Article

Characterization and Homology Modeling of Catalytically Active Recombinant PhaCAp Protein from Arthrospira platensis

by
Chanchanok Duangsri
1,
Tiina A. Salminen
2,
Marion Alix
2,
Sarawan Kaewmongkol
1,
Nattaphong Akrimajirachoote
3,
Wanthanee Khetkorn
4,
Sathaporn Jittapalapong
1,
Pirkko Mäenpää
5,
Aran Incharoensakdi
6,7 and
Wuttinun Raksajit
1,*
1
Program of Animal Health Technology, Faculty of Veterinary Technology, Kasetsart University, Bangkok 10900, Thailand
2
Structural Bioinformatics Laboratory and InFLAMES Research Flagship Center, Biochemistry, Faculty of Science and Engineering, Åbo Akademi University, 20520 Turku, Finland
3
Department of Physiology, Faculty of Veterinary Medicine, Kasetsart University, Bangkok 10900, Thailand
4
Division of Biology, Faculty of Science and Technology, Rajamangala University of Technology Thanyaburi (RMUTT), Thanyaburi, Pathumthani 12110, Thailand
5
Faculty of Technology, University of Turku, 20014 Turku, Finland
6
Laboratory of Cyanobacterial Biotechnology, Department of Biochemistry, Faculty of Science, Chulalongkorn University, Bangkok 10330, Thailand
7
Academy of Science, Royal Society of Thailand, Bangkok 10300, Thailand
*
Author to whom correspondence should be addressed.
Biology 2023, 12(5), 751; https://doi.org/10.3390/biology12050751
Submission received: 3 April 2023 / Revised: 30 April 2023 / Accepted: 17 May 2023 / Published: 20 May 2023

Abstract

:

Simple Summary

The cyanobacterium Arthrospira platensis contains PHA synthase Class III (PhaCAp), which can produce short chain length (SCL) PHB under nitrogen-depleted conditions. In this study, we cloned a gene encoding PhaC from A. platensis into Escherichia cloni ®10G cells to produce rPhaCAp protein. The Vmax, Km, and kcat values for β-3-hydroxybutyryl coenzyme A (3HB-CoA) of the purified rPhaCAp were investigated. Size-exclusion chromatography revealed that rPhaCAp exists as an active dimer. The overall fold and catalytic triad residues were predicted using the 3D structural model for rPhaCAp. These results are discussed with respect to the dimerization mechanism of PhaCAp, which has not yet been clarified.

Abstract

Polyhydroxybutyrate (PHB) is a biocompatible and biodegradable polymer that has the potential to replace fossil-derived polymers. The enzymes involved in the biosynthesis of PHB are β-ketothiolase (PhaA), acetoacetyl-CoA reductase (PhaB), and PHA synthase (PhaC). PhaC in Arthrospira platensis is the key enzyme for PHB production. In this study, the recombinant E. cloni ®10G cells harboring A. platensis phaC (rPhaCAp) was constructed. The overexpressed and purified rPhaCAp with a predicted molecular mass of 69 kDa exhibited Vmax, Km, and kcat values of 24.5 ± 2 μmol/min/mg, 31.3 ± 2 µM and 412.7 ± 2 1/s, respectively. The catalytically active rPhaCAp was a homodimer. The three-dimensional structural model for the asymmetric PhaCAp homodimer was constructed based on Chromobacterium sp. USM2 PhaC (PhaCCs). The obtained model of PhaCAp revealed that the overall fold of one monomer was in the closed, catalytically inactive conformation whereas the other monomer was in the catalytically active, open conformation. In the active conformation, the catalytic triad residues (Cys151-Asp310-His339) were involved in the binding of substrate 3HB-CoA and the CAP domain of PhaCAp involved in the dimerization.

1. Introduction

Energy demand worldwide is increasing continuously due to human population and economic growth. Higher consumption of fossil fuels leads to higher greenhouse gas emissions, particularly of CO2, which contribute to global warming. Petrochemical-based plastics, which have been used in daily life for decades, cannot be decomposed by biological processes and accumulate in the environment. The global demand for biodegradable plastic as a mandatory substitute for synthetic plastics is augmented by considering their biocompatibility, biodegradability, nontoxicity, and renewability properties [1,2]. Among the biopolymers, poly (3-hydroxybutyrate) (PHB) is the most well-characterized of the polyhydroxyalkanoates (PHAs) that are produced by a large variety of microorganisms such as bacteria, fungi, and cyanobacteria under unbalanced growth [3]. The PHB has properties similar to some traditional synthetic plastics such as polypropylene and polyethylene [4,5]. The PHB biosynthetic pathway consists of three enzymatic reactions catalyzed by three distinct enzymes encoded by the phaABC operon in many cyanobacterial species [6]. The first reaction begins with the condensation of two acetyl-CoA molecules into acetoacetyl-CoA by β-ketothiolase (encoded by phaA). The second reaction is the conversion of acetoacetyl-CoA to 3-hydroxybutyryl-CoA by acetoacetyl-CoA reductase (encoded by phaB). Finally, the 3-hydroxybutyryl-CoA monomers are polymerized into poly (3-hydroxybutyrate) (PHB) by PHA synthase (encoded by phaC) (Figure S1).
PHA synthases (PhaC) are classified into four classes based on subunit composition, primary sequences, and substrate specificity [7,8]. The structure and properties have been characterized for the Class I PhaC proteins from Cupriavidus necator (PhaCCn) [7], Chromobacterium sp. USM2 (PhaCCs) [9], Rhodovulum sulfidophilum (PhaCRs) [10], and Aquitalea sp. USM4 (PhaCAs) [11]. Class II PhaC is characterized from Pseudomonas spp. (PhaCPs) [12], Class III PhaC from Chromatium vinosum (PhaCCv), and Class IV PhaC from Bacillus spp. (PhaCBs) [13]. PHB can be categorized into two primary groups based on the carbon atom count present in the monomer units. The first group is referred to as short-chain-length (SCL) PHB and consists of repeat units made up of hydroxy fatty acids containing carbon atoms ranging from C3 to C5. This type of PHB is generated through PhaC Class I, III, and IV. The second group is known as medium-chain-length (MCL) PHB. The repeat units in this group are hydroxy fatty acids of C6-C14 carbon atoms, and they are produced by PhaC Class II [14].
Arthrospira platensis is a filamentous cyanobacterium that grows naturally in alkaline salt lakes. A. platensis are the most employed because of their high growth rate, simple cultivation, and relatively easy harvesting [15]. A. platensis contains PHA synthase Class III (PhaCAp), which can produce SCL-PHB. Most Arthrospira species produce large amounts of PHB under nitrogen-depleted conditions [16]. It is worth noting that the highest content of polyhydroxybutyrate (PHB) was found in Arthrospira platensis cultures that were grown under nitrogen-deprived conditions for three days, while being supplemented with 0.50% (w/v) acetate. This resulted in the maximum PHB content of 19.2% of cell dry weight [17], which is much higher than the unicellular cyanobacterium Synechocystis sp. PCC 6803 under optimized conditions, which showed a PHB content of 13.1% [18]. Therefore, A. platensis is considered to be one of the most viable candidates for industrial-scale production of PHB. To obtain a more comprehensive understanding of the function of PhaC, we created recombinant Escherichia cloni®10G cells that contained A. platensis phaC. The expressed A. platensis PhaC protein was purified and evaluated for its enzymatic activity and oligomeric structure in vitro. We also constructed homology 3D models for A. platensis PhaC and analyzed the active site for its ligand-binding properties.

2. Materials and Methods

2.1. Bacterial Strains and Culture Conditions

The Arthrospira platensis was cultivated in a 250-mL Erlenmeyer flask with 50 mL of Zarrouk medium (pH 10.0) at 32 °C under a continuous fluorescent lamp emitting 40 μmol photon/m2/s on a rotatory shaker at 120 rpm [14]. Escherichia cloni®10G (Lucigen) was used for cloning and expression analysis. Luria–Bertani (LB) media supplemented with 100 g/mL kanamycin was used to grow and maintain cells containing recombinant plasmids. Following overnight cell growth at 37 °C, the growth of E. cloni®10G was measured in terms of turbidity (OD600). E. cloni®10G strains were grown in LB medium at 37 °C and 120 rpm in an incubator. Expresso® pSol-Tsf vector (Lucigen) was used as a vector for cloning.

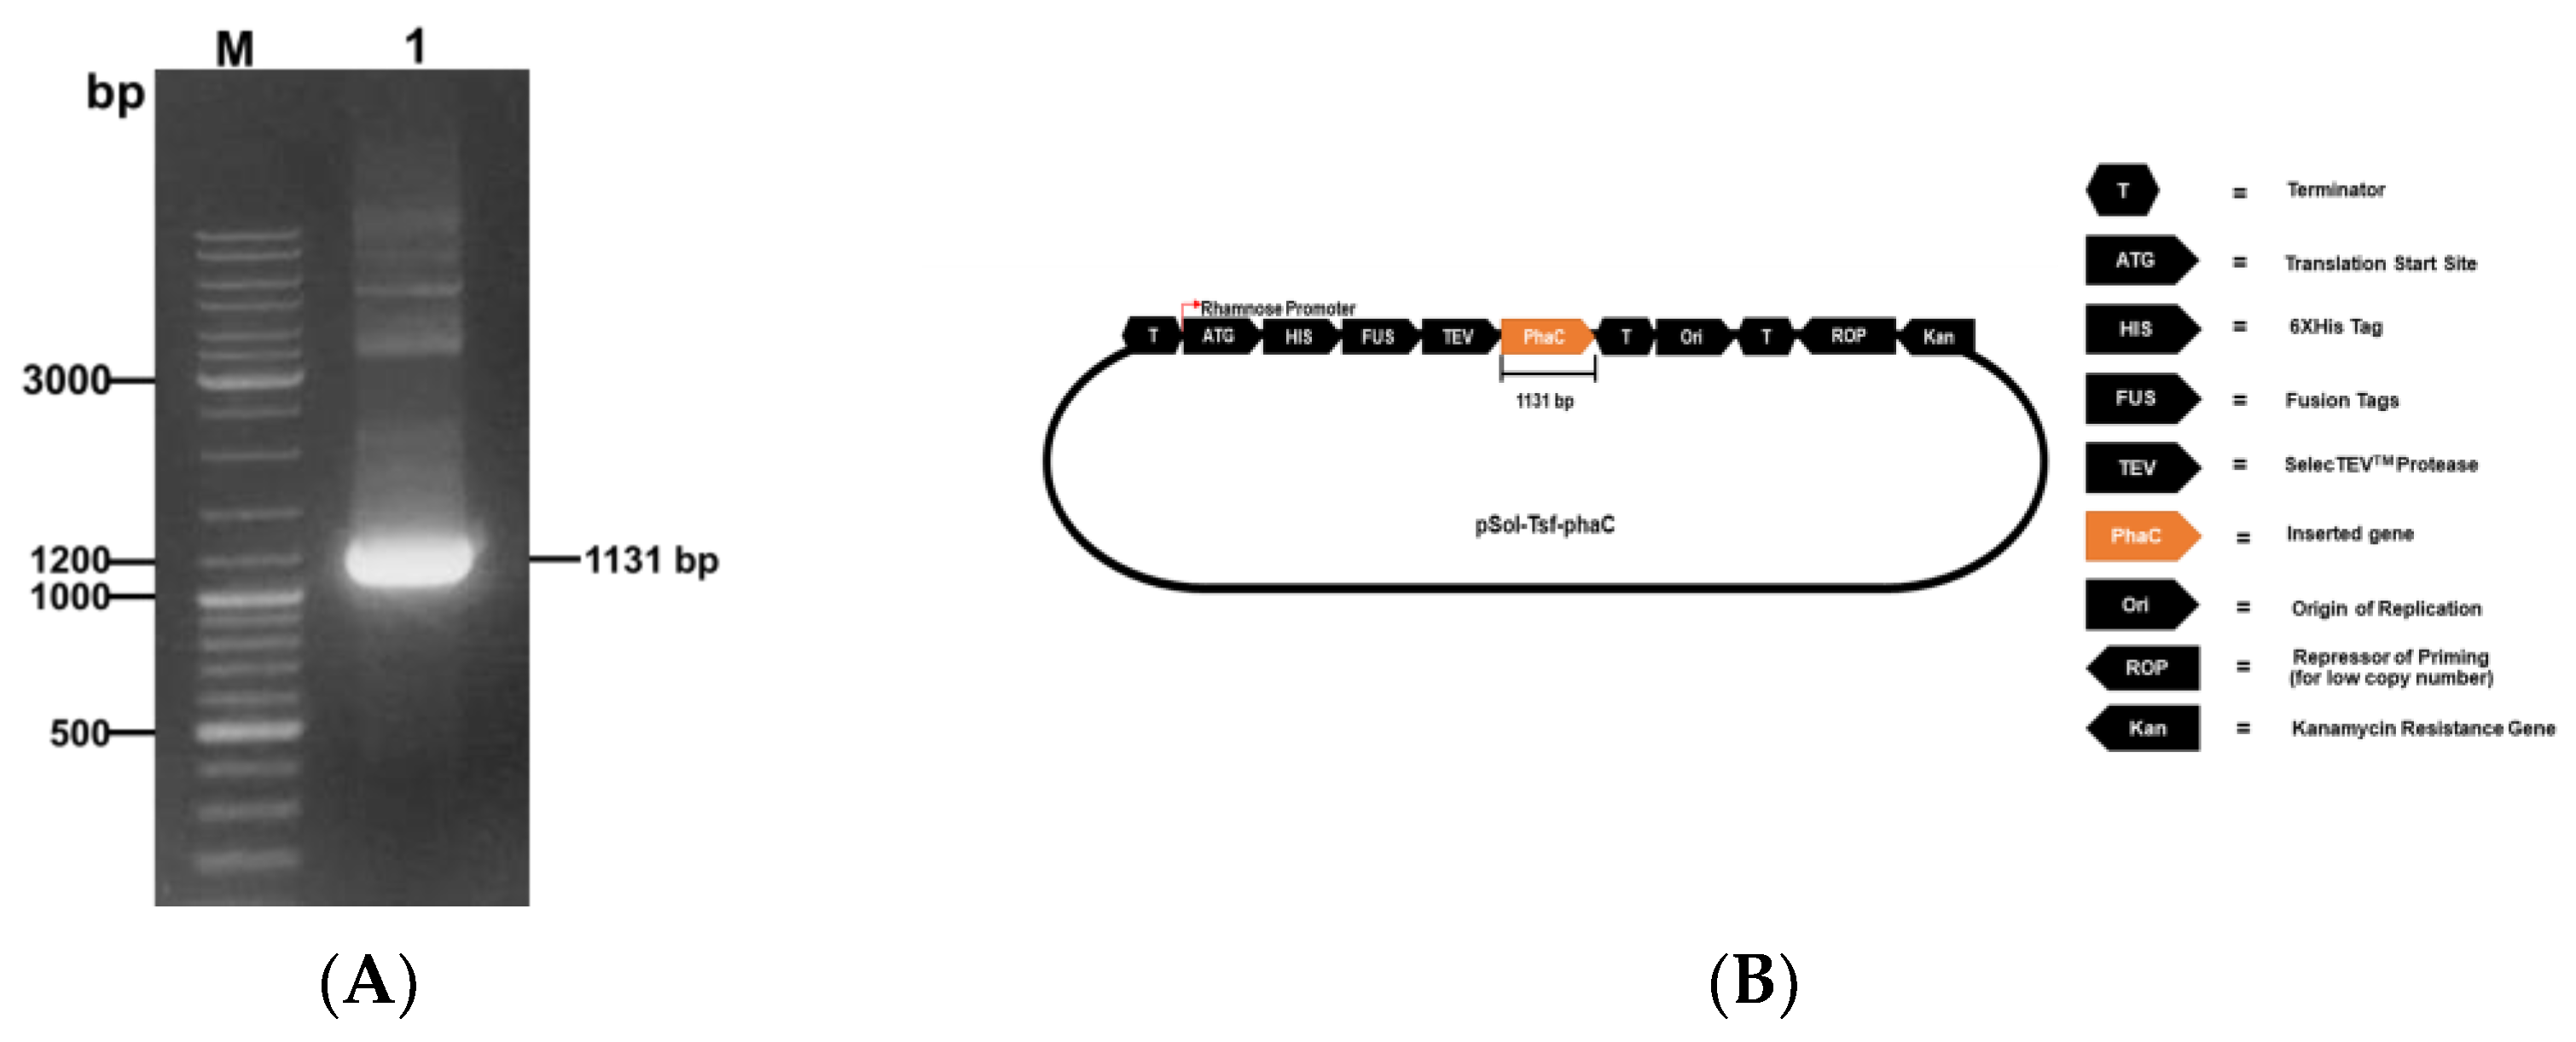
2.2. Cloning of phaCAp in pSol-Tsf Plasmid

The open reading frame of phaCAp gene (1095 bp) encoding PhaCAp protein was amplified from A. platensis genomic DNA using primers: Fpha: 5′-AAT CTG TAC TTC CAG GGT ATG TTA CCT-3′ and Rpha: 5′-GTG GCG GCC GCT CTA TTA TTA CTC TCG-3′ (underlined sequence indicates primers that add flanking sequence identical to those found at the ends of linear pSol-Tsf vector). PCR was performed with a temperature program starting at 94 °C for 10 min, followed by 30 cycles of 94 °C for 45 s, 52 °C for 45 s, 72 °C for 45 s, and a final elongation at 72 °C for 10 min. The phaCAp gene, which was amplified to a length of 1131-bp, was extracted and purified using the Silica Bead DNA Gel Extraction Kit (Thermo Fisher Scientific), and the fragment was cloned into the Expresso® pSol-Tsf vector (Lucigen). The recombinant plasmid (pSol-Tsf-phaC) harboring the SelecTEVTM Protease, 6x-His-tagged fusion, and terminator recognition sites was transformed into E. cloni®10G, and the presence of inserts with correct sequence was verified by colony PCR and further by sequencing.

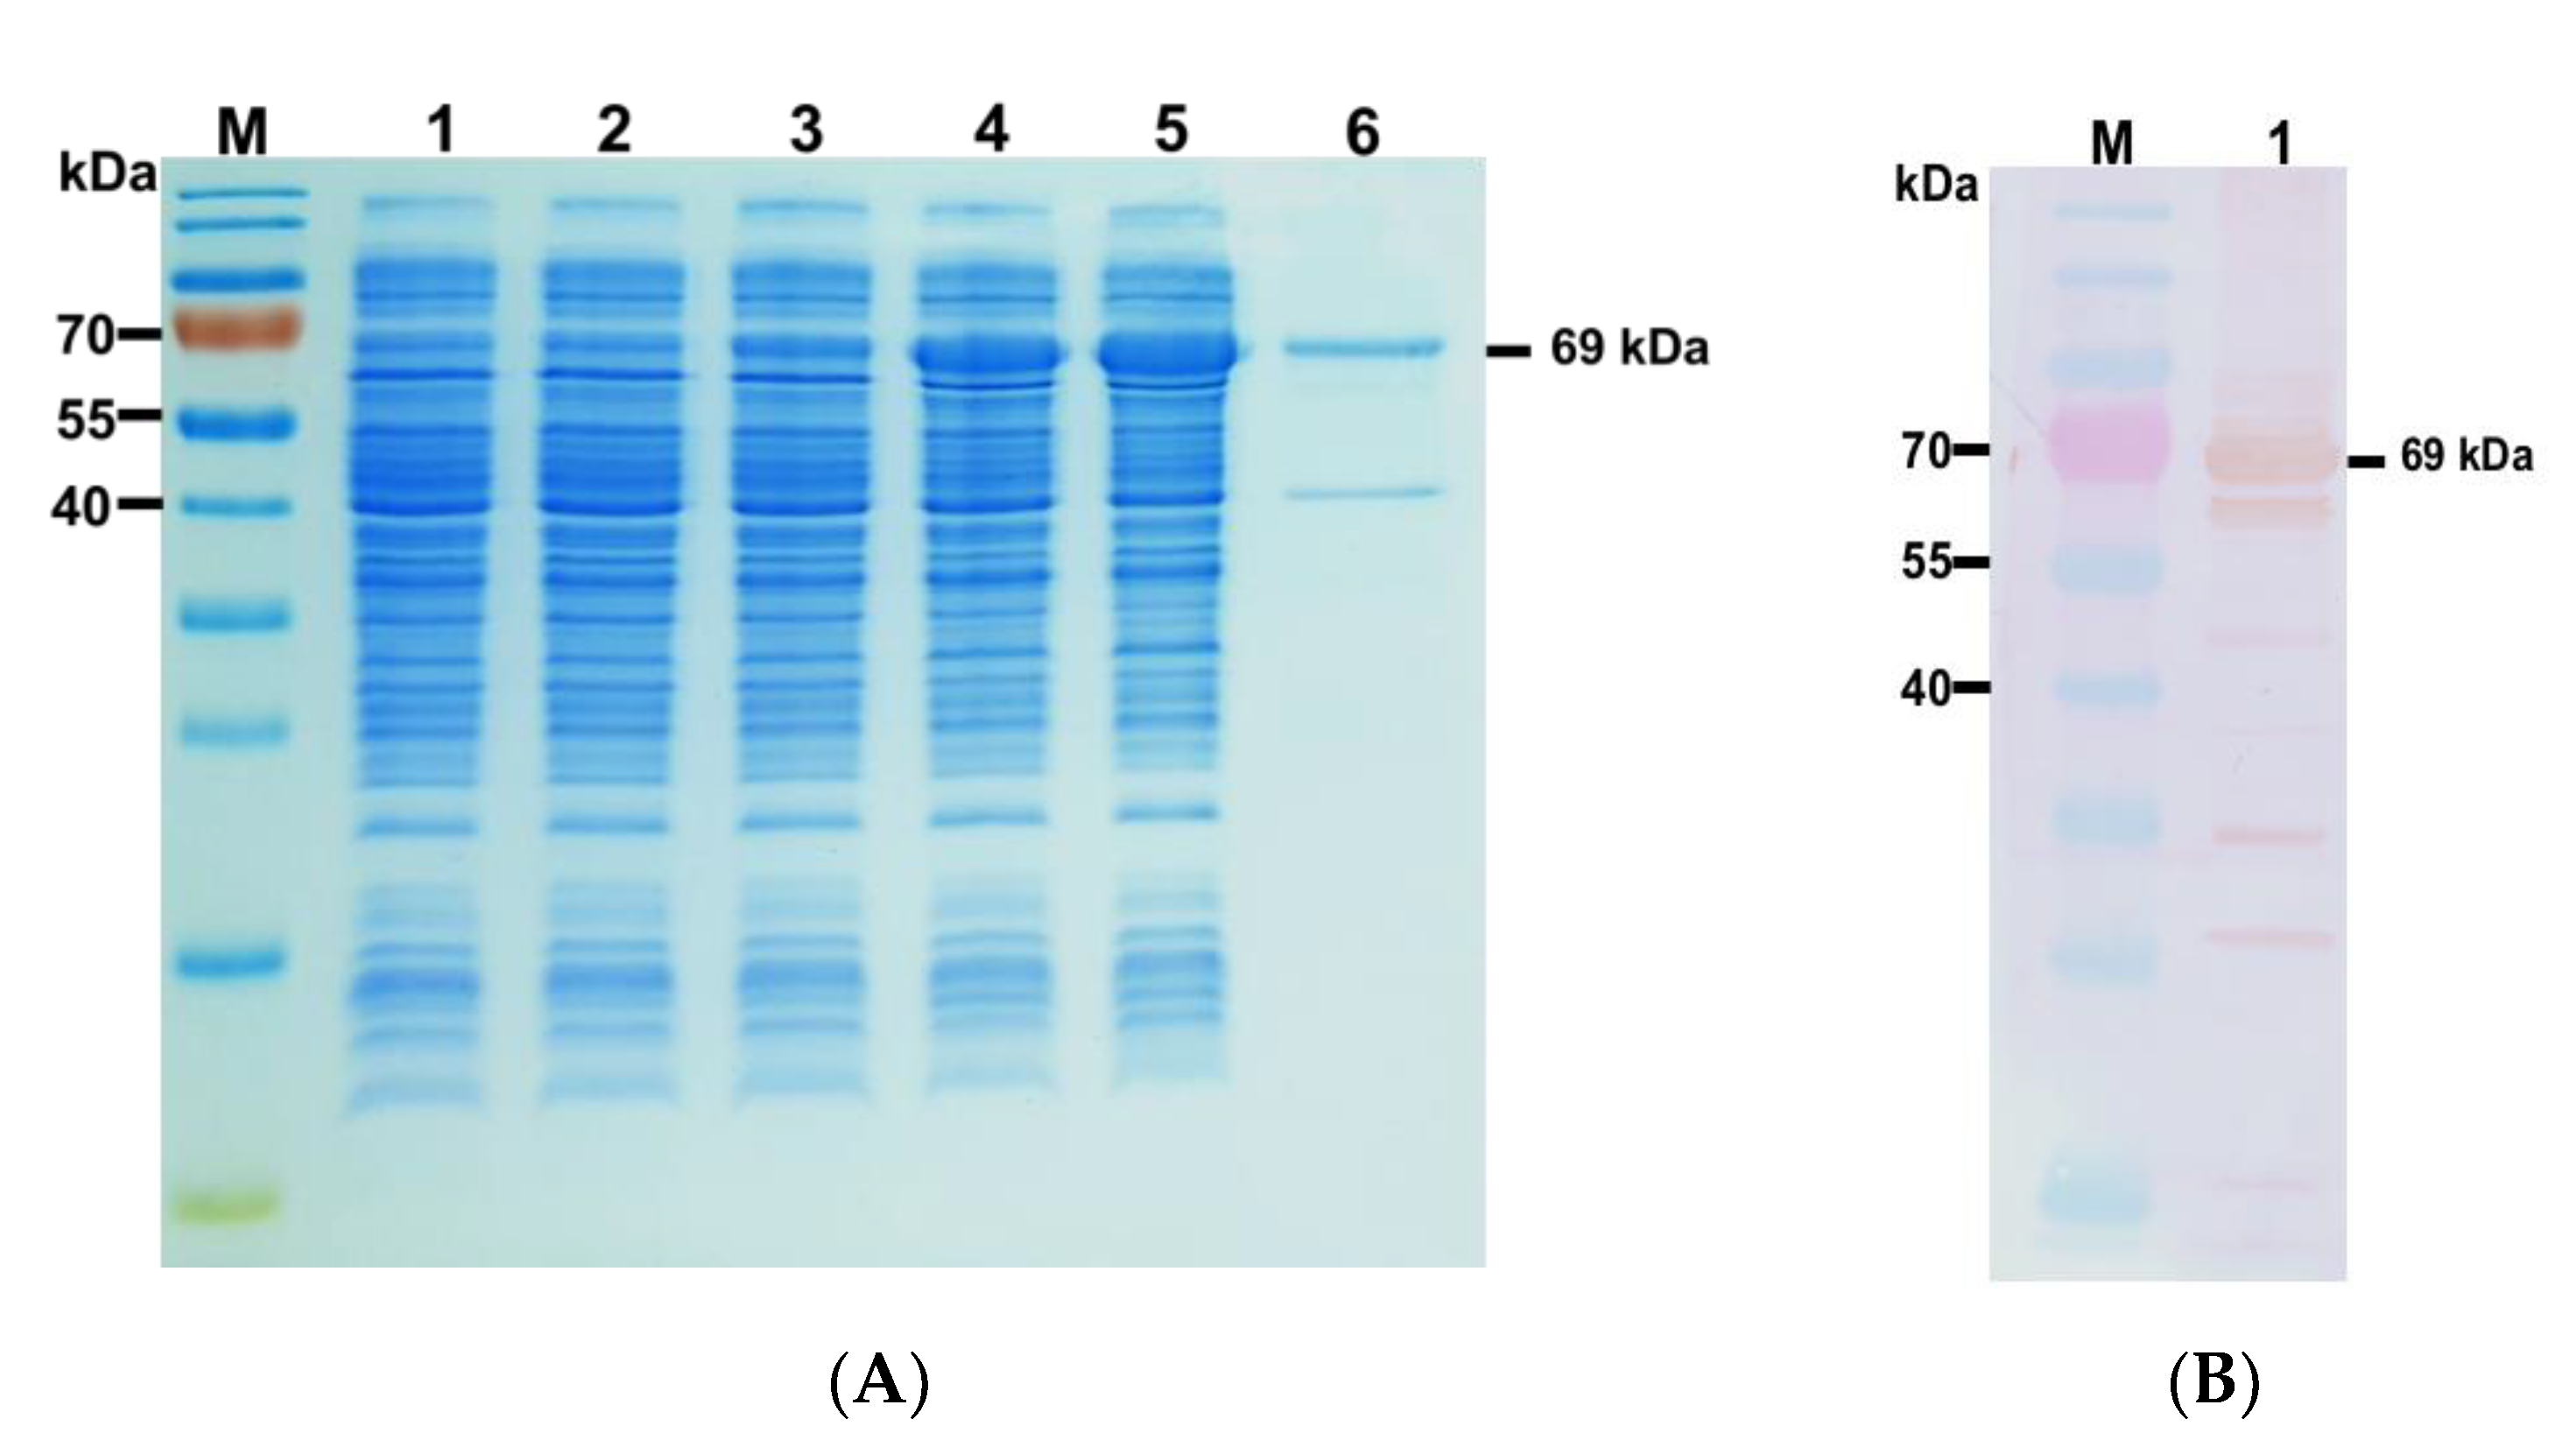
2.3. Expression and Purification of rPhaCAp

Fresh 500 mL LB broth containing 100 μg/mL kanamycin was inoculated with transformed cells harboring recombinant (pSol-Tsf-phaC) or empty vectors (pSol-Tsf), and allowed to grow at 37 °C. When the OD600 of the culture reached ~0.5, cells were induced with a final concentration of 0.2% (w/v) L-rhamnose. This culture was incubated at 30 °C for 4 h with shaking at 120 rpm. Overexpressed cells were collected and subjected to three MQ water washes. The cell pellets were suspended in buffer pH 7.5 (50 mM Na2HPO4, 300 mM NaCl) and lysed by sonication (20 kHz) at 32 °C for 10 min, followed by centrifugation to remove cell debris. The supernatant containing recombinant 6x-His-tagged fusion protein (rPhaCAp) was loaded onto a Ni-NTA column (Ni SepharoseTM 6 Fast Flow, GE Healthcare Bio-sciences AB), then washed with five column volumes of binding buffer (50 mM Na2HPO4 pH 7.5, 300 mM NaCl, 10 mM imidazole). The rPhaCAp was eluted from the column with elution buffer (50 mM Na2HPO4, pH 7.5, 300 mM NaCl, 90 mM imidazole). The protein purity was determined by using 12% sodium dodecyl sulfate-polyacrylamide gel electrophoresis (SDS-PAGE) and Western blotting. Protein concentration was determined by using a Bio-Rad protein assay kit and BSA as standard [19].

2.4. In Vitro Enzymatic Assay of the Purified rPhaCAp

The activity of the purified rPhaCAp was determined by estimating the amount of CoA (reaction product) using β-3-hydroxybutyryl coenzyme A (3HB-CoA). This assay was carried out in the reaction mixture (1 mL) containing 50 μM 3HB-CoA, 50 μM 5,5′-dithiobis-(2-nitrobenzoic acid) (DTNB), BSA (0.2 mg/mL) in 100 mM Tris-HCl buffer (pH 8.0) and enzyme, which was previously reported by [20]. Incubation was carried out at 30 °C for 10 min. The liberation of CoA was determined by measuring the absorbance at 412 nm with a spectrophotometer. The enzyme activity was expressed as µmol/min/mg. The measurement was carried out in triplicate. Protein concentration was determined by using a Bio-Rad protein assay kit and BSA as standard [19].

2.5. Determination of Steady-State Kinetic Constants of rPhaCAp

The Km and kcat values were calculated using the initial velocity data obtained by varying the concentration of 3HB-CoA from 10 μM to 400 μM. The initial velocity data were fitted to Michaelis–Menten equation V0 = Vmax[S]/(Km + [S]) (where V0 is the initial velocity, Vmax is the maximum velocity, [S] is the substrate concentration, and Km is the Michaelis constant) with GraphPad Prism 9.5.1 software. The Km represents the equilibrium constant for dissociation of the enzyme from the substrate. The kcat value was calculated from the ratio of Vmax and enzyme concentration. Each reaction was initiated by the addition of 100 μg of crude enzyme to 1 mL of reaction mixture.

2.6. Production of Polyclonal Antibodies against rPhaCAp

Two healthy, 12-week-old male New Zealand rabbits were maintained in the experimental animal facility. Purified rPhaCAp (100 μg) was emulsified with an equal volume of Freund’s Complete Adjuvant (FCA) and subcutaneously injected into rabbits for the first immunization. Three booster injections of the same protein mixed with FCA were given to each rabbit on the 14th, 21st, and 28th day. The rabbits were bled via the marginal ear vein prior to the first dose and at 7-day intervals, and the serum antibody titer was measured using ELISA. The rabbit anti-rPhaCAp polyclonal antibody serum was kept for further experiment. The body weight, temperature, complete blood count, and behavior of the rabbits in the home cage, upon handling, and in an open field did not differ significantly among the immunization groups during the 7-week assessment period.

2.7. Western Blot Analysis

The 6x-His-tagged fusion rPhaCAp protein (69 kDa) was purified and analyzed by resolving in a 12% SDS-PAGE gel. The separated protein was then transferred to a nitrocellulose membrane (Bio-Rad) using a Trans-Blot® Semi-Dry system (Bio-Rad) with an applied voltage of 10V for 60 min. The nitrocellulose membranes were incubated with 5% (w/v) non-fat powdered milk in PBST buffer (25 mM phosphate-buffer pH 7.4, 150 mM NaCl, 0.1% (v/v) Tween 20) at 4 °C overnight. The membranes were washed three times by PBST buffer. Subsequently, the nitrocellulose membranes were incubated with either a 1:5000 dilution of rabbit anti-His-tagged polyclonal antibody (Thermo Fisher Scientific) or a 1:10,000 dilution of rabbit anti-rPhaCAp polyclonal antibody in PBST buffer for 3 h at room temperature. Next, the membranes were washed three times with PBST buffer and then incubated with a 1:2000 dilution of HRP-conjugated goat anti-rabbit IgG (Sigma-Aldrich) in PBST buffer containing 2% non-fat powdered milk for 90 min at room temperature. Following the washing step, the nitrocellulose membranes were treated with diaminobenzidine (DAB) using a DAB substrate kit (Thermo Fisher Scientific) at room temperature for 5–10 min. A brown band on a nitrocellulose membrane was observed, indicating the presence of the rPhaCAp protein.

2.8. Size-Exclusion Chromatography

The reaction mixture consisting of purified rPhaCAp and 100 mM sodium phosphate (pH 7.4) was incubated for 10 min. The reaction mixtures were then loaded onto a Sephadex-G50 column (Merck, Darmstadt, Germany) equilibrated with 100 mM sodium phosphate (pH 7.4). The reaction mixture containing rPhaCAp was eluted with the same buffer at a flow rate of 1 mL/min. The eluted samples were measured for absorbance at 280 nm, and their retention times were compared to those of molecular standards. The standards used for comparison were alcohol dehydrogenase (150 kDa, 18.5 min), BSA (66 kDa, 24.5 min), and ovalbumin (44 kDa, 27.5 min).

2.9. Sequence and Multiple Sequence Alignment Analysis

The amino acid sequence of PhaCAp was retrieved from UniProtKB (UniProt code D4ZNW6). BLAST (Basic Local Alignment Search Tool) was used to identify the structural templates for modeling PhaCAp. The Protein Data Bank (PDB, http://www.rcsb.org (accessed on 11 May 2020); Berman et al., 2000), which is available at http://www.rcsb.org (accessed on 13 May 2020) and contains a collection of protein structures, was used as the target database. The BLAST searches revealed 4 PhaC structures with expectation values (e-value) below 1 × 10⁻¹⁷: two structures from Cupriavidus necator H16 (Ralstonia eutropha) (PDB codes 5T6O and 5HZ2), and Chromobacterium sp. USM2 (PDB codes:5XAV and 6K3C). Next, we created a structure-based sequence alignment of the PhaC structures from Cupriavidus necator H16 (5HZ2) and from Chromobacterium sp. USM2 (6K3C) by superimposing the structures with VERTAA [21]. Since the sequence identity of these structures to PhaCAp was only around 20%, we searched for more sequences similar to PhaCAp and aligned the Synechocystis sp. PCC 6803 PhaC ((PhaCSs; WP_041425936.1), Bernardetia litoralis PhaC (PhaCBl; WP_014797661.1), and Aromatoleum buckelii PhaC (PhaCAb; WP_169197587.1) to the pre-aligned structure-based alignment using MALIGN in Bodil [22]. The secondary structure for the PhaCAp sequence was predicted using Jpred [23]. The final sequence alignment figure was prepared with ESPript 3.0 [24].

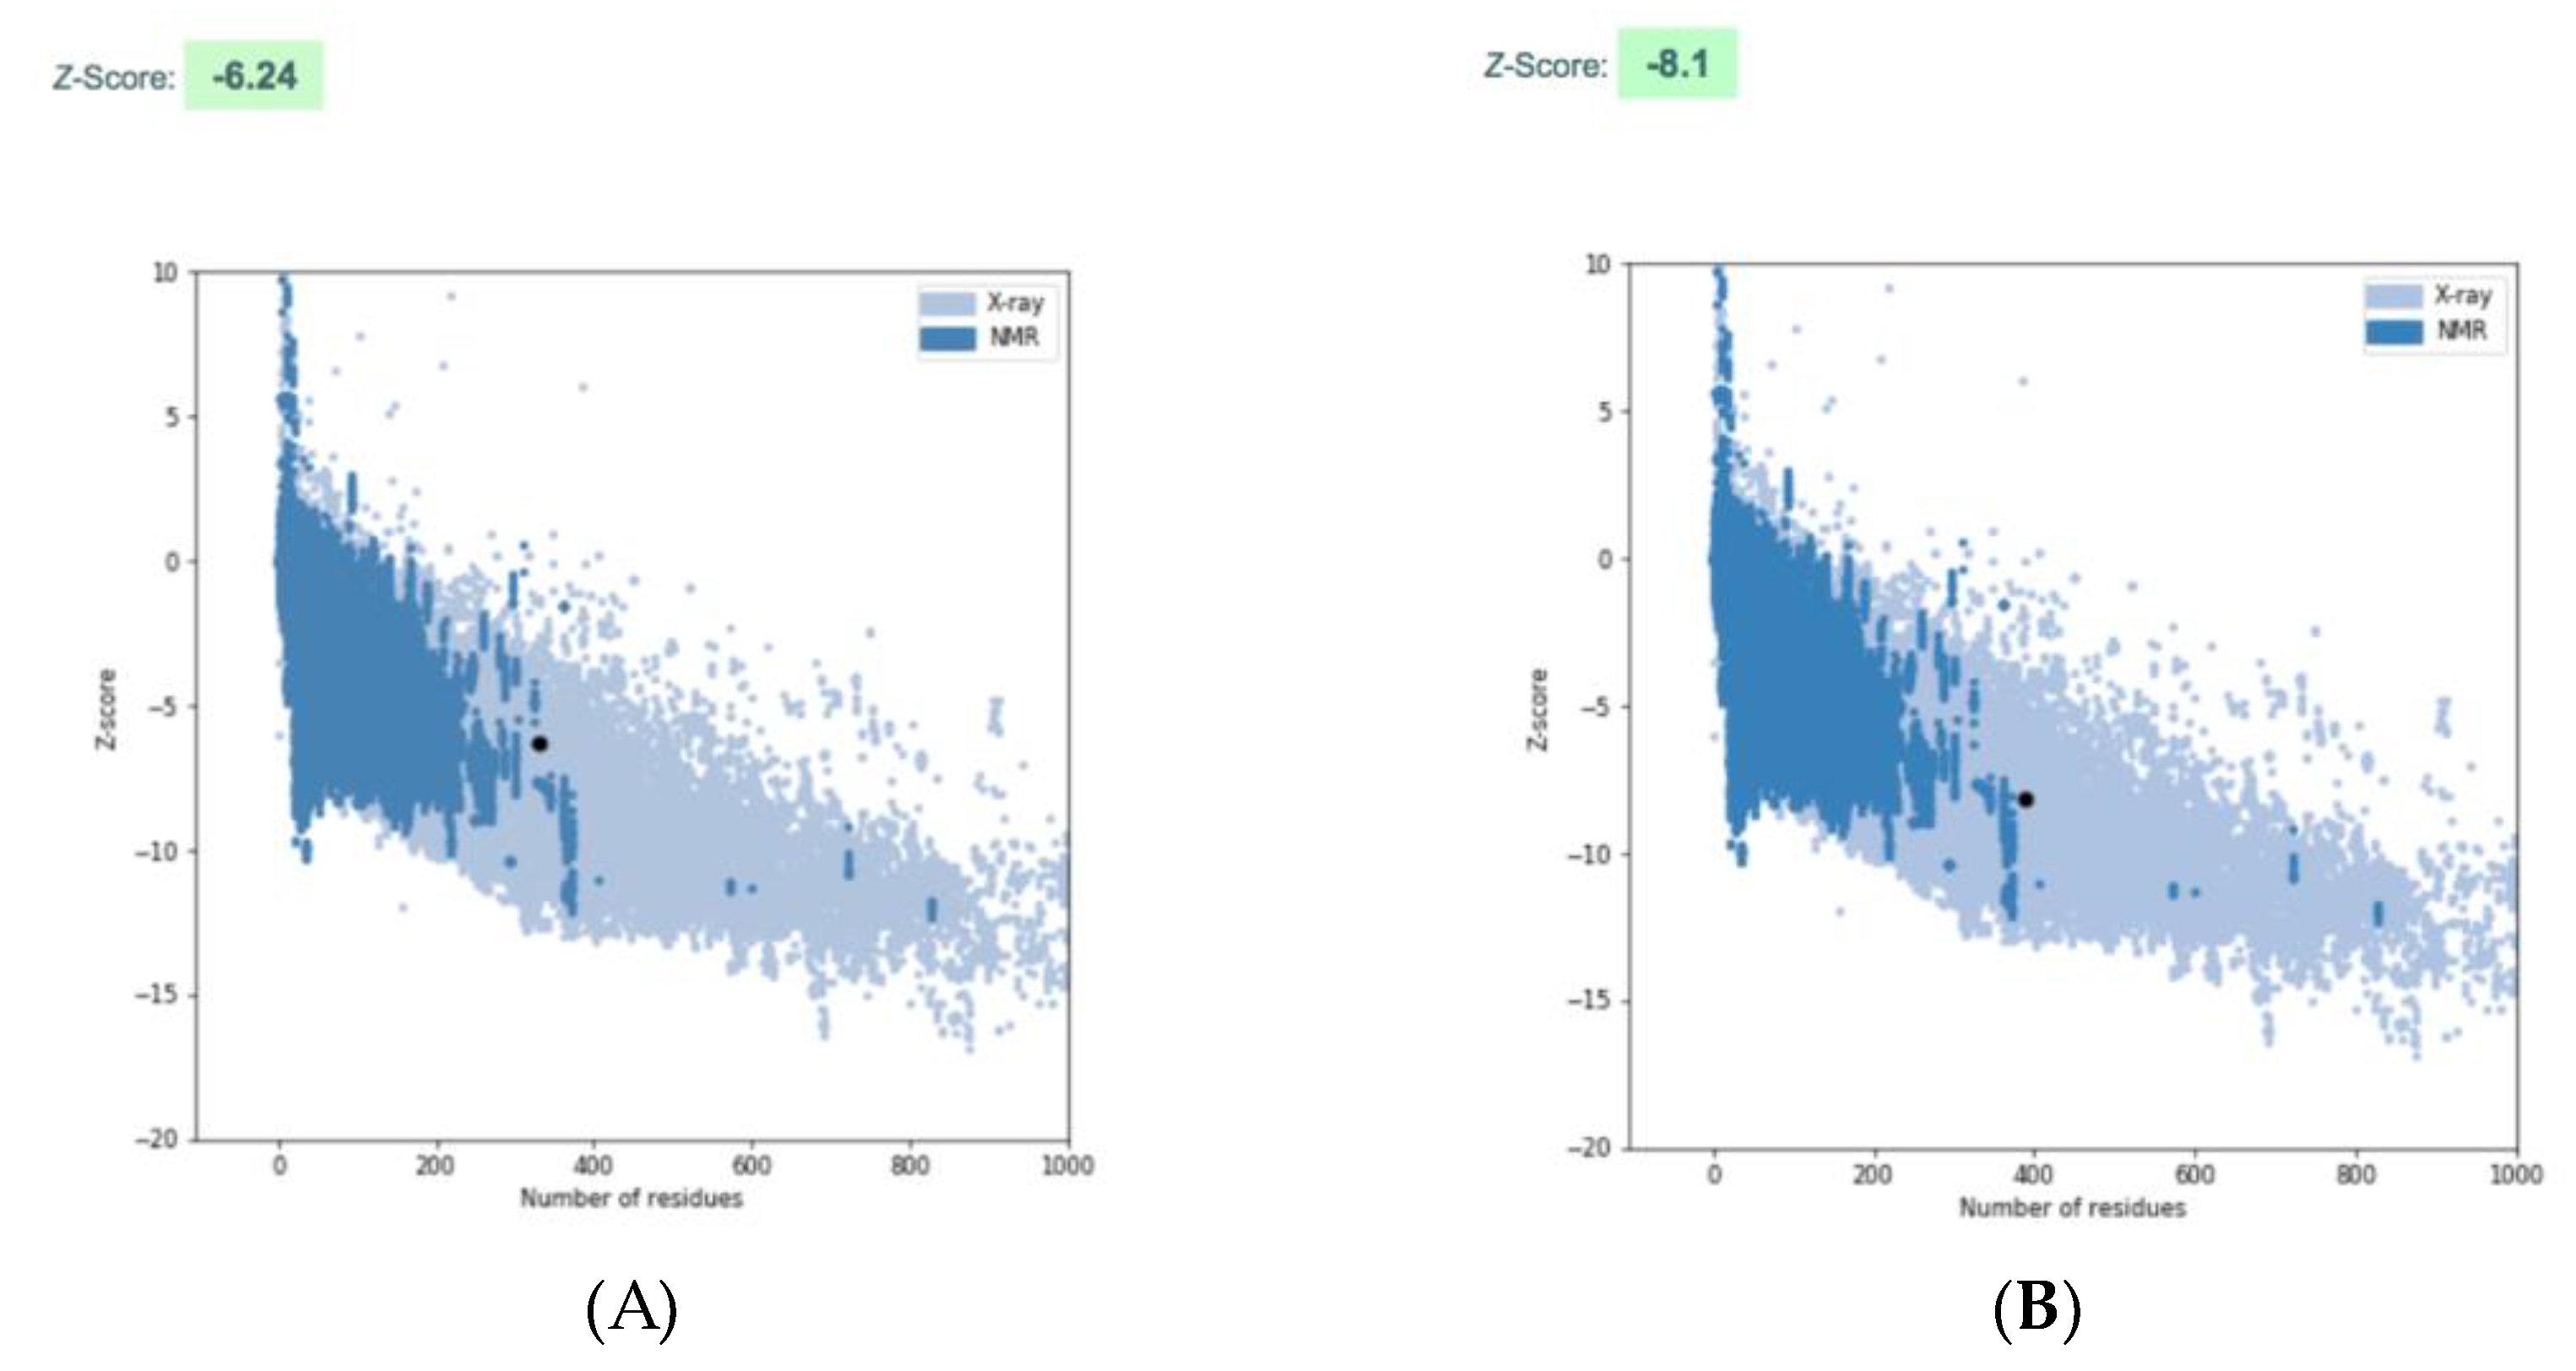
2.10. Homology Modelling

The 3D model of PhaCAp was created using the multiple sequence alignment and the crystal structure of PhaCCs from Chromobacterium sp. USM2 (PDB code: 6K3C) as a template, with a resolution of 1.8 Å. MODELLER generated ten models for PhaCAp, and the one with the lowest energy, as determined by the MODELLER objective function, was selected for additional structural analysis. The ProSA-wed (https://prosa.services.came.sbg.ac.at/prosa.php (accessed on 10 October 2021)) [25,26] was used to assess the quality of the 3D model for PhaCAp.

3. Results

3.1. Cloning, Expression, and Purification of rPhaCAp

A band of approximately 1131 bp on the agarose gel electrophoregram corresponded to the fragment encoding rPhaCAp (Figure 1A). The fragment was purified and ligated into the pSol-Tsf vector and successfully verified by colony PCR and DNA sequencing. E. cloni®10G was transformed with the recombinant plasmid pSol-Tsf-phaCAp for the expression of rPhaCAp with 6x-His-tagged fusion (Figure 1B). Conditions for rPhaCAp induction were established with the expression strain E. cloni®10G. SDS-PAGE showed that rPhaCAp was present in soluble fraction (SF) after induction with 0.002% (w/v) l-rhamnose at 30 °C (Figure 2A, lane 3). Increasing the l-rhamnose concentration (0.02–0.2% (w/v)) induced the amount of soluble rPhaCAp where the maximum expression in SF was observed at 0.2% (w/v) L-rhamnose (Figure 2A, lane 5). The purified rPhaCAp from the overexpressing cells induced with 0.2% (w/v) l-rhamnose showed one distinct band with molecular size of 69 kDa (Figure 2A, lane 6). The presence of N-terminal 6x-His-tagged rPhaCAp was verified through Western blotting with polyclonal anti-His antibody (data not shown) and polyclonal anti-rPhaCAp antibody (Figure 2B).

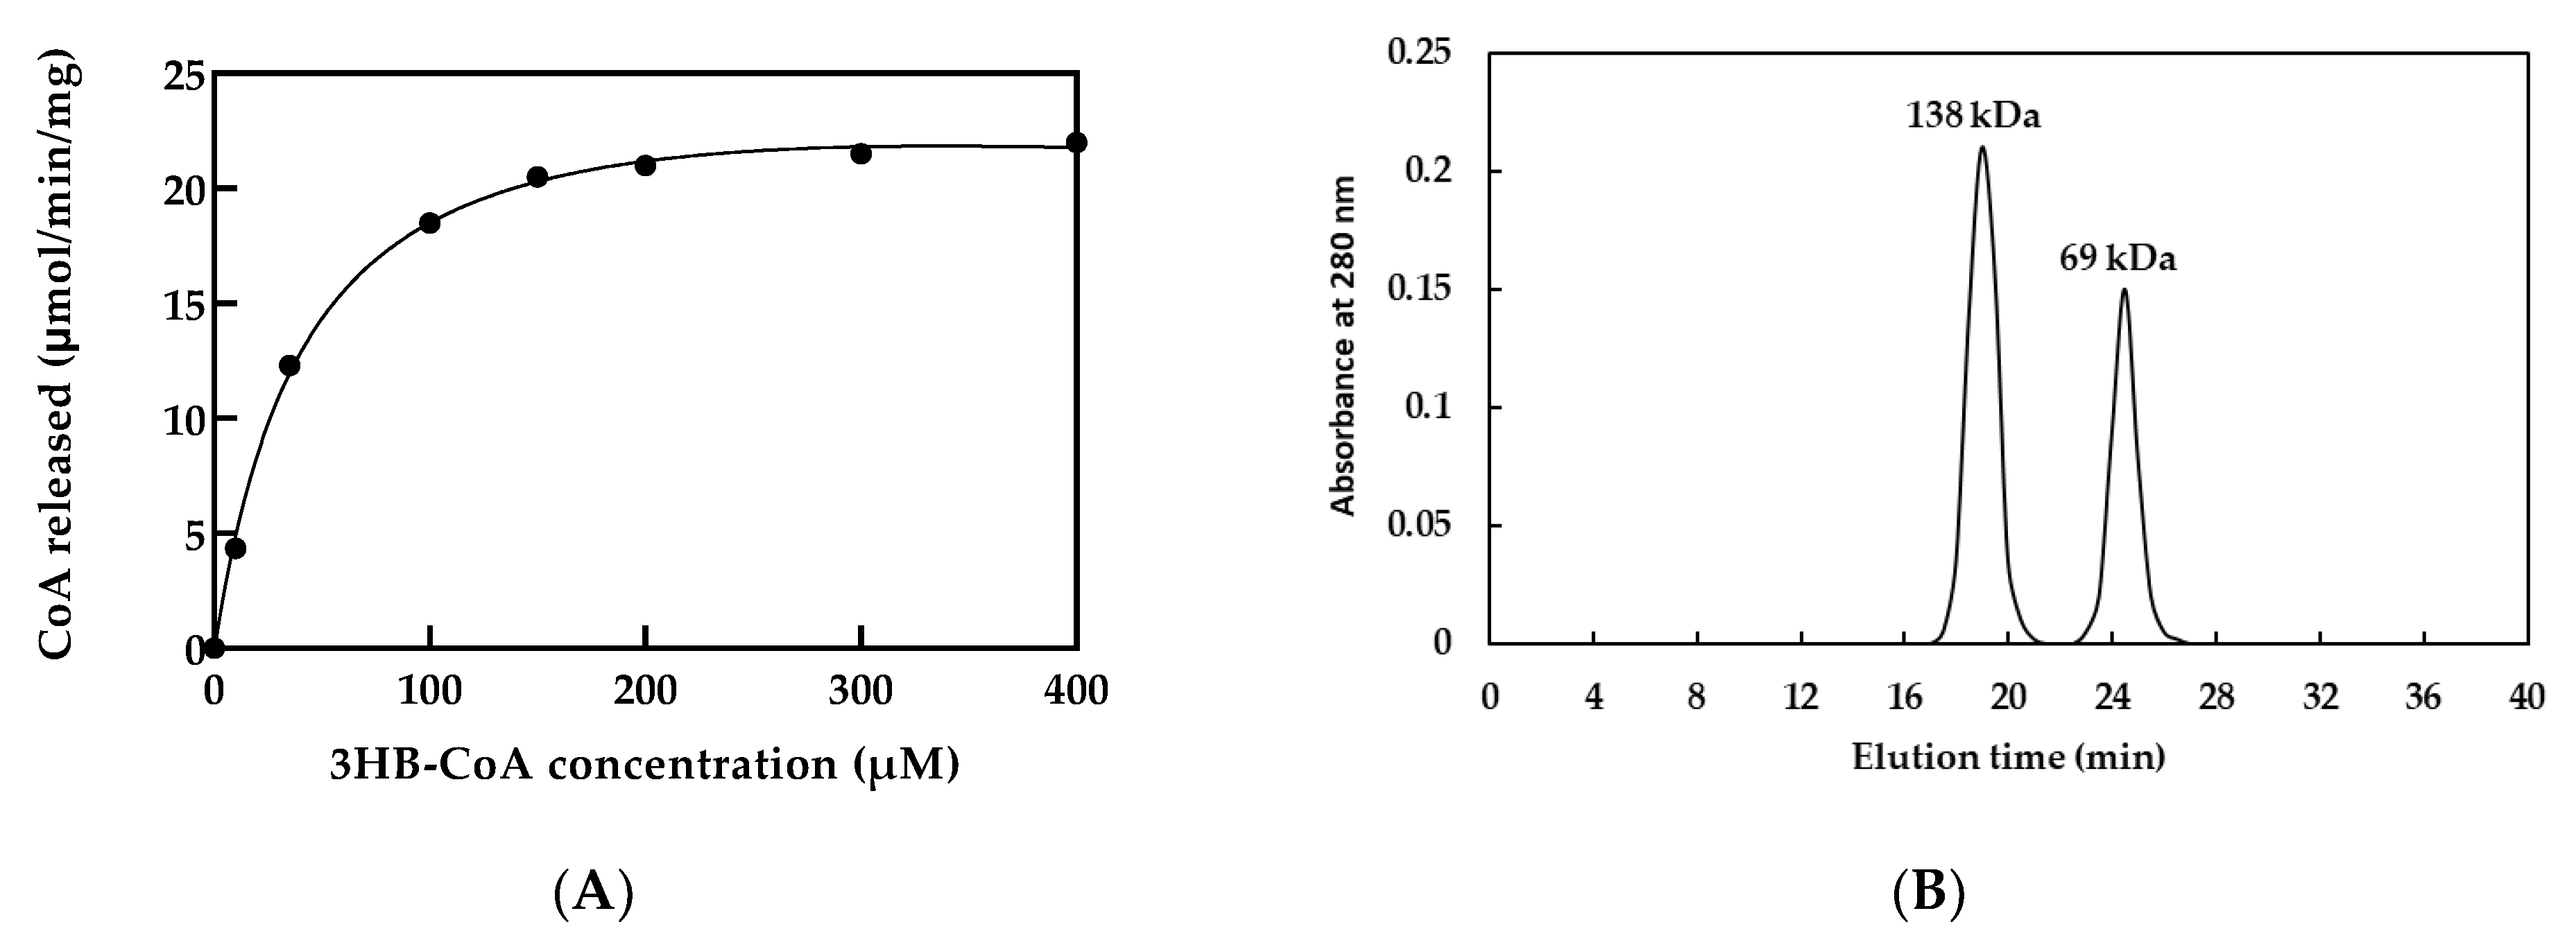
3.2. PHA Synthase Activity and Kinetics

The optimal condition for purified rPhaCAp activity was observed at 30 °C in 100 mM Tris-HCl buffer (pH 8.0) in the presence of 3HB-CoA as substrate. The Michaelis–Menten fitting of the data is shown in Figure 3A. The Vmax, Km, and kcat values for 3HB-CoA of the purified rPhaCAp were 24.5 ± 2 μmol/min/mg, 31.3 ± 2 μM, and 412.7 ± 2 1/s, respectively.

3.3. Size-Exclusion Chromatography

Size-exclusion chromatography was performed to examine the multimeric formation of PhaCAp. Two peaks were detected at 19.0 and 24.5 min (Figure 3B). According to the calibration curve generated from the elution times of the molecular standard, the molecular weights corresponding to peaks with elution times of 19.0 and 24.5 min were estimated to be 141 and 71 kDa, respectively, which corresponds to the dimeric rPhaCAp (138 kDa) and monomeric rPhaCAp (69 kDa).

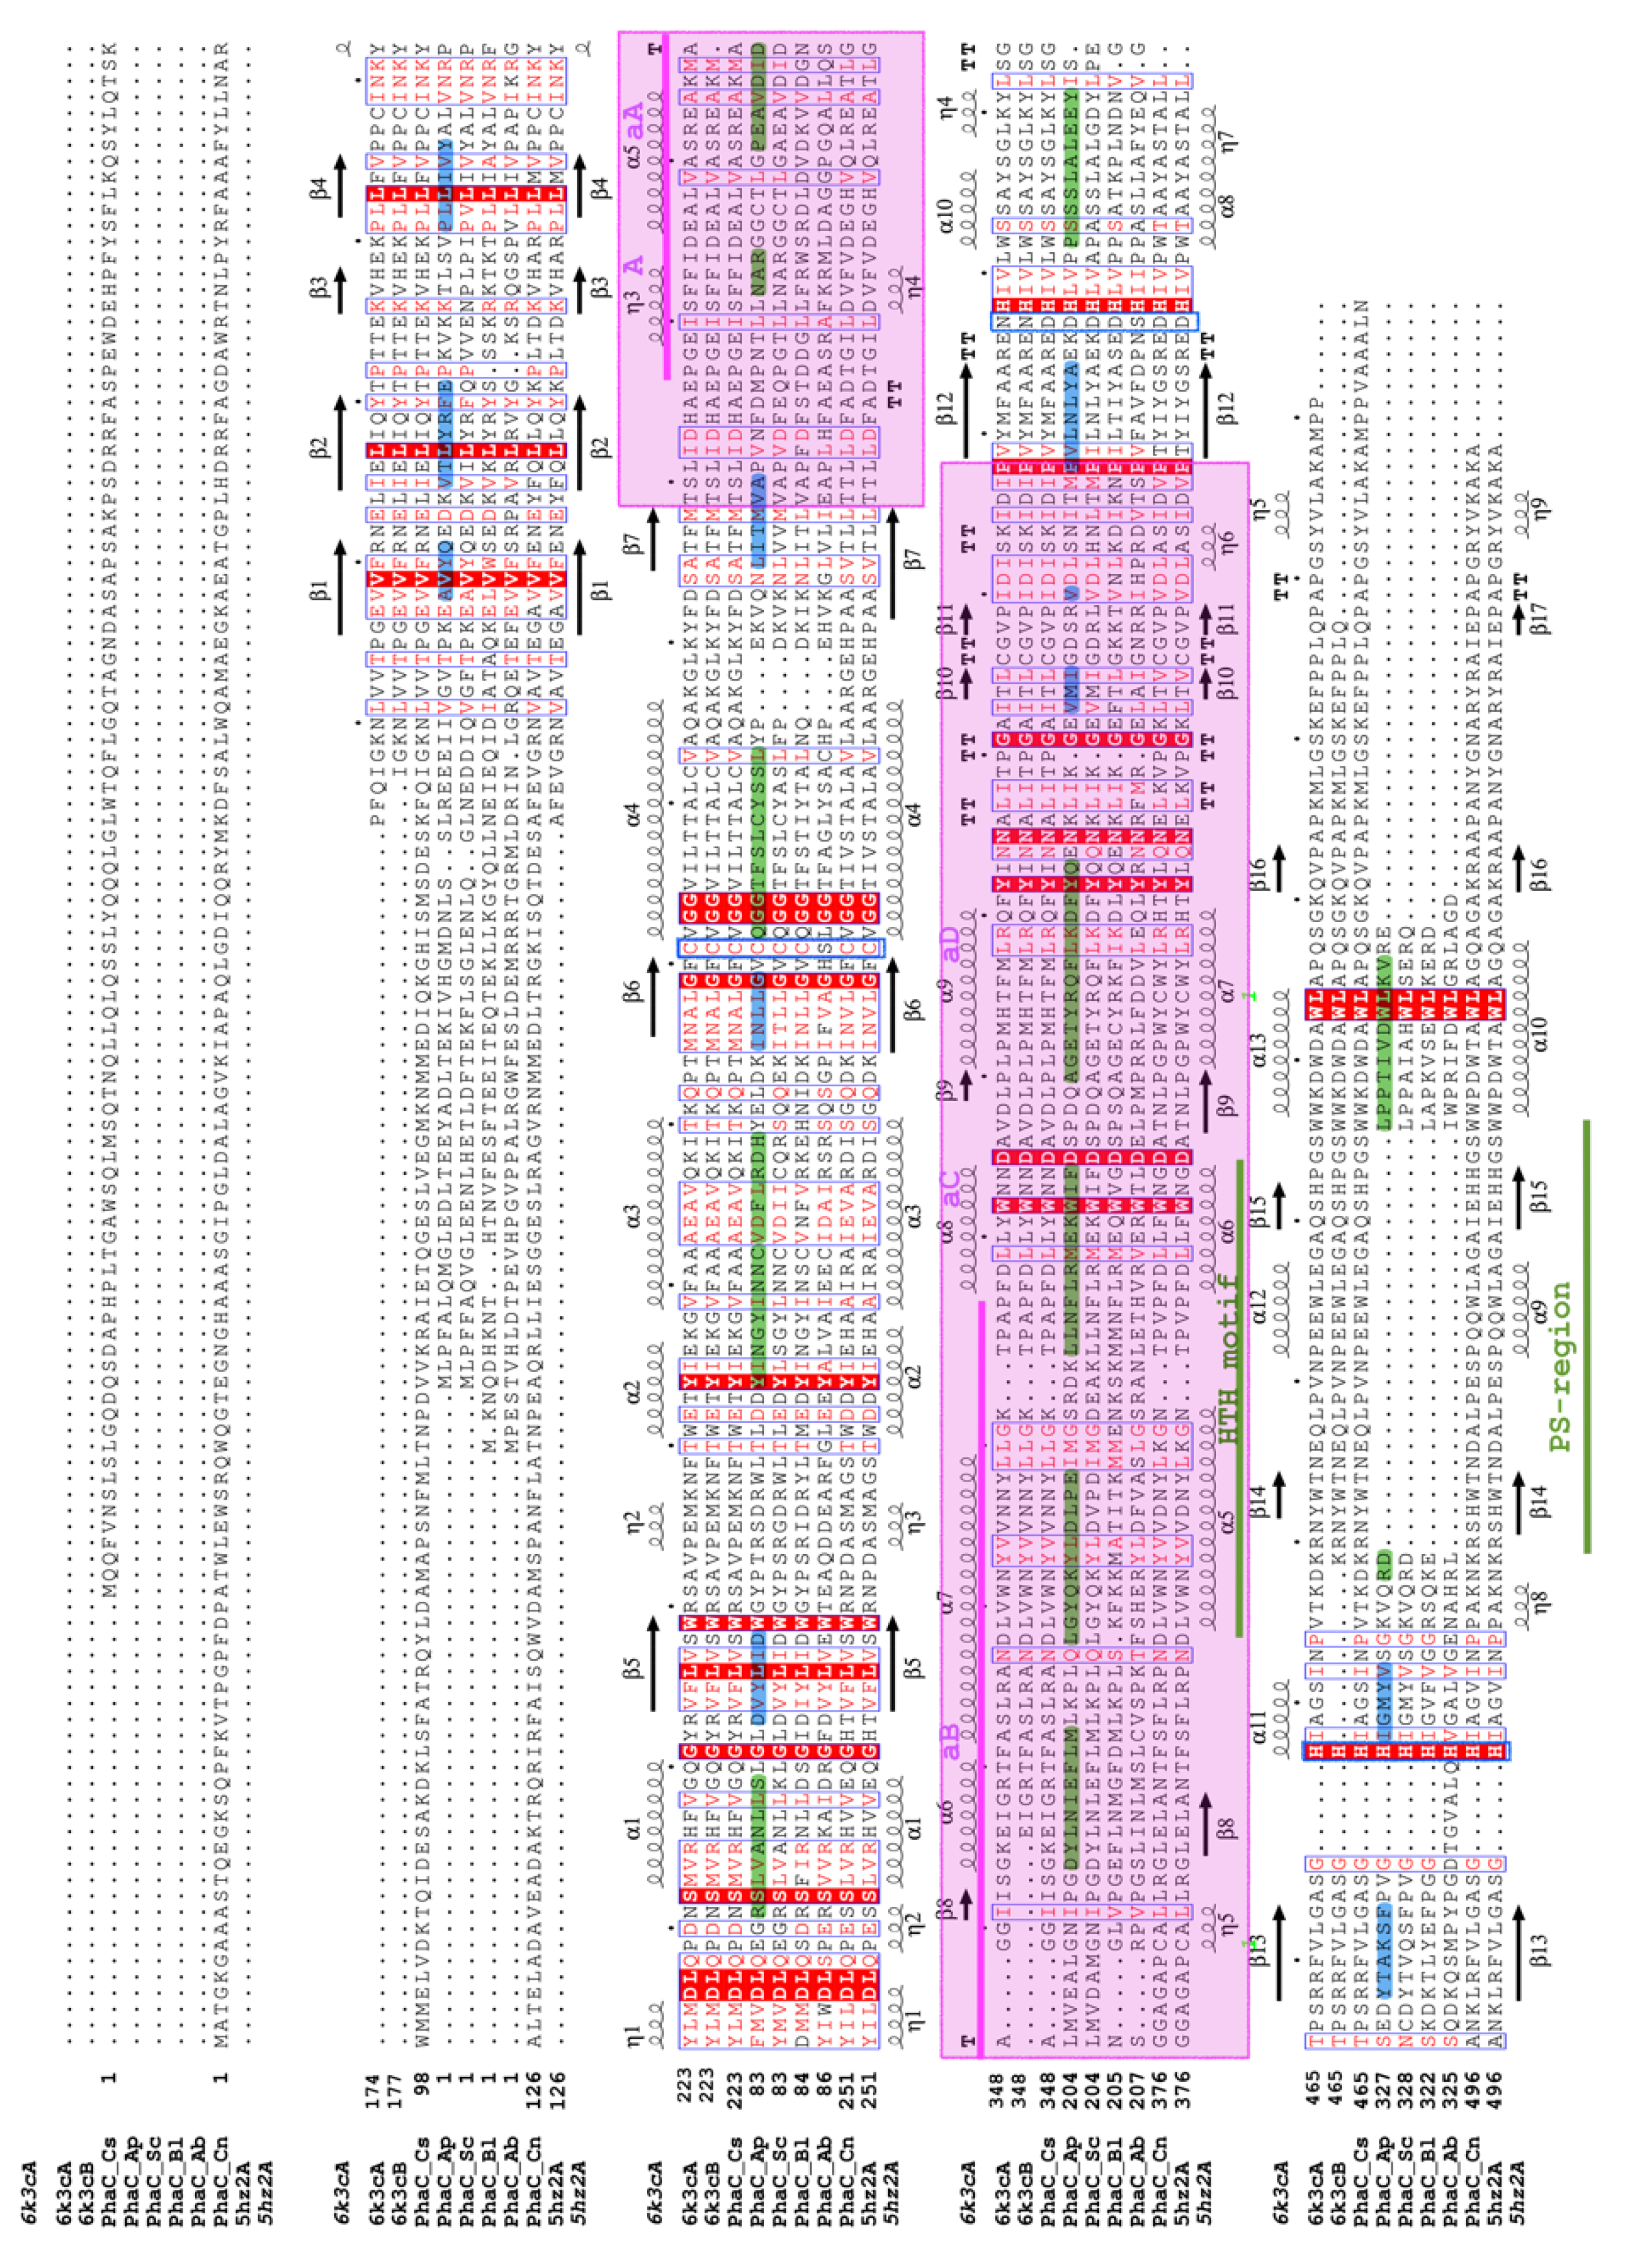
3.4. Sequence Analysis and Multiple Sequence Alignment for Homology Modeling

The gene for PhaCAp in A. platensis had a length of 1095 base pairs and encoded a protein consisting of 364 amino acid residues with a molecular weight of 42 kDa. Due to the low sequence identity between PhaCAp and the structurally known PhaC homologs, multiple sequence alignments with intact structural data were made to provide a more reliable basis for the construction of a 3D model for PhaCAp. A structure-based sequence alignment, pre-aligned for PhaCCs and PhaCCn structures, was used to align PhaCAp and four other related PhaC sequences. The resulting alignment is shown in Figure 4. According to the structure-based alignment, PhaCCs and PhaCCn share 51.5% sequence identity with each other, and 20% sequence identity with PhaCAp. Table 1 displays the conserved amino acid residues found in PhaCAp, PhaCCn (Cupriavidus necator PhaC), and PhaCCs (Chromobacterium sp. USM2 PhaC).
Since the experimental analysis revealed that rPhaCAp forms a catalytically active dimer, we used the asymmetric dimer of the catalytic domain of PhaCCs (6K3C) as a template for modeling to predict the overall fold and pinpoint the catalytically important residues and structural features of rPhaCAp. Similar to the template structure of PhaCCs, the 3D model for the PhaCAp is an asymmetric dimer in which the CoA-free monomer is in the closed conformation and the CoA-bound monomer in the open conformation (Figure 5A). The α/β hydrolase fold, consisting of the α/β core subdomains and the CAP subdomains (residues Val175-Pro301), forms the dimer interface in both the closed and open monomers of the PhaCAp dimer. The α/β core subdomain consists of β-sheets (β1-β8) and α-helices (α1-α5) in both monomers. However, the closed and open conformations represent a distinct conformation, particularly in the CAP domain (Figure 5B). The closed form of the CAP domain is composed of four α-helices (αA-αD) and three 310-helices (ηA-ηC) in the sequence (ηA-αA-αB-αC-αD-ηB-ηC), and make close contacts with the α/β core subdomain. The αB helix, which is made up of 26 amino acid residues (Asp215-Ile240), is a unique feature of the CAP subdomain. The αB helix, αB-αC loop, and αC helix of the CAP subdomain provide protection to the catalytic triad residues (Cys151-His339-Asp310) to a significant extent. On the other hand, the open form of the CAP subdomain comprises five α-helices (αA-αF) and a short 310-helix (ηA-ηF) in the sequence (ηA-αA-αB-αC-αD-ηB-ηF-ηC-ηD). In the open conformation, the fold of the CAP subdomain (residues Val175-Pro301) differs from that of the closed form, and the subdomain does not provide coverage to the catalytic triad residues. The dimer interface is formed by the CAP subdomain of both chains (Figure 5A,B). Analysis of the homology model for PhaCAp with the ProSA-web gave a Z-score of −6.24 (Figure 6A), and the crystal structure of PhaCCs gave a Z-score of −8.1 (Figure 6B). These Z-scores are within the range of the typical scores for experimentally determined structures of a similar size. Furthermore, the predicted secondary structure for PhaCAp matches well with the secondary structure elements in the PhaCCs and PhaCCn crystal structures. Hence, the overall fold of PhaCAp could be modeled with relatively good reliability.

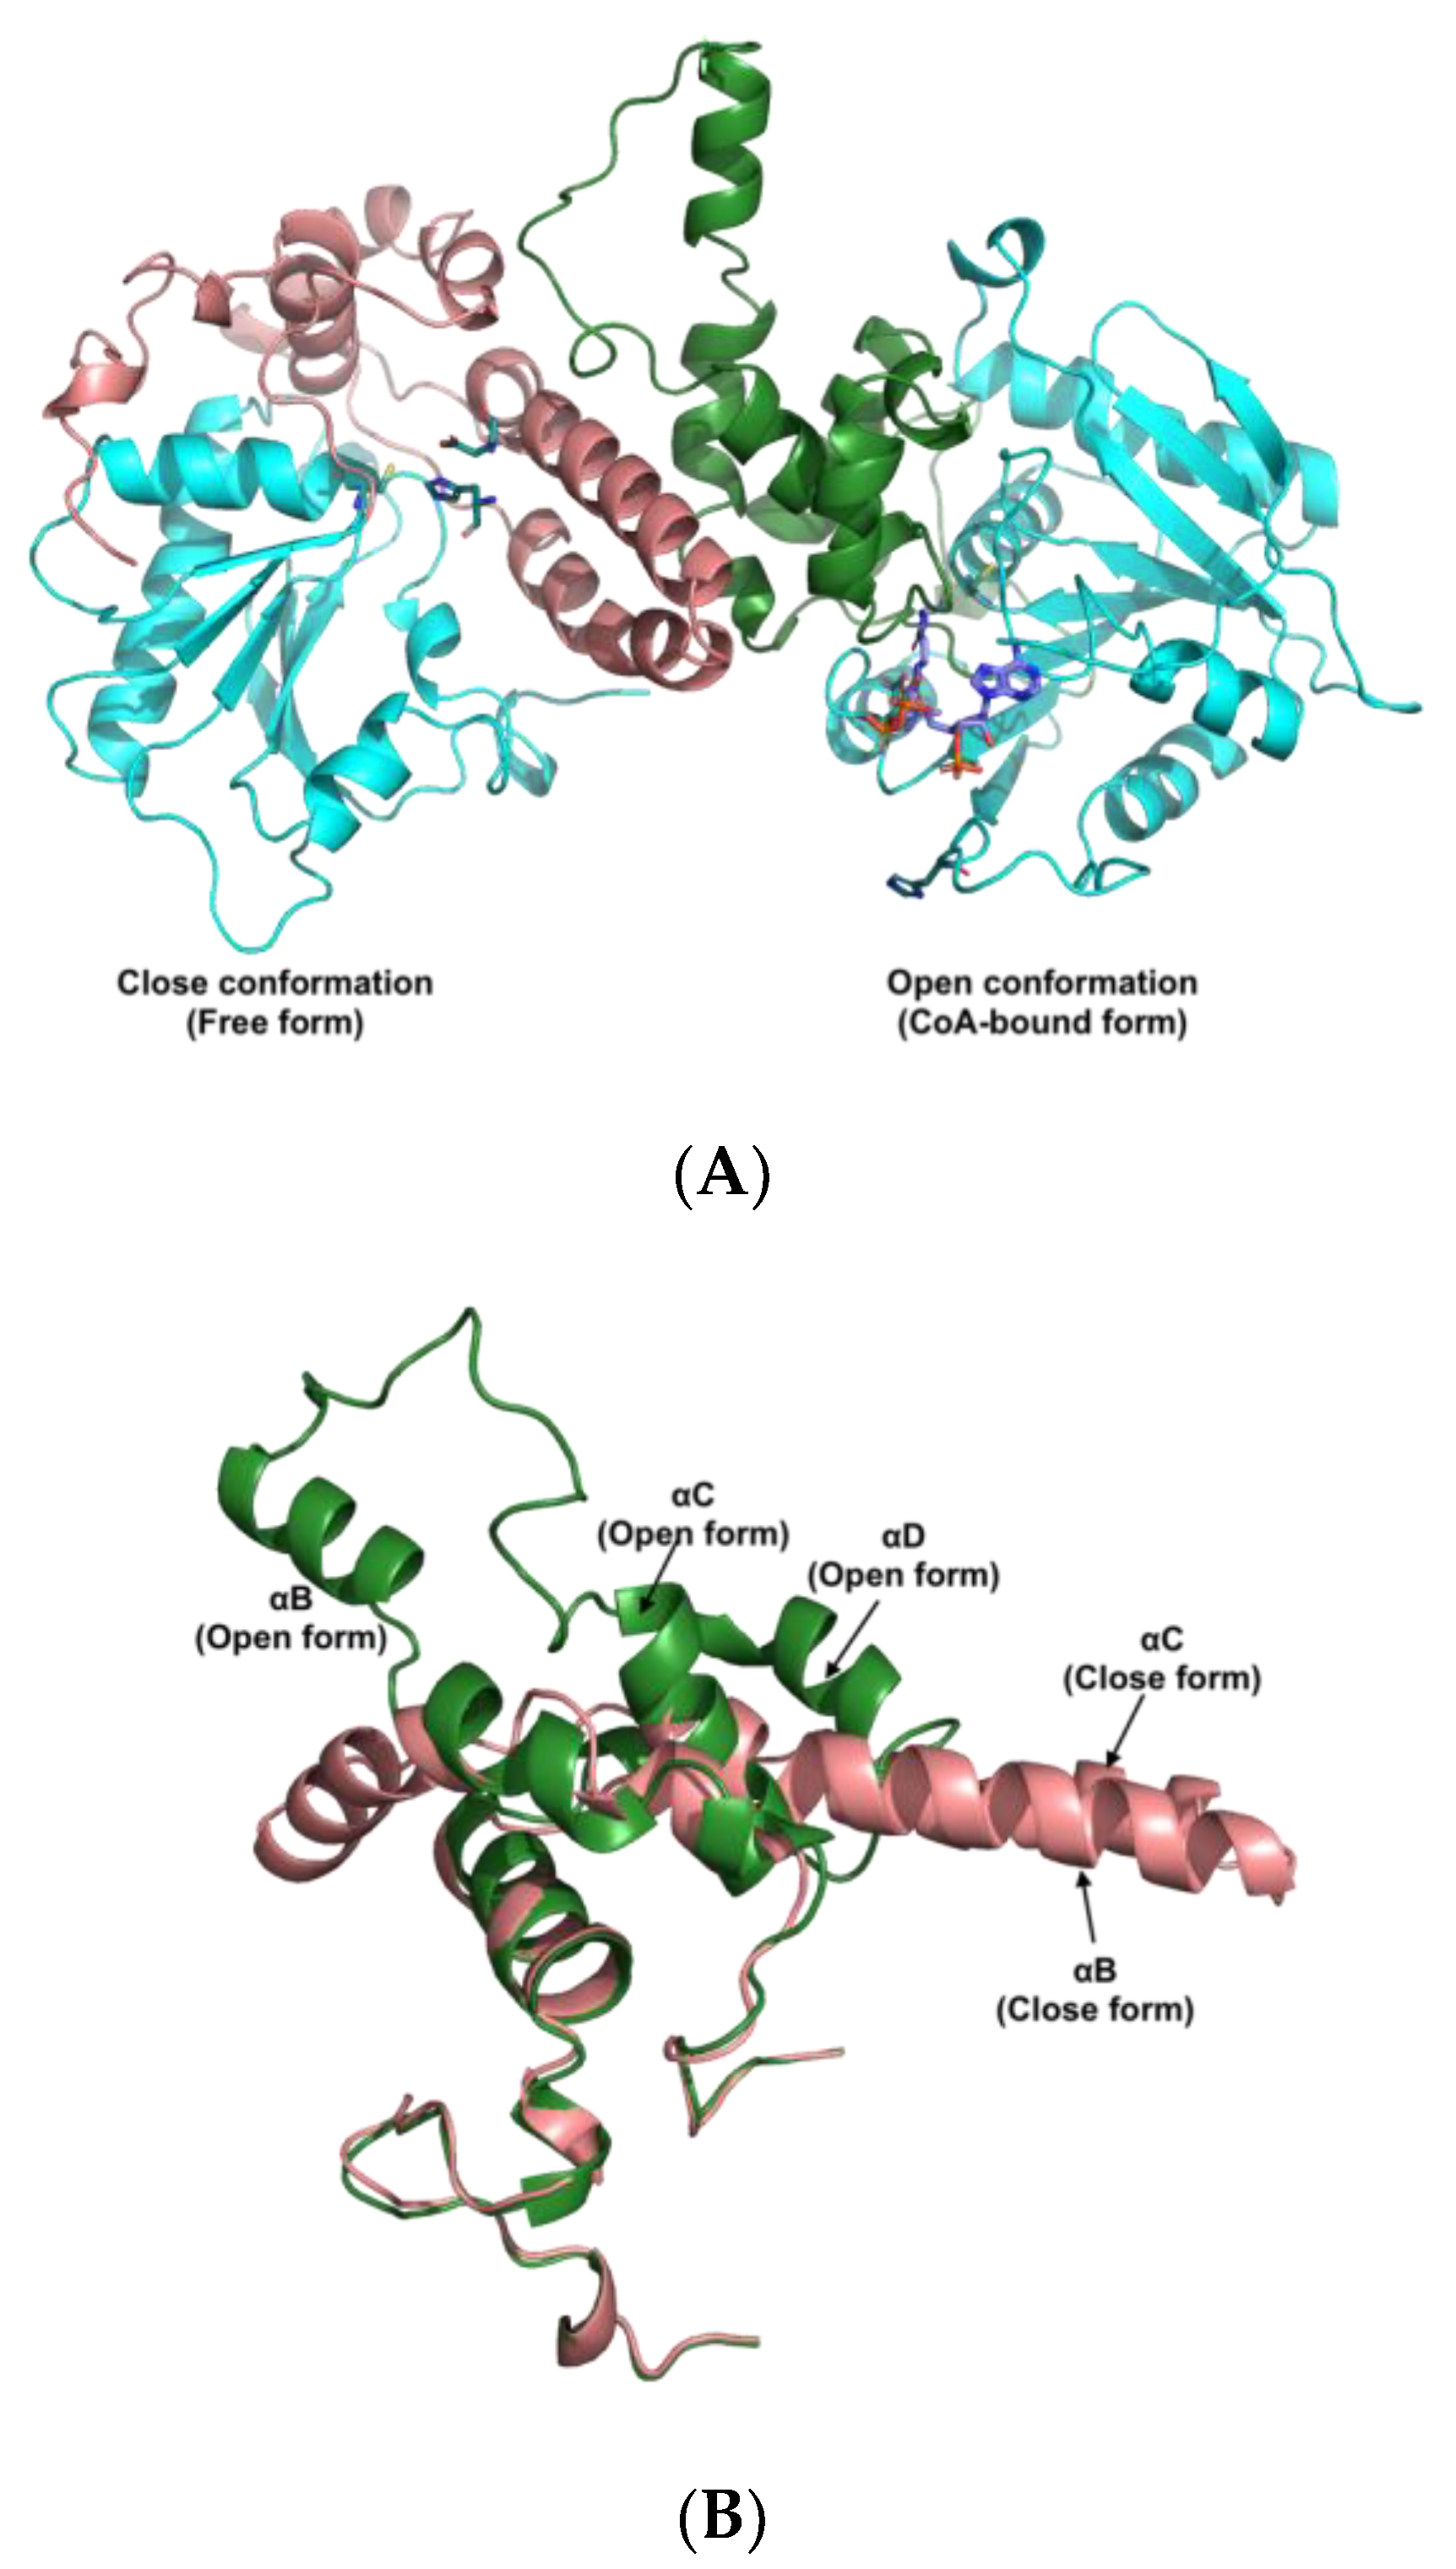
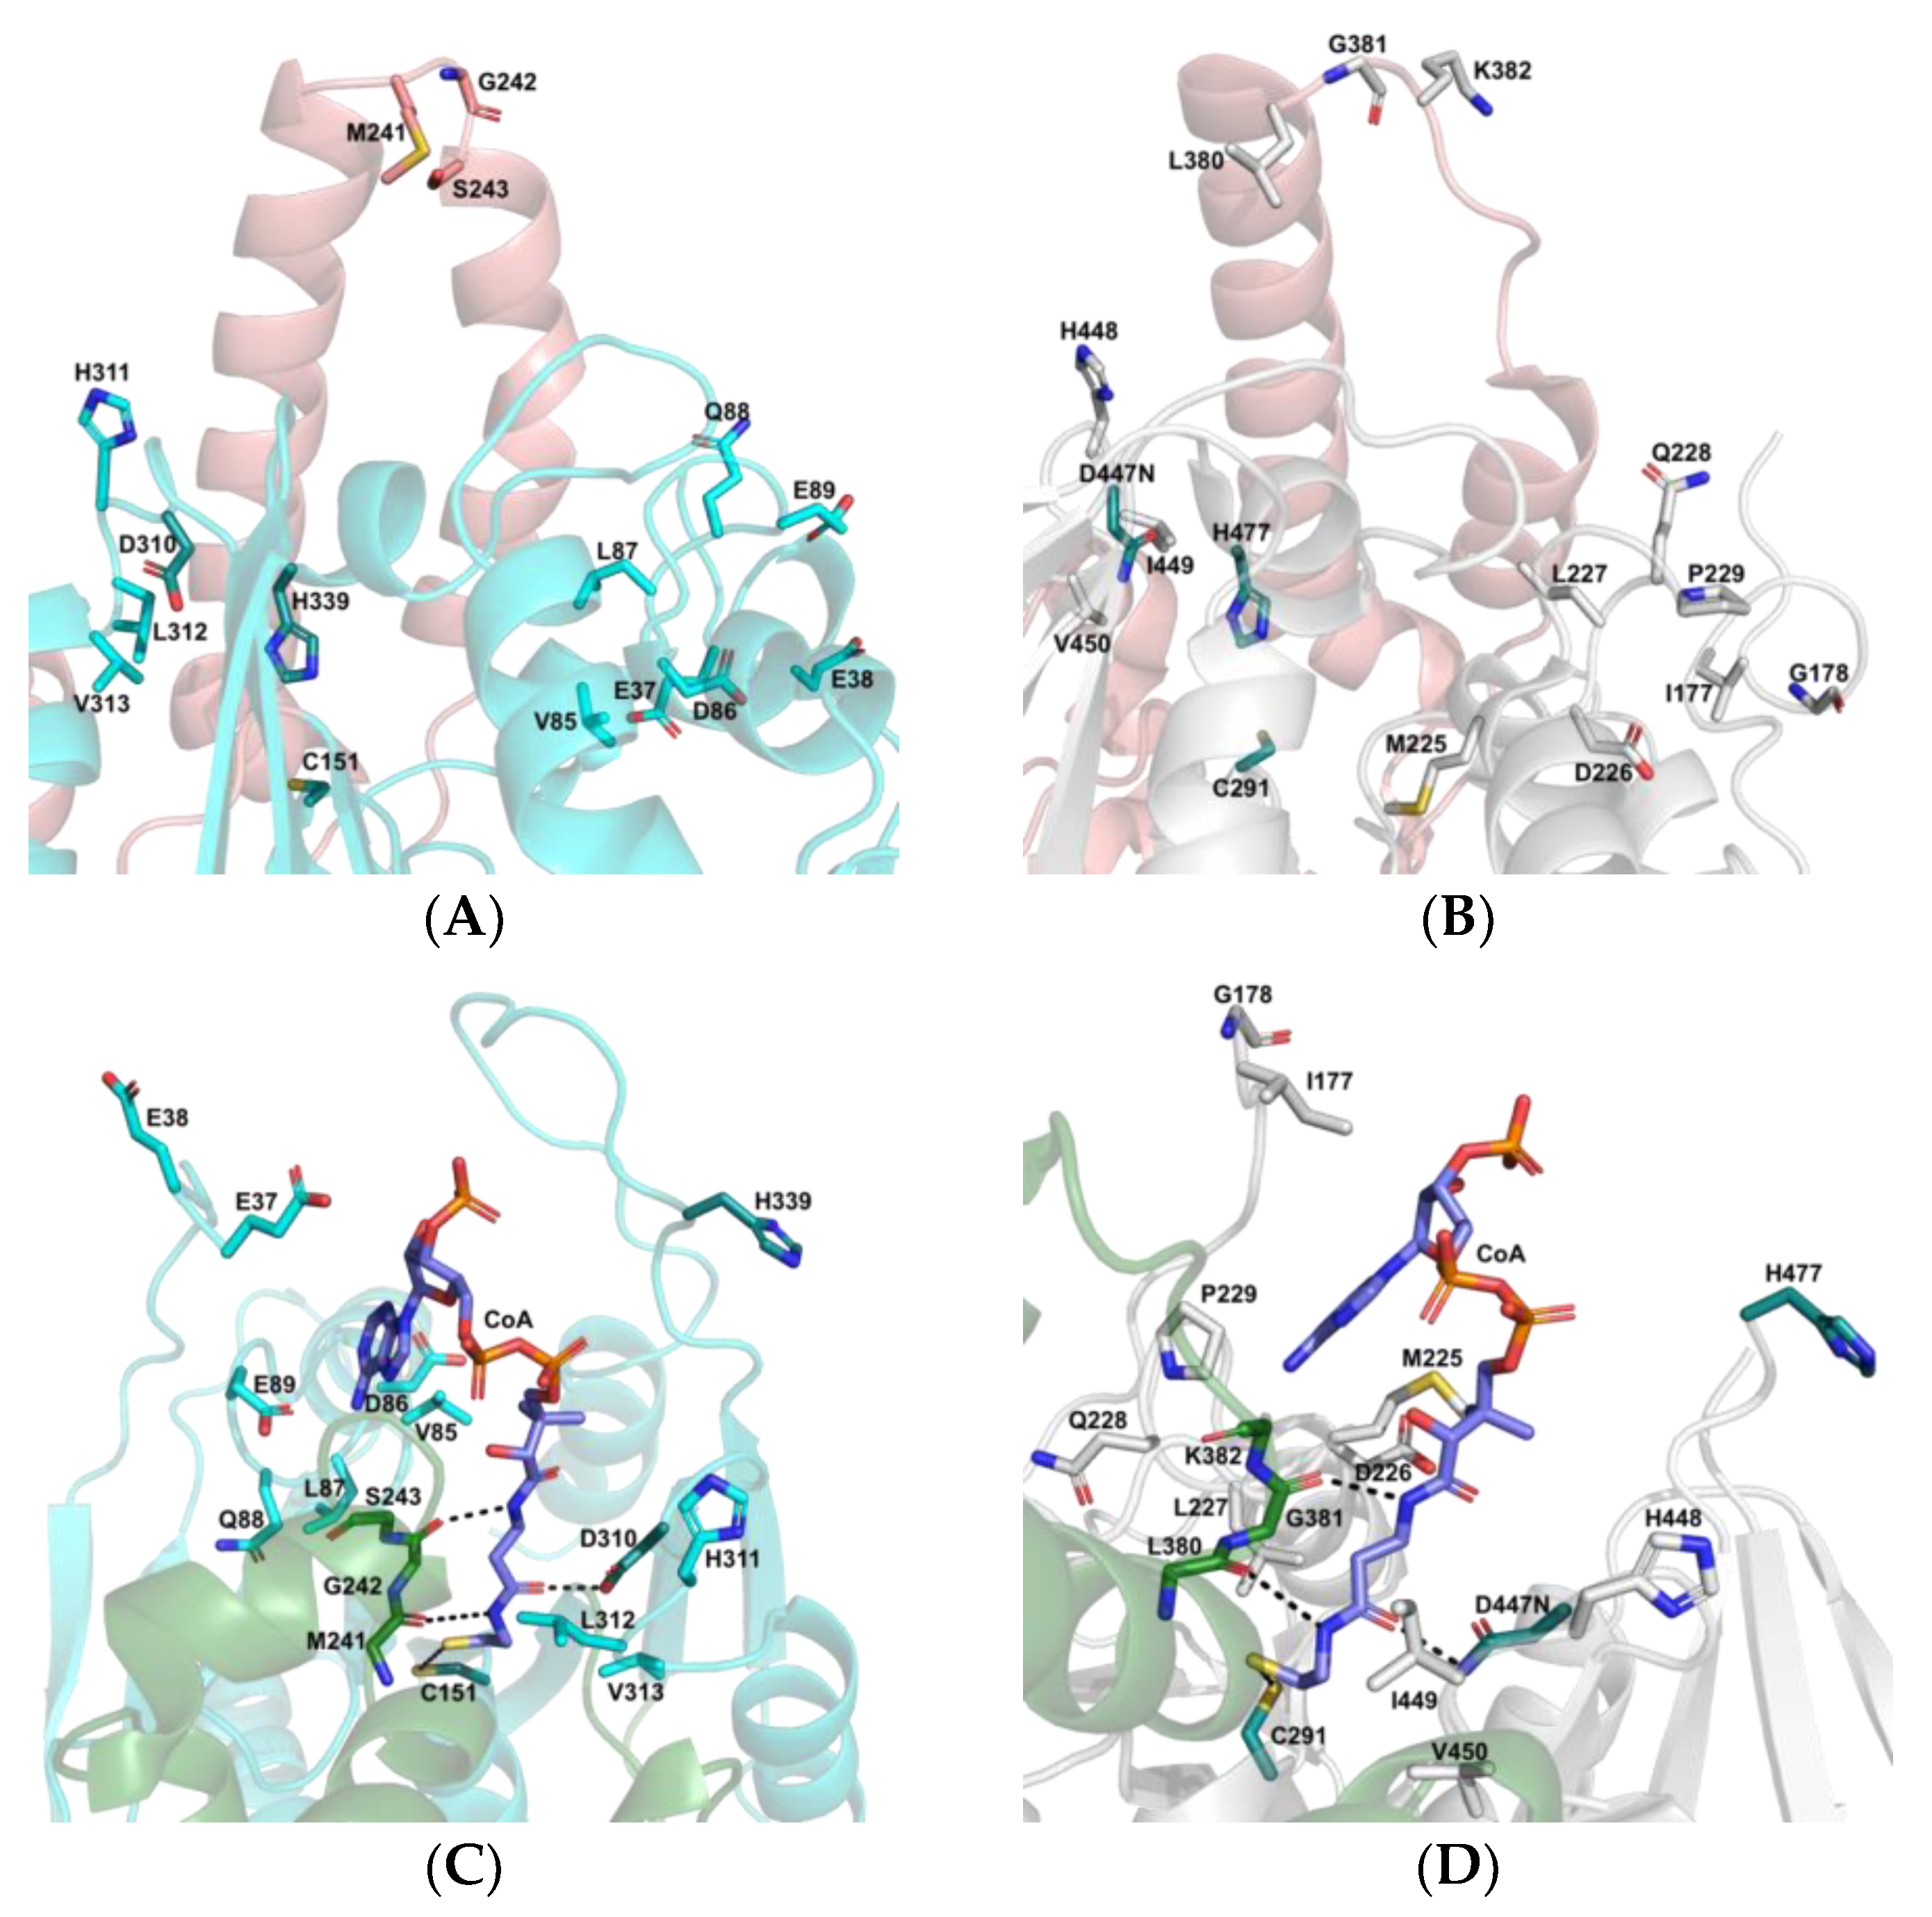
3.5. The Active Site and Catalytic Mechanism of PhaCAp

The overall architecture of the active site in PhaCAp is very similar to that of PhaCCs. In the closed monomer of PhaCCs, the αB-αC loop (Leu380-Lys382) in the CAP subdomain blocks the catalytic triad. In the closed-form monomer of rPhaCAp, the catalytic triad is blocked by residues Met241-Ser243 of the αB-αC loop in the CAP subdomain (Figure 7A,B). Residues Met241-Ser243 of the αC-αD loop in the CAP subdomain have a similar role in the open conformation of PhaCAp (Figure 7C,D). In PhaCAp, the open conformation exposes the catalytic Cys-His-Asp triad (Cys151-His339-Asp310). Residues Asp86, Leu87, His311, and His339 near the CoA binding site are conserved in PhaCAp, PhaCCs, and PhaCCn (Table 1). The PhaCAp catalytic triad (Cys-Asp-His) cleft is situated between the CAP subdomain and the α/β core subdomains. The β5-α3 loop containing Cys151, the β7-α4 loop containing Asp310, and the β8-α5 loop containing His339 are the components that make up the α/β core subdomains. The extended pantetheine arm of CoA attaches to the active site, which is close to the catalytic triad, and the ADP moiety of CoA is positioned there. Cysteamine containing the terminal thiol (SH) group is close to Cys151 (Figure 7C). The ribose ring is shielded by the hydrophilic residue Glu37 of the extended N-terminal loop, while the Val85 residue from β3-α1 loop interacts with the adenine moiety of CoA. The interaction with CoA is facilitated by Met241-Ser243, which is located in the αC-αD loop of the CAP subdomain. The hydrophobic nature of the cleft is due to the presence of nonpolar residues from the α/β core subdomains, namely Asp86, Val85, Leu312, and Val313. The side chain of Asp310 forms a hydrogen bond with the pantetheine arm of CoA. In addition, the αC-αD loop of the enzyme locks the pantetheine arm of CoA, as shown in Figure 7C, through the side chain carbonyl groups of Leu312 and Val313.

4. Discussion

In this study, we cloned class III PhaC from A. platensis (rPhaCAp) and produced rPhaCAp with hydrophilic His-tagged fusion using a bacterial protein expression system. We demonstrated that His-tagged rPhaCAp was highly induced with 0.2% (w/v) l-rhamnose at 30 °C. The purified His-tagged rPhaCAp, which represented a molecular size of 69 kDa, was used directly as an antigen for immunization without further depleting His-tag [27]. The presence of N-terminal His-tagged rPhaCAp was verified through Western blotting with polyclonal anti-rPhaCAp antibodies. The lower faint band was the minor protein contaminants. These minor proteins showed no changes without or with induction by increasing concentration of L-rhamnose (Figure 2A, lanes 2, 3, 4, and 5). In addition, size-exclusion chromatography revealed the active dimerization of rPhaCAp subunit (138 kDa). These results suggested that the PhaCAp exists as a dimeric assembly in solution. On the basis of previous observations, PhaC synthase likely forms either various dimers or multimers other than monomers [28,29,30]. Furthermore, a dimeric form of PhaC synthase was important in its catalytic function, although, in general, the monomeric and dimeric forms of PhaC exist in equilibrium [31,32,33]. The Michaelis–Menten fitting of the data shown in Figure 3A demonstrated that Km and kcat values for 3HB-CoA of the purified rPhaCAp were 31.3 ± 2 μM and 412.7 ± 2 1/s, respectively. Numerous studies have reported kinetic parameters of PhaC. One of those demonstrated that the Km value for 3HB-CoA of PhaCE from Synechocystis sp. PCC 6803 (rPhaCE) was 478 ± 31 µM [20], whereas the Km value of PhaC from Aeromonas caviae FA440 (rPhaCAc) was 77 ± 5 µM [34]. In addition, Km and kcat values of the purified rPhaCAv (Allochromatium vinosum) were 0.11 mM and 508 1/s, respectively [35], while those of the purified rPhaECEs (Ectothiorhodospira shaposhnikovii) were 0.065 mM and 320 1/s, respectively [36], and 0.13 mM and 3920 1/min, respectively for rPhaECAv (Allochromatium vinosum [37]. Probably, high values of Km correspond to the structure of PHA synthase. The rPhaCE has a lower enzyme affinity for substrates than rPhaC. The catalytic activity of PHA synthase is easily influenced by abiotic factors, i.e., pH, ionic strength, or temperature [38]. Although this enzyme has frequently been tested for activity using both Tris-HCl and phosphate-buffered solutions, at the same concentration and pH, Tris-HCl buffer exhibits primarily greater enzyme activity [38]. In the present study, the highest rPhaCAp activity was observed in 100 mM Tris-HCl buffer (pH 8.0) at 30 °C. Additionally, the PHA synthase activity from Ralstonia eutropha was reduced when the concentration of the buffer solution increased [38]. This implies that ionic strength affects PHA synthase activity. Additionally, the cultivation temperature could significantly influence PHB production. In terms of the class III PHA synthase, E. coli JM109 harboring the phaECAB expression plasmid was found to be capable of producing PHB. The maximum PHB production (0.64 g/L) was found at 30 °C among the four temperatures tested (25 °C, 30 °C, 37 °C, and 42 °C), indicating their differences in catalytic activity [39]. In addition, when BSA (0.2 mg/mL) was added in the assay mixture, the PHA synthase activity from Allochromatium vinosum (PhaECAv) was increased [35]. BSA has been shown to bind PHB granules in vitro, and it was proposed that BSA interacts with hydrophobic polymers to prevent the increasing chain from obstructing the active site, which led to the observed increase in activity. In the present study, inclusion of BSA (0.2 mg/mL) in the reaction mixture somehow enhanced the activity of rPhaCAp. Moreover, it was reported that a R. eutropha PHA synthase mutant with a high catalytic activity can synthesize higher molecular weight P (3HB) compared with wild type or mutants with lower catalytic activities, indicating that the catalytic activity of PHA synthase affects the molecular weight of PHA [40].
The PhaCAp forms are very similar to those of PhaCCs. The αB-αC loop undergoes conformational changes in the PhaCCs crystal structure, causing the C-terminal end region of the α/β core subdomains to become disordered. As a result, the αB and αC helices move away from the active site, allowing the CoA molecule to enter the active site cleft. [9]. The movement of the αB helix and αC helix of the CAP subdomain in both PhaCCs and PhaCAp is similar to a retracting “Boom gate” mechanism, which covers the catalytic Cys-His-Asp triad and blocks substrate entry [9]. In the open conformation of PhaCCs, the αC-αD loop in the CAP subdomain contains Leu380-Lys382 residues that form polar interactions with CoA, which is critical for PhaC activity. Additionally, the CoA moiety of acyl-CoA substrates plays an important role in this process. Zhang et al. [41] reported that the Class III synthase (PhaC-PhaE) from Allochromatium vinosum (PhaCEAv) appears to require the CoA molecule for binding to its substrate. These results are in agreement with the hypothesis that the complex between PhaC and the substrate acyl-CoA is formed by the interaction between PhaC and the CoA moiety of the substrate. The CAP domain may play a significant role in the catalytic activity of PHA synthase, because local conformational changes in the α/β core subdomain are caused by conformational changes of the CAP subdomain. The activity of PHA synthase is reliant on the presence of the catalytic triad C-H-D, which refers to the amino acid residues cysteine, histidine, and aspartate. Interestingly, this same triad is also responsible for the catalysis of lipases, but with the substitution of serine in place of cysteine (S-H-D) [8]. In the crystal structure of PhaCCs, the Cys291, Asp447, and His477 that form the catalytic triad are crucial for its catalytic activity [9]. The most striking difference between the crystal structures of PhaCCs and PhaCCn compared to PhaCAp is the lack of so-called protruding structure regions (PS-region in Figure 4), which are also lacking in some other PhaC proteins [42].
The catalytic triad in PhaCCs has been proposed to function in PHA biosynthesis in the following way. First, the 3HB-CoA molecule enters the active site tunnel of PhaC, where His477 facilitates deprotonation of the thiol group of the catalytic triad residue Cys291. This results in the formation of a covalent bond between 3HB and Cys291, and the release of CoA from the tunnel. Asp447 plays a role in the PHA elongation process by participating in the attack on the acyl-CoA substrate, specifically targeting the hydroxyl group within the acyl moiety. After the release of CoA, the newly attacked 3HB-CoA enters the active site and the cycle repeats. In this way, the polymer chain is elongated, resulting in the formation of (3HB)n+1 covalently bound to the Cys residue. Therefore, at the end of each cycle, the 3HB polymer is bound to the enzyme [43]. In addition, in the CoA-bound monomer of the PhaCCs dimer, the replacement of aspartic acid with asparagine (D447N) forms hydrogen bonds with the carbonyl group of CoA [14,44], and it was reported that a D480N mutation in 6x-His-tagged PhaCCn reduced the reaction rate to the 0.0008 units/mg from 20 unit/mg observed in wild type. Furthermore, the mutation of Phe318 in the pocket in Ralstonia eutropha PHA synthase (PhaCRe) led to a decrease in synthase activity [42]. Harada et al. [28] demonstrated that mutation of Phe318 in PhaCAc resulted in a significant reduction in polymer synthesis. Moreover, Müh et al. [45] showed that PhaC from Chromatium Vinosum was capable of in vitro PHA polymerization in the absence of PhaE, and PhaC alone was much more susceptible to such inhibition of PMSF in comparison with PhaEC.

5. Conclusions

In this study, the recombinant PhaCAp enzyme was constructed and produced in an E. cloni®10G system. Our homology model shows that Cys151, Asp310, and His339 are the important catalytic triad residues that determine the pocket size of PhaCAp. Therefore, it is reasonable to hypothesize that a mutation at these positions would have a significant influence on the pocket depth and PhaC synthase activity. To better understand the regulation of PHA synthesis in A. platensis, the kinetics of enzymes with catalytic triad (Cys-Asp-His) mutations would be valuable for further investigation. The proper orientation of the substrate may increase the efficiency of the catalytic reaction. Additionally, the model for an asymmetric PhaCAp homodimer provided insight into the putative mechanism and function of PHA synthase in A. platensis.

Supplementary Materials

The following supporting information can be downloaded at: https://www.mdpi.com/article/10.3390/biology12050751/s1, Figure S1. PHB Biosynthetic pathway in cyanobacteria (modified from Singh et al., 2017).

Author Contributions

Conceptualization, C.D., W.R., and T.A.S.; methodology, C.D., W.R., and T.A.S.; formal analysis, C.D.; investigation, W.R. and T.A.S.; resources, S.K., W.K., N.A., and S.J.; data curation, C.D. and M.A.; writing—original draft preparation, C.D., M.A., W.R., and T.A.S.; writing—review and editing, W.R. and T.A.S.; supervision, A.I. and P.M.; project administration, W.R. and T.A.S.; funding acquisition, W.R. All authors have read and agreed to the published version of the manuscript.

Funding

This research was funded by Kasetsart University Research and Development (KURDI), (grant number FF (KU)38.65 and FF (KU)14.65), and the Office of the Ministry of Higher Education, Science, Research and Innovation, and the Thailand Science Research and Innovation through the Kasetsart University Reinventing University Program 2021.

Institutional Review Board Statement

The animal study protocol was approved by Animal Care and Use for Scientific Research Kasetsart University under the ethic code ACKU64-VTN-017, December 2021.

Informed Consent Statement

Not applicable.

Data Availability Statement

All data obtained during this work is available from the authors on request.

Acknowledgments

We wish to thank the bioinformatics (J.V. Lehtonen), translational activities and structural biology(FINStruct) infrastructure support from Biocenter Finland and CSC IT Center for Science for computational infrastructure support at the Structural Bioinformatics Laboratory, (SBL), Åbo Akademi University. SBL is part of the NordForsk Nordic POP (Patient Oriented Products) and the Solutions for Health strategic area of Åbo Akademi University.

Conflicts of Interest

The authors declare no conflict of interest.

References

  1. Agarwal, P.; Soni, R.; Kaur, P.; Madan, A.; Mishra, R.; Pandey, J.; Singh, S.; Singh, G. Cyanobacteria as a promising alternative for sustainable environment: Synthesis of biofuel and biodegradable plastics. Front. Microbiol. 2022, 13, 939347. [Google Scholar] [CrossRef] [PubMed]
  2. Price, S.; Kuzhiumparambil, U.; Pernice, M.; Ralph, P. Techno-economic analysis of cyanobacterial PHB bioplastic production. J. Environ. Chem. Eng. 2022, 10, 107502. [Google Scholar] [CrossRef]
  3. Alves, A.A.; Siqueira, E.C.; Barros, M.P.S.; Silva, P.E.C.; Houllou, L.M. Polyhydroxyalkanoates: A review of microbial production and technology application. Int. J. Environ. Sci. Technol. 2023, 20, 3409–3420. [Google Scholar] [CrossRef]
  4. Sharma, S.; Sharma, P.; Sharma, V.; Bajaj, B.K. Polyhydroxybutyrate as an eco-friendly alternative of synthetic plastics. In Environmental and Agricultural Microbiology: Applications for Sustainability; Mishra, B.B., Nayak, S.K., Mohapatra, S., Samantaray, D., Eds.; Springer: Berlin/Heidelberg, Germany, 2021; pp. 101–149. [Google Scholar]
  5. Madbouly, S.A. 8 Bio-based polyhydroxyalkanoates blends and composites. In Biopolymers and Composites: Processing and Characterization; Madbouly, S.A., Zhang, C., Eds.; Boston: Berlin, Germany, 2021; pp. 235–254. [Google Scholar]
  6. Singh, A.K.; Sharma, L.; Mallick, N.; Mala, J. Progress and challenges in producing polyhydroxyalkanoate biopolymers from cyanobacteria. J. Appl. Phycol. 2017, 29, 1213–1232. [Google Scholar] [CrossRef]
  7. Wittenborn, E.C.; Jost, M.; Wei, Y.; Stubbe, J.; Drennan, C.L. Structure of the catalytic domain of the class I polyhydroxybutyrate synthase from Cupriavidus necator. J. Biol. Chem. 2016, 291, 25264–25277. [Google Scholar] [CrossRef] [PubMed]
  8. Chek, M.F.; Hiroe, A.; Hakoshima, T.; Sudesh, K.; Taguchi, S. PHA synthase (PhaC): Interpreting the functions of bioplastic-producing enzyme from a structural perspective. Appl. Microbiol. Biotechnol. 2019, 103, 1131–1141. [Google Scholar] [CrossRef] [PubMed]
  9. Chek, M.F.; Kim, S.-Y.; Mori, T.; Arsad, H.; Samian, M.R.; Sudesh, K.; Hakoshima, T. Structure of polyhydroxyalkanoate (PHA) synthase PhaC from Chromobacterium sp. USM2, producing biodegradable plastics. Sci. Rep. 2017, 7, 5312. [Google Scholar] [CrossRef]
  10. Higuchi-Takeuchi, M.; Motoda, Y.; Kigawa, T.; Numata, K. Class I polyhydroxyalkanoate synthase from the purple photosynthetic bacterium Rhodovulum sulfidophilum predominantly exists as a functional dimer in the absence of a substrate. ACS Omega. 2017, 2, 5071–5078. [Google Scholar] [CrossRef]
  11. Teh, A.-H.; Chiam, N.-C.; Furusawa, G.; Sudesh, K. Modelling of polyhydroxyalkanoate synthase from Aquitalea sp. USM4 suggests a novel mechanism for polymer elongation. Int. J. Biol. Macromol. 2018, 119, 438–445. [Google Scholar]
  12. Tan, I.K.P.; Foong, C.P.; Tan, H.T.; Lim, H.; Zain, N.-A.A.; Tan, Y.C.; Hoh, C.C.; Sudesh, K. Polyhydroxyalkanoate (PHA) synthase genes and PHA-associated gene clusters in Pseudomonas spp. and Janthinobacterium spp. isolated from Antarctica. J. Biotechnol. 2020, 313, 18–28. [Google Scholar] [PubMed]
  13. Mezzolla, V.; D'Urso, O.F.; Poltronieri, P. Role of PhaC type I and type II enzymes during PHA biosynthesis. Polymers 2018, 10, 910. [Google Scholar] [CrossRef] [PubMed]
  14. Chek, M.F.; Kim, S.-Y.; Mori, T.; Tan, H.T.; Sudesh, K.; Hakoshima, T. Asymmetric open-closed dimer mechanism of polyhydroxyalkanoate synthase PhaC. iScience 2020, 23, 101084. [Google Scholar] [CrossRef] [PubMed]
  15. Markou, G. Overview of microalgal cultivation, biomass processing and application. In Handbook of Algal Science, Technology and Medicine; Konur, O., Ed.; Academic Press: Cambridge, MA, USA, 2020; pp. 343–352. [Google Scholar]
  16. Deschoenmaeker, F.; Facchini, R.; Cabrera Pino, J.C.; Bayon-Vicente, G.; Sachdeva, N.; Flammang, P.; Wattiez, R. Nitrogen depletion in Arthrospira sp. PCC 8005, an ultrastructural point of view. J. Struct. Biol. 2016, 196, 385–393. [Google Scholar] [CrossRef] [PubMed]
  17. Duangsri, C.; Mudtham, N.A.; Incharoensakdi, A.; Raksajit, W. Enhanced polyhydroxybutyrate (PHB) accumulation in heterotrophically grown Arthrospira platensis under nitrogen deprivation. J. Appl. Phycol. 2020, 32, 3645–3654. [Google Scholar] [CrossRef]
  18. Monshupanee, T.; Incharoensakdi, A. Enhanced accumulation of glycogen, lipids and polyhydroxybutyrate under optimal nutrients and light intensities in the cyanobacterium Synechocystis sp. PCC 6803. J. Appl. Microbiol. 2014, 116, 830–838. [Google Scholar] [CrossRef] [PubMed]
  19. Bradford, M.M. A rapid and sensitive method for the quantitation of microgram quantities of protein utilizing the principle of protein-dye binding. Anal. Biochem. 1976, 72, 248–254. [Google Scholar] [CrossRef]
  20. Numata, K.; Motoda, Y.; Watanabe, S.; Osanai, T.; Kigawa, T. Co-expression of two polyhydroxyalkanoate synthase subunits from Synechocystis sp. PCC 6803 by cell-free synthesis and their specific activity for polymerization of 3-hydroxybutyryl-coenzyme A. Biochemistry 2015, 54, 1401–1407. [Google Scholar] [CrossRef]
  21. Johnson, M.S.; Lehtonen, J.V. Comparison of protein three-dimensional structures. In Bioinformatics, Sequence, Structure, and Databanks; Higgins, D., Taylor, W., Eds.; Oxford University Press: Oxford, UK, 2000; pp. 15–50. [Google Scholar]
  22. Lehtonen, J.V.; Still, D.-J.; Rantanen, V.-V.; Ekholm, J.; Björklund, D.; Iftikhar, Z.; Huhtala, M.; Repo, S.; Jussila, A.; Jaakkola, J.; et al. BODIL: A molecular modeling environment for structure-function analysis and drug design. J. Comput. Aided Mol. Des. 2004, 18, 401–419. [Google Scholar] [CrossRef]
  23. Drozdetskiy, A.; Cole, C.; Procter, J.; Barton, G.J. JPred4: A protein secondary structure prediction server. Nucleic Acids Res. 2015, 43, W389–W394. [Google Scholar] [CrossRef]
  24. Robert, X.; Gouet, P. Deciphering key features in protein structures with the new ENDscript server. Nucleic Acids Res. 2014, 42, W320–W324. [Google Scholar] [CrossRef]
  25. Sippl, M.J. Recognition of errors in three-dimensional structures of proteins. Proteins 1993, 17, 355–362. [Google Scholar] [CrossRef]
  26. Wiederstein, M.; Sippl, M.J. ProSA-web: Interactive web service for the recognition of errors in three-dimensional structures of proteins. Nucleic Acids Res. 2007, 35, W407–W410. [Google Scholar] [CrossRef]
  27. GE Healthcare. Tagged proteins. In Handbook of Affinity Chromatography; General Electric Company: Uppsala, Sweden, 2016; Volume 2, pp. 9–291. [Google Scholar]
  28. Harada, K.; Kobayashi, S.; Oshima, K.; Yoshida, S.; Tsuge, T.; Sato, S. Engineering of Aeromonas caviae polyhydroxyalkanoate synthase through site-directed mutagenesis for enhanced polymerization of the 3-hydroxyhexanoate. Front. Bioeng. Biotechnol. 2021, 9, 627082. [Google Scholar] [CrossRef] [PubMed]
  29. Harada, K.; Nambu, Y.; Mizuno, S.; Tsuge, T. In vivo and in vitro characterization of hydrophilic protein tag-fused Ralstonia eutropha polyhydroxyalkanoate synthase. Int. J. Biol. Macromol. 2019, 138, 379–385. [Google Scholar] [CrossRef]
  30. Wodzinska, J.; Snell, K.D.; Rhomberg, A.; Sinskey, A.J.; Biemann, K.; Stubbe, J. Polyhydroxybutyrate synthase: Evidence for covalent catalysis. J. Am. Chem. Soc. 1996, 118, 6319–6320. [Google Scholar] [CrossRef]
  31. Numata, K.; Motoda, Y.; Watanabe, S.; Tochio, N.; Kigawa, T.; Doi, Y. Active intermediates of polyhydroxyalkanoate synthase from Aeromonas caviae in polymerization reaction. Biomacromolecules 2012, 13, 3450–3455. [Google Scholar] [CrossRef] [PubMed]
  32. Jia, K.; Cao, R.; Hua, D.H.; Li, P. Study of class I and class III polyhydroxyalkanoate (PHA) synthases with substrates containing a modified side chain. Biomacromolecules 2016, 17, 1477–1485. [Google Scholar] [CrossRef] [PubMed]
  33. Zhang, S.; Kolvek, S.; Goodwin, S.; Lenz, R.W. Poly(hydroxyalkanoic acid) biosynthesis in Ectothiorhodospira shaposhnikovii: Characterization and reactivity of a type III PHA synthase. Biomacromolecules 2004, 5, 40–48. [Google Scholar] [CrossRef]
  34. Yuan, W.; Jia, Y.; Tian, J.; Snell, K.D.; Müh, U.; Sinskey, A.J.; Lambalot, R.H.; Walsh, C.T.; Stubbe, J. Class I and III polyhydroxyalkanoate synthases from Ralstonia eutropha and Allochromatium vinosum: Characterization and substrate specificity studies. Arch. Biochem. Biophys. 2001, 394, 87. [Google Scholar] [CrossRef]
  35. Zhang, S.; Yasuo, T.; Lenz, R.W.; Goodwin, S. Kinetic and mechanistic characterization of the polyhydroxybutyrate synthase from Ralstonia eutropha. Biomacromolecules 2000, 1, 244–251. [Google Scholar] [CrossRef] [PubMed]
  36. Pu, N.; Wang, M.-R.; Li, Z.-J. Characterization of polyhydroxyalkanoate synthases from the marine bacterium Neptunomonas concharum JCM17730. J. Biotechnol. 2020, 319, 69–73. [Google Scholar] [CrossRef] [PubMed]
  37. Agus, J.; Kahar, P.; Abe, H.; Doi, Y.; Tsuge, T. Molecular weight characterization of poly[(R-3-hydroxybutyrate] synthesized by genetically engineered strains of Escherichia coli. Polym. Degrad. Stab. 2006, 91, 1138–1146. [Google Scholar] [CrossRef]
  38. Zhang, W.; Chen, C.; Cao, R.; Maurmann, L.; Li, P. Inhibitors of polyhydroxyalkanoate (PHA) synthases: Synthesis, molecular docking, and implications. Chem. BioChem. 2015, 16, 156–166. [Google Scholar] [CrossRef] [PubMed]
  39. Kim, J.; Kim, Y.J.; Choi, S.Y.; Lee, S.Y.; Kim, K.J. Crystal structure of Ralstonia eutropha polyhydroxyalkanoate synthase C-terminal domain and reaction mechanisms. Biotechnol. J. 2017, 12, 1600648. [Google Scholar] [CrossRef]
  40. Chen, G.Q.; Jiang, X.R. Engineering bacteria for enhanced polyhydroxyalkanoates (PHA) biosynthesis. Synth. Syst. Biotechnol. 2017, 2, 192–197. [Google Scholar] [CrossRef]
  41. Tian, J.; Sinskey, A.J.; Stubbe, J. Detection of intermediates from the polymerization reaction catalyzed by a D302A mutant of class III polyhydroxyalkanoate (PHA) synthase. Biochemistry 2005, 44, 1495–1503. [Google Scholar] [CrossRef]
  42. Jia, Y.; Yuan, W.; Wodzinska, J.; Park, C.; Sinskey, A.J.; Stubbe, J. Mechanistic studies on class I polyhydroxybutyrate (PHB) synthase from Ralstonia eutropha: Class I and III synthases share a similar catalytic mechanism. Biochemistry 2001, 40, 1011–1019. [Google Scholar] [CrossRef]
  43. Stubbe, J.; Tian, J. Polyhydroxyalkanoate (PHA) homeostasis: The role of the PHA synthase. Nat. Prod. Rep. 2003, 20, 445–457. [Google Scholar] [CrossRef]
  44. Neoh, S.Z.; Chek, M.F.; Tan, H.T.; Linares-Pastén, J.A.; Nandakumar, A.; Hakoshima, T.; Sudesh, K. Polyhydroxyalkanoate synthase (PhaC): The key enzyme for biopolyester synthesis. Curr. Res. Biotechnol. 2022, 4, 87–101. [Google Scholar] [CrossRef]
  45. Müh, U.; Sinskey, A.J.; Kirby, D.P.; Lane, W.S.; Stubbe, J. PHA synthase from Chromatium vinosum: Cysteine 149 is involved in covalent catalysis. Biochemistry 1999, 38, 826–837. [Google Scholar] [CrossRef] [PubMed]
Figure 1. (A) PCR amplification from A. platensis DNA, lane: M marker; lane 1: PCR fragment of A. platensis phaC (1131 bp) (B) Schematic map of pSol-Tsf-phaCAp plasmid carrying A. platensis phaC gene).
Biology 12 00751 g001
Figure 2. (A) SDS-PAGE representing rPhaCAp protein expression in E. cloni®10G. The target protein is about 69 kDa. Lane M: protein marker (in kDa); lane 1: crude protein fraction; lane 2: soluble protein fraction (SF) before l-rhamnose induction; lane 3: SF after 0.002% (w/v) l-rhamnose induction; lane 4: SF after 0.02% (w/v) L-rhamnose induction; lane 5: SF after 0.2% (w/v) L-rhamnose induction; lane 6: purified rPhaCAp obtained from SF after 0.2% (w/v) l-rhamnose induction. (B) Western blot detection of rPhaCAp protein with polyclonal anti-rPhaCAp antibody which corresponds to protein band of approximately 69 kDa. Lane M: protein marker (in kDa); lane 1: purified soluble protein fraction containing rPhaCAp protein after 0.2% (w/v) L-rhamnose induction.
Biology 12 00751 g002
Figure 3. (A) The Michaelis–Menten plot of purified rPhaCAp (B) Size-exclusion chromatography of rPhaCAp.
Biology 12 00751 g003
Figure 4. Multiple sequence alignment used for modeling. The PhaC proteins of PhaCAp, PhaCSs, PhaCPl, and PhaCAb were aligned to the pre-aligned structure-based alignment of Chromobacterium sp. USM2 PhaCCs (PDB ID 6K3C) and Cupriavidus necator PhaCCn (PDB ID 5HZ2). The secondary structures of PhaCCs and PhaCCn are shown above and below the alignment, respectively. The predicted secondary structure of PhaCAp is highlighted, with helices colored green and beta-strands colored blue. Residues that are conserved are depicted with a red background. The catalytic triad residues (Cys-His-Asp) are marked with blue boxes. CAP subdomains are highlighted in pink and the Lid area with a pink line. The HTH motif and lacking PS-region are shown with a green line and marked.
Biology 12 00751 g004
Figure 5. (A) Model for the PhaCAp homodimer consisting of free form and CoA-bound form. The α-helical CAP subdomains in the dimer are colored in salmon and forest (residues 175-301). The catalytic triad (Cys151-His339-Asp310) is represented by a stick in deep teal color. The CoA is a purple stick. (B) Comparison between CAP subdomains of free form (salmon) and CoA-bound form (forest).
Biology 12 00751 g005
Figure 6. Quality assessment of the PhaCAp. The graphs reveal the quality assessment of the model structures using ProSA-web [25,26]. (A) The ProSA-web scores (black dot) for the 3D model of PhaCAp are based on the PhaCCs. (B) The ProSA-web scores (black dot) for the 3D model of PhaCCs.
Biology 12 00751 g006
Figure 7. Side view of the closed and open active site cleft. (A,C) The active site of PhaCAp with the catalytic triad Cys151-His339-Asp310 in the closed and open conformation. (B,D) The active site of PhaCCs (6K3C) in the closed and open conformation. The catalytic triad residues displayed as deep-teal sticks and the CoA as purple sticks. The residues of the CAP subdomain from the closed and open conformation are presented in salmon and forest color, respectively.
Biology 12 00751 g007
Table 1. List of the conserved amino acid residues in PhaCCn, PhaCCs, and PhaCAp. The catalytic triad residues are depicted with a blue background.
Conserved ResiduePhaCCnPhaCCsPhaCApConserved ResiduePhaCCnPhaCCsPhaCAp
(This Study)(This Study)
VV211V183V43LL316L288L148
TT212T184T44GG317G289G149
VV217V189V49CC319C291C151
LL225L197L57GG321G293G153
PP230P202P62GG322G294G154
KK234K206K66YY406Y373Y234
PP239P211P71GG414G381G242
LL240L212L72WW425W392W256
LL241L213L73DD428D395D259
VV243V215V75LL441L408L272
NN248N220N80YY445Y412Y276
DD254D226D86NN448N415N279
LL255L227L87LL450L417L280
QQ256Q228Q88GG454G421G284
SS260S232S92DD464D431D294
VV262V234V94II468I435I298
GG269G241G101PP471P438P301
VV272V244V104DD480D447ND310
LL274L246L106HH481H448H311
WW277W249W109VV483V450V313
TT288T260T120GG507G476G338
YY292Y264Y124HH508H477H339
II293I265I125WW554W523W359
NN314N286N146LL555L524L360
Disclaimer/Publisher’s Note: The statements, opinions and data contained in all publications are solely those of the individual author(s) and contributor(s) and not of MDPI and/or the editor(s). MDPI and/or the editor(s) disclaim responsibility for any injury to people or property resulting from any ideas, methods, instructions or products referred to in the content.

