
Age and Sex Determine Electrocardiogram Parameters in the Octodon degus

 , , , , ,
on behalf of GOING-FWD Consortium
, , , , ,
on behalf of GOING-FWD Consortium
Abstract
:Simple Summary
Abstract
1. Introduction
2. Materials and Methods
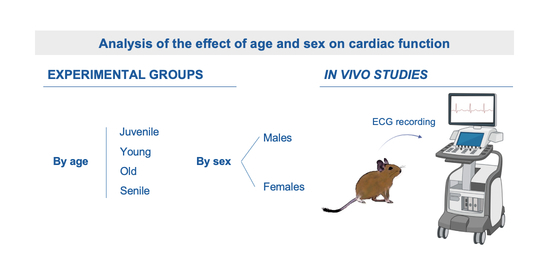
2.1. Animals and Experimental Groups
2.2. Ethics Statement
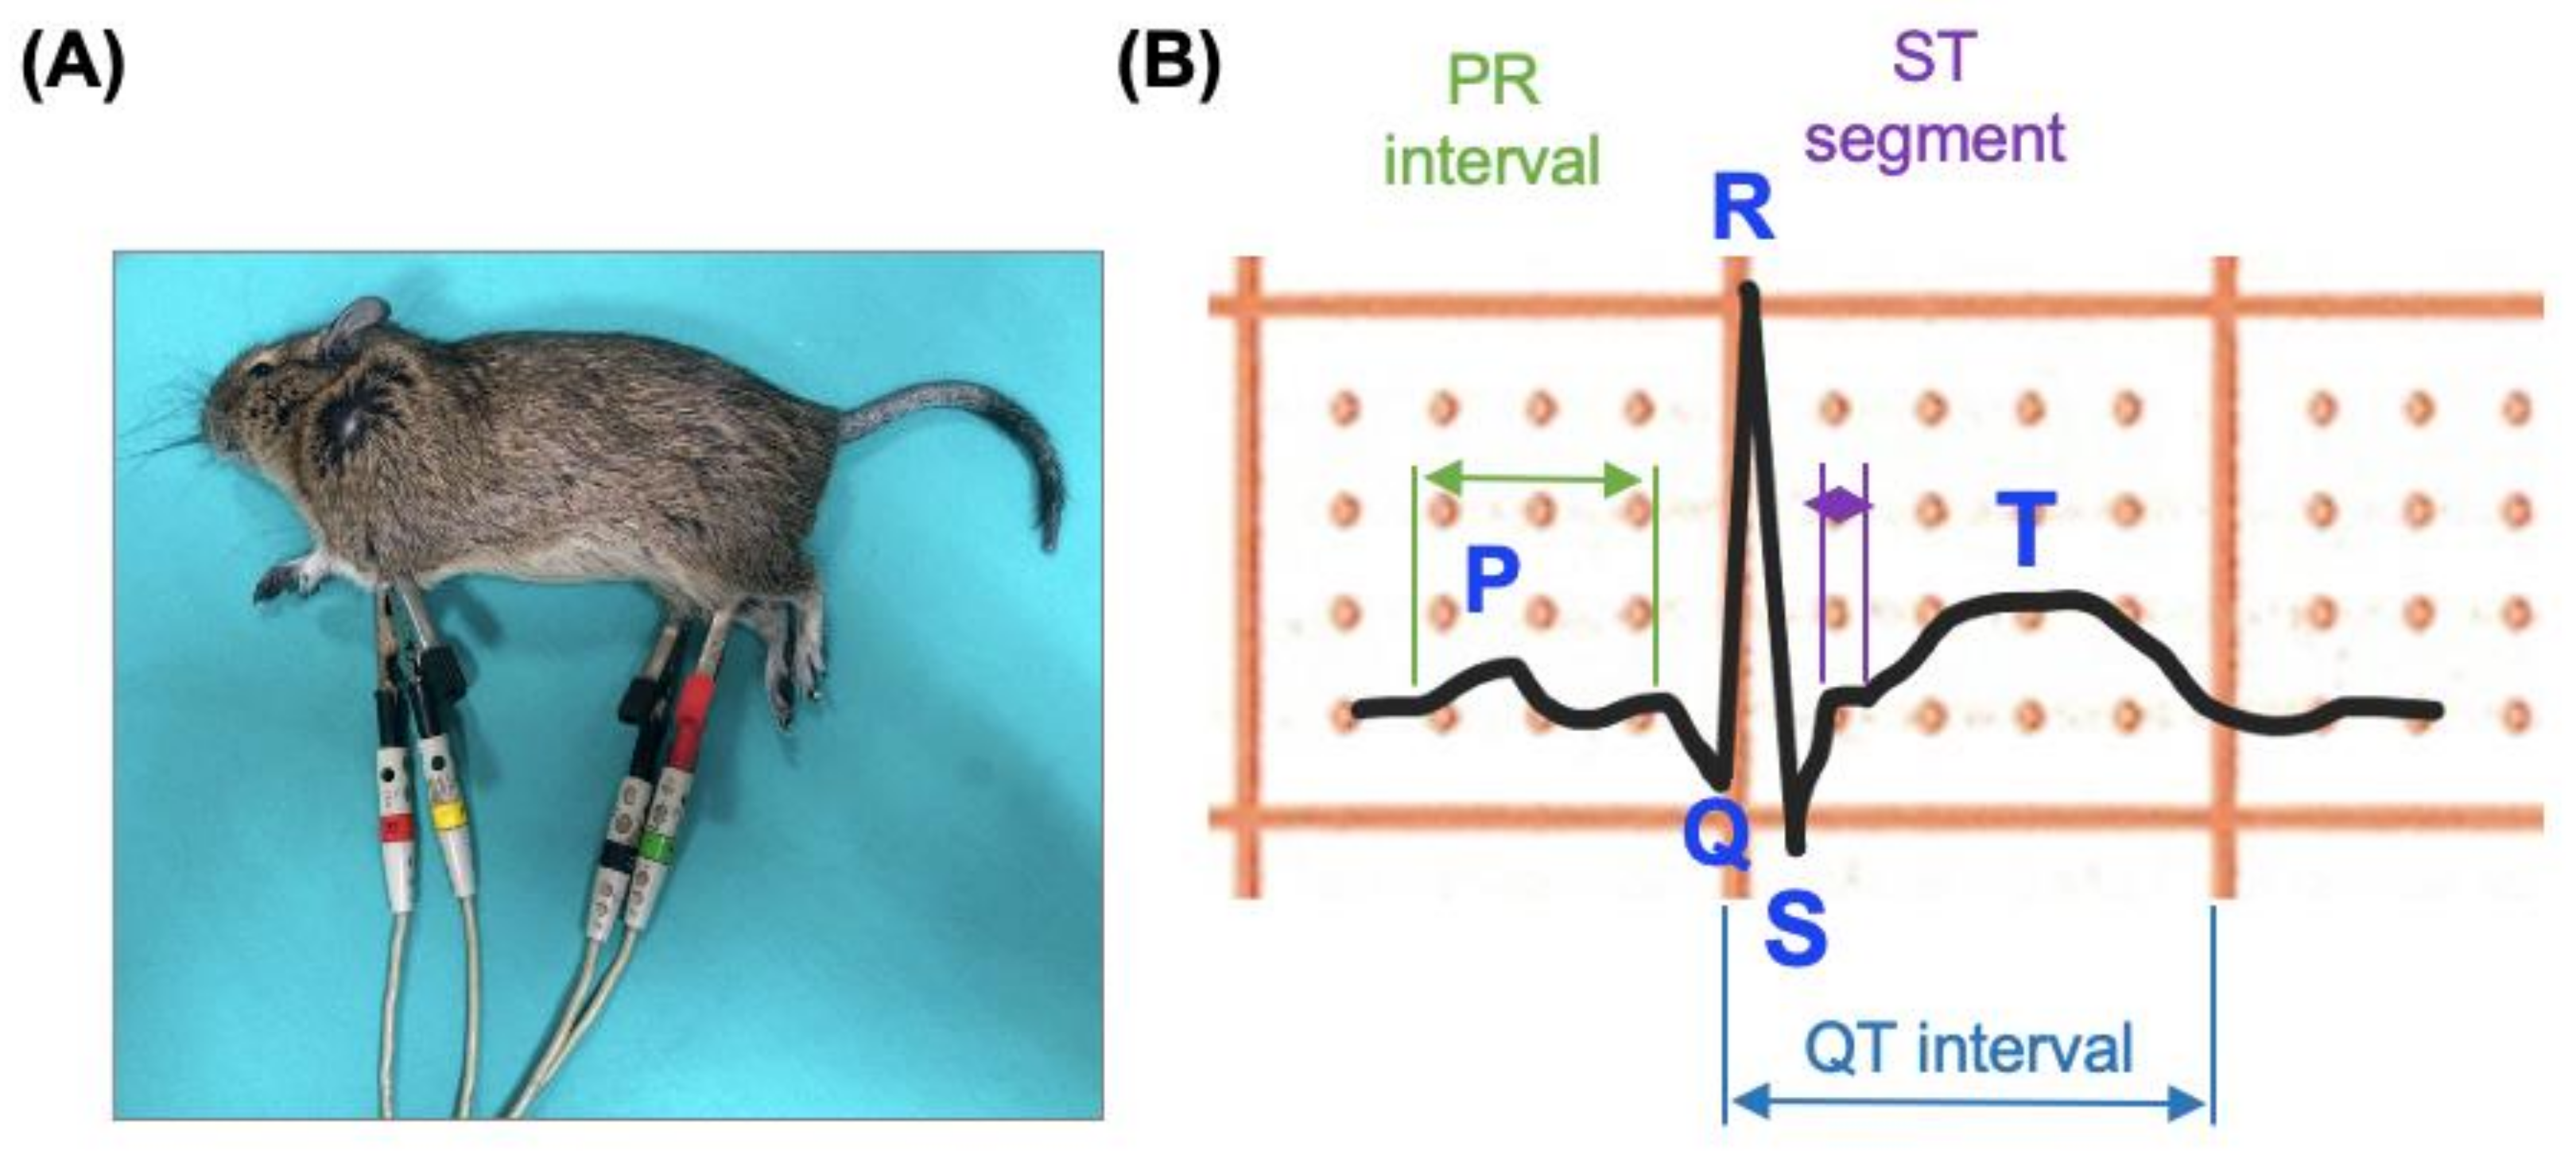
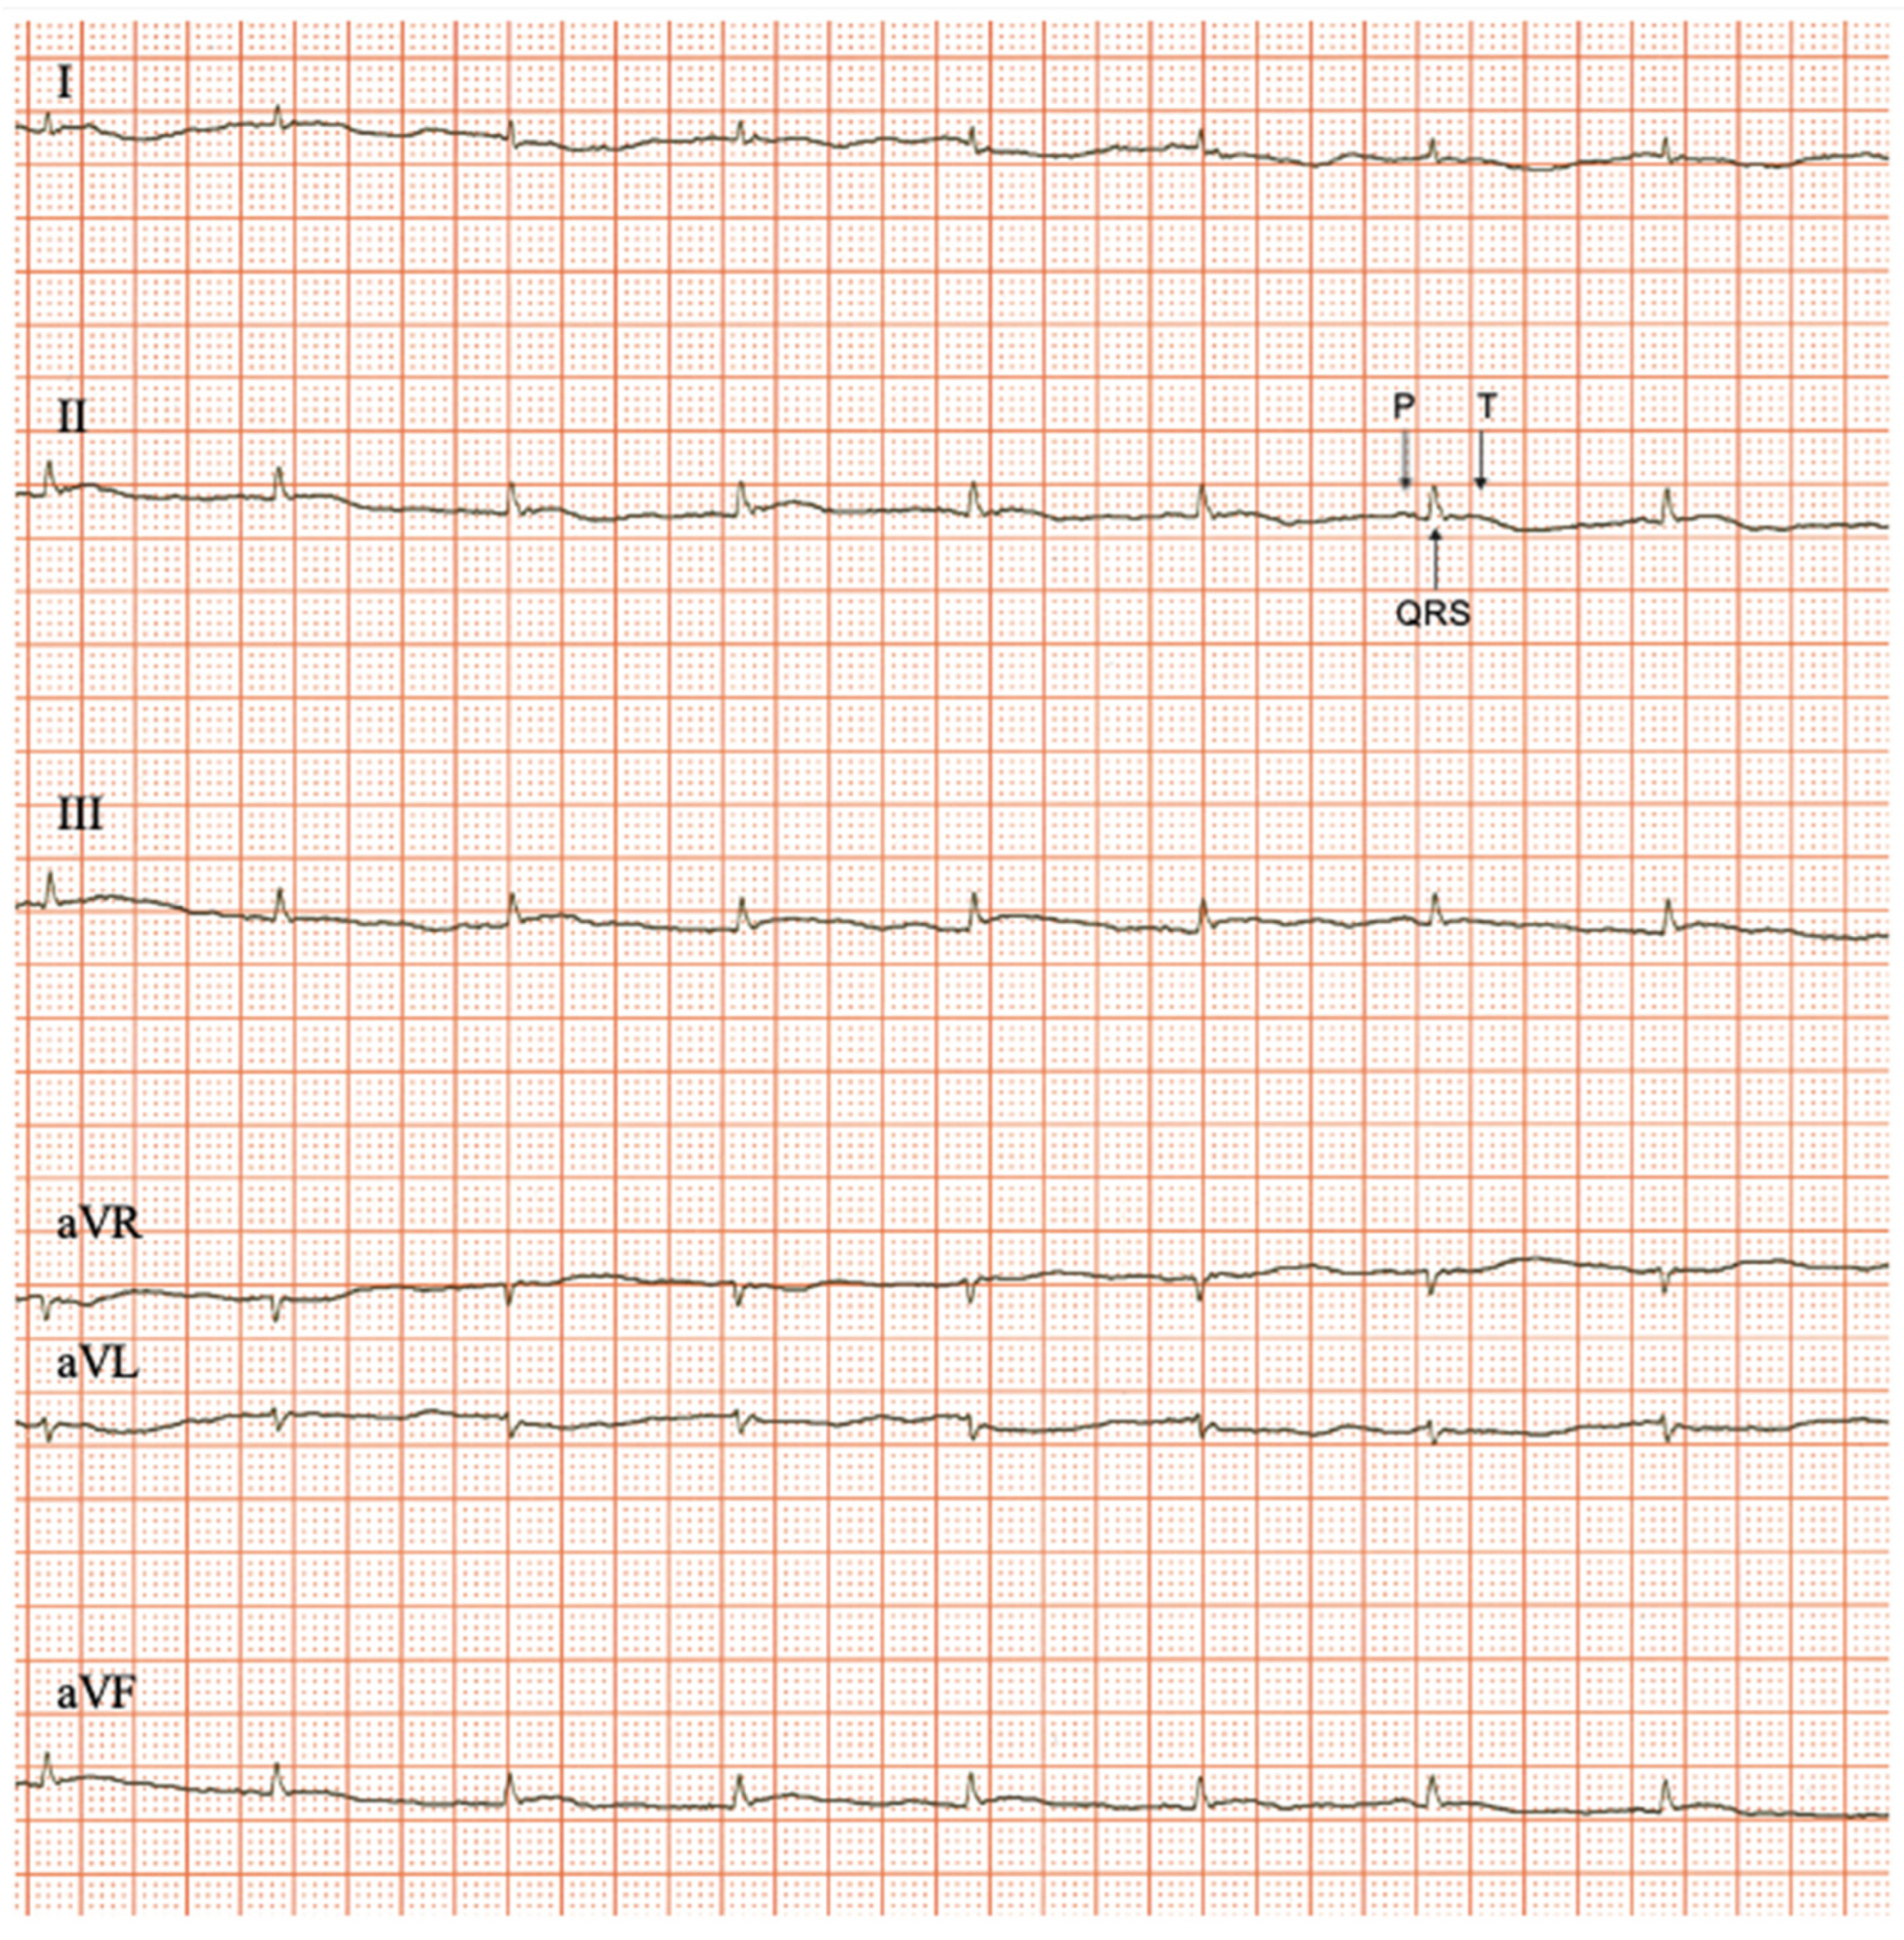
2.3. Electrocardiogram Recordings
2.4. Electrocardiogram Trace Analysis
- (i)
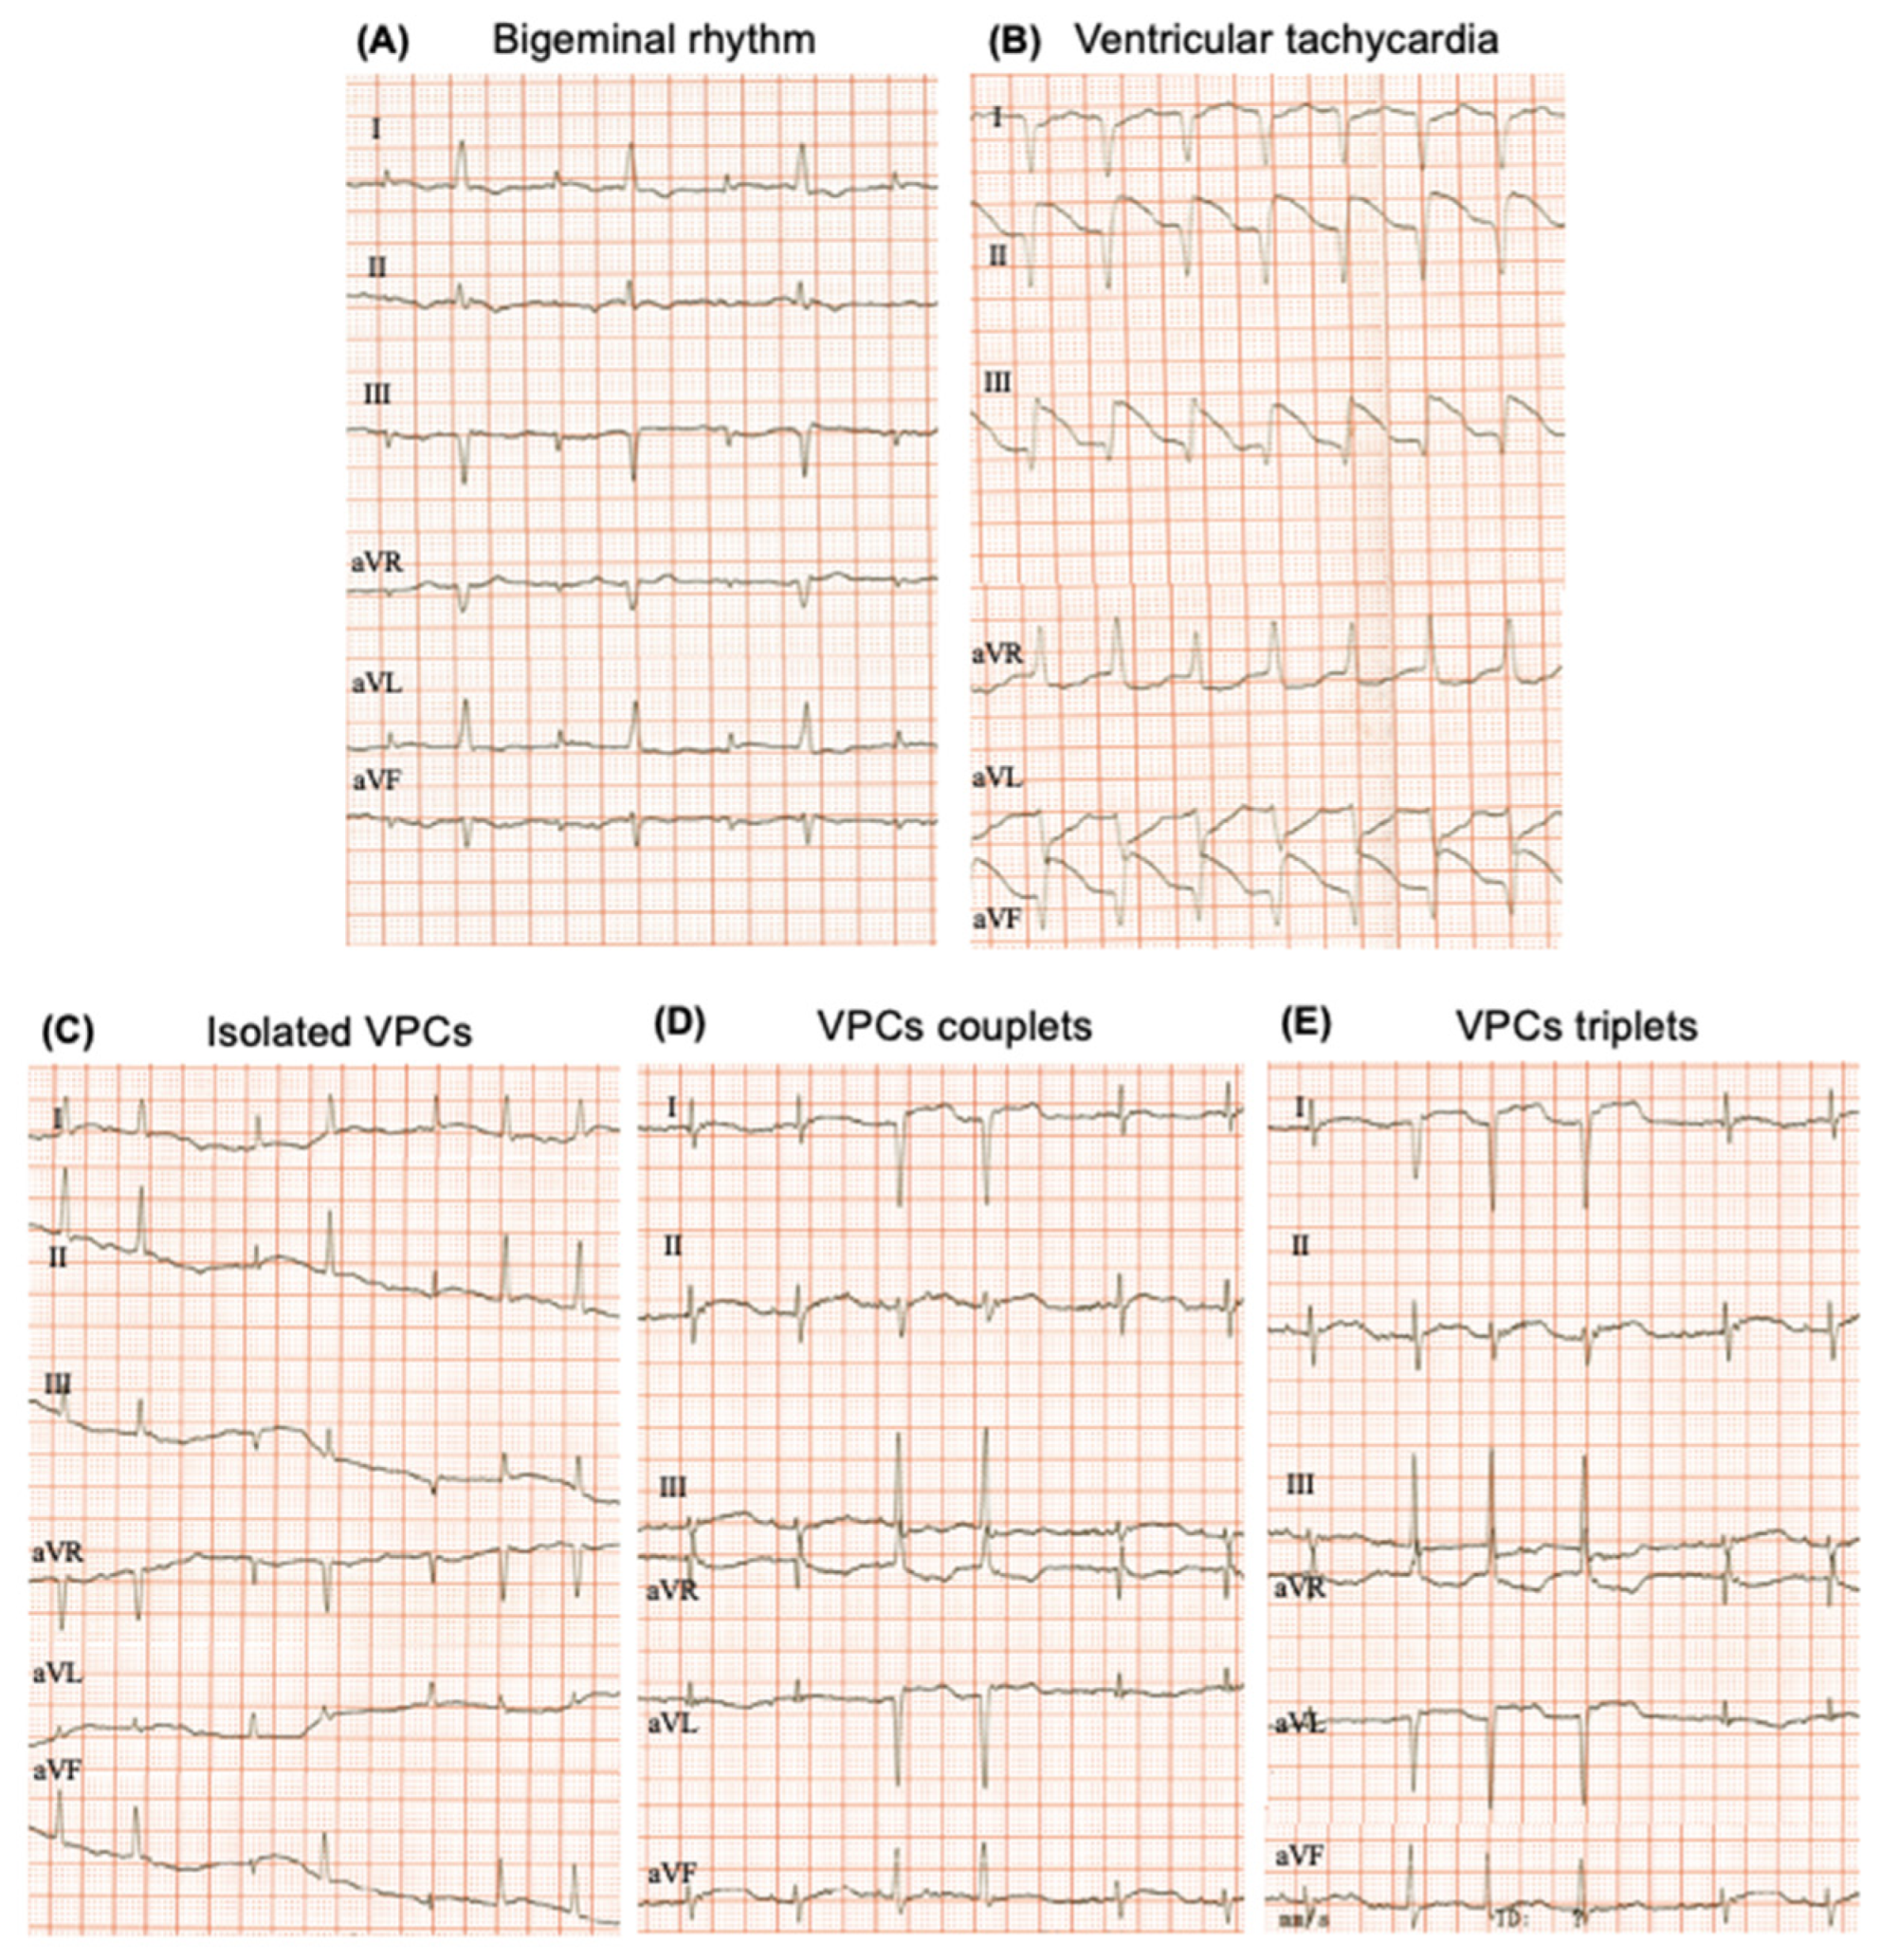
- Cardiac rhythm, which was classified as normal sinus rhythm, sinus arrhythmia and pathological arrhythmias.
- (ii)
- Heart rate (HR), in beats per minute (bpm), which was calculated by determining the number of QRS complexes in a 3 s interval and multiplying this number by 20 (50 mm/s) or 40 (100 mm/s).
- (iii)
- Using the bipolar lead II, the following variables were measured (Figure 1B): amplitude and duration of the P wave, PR interval duration, duration of the QRS complex; amplitude of the R and S waves; QT interval duration; amplitude of the T wave. QT measurements were corrected using the Fridericia and Framingham formula: QTc = QT/RR1/3.
2.5. Statistical Analysis
3. Results
3.1. Heart Rate
3.2. Rhythm
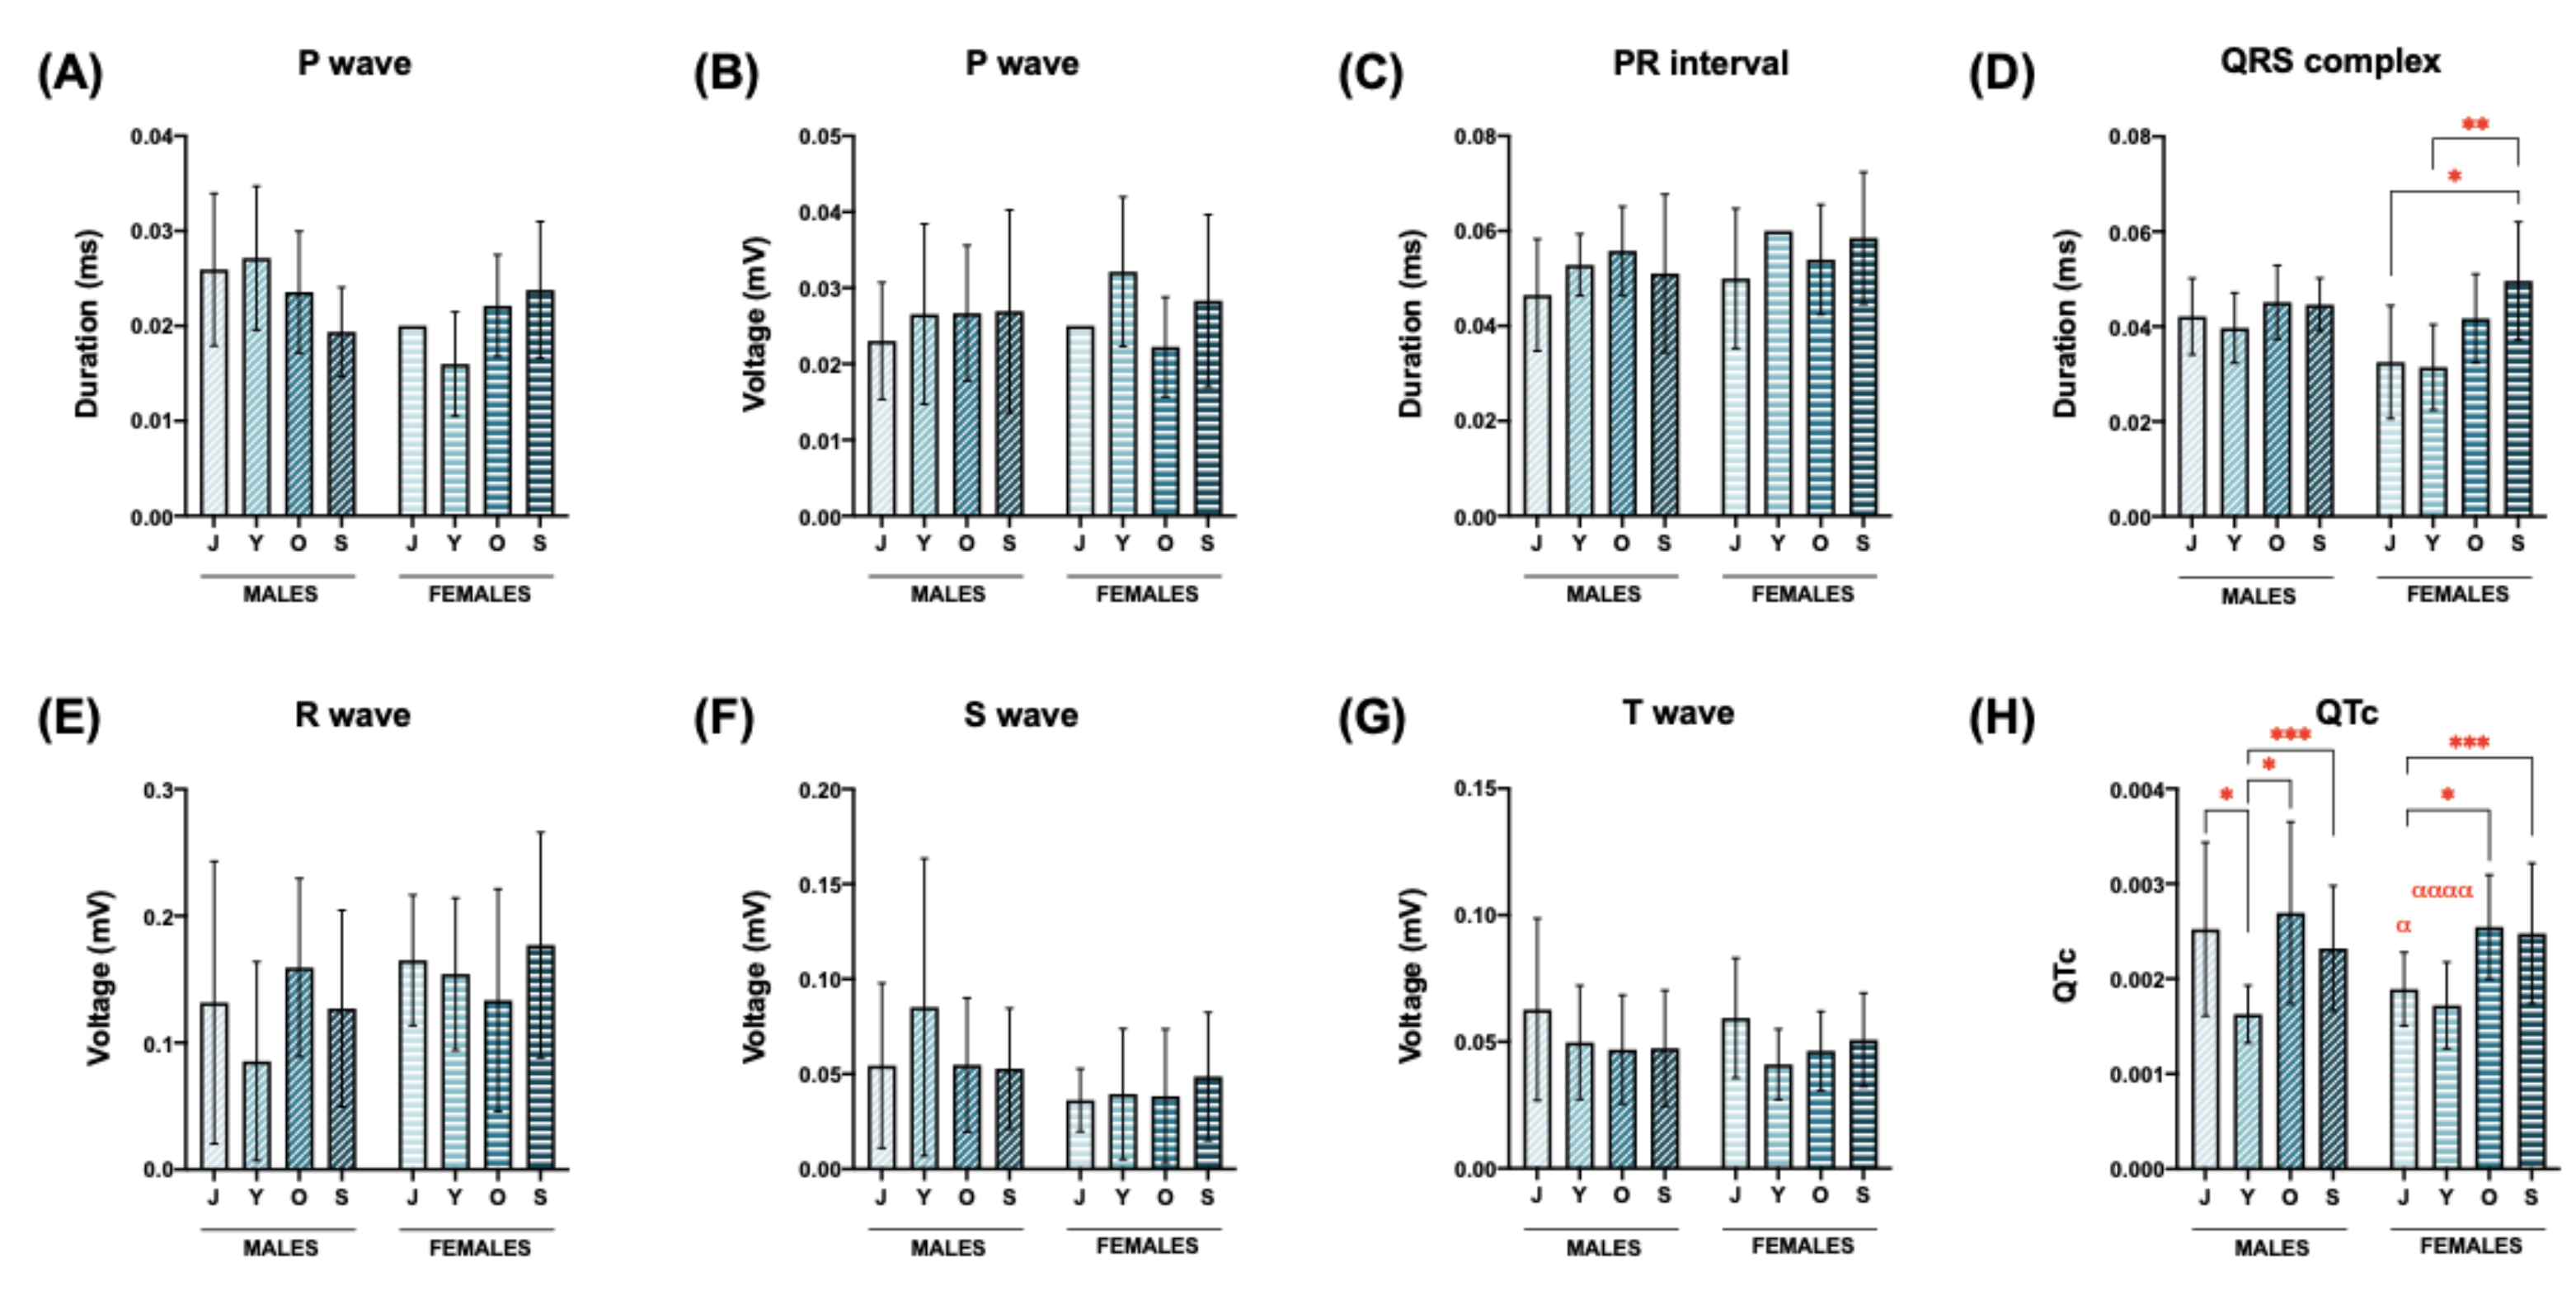
3.3. P Wave
3.4. PR Interval
3.5. QRS Complex
3.6. R Wave (mV)
3.7. S Wave (mV)
3.8. T Wave (mV)
3.9. QT Interval Corrected (QTc)
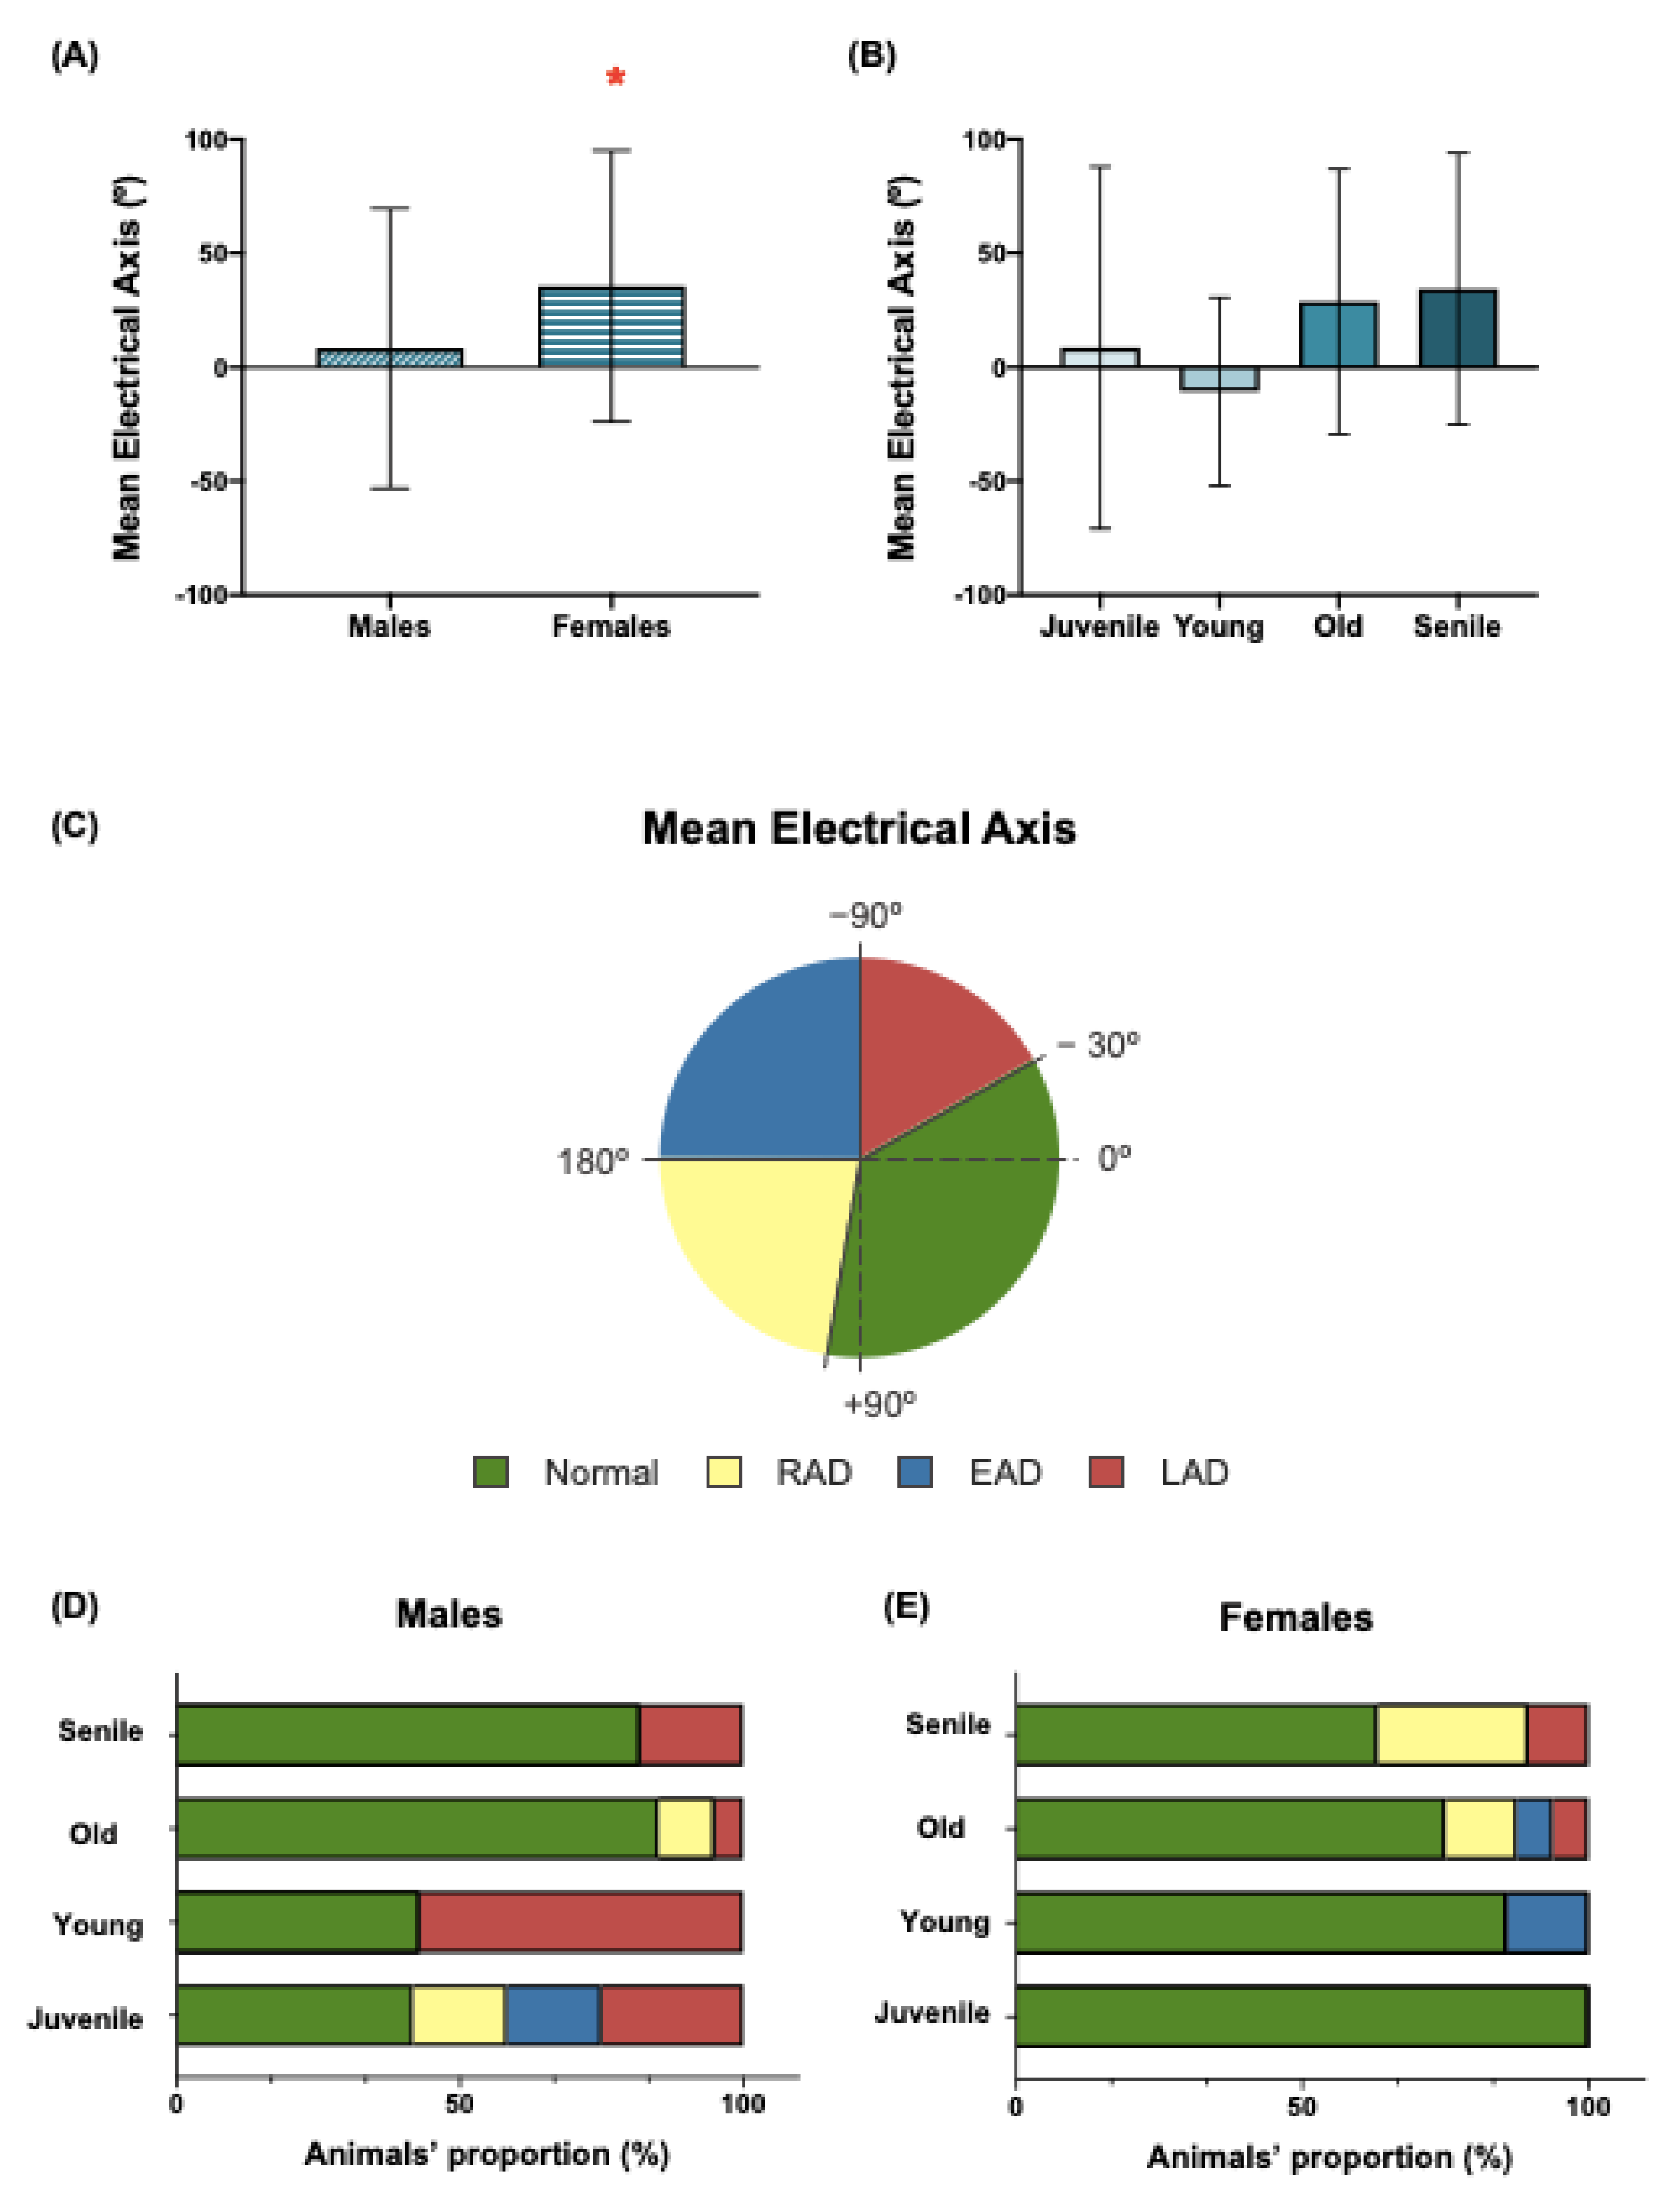
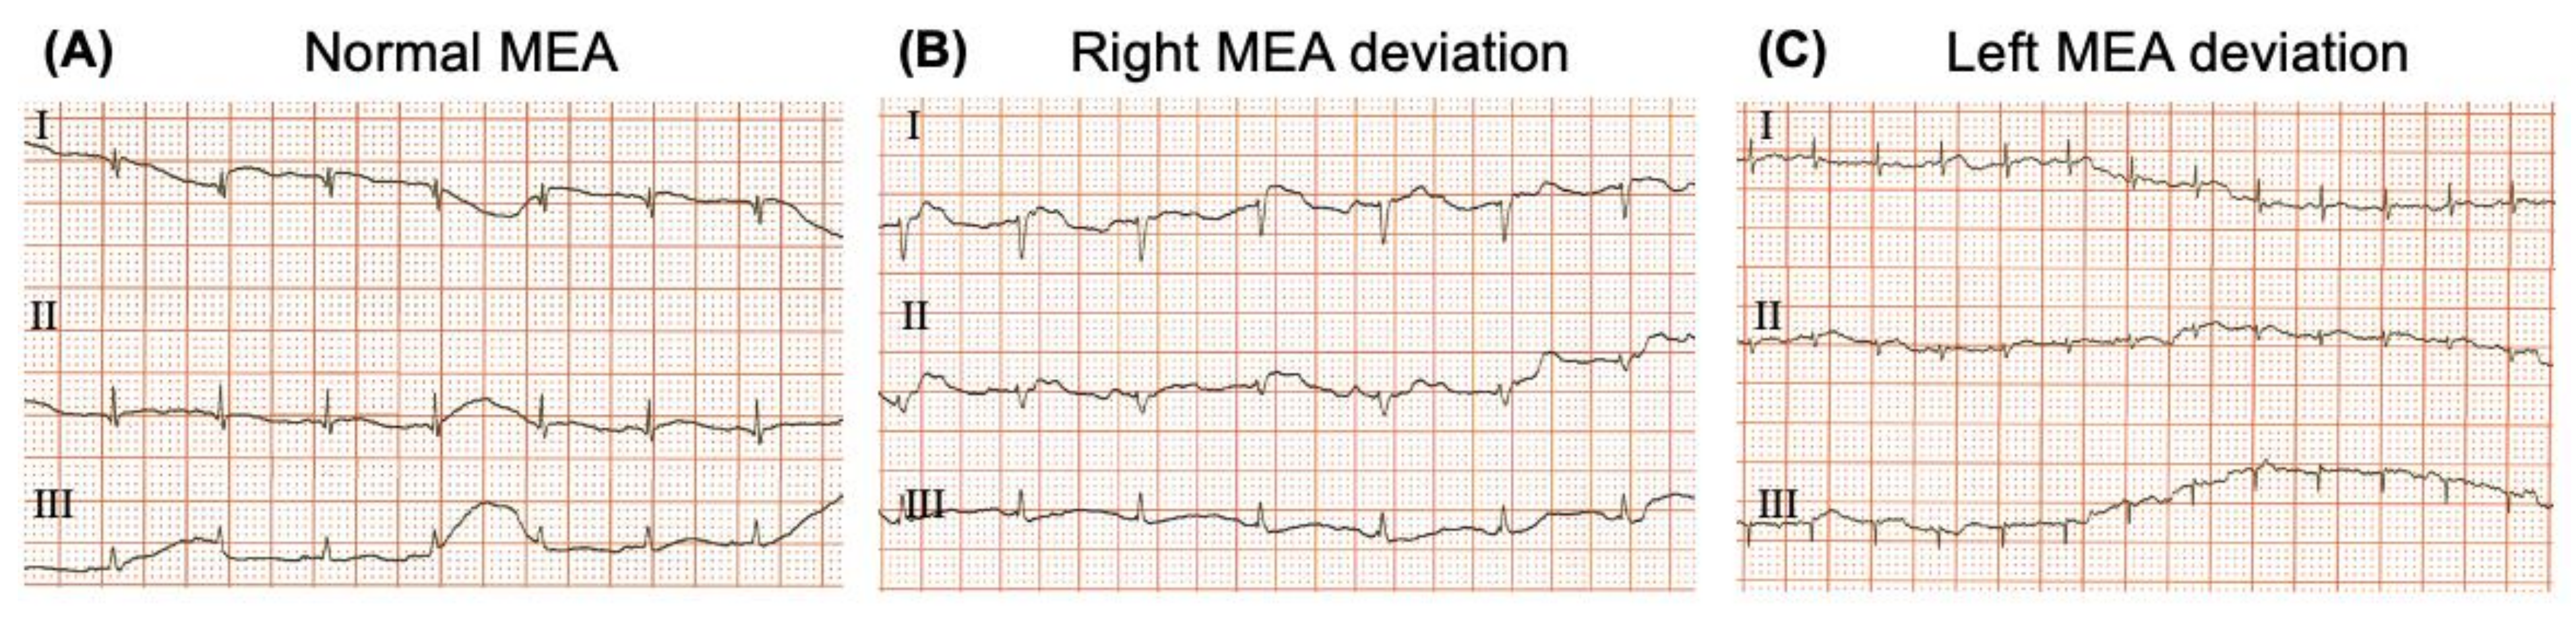
3.10. Electrical Axis
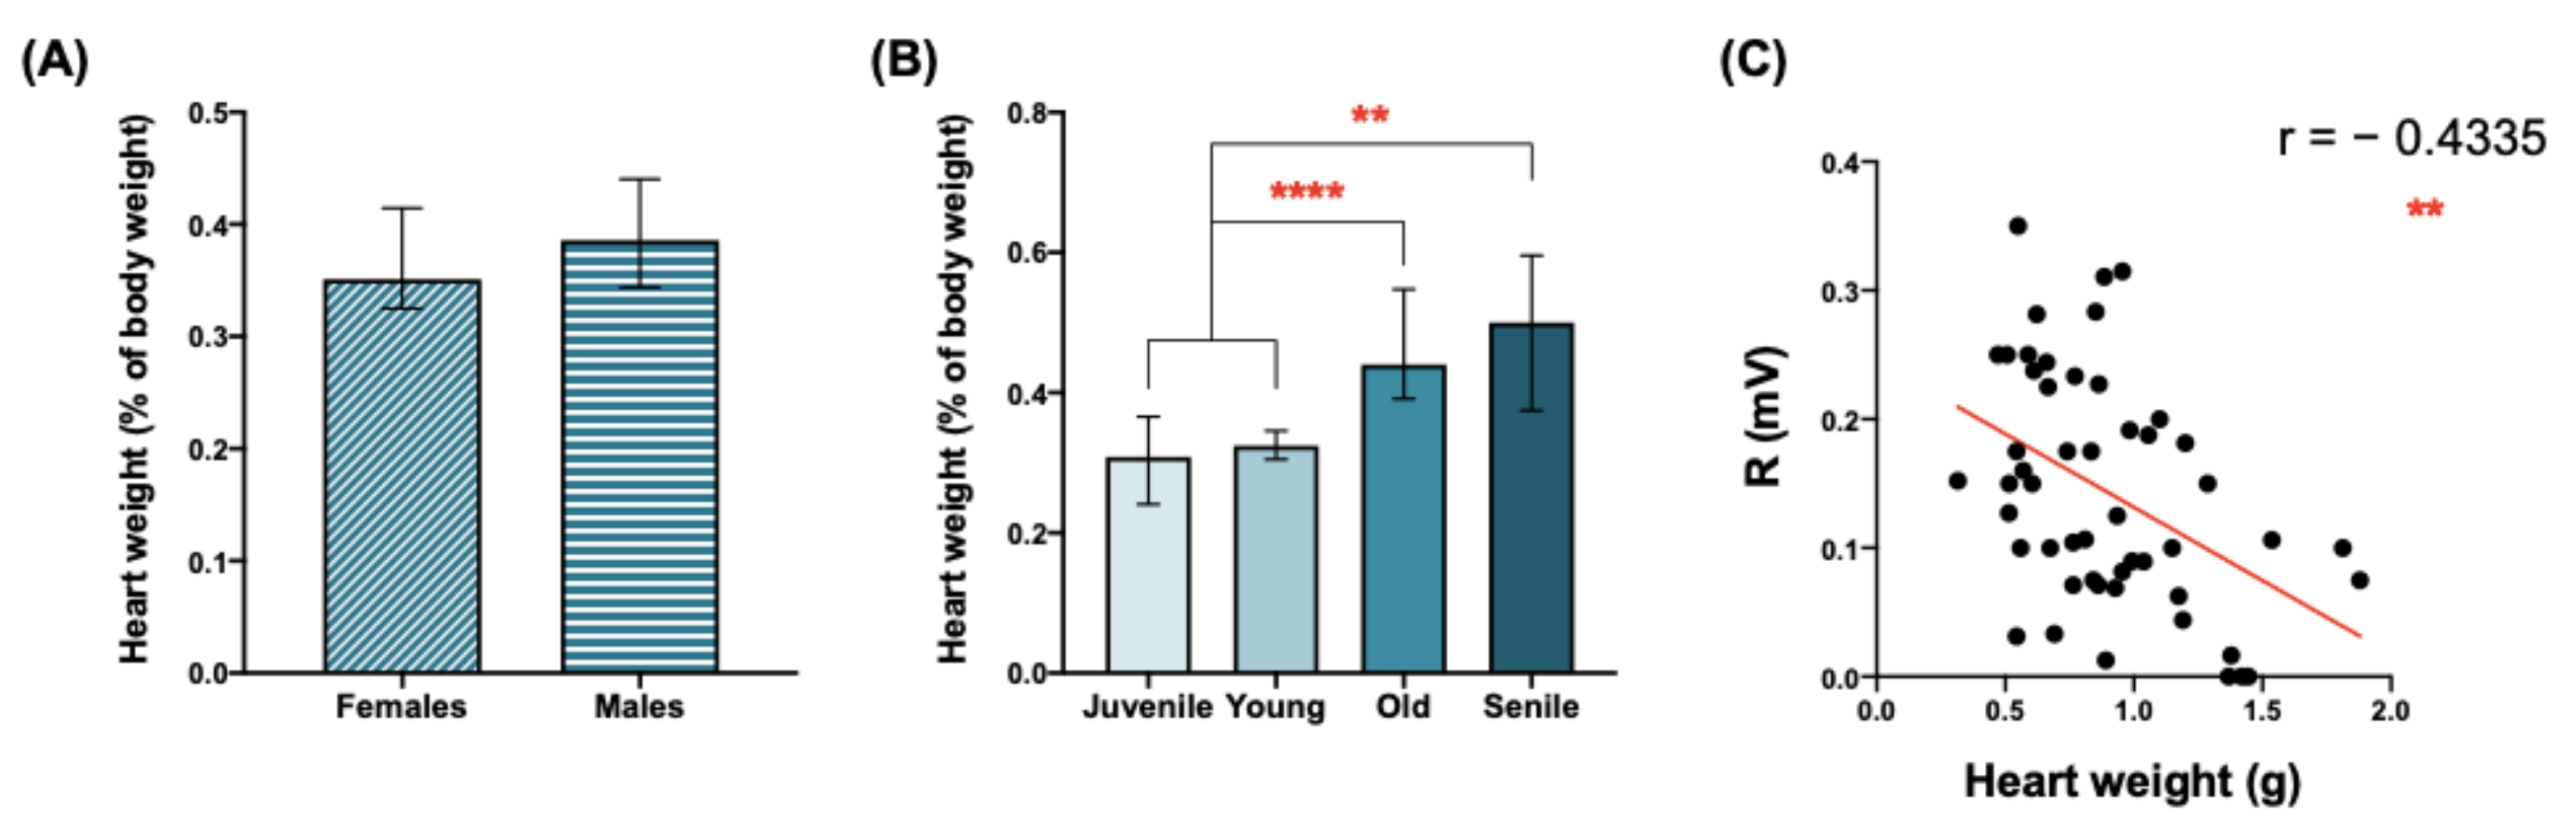
3.11. Heart/Body Weight Ratio Is Increased in the Aged O. degus
4. Discussion
Limitations
5. Conclusions
Supplementary Materials
Author Contributions
Funding
Institutional Review Board Statement
Data Availability Statement
Acknowledgments
Conflicts of Interest
Abbreviations
| CVD | cardiovascular diseases |
| ECG | electrocardiogram |
| HR | heart rate |
| LAD | left axis deviation |
| MEA | mean electrical axis |
| O. degus | Octodon degus |
| QTc | QT segment corrected |
| RAD | right axis deviation |
| VPC | ventricular premature complex |
References
- Krishnaswami, A.; Beavers, C.; Dorsch, M.P.; Dodson, J.A.; Masterson Creber, R.; Kitsiou, S.; Goyal, P.; Maurer, M.S.; Wenger, N.K.; Croy, D.S.; et al. Gerotechnology for Older Adults with Cardiovascular Diseases: JACC State-of-the-Art Review. J. Am. Coll. Cardiol. 2020, 76, 2650–2670. [Google Scholar] [CrossRef] [PubMed]
- WHO. World Health Statistics 2022; World Health Organization: Geneva, Switzerland, 2022; ISBN 9789240051140. [Google Scholar]
- Herrmann, J.; Lerman, A.; Sandhu, N.P.; Villarraga, H.R.; Mulvagh, S.L.; Kohli, M. Evaluation and management of patients with heart disease and cancer: Cardio-oncology. Mayo Clin. Proc. 2014, 89, 1287–1306. [Google Scholar] [CrossRef] [PubMed]
- Khan, S.; Kamal, M.A. Cardiac Biomarkers in Stroke, Alzheimer’s Disease, and Other Dementia. Are They of Use? A Brief Overview of Data from Recent Investigations. CNS Neurol. Disord. Drug Targets 2020, 20, 687–693. [Google Scholar] [CrossRef]
- Gawałko, M.; Balsam, P.; Lodziński, P.; Grabowski, M.; Krzowski, B.; Opolski, G.; Kosiuk, J. Cardiac arrhythmias in autoimmune diseases. Circ. J. 2020, 84, 685–694. [Google Scholar] [CrossRef] [PubMed]
- Gonçalves, V.C.; Cuenca-Bermejo, L.; Fernandez-Villalba, E.; Martin-Balbuena, S.; da Silva Fernandes, M.J.; Scorza, C.A.; Herrero, M.-T. Heart Matters: Cardiac Dysfunction and Other Autonomic Changes in Parkinson’s Disease. Neuroscientist 2021, 28, 530–542. [Google Scholar] [CrossRef]
- Evans, M.A.; Sano, S.; Walsh, K. Cardiovascular Disease, Aging, and Clonal Hematopoiesis. Annu. Rev. Pathol. Mech. Dis. 2020, 15, 419–438. [Google Scholar] [CrossRef]
- Yang, X.L.; Liu, G.Z.; Tong, Y.H.; Yan, H.; Xu, Z.; Chen, Q.; Liu, X.; Zhang, H.H.; Wang, H.B.; Tan, S.H. The history, hotspots, and trends of electrocardiogram. J. Geriatr. Cardiol. 2015, 12, 448–456. [Google Scholar] [CrossRef]
- Nikus, K.; Pérez-Riera, A.R.; Konttila, K.; Barbosa-Barros, R. Electrocardiographic recognition of right ventricular hypertrophy. J. Electrocardiol. 2018, 51, 46–49. [Google Scholar] [CrossRef]
- Singh, D.K.; Peter, C.T. Use of the Surface Electrocardiogram to Define the Nature of Challenging Arrhythmias. Card. Electrophysiol. Clin. 2016, 8, 1–24. [Google Scholar] [CrossRef]
- Konopelski, P.; Ufnal, M. Electrocardiography in rats: A comparison to human. Physiol. Res. 2016, 65, 717–725. [Google Scholar] [CrossRef]
- Liu, M.; Zhang, P.; Chen, M.; Zhang, W.; Yu, L.; Yang, X.C.; Fan, Q. Aging might increase myocardial ischemia / reperfusion-induced apoptosis in humans and rats. Age 2012, 34, 621–632. [Google Scholar] [CrossRef]
- Locati, E.T.; Bagliani, G.; Testoni, A.; Lunati, M.; Padeletti, L. Role of Surface Electrocardiograms in Patients with Cardiac Implantable Electronic Devices. Card. Electrophysiol. Clin. 2018, 10, 233–255. [Google Scholar] [CrossRef]
- Speerschneider, T.; Thomsen, M.B. Physiology and analysis of the electrocardiographic T wave in mice. Acta Physiol. 2013, 209, 262–271. [Google Scholar] [CrossRef]
- Cuenca-Bermejo, L.; Pizzichini, E.; Gonzalez-Cuello, A.M.; De Stefano, M.E.; Fernandez-Villalba, E.; Herrero, M.T. Octodon degus: A natural model of multimorbidity for ageing research. Ageing Res. Rev. 2020, 64, 101204. [Google Scholar] [CrossRef]
- Sanchez, J.N.; Summa, N.M.E.; Visser, L.C.; Norvall, A.; Sheley, M.F.; Sanchez-Migallon Guzman, D. Ventricular septal defect and congestive heart failure in a common degu (Octodon degus). J. Exot. Pet Med. 2019, 31, 32–35. [Google Scholar] [CrossRef]
- Chang, L.Y.L.; Ardiles, A.O.; Tapia-Rojas, C.; Araya, J.; Inestrosa, N.C.; Palacios, A.G.; Acosta, M.L. Evidence of Synaptic and Neurochemical Remodeling in the Retina of Aging Degus. Front. Neurosci. 2020, 14, 161. [Google Scholar] [CrossRef]
- Talavera, J.; Guzmán, M.J.; del Palacio, M.J.F.; Albert, A.P.; Bayón, A. The normal electrocardiogram of four species of conscious raptors. Res. Vet. Sci. 2008, 84, 119–125. [Google Scholar] [CrossRef]
- Kashou, A.H.; Kashou, H.E. Electrical Axis (Normal, Right Axis Deviation, and Left Axis Deviation); StatPearls Publishing: Treasure Island, FL, USA, 2018. [Google Scholar]
- Bray, F.; Laversanne, M.; Cao, B.; Varghese, C.; Mikkelsen, B.; Weiderpass, E.; Soerjomataram, I. Comparing cancer and cardiovascular disease trends in 20 middle- or high-income countries 2000–19: A pointer to national trajectories towards achieving Sustainable Development goal target 3.4. Cancer Treat. Rev. 2021, 100, 102290. [Google Scholar] [CrossRef]
- Paneni, F.; Diaz Cañestro, C.; Libby, P.; Lüscher, T.F.; Camici, G.G. The Aging Cardiovascular System: Understanding It at the Cellular and Clinical Levels. J. Am. Coll. Cardiol. 2017, 69, 1952–1967. [Google Scholar] [CrossRef]
- Wagner, J.U.G.; Dimmeler, S. Cellular cross-talks in the diseased and aging heart. J. Mol. Cell. Cardiol. 2020, 138, 136–146. [Google Scholar] [CrossRef]
- Merz, A.A.; Cheng, S. Sex differences in cardiovascular ageing. Physiol. Behav. 2017, 176, 139–148. [Google Scholar] [CrossRef] [PubMed]
- Azizi, Z.; Gisinger, T.; Bender, U.; Deischinger, C.; Raparelli, V.; Norris, C.M.; Kublickiene, K.; Herrero, M.T.; Emam, K.E.; Kautzky-Willer, A.; et al. Sex, Gender, and Cardiovascular Health in Canadian and Austrian Populations. Can. J. Cardiol. 2021, 37, 1240–1247. [Google Scholar] [CrossRef] [PubMed]
- Kane, A.E.; Howlett, S.E. Differences in cardiovascular aging in men and women. Adv. Exp. Med. Biol. 2018, 1065, 389–411. [Google Scholar] [CrossRef] [PubMed]
- Leonard, E.A.; Marshall, R.J. Cardiovascular Disease in Women. Prim. Care Clin. Off. Pract. 2018, 45, 131–141. [Google Scholar] [CrossRef]
- Macfarlane, P.W. The Influence of Age and Sex on the Electrocardiogram. Adv. Exp. Med. Biol. 2018, 9, 9–43. [Google Scholar] [CrossRef]
- Farraj, A.K.; Hazari, M.S.; Cascio, W.E. The utility of the small rodent electrocardiogram in toxicology. Toxicol. Sci. 2011, 121, 11–30. [Google Scholar] [CrossRef]
- Jones, J.; Srodulski, Z.M.; Romisher, S. The aging electrocardiogram. Am. J. Emerg. Med. 1990, 8, 240–245. [Google Scholar] [CrossRef]
- Rossi, S.; Fortunati, I.; Carnevali, L.; Baruffi, S.; Mastorci, F.; Trombini, M.; Sgoifo, A.; Corradi, D.; Callegari, S.; Miragoli, M.; et al. The effect of aging on the specialized conducting system: A telemetry ECG study in rats over a 6 month period. PLoS ONE 2014, 9, e112697. [Google Scholar] [CrossRef]
- Vicent, L.; Martínez-Sellés, M. Electrocardiogeriatrics: ECG in advanced age. J. Electrocardiol. 2017, 50, 698–700. [Google Scholar] [CrossRef]
- Singletary, G.E.; Saunders, A.B.; Saunders, W.B.; Suchodolski, J.S.; Steiner, J.M.; Fosgate, G.T.; Hartsfield, S.M. Cardiac troponin I concentrations following medetomidine-butorphanol sedation in dogs. Vet. Anaesth. Analg. 2010, 37, 342–346. [Google Scholar] [CrossRef]
- Ferner, R.; Aronson, J. Susceptibility to adverse drug reactions. Br. J. Clin. Pharmacol. 2019, 85, 2205–2212. [Google Scholar] [CrossRef]
- Xing, S.; Tsaih, S.W.; Yuan, R.; Svenson, K.L.; Jorgenson, L.M.; So, M.; Paigen, B.J.; Korstanje, R. Genetic influence on electrocardiogram time intervals and heart rate in aging mice. Am. J. Physiol. Heart Circ. Physiol. 2009, 296, H1907–H1913. [Google Scholar] [CrossRef]
- Rodriguez, R.D.; Schocken, D.D. Update on sick sinus syndrome, a cardiac disorder of aging. Geriatrics 1990, 45, 26–30, 33–36. [Google Scholar]
- Akita, M.; Kuwahara, M.; Tsubone, H.; Sugano, S. ECG changes during furosemide-induced hypokalemia in the rat. J. Electrocardiol. 1998, 31, 45–49. [Google Scholar] [CrossRef]
- Mladěnka, P.; Applová, L.; Patočka, J.; Costa, V.M.; Remiao, F.; Pourová, J.; Mladěnka, A.; Karlíčková, J.; Jahodář, L.; Vopršalová, M.; et al. Comprehensive review of cardiovascular toxicity of drugs and related agents. Med. Res. Rev. 2018, 38, 1332–1403. [Google Scholar] [CrossRef]
- Nakamura, M.; Sadoshima, J. Mechanisms of physiological and pathological cardiac hypertrophy. Nat. Rev. Cardiol. 2018, 15, 387–407. [Google Scholar] [CrossRef]
- McMullen, J.R.; Jennings, G.L. Differences between pathological and physiological cardiac hypertrophy: Novel therapeutic strategies to treat heart failure. Clin. Exp. Pharmacol. Physiol. 2007, 34, 255–262. [Google Scholar] [CrossRef]
- Joukar, S. A comparative review on heart ion channels, action potentials and electrocardiogram in rodents and human: Extrapolation of experimental insights to clinic. Lab. Anim. Res. 2021, 37, 25. [Google Scholar] [CrossRef]
- Kaese, S.; Frommeyer, G.; Verheule, S.; Van Loon, G.; Gehrmann, J.; Breithardt, G.; Eckardt, L. The ECG in cardiovascular-relevant animal models of electrophysiology. Herzschrittmacherther. Elektrophysiol. 2013, 24, 84–91. [Google Scholar] [CrossRef]
- Barrasa, J.L.M.; Rodríguez, N.S.; Rodríguez-Pérez, J.C.; Hidalgo, A.C.; García, A.T.; Camarillo, J.A.I.; Santisteban, P.L.; Mireles, M.B.; González, M.P.; Chico, B.D. Electrocardiographic changes in rats undergoing thoracic surgery under combined parenteral anesthesia. Lab Anim. 2008, 37, 469–474. [Google Scholar] [CrossRef]
- Heaton-Jones, T.G.; Ko, J.C.H.; Heaton-Jones, D.L. Evaluation of medetomidine-ketamine anesthesia with atipamezole reversal in American alligators (Alligator mississippiensis). J. Zoo Wildl. Med. 2002, 33, 36–44. [Google Scholar] [CrossRef] [PubMed]
- Chen, C.Y.; Chen, K.S.; Chang, K.M.; Lee, W.M.; Chang, S.C.; Wang, H.C. Dexmedetomidine related bradycardia leading to cardiac arrest in a dog. Pak. Vet. J. 2013, 33, 123–124. [Google Scholar]


| Juvenile (6 Months Old) | Young (1 Year Old) | Old (4–5 Years Old) | Senile (6–7 Years Old) | |
|---|---|---|---|---|
| Males | n = 13 | n = 7 | n = 20 | n = 12 |
| Weight (g) | 194.6 ± 14.4 | 220.7 ± 18.5 | 264.3 ± 33.5 | 246.7 ± 33.3 |
| Females | n = 4 | n = 7 | n = 16 | n = 19 |
| Weight (g) | 202.5 ± 15.5 | 205.0 ± 11.4 | 226.8 ± 18.8 | 221.5 ± 33.9 |
| Groups | HR (bpm) | P (mV) | R (mV) | S (mV) | T (mV) | MEA (°) |
|---|---|---|---|---|---|---|
| ALL ANIMALS TOGETHER | ||||||
| Mean ± SD | 207.2 ± 41.3 | 0.023 ± 0.007 | 0.168 ± 0.112 | 0.065 ± 0.063 | 0.053 ± 0.029 | 21.4 ± 61.7 |
| Median | 200.0 | 0.025 | 0.150 | 0.044 | 0.050 | 19.3 |
| Q1 | Q3 | 180.0 | 230.0 | 0.019 | 0.032 | 0.090 | 0.217 | 0.025 | 0.075 | 0.038 | 0.063 | −17.3 | 60.0 |
| Min–Max | 110.0–340.0 | 0.006–0.083 | 0.013–0.525 | 0.002–0.363 | 0.006–0.200 | −138.0–180.0 |
| BY SEX | ||||||
| Males | ||||||
| Mean ± SD | 209.0 ± 47.0 | 0.026 ± 0.010 | 0.150 ± 0.078 | 0.057 ± 0.039 | 0.053 ± 0.026 | 8.3 ± 61.4 |
| Median | 200.0 | 0.025 | 0.146 | 0.044 | 0.051 | 0.0 |
| Q1 | Q3 | 180.0 | 240.0 | 0.019 | 0.032 | 0.088 | 0.210 | 0.023 | 0.085 | 0.036 | 0.075 | −29.0 | 39.0 |
| Min–Max | 110.0–320.0 | 0.013–0.050 | 0.019–0.525 | 0.013–0.363 | 0.006–0.129 | −138.0–169.0 |
| Females | ||||||
| Mean ± SD | 203.0 ± 28.3 | 0.027 ± 0.010 | 0.165 ± 0.100 | 0.043 ± 0.032 | 0.050 ± 0.021 | 35.6 ± 59.5 |
| Median | 200.0 | 0.025 | 0.152 | 0.032 | 0.050 | 39.0 |
| Q1 | Q3 | 180.0 | 220.0 | 0.020 | 0.032 | 0.095 | 0.230 | 0.025 | 0.058 | 0.038 | 0.061 | 2.63 | 66.9 |
| Min–Max | 160.0–270.0 | 0.006–0.050 | 0.013–0.504 | 0.002–0.125 | 0.013–0.117 | −128.0–180.0 |
| BY AGE | ||||||
| Juvenile | ||||||
| Mean ± SD | 216.0 ± 40.5 | 0.025 ± 0.009 | 0.183 ± 0.133 | 0.067 ± 0.058 | 0.071 ± 0.047 | 8.5 ± 79.4 |
| Median | 200.0 | 0.025 | 0.168 | 0.044 | 0.072 | −5.75 |
| Q1 | Q3 | 200.0 | 235.0 | 0.019 | 0.0303 | 0.085 | 0.231 | 0.025 | 0.103 | 0.032 | 0.087 | −46.9 | 70.5 |
| Min–Max | 140.0–300.0 | 0.013–0.050 | 0.025–0.525 | 0.015–0.363 | 0.008–0.200 | −138.0–169.0 |
| Young | ||||||
| Mean ± SD | 244.0 ± 31.0 | 0.030 ± 0.011 | 0.157 ± 0.087 | 0.049 ± 0.044 | 0.046 ± 0.075 | −10.7 ± 41.3 |
| Median | 240.0 | 0.025 | 0.138 | 0.029 | 0.050 | −1.25 |
| Q1 | Q3 | 220.0 | 260.0 | 0.025 | 0.038 | 0.087 | 0.198 | 0.019 | 0.053 | 0.035 | 0.063 | −45.5 | 21.0 |
| Min–Max | 200.0–320.0 | 0.013–0.050 | 0.063–0.363 | 0.013–0.163 | 0.006–0.019 | −90.0–46.0 |
| Old | ||||||
| Mean ± SD | 187.0 ± 30.2 | 0.025 ± 0.010 | 0.148 ± 0.078 | 0.049 ± 0.035 | 0.049 ± 0.023 | 28.8 ± 58.1 |
| Median | 185.0 | 0.025 | 0.138 | 0.044 | 0.044 | 23.3 |
| Q1 | Q3 | 170.0 | 210.0 | 0.015 | 0.031 | 0.091 | 0.198 | 0.019 | 0.077 | 0.038 | 0.062 | −11.0 | 63.5 |
| Min–Max | 110.0–270.0 | 0.006–0.044 | 0.013–0.313 | 0.002–0.138 | 0.007–0.113 | −128.0–163.0 |
| Senile | ||||||
| Mean ± SD | 198.0 ± 31.5 | 0.027 ± 0.011 | 0.019 ± 0.504 | 0.051 ± 0.033 | 0.051 ± 0.018 | 34.4 ± 59.6 |
| Median | 193.0 | 0.026 | 0.163 | 0.040 | 0.050 | 27.3 |
| Q1 | Q3 | 180.0 | 200.0 | 0.020 | 0.037 | 0.085 | 0.226 | 0.029 | 0.065 | 0.038 | 0.057 | −2.88 | 70.5 |
| Min–Max | 160.0–300.0 | 0.012–0.083 | 0.182–0.116 | 0.001–0.125 | 0.019–0.100 | −67.0–180.0 |
| Groups | P (ms) | PR Interval (ms) | QRS (ms) | QTc |
|---|---|---|---|---|
| ALL ANIMALS TOGETHER | ||||
| Mean ± SD | 0.023 ± 0.007 | 0.055 ± 0.013 | 0.044 ± 0.010 | 0.155 ± 0.029 |
| Median | 0.022 | 0.055 | 0.043 | 0.0023 |
| Q1 | Q3 | 0.005–0.040 | 0.047 | 0.063 | 0.038 | 0.050 | 0.0019 | 0.0028 |
| Min–Max | 0.005–0.040 | 0.020–0.096 | 0.020–0.075 | 0.0010–0.0044 |
| BY SEX | ||||
| Males | ||||
| Mean ± SD | 0.024 ± 0.007 | 0.052 ± 0.012 | 0.044 ± 0.007 | 0.158 ± 0.029 |
| * vs females | ||||
| Median | 0.022 | 0.053 | 0.045 | 0.0023 |
| Q1 | Q3 | 0.018 | 0.030 | 0.047 | 0.060 | 0.040 | 0.050 | 0.0019 | 0.0028 |
| Min–Max | 0.013–0.040 | 0.020–0.073 | 0.025–0.056 | 0.0013–0.0050 |
| Females | ||||
| Mean ± SD | 0.022 ± 0.007 | 0.058 ± 0.013 | 0.043 ± 0.013 | 0.151 ± 0.026 |
| Median | 0.022 | 0.060 | 0.040 | 0.0023 |
| Q1 | Q3 | 0.018 | 0.026 | 0.048 | 0.063 | 0.035 | 0.049 | 0.0019 | 0.0028 |
| Min–Max | 0.005–0.040 | 0.034–0.096 | 0.020–0.075 | 0.0010–0.0044 |
| BY AGE | ||||
| Juvenile | ||||
| Mean ± SD | 0.025 ± 0.007 | 0.048 ± 0.012 | 0.040 ± 0.010 | 0.0022 ± 0.0005 |
| Median | 0.025 | 0.049 | 0.040 | 0.0021 |
| Q1 | Q3 | 0.019 | 0.030 | 0.036 | 0.060 | 0.040 | 0.047 | 0.0017 | 0.0024 |
| Min–Max | 0.015–0.040 | 0.030–0.065 | 0.020–0.056 | 0.0015–0.0034 |
| Young | ||||
| Mean ± SD | 0.022 ± 0.010 | 0.058 ± 0.008 | 0.036 ± 0.009 | 0.0017 ± 0.0004 |
| Median | 0.020 | 0.060 | 0.039 | 0.0017 |
| Q1 | Q3 | 0.014 | 0.030 | 0.050 | 0.060 | 0.030 | 0.040 | 0.0014 | 0.0020 |
| Min–Max | 0.005–0.035 | 0.045–0.075 | 0.020–0.053 | 0.0010–0.0024 |
| Old | ||||
| Mean ± SD | 0.023 ± 0.006 | 0.057 ± 0.012 | 0.044 ± 0.009 | 0.0025 ± 0.0006 |
| **** vs. young | ||||
| Median | 0.023 | 0.055 | 0.045 | 0.0025 |
| Q1 | Q3 | 0.020 | 0.028 | 0.049 | 0.065 | 0.036 | 0.050 | 0.0021 | 0.0030 |
| Min–Max | 0.013–0.035 | 0.035–0.090 | 0.025–0.058 | 0.0013–0.0036 |
| Senile | ||||
| Mean ± SD | 0.023 ± 0.007 | 0.056 ± 0.015 | 0.049 ± 0.012 | 0.0024 ± 0.0007 |
| ** vs. young | ** vs. young | |||
| Median | 0.022 | 0.058 | 0.049 | 0.0024 |
| Q1 | Q3 | 0.017 | 0.027 | 0.048 | 0.064 | 0.041 | 0.053 | 0.0021 | 0.0028 |
| Min–Max | 0.013–0.040 | 0.020–0.096 | 0.026–0.075 | 0.0012–0.0044 |
| Groups | HR (bpm) | P (mV) | R (mV) | S (mV) | T (mV) | MEA (°) |
|---|---|---|---|---|---|---|
| MALES | ||||||
| Juvenile | ||||||
| Mean ± SD | 216.0 ± 46.2 | 0.023 ± 0.007 | 0.197 ± 0.149 | 0.109 ± 0.108 | 0.074 ± 0.052 | −2.0 ± 86.9 |
| Median | 200.0 | 0.022 | 0.100 | 0.0438 | 0.069 | −11.5 |
| Q1 | Q3 | 193.0 | 235.0 | 0.019 | 0.030 | 0.031 | 0.225 | 0.017 | 0.116 | 0.031 | 0.088 | −48.0 | 56.3 |
| Min–Max | 140.0–300.0 | 0.013–0.038 | 0.031–0.525 | 0.015–0.363 | 0.008–0.200 | −138.0–169.0 |
| Young | ||||||
| Mean ± SD | 250.0 ± 37.4 | 0.027 ± 0.012 | 0.120 ± 0.064 | 0.111 ± 0.098 | 0.050 ± 0.023 | −25.6 ± 32.2 |
| Median | 240.0 | 0.025 | 0.075 | 0.0878 | 0.054 | -38.0 |
| Q1 | Q3 | 230.0 | 270.0 | 0.019 | 0.032 | 0.000 | 0.188 | 0.021 | 0.196 | 0.038 | 0.063 | −47.0 | 9.0 |
| Min–Max | 200.0–320.0 | 0.013–0.050 | 0.063–0.192 | 0.013–0.263 | 0.006–0.075 | −67.0–20.5 |
| Old | ||||||
| Mean ± SD | 190.0 ± 43.8 | 0.026 ± 0.009 | 0.159 ± 0.070 | 0.062 ± 0.046 | 0.050 ± 0.026 | 25.7 ± 55.2 |
| Median | 180.0 | 0.025 | 0.144 | 0.0542 | 0.044 | 17.0 |
| Q1 | Q3 | 163.0 | 200.0 | 0.022 | 0.033 | 0.100 | 0.189 | 0.019 | 0.081 | 0.042 | 0.063 | −14.8 | 66.1 |
| Min–Max | 110.0–300.0 | 0.013–0.044 | 0.081–0.313 | 0.013–0.188 | 0.007–0.113 | −76.0–163.0 |
| Senile | ||||||
| Mean ± SD | 209.0 ± 45.0 | 0.032 ± 0.021 | 0.166 ± 0.125 | 0.053 ± 0.032 | 0.052 ± 0.018 | 9.4 ± 47.5 |
| Median | 200.0 | 0.022 | 0.122 | 0.044 | 0.044 | 9.0 |
| Q1 | Q3 | 180.0 | 240.0 | 0.016 | 0.057 | 0.066 | 0.116 | 0.020 | 0.072 | 0.035 | 0.059 | −11.5 | 37.0 |
| Min–Max | 160.0–300.0 | 0.013–0.083 | 0.019–0.442 | 0.013–0.117 | 0.035–0.082 | −67.0–99.0 |
| FEMALES | ||||||
| Juvenile | ||||||
| Mean ± SD | 215.0 ± 19.1 | 0.025 ± 0.000 | 0.15 ± 0.086 | 0.025 ± 0.000 | 0.059 ± 0.024 | 39.8 ± 45.7 |
| Median | 210.0 | 0.025 | 0.168 | 0.030 | 0.069 | 52.0 |
| Q1 | Q3 | 200.0 | 235.0 | 0.025 | 0.025 | 0.115 | 0.213 | 0.025 | 0.054 | 0.034 | 0.075 | −8.3 | 75.5 |
| Min–Max | 200.0–240.0 | 0.025–0.025 | 0.025–0.225 | 0.025–0.025 | 0.025–0.0750 | −21.0–76.0 |
| Young | ||||||
| Mean ± SD | 200.0 ± 260.0 | 0.032 ± 0.010 | 0.184 ± 0.096 | 0.038 ± 0.019 | 0.041 ± 0.014 | 4.1 ± 46.3 |
| Median | 240.0 | 0.025 | 0.138 | 0.025 | 0.038 | 21.0 |
| Q1 | Q3 | 220.0 | 260.0 | 0.025 | 0.038 | 0.100 | 0.213 | 0.013 | 0.05 | 0.025 | 0.050 | −19.0 | 37.0 |
| Min–Max | 237.0–24.3 | 0.025–0.050 | 0.100–0.363 | 0.013–0.063 | 0.025–0.063 | −90.0–46.0 |
| Old | ||||||
| Mean ± SD | 197.0 ± 29.8 | 0.022 ± 0.010 | 0.134 ± 0.088 | 0.041 ± 0.035 | 0.047 ± 0.019 | 32.6 ± 63.2 |
| Median | 195.0 | 0.019 | 0.114 | 0.025 | 0.045 | 43.0 |
| Q1 | Q3 | 173.0 | 210.0 | 0.016 | 0.029 | 0.065 | 0.225 | 0.013 | 0.055 | 0.038 | 0.056 | −7.5 | 63.5 |
| Min–Max | 160.0–270.0 | 0.006–0.044 | 0.013–0.283 | 0.002–0.119 | 0.013–0.083 | −128.0–147.0 |
| Senile | ||||||
| Mean ± SD | 191.0 ± 17.8 | 0.027 ± 0.010 | 0.212 ± 0.147 | 0.052 ± 0.034 | 0.050 ± 0.019 | 48.9 ± 62.1 |
| Median | 193.0 | 0.027 | 0.165 | 0.036 | 0.050 | 50.5 |
| Q1 | Q3 | 180.0 | 200.0 | 0.021 | 0.033 | 0.113 | 0.272 | 0.027 | 0.068 | 0.039 | 0.056 | 3.5 | 102.0 |
| Min–Max | 160.0–230.0 | 0.012–0.044 | 0.033–0.033 | 0.007–0.125 | 0.019–0.100 | −51.0–180.0 |
| Sinus Rhythm (%) | Type of Rhythm | ||||
|---|---|---|---|---|---|
| Bigeminal Rhythm (%) | Ventricular Premature Complexes (VPC) | Ventricular Tachycardia | |||
| Frequent VPC (%) | Isolated VPC, Couplets or Triplets (%) | ||||
| Males | |||||
| Juvenile | 37.50 | 50.00 | - | - | 12.50 |
| Young | 66.67 | 33.33 | - | - | - |
| Old | 100.00 | - | - | - | - |
| Senile | 66.67 | - | 25.00 | 8.33 | - |
| Females | |||||
| Juvenile | 100.00 | - | - | - | - |
| Young | 85.71 | - | - | 14.29 | - |
| Old | 93.75 | - | 6.25 | - | - |
| Senile | 100.00 | - | - | - | - |
| Groups | P (ms) | PR Interval (ms) | QRS (ms) | QTc |
|---|---|---|---|---|
| MALES | ||||
| Juvenile | ||||
| Mean ± SD | 0.026 ± 0.008 | 0.047 ± 0.012 | 0.042 ± 0.008 | 0.0025 ± 0.0009 |
| Median | 0.023 | 0.049 | 0.041 | 0.0023 |
| Q1 | Q3 | 0.018 | 0.034 | 0.034 | 0.057 | 0.040 | 0.048 | 0.0020 | 0.0029 |
| Min−Max | 0.015−0.040 | 0.030−0.063 | 0.025−0.056 | 0.0016−0.0050 |
| Young | ||||
| Mean ± SD | 0.027 ± 0.008 | 0.053 ± 0.007 | 0.040 ± 0.007 | 0.00163 ± 0.0003 |
| Median | 0.030 | 0.050 | 0.040 | 0.0015 |
| Q1 | Q3 | 0.020 | 0.035 | 0.048 | 0.060 | 0.038 | 0.043 | 0.0014 | 0.0020 |
| Min−Max | 0.015−0.035 | 0.045−0.063 | 0.028−0.053 | 0.0013−0.0021 |
| Old | ||||
| Mean ± SD | 0.024 ± 0.006 | 0.057 ± 0.009 | 0.045 ± 0.008 | 0.0025 ± 0.00064 |
| Median | 0.021 | 0.055 | 0.048 | 0.0025 |
| Q1 | Q3 | 0.020 | 0.029 | 0.049 | 0.062 | 0.041 | 0.050 | 0.0021 | 0.0031 |
| Min−Max | 0.014−0.035 | 0.043−0.073 | 0.027−0.055 | 0.0013−0.0035 |
| Senile | ||||
| Mean ± SD | 0.019 ± 0.005 | 0.051 ± 0.017 | 0.045 ± 0.010 | 0.0023 ± 0.0007 |
| Median | 0.018 | 0.052 | 0.044 | 0.0023 |
| Q1 | Q3 | 0.016 | 0.022 | 0.038 | 0.068 | 0.040 | 0.051 | 0.0017 | 0.0026 |
| Min−Max | 0.013−0.028 | 0.020−0.071 | 0.038−0.052 | 0.0013−0.0036 |
| FEMALES | ||||
| Juvenile | ||||
| Mean ± SD | 0.020 ± 0.000 | 0.050 ± 0.015 | 0.040 ± 0.000 | 0.0018 ± 0.0004 |
| Median | 0.020 | 0.050 | 0.038 | 0.0019 |
| Q1 | Q3 | 0.020 | 0.020 | 0.036 | 0.064 | 0.020 | 0.040 | 0.0015 | 0.0021 |
| Min−Max | 0.020−0.020 | 0.035−0.065 | 0.015−0.040 | 0.0010−0.0036 |
| Young | ||||
| Mean ± SD | 0.016 ± 0.008 | 0.060 ± 0.000 | 0.031 ± 0.009 | 0.0026 ± 0.0006 |
| Median | 0.020 | 0.060 | 0.030 | 0.0024 |
| Q1 | Q3 | 0.010 | 0.020 | 0.060 | 0.060 | 0.020 | 0.040 | 0.0020 | 0.0030 |
| Min−Max | 0.005−0.030 | 0.040−0.040 | 0.020−0.040 | 0.0019−0.0024 |
| Old | ||||
| Mean ± SD | 0.022 ± 0.005 | 0.058 ± 0.015 | 0.042 ± 0.009 | 0.0025 ± 0.0007 |
| Median | 0.023 | 0.055 | 0.041 | 0.0024 |
| Q1 | Q3 | 0.018 | 0.025 | 0.046 | 0.063 | 0.035 | 0.048 | 0.0021 | 0.0028 |
| Min−Max | 0.013−0.032 | 0.035−0.090 | 0.025−0.058 | 0.0012−0.0036 |
| Senile | ||||
| Mean ± SD | 0.025 ± 0.008 | 0.059 ± 0.014 | 0.050 ± 0.012 | 0.0572 ± 0.0074 |
| Median | 0.023 | 0.059 | 0.049 | 0.1500 |
| Q1 | Q3 | 0.018 | 0.033 | 0.048 | 0.064 | 0.040 | 0.055 | 0.0021 | 0.166 |
| Min−Max | 0.013−0.040 | 0.034−0.096 | 0.026−0.075 | 0.0016−0.0044 |
Disclaimer/Publisher’s Note: The statements, opinions and data contained in all publications are solely those of the individual author(s) and contributor(s) and not of MDPI and/or the editor(s). MDPI and/or the editor(s) disclaim responsibility for any injury to people or property resulting from any ideas, methods, instructions or products referred to in the content. |
© 2023 by the authors. Licensee MDPI, Basel, Switzerland. This article is an open access article distributed under the terms and conditions of the Creative Commons Attribution (CC BY) license (https://creativecommons.org/licenses/by/4.0/).
Share and Cite
Cuenca-Bermejo, L.; Fernández-Del Palacio, M.J.; de Cassia Gonçalves, V.; Bautista-Hernández, V.; Sánchez-Rodrigo, C.; Fernández-Villalba, E.; Kublickiene, K.; Raparelli, V.; Kautzky-Willer, A.; Norris, C.M.; et al. Age and Sex Determine Electrocardiogram Parameters in the Octodon degus. Biology 2023, 12, 747. https://doi.org/10.3390/biology12050747
Cuenca-Bermejo L, Fernández-Del Palacio MJ, de Cassia Gonçalves V, Bautista-Hernández V, Sánchez-Rodrigo C, Fernández-Villalba E, Kublickiene K, Raparelli V, Kautzky-Willer A, Norris CM, et al. Age and Sex Determine Electrocardiogram Parameters in the Octodon degus. Biology. 2023; 12(5):747. https://doi.org/10.3390/biology12050747
Chicago/Turabian StyleCuenca-Bermejo, Lorena, María Josefa Fernández-Del Palacio, Valeria de Cassia Gonçalves, Víctor Bautista-Hernández, Consuelo Sánchez-Rodrigo, Emiliano Fernández-Villalba, Karolina Kublickiene, Valeria Raparelli, Alexandra Kautzky-Willer, Colleen M. Norris, and et al. 2023. "Age and Sex Determine Electrocardiogram Parameters in the Octodon degus" Biology 12, no. 5: 747. https://doi.org/10.3390/biology12050747