Article

Transcriptome Analysis on Hepatopancreas Reveals the Metabolic Dysregulation Caused by Vibrio parahaemolyticus Infection in Litopenaeus vannamei

1
CAS and Shandong Province Key Laboratory of Experimental Marine Biology, Institute of Oceanology, Chinese Academy of Sciences, Qingdao 266071, China
2
Laboratory for Marine Biology and Biotechnology, Qingdao National Laboratory for Marine Science and Technology, Qingdao 266237, China
3
University of Chinese Academy of Sciences, Beijing 100049, China
4
Center for Ocean Mega-Science, Chinese Academy of Sciences, Qingdao 266071, China
5
The Innovation of Seed Design, Chinese Academy of Sciences, Wuhan 430072, China
*
Author to whom correspondence should be addressed.
Biology 2023, 12(3), 417; https://doi.org/10.3390/biology12030417
Submission received: 16 January 2023 / Revised: 19 February 2023 / Accepted: 7 March 2023 / Published: 9 March 2023
(This article belongs to the Section Genetics and Genomics)

Abstract

:

Simple Summary

Acute hepatopancreas necrosis disease (AHPND) is a lethal disease which hinders the development of shrimp aquaculture. It is mainly caused by Vibrio parahaemolyticus. In order to learn more about the mechanism of resistance to AHPND and breed the disease resistant broodstocks, transcriptome analysis has been widely used to study the immune responses of shrimp to Vibrio parahaemolyticus infection, and many immune-related genes have been reported in response to the pathogen. However, few studies have focused on the relationship between the host metabolism and Vibrio infection. In this study, we performed a comparative transcriptomic analysis on the hepatopancreas of shrimp at different times after V. parahaemolyticus infection. We found that several processes and pathways related to metabolism were significantly upregulated in shrimp hepatopancreas after infection. These results indicate that the metabolism of shrimp plays an important role in response to Vibrio infection. The data provide a new perspective for the development of disease-resistant strategies in shrimp aquaculture.

Abstract

Acute hepatopancreas necrosis disease (AHPND) has caused massive deaths of shrimp and has led to huge economic losses in aquaculture. Vibrio parahaemolyticus (VPAHPND) carrying a plasmid encoding binary toxins homologous to the photorhabdus insect-related (Pir) toxins is one of the main pathogens causing this disease. Previous studies have reported many immune-related genes of shrimp in response to this pathogenic bacteria. However, few studies have so far focused on the metabolic changes in Litopenaeus vannamei upon VPAHPND infection. In the present study, comparative transcriptomic analysis was performed on the hepatopancreas of shrimp at different times during VPAHPND infection. Functional analyses on the differentially expressed genes (DEGs) during infection showed that pathways related to glucose, energy and amino acid metabolism, as well as nucleic acid synthesis, were obviously changed in the hepatopancreas after VPAHPND infection. Additionally, three signaling pathways, which could regulate metabolic processes, including HIF-1 signaling pathway, PI3K-Akt signaling pathway and NF-KappaB signaling pathway, also changed significantly. Collectively, these data reveal a close relationship between host metabolism processes and Vibrio infection. The information will enrich our understanding of the interaction mechanism between the shrimp and Vibrio.

1. Introduction

The Pacific white shrimp Litopenaeus vannamei is one of the major shrimp species cultivated around the world. According to the FAO, its production was estimated about 5812 thousand tons in 2020 [1]. However, shrimp diseases caused by bacteria, viruses and fungi threaten the development of the shrimp industry [2,3]. The emerging lethal disease named acute hepatopancreas necrosis disease (AHPND) has caused a tremendous decrease in shrimp production and has become one of the greatest hindrances to the development of shrimp aquaculture [4]. The causative agent of AHPND was originally reported to be a specific Vibrio parahaemolyticus, which carries an extrachromosomal plasmid that encodes a binary toxin PirAVp and PirBVp, homologous to the Photorhabdus insect-related (Pir) toxins [5]. Additionally, studies have demonstrated that other Vibrio species, such as Vibrio owensii, Vibrio harveyi, Vibrio campbellii and Vibrio punensis, which contain plasmid-coded toxin PirABvp, could also result in AHPND [6,7,8,9]. Moreover, a study has also shown that the unfavorable aquatic conditions make farmed shrimp more susceptible to Vibrio [10].
The clinical symptoms of shrimp with AHPND include lethargy, bottom swimming, empty stomach and intestine, pale and atrophied hepatopancreas [4,11]. The hepatopancreas is the main target tissue of AHPND in shrimp. VPAHPND infection could cause the sloughing and necrosis of epithelial cells in hepatopancreas tubules and massive hemocytic infiltration [12]. As a multifunctional organ, the hepatopancreas integrates metabolic and immune functions in crustaceans [13]. It not only participates in nutrient metabolism, but also in pathogen clearance and antigen processing [14]. In recent years, transcriptome analysis has been widely used to study the immune responses of shrimp to V. parahaemolyticus infection, and many immune-related genes in response to the pathogen have been found [15,16]. However, few studies have specifically focused on the metabolic changes in the shrimp hepatopancreas during V. parahaemolyticus infection.
In fact, the metabolic processes in aquatic animals play an important role in the pathogenesis of bacterial infections. For example, in the hemocytes of shrimp, white spot syndrome virus (WSSV) causes the Warburg effect of the host to meet its own demand for energy and macromolecular precursors [17]. Furthermore, transcriptome studies on different tissues of shrimp have also shown that pathogen infection causes metabolic changes in the host [18,19]. In addition, these changes are also found in other marine aquatic species, such as the Clam Ruditapes philippinarum [20]. Nevertheless, the detailed changes in shrimp metabolism caused by V. parahaemolyticus infection are still less investigated.
In the present study, we focused on the hepatopancreas of shrimp during V. parahaemolyticus infection and explored the details of metabolic changes in the tissue responsive to V. parahaemolyticus infection. The results provided us with a deeper understanding of the interaction between host and pathogen, and provided new ideas for the development of disease resistance methods from the perspective of metabolism.

2. Materials and Methods

2.1. Shrimp Culture and VPAHPND Challenge

Healthy L. vannamei were provided by Hainan Grand Suntop Ocean Breeding Co., Ltd. (Wenchang, China) and cultured in filtered seawater at 25 °C and continuously aerated. The VPAHPND were isolated from shrimp infected with V. parahaemolyticus. The procedure of isolation was as described by Liu et al. [21]. Firstly, the hepatopancreas of shrimp with AHPND was extracted to a centrifugal tube with sterile phosphate-buffered saline (PBS) and crushed into homogenates. The tissue homogenates were diluted and coated in citrate thiosulfate bile sucrose (TCBS) agar medium. After incubation at 28 °C for 18 h, monoclones were re-steaked on TCBS agar medium. The monoclone was selected again and inoculated into liquid tryptic soy broth (with 2% NaCl) medium. The cultured bacteria were centrifuged and boiled to extract DNA. Then, the DNA was used as a template to amplify 16s rRNA, PirAVp and PirBVp toxins. The products of 16s rRNA were sequenced and blasted in NCBI, the products of PirAVp and PirBVp toxins were detected by 1% agarose gel electrophoresis. The Vibrio used in the infection experiment was prepared as described by Zhang et al. [22]. Immersion infection was carried out to mimic the natural state of shrimp infection. Before the experiment, shrimp were bred in the aquarium at laboratory to acclimatize to the environment. About 100 healthy shrimp were used in the challenge experiment. The challenge dosage of VPAHPND was 5 × 10⁶ CFU/mL, which was the half of half-lethal dose determined by pre-experiment. The VPAHPND were added to the aquarium at a final concentration of 5 × 10⁶ CFU/mL. The hepatopancreas was dissected from three shrimp and mixed as one biological sample and three biological replicates were prepared at 0, 6 and 12 h post infection (hpi). The samples were pre-treated in liquid nitrogen and then stored at −80 °C.

2.2. Molecular Detection of V. parahaemolyticus in the Hepatopancreas

To explore the dynamic changes in V. parahaemolyticus in shrimp, DNA from the hepatopancreas samples was extracted using the Plant Genome DNA Extraction Kit (TIANGEN, Beijing, China) according to the manufacturer’s protocols. The concentration and purity of DNA was measured by NanoDrop 2000 (Thermo Fisher Scientific, Waltham, MA, USA), and the DNA integrity was measured by 1% agarose gel electrophoresis. Then, the extracted DNA was screened for the presence of the PirAVp sequence using the TaqMan-probe fluorescence real-time PCR. The copy number of PirAVp was calculated according to the standard curves, which were constructed by measuring the presence of the PirAVp and PirBVp. The primers used in RT-qPCR are shown in Table S1.

2.3. Total RNA Extraction, Library Preparation, and Transcriptome Sequencing

Total RNA from the hepatopancreas samples was extracted with RNAiso Plus (Takara, Japan) according to the manufacturer’s instructions. The quality and concentration of RNA samples were determined by 1% agarose gel electrophoresis and NanoDrop 2000 spectrophotometer (Thermo Fisher Scientific, Waltham, MA, USA). The mRNA was enriched by the magnetic beads with Oligo (dT) (New England Biolabs, MA, USA) and then fragmented into randomly short fragments with fragmentation buffer. Subsequently, the short mRNA fragments were used as templates for reverse transcription into the first-strand cDNA with random primers, and the second-strand cDNA was synthesized by adding DNA polymerase I, RNaseH, dNTP and buffer (New England Biolabs, USA). Then, the cDNA fragments were purified, end repaired, ploy(A) added and linked to Illumina sequencing adapters. The appropriate fragments were selected by agarose gel electrophoresis. Finally, PCR was used to complete the preparation of the library, and the constructed library was sequenced using Illumina HiSeqTM 2500 by Genedenovo Biotechnology Co., Ltd. (Guangzhou, China).

2.4. Transcriptome Assembly and Gene Functional Annotation

Before assembly, raw reads were filtered to remove reads containing adapters or more than 10% of unknown nucleotides (N), low-quality reads and rRNA, in order to obtain high-quality clean reads. Then, the clean reads were mapped to the reference genome [23] by HISAT2.2.4 [24]. The mapped reads were assembled using StringTie v 1.3.1 [25,26] in a reference-based approach. The reconstructed transcripts were aligned to the reference genome, and the functional annotation of novel genes was carried out by aligning to Nucleotide Sequence (NT), Non-Redundant protein sequence (NR), Swiss-Prot, Clusters of orthologous groups of proteins (COG) and Kyoto Encyclopedia of Genes and Genomes (KEGG) databases. To characterize the AHPND related genes in Litopenaeus vannamei, nine cDNA libraries representing samples at post-AHPND infection stages (6 hpi and 12 hpi) and non-AHPND-infected stage (0 hpi) were constructed. The sample 6 hpi-H-1 had a very low correlation with the other two samples in the 6 hpi group, which was even lower than the correlation between 6 hpi-H-1 and samples from other groups. There should be a contamination of other tissues in the sample 6 hpi-H-1 during tissue collection. Therefore, the sample 6 hpi-H-1 was removed, and eight samples were used for transcriptome analysis.

2.5. Identification of Differentially Expressed Genes (DEGs)

To identify the DEGs of 6 hpi vs. 0 hpi, 12 hpi vs. 0 hpi and 12 hpi vs. 6 hpi, the expression level of each transcript was quantified by calculating its FPKM (fragment per kilobase of transcript per million mapped reads). DEGs before and after infection were analyzed using the edgeR package (http://www.rproject.org/, accessed on 28 September 2020), with the parameter of false discovery rate (FDR) below 0.05 and absolute fold change ≥ 2. In addition, the correlation analysis between samples was also carried out among samples to ensure the reliability of experimental data.

2.6. Enrichment Analysis of DEGs

The Gene Ontology (GO) functions and KEGG pathways enrichment analysis of DEGs were performed using the OmicShare tools (http://www.omicshare.com/tools) (accessed on 28 September 2020). The GESA software v4.10 (https://www.gsea-msigdb.org/gsea/downloads.jsp) (accessed on 28 September 2020) [27] was used for Gene Set Enrichment Analysis (GESA) in two comparison groups. The p-value < 0.05 and Q ≤ 0.05 were considered statistically significant and were chosen for further analysis.

2.7. Validation of Differentially Expressed Genes by RT-qPCR

To validate the transcriptome data, twelve DEGs were selected randomly to perform a relative quantitative real-time PCR (RT-qPCR) analysis. The technical validation was conducted in the same RNA prepared for RNA-seq. The first strand of cDNA was reverse transcribed from RNA (1 μg) using PrimeScript™ RT Reagent Kit with gDNA Eraser (TaKaRa, Japan), and diluted by 30-fold in nuclease-free water. Primers for qRT-PCR were designed using Primer Premier 5.0 software. The primers used in RT-qPCR are shown in Table S1. 18s rRNA was used as an internal control to standardize the expression level. The RT-qPCR was conducted with THUNDERBIRD® SYBR® qPCR Mix on the Eppendorf Mastercycler ep realplex (Eppendorf, Germany) in a total volume of 10 μL, containing 5 μL of qPCR Mix, 1 μL of diluted cDNA, 0.3 μL each of forward and reverse primer, and 3.4 μL of DEPC-H20. The amplification steps were as follows: 95 °C for 2 min; 40 cycles of 95 °C for 15 s, 56 °C for 15 s and 72 °C for 30 s; and followed by a melting curve. The RT-qPCR analysis of all templates was repeated three times. The RT-qPCR data of the transcription of DEGs were calculated by 2−ΔΔct.

3. Results

3.1. The Loads of V. parahaemolyticus in Shrimp Hepatopancreas

The copy number of PirAVp per ng hepatopancreas DNA of shrimp at different infection time points was shown in Figure S1. The copy number of PirAVp per ng hepatopancreas DNA was 0.25 cfu/ng at 0 hpi, 1.43 cfu/ng at 6hpi, and 5.81 cfu/ng at 12 hpi. The copy number of PirAVp did not change apparently during the early infection stages (0 hpi and 6 hpi), but was significantly increased from 6 hpi to 12 hpi, indicating that the V. parahaemolyticus proliferated significantly in hepatopancreas from 6 hpi to 12 hpi.

3.2. Transcriptome Sequencing Data

The details of hepatopancreas transcriptome sequencing and assembly of Litopenaeus vannamei are presented in Table S2. A total of 454,180,184 raw reads were obtained. After filtering out low-quality data, a total of 452,336,166 clean reads were obtained. The proportion of each sample with quality scores ≥ Q20 and ≥ Q30 exceeded 97% and 92%. After mapping to the reference genome, a total of 25,572 unigenes were obtained, of which 7912 were newly assembled.

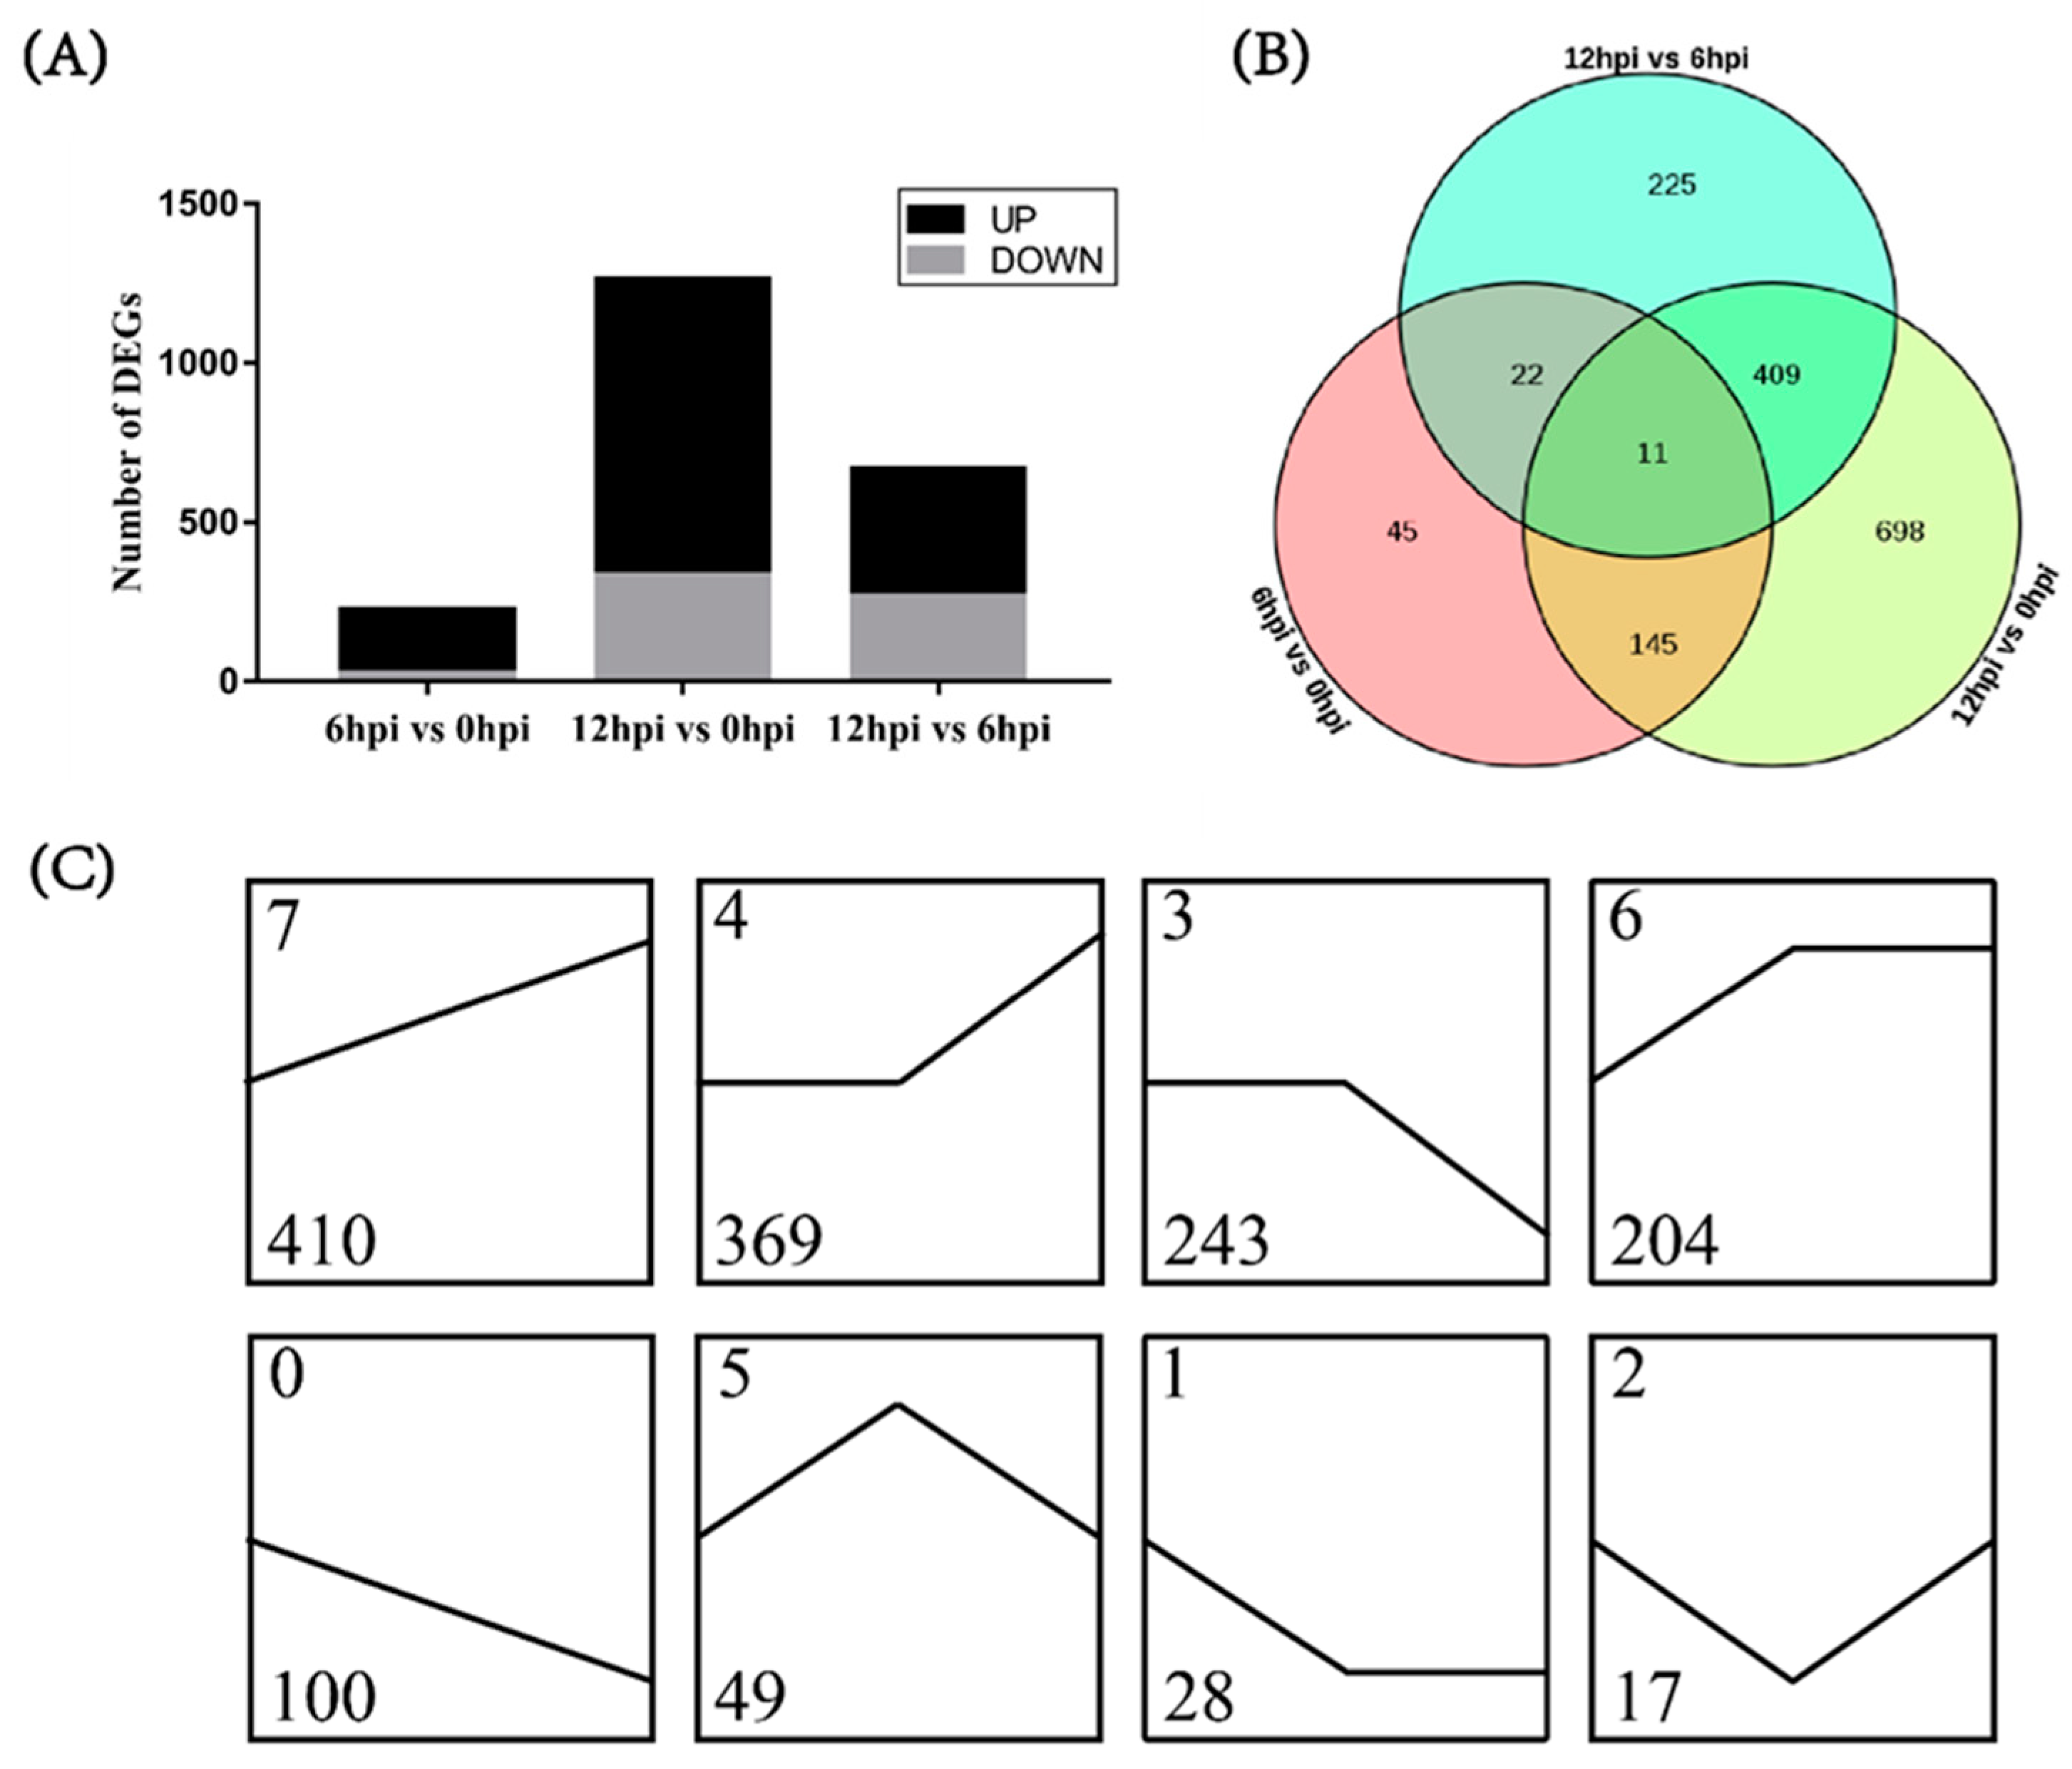
3.3. Differentially Expressed Genes (DEGs) in Different Comparisons

The expression levels of unigenes between two different time points were compared by FPKM value to identify DEGs. A total of 223 DEGs were obtained in the 6 hpi vs. 0 hpi group, including 199 upregulated unigenes and 24 downregulated unigenes (Figure 1A). A total of 1263 DEGs were obtained in the 12 hpi vs. 0 hpi group, including 931 upregulated unigenes and 332 downregulated unigenes. There were 156 DEGs that were significantly different between the two comparison groups. A total of 667 DEGs were obtained in the 12 hpi vs. 6 hpi group, including 399 upregulated unigenes and 268 downregulated unigenes.
To further understand the relationship between DEGs in pairwise comparison groups, we identified the common DEGs. As shown in the Venn diagram (Figure 1B), few genes were shared among the three comparison groups, while 420 common DEGs were shared by the 12 hpi vs. 0 hpi group and the 12 hpi vs. 6 hpi group. This phenomenon might be related to the proliferation process of V. parahaemolyticus in the hepatopancreas. Furthermore, we analyzed the expression patterns of DEGs and grouped them into eight categories based on the trend of gene expression (Figure 1C). By counting the gene number of each category, we found that most of the DEGs were upregulated after V. parahaemolyticus infection (profile 7, profile 4, profile 6 and profile 5). These DEGs were mainly related to metabolism, signal pathway, cancers and diseases (Table S3). Interestingly, many of the upregulated genes were key regulatory genes in the metabolic pathways, such as glucose metabolism, amino acid metabolism, and nucleotide metabolism. Moreover, the upregulated expression of genes in metabolic pathways mainly occurred from 6 hpi to 12 hpi, when V. parahaemolyticus proliferated significantly in the hepatopancreas. Therefore, it was considered that the alterations in host metabolism were responsible for the massive proliferation of V. parahaemolyticus.

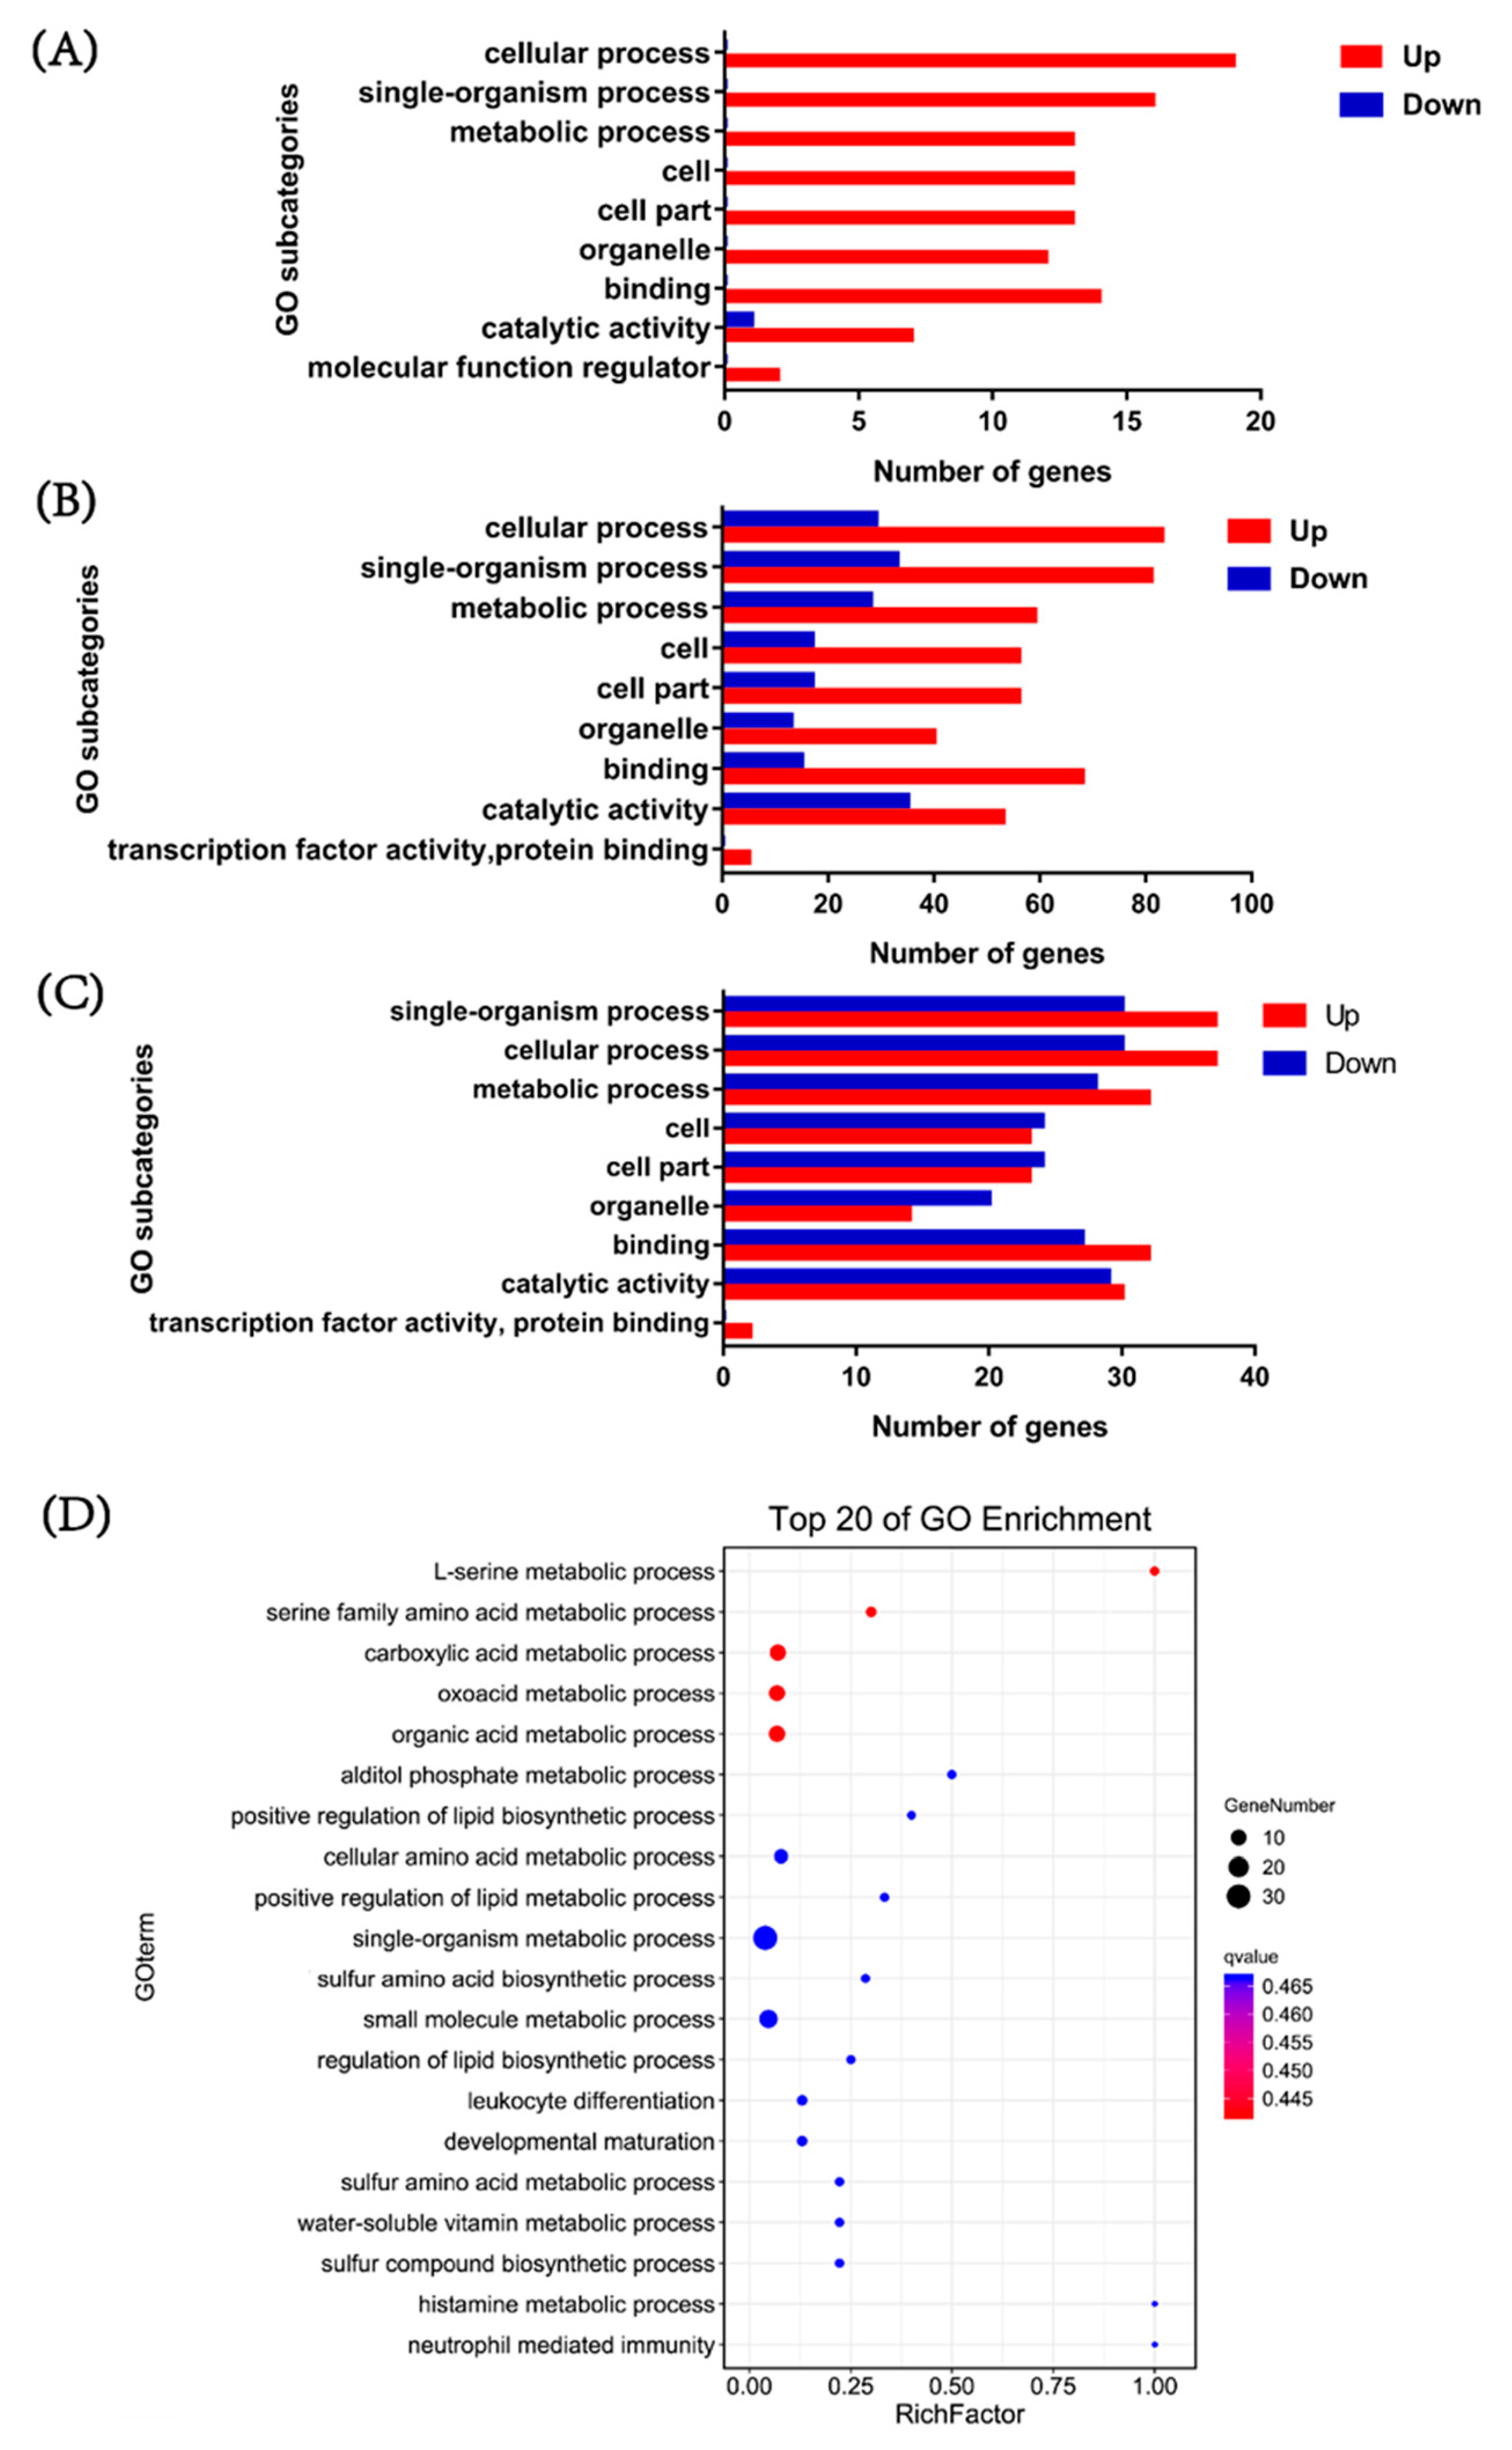
3.4. Functional Annotation of DEGs

To investigate the function of DEGs in response to V. parahaemolyticus infection, gene ontology (GO) functional enrichment analysis was performed in three comparison groups. In the biological process category, DEGs were mainly enriched in the cellular process, signal-organism and metabolic process (Figure 2A). In the cellular component, most DEGs were enriched in the cell, cell part and organelle (Figure 2B). In the molecular function category, most DEGs were involved in binding and catalytic activity (Figure 2C). According to the number of DEGs in different subcategories, the changes in the processes involved in these major subcategories mainly occurred at 6–12 h after V. parahaemolyticus infection. In particular, the most enriched process was the metabolic process in the biological process, including L-serine metabolic process, serine family amino acid metabolic process, carboxylic acid metabolic process, oxoacid metabolic process, organic acid metabolic process, alditol phosphate metabolic process, positive regulation of lipid biosynthetic process, cellular amino acid metabolic process and positive regulation of lipid metabolic process (Figure 2D). The results indicated that metabolic processes might play important roles during V. parahaemolyticus infection.
KEGG pathway enrichment analysis was conducted to investigate the specific pathways involved in DEGs. In the 6 hpi vs. 0 hpi group, the most enriched pathways of DEGs were antigen processing and presentation, prion diseases, leishmaniasis, MAPK signaling pathway, influenza A, estrogen signaling pathway, endocytosis, toxoplasmosis, legionellosis and longevity regulating pathway-multiple species (Figure 3A). In the 12 hpi vs. 0 hpi group and 12 hpi vs. 6 hpi group, there were many enrichment pathways that were the same, including biosynthesis of amino acids, glycine, serine and threonine metabolism, ascorbate and aldarate metabolism, drug metabolism-cytochrome P450, chemical carcinogenesis, metabolism of xenobiotics by cytochrome P450, glycolysis/gluconeogenesis, retinol metabolism, pentose and glucuronate interconversions, metabolic pathways, fructose and mannose metabolism, cysteine and methionine metabolism, carbon metabolism and alanine, aspartate and glutamate metabolism (Figure 3B,C). These pathways are basically related to the metabolism of substances (mainly glucose and amino acids), and some were related to detoxification. Significant changes in the expression of genes involved in these metabolic pathways mainly occurred during 6 hpi to 12 hpi, when V. parahaemolyticus proliferated rapidly in the host. These results suggest that the changes in host metabolism are mainly caused by the massive proliferation of V. parahaemolyticus.

3.5. Screening and Trend Analysis of Metabolism-Related DEGs
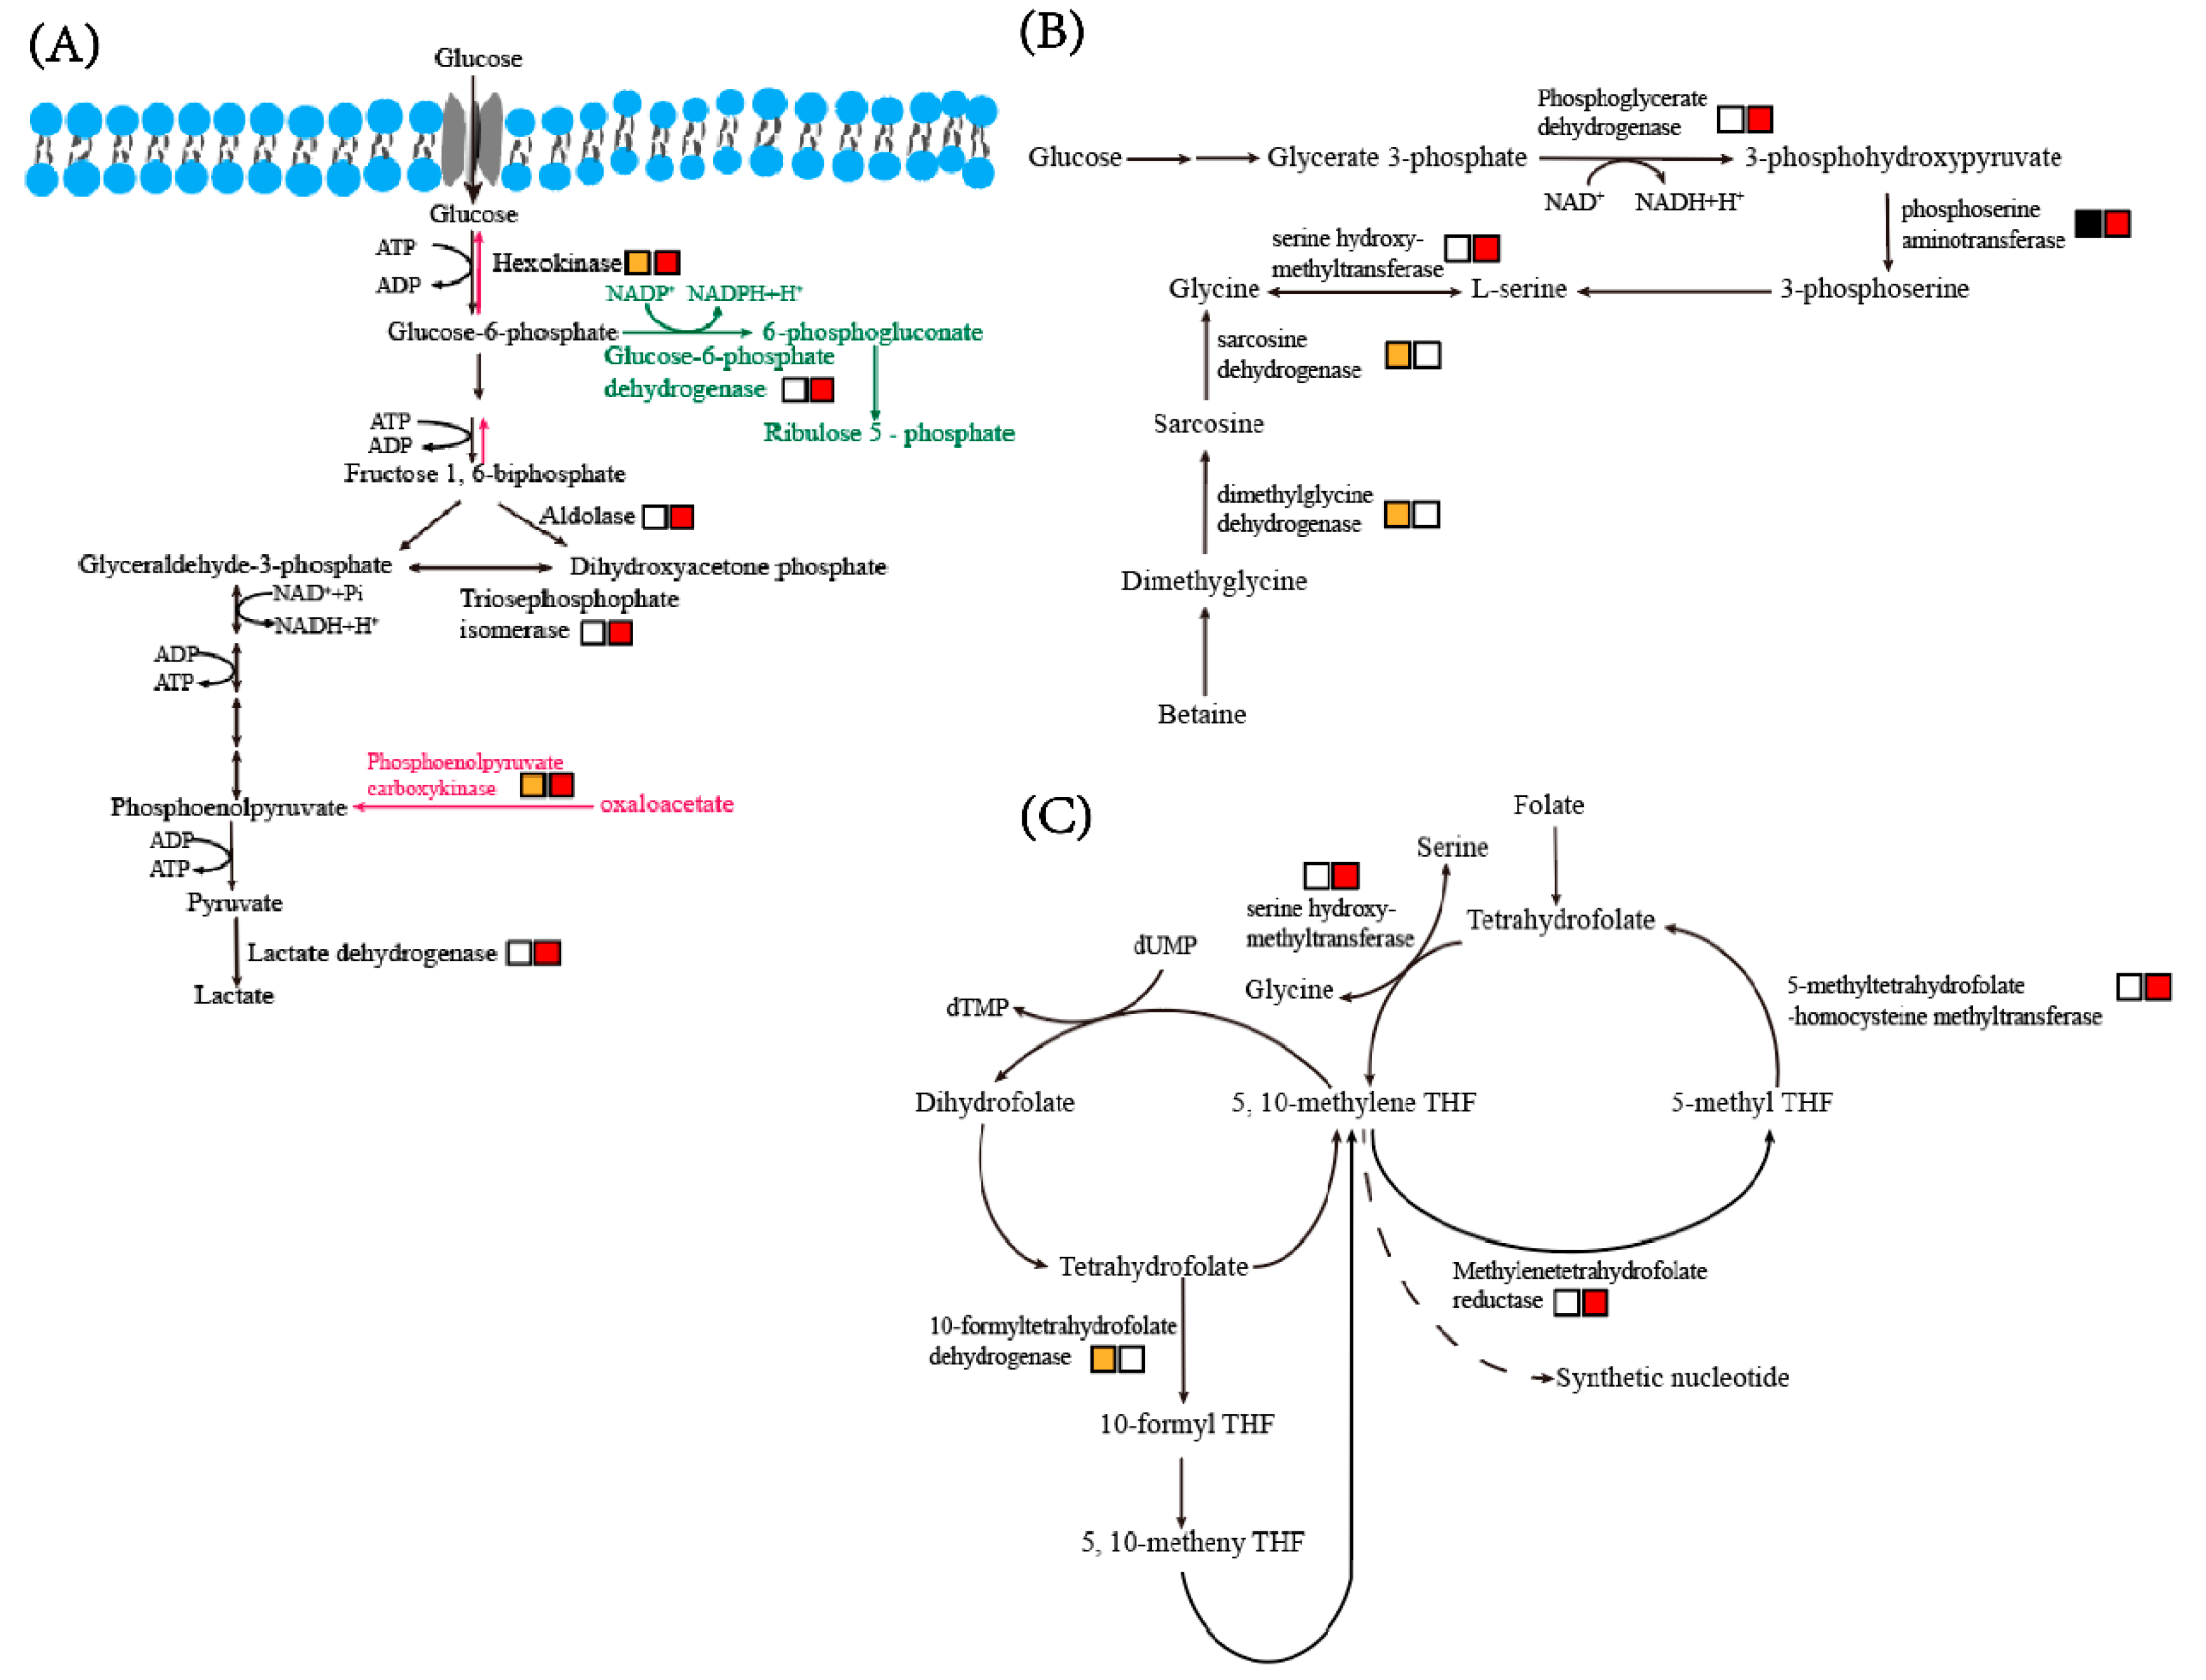
To understand the metabolic changes in the hepatopancreas of shrimp with AHPND, we screened genes involved in metabolic processes and analyzed their expression trends. Most of the DEGs were found to encode the key enzymes of key metabolic pathways, including glycolysis, gluconeogenesis pathway, pentose phosphate pathway, glycine, serine and threonine metabolism, and one carbon pool by folate (Figure 4 and Figure S2).

3.5.1. Glycolysis

V. parahaemolyticus infection led to a significant increase in the expression of genes involved in the glycolysis pathway (Figure 4A). Hexokinase (HK), the first rate-limiting enzyme of glycolysis, was significantly upregulated at 6 hpi and 12 hpi. The expression level of fructose 1,6-biphosphate-aldolase (FBA) gradually increased 8-fold from 0 hpi to 12 hpi. Several homologous genes encoding triosephosphate isomerase were significantly upregulated at 12 hpi. Lastly, the transcriptional level of lactate dehydrogenase (LDH) increased significantly at 12 hpi.

3.5.2. Gluconeogenesis and Pentose Phosphate Pathway

The expression level of phosphoenolpyruvate carboxykinase (PCK), the rate-limiting enzyme of the gluconeogenesis pathway, gradually increased after VPAHPND infection (Figure 4A). Glucose-6-phosphate dehydrogenase (G6PDH), the rate-limiting enzyme of the pentose phosphate pathway, showed significant upregulation at 12 hpi (Figure 4A). The upregulation of PCK indicated that large amounts of intermediate metabolites would be generated with the progress of infection, providing substrates for amino acid synthesis. The products catalyzed by G6PDH would also be used as substrates for de novo synthesis of nucleic acids.

3.5.3. Glycine, Serine and Threonine Metabolism

PHGDH encodes 3-phosphoglycerate dehydrogenase, the first branch enzyme of the glycolysis-serine biosynthetic pathway, was significantly upregulated at 12 hpi (Figure 4B). In addition, other enzymes involved in this pathway, including phosphoserine aminotransferase, serine hydroxymethyltransferase (SHMT), sarcosine dehydrogenase and dimethylglycine dehydrogenase, were also transcriptionally upregulated (Figure 4B). The expression levels of phosphoserine aminotransferase and serine hydroxymethyltransferase were significantly increased from 6 hpi to 12 hpi. The sarcosine dehydrogenase and dimethylglycine dehydrogenase were upregulated at 6 hpi.

3.5.4. One Carbon Pool by Folate

There are four DEGs involved in the one carbon pool by folate pathway, including serine hydroxymethyltransferase, methylenetetrahydrofolate reductase (MTHFR), 5-methyltetrahydrofolate-homocysteine methyltransferase and formyltetrahydrofolate dehydrogenase (Figure 4C). The expression levels of formyltetra-hydrofolate dehydrogenase increased significantly at 6 hpi. The expression levels of the other three enzymes were significantly upregulated at 12 hpi.

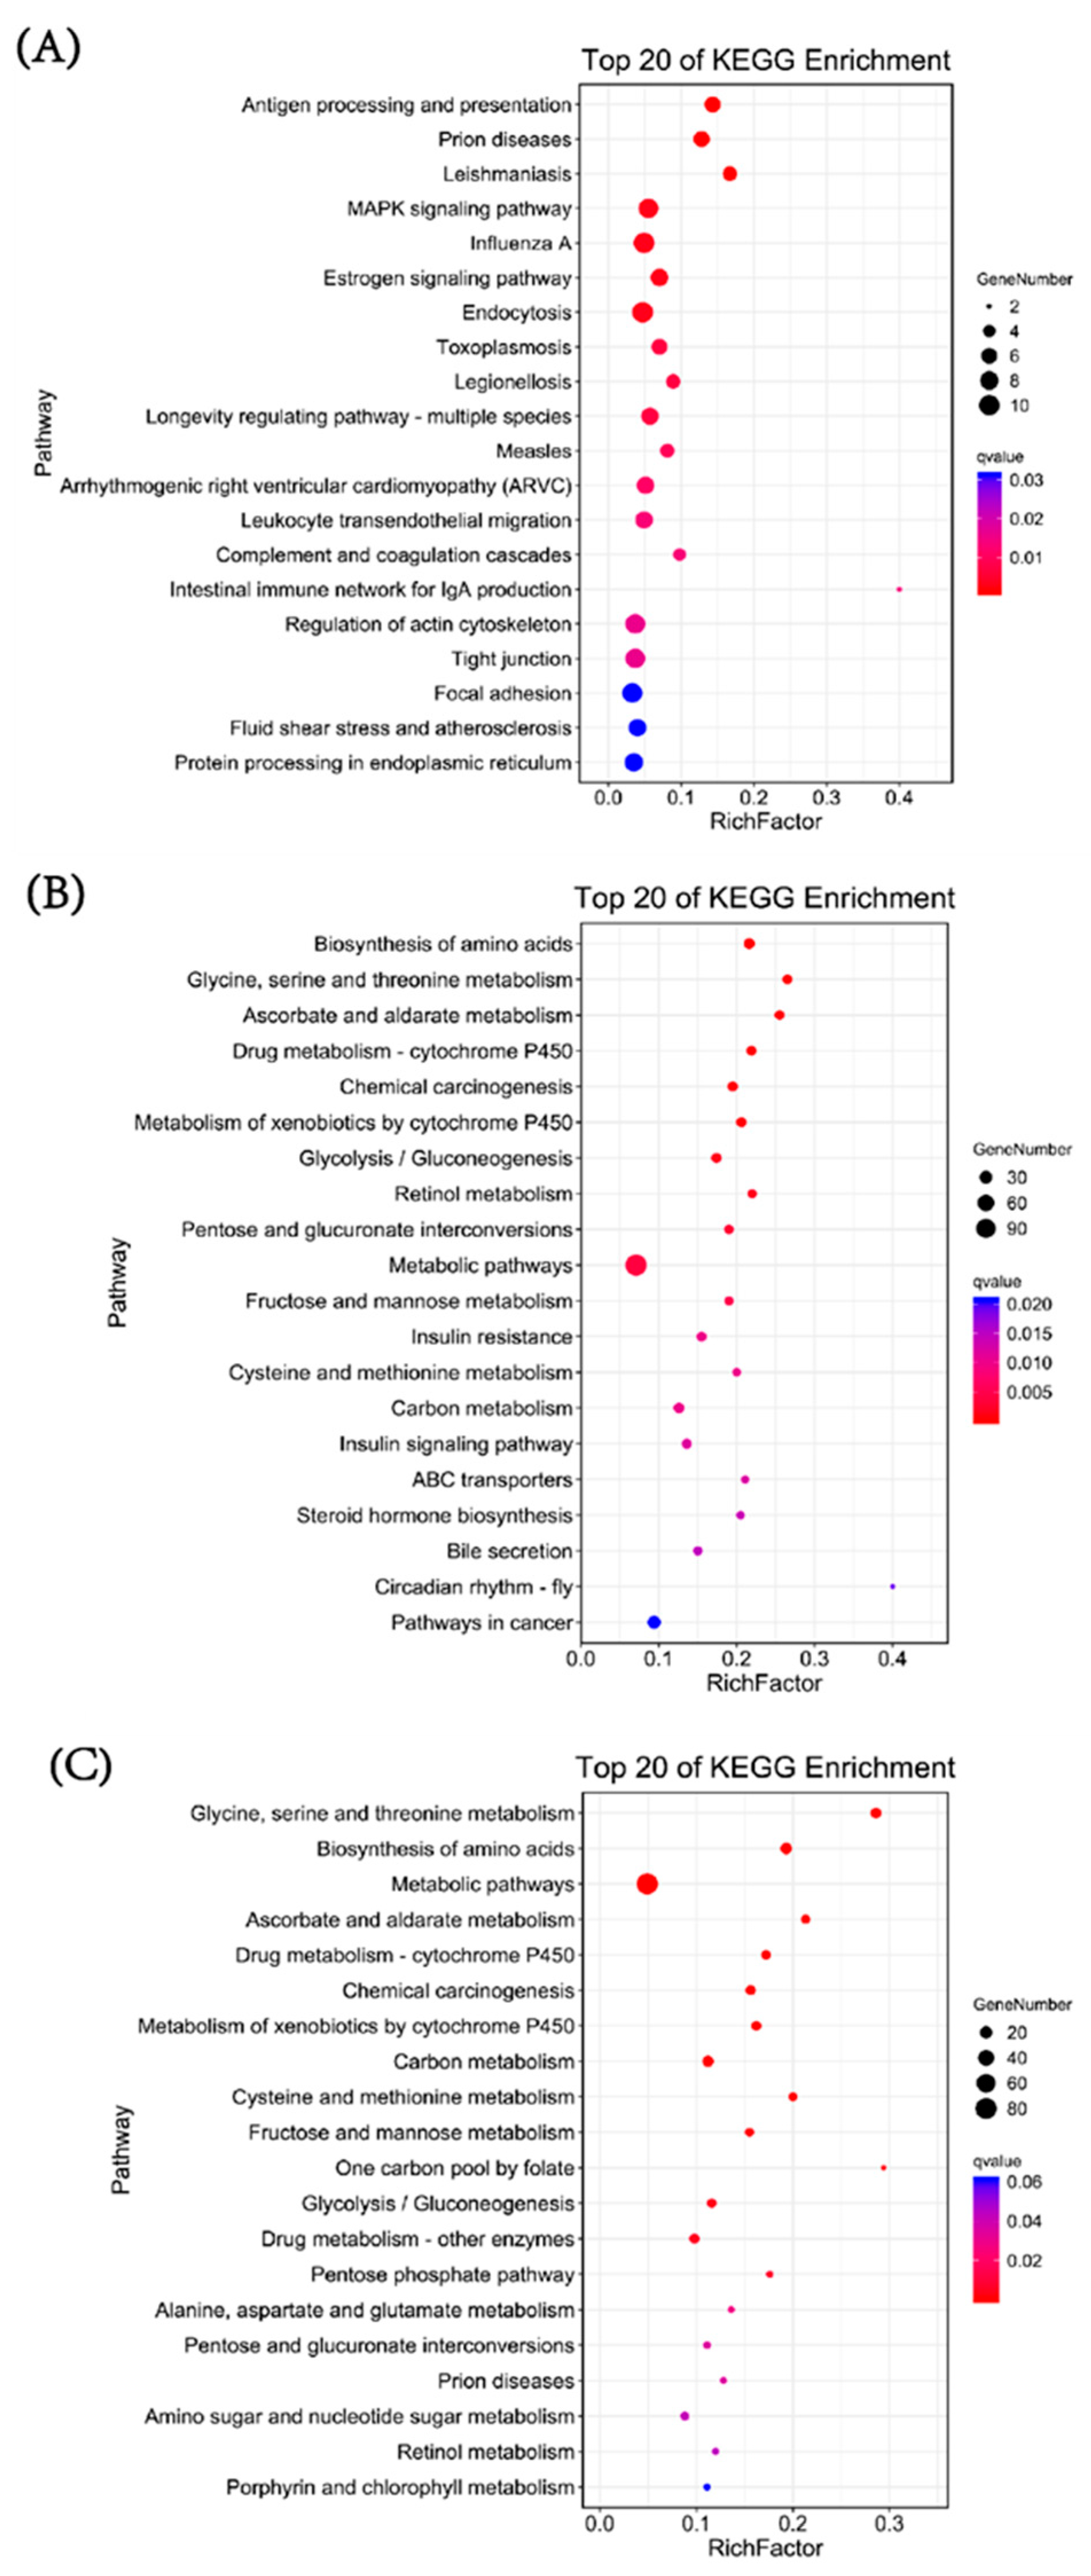
3.6. Enriched Signaling Pathways

Genes involved in HIF-1 signaling pathway, PI3K-Akt signaling pathway and NF-kappa B signaling pathway were also upregulated in hepatopancreas after AHPND infection.

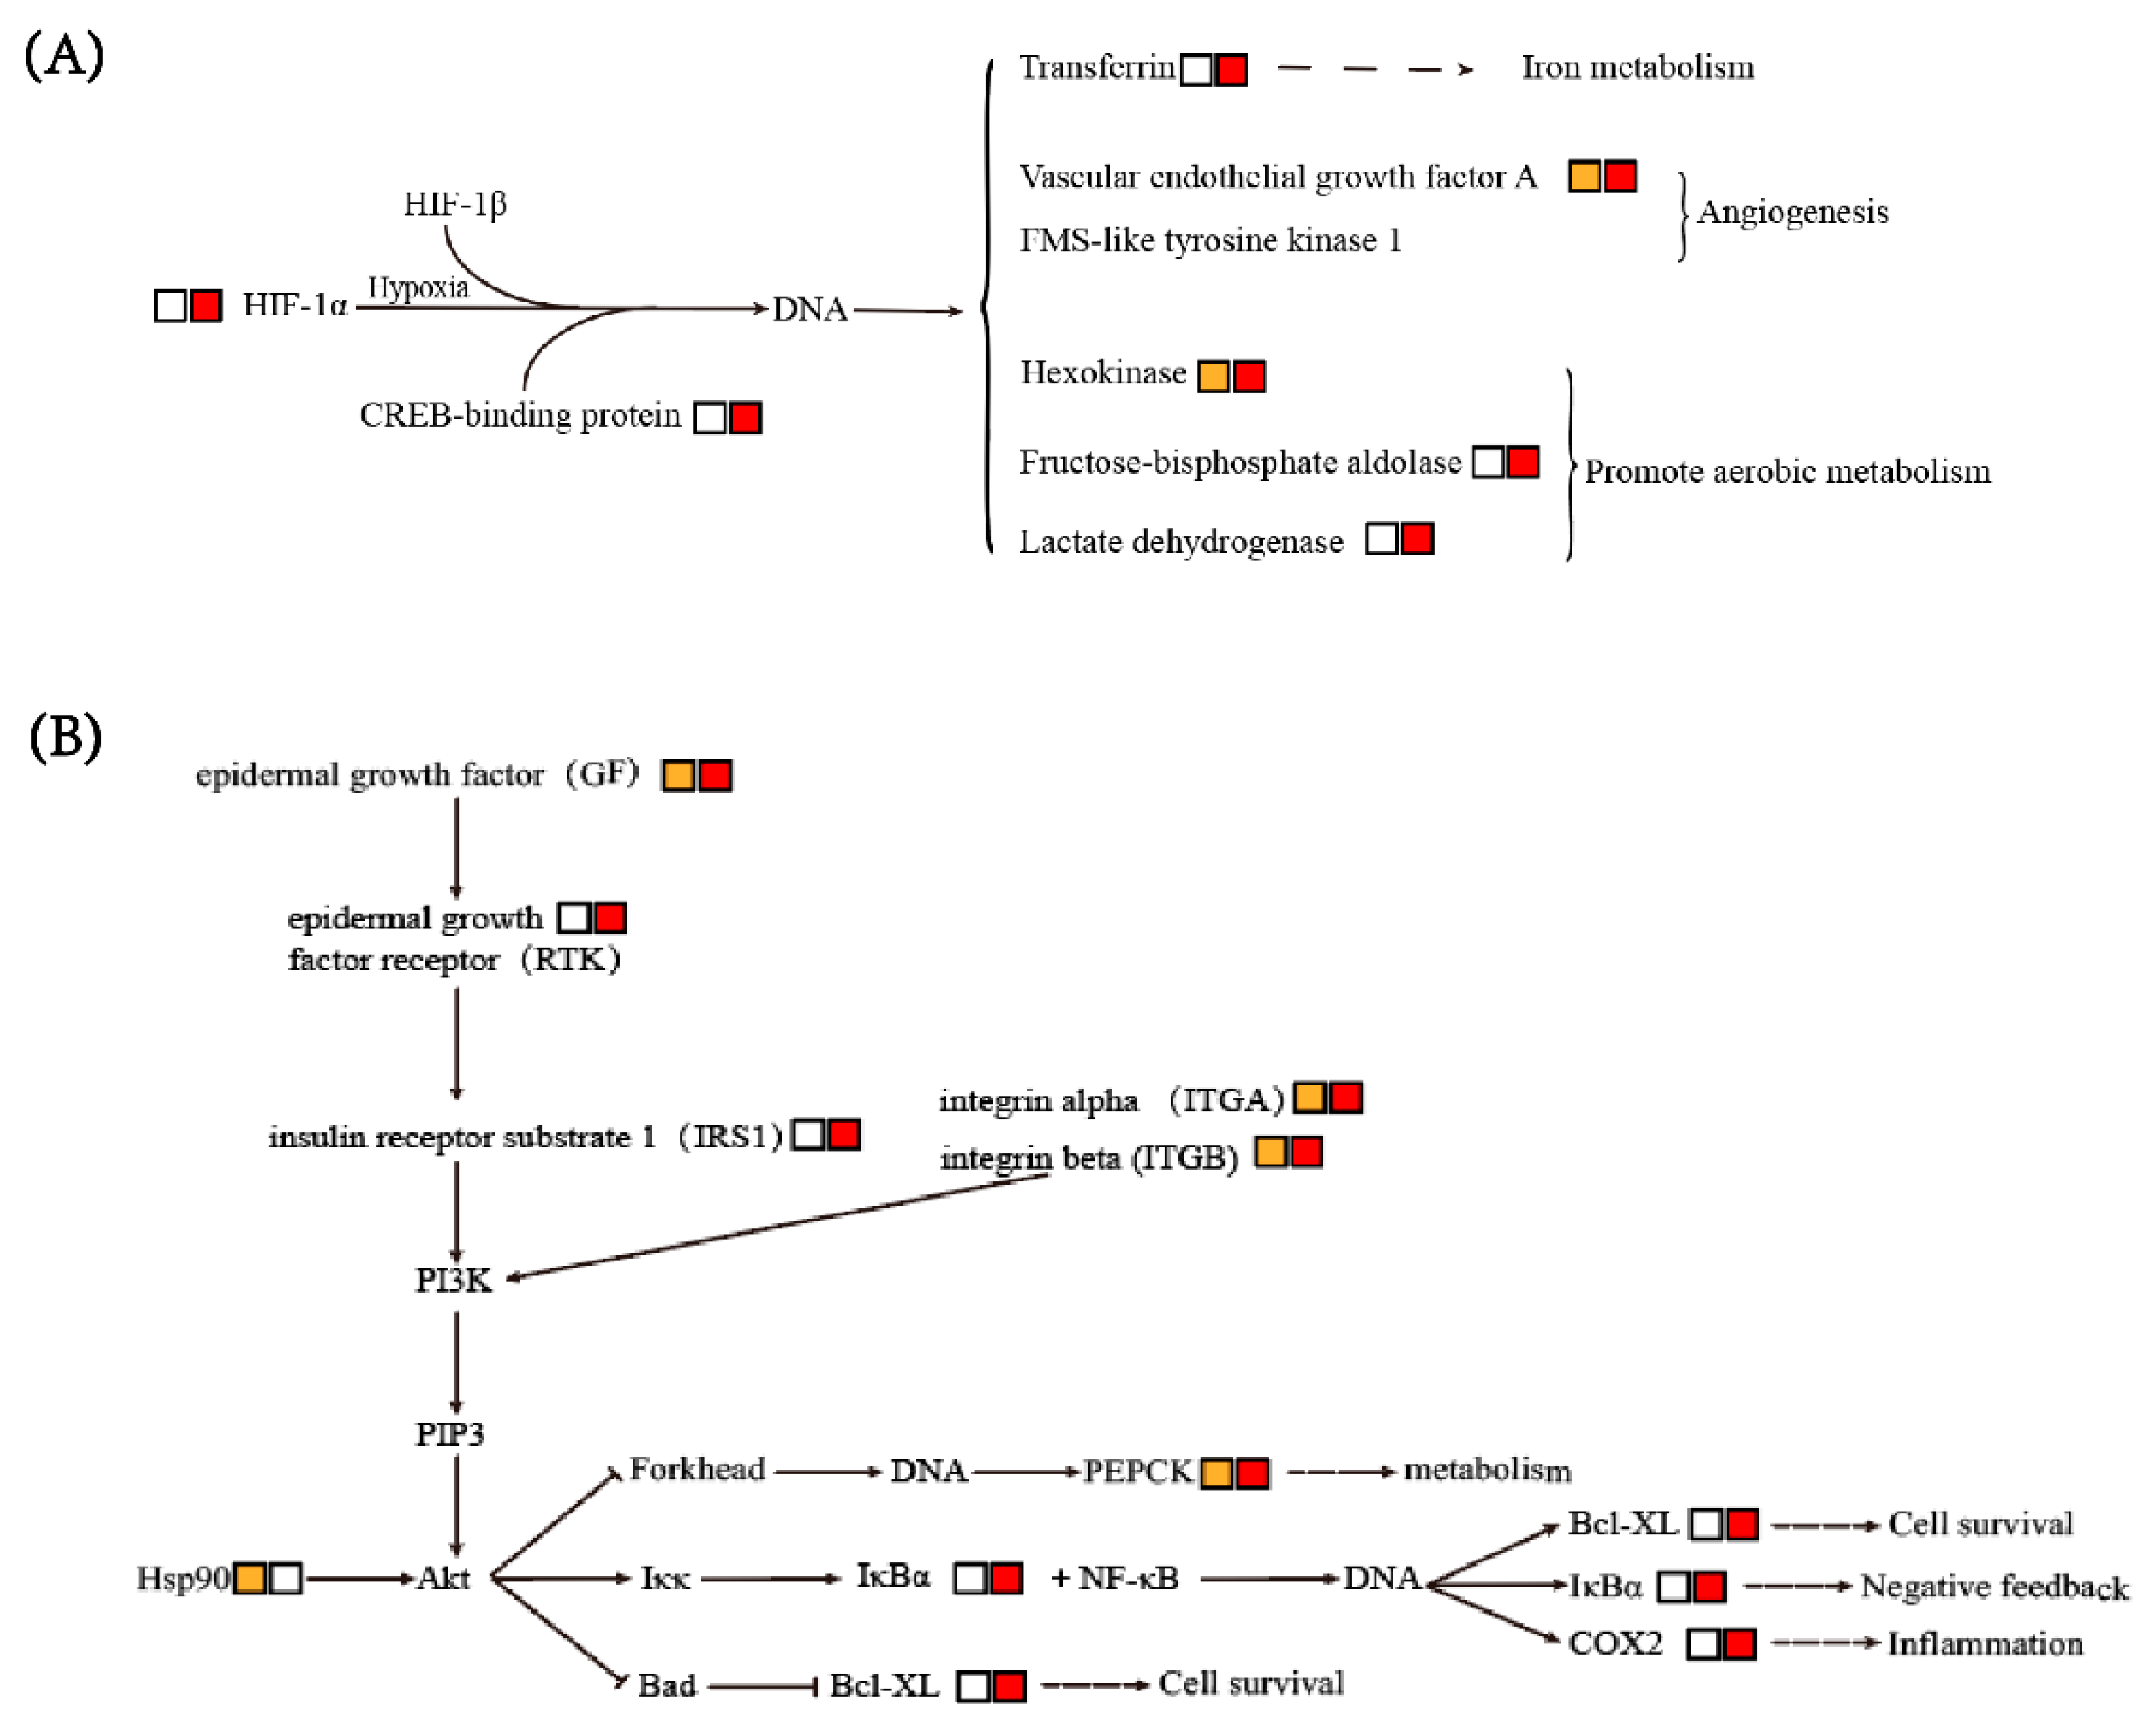
3.6.1. HIF-1 Signaling Pathway

In the HIF-1 signaling pathway, HIF-1α, the active subunit of the transcriptional activator HIF-1 [28], was significantly upregulated after V. parahaemolyticus infection (Figure 5A). The HIF-1 activated genes involved in iron metabolism, angiogenesis and anaerobic metabolism, including transferrin (TF), vascular endothelial growth factor A (VEGFA), vascular endothelial growth factor receptor precursor/FMS-like tyrosine kinase 1 (VEGFR1 or FLT1), hexokinase (HK), fructose 1,6-biphosphate-aldolase A (ALDOA), and lactate dehydrogenase A (LDHA), were also upregulated after V. parahaemolyticus infection (Figure 5A).

3.6.2. PI3K-Akt and NF-κB Signaling Pathways

In PI3K-Akt and NF-κB signaling pathways, genes encoding epidermal growth factor (GF), epidermal growth factor receptor (RTK), insulin receptor substrate 1 (IRS1), integrin, heat shock protein 90 (HSP90), Bcl-XL, phosphoenolpyruvate carboxykinase (PCK), cyclooxygenase (COX2), and cactus protein (IκBα) all showed significant upregulation after V. parahaemolyticus infection (Figure 5B). The above-mentioned genes are involved in different cell activities, such as cell survival, anaerobic metabolism and inflammation.

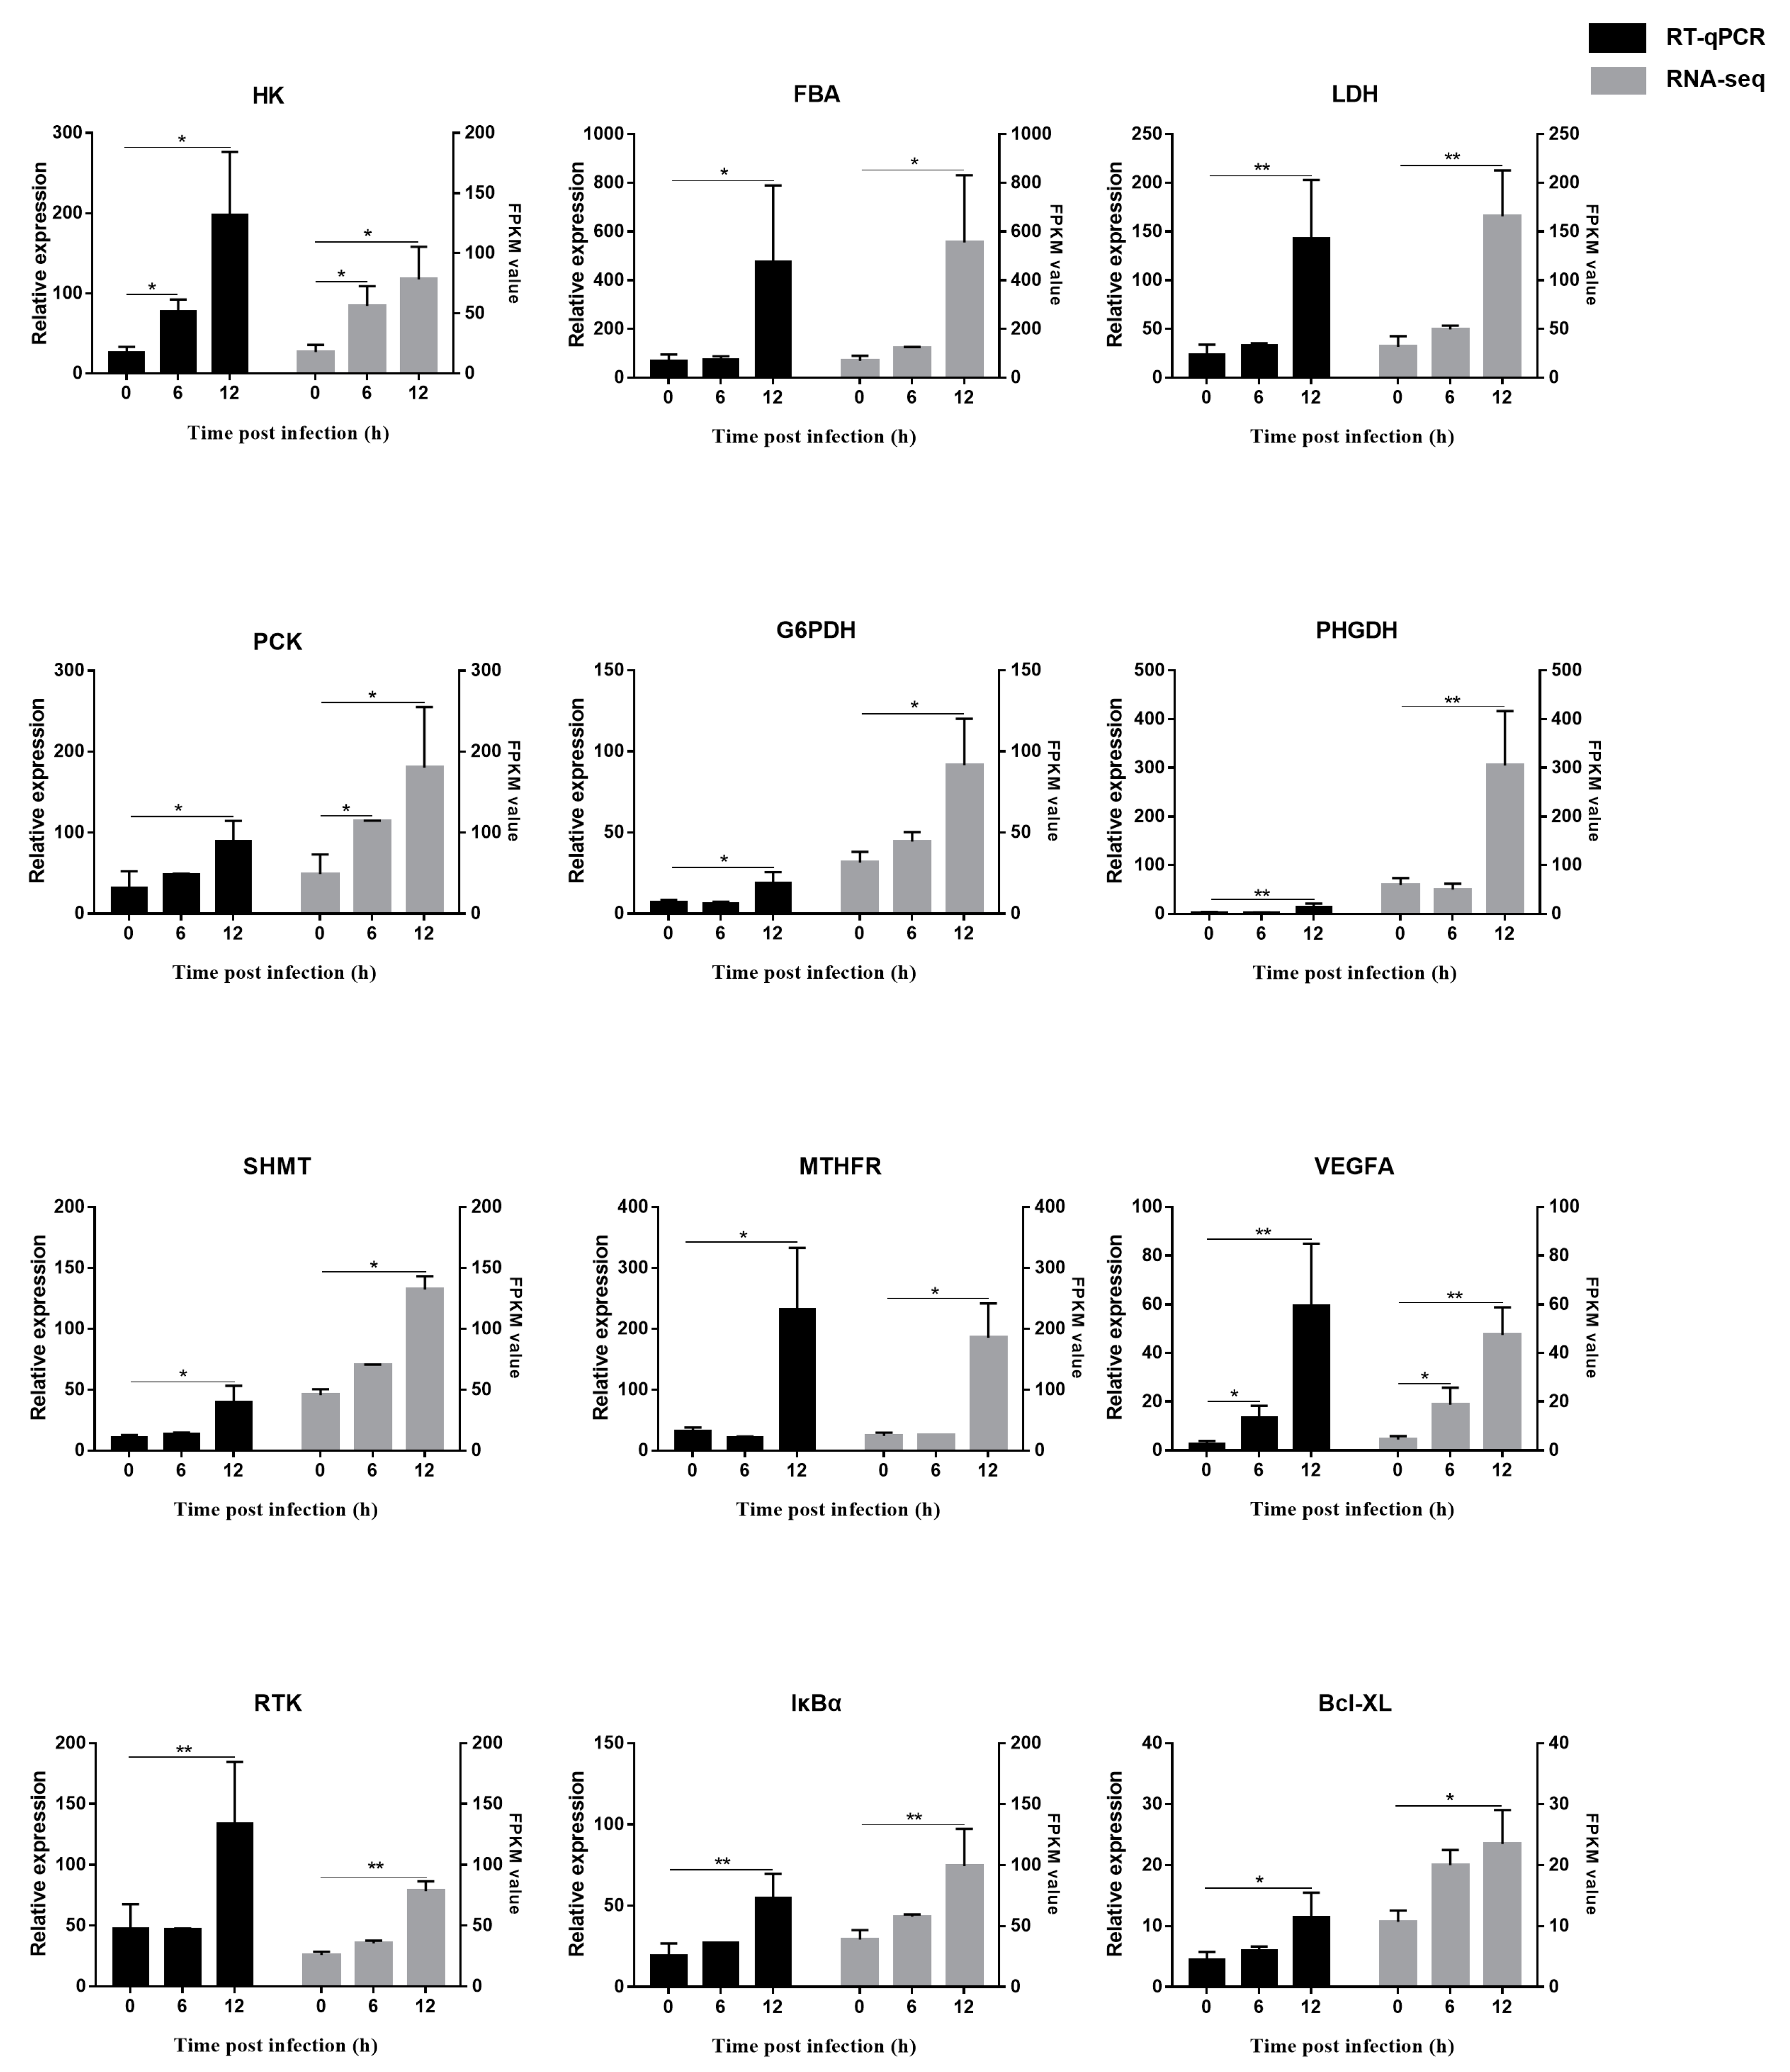
3.7. Verification of RNA-seq Results by RT-qPCR

A total of twelve DEGs in which transcriptional levels changed significantly after V. parahaemolyticus infection were chosen for RT-qPCR to validate the RNA-seq results. For the twelve DEGs acquired from three comparison groups, they were all verified successfully in the hepatopancreas. As shown in Figure 6 and Figure S2, the expression trends of these DEGs which participated in metabolic and signaling pathways were exactly consistent with the transcriptome data.

4. Discussion

Recently, studies have shown that the interaction between immunity and metabolism seems to participate in shrimp’s response to AHPND [29]. However, transcriptome studies of shrimp responses to AHPND have mainly focused on immune-related genes and pathways, and little is known about metabolism-related changes [16,30,31,32]. Here, the comparative transcriptome study mainly focused on the metabolic processes in shrimp hepatopancreas at different time points post V. parahaemolyticus infection. The data revealed that the expression levels of several genes that are involved in glucose metabolism, amino acid metabolism and nucleic acid metabolism were significantly affected after V. parahaemolyticus infection. In addition, the expression levels of some genes in the HIF-1 signaling pathway, PI3K-Akt signaling pathway and NF-kappa B signaling pathway, which participate in the regulation of metabolic processes, were also changed after V. parahaemolyticus infection.
The glycolysis/gluconeogenesis pathway is central to the metabolism of organisms, and its vital function is to provide energy and biosynthetic precursors such as amino acids, lipids and nucleotides [33]. Under aerobic conditions, glycolysis is a catabolic process that catalyzes the conversion of glucose to pyruvate via ten enzymatic steps [34]. Subsequently, the pyruvate is metabolized through the TCA cycle into NADH and reduced FADH2 to perform oxidative phosphorylation. However, pyruvate can also be fermented to lactate without producing ATP but regenerating NAD+ [35]. This phenomenon was known as Warburg effect in mammalian [36]. The excessive consumption of glucose and accumulation of lactate are both hallmarks of the Warburg effect [37]. The Warburg effect has been widely accepted as a common feature of metabolic reprogramming. Enhanced glycolysis, blocked tricarboxylic acid (TCA) cycle and oxidative phosphorylation (OXPHOS) are all key features of metabolic reprogramming in cancer cells [34]. In some studies, researchers also found that pathogens could cause these changes by exploiting the metabolic pathways of hosts to meet their raw material needs [38,39,40]. In the present study, we found that the hexokinase (HK) and lactate dehydrogenase (LDH), two key enzymes of metabolic reprogramming [41,42], were both significantly upregulated after V. parahaemolyticus infection. The expression of HK is often upregulated in cancer cells, and it plays a vital role in the high glycolytic phenotype [43,44]. LDH is involved in both aerobic and anaerobic glycolysis, which could also be induced by the hypoxia inducible factor-1 (HIF-1) [45,46]. The high expression of these two enzymes and other enzymes in the glycolysis pathway suggested that V. parahaemolyticus infection significantly enhanced the glycolysis of shrimp, causing rapid production of ATP. Notably, the expression levels of LDH did not increase significantly at 6 hpi, but increased significantly at 12 hpi, indicating that V. parahaemolyticus infection might cause significant changes in glycolysis during the rapid proliferation of Vibrio. This phenomenon may be related to the fact that V. parahaemolyticus initially colonizes the stomach at the early infection stage, and then released the PirA- and PirB-like toxins to the hepatopancreas [47,48]. The energy produced might not only be used to fight infection and maintain homeostasis by the host, but might also be used for Vibrio proliferation, similar to how viruses use glycolysis for successful replication in shrimp [39]. In addition, with the consumption of glucose, the gluconeogenesis pathway was also enhanced, with the most obvious feature that the upregulation of PCK at 6 hpi and 12 hpi, a key regulatory enzyme of gluconeogenesis. Additionally, the glycolysis pathway also provides precursors for substance synthesis, such as nucleic acids, amino acids and fatty acids [49]. Therefore, the activation of glycolysis might also enhance other biosynthetic processes.
The pentose phosphate pathway (PPP) branches from the first step of glycolysis. This pathway has two important functions, providing precursors for nucleotide synthesis (which often occurs during cell rapid proliferation) and balancing cellular redox conditions [50]. After V. parahaemolyticus infection, PPP was significantly enhanced with the phenomenon of G6PDH upregulation. G6PDH is the first and rate-limiting enzyme and as a control enzyme in the oxidative branch of the PPP, responsible for the ribose-5-phosphate and NADPH generation. NADPH is involved in many processes, including detoxification of intracellular reactive oxygen species (ROS), reductive biosynthesis and ribose biogenesis [51]. In crustaceans, ROS are important factors in the immunity of shrimp against microbes and virus infection [52,53,54]. The upregulation of PPP from 6 hpi to 12 hpi was consistent with the proliferation of Vibrio in shrimp. Therefore, the changes in PPP after infection might neutralize the ROS produced by the shrimp and facilitate the replication of Vibrio.
Glycine, serine and threonine metabolism is the most significantly enriched amino acid metabolic pathway after Vibrio infection. In this pathway, the enzymes involved in de novo synthesis of serine (SSP) and serine conversion to glycine were significantly increased from 6 hpi to 12 hpi after infection. Serine is a non-essential amino acid, derived from the glycolytic intermediate, 3- phosphoglycerate (3-PG), and can be converted to glycine [55]. Serine and glycine are both sources of one-carbon units. Serine can be converted to glycine by SHMT1/2 and one-carbon units for the synthesis of nucleotides, proteins, lipids and metabolites. Glycine can produce one-carbon units via a glycine cleavage system [56]. One-carbon units are essential for biosynthetic pathways, methylation modification and synthesis of metabolites, such as NAD(P)H, ATP and SAM/SAH [55]. The two pathways involved in the metabolism of one carbon unit are folate acid cycle and methionine metabolism [57]. In the present study, the expression levels of dimethylglycine dehydrogenase, sarcosine dehydrogenase, methylenetetrahydrofolate reductase and 10-formyltetrahydrofolate dehydrogenase, which are responsible for the folate cycle, increased significantly after Vibrio infection. The results indicated that Vibrio infection might cause disorders of the synthesis of nucleotides, proteins, lipids and metabolites, and affect the survival and proliferation of hepatopancreas cells. In L. vannamei, aflatoxins produced by fungi cause changes in serine metabolism, which was used to resist the damaging effects of the toxin [58]. However, serine/glycine biosynthesis and one-carbon metabolism also contribute to the survival and rapid proliferation of cancer cells [59]. Therefore, it is still ambiguous and needs to clarify whether the disorder of this pathway facilitates hepatopancreas cells to clear Vibrio toxins or benefits Vibrio to promote their own proliferation.
The responses of HIF-1, PI3K-Akt and NF-kappa B signaling pathways to Vibrio infection further supported the transcriptional changes in these metabolic processes. During hypoxia conditions, animals usually utilize the anaerobic glycolysis to satisfy their energy requirement. HIF-1 is one of the main responsible factors for coordinating anaerobic metabolism [60]. The target genes of HIF-1 are involved in a variety of cellular processes, such as glycolysis, erythropoiesis, angiogenesis and vascular remodeling [61]. In our transcriptome data, the genes of the HIF-1 signaling pathway were significantly upregulated after Vibrio infection, indicating that the infection and proliferation of Vibrio might alter the microenvironment of hepatopancreas cells, resulting in oxygen deficiency and thereby inducing HIF-1 signaling pathway. According to many studies, the hypoxic induction of HIF-1α protein could be regulated by PI3K/Akt signaling pathway [62]. PI3K/Akt signaling pathway plays an important role in various normal activities of cells, including cell proliferation, differentiation, survival, metabolism and motility [63]. In the present study, the genes involved in the PI3K/Akt signaling pathway and the downstream target genes of the NF-κB signaling pathway were also significantly upregulated after Vibrio infection. Overall, Vibrio infection might cause oxygen deficiency, leading to the upregulation of these signaling pathways and the enhancement of anaerobic glycolysis in hepatopancreatic cells. These changes play an important role in cell survival and resistance to Vibrio infection.
In summary, we compared the gene expression profiles of three time points of L. vannamei before and after VPAHPND infection. The DEGs were significantly enriched in the metabolism pathway and related signaling pathways, including the glycolysis/gluconeogenesis pathway, the pentose phosphate pathway, serine/glycine metabolism, one-carbon unit metabolism, HIF-1 signaling pathway, PI3K-Akt signaling pathway and NF-kappa B signaling pathway. Compared with the uninfected shrimp, these metabolic pathways were disordered after infection, similar to the metabolic reprogramming in cancer cells and immune cell functional changes during the pro- and anti-inflammatory phases [64]. Changes in these pathways not only contribute to host resistance to Vibrio infection, but can also be plundered by Vibrio for its own proliferation. The results provide us with new insights on finding anti-Vibrio strategies based on these metabolic pathways.

5. Conclusions

Comparative transcriptome analysis on hepatopancreas of Litopenaeus vannamei indicated that the metabolic processes and related signaling pathways of shrimp changed significantly at different time points after Vibrio parahaemolyticus infection. The DEGs of metabolic processes mainly consisted of glucose, energy and amino acid metabolism, as well as nucleic acid synthesis. The signaling pathways, including HIF-1 signaling pathway, PI3K-Akt signaling pathway and NF-KappaB signaling pathway, which participate in the modulation of metabolic processes, were also responsive to V. parahaemolyticus infection. Moreover, the significant changes in host metabolism were consistent the proliferation of VPAHPND, indicating that the metabolism dysregulation might be related to Vibrio proliferation. The results revealed a close relationship between host metabolism and Vibrio proliferation, which might help to develop anti-vibrio strategies from the metabolic perspective.

Supplementary Materials

The following supporting information can be downloaded at: https://www.mdpi.com/article/10.3390/biology12030417/s1, Figure S1: Copy number of PirAVp per ng hepatopancreas DNA at 0 hpi, 6 hpi and 12 hpi. The statistic significant difference was indicated with * (p < 0.05), Figure S2: Heatmap visualization of the expression trends of DEGs involved in metabolic processes and signaling pathways among different time points, Table S1: Primers and probes used in the present study, Table S2: Summary of the transcriptome data, Table S3: KEGG enrichment analysis of profile 7, 4, 6 and 5, Table S4: Pearson correlation coefficient analysis between the results of RNA seq and RT-qPCR for twelve DEGs.

Author Contributions

Conceptualization, M.M., S.L. and F.L.; methodology, Y.L.; statistical analysis, Y.Y.; writing—original draft preparation, M.M.; writing—review and editing, S.L. and F.L. All authors have read and agreed to the published version of the manuscript.

Funding

This work was financially supported by the Key Program of National Natural Science Foundation of China (31830100), the General Program of National Natural Science Foundation of China (31972829), the earmarked fund for CARS-48 and the Taishan Scholars Program.

Institutional Review Board Statement

This study used shrimp as experimental animals, which are not endangered invertebrates. In addition, there is no genetically modified organism used in the study. According to the national regulation (Fisheries Law of the People’s Republic of China), no permission is required to collect the animals and no formal ethics approval is required for this study.

Informed Consent Statement

Not applicable.

Data Availability Statement

The original contributions presented in the study are included in the article/Supplementary Material. Further inquiries can be directed to the corresponding authors.

Acknowledgments

We would like to thank the research team for their preparation of the materials for RNA-seq and technical support. Thanks for the data service provided by the Oceanographic Data Center, Chinese Academy of Sciences (CASODC).

Conflicts of Interest

The authors declare no conflict of interest.

References

  1. Colombo, G.M.; dos Santos Simião, C.; Ramírez, J.R.B.; de Sousa Araujo, A.C.; Gomes, R.M.M.; Buitagro, S.A.M.; Wasielesky, W.; Monserrat, J.M. Bioflocs enriched with lyophilized açaí (Euterpe oleracea) improved the survival and weight gain of Litopenaeus vannamei post-larvae cultivated in the BFT system. Aquaculture 2023, 566, 739230. [Google Scholar] [CrossRef]
  2. Thitamadee, S.; Prachumwat, A.; Srisala, J.; Jaroenlak, P.; Salachan, P.V.; Sritunyalucksana, K.; Flegel, T.W.; Itsathitphaisarn, O. Review of current disease threats for cultivated penaeid shrimp in Asia. Aquaculture 2016, 452, 69–87. [Google Scholar] [CrossRef]
  3. Flegel, T.W. Historic emergence, impact and current status of shrimp pathogens in Asia. J. Invertebr. Pathol. 2012, 110, 166–173. [Google Scholar] [CrossRef]
  4. Hong, X.; Lu, L.; Xu, D. Progress in research on acute hepatopancreatic necrosis disease (AHPND). Aquac. Int. 2015, 24, 577–593. [Google Scholar] [CrossRef]
  5. Lee, C.T.; Chen, I.T.; Yang, Y.T.; Ko, T.P.; Huang, Y.T.; Huang, J.Y.; Huang, M.F.; Lin, S.J.; Chen, C.Y.; Lin, S.S.; et al. The opportunistic marine pathogen Vibrio parahaemolyticus becomes virulent by acquiring a plasmid that expresses a deadly toxin. Proc. Natl. Acad. Sci. USA 2015, 112, 10798–10803. [Google Scholar] [CrossRef] [Green Version]
  6. Liu, L.; Xiao, J.; Xia, X.; Pan, Y.; Yan, S.; Wang, Y. Draft Genome Sequence of Vibrio owensii Strain SH-14, Which Causes Shrimp Acute Hepatopancreatic Necrosis Disease. Genome Announc. 2015, 3, e01395-15. [Google Scholar] [CrossRef] [Green Version]
  7. Kondo, H.; Van, P.T.; Dang, L.T.; Hirono, I. Draft Genome Sequence of Non-Vibrio parahaemolyticus Acute Hepatopancreatic Necrosis Disease Strain KC13.17.5, Isolated from Diseased Shrimp in Vietnam. Genome Announc. 2015, 3, e00978-15. [Google Scholar] [CrossRef] [Green Version]
  8. Dong, X.; Wang, H.; Xie, G.; Zou, P.; Guo, C.; Liang, Y.; Huang, J. An isolate of Vibrio campbellii carrying the pir(VP) gene causes acute hepatopancreatic necrosis disease. Emerg. Microbes Infect. 2017, 6, e2. [Google Scholar] [CrossRef] [Green Version]
  9. Restrepo, L.; Bayot, B.; Arciniegas, S.; Bajana, L.; Betancourt, I.; Panchana, F.; Reyes Munoz, A. PirVP genes causing AHPND identified in a new Vibrio species (Vibrio punensis) within the commensal Orientalis clade. Sci. Rep. 2018, 8, 13080. [Google Scholar] [CrossRef] [Green Version]
  10. Elgendy, M.; Soliman, W.S.; Hassan, H.A.; Kenawy, A.M.; Liala, A.M. Effect of Abrupt Environmental Deterioration on the Eruption of Vibriosis in Mari-Cultured Shrimp, Penaeus indicus, in Egypt. J. Fish. Aquat. Sci. 2005, 10, 146–158. [Google Scholar] [CrossRef] [Green Version]
  11. Zorriehzahra, M.J. Early Mortality Syndrome (EMS) as new Emerging Threat in Shrimp Industry. Adv. Anim. Vet. Sci. 2015, 3, 64–72. [Google Scholar] [CrossRef] [Green Version]
  12. Tran, L.; Nunan, L.; Redman, R.M.; Mohney, L.L.; Pantoja, C.R.; Fitzsimmons, K.; Lightner, D.V. Determination of the infectious nature of the agent of acute hepatopancreatic necrosis syndrome affecting penaeid shrimp. Dis. Aquat. Organ. 2013, 105, 45–55. [Google Scholar] [CrossRef]
  13. Roszer, T. The invertebrate midintestinal gland (“hepatopancreas”) is an evolutionary forerunner in the integration of immunity and metabolism. Cell Tissue Res. 2014, 358, 685–695. [Google Scholar] [CrossRef]
  14. Alday-Sanz, V.; Roque, A.; Turnbull, J.F. Clearing mechanisms of Vibrio vulnificus biotype I in the black tiger shrimp Penaeus monodon. Dis. Aquat. Organ. 2002, 48, 91–99. [Google Scholar] [CrossRef] [Green Version]
  15. Soo, T.C.C.; Devadas, S.; Mohamed Din, M.S.; Bhassu, S. Differential transcriptome analysis of the disease tolerant Madagascar-Malaysia crossbred black tiger shrimp, Penaeus monodon hepatopancreas in response to acute hepatopancreatic necrosis disease (AHPND) infection: Inference on immune gene response and interaction. Gut Pathog. 2019, 11, 39. [Google Scholar] [CrossRef] [Green Version]
  16. Qin, Z.; Babu, V.S.; Wan, Q.; Zhou, M.; Liang, R.; Muhammad, A.; Zhao, L.; Li, J.; Lan, J.; Lin, L. Transcriptome analysis of Pacific white shrimp (Litopenaeus vannamei) challenged by Vibrio parahaemolyticus reveals unique immune-related genes. Fish Shellfish Immunol. 2018, 77, 164–174. [Google Scholar] [CrossRef]
  17. Su, M.A.; Huang, Y.T.; Chen, I.T.; Lee, D.Y.; Hsieh, Y.C.; Li, C.Y.; Ng, T.H.; Liang, S.Y.; Lin, S.Y.; Huang, S.W.; et al. An invertebrate Warburg effect: A shrimp virus achieves successful replication by altering the host metabolome via the PI3K-Akt-mTOR pathway. PLoS Pathog. 2014, 10, e1004196. [Google Scholar] [CrossRef] [Green Version]
  18. Kumar, R.; Tung, T.C.; Ng, T.H.; Chang, C.C.; Chen, Y.L.; Chen, Y.M.; Lin, S.S.; Wang, H.C. Metabolic Alterations in Shrimp Stomach During Acute Hepatopancreatic Necrosis Disease and Effects of Taurocholate on Vibrio parahaemolyticus. Front. Microbiol. 2021, 12, 631468. [Google Scholar] [CrossRef]
  19. Yu, D.; Zhai, Y.; He, P.; Jia, R. Comprehensive Transcriptomic and Metabolomic Analysis of the Litopenaeus vannamei Hepatopancreas After WSSV Challenge. Front. Immunol. 2022, 13, 826794. [Google Scholar] [CrossRef]
  20. Liu, X.; Ji, C.; Zhao, J.; Wu, H. Differential metabolic responses of clam Ruditapes philippinarum to Vibrio anguillarum and Vibrio splendidus challenges. Fish Shellfish Immunol. 2013, 35, 2001–2007. [Google Scholar] [CrossRef]
  21. Liu, F.; Li, S.; Yu, Y.; Yuan, J.; Li, F. Pathogenicity of a Vibrio owensii strain isolated from Fenneropenaeus chinensis carrying pirAB genes and causing AHPND. Aquaculture 2020, 530, 735747. [Google Scholar] [CrossRef]
  22. Zhang, Q.; Yu, Y.; Wang, Q.; Liu, F.; Luo, Z.; Zhang, C.; Zhang, X.; Huang, H.; Xiang, J.; Li, F. Identification of Single Nucleotide Polymorphisms Related to the Resistance Against Acute Hepatopancreatic Necrosis Disease in the Pacific White Shrimp Litopenaeus vannamei by Target Sequencing Approach. Front. Genet. 2019, 10, 700. [Google Scholar] [CrossRef] [Green Version]
  23. Zhang, X.; Yuan, J.; Sun, Y.; Li, S.; Gao, Y.; Yu, Y.; Liu, C.; Wang, Q.; Lv, X.; Zhang, X.; et al. Penaeid shrimp genome provides insights into benthic adaptation and frequent molting. Nat. Commun. 2019, 10, 356. [Google Scholar] [CrossRef] [Green Version]
  24. Kim, D.; Langmead, B.; Salzberg, S.L. HISAT: A fast spliced aligner with low memory requirements. Nat. Methods 2015, 12, 357–360. [Google Scholar] [CrossRef] [Green Version]
  25. Pertea, M.; Pertea, G.M.; Antonescu, C.M.; Chang, T.C.; Mendell, J.T.; Salzberg, S.L. StringTie enables improved reconstruction of a transcriptome from RNA-seq reads. Nat. Biotechnol. 2015, 33, 290–295. [Google Scholar] [CrossRef] [Green Version]
  26. Pertea, M.; Kim, D.; Pertea, G.M.; Leek, J.T.; Salzberg, S.L. Transcript-level expression analysis of RNA-seq experiments with HISAT, StringTie and Ballgown. Nat. Protoc. 2016, 11, 1650–1667. [Google Scholar] [CrossRef]
  27. Subramanian, A.; Tamayo, P.; Mootha, V.K.; Mukherjee, S.; Ebert, B.L.; Gillette, M.A.; Paulovich, A.; Pomeroy, S.L.; Golub, T.R.; Lander, E.S.; et al. Gene set enrichment analysis: A knowledge-based approach for interpreting genome-wide expression profiles. Proc. Natl. Acad. Sci. USA 2005, 102, 15545–15550. [Google Scholar] [CrossRef] [Green Version]
  28. Hong, S.S.; Lee, H.; Kim, K.W.J.C.R.; Association, T.O.J.o.K.C. HIF-1α: A Valid Therapeutic Target for Tumor Therapy. Cancer Res. Treat. 2004, 36, 343. [Google Scholar] [CrossRef] [Green Version]
  29. Velazquez-Lizarraga, A.E.; Juarez-Morales, J.L.; Racotta, I.S.; Villarreal-Colmenares, H.; Valdes-Lopez, O.; Luna-Gonzalez, A.; Rodriguez-Jaramillo, C.; Estrada, N.; Ascencio, F. Transcriptomic analysis of Pacific white shrimp (Litopenaeus vannamei, Boone 1931) in response to acute hepatopancreatic necrosis disease caused by Vibrio parahaemolyticus. PLoS ONE 2019, 14, e0220993. [Google Scholar] [CrossRef] [Green Version]
  30. Maralit, B.A.; Jaree, P.; Boonchuen, P.; Tassanakajon, A.; Somboonwiwat, K. Differentially expressed genes in hemocytes of Litopenaeus vannamei challenged with Vibrio parahaemolyticus AHPND (VPAHPND) and VPAHPND toxin. Fish Shellfish Immunol. 2018, 81, 284–296. [Google Scholar] [CrossRef]
  31. Ren, X.; Liu, P.; Li, J. Comparative transcriptomic analysis of Marsupenaeus japonicus hepatopancreas in response to Vibrio parahaemolyticus and white spot syndrome virus. Fish Shellfish Immunol. 2019, 87, 755–764. [Google Scholar] [CrossRef]
  32. Mai, H.N.; Caro, L.F.A.; Cruz-Flores, R.; White, B.N.; Dhar, A.K. Differentially Expressed Genes in Hepatopancreas of Acute Hepatopancreatic Necrosis Disease Tolerant and Susceptible Shrimp (Penaeus vannamei). Front. Immunol. 2021, 12, 634152. [Google Scholar] [CrossRef]
  33. Wang, Y.; Wang, B.; Liu, M.; Jiang, K.; Wang, M.; Wang, L. Comparative transcriptome analysis reveals the potential influencing mechanism of dietary astaxanthin on growth and metabolism in Litopenaeus vannamei. Aquac. Rep. 2020, 16, 100259. [Google Scholar] [CrossRef]
  34. Sreedhar, A.; Zhao, Y. Dysregulated metabolic enzymes and metabolic reprogramming in cancer cells. Biomed. Rep. 2018, 8, 3–10. [Google Scholar] [CrossRef] [Green Version]
  35. Soto-Heredero, G.; Gomez de Las Heras, M.M.; Gabande-Rodriguez, E.; Oller, J.; Mittelbrunn, M. Glycolysis—A key player in the inflammatory response. FEBS J. 2020, 287, 3350–3369. [Google Scholar] [CrossRef] [Green Version]
  36. Warburg, O.A. On the Origin of Cancer Cell. Science 1956, 123, 309–314. [Google Scholar] [CrossRef]
  37. Liberti, M.V.; Locasale, J.W. Correction to: ‘The Warburg Effect: How Does it Benefit Cancer Cells? Trends Biochem. Sci. 2016, 41, 287. [Google Scholar] [CrossRef] [Green Version]
  38. Delgado, T.; Carroll, P.A.; Punjabi, A.S.; Margineantu, D.; Hockenbery, D.M.; Lagunoff, M. Induction of the Warburg effect by Kaposi’s sarcoma herpesvirus is required for the maintenance of latently infected endothelial cells. Proc. Natl. Acad. Sci. USA 2010, 107, 10696–10701. [Google Scholar] [CrossRef] [Green Version]
  39. Chen, I.T.; Aoki, T.; Huang, Y.T.; Hirono, I.; Chen, T.C.; Huang, J.Y.; Chang, G.D.; Lo, C.F.; Wang, H.C. White spot syndrome virus induces metabolic changes resembling the warburg effect in shrimp hemocytes in the early stage of infection. J. Virol. 2011, 85, 12919–12928. [Google Scholar] [CrossRef] [Green Version]
  40. Karniely, S.; Weekes, M.P.; Antrobus, R.; Rorbach, J.; van Haute, L.; Umrania, Y.; Smith, D.L.; Stanton, R.J.; Minczuk, M.; Lehner, P.J.; et al. Human Cytomegalovirus Infection Upregulates the Mitochondrial Transcription and Translation Machineries. mBio 2016, 7, e00029. [Google Scholar] [CrossRef] [Green Version]
  41. Kalezic, A.; Udicki, M.; Srdic Galic, B.; Aleksic, M.; Korac, A.; Jankovic, A.; Korac, B. Tissue-Specific Warburg Effect in Breast Cancer and Cancer-Associated Adipose Tissue-Relationship between AMPK and Glycolysis. Cancers 2021, 13, 2731. [Google Scholar] [CrossRef]
  42. Shim, H.; Dolde, C.; Lewis, B.C.; Wu, C.S.; Dang, G.; Jungmann, R.A.; Dalla-Favera, R.; Dang, C.V. c-Myc transactivation of LDH-A: Implications for tumor metabolismandgrowth. Proc. Natl. Acad. Sci. USA 1997, 94, 6658–6663. [Google Scholar] [CrossRef] [Green Version]
  43. Pedersen, B. High aerobic glycolysis of rat hepatoma cells in culture: Role of mitochondrial hexokinase. Proc. Natl. Acad. Sci. USA 1977, 74, 3735–3739. [Google Scholar]
  44. Rempel, A.; Mathupala, S.P.; Griffin, C.A.; Hawkins, A.L.; Pedersen, P.L. Glucose catabolism in cancer cells: Amplification of the gene encoding type II hexokinase. Cancer Res. 1996, 56, 2468–2471. [Google Scholar]
  45. Miao, P.; Sheng, S.; Sun, X.; Liu, J.; Huang, G. Lactate dehydrogenase A in cancer: A promising target for diagnosis and therapy. IUBMB Life 2013, 65, 904–910. [Google Scholar] [CrossRef]
  46. Valvona, C.J.; Fillmore, H.L.; Nunn, P.B.; Pilkington, G.J. The Regulation and Function of Lactate Dehydrogenase A: Therapeutic Potential in Brain Tumor. Brain Pathol. 2016, 26, 3–17. [Google Scholar] [CrossRef] [Green Version]
  47. Lai, H.C.; Ng, T.H.; Ando, M.; Lee, C.T.; Chen, I.T.; Chuang, J.C.; Mavichak, R.; Chang, S.H.; Yeh, M.D.; Chiang, Y.A.; et al. Pathogenesis of acute hepatopancreatic necrosis disease (AHPND) in shrimp. Fish Shellfish. Immunol. 2015, 47, 1006–1014. [Google Scholar] [CrossRef]
  48. Soonthornchai, W.; Chaiyapechara, S.; Jarayabhand, P.; Soderhall, K.; Jiravanichpaisal, P. Interaction of Vibrio spp. with the Inner Surface of the Digestive Tract of Penaeus monodon. PLoS ONE 2015, 10, e0135783. [Google Scholar] [CrossRef] [Green Version]
  49. O’Neill, L.A.; Kishton, R.J.; Rathmell, J. A guide to immunometabolism for immunologists. Nat. Rev. Immunol. 2016, 16, 553–565. [Google Scholar] [CrossRef] [Green Version]
  50. Ramos-Montoya, A.; Lee, W.N.; Bassilian, S.; Lim, S.; Trebukhina, R.V.; Kazhyna, M.V.; Ciudad, C.J.; Noe, V.; Centelles, J.J.; Cascante, M. Pentose phosphate cycle oxidative and nonoxidative balance: A new vulnerable target for overcoming drug resistance in cancer. Int. J. Cancer 2006, 119, 2733–2741. [Google Scholar] [CrossRef]
  51. Puleston, D.J.; Villa, M.; Pearce, E.L. Ancillary Activity: Beyond Core Metabolism in Immune Cells. Cell Metab. 2017, 26, 131–141. [Google Scholar] [CrossRef] [PubMed] [Green Version]
  52. Inada, M.; Sudhakaran, R.; Kihara, K.; Nishi, J.; Yoshimine, M.; Mekata, T.; Kono, T.; Sakai, M.; Yoshida, T.; Itami, T. Molecular cloning and characterization of the NADPH oxidase from the kuruma shrimp, Marsupenaeus japonicus: Early gene up-regulation after Vibrio penaeicida and poly(I:C) stimulations in vitro. Mol. Cell. Probes 2012, 26, 29–41. [Google Scholar] [CrossRef] [PubMed]
  53. Gomez-Anduro, G.A.; Barillas-Mury, C.V.; Peregrino-Uriarte, A.B.; Gupta, L.; Gollas-Galvan, T.; Hernandez-Lopez, J.; Yepiz-Plascencia, G. The cytosolic manganese superoxide dismutase from the shrimp Litopenaeus vannamei: Molecular cloning and expression. Dev. Comp. Immunol. 2006, 30, 893–900. [Google Scholar] [CrossRef]
  54. Muñoz, M.; Cedeño, R.; Rodrı, J.; van der Knaap, W.P.; Mialhe, E.; Bachère, E. Measurement of reactive oxygen intermediate production in haemocytes of the penaeid shrimp, Penaeus vannamei. Aquaculture 2000, 191, 89–107. [Google Scholar] [CrossRef] [Green Version]
  55. Newman, A.C.; Maddocks, O.D.K. Serine and Functional Metabolites in Cancer. Trends Cell Biol. 2017, 27, 645–657. [Google Scholar] [CrossRef]
  56. Kikuchi, G.; Motokawa, Y.; Yoshida, T.; Hiraga, K. Glycine cleavage system: Reaction mechanism, physiological significance, and hyperglycinemia. Proc. Jpn. Acad. Ser. B Phys. Biol. Sci. 2008, 84, 246–263. [Google Scholar] [CrossRef] [Green Version]
  57. Locasale, J.W. Serine, glycine and one-carbon units: Cancer metabolism in full circle. Nat. Rev. Cancer 2013, 13, 572–583. [Google Scholar] [CrossRef] [Green Version]
  58. Zhao, W.; Wang, M.; Wang, L.; Liu, M.; Jiang, K.; Xia, S.; Qi, C.; Wang, B. Analysis of the expression of metabolism-related genes and histopathology of the hepatopancreas of white shrimp Litopenaeus vannamei fed with aflatoxin B1. Aquaculture 2018, 485, 191–196. [Google Scholar] [CrossRef]
  59. Pan, S.; Fan, M.; Liu, Z.; Li, X.; Wang, H. Serine, glycine and onecarbon metabolism in cancer (Review). Int. J. Oncol. 2021, 58, 158–170. [Google Scholar] [CrossRef]
  60. Soñanez-Organis, J.G.; Racotta, I.S.; Yepiz-Plascencia, G. Silencing of the hypoxia inducible factor 1 –HIF-1- obliterates the effects of hypoxia on glucose and lactate concentrations in a tissue-specific manner in the shrimp Litopenaeus vannamei. J. Exp. Mar. Biol. Ecol. 2010, 393, 51–58. [Google Scholar] [CrossRef]
  61. Semenza, G.L.J.G.D. HIF-1 and human disease: One highly involved factor. Genes Dev. 2000, 14, 1983–1991. [Google Scholar] [CrossRef]
  62. Kilic-Eren, M.; Boylu, T.; Tabor, V. Targeting PI3K/Akt represses Hypoxia inducible factor-1alpha activation and sensitizes Rhabdomyosarcoma and Ewing’s sarcoma cells for apoptosis. Cancer Cell Int. 2013, 13, 36. [Google Scholar] [CrossRef] [PubMed] [Green Version]
  63. Katso, R.; Okkenhaug, K.; Ahmadi, K.; White, S.; Timms, J.; Biol, M.W. Cellular function of phosphoinositide 3-kinases: Implications for development, homeostasis, and cancer. Annu. Rev. Cell Dev. Biol. 2001, 17, 615–675. [Google Scholar] [CrossRef] [PubMed]
  64. Sun, L.; Yang, X.; Yuan, Z.; Wang, H. Metabolic Reprogramming in Immune Response and Tissue Inflammation. Arterioscler. Thromb. Vasc. Biol. 2020, 40, 1990–2001. [Google Scholar] [CrossRef] [PubMed]
Figure 1. Identification of differentially expressed genes (DEGs) from the transcriptome data. (A) Comparison of DEGs between three pairwise groups. Up represents upregulated genes. Down represents downregulated genes. (B) Venn diagrams for three pairwise comparisons at different time points after V. parahaemolyticus infection. (C) Trend analysis of DEGs. The number of genes with the same trend was marked in the lower left corner of each profile. Profiles were ordered based on the number of genes assigned.
Biology 12 00417 g001
Figure 2. Gene ontology (GO) functional enrichment analysis of DEGs in pairwise comparisons between three time points. The column showed quantity of up(red)- and down(blue)-regulated DEGs. (A) Enriched GO items from the 6 hpi vs. 0 hpi comparison. (B) Enriched GO items from the 12 hpi vs. 0 hpi comparison. (C) Enriched GO items from the 12 hpi vs. 6 hpi comparison. (D) The most enriched biological processes from the 12 hpi vs. 6 hpi comparison.
Biology 12 00417 g002
Figure 3. KEGG pathway enrichment analysis of DEGs in pairwise comparisons between three time points. (A) Enriched KEGG pathways from the 6 hpi vs. 0 hpi comparison. (B) Enriched KEGG pathways from the 12 hpi vs. 0 hpi comparison. (C) Enriched KEGG pathways from the 12 hpi vs. 6 hpi comparison.
Biology 12 00417 g003
Figure 4. Expression trends of DEGs involved in metabolic pathways. (A) Glycolysis, gluconeogenesis (pink) and pentose phosphate pathway (green). (B) Glycine, serine and threonine metabolism. (C) One carbon pool by folate. The box shows the upregulated DEGs from the 6 hpi vs. 0 hpi comparison (orange), the upregulated DEGs from the 12 hpi vs. 0 hpi comparison (red) and the downregulated DEGs from the 6 hpi or 12 hpi vs. 0 hpi comparisons (black).
Biology 12 00417 g004
Figure 5. Expression trends of DEGs involved in PI3K-Akt (A) and NF-κB (B) signaling pathways. The box showed upregulated DEGs from the 6 hpi vs. 0 hpi comparison (orange), the upregulated DEGs from the 12 hpi vs. 0 hpi comparison (red) and the downregulated DEGs from the 6 hpi or 12 hpi vs. 0 hpi comparisons (black).
Biology 12 00417 g005
Figure 6. RT-qPCR and RNA-seq results of twelve DEGs in hepatopancreas. The data were calculated as the mean ± SD relative to the reference gene (18S rRNA). The significant statistical difference was marked with * (p < 0.05) or ** (p < 0.01).
Biology 12 00417 g006
Disclaimer/Publisher’s Note: The statements, opinions and data contained in all publications are solely those of the individual author(s) and contributor(s) and not of MDPI and/or the editor(s). MDPI and/or the editor(s) disclaim responsibility for any injury to people or property resulting from any ideas, methods, instructions or products referred to in the content.

