

Alleviation of Hyperuricemia by Strictinin in AML12 Mouse Hepatocytes Treated with Xanthine and in Mice Treated with Potassium Oxonate
 , , , and
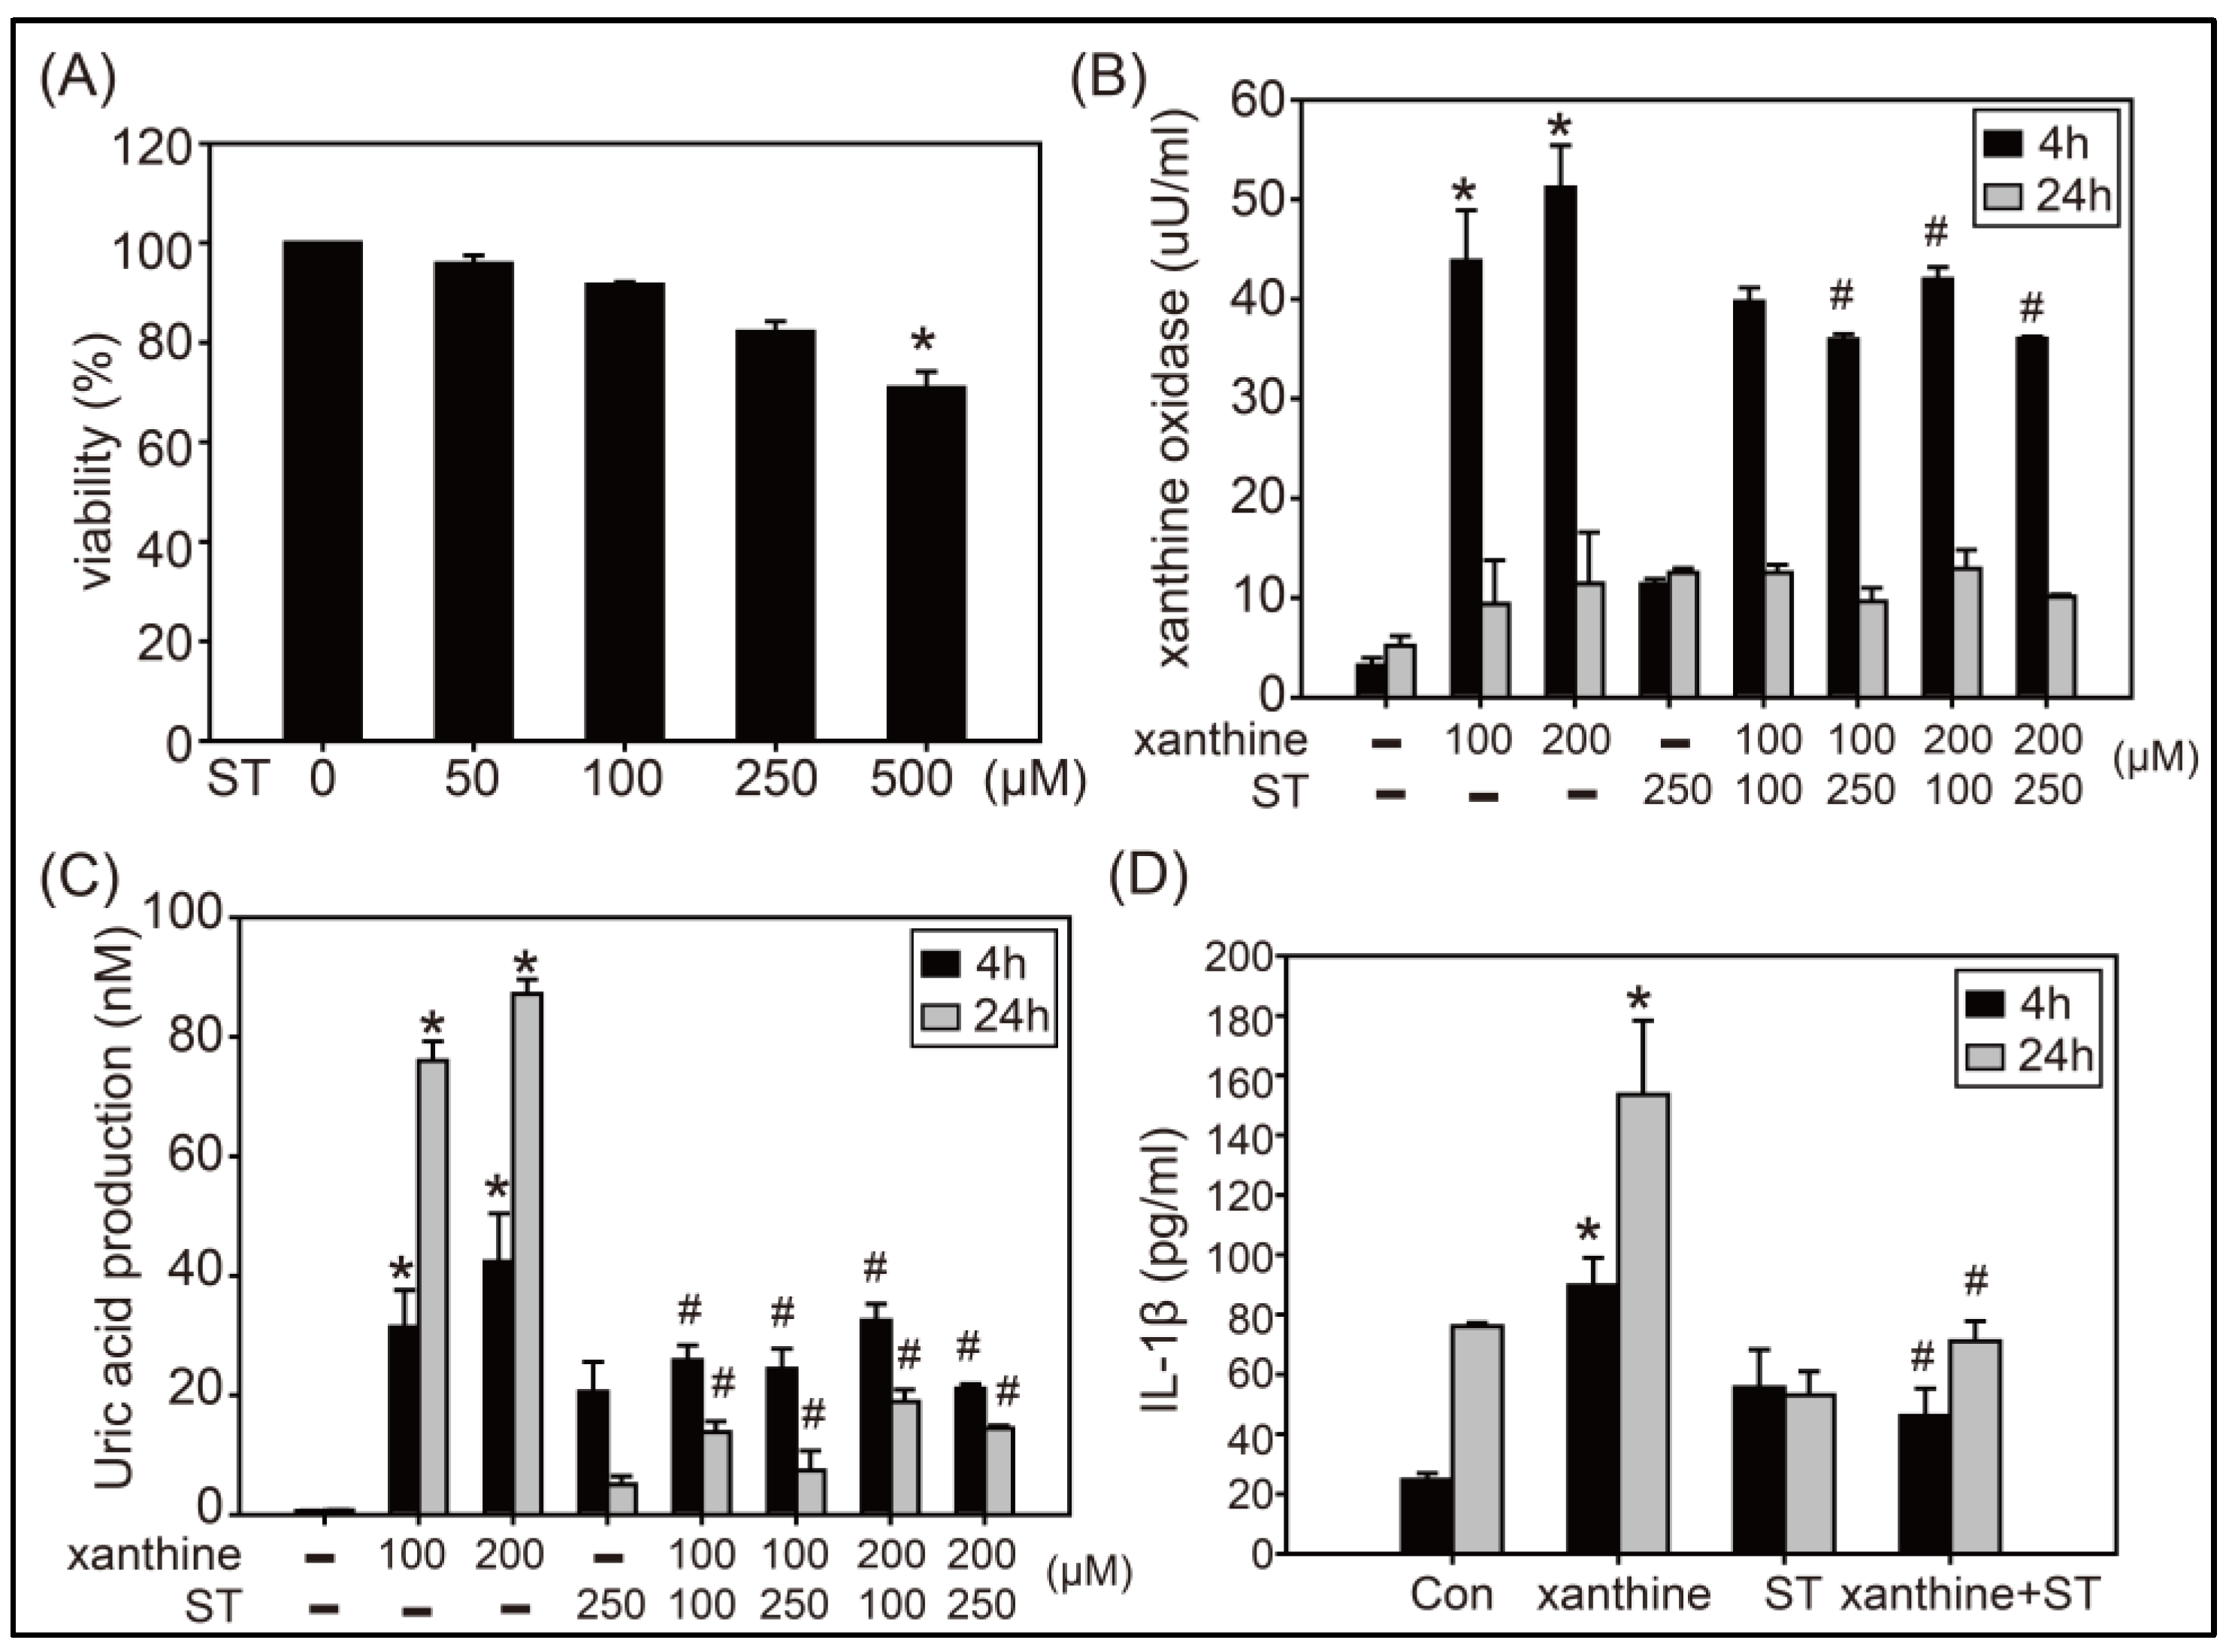
Abstract
:Simple Summary
Abstract
1. Introduction
2. Materials and Methods
2.1. Chemicals and Reagents
2.2. Cell Culture
2.3. Cell Viability Assay
2.4. Detection the Production of UA and IL-1β
2.5. Western Blotting Analysis
2.6. In Vivo Experiment
2.7. Detection of XOD Activity
2.8. Histopathological Analysis
2.9. Analysis of Microbiota
2.10. Statistical Analysis
3. Results
3.1. Effects of Strictinin on XOD Activity, UA Production, and IL-1β Expression in AML12 Cells Treated with Xanthine
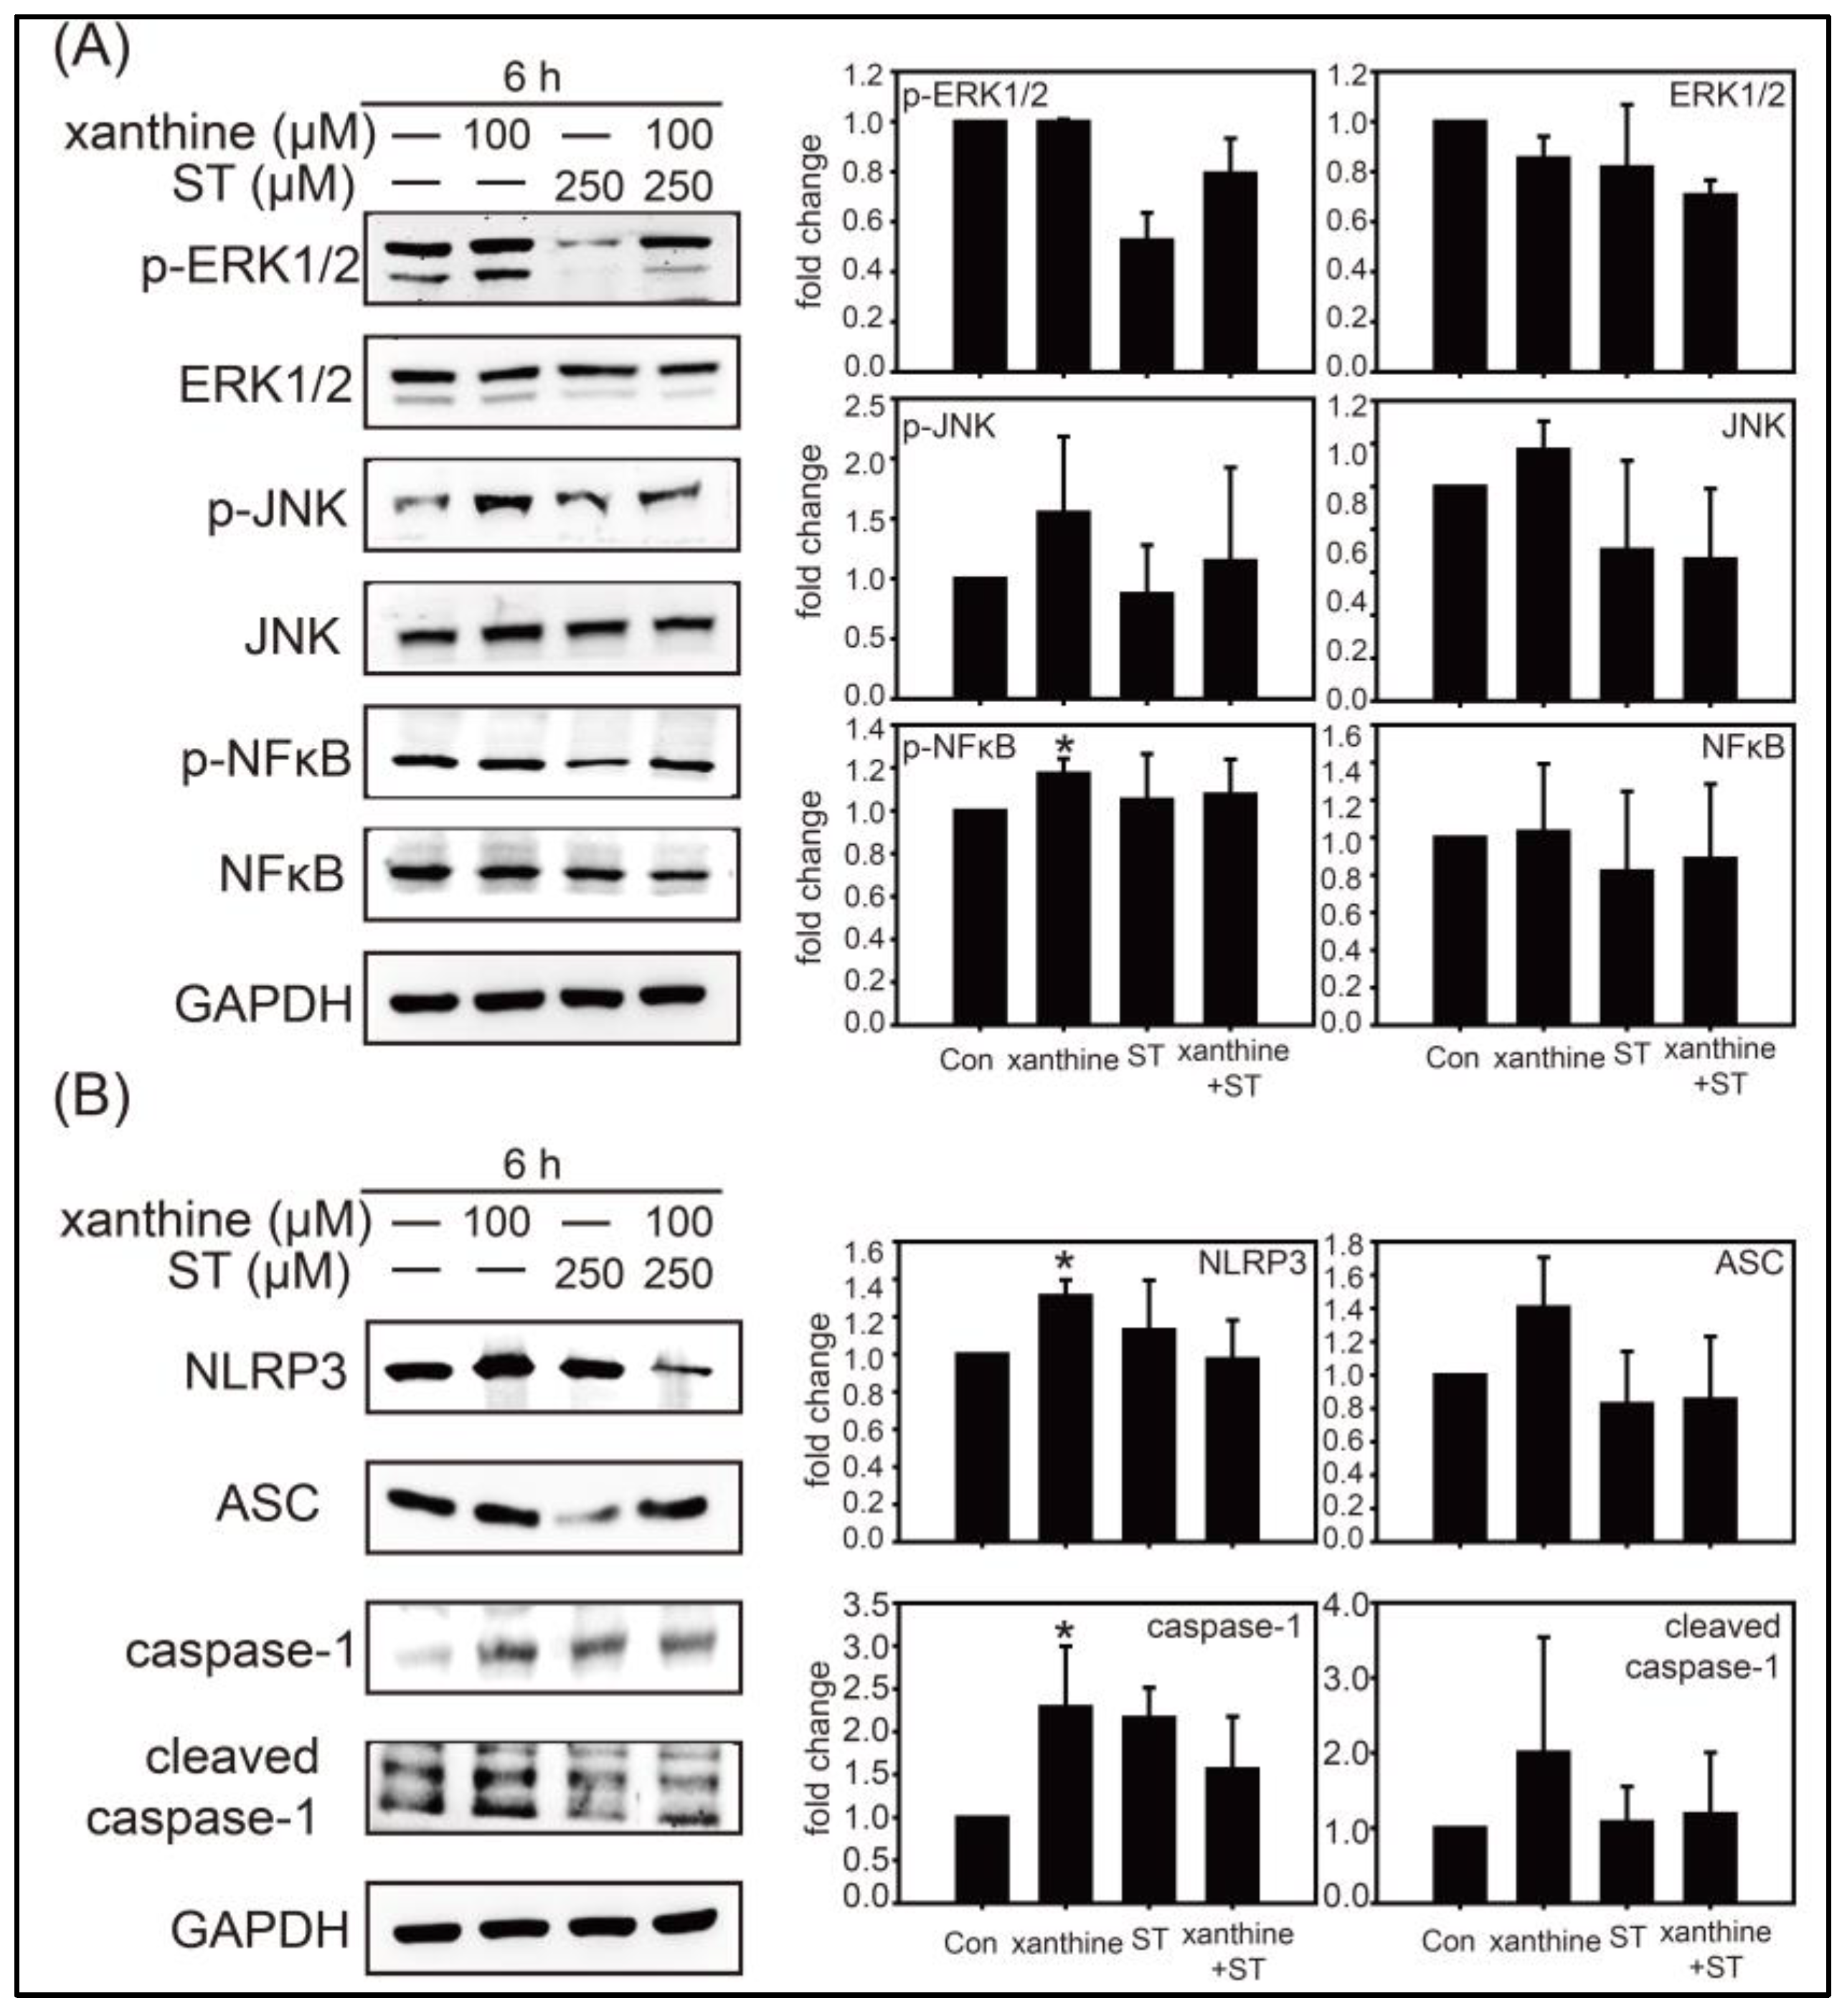
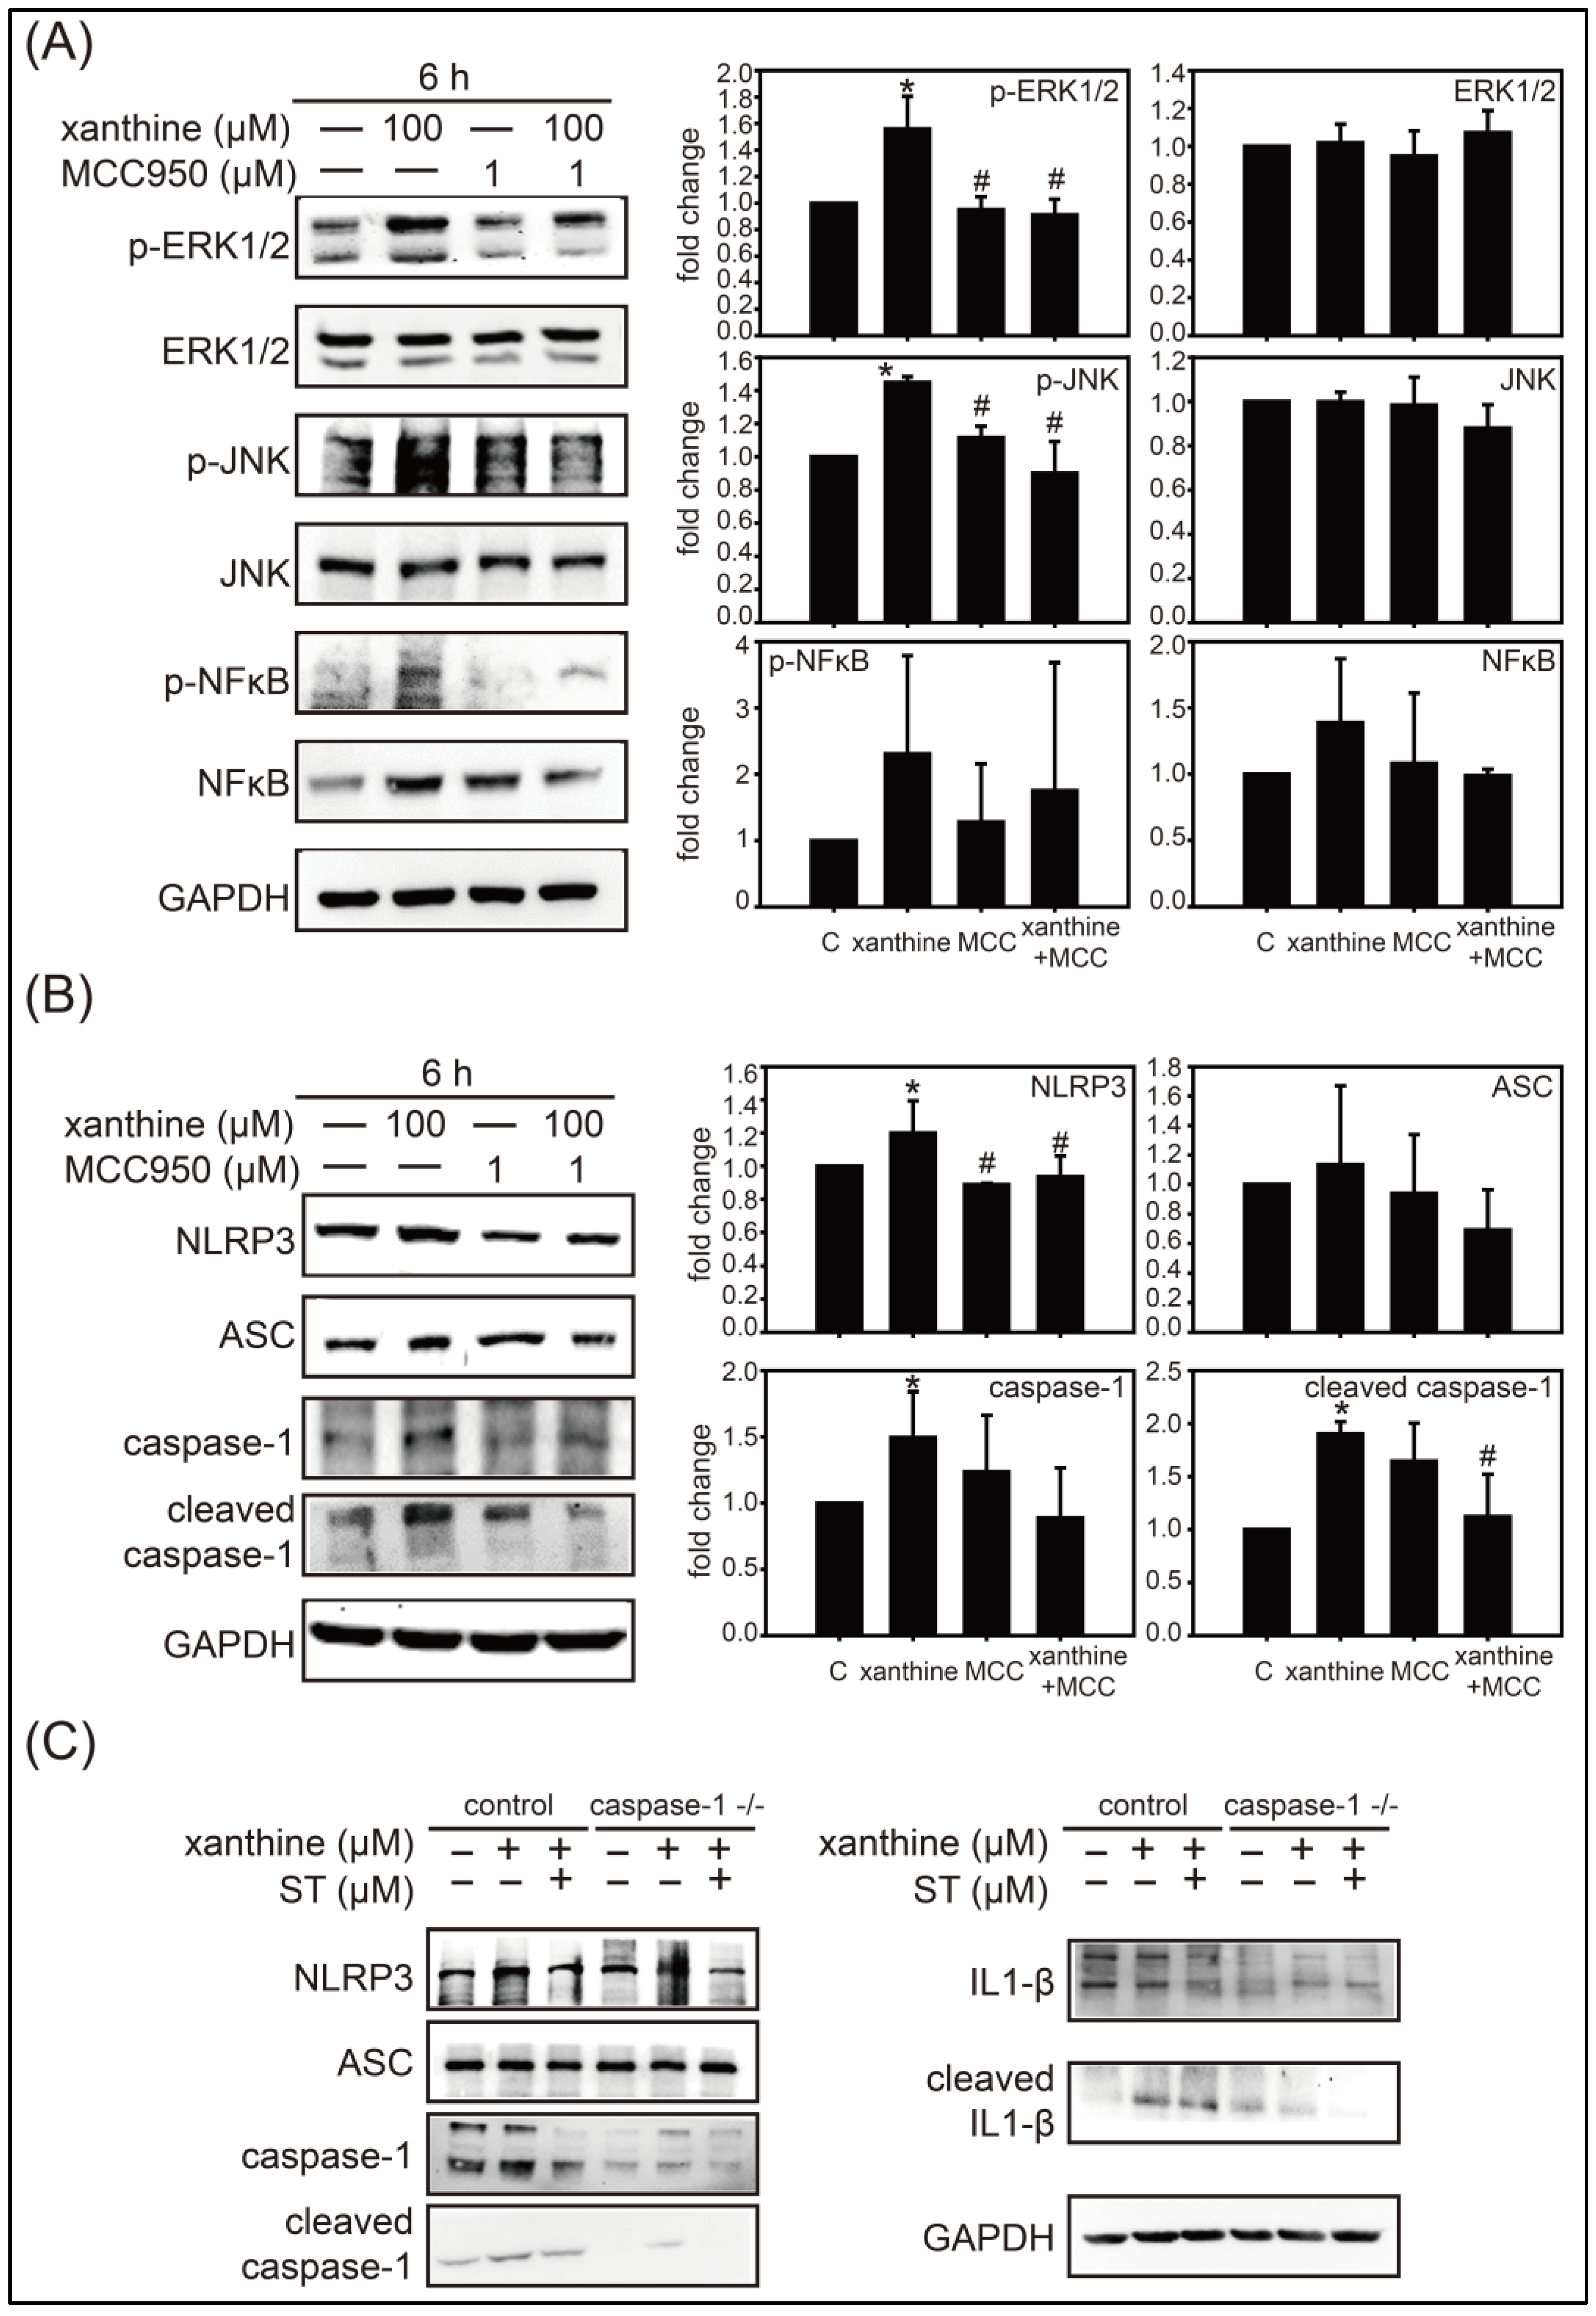
3.2. Inhibition of Strictinin on the ERK1/2, JNK, and Xanthine-Induced NLRP3 Inflammasome Activation
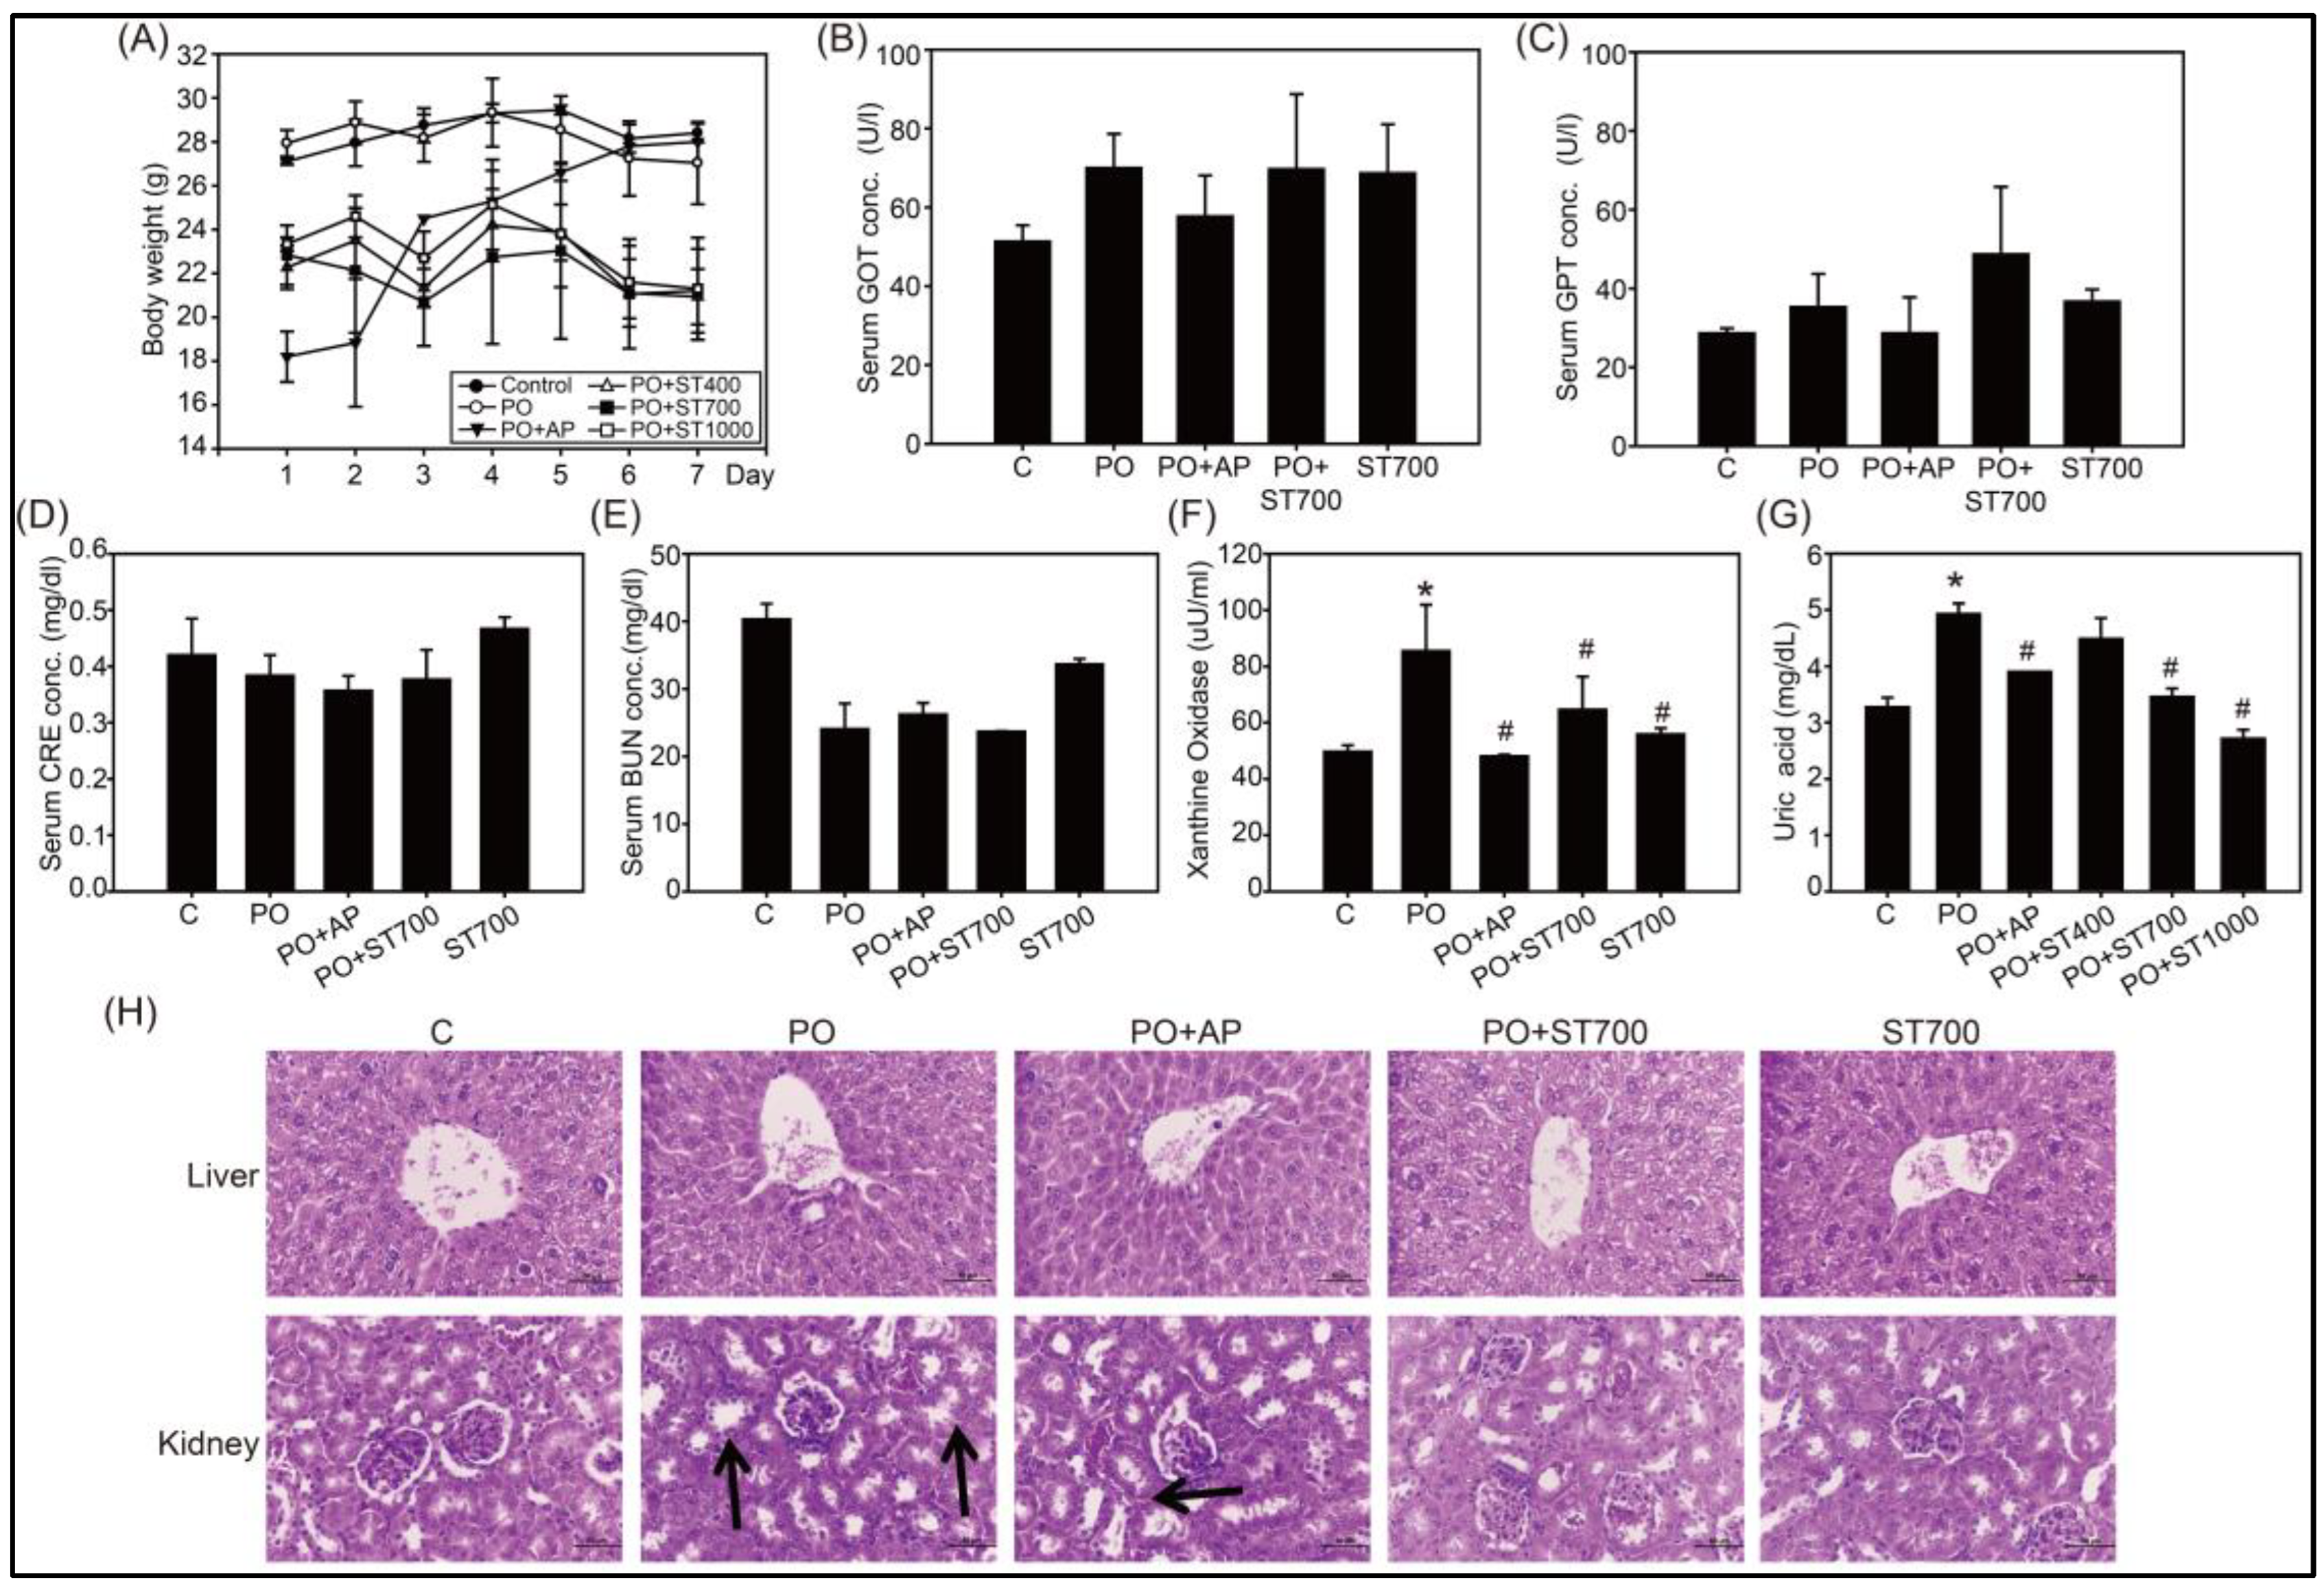
3.3. UA Lowering and XOD Inhibition of Strictinin in Mice Treated with Potassium Oxonate
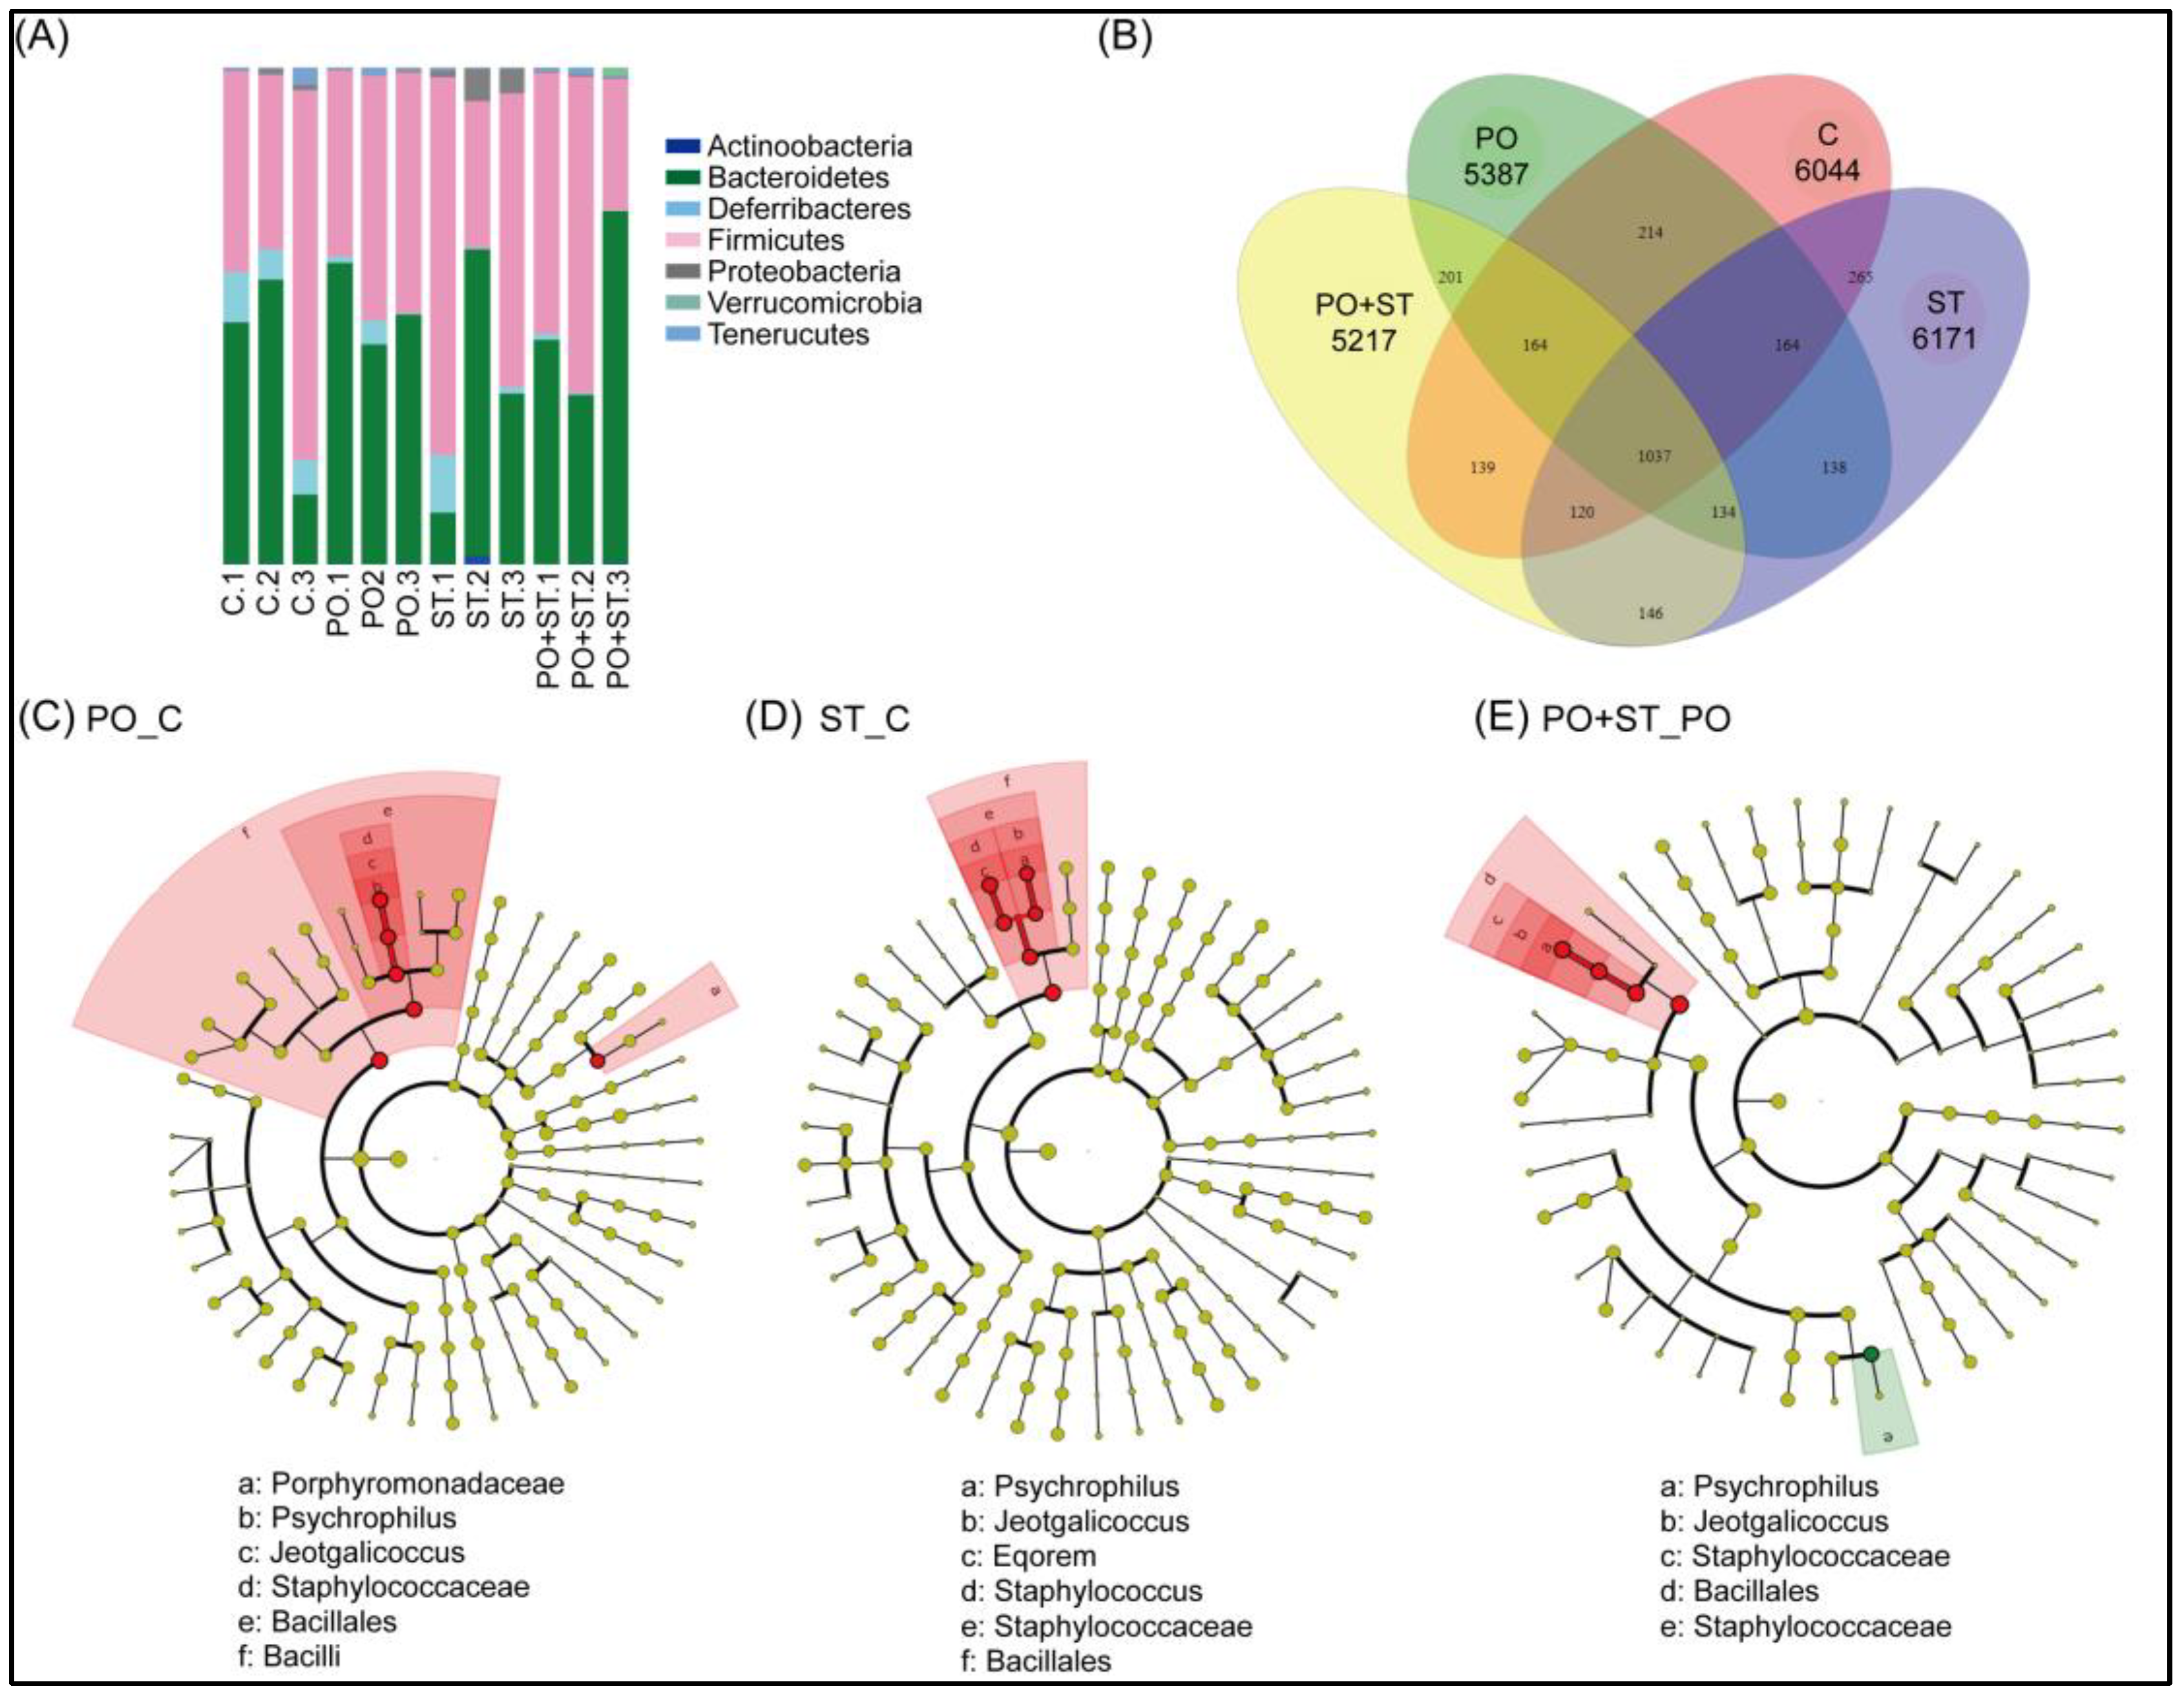
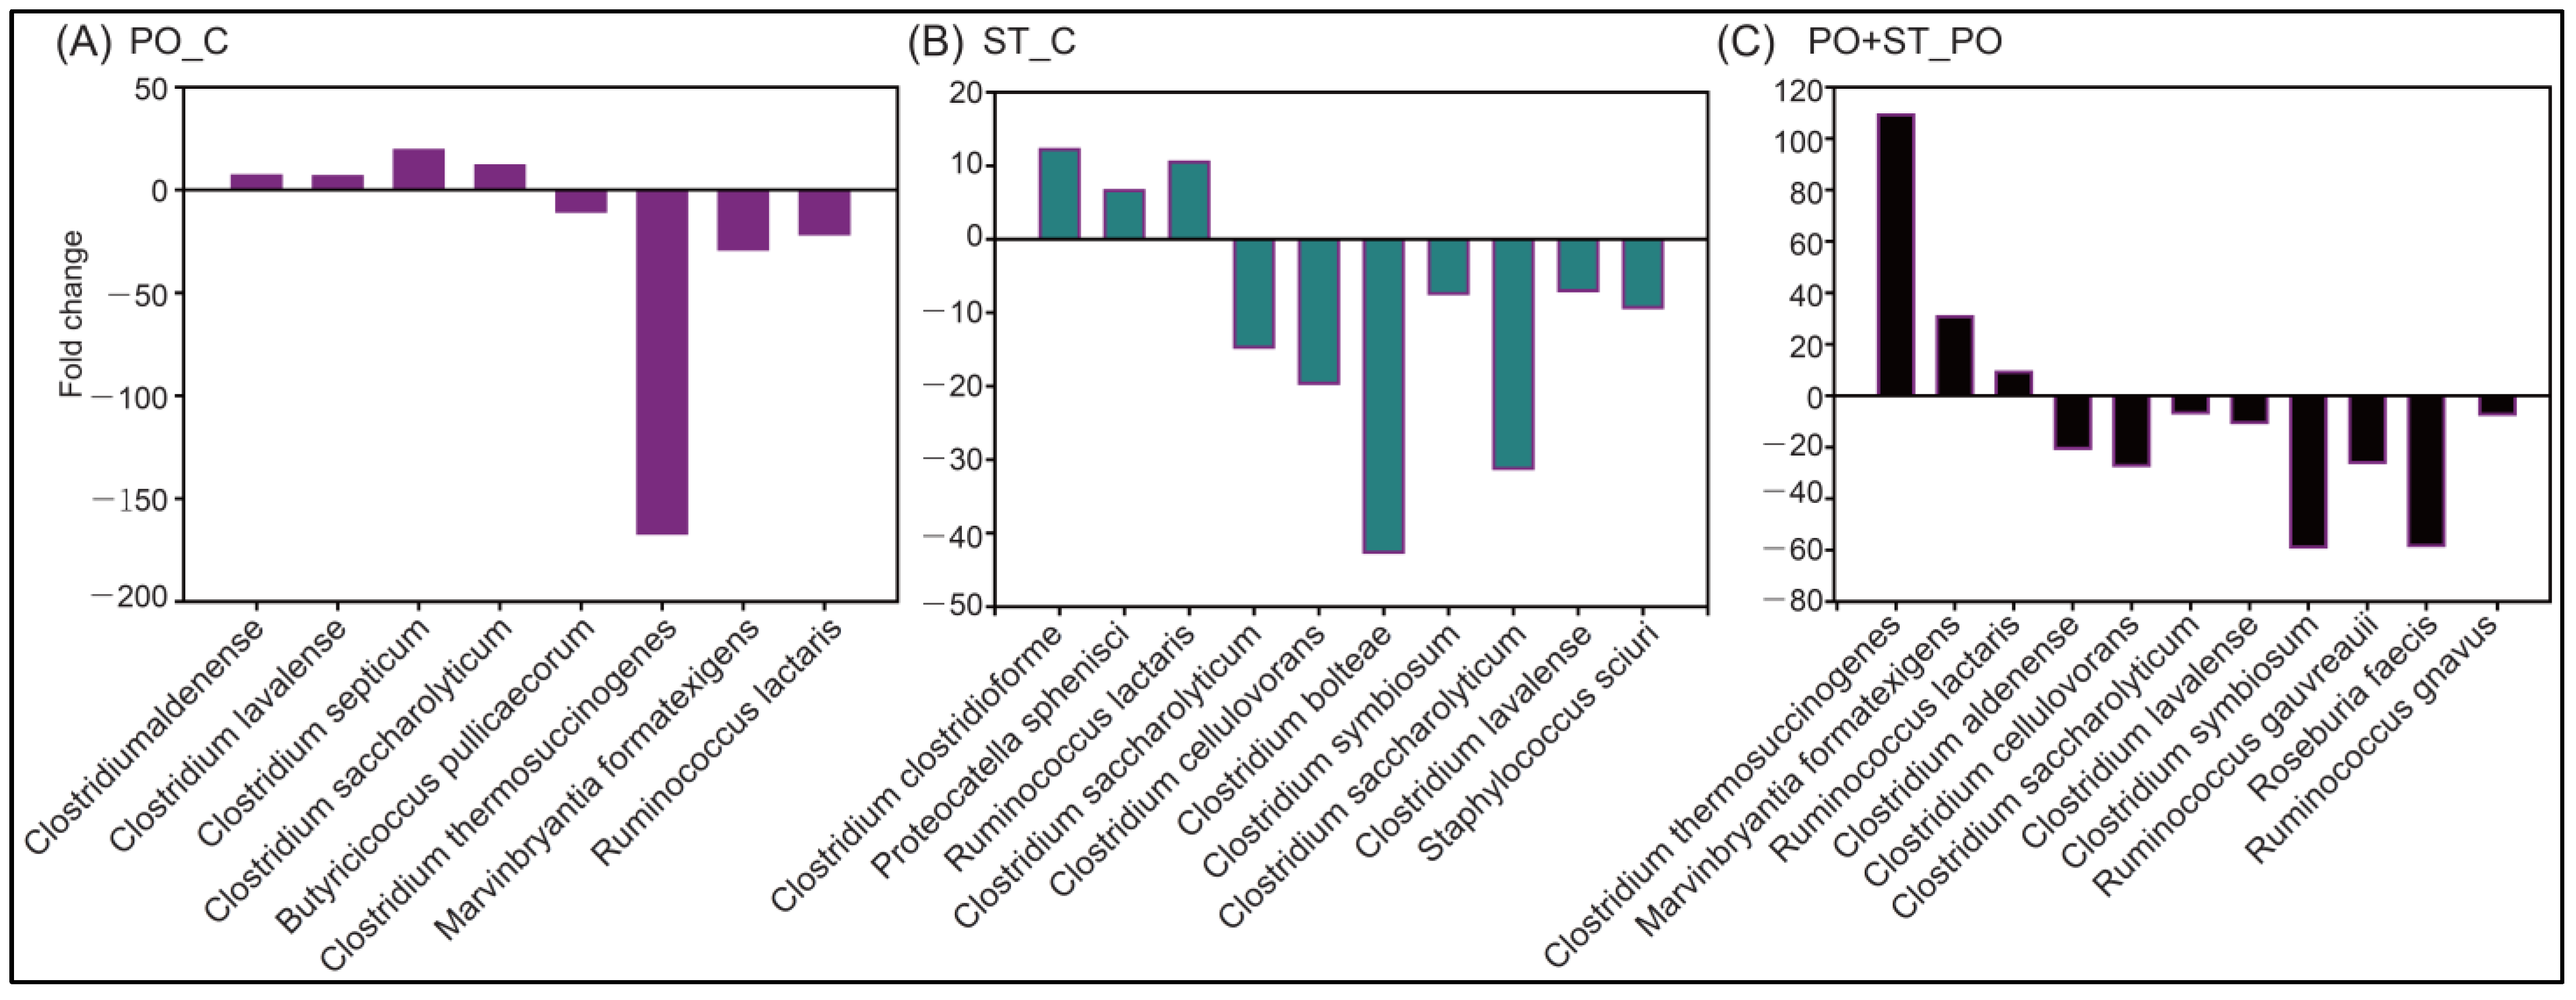
3.4. Beneficial Effects of Strictinin on the Gut Microbiota
4. Discussion
5. Conclusions
Supplementary Materials
Author Contributions
Funding
Institutional Review Board Statement
Informed Consent Statement
Data Availability Statement
Acknowledgments
Conflicts of Interest
References
- Lee, M.S.; Lin, S.C.; Chang, H.Y.; Lyu, L.C.; Tsai, K.S.; Pan, W.H. High prevalence of hyperuricemia in elderly Taiwanese. Asia Pac. J. Clin. Nutr. 2005, 14, 285–292. [Google Scholar] [PubMed]
- Liu, N.; Xu, L.; Shi, Y.; Fang, L.; Gu, H.; Wang, H.; Ding, X.; Zhuang, S. Pharmacologic targeting ERK1/2 attenuates the development and progression of hyperuricemic nephropathy in rats. Oncotarget 2017, 8, 33807–33826. [Google Scholar] [CrossRef]
- Babio, N.; Martínez-González, M.A.; Estruch, R.; Wärnberg, J.; Recondo, J.; Ortega-Calvo, M.; Serra-Majem, L.; Corella, D.; Fitó, M.; Ros, E.; et al. Associations between serum uric acid concentrations and metabolic syndrome and its components in the PREDIMED study. Nutr. Metab. Cardiovasc. Dis. 2015, 25, 173–180. [Google Scholar] [CrossRef] [PubMed]
- Nishikawa, T.; Nagata, N.; Shimakami, T.; Shirakura, T.; Matsui, C.; Ni, Y.; Zhuge, F.; Xu, L.; Chen, G.; Nagashimada, M.; et al. Xanthine oxidase inhibition attenuates insulin resistance and diet-induced steatohepatitis in mice. Sci. Rep. 2020, 10, 815. [Google Scholar] [CrossRef] [PubMed] [Green Version]
- Thottam, G.E.; Krasnokutsky, S.; Pillinger, M.H. Gout and metabolic syndrome: A tangled web. Curr. Rheumatol. Rep. 2017, 19, 60. [Google Scholar] [CrossRef] [PubMed]
- Wang, Y.J.; Chen, Y.Y.; Hsiao, C.M.; Pan, M.H.; Wang, B.J.; Chen, Y.C.; Ho, C.T.; Huang, K.C.; Chen, R.J. Induction of autophagy by pterostilbene contributes to the prevention of renal fibrosis via attenuating NLRP3 inflammasome activation and epithelial-mesenchymal transition. Front. Cell. Dev. Biol. 2020, 8, 436. [Google Scholar] [CrossRef] [PubMed]
- Ishikawa, T.; Aw, W.; Kaneko, K. Metabolic interactions of purine derivatives with human ABC transporter ABCG2: Genetic testing to assess gout risk. Pharmaceuticals 2013, 6, 1347–1360. [Google Scholar] [CrossRef]
- Liu, P.W.; Li, C.I.; Huang, K.C.; Liu, C.S.; Chen, H.L.; Lee, C.C.; Chiou, Y.Y.; Chen, R.J. 3-MCPD and glycidol coexposure induces systemic toxicity and synergistic nephrotoxicity via NLRP3 inflammasome activation, necroptosis, and autophagic cell death. J. Hazard. Mater. 2021, 405, 124241. [Google Scholar] [CrossRef]
- Zhuang, J.; Zhou, X.; Liu, T.; Zhang, S.; Yuan, F.; Zhang, L.; Yang, Z.; Chen, Y. Astaxanthin attenuated hyperuricemia and kidney inflammation by inhibiting uric acid synthesis and the NF-κ B/NLRP3 signaling pathways in potassium oxonate and hypoxanthine-induced hyperuricemia mice. Pharmazie 2021, 76, 551–558. [Google Scholar]
- Wu, L.; Zhou, C.; Wu, J.; Chen, S.; Tian, Z.; Du, Q. Corticosterone inhibits LPS-induced NLRP3 inflammasome priming in macrophages by suppressing xanthine oxidase. Mediat. Inflamm. 2020, 2020, 6959741. [Google Scholar] [CrossRef]
- Nomura, J.; Kobayashi, T.; So, A.; Busso, N. Febuxostat, a xanthine oxidoreductase inhibitor, decreases NLRP3-dependent inflammation in macrophages by activating the purine salvage pathway and restoring cellular bioenergetics. Sci. Rep. 2019, 9, 17314. [Google Scholar] [CrossRef] [Green Version]
- Benn, C.L.; Dua, P.; Gurrell, R.; Loudon, P.; Pike, A.; Storer, R.I.; Vangjeli, C. Physiology of hyperuricemia and urate-lowering treatments. Front. Med. 2018, 5, 160. [Google Scholar] [CrossRef] [PubMed] [Green Version]
- Knake, C.; Stamp, L.; Bahn, A. Molecular mechanism of an adverse drug-drug interaction of allopurinol and furosemide in gout treatment. Biochem. Biophys. Res. Commun. 2014, 452, 157–162. [Google Scholar] [CrossRef] [PubMed]
- Tu, E.C.; Hsu, W.L.; Tzen, J.T.C. Strictinin, a major ingredient in Yunnan kucha tea possessing inhibitory activity on the infection of mouse hepatitis virus to mouse L cells. Molecules 2023, 28, 1080. [Google Scholar] [CrossRef] [PubMed]
- Lin, P.R.; Kuo, P.C.; Li, Y.C.; Jhuo, C.F.; Hsu, W.L.; Tzen, J.T.C. Theacrine and strictinin, two major ingredients for the anti-influenza activity of Yunnan Kucha tea. J. Ethnopharmacol. 2020, 262, 113190. [Google Scholar] [CrossRef]
- Jhuo, C.F.; Hsu, Y.Y.; Chen, W.Y.; Tzen, J.T.C. Attenuation of tumor development in mammary carcinoma rats by theacrine, an antagonist of adenosine 2A receptor. Molecules 2021, 26, 7455. [Google Scholar] [CrossRef]
- Liao, M.H.; Wang, X.R.; Hsu, W.L.; Tzen, J.T.C. Pu’er tea rich in strictinin and catechins prevents biofilm formation of two cariogenic bacteria, Streptococcus mutans and Streptococcus sobrinus. J. Dent. Sci. 2021, 16, 1331–1334. [Google Scholar] [CrossRef]
- Lin, P.Y.; Jhuo, C.F.; Lin, N.H.; Chen, W.Y.; Tzen, J.T.C. Assessing anti-psoriatic effects of bitter Pu’er tea and its three major compounds, strictinin, theacrine and epigallocatechin gallate in Iimiquimod-treated mice. Compounds 2022, 2, 293–306. [Google Scholar] [CrossRef]
- Lin, S.; Zhang, T.; Zhu, L.; Pang, K.; Lu, S.; Liao, X.; Ying, S.; Zhu, L.; Xu, X.; Wu, J.; et al. Characteristic dysbiosis in gout and the impact of a uric acid-lowering treatment, febuxostat on the gut microbiota. J. Genet. Genom. 2021, 48, 781–791. [Google Scholar] [CrossRef]
- Huang, F.; Zheng, X.; Ma, X.; Jiang, R.; Zhou, W.; Zhou, S.; Zhang, Y.; Lei, S.; Wang, S.; Kuang, J.; et al. Theabrownin from Pu-erh tea attenuates hypercholesterolemia via modulation of gut microbiota and bile acid metabolism. Nat. Commun. 2019, 10, 4971. [Google Scholar] [CrossRef] [Green Version]
- Ives, A.; Nomura, J.; Martinon, F.; Roger, T.; LeRoy, D.; Miner, J.N.; Simon, G.; Busso, N.; So, A. Xanthine oxidoreductase regulates macrophage IL1β secretion upon NLRP3 inflammasome activation. Nat. Commun. 2015, 6, 6555. [Google Scholar] [CrossRef] [PubMed] [Green Version]
- Johnson, R.J.; Bakris, G.L.; Borghi, C.; Chonchol, M.B.; Feldman, D.; Lanaspa, M.A.; Merriman, T.R.; Moe, O.W.; Mount, D.B.; Sanchez Lozada, L.G.; et al. Hyperuricemia, acute and chronic kidney disease, hypertension, and cardiovascular disease: Report of a scientific workshop organized by the National Kidney Foundation. Am. J. Kidney Dis. 2018, 71, 851–865. [Google Scholar] [CrossRef] [PubMed]
- Chen, R.J.; Chen, M.H.; Chen, Y.L.; Hsiao, C.M.; Chen, H.M.; Chen, S.J.; Wu, M.D.; Yech, Y.J.; Yuan, G.F.; Wang, Y.J. Evaluating the urate-lowering effects of different microbial fermented extracts in hyperuricemic models accompanied with a safety study. J. Food Drug Anal. 2017, 25, 597–606. [Google Scholar] [CrossRef] [PubMed]
- Estiverne, C.; Mandal, A.K.; Mount, D.B. Molecular pathophysiology of uric acid homeostasis. Semin. Nephr. 2020, 40, 535–549. [Google Scholar] [CrossRef]
- Yu, X.; Zhang, L.; Zhang, P.; Zhi, J.; Xing, R.; He, L. Lycium barbarum polysaccharides protect mice from hyperuricaemia through promoting kidney excretion of uric acid and inhibiting liver xanthine oxidase. Pharm. Biol. 2020, 58, 944–949. [Google Scholar] [CrossRef]
- Edwards, N.L. Febuxostat: A new treatment for hyperuricaemia in gout. Rheumatology 2009, 48 (Suppl. S2), ii15–ii19. [Google Scholar] [CrossRef] [Green Version]
- Xu, L.; Lin, G.; Yu, Q.; Li, Q.; Mai, L.; Cheng, J.; Xie, J.; Liu, Y.; Su, Z.; Li, Y. Anti-hyperuricemic and nephroprotective effects of dihydroberberine in potassium oxonate- and hypoxanthine-induced hyperuricemic mice. Front. Pharmacol. 2021, 12, 645879. [Google Scholar] [CrossRef]
- Ma, Y.; Wang, Y.; Zhang, H.; Sun, W.; Li, Z.; Zhang, F.; Zhang, H.; Chen, F.; Zhang, H.; An, J.; et al. Antimicrobial mechanism of strictinin isomers extracted from the root of Rosa roxburghii Tratt (Ci Li Gen). J. Ethnopharmacol. 2020, 250, 112498. [Google Scholar] [CrossRef]
- Zhou, B.; Yang, L.; Liu, Z.L. Strictinin as an efficient antioxidant in lipid peroxidation. Chem. Phys. Lipids 2004, 131, 15–25. [Google Scholar] [CrossRef]
- Bent, R.; Moll, L.; Grabbe, S.; Bros, M. Interleukin-1 Beta—A friend or foe in malignancies? Int. J. Mol. Sci. 2018, 19, 2155. [Google Scholar] [CrossRef] [Green Version]
- Fultang, N.; Illendula, A.; Chen, B.; Wu, C.; Jonnalagadda, S.; Baird, N.; Klase, Z.; Peethambaran, B. Strictinin, a novel ROR1-inhibitor, represses triple negative breast cancer survival and migration via modulation of PI3K/AKT/GSK3ß activity. PLoS ONE 2019, 14, e0217789. [Google Scholar] [CrossRef] [PubMed]
- Takayama, S.; Kawanishi, M.; Yamauchi, K.; Tokumitsu, D.; Kojima, H.; Masutani, T.; Iddamalgoda, A.; Mitsunaga, T.; Tanaka, H. Ellagitannins from Rosa roxburghii suppress poly(I:C)-induced IL-8 production in human keratinocytes. J. Nat. Med. 2021, 75, 623–632. [Google Scholar] [CrossRef] [PubMed]
- Si, K.; Wei, C.; Xu, L.; Zhou, Y.; Lv, W.; Dong, B.; Wang, Z.; Huang, Y.; Wang, Y.; Chen, Y. Hyperuricemia and the risk of heart failure: Pathophysiology and therapeutic implications. Front. Endocrinol. 2021, 12, 770815. [Google Scholar] [CrossRef] [PubMed]
- O’Hara, A.M.; Shanahan, F. The gut flora as a forgotten organ. EMBO Rep. 2006, 7, 688–693. [Google Scholar] [CrossRef] [PubMed] [Green Version]
- Liu, X.; Lv, Q.; Ren, H.; Gao, L.; Zhao, P.; Yang, X.; Yang, G.; Xu, D.; Wang, G.; Yang, W.; et al. The altered gut microbiota of high-purine-induced hyperuricemia rats and its correlation with hyperuricemia. PeerJ 2020, 8, e8664. [Google Scholar] [CrossRef]
- Kudo, M.; Uchida, T.; Sakano, T.; Matono, T. A colon cancer-related, Clostridium septicum-infected, aortic aneurysm. Intern. Med. 2021, 60, 3189–3190. [Google Scholar] [CrossRef]
- Zeng, Q.; Li, D.; He, Y.; Li, Y.; Yang, Z.; Zhao, X.; Liu, Y.; Wang, Y.; Sun, J.; Feng, X.; et al. Discrepant gut microbiota markers for the classification of obesity-related metabolic abnormalities. Sci. Rep. 2019, 9, 13424. [Google Scholar] [CrossRef] [Green Version]
- Yuan, X.; Chen, R.; Zhang, Y.; Lin, X.; Yang, X. Altered gut microbiota in children with hyperuricemia. Front. Endocrinol. 2022, 13, 848715. [Google Scholar] [CrossRef]
- Williams, O.M.; Brazier, J.; Peraino, V.; Goldstein, E.J. A review of three cases of Clostridium aldenense bacteremia. Anaerobe 2010, 16, 475–477. [Google Scholar] [CrossRef]
- Garceau, R.; Bourque, C.; Thibault, L.; Côté, J.C.; Longtin, J.; Domingo, M.C. First report of Clostridium lavalense isolated in human blood cultures. Can. J. Infect. Dis. Med. Microbiol. 2016, 2016, 7231805. [Google Scholar] [CrossRef] [Green Version]
- Speers, A.M.; Young, J.M.; Reguera, G. Fermentation of glycerol into ethanol in a microbial electrolysis cell driven by a customized consortium. Environ. Sci. Technol. 2014, 48, 6350–6358. [Google Scholar] [CrossRef] [PubMed]
- Goldstein, E.J.; Citron, D.M.; Warren, Y.A.; Tyrrell, K.L.; Merriam, C.V.; Fernandez, H. In vitro activity of moxifloxacin against 923 anaerobes isolated from human intra-abdominal infections. Antimicrob. Agents Chemother. 2006, 50, 148–155. [Google Scholar] [CrossRef] [Green Version]
- Chen, T.Y.; Wang, M.M.C.; Hsieh, S.K.; Hsieh, M.H.; Chen, W.Y.; Tzen, J.T.C. Pancreatic lipase inhibition of strictinin isolated from Pu’er tea (Cammelia sinensis) and its anti-obesity effects in C57BL6 mice. J. Func. Foods 2018, 48, 1–8. [Google Scholar] [CrossRef]
- Yoshikawa, T.; Minaga, K.; Hara, A.; Sekai, I.; Kurimoto, M.; Masuta, Y.; Otsuka, Y.; Takada, R.; Kamata, K.; Park, A.M.; et al. Disruption of the intestinal barrier exacerbates experimental autoimmune pancreatitis by promoting the translocation of Staphylococcus sciuri into the pancreas. Int. Immunol. 2022, 34, 621–634. [Google Scholar] [CrossRef]
- Lu, X.; Liu, J.; Zhang, N.; Fu, Y.; Zhang, Z.; Li, Y.; Wang, W.; Li, Y.; Shen, P.; Cao, Y. Ripened Pu-erh tea extract protects mice from obesity by modulating gut microbiota composition. J. Agric. Food Chem. 2019, 67, 6978–6994. [Google Scholar] [CrossRef] [PubMed]
- Zhang, Z.; He, F.; Yang, W.; Yang, L.; Huang, S.; Mao, H.; Hou, Y.; Xiao, R. Pu-erh tea extraction alleviates intestinal inflammation in mice with flora disorder by regulating gut microbiota. Food Sci. Nutr. 2021, 9, 4883–4892. [Google Scholar] [CrossRef] [PubMed]
- Henke, M.T.; Kenny, D.J.; Cassilly, C.D.; Vlamakis, H.; Xavier, R.J.; Clardy, J. Ruminococcus gnavus, a member of the human gut microbiome associated with Crohn's disease, produces an inflammatory polysaccharide. Proc. Natl. Acad. Sci. USA 2019, 116, 12672–12677. [Google Scholar] [CrossRef] [Green Version]
- Tamanai-Shacoori, Z.; Smida, I.; Bousarghin, L.; Loreal, O.; Meuric, V.; Fong, S.B.; Bonnaure-Mallet, M.; Jolivet-Gougeon, A. Roseburia spp.: A marker of health? Future Microbiol. 2017, 12, 157–170. [Google Scholar] [CrossRef]


Disclaimer/Publisher’s Note: The statements, opinions and data contained in all publications are solely those of the individual author(s) and contributor(s) and not of MDPI and/or the editor(s). MDPI and/or the editor(s) disclaim responsibility for any injury to people or property resulting from any ideas, methods, instructions or products referred to in the content. |
© 2023 by the authors. Licensee MDPI, Basel, Switzerland. This article is an open access article distributed under the terms and conditions of the Creative Commons Attribution (CC BY) license (https://creativecommons.org/licenses/by/4.0/).
Share and Cite
Huang, K.-C.; Chang, Y.-T.; Pranata, R.; Cheng, Y.-H.; Chen, Y.-C.; Kuo, P.-C.; Huang, Y.-H.; Tzen, J.T.C.; Chen, R.-J. Alleviation of Hyperuricemia by Strictinin in AML12 Mouse Hepatocytes Treated with Xanthine and in Mice Treated with Potassium Oxonate. Biology 2023, 12, 329. https://doi.org/10.3390/biology12020329
Huang K-C, Chang Y-T, Pranata R, Cheng Y-H, Chen Y-C, Kuo P-C, Huang Y-H, Tzen JTC, Chen R-J. Alleviation of Hyperuricemia by Strictinin in AML12 Mouse Hepatocytes Treated with Xanthine and in Mice Treated with Potassium Oxonate. Biology. 2023; 12(2):329. https://doi.org/10.3390/biology12020329
Chicago/Turabian StyleHuang, Kuo-Ching, Yu-Ting Chang, Rosita Pranata, Yung-Hsuan Cheng, Yu-Chi Chen, Ping-Chung Kuo, Yi-Hsuan Huang, Jason T. C. Tzen, and Rong-Jane Chen. 2023. "Alleviation of Hyperuricemia by Strictinin in AML12 Mouse Hepatocytes Treated with Xanthine and in Mice Treated with Potassium Oxonate" Biology 12, no. 2: 329. https://doi.org/10.3390/biology12020329