Article

Photoautotrophic Growth Rate Enhancement of Synechocystis sp. PCC6803 by Heterologous Production of 2-Oxoglutarate:Ferredoxin Oxidoreductase from Chlorobaculum tepidum

1
Department of Life Science, Sogang University, Seoul 121-742, Republic of Korea
2
Microbial Research Department, Nakdonggang National Institute of Biological Resources, Sangju 37242, Republic of Korea
*
Authors to whom correspondence should be addressed.
Biology 2023, 12(1), 59; https://doi.org/10.3390/biology12010059
Submission received: 30 November 2022 / Revised: 27 December 2022 / Accepted: 27 December 2022 / Published: 29 December 2022
(This article belongs to the Section Biochemistry and Molecular Biology)

Abstract

:

Simple Summary

Synechocystis sp. PCC6803 (Synechocystis) is a photosynthetic organism useful for biotechnological applications. It utilizes light energy and fixes CO2 to synthesize C3 organic acids for growth and biomass formation. However, carbon fixation is the limiting step for its maximal growth. To enhance the carbon fixation, 2-oxoglutarate:ferredoxin oxidoreductase from Chlorobaculum tepidum (CtOGOR)—a carbon-fixing enzyme in the reductive TCA cycle—was produced in trans in Synechocystis. Overexpression of the CtOGOR gene effectively altered 2-oxoglutarate and glutamate levels and elevated the photoautotrophic growth rate of Synechocystis.

Abstract

2-Oxoglutarate:ferredoxin oxidoreductase from Chlorobaculum tepidum (CtOGOR) is a carbon-fixing enzyme in the reductive TCA cycle that reversibly carboxylates succinyl-CoA to yield 2-oxoglutarate. CtOGOR is a heterotetramer of two large (α = 68 kDa) and two small (β = 38 kDa) subunits. The αβ protomer harbors one thiamine pyrophosphate and two 4Fe-4S clusters. Nonetheless, the enzyme has a considerable oxygen tolerance with a half-life of 143 min at 215 μM dissolved oxygen. Kinetic analyses of the purified recombinant CtOGOR revealed a lower Km for succinyl-CoA than for 2-oxoglutarate. Cellular levels of 2-oxoglutarate and glutamate—a product of glutamine oxoglutarate aminotransferase and glutamate dehydrogenase—increased more than twofold in the exponential phase compared with the control strain, leading to an approximately >30% increase in the photoautotrophic growth rate. Thus, CtOGOR was successfully produced in Synechocystis, thereby boosting carboxylation, resulting in enhanced photoautotrophic growth.

Graphical Abstract

1. Introduction

Chorobaculum tepidum is a photosynthetic bacterium that possesses a reductive TCA (rTCA) cycle for carbon fixation [1,2]. Among the carbon-fixing enzymes responsible for critical steps of the rTCA cycle, it possesses 2-oxoglutarate:ferredoxin oxidoreductase (OGOR, also known as KGOR or KFOR), which is classified under the 2-oxoacid:ferredoxin oxidoreductase (OFOR) superfamily. It catalyzes the bidirectional carboxylation/decarboxylation reaction between succinyl-CoA and 2-oxoglutarate (Figure 1). OGORs from diverse species have been previously studied [3,4,5,6,7,8]. OGORs commonly contain the [4Fe-4S] cluster and thiamine pyrophosphate (TPP), although the number of each cofactor varies [3,4,5,6,7,8]. Due to the (4Fe-4S) cluster, the OFOR superfamily of enzymes is generally vulnerable to oxygen exposure [9]. OGOR from C. tepidum (CtOGOR) consists of a large subunit (CtOGOR-A, α-subunit, KorA) and small subunit (CtOGOR-B, β-subunit, KorB) [1].
Synechocystis sp. PCC6803 (hereafter Synechocystis) is a phototrophic cyanobacterium that depends on ribulose-1,5-bisphosphate carboxylase-oxygenase (RuBisCO) for carbon fixation. Recently, Synechocystis has attracted considerable attention for its light-utilizing biotechnological applications [10]. Similar to plants and other phototrophic organisms, carbon fixation is a rate-limiting step for the effective production of Synechocystis biomass because of the low turnover rate (approximately 3.3 s−1 in spinach, 9–14 s−1 in Synechocystis) and low substrate specificity of RuBisCO [10,11,12,13,14]. Accordingly, several studies have been conducted to increase the carbon fixation rate by overexpressing RuBisCO and other enzymes in the Calvin-Benson-Bassham (CBB) cycle to increase the yield of biomass and carbonaceous product [15,16,17].
Here, we biochemically characterized CtOGOR and heterologously produced it in Synechocystis to promote carbon fixation. The product of CtOGOR is 2-oxoglutarate, which is readily (trans)aminated to glutamate by either glutamine oxoglutarate aminotransferase (GOGAT) or glutamate dehydrogenase (GDH). Considering the metabolic flux levels leading to biomass, glutamate is known to greatly enhance the biomass yield of Synechocystis [18].

2. Materials and Methods

2.1. Bacterial Strains and Growth Conditions

For photoautotrophic growth, Synechocystis was cultured in BG-11 minimal medium [19] at 30 °C. The culture was agitated by a shaking incubator at 130 rpm in 250-mL Erlenmeyer flasks under fluorescent light of 40 μmole·m−2·s−1. Escherichia coli was cultured at 37 °C in Luria-Bertani (LB) medium [20] with agitation at 250 rpm. Antibiotics were added to the medium when necessary, at the following concentrations: For Synechocystis, gentamicin (Gm) was added at 30 μg/mL; For E. coli, ampicillin (Ap) and Gm were added at 50 and 30 μg/mL, respectively.

2.2. Construction of Plasmids and Their Mobilization into Synechocystis

All plasmids were constructed in E. coli DH5αphe [21]. korA (CT0163) and korB (CT0162), which encode the α and β subunits of CtOGOR, respectively, are clustered around a 3-bp gap in the genome of C. tepidum. The open reading frames (ORFs) of the genes were synthesized using optimized codons for E. coli. The synthesized korA fragment was flanked by XhoI and HindIII sites. The korB fragment was flanked by HindIII and EcoRI sites with a strep-tag sequence (5′-TGGAG CCACC CGCAG TTCGA AAAA-3′) between the penultimate and stop codons. Both fragments were cloned into XhoI and EcoRI sites of pRSET-A (Invitrogen, Waltham, MA, USA) to form pRSET-ogor, and N-terminal His6-tagged CtOGOR-A and C-terminal strep-tagged CtOGOR-B were produced in E. coli. In the pRSET-ogor, the gap between korA and korB was 6-bp and the ribosomal binding site of korB in korA (the region including the last 20 bp sequence of korA ORF) was the same as the original genomic DNA sequence.
The korAB fragment in pRSET-ogor was PCR-amplified using the primer set 5′-AAAAA ACTCG AGGAA GGAGA TATAC AAATG AGTGA TACCG TAATC-3′ and 5′-AAAAA AGAAT TCTTA ATTAA TGGTC CACGT GCT-3′, followed by digestion with XhoI and EcoRI and cloned into the same sites of pSL1211 [22], resulting in pSL-ogor. pSL-ogor produced CtOGOR which is free of His6- or strep-tags, following isopropyl β-D-1-thiogalactopyranoside (IPTG) induction in Synechocystis. pSL-ogor was mobilized into Synechocystis via conjugation with E. coli S17-1 [23] carrying pSL-ogor, as described previously [24].
To purify ferredoxin-NADP+ reductase (FNR) and ferredoxin (Fd) of Synechocystis from E. coli, the ORF of FNR (slr1643) was PCR-amplified from the genomic DNA of Synechocystis using the primer set 5′-AAAAA AGGAT CCATG TACAG TCCCG GTTAC-3′ and 5′-AAAAA AAAGC TTTTA GTAGG TTTCC ACGTG-3′, and that of Fd (slr1382) was amplified with the primer set 5′-AAAAA AGGAT CCATG TCCCG TTCCC ACCGA-3′ and 5′-AAAAA AAAGC TTCTA GTCCT CATCT AAAGG C-3′. FNR and Fd gene fragments were digested with BamHI/HindIII and ligated into the same sites of pQE30 (Qiagen, Hilden, Germany), resulting in pQE-fnr and pQE-fd, respectively.
To purify Synechocystis isocitrate dehydrogenase (Icd) in E. coli, ORF of Icd (slr1289) was PCR-amplified from the genomic DNA of Synechocystis using the primer set 5′-AAAAA AGGAT CCATG TACGA AAAAC TTCAG-3′ and 5′-AAAAA AAAGC TTTTA ATCAT CGAAA TGACT-3′, followed by digestion with BamHI/HindIII and subsequent ligation into the same sites of pRSET-A, resulting in pRSET-icd.
To purify aminolevulinic acid synthase (ALAS) of Rhodobacter sphaeroides 2.4.1, the ORF (RSP_2984) without a stop codon was amplified from the genomic DNA of R. sphaeroides 2.4.1 using the primer set 5′-AAAAA ACATA TGGAC TACAA TCTGG CACT-3′ and 5′-AAAAA AAAGC TTGGC AACGA CCTCG GCGCG AT-3’. The fragment was digested with NdeI/HindIII and ligated into the same sites of pET29a (Merck, Darmstadt, Germany), resulting in pET-alas.

2.3. Purification of Recombinant Enzymes from E. coli

To purify CtOGOR, E. coli BL21 (DE3) (Stratagene, San Diego, CA, USA) transformed with pRSET-ogor was cultivated at 37 °C and agitated at 250 rpm to an OD600 of 0.6. IPTG (1 mM) was added to the culture medium, followed by incubation at 30 °C for 18 h with agitation at 250 rpm. All the following procedures were conducted in an anaerobic chamber (Model 10; Coy Laboratory Products, Grass Lake, MI, USA) filled with a gas mix of 90% N2/5% H2/5% CO2. The cells were harvested by centrifugation at 6000× g at 4 °C for 10 min and resuspended in Buffer-A (50 mM Na2HPO4 (pH 8.0), 300 mM NaCl, 10 mM imidazole). The cells were lysed by sonication (5 min lysis/5 min rest, 3 cycles, on ice), followed by centrifugation at 8000× g at 4 °C for 10 min to obtain the lysate. The lysate was loaded onto Ni-NTA agarose resin (Qiagen) and washed with five resin volumes of Buffer-A (His-tag affinity purification). The enzyme was eluted using Buffer-A supplemented with 240 mM imidazole. The purity of the CtOGOR in the eluate was >99%.
For further purification and assessment of the native molecular mass, the eluted CtOGOR was subjected to gel-filtration chromatography. The sample was loaded into SuperdexTM 200 prep-grade resin (Cytiva, Emeryville, CA, USA) with dimensions of 10 mm/300 mm (diameter/height). The column was eluted with 50 mM Na2HPO4 (pH 8.0) containing 300 mM NaCl at a flow rate of 0.25 mL/min, and the absorbance at 280 nm was recorded. Thyroglobulin (669 kDa; cat. #. T1001; Sigma-Aldrich, St. Louis, MO, USA), ferritin (480 kDa; cat. #. F4503; Sigma-Aldrich), catalase (240 kDa; cat. #. C9322; Sigma-Aldrich), albumin (67 kDa; cat. #. A2153; Sigma-Aldrich), and cytochrome c (12.3 kDa; cat. #. C7150; Sigma-Aldrich) were used as size standards. Western blotting of purified CtOGOR with antibodies against His6- and strep-tags was performed as described previously [25]. E. coli BL21 (DE3) transformed with pQE-fnr, pQE-fd, pRSET-icd and pET-alas was used for the purification of FNR, Fd, Icd, and ALAS, respectively, using His-tag affinity purification.

2.4. Reconstitution and Determination of Cofactors in CtOGOR

The iron-sulfur clusters of CtOGOR were reconstituted using cysteine desulfurase (IscS), as previously described [25,26]. After reconstitution of the iron-sulfur cluster, TPP was added at a 10-fold concentration of CtOGOR and incubated at 4 °C for 1 h. The sample was dialyzed against 50 mM Na2HPO4 (pH 7.5) at 4 °C for 24 h. The iron [27], labile sulfur [28], and TPP [29] contents were determined as previously described. The amount of CtOGOR was quantified using the Lowry assay [30].

2.5. Kinetic Analyses of Enzymes

All reactions were performed under anaerobic conditions at 30 °C. The basal mix contained 50 mM Na2HPO4 (pH 7.5), 1 mM MgCl2, 1 mM DTT, 1 mM TPP, 0.1 μM FNR, 1 μM Fd, and 0.2 μM CtOGOR (reconstituted with iron-sulfur cluster and TPP). In the carboxylation reaction, 0.01–0.1 mM succinyl-CoA with 50 mM sodium bicarbonate (fixed), or 5–50 mM sodium bicarbonate with 0.5 mM succinyl-CoA (fixed) were added to the basal mix. The reactions were initiated by adding 0.15 mM NADPH, and the decrease in A340 was recorded. In the decarboxylation reaction, 0.1–10 mM disodium 2-oxoglutarate with 0.5 mM CoA (fixed), or 0.01–0.1 mM CoA with 5 mM disodium 2-oxoglutarate (fixed) were added to the basal mix. The reactions were initiated by adding 0.15 mM NADP+ and the increase in A340 was recorded. The initial velocities were calculated from the changes in A340. The datasets were fitted to Michaelis-Menten equation to determine the kinetic parameters using SigmaPlot ver. 14 (Systat Software, San Jose, CA, USA). Initial concentrations of CO2 were estimated from those of sodium bicarbonate by using pKa of 6.11 in equilibrium between CO2 and HCO3 [31,32].
The kinetic analysis of Icd was performed in 10 mM HEPES (pH 8.0) containing 40 mM MgCl2 and 2 nM Icd. In the carboxylation reaction, 0.2–1.6 mM disodium 2-oxoglutarate with 50 mM sodium bicarbonate (fixed), or 5–40 mM sodium bicarbonate with 5 mM disodium 2-oxoglutarate (fixed) were added, which were initiated by adding 0.15 mM NADPH. In the decarboxylation reaction, 0.1–0.8 mM trisodium isocitrate and 0.15 mM NADP+ were added. The initial velocities were calculated from the changes in the A340. All analyses were performed as described for CtOGOR. Initial concentrations of CO2 were estimated from those of sodium bicarbonate using a pKa of 6.11 in equilibrium between CO2 and HCO3 [31,32].

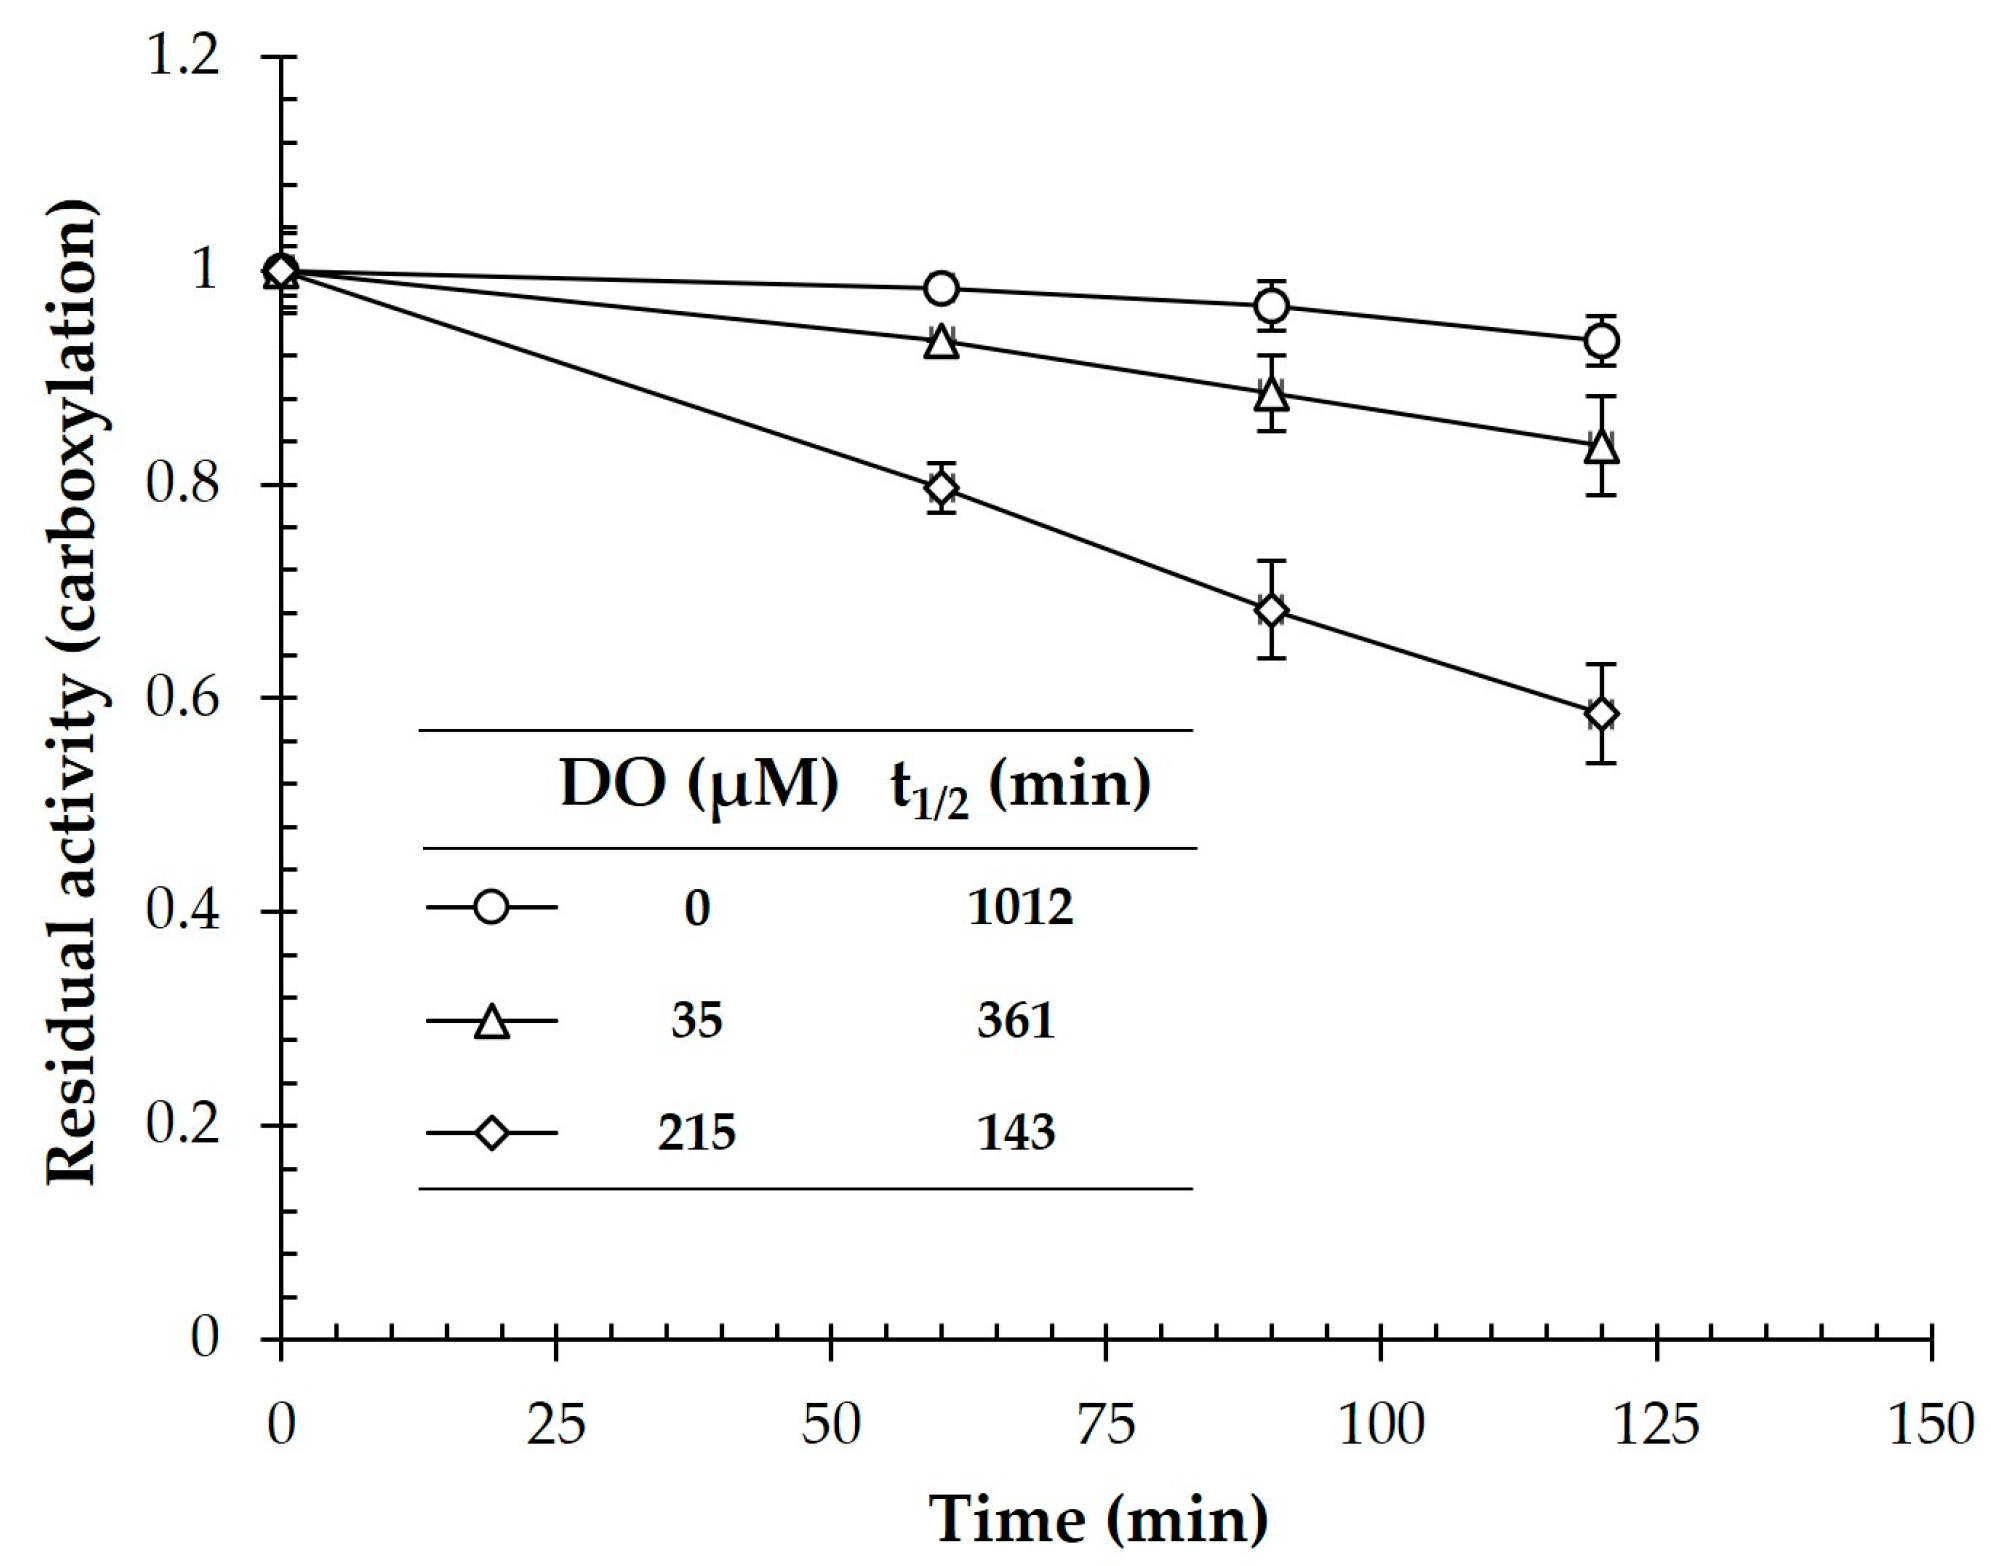
2.6. Assessment of O2 Stability of CtOGOR

The 50 mM Na2HPO4 (pH 7.5) buffer was pre-equilibrated with gas mixtures containing varying levels of O2, as previously described [33]. The purified CtOGOR was incubated in the buffers and aliquots were taken intermittently to determine the residual carboxylation activity, as mentioned earlier.

2.7. Total RNA Extraction and Quantitative Reverse Transcription PCR (RT-qPCR)

The procedures and reagents for total RNA extraction and RT qPCR were essentially the same as those previously described [25]. The transcript level of korB was determined using the primer set 5′-GGAGC TTTTA GAGCC TTCTC-3′ and 5′-CTCTT TTCGA GGTCA ATCAC-3′. The expression of rbcL (slr0012) was determined using the primer set 5′-TTGGA CTGAC AACCT AACTG-3′ and 5′-ATACG TTACC GACCA AAGAG-3′. The 16S rRNA gene (rrn16Sa) was used as a reference gene and was amplified by the primer set 5′-TACAG TAGGG GTAGC AGGAA-3′ and 5′-GGCTA GGACT ACAGG GGTAT-3′. Relative changes in transcript levels were assessed using the comparative CT method [34].

2.8. Preparation and Spectral Analysis of the Membrane Fraction

Cells harvested during the exponential phase were resuspended in 10 mM phosphate-buffered saline (PBS) at pH 7.4 and lysed by sonication. After centrifugation at 6000× g and 4 °C for 10 min, the supernatant was decanted to perform ultracentrifugation at 150,000× g and 4 °C for 1 h. Then, the resulting pellet was resuspended in PBS supplemented with 1% (w/v) n-dodecyl β-D-maltoside and mixed by inverting at 4 °C for 1 h. Insoluble materials were removed by centrifugation at 12,000× g and 4 °C for 5 min. The supernatant (membrane fraction) was subjected to absorption spectrum measurements using a UV-Vis spectrophotometer (UV 2550; Shimadzu, Kyoto, Japan).

2.9. Determination of Cellular Enzyme Activity

The cellular carboxylation activity of OGOR was determined as described above in the kinetic analyses of the enzyme sections, which were also performed under anaerobic conditions. Synechocystis cells were harvested during the exponential phase, resuspended in 50 mM Na2HPO4 (pH 7.5), and lysed by sonication, as described earlier for enzyme purification. The reaction was performed with cell lysate (0.1 mg protein) in the basal mix, from which CtOGOR was omitted and further supplemented with 0.15 mM NADPH and 50 mM NaHCO3. The reaction was initiated by adding 0.5 mM succinyl-CoA. The background control was conducted in the absence of succinyl-CoA. Cellular RuBisCO activity was determined as described previously using Synechocystis lysates [35].

2.10. Determination of Metabolite Levels

The cells were harvested during the exponential phase and resuspended in 50 mM Tris-Cl (pH 8.0). The cells were lysed by sonication and unbroken cells were removed by centrifugation at 12,000× g for 5 min. The protein contents in the supernatant were determined using the Lowry assay. The supernatants were filtered through a membrane with a 3-kDa cutoff (AmiconTM Ultra; Merck) to remove cellular proteins. The filtrates were used for metabolite determination. Succinyl-CoA was determined by a coupled assay using ALAS. The filtrates were supplemented with 0.5 mM PLP, 50 mM glycine, and 5 μM ALAS, and incubated at 30 °C for 15 min. The reaction without ALAS was included as a background control. After the reaction, the succinyl-CoA in the samples was completely converted to 5-aminolevulinic acid which was quantified as previously described [36]. The levels of 2-oxoglutarate (cat. #. K677-100; BioVision, Milpitas, CA, USA), glutamate (cat. #. K629-100; BioVision), succinate (cat. #. K649-100; BioVision) and isocitrate (cat. #. MAK061; Sigma-Aldrich) were determined using the commercial assay kits.

3. Results

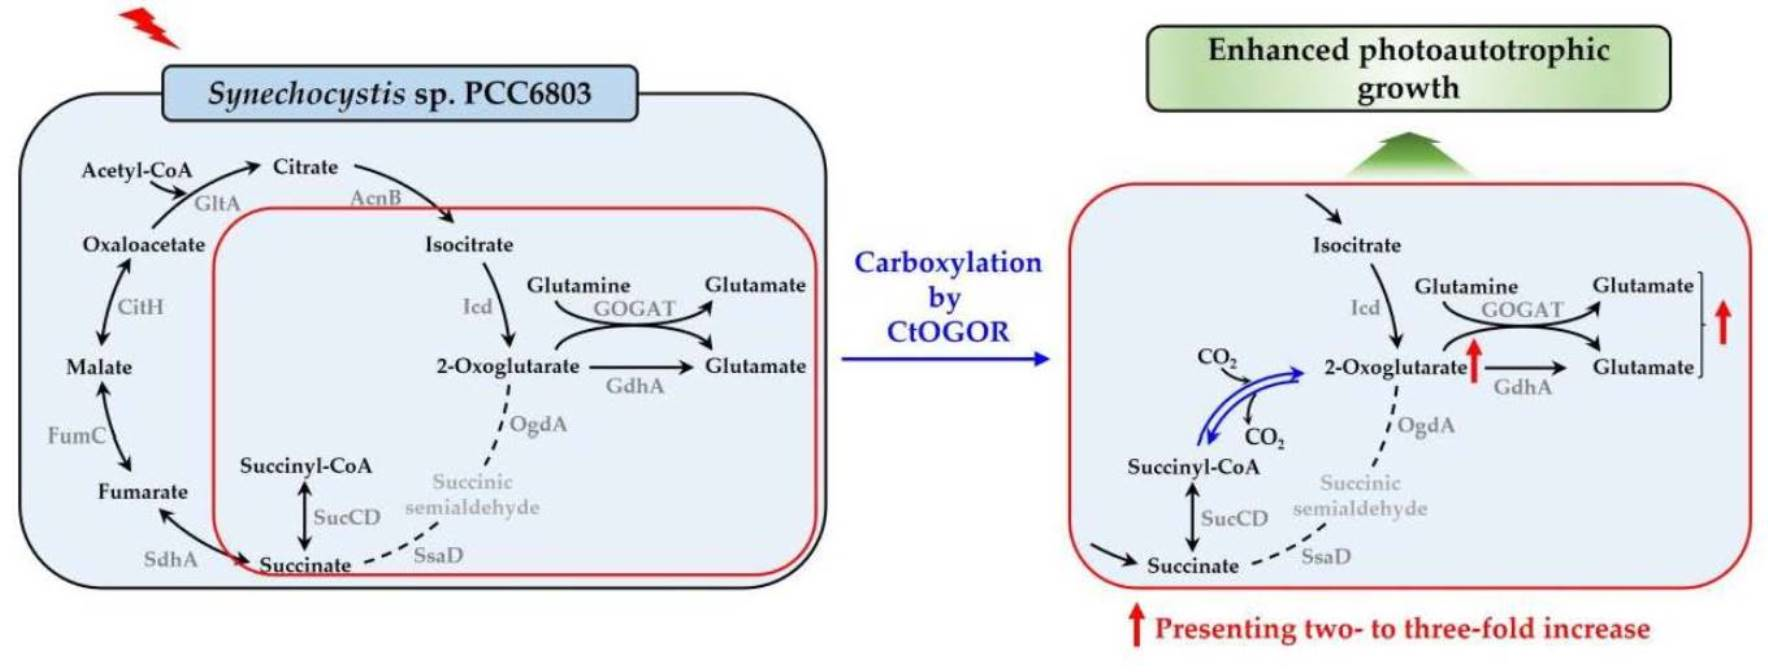
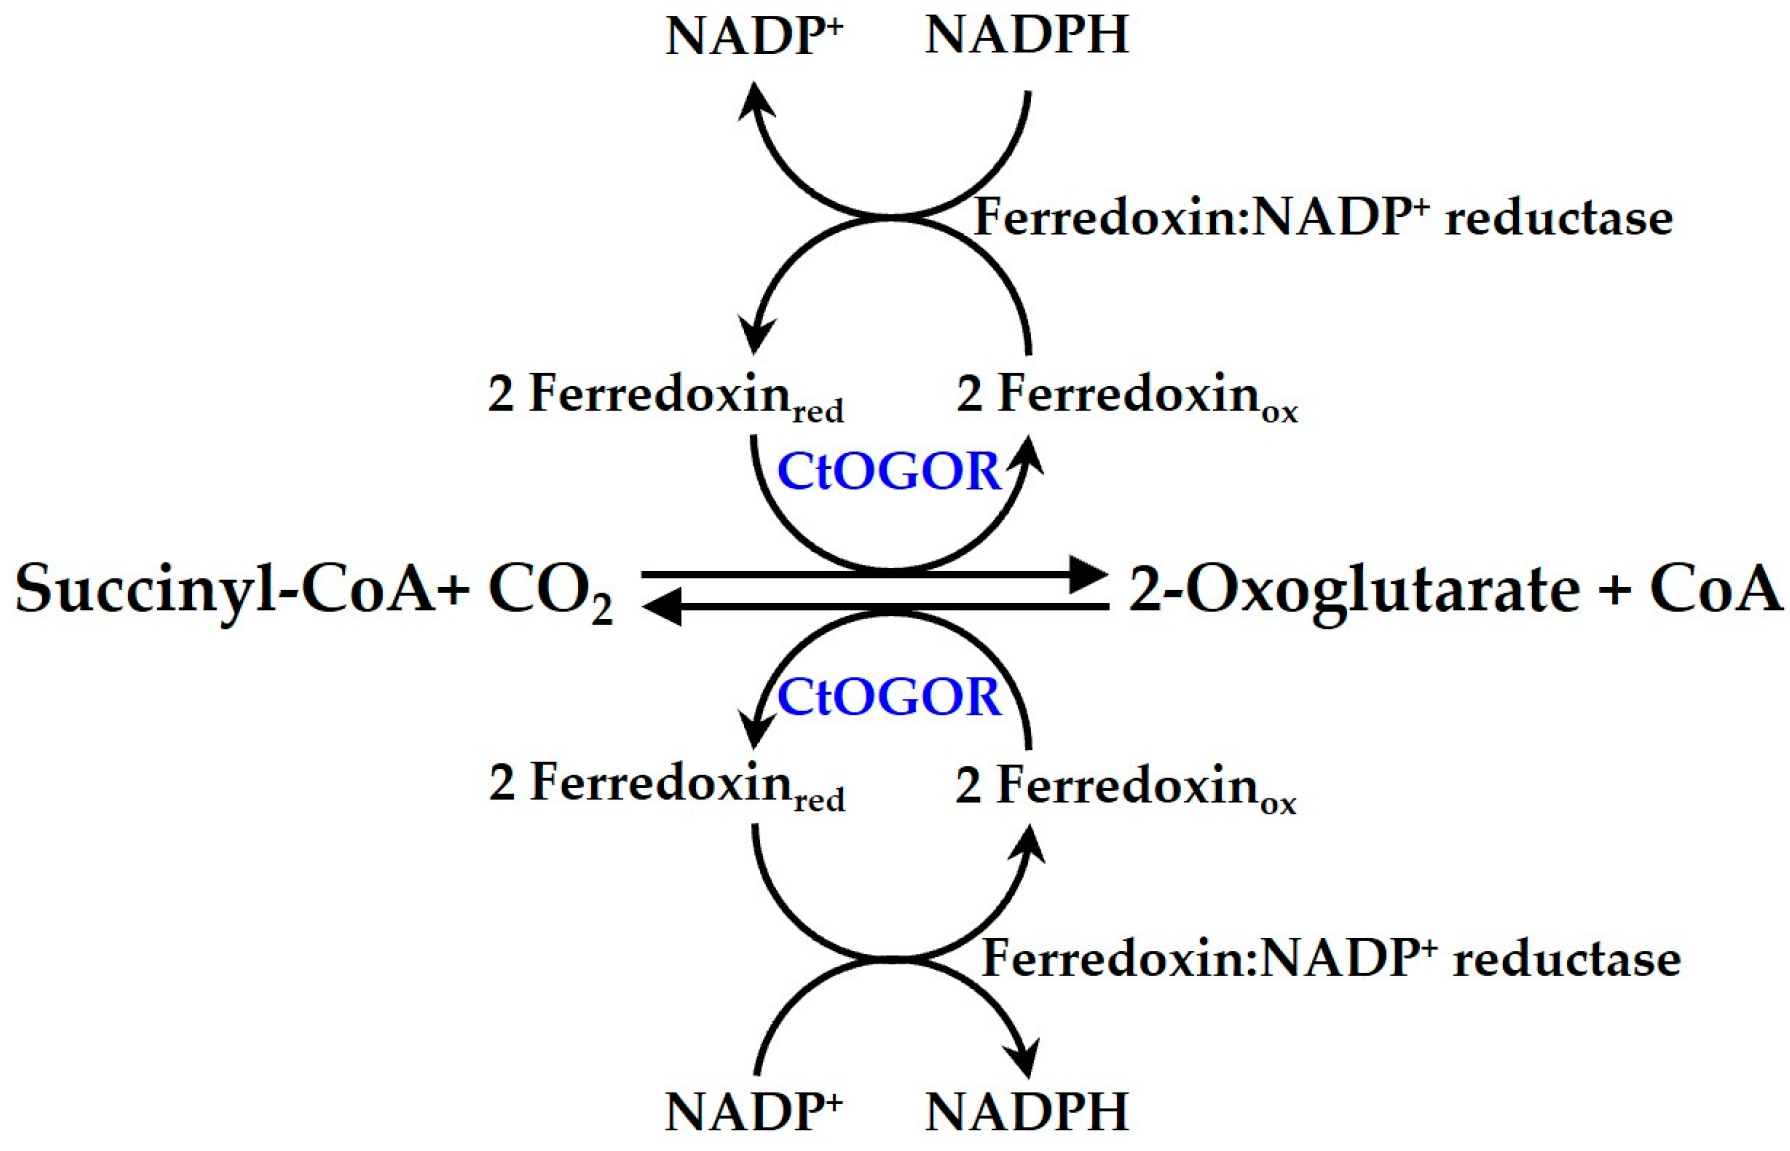
3.1. Biochemical Characterization of CtOGOR

CtOGOR is composed of two subunits, CtOGOR-A (α-subunit) and CtOGOR-B (β-subunit). The ORFs of korA and korB, coding for CtOGOR-A and CtOGOR-B, respectively are clustered around a 3-bp gap in the genome of C. tepidum, which implies that both genes are co-expressed at the transcriptional level as well as the tight interaction of gene products. As expected, after purification using His-tag affinity chromatography and subsequent gel-filtration chromatography, a single peak was detected in the chromatogram, which corresponded to a molecular mass of 220 kDa (Figure 2a). When the peak was pooled and subjected to SDS-PAGE, two bands were observed (Figure 2b and Figure S1a), illustrating the expected size of both subunits of CtOGOR at similar densities. These were confirmed to be His6-CtOGOR-A (N-terminally His6-tagged CtOGOR-A) and CtOGOR-B-strep (C-terminally strep-tagged CtOGOR-B) by Western blotting experiments
(Figure 2c,d and Figure S1b,c). This indicated that the two subunits were co-expressed and tightly bound to each other. Assuming that CtOGOR-A and CtOGOR-B constitute a multimer in 1:1 molar ratio, the oligomeric state of native CtOGOR is suggested to be the heterotetrameric (αβ)2 form.
The cofactor content of CtOGOR was determined after reconstitution of the enzyme with iron, sulfur, and TPP. CtOGOR was found to contain 7.51 ± 0.51, 7.65 ± 0.12, and 0.77 ± 0.07 of Fe, S, and TPP, respectively, per αβ-protomer (Table 1). If the iron-sulfur cluster is (4Fe-4S)-type like other OFOR superfamily enzymes [3,4,5,6,7,8], the CtOGOR protomer has two (4Fe-4S) clusters and one TPP as its cofactor.
Because the direction of the CtOGOR reaction is reversible (Figure 1), kinetic parameters were determined for both carboxylation and decarboxylation (Table 2). Enzyme analysis was performed with Synechocystis Fd as a mediator for electron transfer at 30 °C to elucidate the effect of CtOGOR production on the photoautotrophic growth of Synechocystis. The Km values varied among the substrates. However, there was a notably large difference found between Km for the major carbon substrates, succinyl-CoA (C4 compound) and 2-oxoglutarate (C5 compound). The Km for succinyl-CoA was 71-fold lower than that for 2-oxoglutarate, indicating that the affinity of succinyl-CoA for CtOGOR was far higher than that of 2-oxoglutarate (Table 2). If the concentrations of CO2 and CoA are sufficiently high and those of succinyl-CoA and 2-oxoglutarate are comparable, the reaction would move toward the carboxylation direction. This expectation appears to be obvious from the 23-fold higher catalytic efficiency (kcat/Km) for succinyl-CoA than that for 2-oxoglutarate.
Synechocystis performs oxygenic photosynthesis. Thus, molecular oxygen is produced by the light reaction of photosynthesis, and the Fe-S cluster of CtOGOR may be detrimentally affected. Enzymes in the OFOR superfamily are sensitive to O2 [9]. Accordingly, we assessed the stability of the carboxylation activity of CtOGOR under anaerobic (0% O2: DO, 0 μM), semi-aerobic (2% O2: DO, 35 ± 5 μM), and aerobic (21% O2: DO, 215 ± 7 μM) conditions (Figure 3). The residual activity decreased further as the DO level increased. Nonetheless, CtOGOR maintained its activity with a half-life of 143 min under aerobic conditions. Moreover, the half-life was extended to 361 min under semi-aerobic conditions, which may correspond to the O2 environments in Synechocystis cells [24].

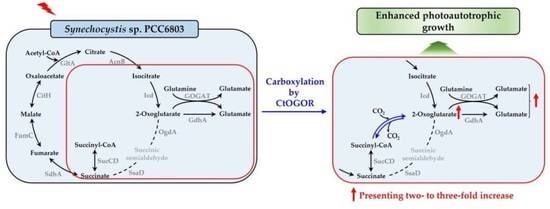
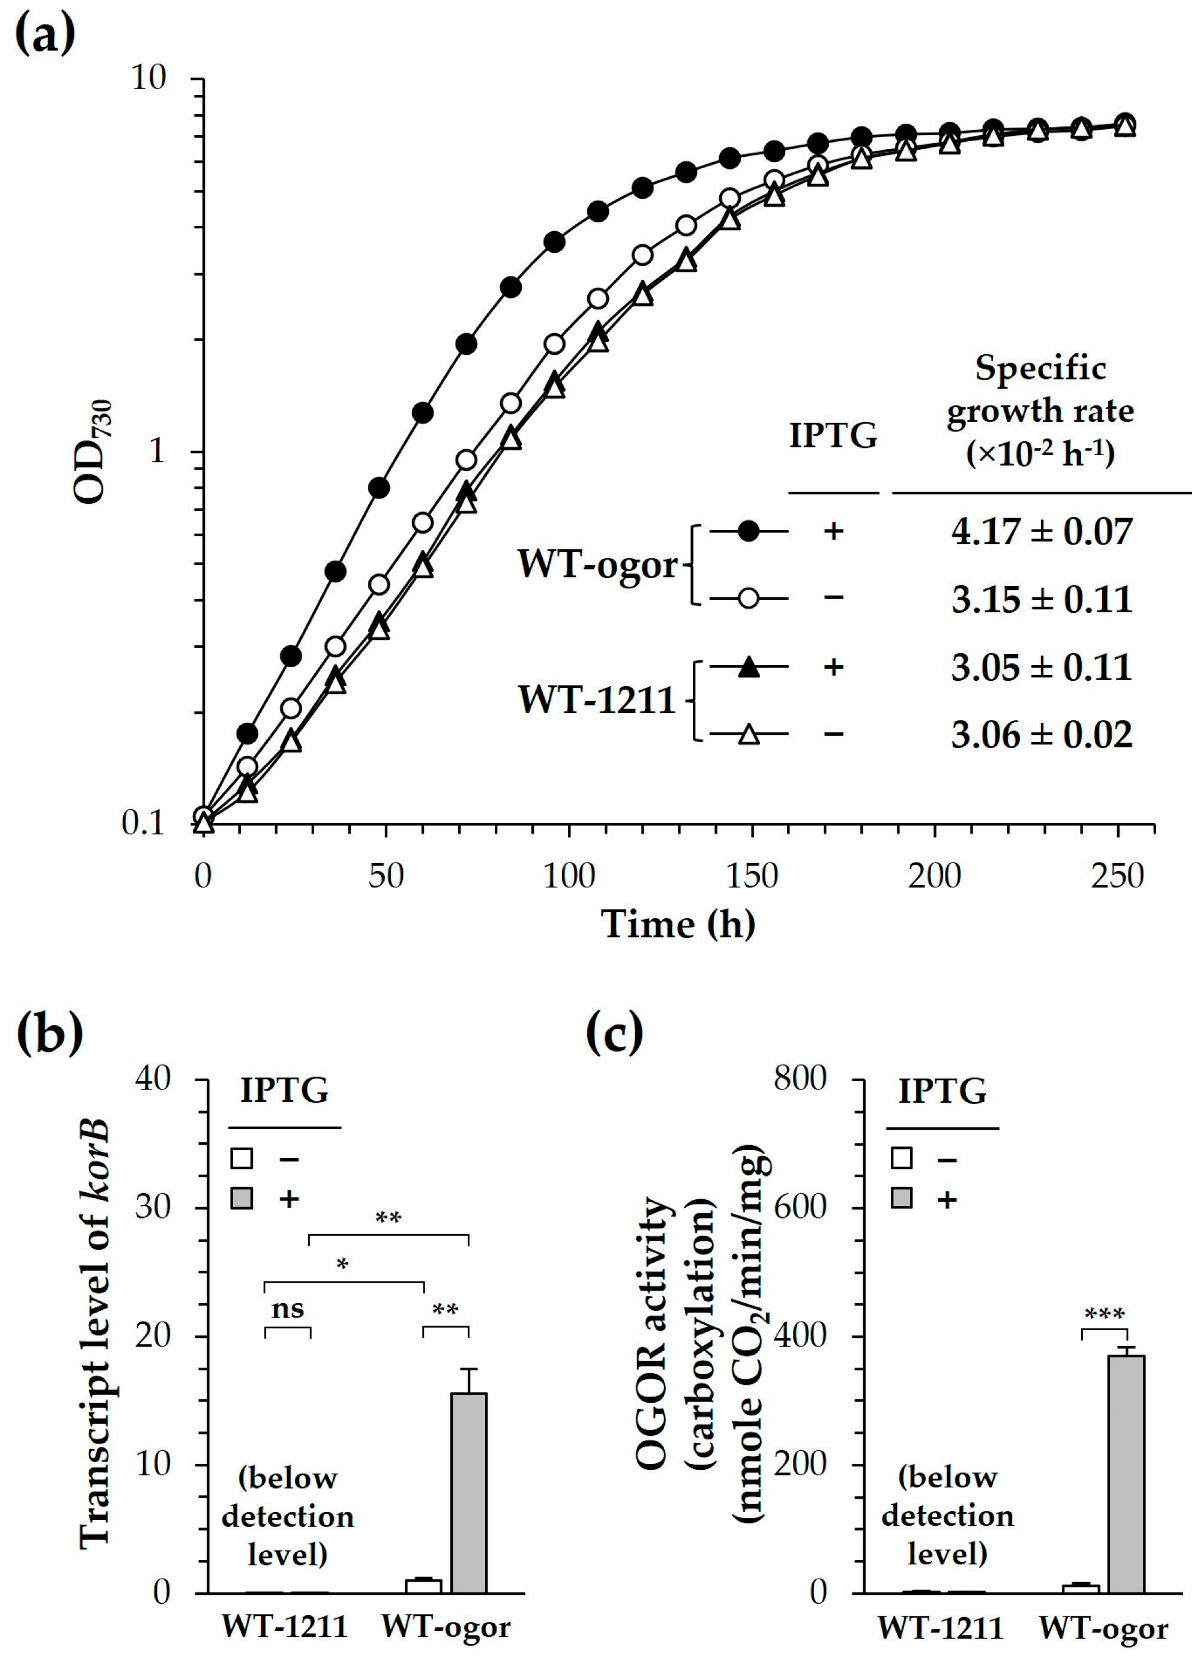
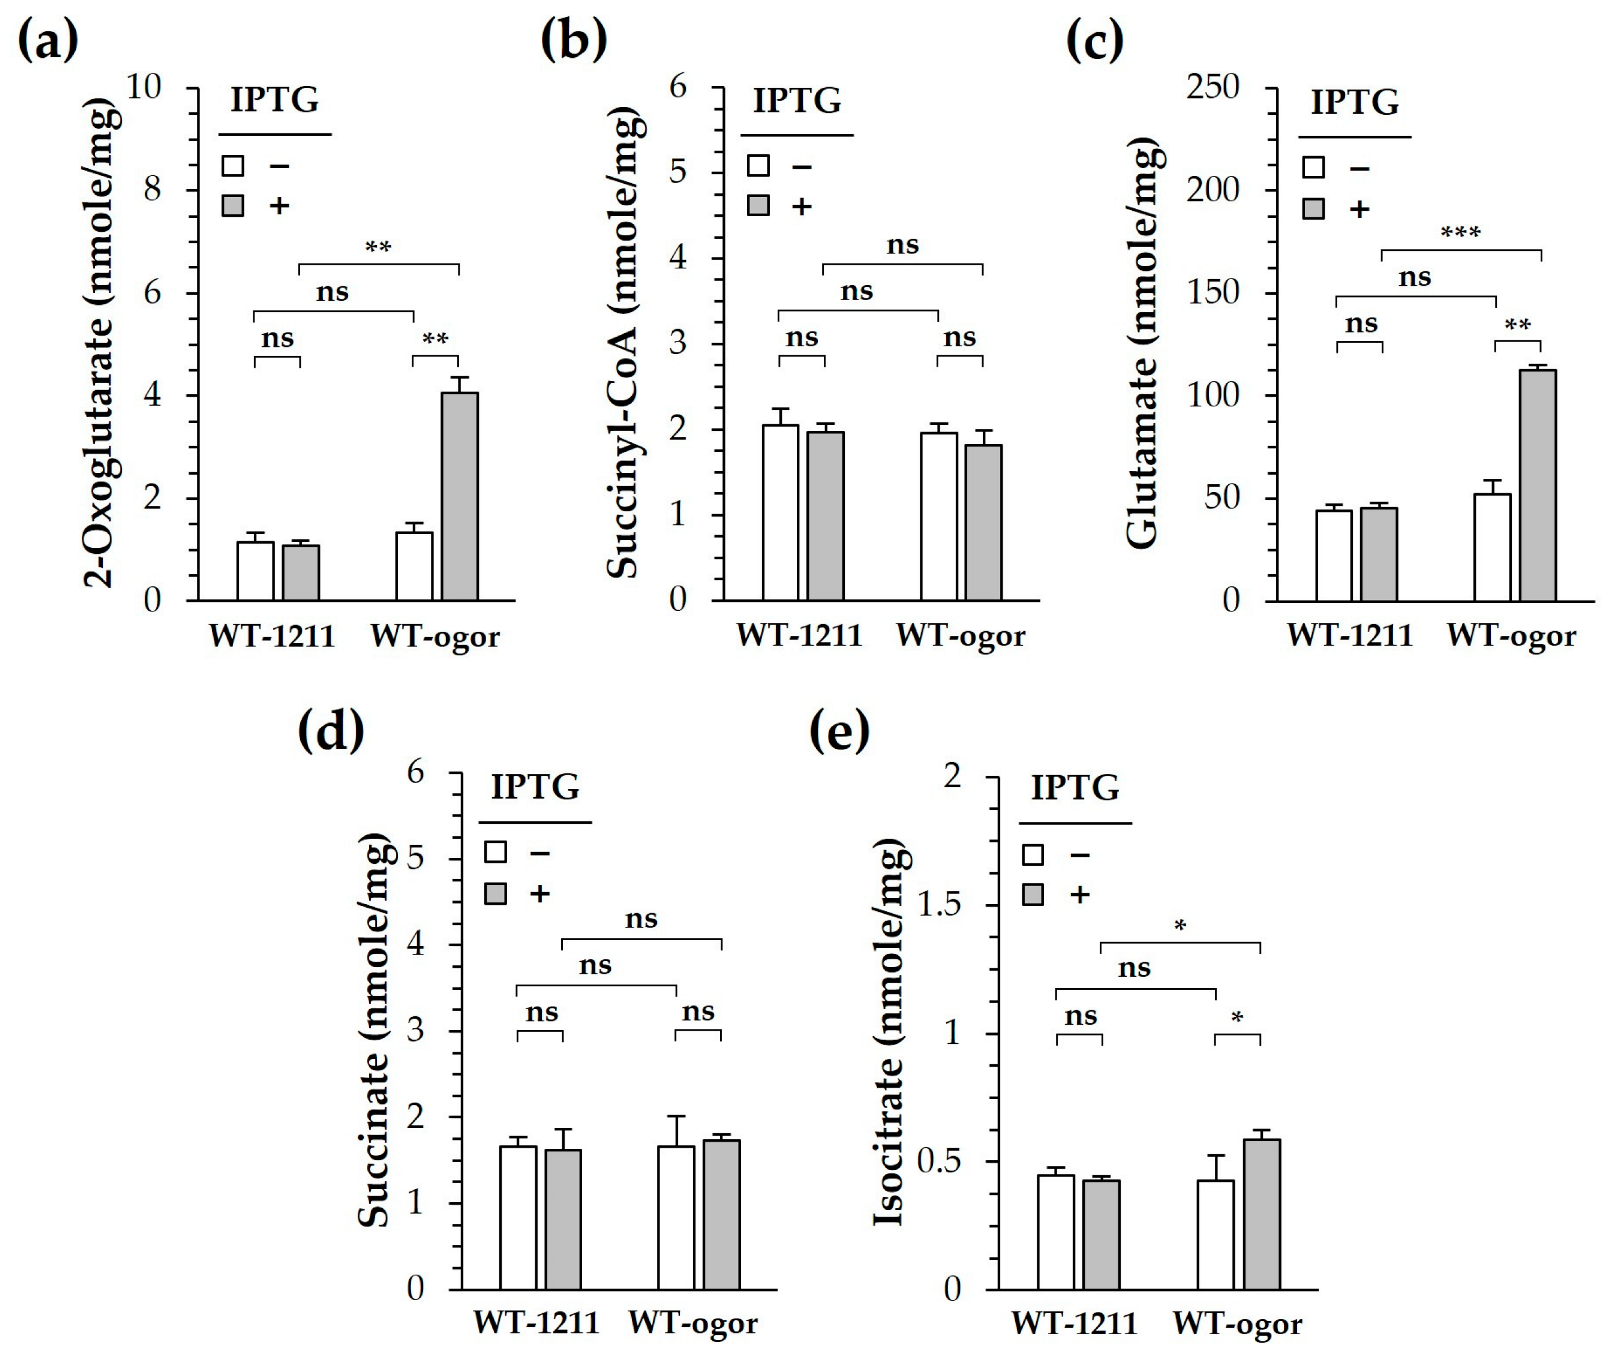
3.2. Heterologous Production of CtOGOR Enhanced Photoautotrophic Growth Rate of Synechocystis by Approximately >30%

Next, we attempted to enhance the carbon fixation of Synechocystis by introducing CtOGOR (Figure 4). CtOGOR was heterologously produced in wild type (WT) Synechocystis by expressing pSL-ogor (the resulting recombinant strain called WT-ogor), in which the CtOGOR gene was expressed with the IPTG (1 mM)-inducible trc promoter. The photoautotrophic growth of WT-ogor was faster than that of the control strain of Synechocystis WT, which carried the empty pSL1211 vector (the resulting recombinant strain called WT-1211), especially during the exponential phase in the presence of IPTG (Figure 5a). The growth of control strain WT-1211 was 3.06 ± 0.02 × 10⁻² h−1, which was comparable with the growth rate of 2.75 × 10⁻² h−1 determined with Synechocystis WT cell in other study [37]. The specific growth rate of WT-ogor (+IPTG) was approximately 36% higher than that of WT-1211 (+IPTG). However, the OD at the stationary phase was identical in all strains examined. The pH of the culture medium BG-11 was initially 7.5; however, it reached 9.0 during the stationary phase (Figure S2a,c). We suspected that an alkaline pH may decrease the effect of CtOGOR, thus leading to the same biomass in the stationary phase. Therefore, the cell culture was titrated to pH 7.5 every 12 h to maintain a constant culture pH. However, there was no difference in growth or biomass between WT-ogor (+IPTG) and WT-1211 (+IPTG) (Figure S2b,d).
To confirm the production of CtOGOR in Synechocystis, cells were harvested during the exponential phase and the gene expression of CtOGOR was examined by RT-qPCR. The expression level of korB in WT-ogor (+IPTG) was 15-fold higher than that in WT-ogor (−IPTG), indicating the induced expression of korAB by IPTG (Figure 5b). This result was confirmed again by the determination of cellular OROR activity, in which only WT-ogor (+IPTG) had significant cellular OGOR activity (Figure 5c). Although the promoter of pSL1211 is tightly regulated by IPTG, there was some leaky expression even in the absence of IPTG, which was observed with WT-ogor (−IPTG), leading to a slight increase in the specific growth rate (Figure 5a) and transcript level (Figure 5b) compared with the control values of WT-1211. However, no difference was detected in the spectral analysis of the membrane fractions (Figure S3), which implies no apparent effect of CtOGOR production on PS complexes. Since the growth of Synechocystis is sensitive to the intrinsic RuBisCO level [16], cellular RuBisCO was also examined. The expression levels of rbcL (i.e., the gene encoding the large subunit of RuBisCO) (Figure S4a) and cellular RuBisCO activities (Figure S4b) were the same in both WT-ogor and WT-1211.
Because CtOGOR connects the metabolic flow between succinyl-CoA and 2-oxoglutarate, the cellular levels of 2-oxoglutarate were determined using the deprotenized lysate obtained from cells grown exponentially under photoautotrophic conditions. 2-Oxoglutarate—the carboxylation product of CtOGOR—increased 4-fold in WT-ogor (+IPTG) compared to that in WT-ogor (-IPTG) and WT-1211 controls (Figure 6a). Meanwhile the cellular level of succinyl-CoA—a decarboxylation product of CtOGOR—did not change. Likewise, no change in succinate levels was observed (Figure 6d). These results reinforce the notion that CtOGOR is preferred for carboxylation over decarboxylation. Isocitrate level of WT-ogor (+IPTG) increased by approximately 30% compared to that of the controls (Figure 6e), which may be attributed to the carboxylation reaction of Icd. The reversibility of Icd was demonstrated by the kinetic analysis (Table S1). Alternatively, Icd may be inhibited by an increased level of 2-oxoglutarate [40], resulting in the accumulation of isocitrate in cells. Since 2-oxoglutarate is the substrate of GOGAT and GDH, glutamate levels increased by approximately 2.5-fold in WT-ogor (+IPTG) compared to those in WT-ogor (-IPTG) and WT-1211 controls (Figure 6c). Moreover, glutamate is known to significantly affect the biomass yield of Synechocystis [18].

4. Discussion

Several studies have characterized OGOR from diverse organisms such as Halobacterium halobium [3], Thermococcus litoralis [4], Sulfolobus sp. Strain 7 [5], Thauera aromatica [6], Sulfolobus tokodaii [7], and Magnetococcus marinus [8]. Although, oligomeric states vary depending on the origin of the enzyme, OGOR is composed of two subunits in the states of (αβ)1 or (αβ)2. Additionally, OGORs have 1–2 mole of (4Fe-4S) and 1–2 mole of TPP per enzyme in most cases. CtOGOR is composed of the (αβ)2 form and has two (4Fe-4S) clusters and one TPP, sharing features with previously reported OGOR enzymes.
CtOGOR requires Fd as a mediator for electron transfer. Although there may be a partner Fd for CtOGOR in C. tepidum, which is yet to be found, the major concern of this study was whether CtOGOR could work with Synechocystis Fds in cells. Synechocystis possesses nine Fds named Fed1–9 [41], the reduction potentials of which are in the range of −240 to −680 mV [42]. To examine the in vitro reaction of CtOGOR, we selected Fed2 (slr1382) as a representative, which has a [2Fe-2S] cluster and the highest reduction potential (−243 mV) [43]. M. marinus (Mm) OGOR was assumed to have a reduction potential of −545 mV and it exhibited in vitro carboxylation reaction with three Fds—MmFd1 (−635 mV and −485 mV for each of two 4Fe-4S clusters), MmFd2 (−520 mV for each of two 4Fe-4S clusters), and MmFd3 (−380 mV and −233 mV for each of two 4Fe-4S clusters) [8]. Although MmFd1 with the lowest negative reduction potential showed the highest carboxylation activity, the other Fds with higher potentials also showed comparable activities [8]. Thus, the in vitro carboxylation of CtOGOR by Synechocystis Fed2 can be explained. The in vivo partner Fd of Synechocystis suitable for carboxylation and decarboxylation by CtOGOR remains to be determined.
Synechocystis performs oxygenic photosynthesis generating O2 through water splitting, which could affect CtOGOR activity. O2 is not a crucial issue because the intracellular O2 concentration is extremely low in Synechocystis cells (0.064 μM; ~0.0001% partial pressure) [44]. Although the low O2 could still affect CtOGOR activity in cells, the steady-state enzyme level in Synechocystis was thought to be constitutively maintained due to the overexpression by plasmid.
Carbon fixation is a rate-limiting step in the cell growth and productivity (e.g., biomass) of Synechocystis [15]. We demonstrated that the overexpression of RuBisCO [16], Fructose-1,6-/sedoheptulose 1,7-biphosphatase [17], and fructose-bisphosphate aldolase [17], which are enzymes involved in the CBB cycle, could enhance the growth of Synechocystis (under high light-intensity). Additionaly, several carboxylases positively affect photoautotrophic growth and biomass formation in Synechocystis. Overexpression of phosphoenolpyruvate carboxylase increases the growth rate of Synechocystis by 43% [45] and ethylene productivity by 64% (under low light-intensity) [46]. Overexpression of acetyl-CoA carboxylase originating from E. coli enhanced lipid production yield in Synechocystis by 3.6-fold [47]. Although the detailed mechanisms vary from case to case, they commonly imply that the increased growth and productivity of Synechocystis could be achieved by promoting the integration of CO2 (or HCO3) into the cellular metabolite pools.
The reaction of heterologously produced CtOGOR seems to be inclined toward carboxylation in Synechocystis. This was demonstrated by the result that CtOGOR production increased 2-oxoglutarate levels (Figure 6a) but did not alter succinyl-CoA levels. At least five enzymes (pathways) were involved in 2-oxoglutarate metabolism: Icd, GOGAT, GdhA, OgdA, and CtOGOR (decarboxylation reaction) (Figure 4). The Km values (mM) for 2-oxoglutarate were as follows: Icd, 1.003 (Table S1); GOGAT, 0.04 [48]; GdhA, 1.8 [49]; OgdA, 21 [50]; and CtOGOR, 1.689 (Table 2). The cellular 2-oxoglutarate level was estimated to be 0.02–0.20 mM [40], which is far below the Km values of the enzymes. Thus, the amount of 2-oxoglutarate the enzymes take in their reaction would be determined primarily by Km of the enzymes. Compared with the other enzymes, Km of GOGAT is considerably lower, which means that GOGAT has the highest affinity for 2-oxoglutarate. Accordingly, 2-oxoglutarate formed by CtOGOR would be mainly metabolized by GOGAT to glutamate.
The 2-oxoglutarate reportedly acts as a signaling molecule for carbon-nitrogen balance [51] mainly via the PII signal transduction protein [52]. Indeed, the C/N ratio of cyanobacteria is maintained at 5:1 [53]. However, the BG-11 [19] minimal medium used in this study contained a sufficient amount of a fixed nitrogen source (NO3) and no fixed carbon source, which could result in a low C/N ratio in Synechocystis. Under these conditions, exogenous CtOGOR could contribute to elevating the fixed carbon level via carboxylation, leading to an appropriate C/N ratio for optimal growth.
Glutamate generated by CtOGOR can be utilized to produce building blocks of cellular components [54]. As an amino acid, glutamate itself participates in de novo protein synthesis (translation) and is used for the synthesis of other amino acids such as glutamine, proline, and arginine. More than 50% of cell components in Synechocystis are proteins [38] and glutamate has a more positive effect on the enhancement of biomass yield compared with other metabolites of the CBB cycle and central carbon metabolism [18]. Synechocystis adopts the C5 pathway to synthesize 5-aminolevulinic acid and glutamate is the main starting molecule of crucial biosynthetic pathways such as chlorophyll a, heme, phycocyanobilin, phycoerythrobilin and cobalamin [39]. Furthermore, glutamate is used to synthesize glutathione, a well-known cellular antioxidant [55]. Thus, an increase in cellular glutamate levels would have positive effects on cell growth under carbon-limiting photoautotrophic conditions.

5. Conclusions

This study characterized a CO2-fixing enzyme CtOGOR of OFOR family and found it similarly forms heterotetramer (αβ)2 and contains two (4Fe-4S) clusters and one TPP per (αβ)1 protomer. Exogenous production of CtOGOR in Synechocystis resulted in the elevation of the levels of 2-oxoglutarate, a central metabolite linking carbon and nitrogen metabolism. Glutamate level increased accordingly, and the photoautotrophic growth rate increased. However, carboxylation by CtOGOR may not largely affect carbon availability in the cell. Thus, further study should focus on examining the effect of CtOGOR production during higher carbon availability via over-producing CBB cycle enzymes including RuBisCO of cyanobacteria under photoautotrophic conditions.

Supplementary Materials

The following supporting information can be downloaded at: https://www.mdpi.com/article/10.3390/biology12010059/s1. Figure S1: Uncropped SDS-polyacrylamide gel and Western blots of CtOGOR; Figure S2: Effect of pH titration to 7.5 on the photoautotrophic growth of Synechocystis WT producing CtOGOR; Figure S3: Membrane spectra of Synechocystis WT producing CtOGOR; Figure S4: Transcript level and cellular activity of RuBisCO in Synechocystis WT producing CtOGOR; Table S1: Enzyme kinetic parameters of isocitrate dehydrogenase of Synechocystis.

Author Contributions

Conceptualization, J.K. and J.K.L.; methodology, J.K. and E.K.O.; software, J.K. and E.K.O.; validation, J.K. and J.K.L.; formal analysis, J.K.; investigation, J.K.; resources, J.K., E.-J.K. and J.K.L.; data curation, J.K. and J.K.L.; writing—original draft preparation, J.K.; writing—review and editing, E.-J.K. and J.K.L.; visualization, J.K.; supervision, E.-J.K. and J.K.L.; project administration, E.-J.K. and J.K.L.; funding acquisition, E.-J.K. All authors have read and agreed to the published version of the manuscript.

Funding

This study was supported by a grant (No. 2019R1A2C2089870) of the National Research Foundation of Korea (NRF) funded by the Korean government (MSIT).

Institutional Review Board Statement

Not applicable.

Informed Consent Statement

Not applicable.

Data Availability Statement

Not applicable.

Conflicts of Interest

The authors declare no conflict of interest.

References

  1. Tang, K.H.; Blankenship, R.E. Both forward and reverse TCA cycles operate in green sulfur bacteria. J. Biol. Chem. 2010, 285, 35848–35854. [Google Scholar] [CrossRef] [PubMed] [Green Version]
  2. Fuchs, G. Alternative pathways of carbon dioxide fixation: Insights into the early evolution of life? Annu. Rev. Microbiol. 2011, 65, 631–658. [Google Scholar] [CrossRef] [PubMed]
  3. Kerscher, L.; Oesterhelt, D. Purification and Properties of Two 2-Oxoacid: Ferredoxin Oxidoreductases from Halobacterium halobium. Eur. J. Biochem. 1981, 116, 587–594. [Google Scholar] [CrossRef] [PubMed]
  4. Mai, X.; Adams, M.W.W. Characterization of a Fourth Type of 2-Keto Acid-Oxidizing Enzyme from a Hyperthermophilic Archaeon: 2-Ketoglutarate Ferredoxin Oxidoreductase from Thermococcus litoralis. J. Bacteriol. 1996, 178, 5890–5896. [Google Scholar] [CrossRef] [PubMed] [Green Version]
  5. Zhang, Q.; Iwasaki, T.; Wakagi, T.; Oshima, T. 2-Oxoacid:Ferredoxin Oxidoreductase from the Thermoacidophilic Archaeon, Sulfolobus sp. Strain 7. J. Biochem. 1996, 120, 587–599. [Google Scholar] [CrossRef] [PubMed]
  6. Dörner, E.; Boll, M. Properties of 2-oxoglutarate:ferredoxin oxidoreductase from Thauera aromatica and its role in enzymatic reduction of the aromatic ring. J. Bacteriol. 2002, 184, 3975–3983. [Google Scholar] [CrossRef] [Green Version]
  7. Yan, Z.; Maruyama, A.; Arakawa, T.; Fushinobu, S.; Wakagi, T. Crystal structures of archaeal 2-oxoacid:ferredoxin oxidoreductases from Sulfolobus tokodaii. Sci. Rep. 2016, 6, 33061. [Google Scholar] [CrossRef] [Green Version]
  8. Chen, P.Y.; Li, B.; Drennan, C.L.; Elliott, S.J. A reverse TCA cycle 2-oxoacid:ferredoxin oxidoreductase that makes C-C bonds from CO2. Joule 2019, 3, 595–611. [Google Scholar] [CrossRef] [Green Version]
  9. Pieulle, L.; Magro, V.; Hatchikian, E.C. Isolation and Analysis of the Gene Encoding the Pyruvate-Ferredoxin Oxidoreductase of Desulfovibrio africanus, Production of the Recombinant Enzyme in Escherichia coli, and Effect of Carboxy-Terminal Deletions on Its Stability. J. Bacteriol. 1997, 179, 5684–5692. [Google Scholar] [CrossRef] [Green Version]
  10. Santos-Merino, M.; Singh, A.K.; Ducat, D.C. New Applications of Synthetic Biology Tools for Cyanobacterial Metabolic Engineering. Front. Bioeng. Biotechnol. 2019, 7, 33. [Google Scholar] [CrossRef]
  11. Spreitzer, R.J. Questions about the complexity of chloroplast ribulose-1,5-bisphosphate carboxylase/oxygenase. Photosynth. Res. 1999, 60, 29–42. [Google Scholar] [CrossRef]
  12. McNevin, D.; von Caemmerer, S.; Farquhar, G. Determining RuBisCO activation kinetics and other rate and equilibrium constants by simultaneous multiple non-linear regression of a kinetic model. J. Exp. Bot. 2006, 57, 3883–3900. [Google Scholar] [CrossRef] [PubMed] [Green Version]
  13. Marcus, Y.; Altman-Gueta, H.; Wolff, Y.; Gurevitz, M. Rubisco mutagenesis provides new insight into limitations on photosynthesis and growth in Synechocystis PCC6803. J. Exp. Bot. 2011, 62, 4173–4182. [Google Scholar] [CrossRef] [PubMed] [Green Version]
  14. Marcus, Y.; Altman-Gueta, H.; Finkler, A.; Gurevitz, M. Mutagenesis at two distinct phosphate-binding sites unravels their differential roles in regulation of Rubisco activation and catalysis. J. Bacteriol. 2005, 187, 4222–4228. [Google Scholar] [CrossRef] [PubMed] [Green Version]
  15. Liang, F.; Lindberg, P.; Lindblad, P. Engineering photoautotrophic carbon fixation for enhanced growth and productivity. Sustain. Energy Fuels 2018, 2, 2583–2600. [Google Scholar] [CrossRef] [Green Version]
  16. Liang, F.; Lindblad, P. Synechocystis PCC 6803 overexpressing RuBisCO grow faster with increased photosynthesis. Metab. Eng. Commun. 2017, 4, 29–36. [Google Scholar] [CrossRef]
  17. Liang, F.; Lindblad, P. Effects of overexpressing photosynthetic carbon flux control enzymes in the cyanobacterium Synechocystis PCC 6803. Metab. Eng. 2016, 38, 56–64. [Google Scholar] [CrossRef]
  18. Nakajima, T.; Yoshikawa, K.; Toya, Y.; Matsuda, F.; Shimizu, H. Metabolic Flux Analysis of the Synechocystis sp. PCC 6803 ΔnrtABCD Mutant Reveals a Mechanism for Metabolic Adaptation to Nitrogen-Limited Conditions. Plant Cell Physiol. 2017, 58, 537–545. [Google Scholar] [CrossRef] [Green Version]
  19. Kratz, W.A.; Myers, J. Nutrition and Growth of Several Blue-Green Algae. Am. J. Bot. 1955, 42, 282–287. [Google Scholar] [CrossRef]
  20. Green, M.R.; Sambrook, J. Molecular Cloning: A Laboratory Manual, 4th ed.; Cold Spring Harbor Laboratory Press: New York, NY, USA, 2012. [Google Scholar]
  21. Eraso, J.M.; Kaplan, S. prrA, a Putative Response Regulator Involved in Oxygen Regulation of Photosynthesis Gene Expression in Rhodobacter sphaeroides. J. Bacteriol. 1994, 176, 32–43. [Google Scholar] [CrossRef]
  22. Ng, W.O.; Zentella, R.; Wang, Y.; Taylor, J.S.; Pakrasi, H.B. phrA, the major photoreactivating factor in the cyanobacterium Synechocystis sp. strain PCC 6803 codes for a cyclobutane-pyrimidine-dimer-specific DNA photolyase. Arch. Microbiol. 2000, 173, 412–417. [Google Scholar] [CrossRef] [PubMed]
  23. Simon, R.; Priefer, U.; Pühler, A. A Broad Host Range Mobilization System for In Vivo Genetic Engineering: Transposon Mutagenesis in Gram Negative Bacteria. Nat. Biotechnol. 1983, 1, 784–791. [Google Scholar] [CrossRef]
  24. Kim, E.-J.; Kim, J.-S.; Rhee, H.J.; Lee, J.K. Growth arrest of Synechocystis sp. PCC6803 by superoxide generated from heterologously expressed Rhodobacter sphaeroides chlorophyllide a reductase. FEBS Lett. 2009, 583, 219–223. [Google Scholar] [CrossRef] [PubMed] [Green Version]
  25. Kim, H.; Kim, H.; Lee, J.K. Biochemical characterization of protoporphyrinogen dehydrogenase and protoporphyrin ferrochelatase of Vibrio vulnificus and the critical complex formation between these enzymes. Biochim. Biophys. Acta Gen. Subj. 2018, 1862, 2674–2687. [Google Scholar] [CrossRef]
  26. Kurihara, T.; Mihara, H.; Kato, S.; Yoshimura, T.; Esaki, N. Assembly of iron–sulfur clusters mediated by cysteine desulfurases, IscS, CsdB and CSD, from Escherichia coli. Biochim. Biophys. Acta 2003, 1647, 303–309. [Google Scholar] [CrossRef]
  27. Lovenberg, W.; Buchanan, B.B.; Rabinowitz, J.C. Studies on the Chemical Nature of Clostridial Ferredoxin. J. Biol. Chem. 1963, 238, 3899–3913. [Google Scholar] [CrossRef]
  28. Beinert, H. Semi-micro Methods for Analysis of Labile Sulfide and of Labile Sulfide plus Sulfane Sulfur in Unusually Stable Iron-Sulfur Proteins. Anal. Biochem. 1983, 131, 373–378. [Google Scholar] [CrossRef]
  29. Fraccascia, P.; Sniekers, M.; Casteels, M.; Van Veldhoven, P.P. Presence of thiamine pyrophosphate in mammalian peroxisomes. BMC Biochem. 2007, 8, 10. [Google Scholar] [CrossRef] [Green Version]
  30. Lowry, O.H.; Rosebrough, N.J.; Farr, A.L.; Randall, R.J. Protein Measurement with the Folin Phenol Reagent. J. Biol. Chem. 1951, 193, 265–275. [Google Scholar] [CrossRef]
  31. Leader, D.P. A method of introducing the physiological carbon dioxide-bicarbonate buffer system to medical students. Biochem. Educ. 1979, 7, 37–38. [Google Scholar] [CrossRef]
  32. Lan, Y.; Mott, K.A. Determination of Apparent Km Values for Ribulose 1,5-Bisphosphate Carboxylase/Oxygenase (Rubisco) Activase Using the Spectrophotometric Assay of Rubisco Activity. Plant Physiol. 1991, 95, 604–609. [Google Scholar] [CrossRef] [PubMed] [Green Version]
  33. Kim, E.-J.; Kim, J.-S.; Lee, I.-H.; Rhee, H.J.; Lee, J.K. Superoxide generation by chlorophyllide a reductase of Rhodobacter sphaeroides. J. Biol. Chem. 2008, 283, 3718–3730. [Google Scholar] [CrossRef] [PubMed] [Green Version]
  34. Schmittgen, T.D.; Livak, K.J. Analyzing real-time PCR data by the comparative CT method. Nat. Protoc. 2008, 3, 1101–1108. [Google Scholar] [CrossRef] [PubMed]
  35. Rasmussen, R.E.; Erstad, S.M.; Ramos-Martinez, E.M.; Fimognari, L.; De Porcellinis, A.J.; Sakuragi, Y. An easy and efficient permeabilization protocol for in vivo enzyme activity assays in cyanobacteria. Microb. Cell Fact. 2016, 15, 186. [Google Scholar] [CrossRef] [PubMed] [Green Version]
  36. Jordan, P.M.; Laghai-Newton, A. [52] Purification of 5-aminolevulinate synthase. Methods Enzymol. 1986, 123, 435–443. [Google Scholar] [CrossRef] [PubMed]
  37. Page, L.E.; Liberton, M.; Pakrasi, H.B. Reduction of Photoautotrophic Productivity in the Cyanobacterium Synechocystis sp. Strain PCC 6803 by Phycobilisome Antenna Truncation. Appl. Environ. Microbiol. 2012, 78, 6349–6351. [Google Scholar] [CrossRef] [Green Version]
  38. Knoop, H.; Gründel, M.; Zilliges, Y.; Lehmann, R.; Hoffmann, S.; Lockau, W.; Steuer, R. Flux Balance Analysis of Cyanobacterial Metabolism: The Metabolic Network of Synechocystis sp. PCC 6803. PLoS Comput. Biol. 2013, 9, e1003081. [Google Scholar] [CrossRef] [Green Version]
  39. Mills, L.A.; McCormick, A.J.; Lea-Smith, D.J. Current knowledge and recent advances in understanding metabolism of the model cyanobacterium Synechocystis sp. PCC 6803. Biosci. Rep. 2020, 40, BSR20193325. [Google Scholar] [CrossRef] [Green Version]
  40. Muro-Pastor, M.I.; Florencio, F.J. Purification and properties of NADP-isocitrate dehydrogenase from the unicellular cyanobacterium Synechocystis sp. PCC 6803. Eur. J. Biochem. 1992, 203, 99–105. [Google Scholar] [CrossRef]
  41. Cassier-Chauvat, C.; Chauvat, F. Function and Regulation of Ferredoxins in the Cyanobacterium, Synechocystis PCC6803: Recent Advances. Life 2014, 4, 666–680. [Google Scholar] [CrossRef]
  42. Wang, Y.; Chen, X.; Spengler, K.; Terberger, K.; Boehm, M.; Appel, J.; Barske, T.; Timm, S.; Battchikova, N. Pyruvate:ferredoxin oxidoreductase and low abundant ferredoxins support aerobic photomixotrophic growth in cyanobacteria. eLife 2022, 11, e71339. [Google Scholar] [CrossRef] [PubMed]
  43. Schorsch, M.; Kramer, M.; Goss, T.; Eisenhut, M.; Robinson, N.; Osman, D.; Wilde, A.; Sadaf, S.; Brückler, H.; Walder, L.; et al. A unique ferredoxin acts as a player in the low-iron response of photosynthetic organisms. Proc. Natl. Acad. Sci. USA 2018, 115, E12111–E12120. [Google Scholar] [CrossRef] [PubMed] [Green Version]
  44. Kihara, S.; Hartzler, D.A.; Savikhin, S. Oxygen concentration inside a functioning photosynthetic cell. Biophys. J. 2014, 106, 1882–1889. [Google Scholar] [CrossRef] [PubMed] [Green Version]
  45. Durall, C.; Rukminasari, N.; Lindblad, P. Enhanced growth at low light intensity in the cyanobacterium Synechocystis PCC 6803 by overexpressing phosphoenolpyruvate carboxylase. Algal Res. 2016, 16, 275–281. [Google Scholar] [CrossRef]
  46. Durall, C.; Lindberg, P.; Yu, J.; Lindblad, P. Increased ethylene production by overexpressing phosphoenolpyruvate carboxylase in the cyanobacterium Synechocystis PCC 6803. Biotechnol. Biofuels 2020, 13, 16. [Google Scholar] [CrossRef]
  47. Fathy, W.; Essawy, E.; Tawfik, E.; Khedr, M.; Abdelhameed, M.S.; Hammouda, O.; Elsayed, K. Recombinant overexpression of the Escherichia coli acetyl-CoA carboxylase gene in Synechocystis sp. boosts lipid production. J. Basic Microbiol. 2021, 61, 330–338. [Google Scholar] [CrossRef]
  48. Tripathy, J.N.; Hirasawa, M.; Sutton, R.B.; Dasgupta, A.; Vaidyanathan, N.; Zabet-Moghaddam, M.; Florencio, F.J.; Srivastava, A.P.; Knaff, D.B. A loop unique to ferredoxin-dependent glutamate synthases is not absolutely essential for ferredoxin-dependent catalytic activity. Photosynth. Res. 2015, 123, 129–139. [Google Scholar] [CrossRef]
  49. Chávez, S.; Candau, P. An NAD-specific glutamate dehydrogenase from cyanobacteria. Identification and properties. FEBS Lett. 1991, 285, 35–38. [Google Scholar] [CrossRef] [Green Version]
  50. Wang, X.; Lei, G.; Wu, X.; Wang, F.; Lai, C.; Li, Z. Expression, purification and characterization of sll1981 protein from cyanobacterium Synechocystis sp. PCC6803. Protein Expr. Purif. 2017, 139, 21–28. [Google Scholar] [CrossRef]
  51. Forchhammer, K.; Selim, K.A. Carbon/nitrogen homeostasis control in cyanobacteria. FEMS Microbiol. Rev. 2020, 44, 33–53. [Google Scholar] [CrossRef]
  52. Fokina, O.; Chellamuthu, V.R.; Forchhammer, K.; Zeth, K. Mechanism of 2-oxoglutarate signaling by the Synechococcus elongatus PII signal transduction protein. Proc. Natl. Acad. Sci. USA 2010, 107, 19760–19765. [Google Scholar] [CrossRef] [PubMed] [Green Version]
  53. Wolk, C.P. Physiology and Cytological Chemistry of Blue-Green Algae. Bacteriol. Rev. 1973, 37, 32–101. [Google Scholar] [CrossRef] [PubMed]
  54. Walker, M.C.; van der Donk, W.A. The many roles of glutamate in metabolism. J. Ind. Microbiol. Biotechnol. 2016, 43, 419–430. [Google Scholar] [CrossRef] [PubMed] [Green Version]
  55. Cameron, J.C.; Pakrasi, H.B. Glutathione in Synechocystis 6803: A closer look into the physiology of a ΔgshB mutant. Plant Signal. Behav. 2011, 6, 89–92. [Google Scholar] [CrossRef] [PubMed]
Figure 1. The reaction scheme of CtOGOR. The enzymatic reaction of CtOGOR is illustrated including a coupled reaction with ferredoxin:NADP+ reductase (FNR) for in vitro assays.
Biology 12 00059 g001
Figure 2. Purification of 2-oxoglutarate:ferredoxin oxidoreductase from Chlorobaculum tepidum (CtOGOR). CtOGOR composed of N-terminal His6-tagged CtOGOR-A (His6-CtOGOR-A) and C-terminal strep-tagged CtOGOR-B (CtOGOR-B-strep) was purified by His-tag affinity chromatography, followed by gel-filtration chromatography using SephacrylTM S-300 HR (a). The molecular mass of native CtOGOR was determined to be 220 kDa, which was calculated by the standard curve constructed with size standards (inset of A). Fractions of major peak (closed circle) were pooled and separated by SDS-PAGE (b). The His6-CtOGOR-A and CtOGOR-B-strep were confirmed by Western blotting using antibody against His6-tag (c) and strep-tag (d), respectively.
Biology 12 00059 g002
Figure 3. Stability of 2-oxoglutarate:ferredoxin oxidoreductase (CtOGOR) at varying O2 levels. CtOGOR was incubated with the buffers equilibrated with gases containing varying levels of O2, and the residual carboxylation activities were recorded intermittently. The half-lives (t1/2) were extrapolated by trendlines.
Biology 12 00059 g003
Figure 4. Tricarboxylic acid (TCA) cycle of Synechocystis producing 2-oxoglutarate:ferredoxin oxidoreductase (CtOGOR) under photoautotrophic conditions. CtOGOR (blue lines) is produced in Synechocystis and the TCA cycle is illustrated with its metabolites and enzymes. The dotted lines are supposed to be least active in the photoautotrophic condition [38]. Several cofactors necessary for enzyme reactions such as ATP and NAD(P)H are omitted. Abbreviations: GltA, citrate synthase; AcnB, aconitate hydratase B; Icd, isocitrate dehydrogenase; GOGAT, Glutamine oxoglutarate aminotransferase; GdhA, glutamate dehydrogenase; OgdA, 2-oxoglutarate decarboxylase; SsaD, succinic semialdehyde dehydrogenase; SucCD, succinyl-CoA synthetase; SdhA, succinate dehydrogenase subunit A; FumC, fumarase C; CitH, malate dehydrogenase [39].
Biology 12 00059 g004
Figure 5. Photoautotrophic growth of Synechocystis producing heterologous 2-oxoglutarate:ferredoxin oxidoreductase (CtOGOR). The photoautotrophic growth of WT-ogor (circle) and WT-1211 (triangle) were recorded in the presence (closed symbols) and absence (open symbols) of 1 mM IPTG (a). Specific growth rates were determined at exponential phases. Transcript levels of korB (b) at exponential phase was determined by RT-qPCR using 16S rRNA as a reference gene. The cellular activity of CtOGOR (c) was determined and normalized by protein level (mg). Significances were assessed by Student’s t-test: ns, p > 0.05; *, p ≤ 0.05; **, p ≤ 0.01; ***, p ≤ 0.001 (n = 3).
Biology 12 00059 g005
Figure 6. Cellular metabolite levels of Synechocystis producing 2-oxoglutarate:ferredoxin oxidoreductase (CtOGOR). WT-ogor and WT-1211 were grown photoautotrophically in the presence and absence of 1 mM IPTG. Cells were harvested at the exponential phase for metabolite analysis. The cellular level of 2-oxoglutarate (a), succinyl-CoA (b), glutamate (c), succinate (d) and isocitrate (e) were determined and normalized by total protein contents in the cells (mg). Significances were assessed by Student’s t-test: ns, p > 0.05; *, p ≤ 0.05; **, p ≤ 0.01; ***, p ≤ 0.001 (n = 3).
Biology 12 00059 g006
Table 1. Cofactor contents of 2-oxoglutarate:ferredoxin oxidoreductase (CtOGOR).
ContentNumber per αβ-Protomer *
Fe7.51 ± 0.51
S **7.65 ± 0.12
TPP0.77 ± 0.07
* Determined after reconstitution of the (Fe-S) cluster and thiamine pyrophosphate (TPP). ** Total sulfur from sulfide plus sulfane.
Table 2. Enzyme kinetic parameters of 2-oxoglutarate:ferredoxin oxidoreductase (CtOGOR).
Direction of ReactionSubstrateKm (mM)kcat (s−1) *kcat/Km (s−1 mM−1)
CarboxylationSuccinyl-CoA0.024 ± 0.0022.6 ± 0.1110.2 ± 3.5
CO2 **0.468 ± 0.0452.7 ± 0.16.5 ± 0.2
Decarboxylation2-Oxoglutarate1.689 ± 0.0928.4 ± 0.15.0 ± 0.1
CoA0.042 ± 0.0158.1 ± 0.2191.7 ± 2.4
* Turnover number per αβ-protomer. ** Concentration was estimated by that of sodium bicarbonate.
Disclaimer/Publisher’s Note: The statements, opinions and data contained in all publications are solely those of the individual author(s) and contributor(s) and not of MDPI and/or the editor(s). MDPI and/or the editor(s) disclaim responsibility for any injury to people or property resulting from any ideas, methods, instructions or products referred to in the content.

