
Effects of Near-Infrared Light on Well-Being and Health in Human Subjects with Mild Sleep-Related Complaints: A Double-Blind, Randomized, Placebo-Controlled Study
 , , , , , ,
Abstract
:Simple Summary
Abstract
1. Introduction
2. Methods
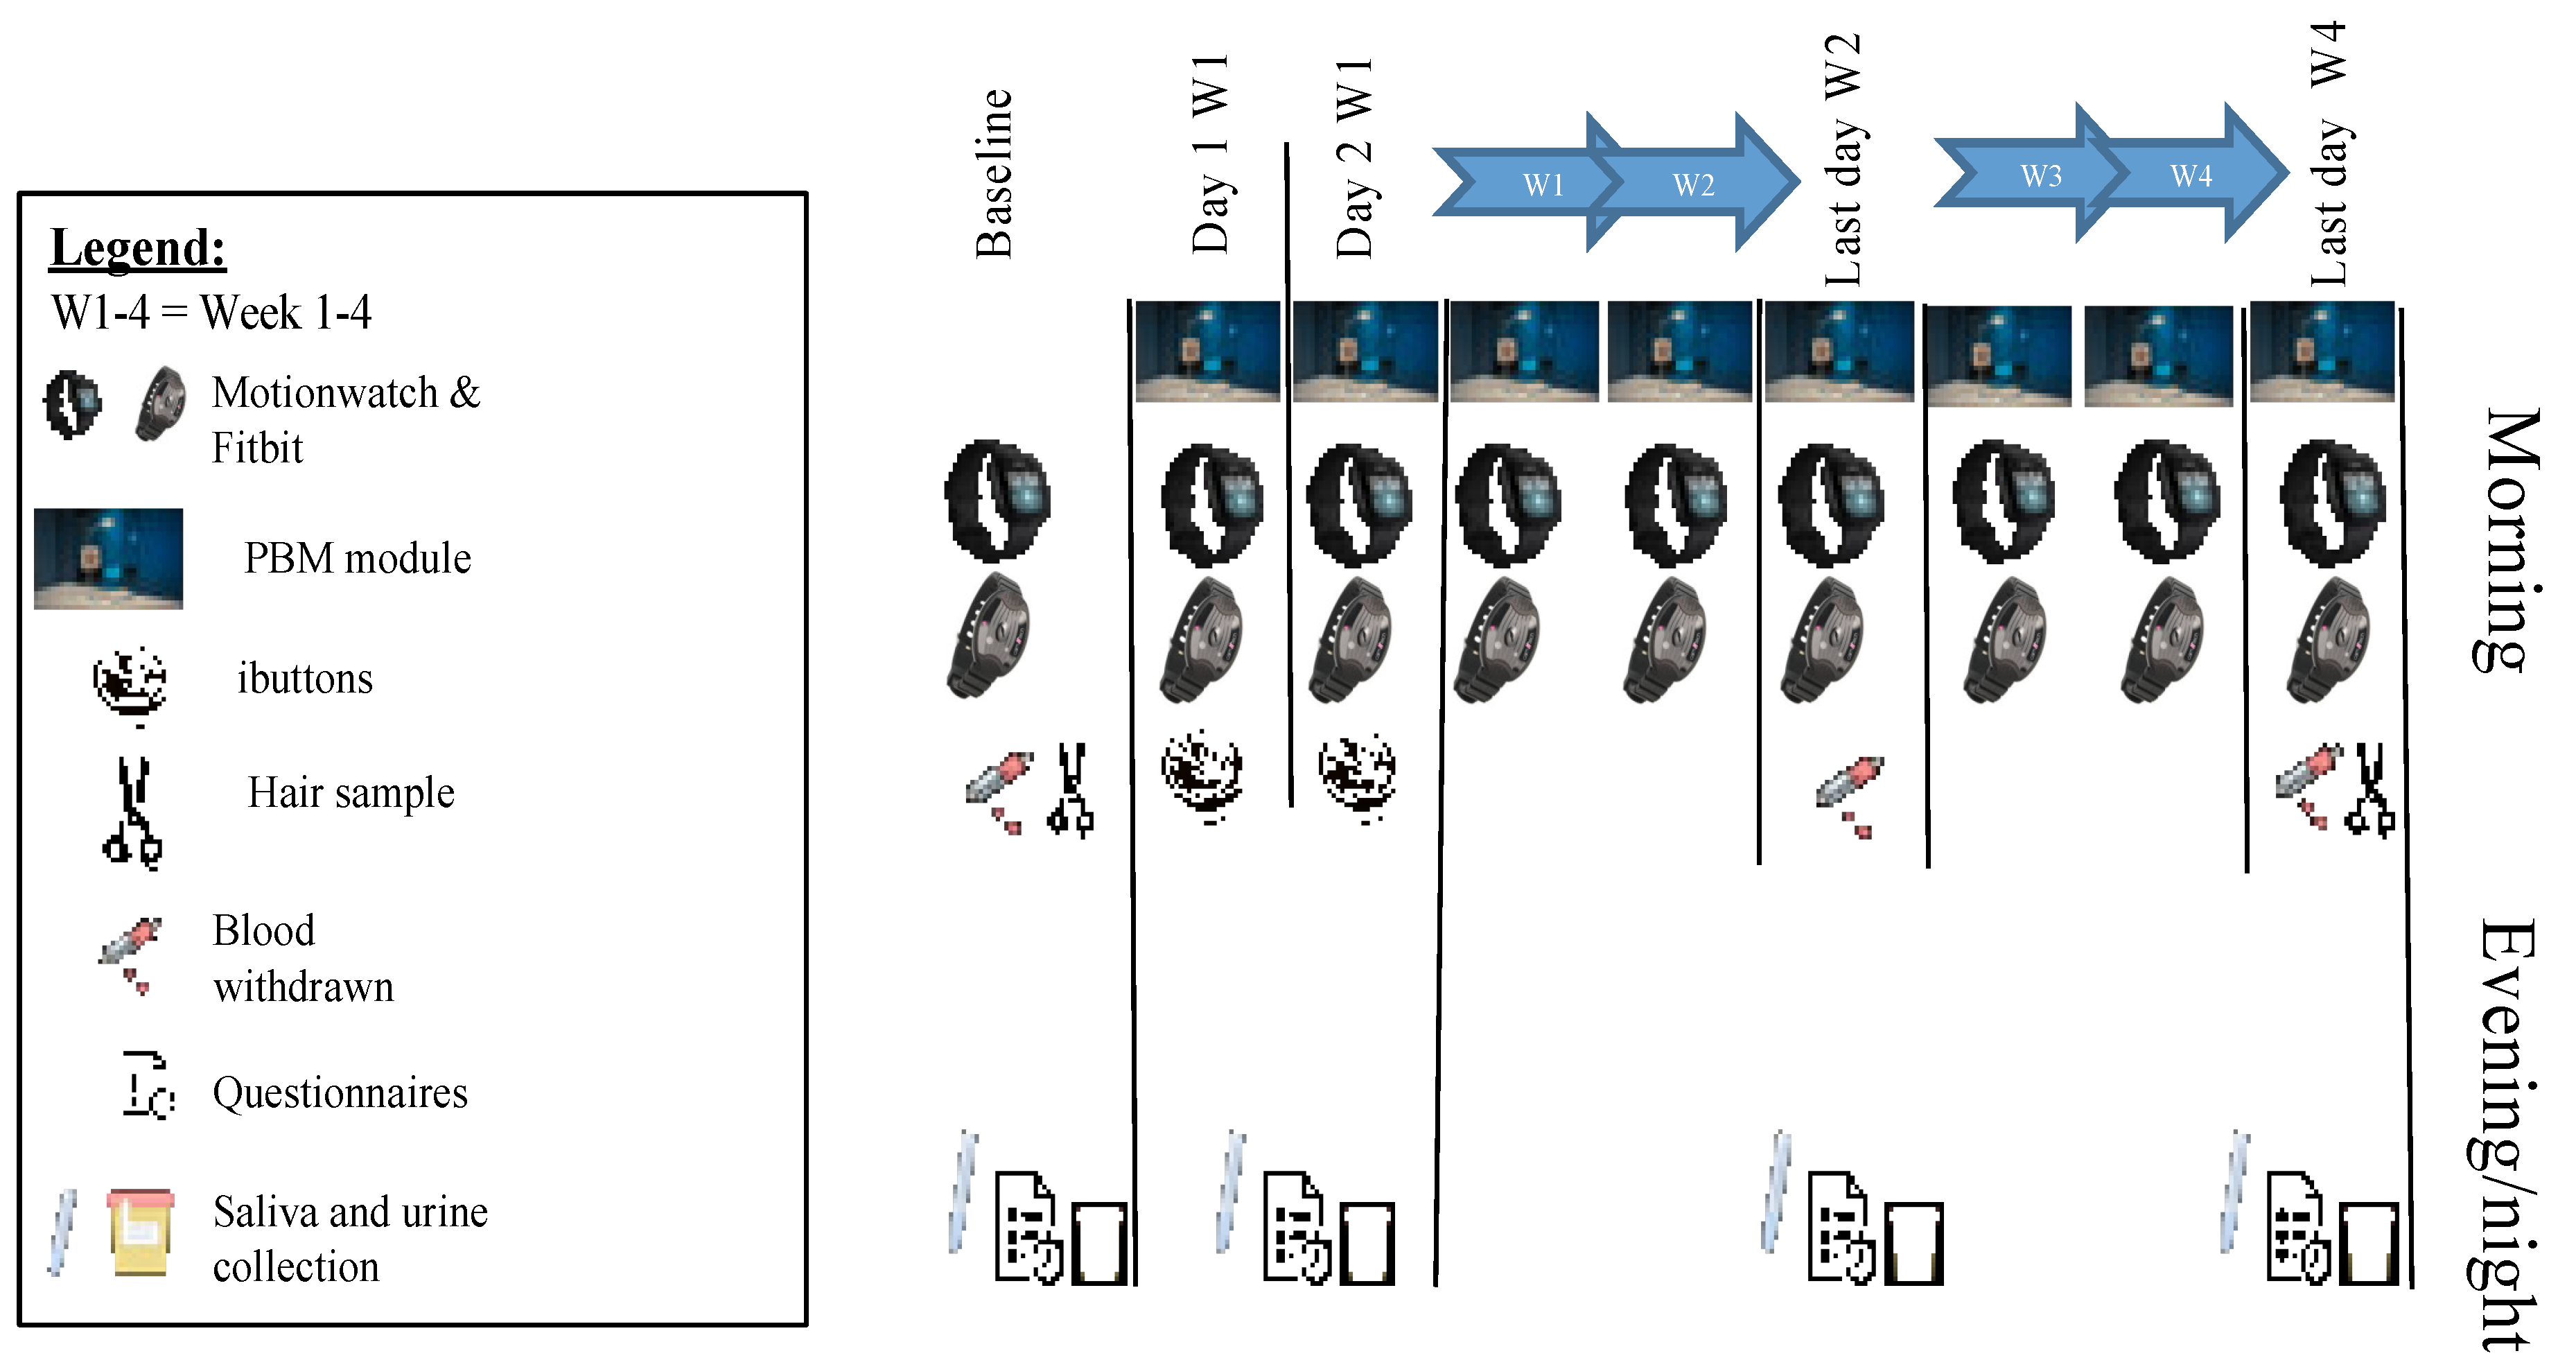
2.1. Clinical Study Design
2.2. PBM Treatment
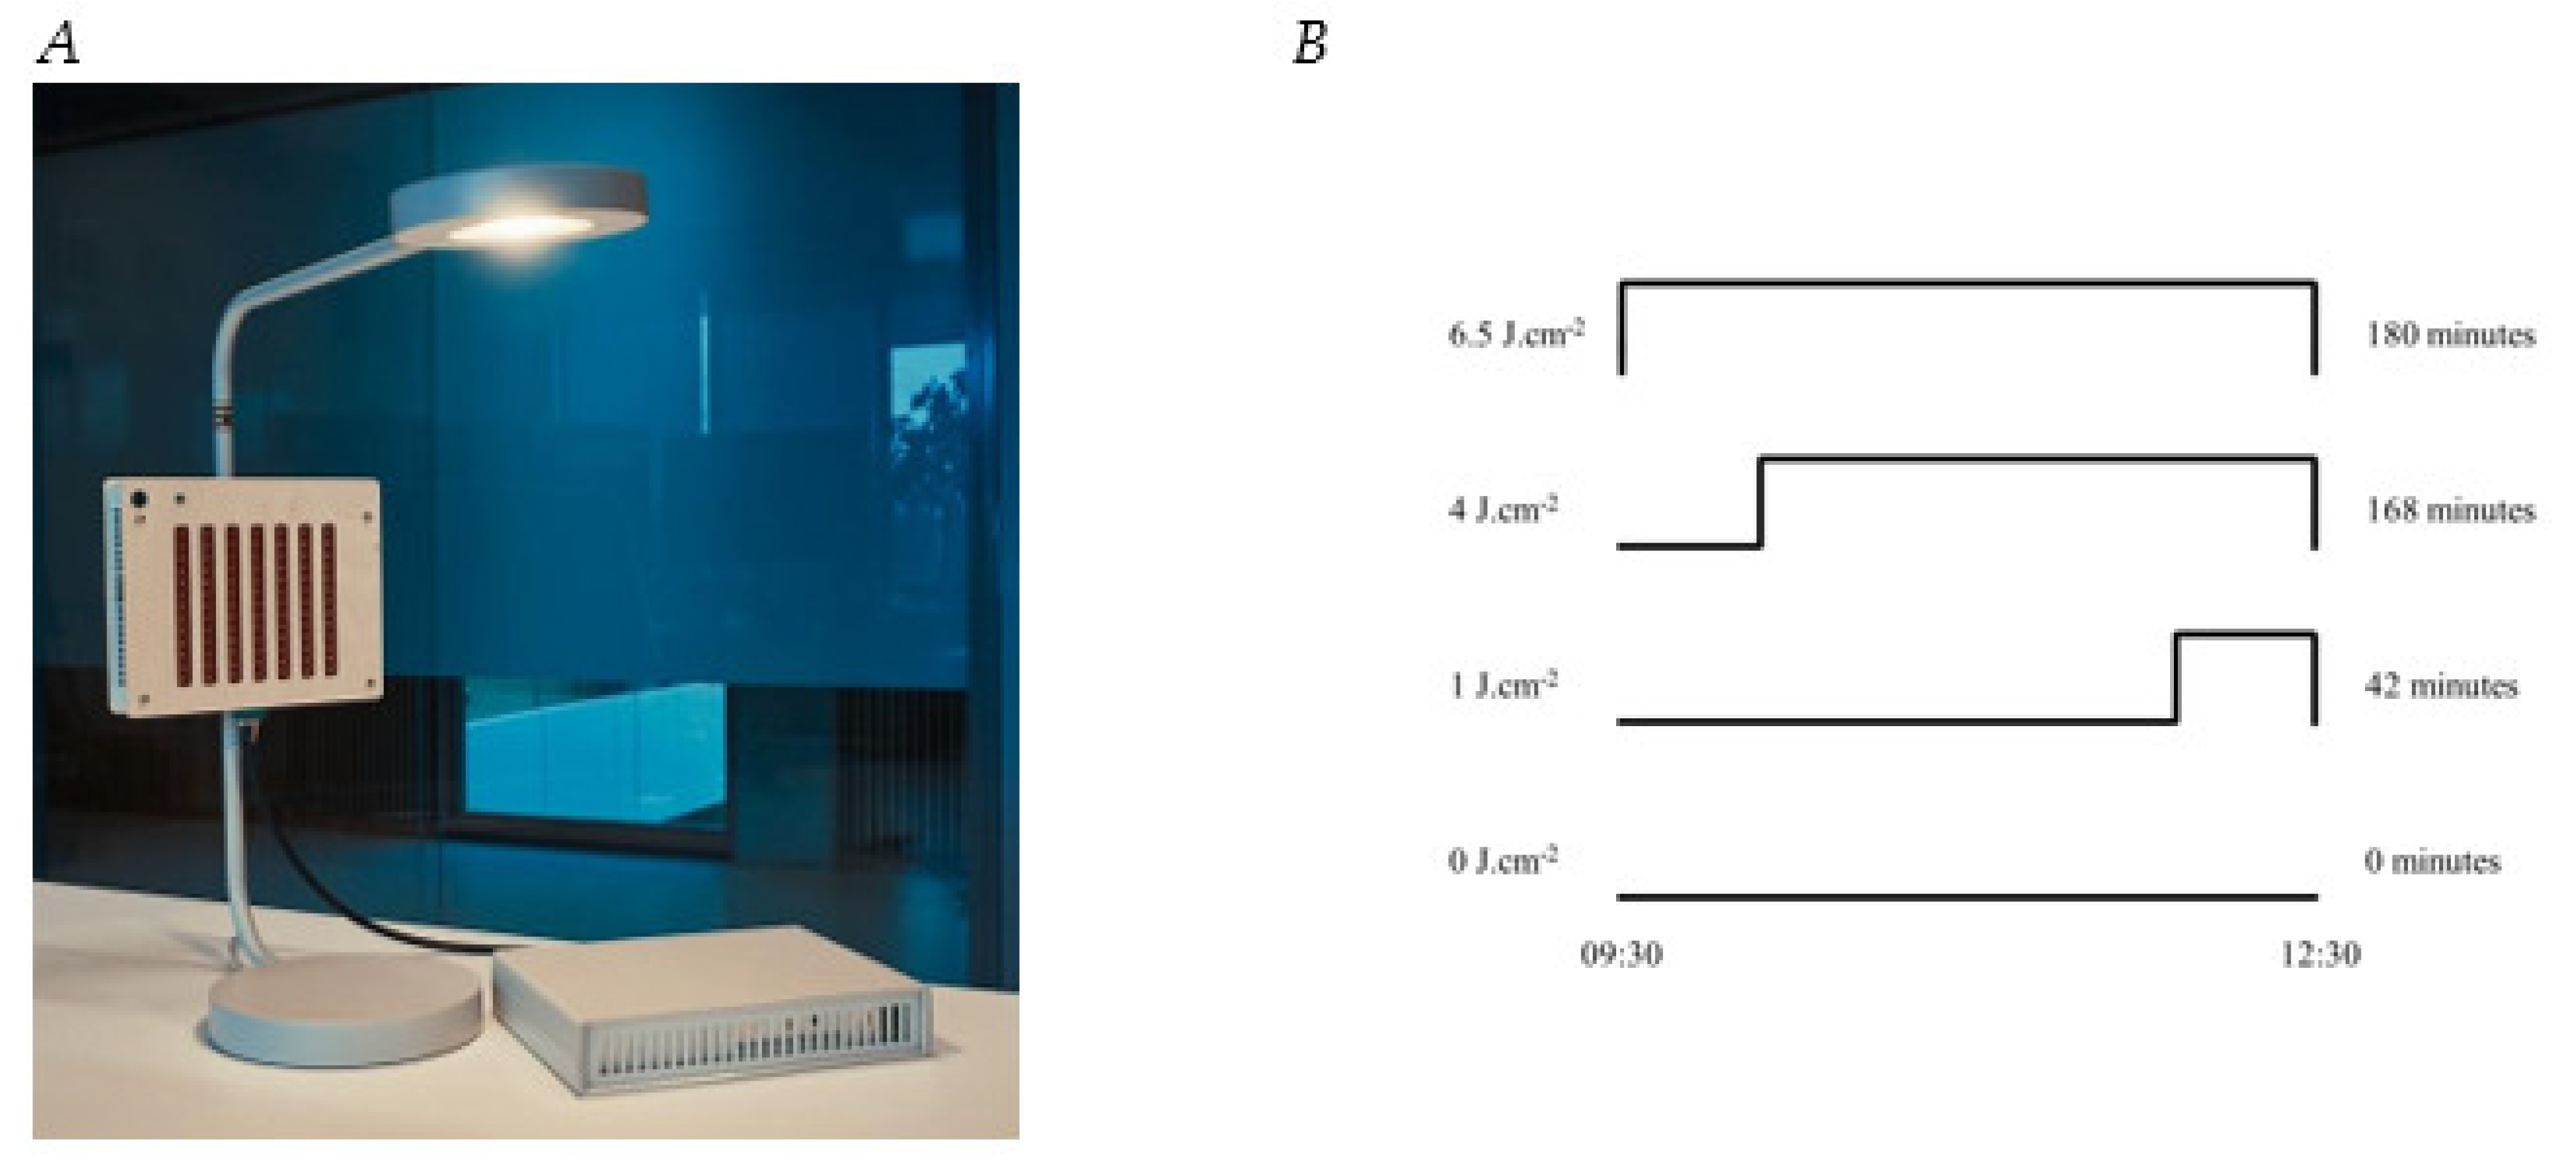
2.2.1. Device
2.2.2. Dose
2.3. Outcomes Assessment
2.3.1. Saliva Collection
2.3.2. Dim Light Melatonin Onset Assessment
2.3.3. aMTs6 Assessment
2.3.4. Cortisol Assessment
2.3.5. Cytokines and Vitamin D Assessments
2.3.6. Skin Temperature
2.3.7. Composite Scores for Well-Being, Health, and Sleep Quality
2.4. Data analysis
3. Results
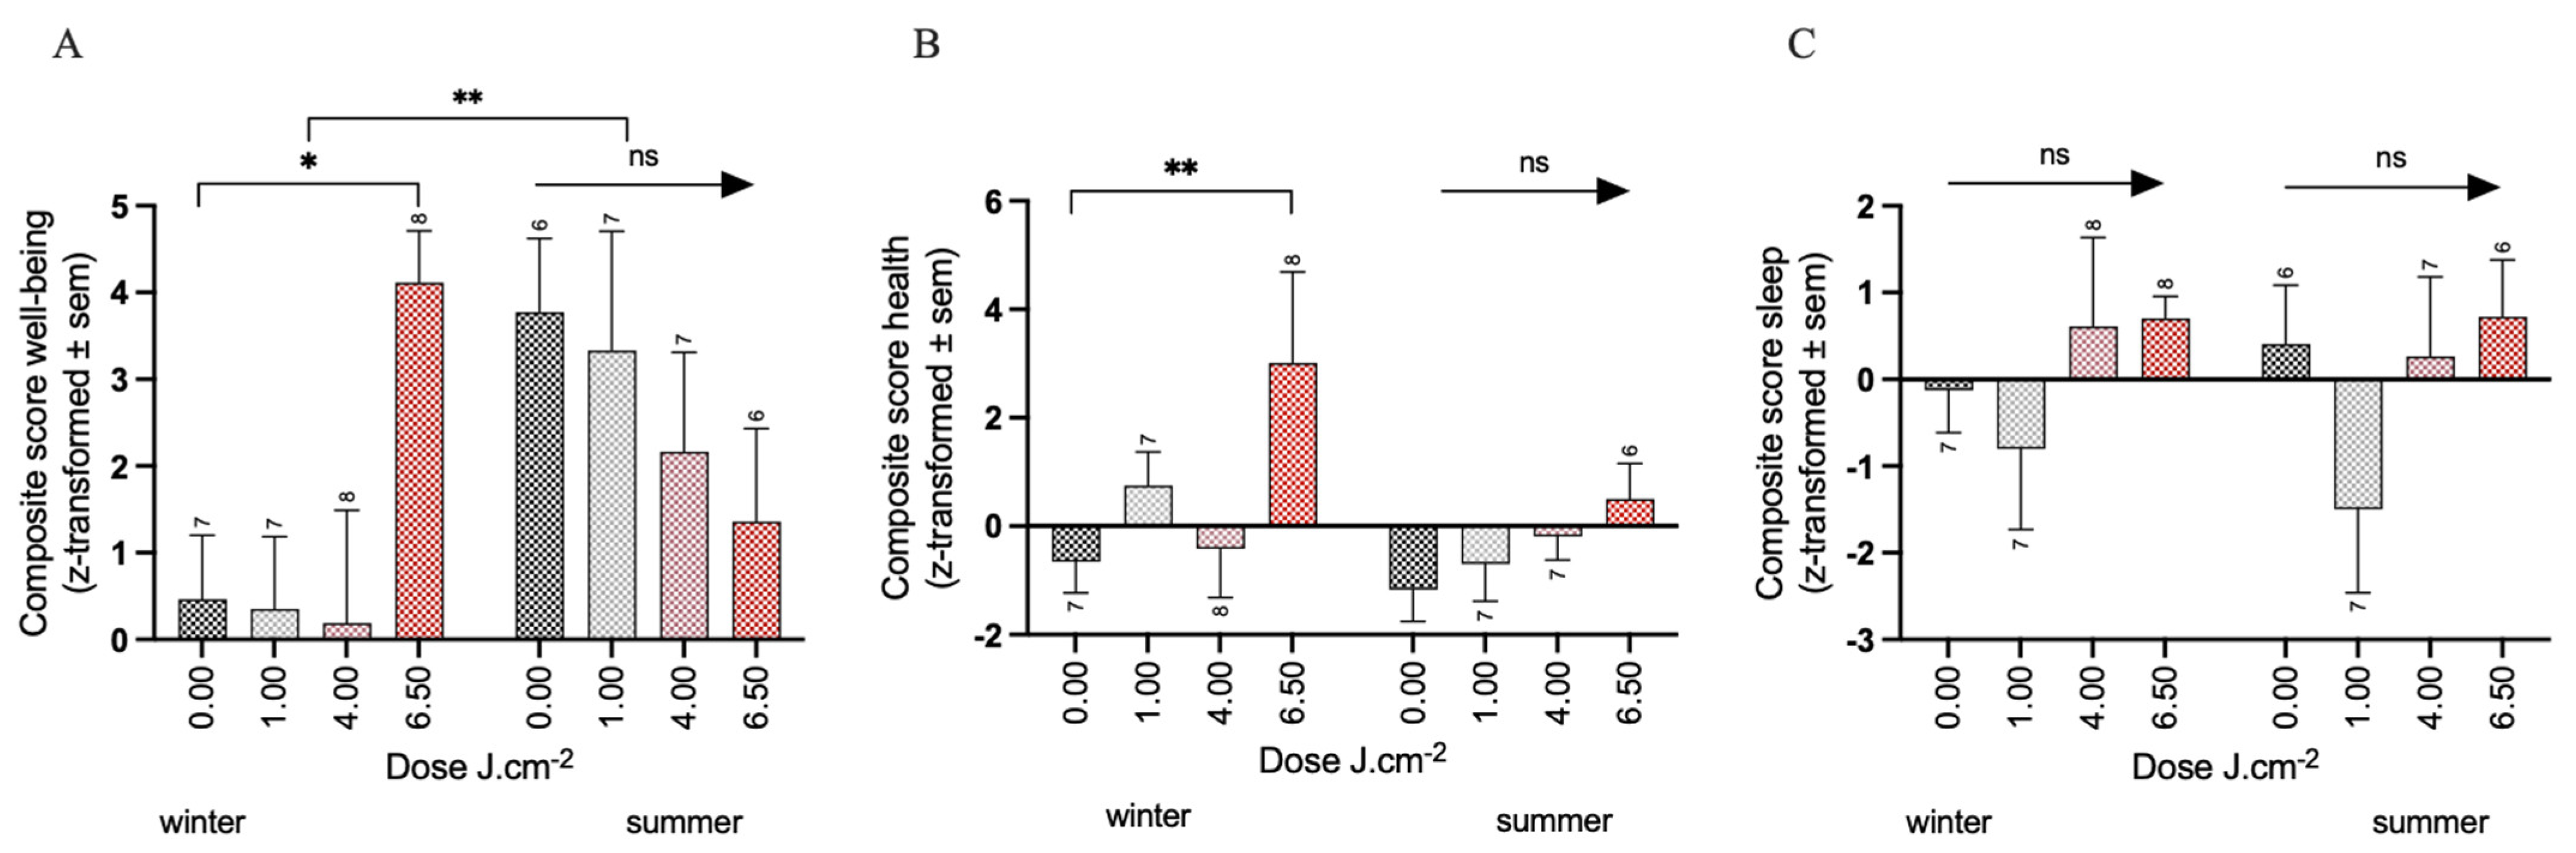
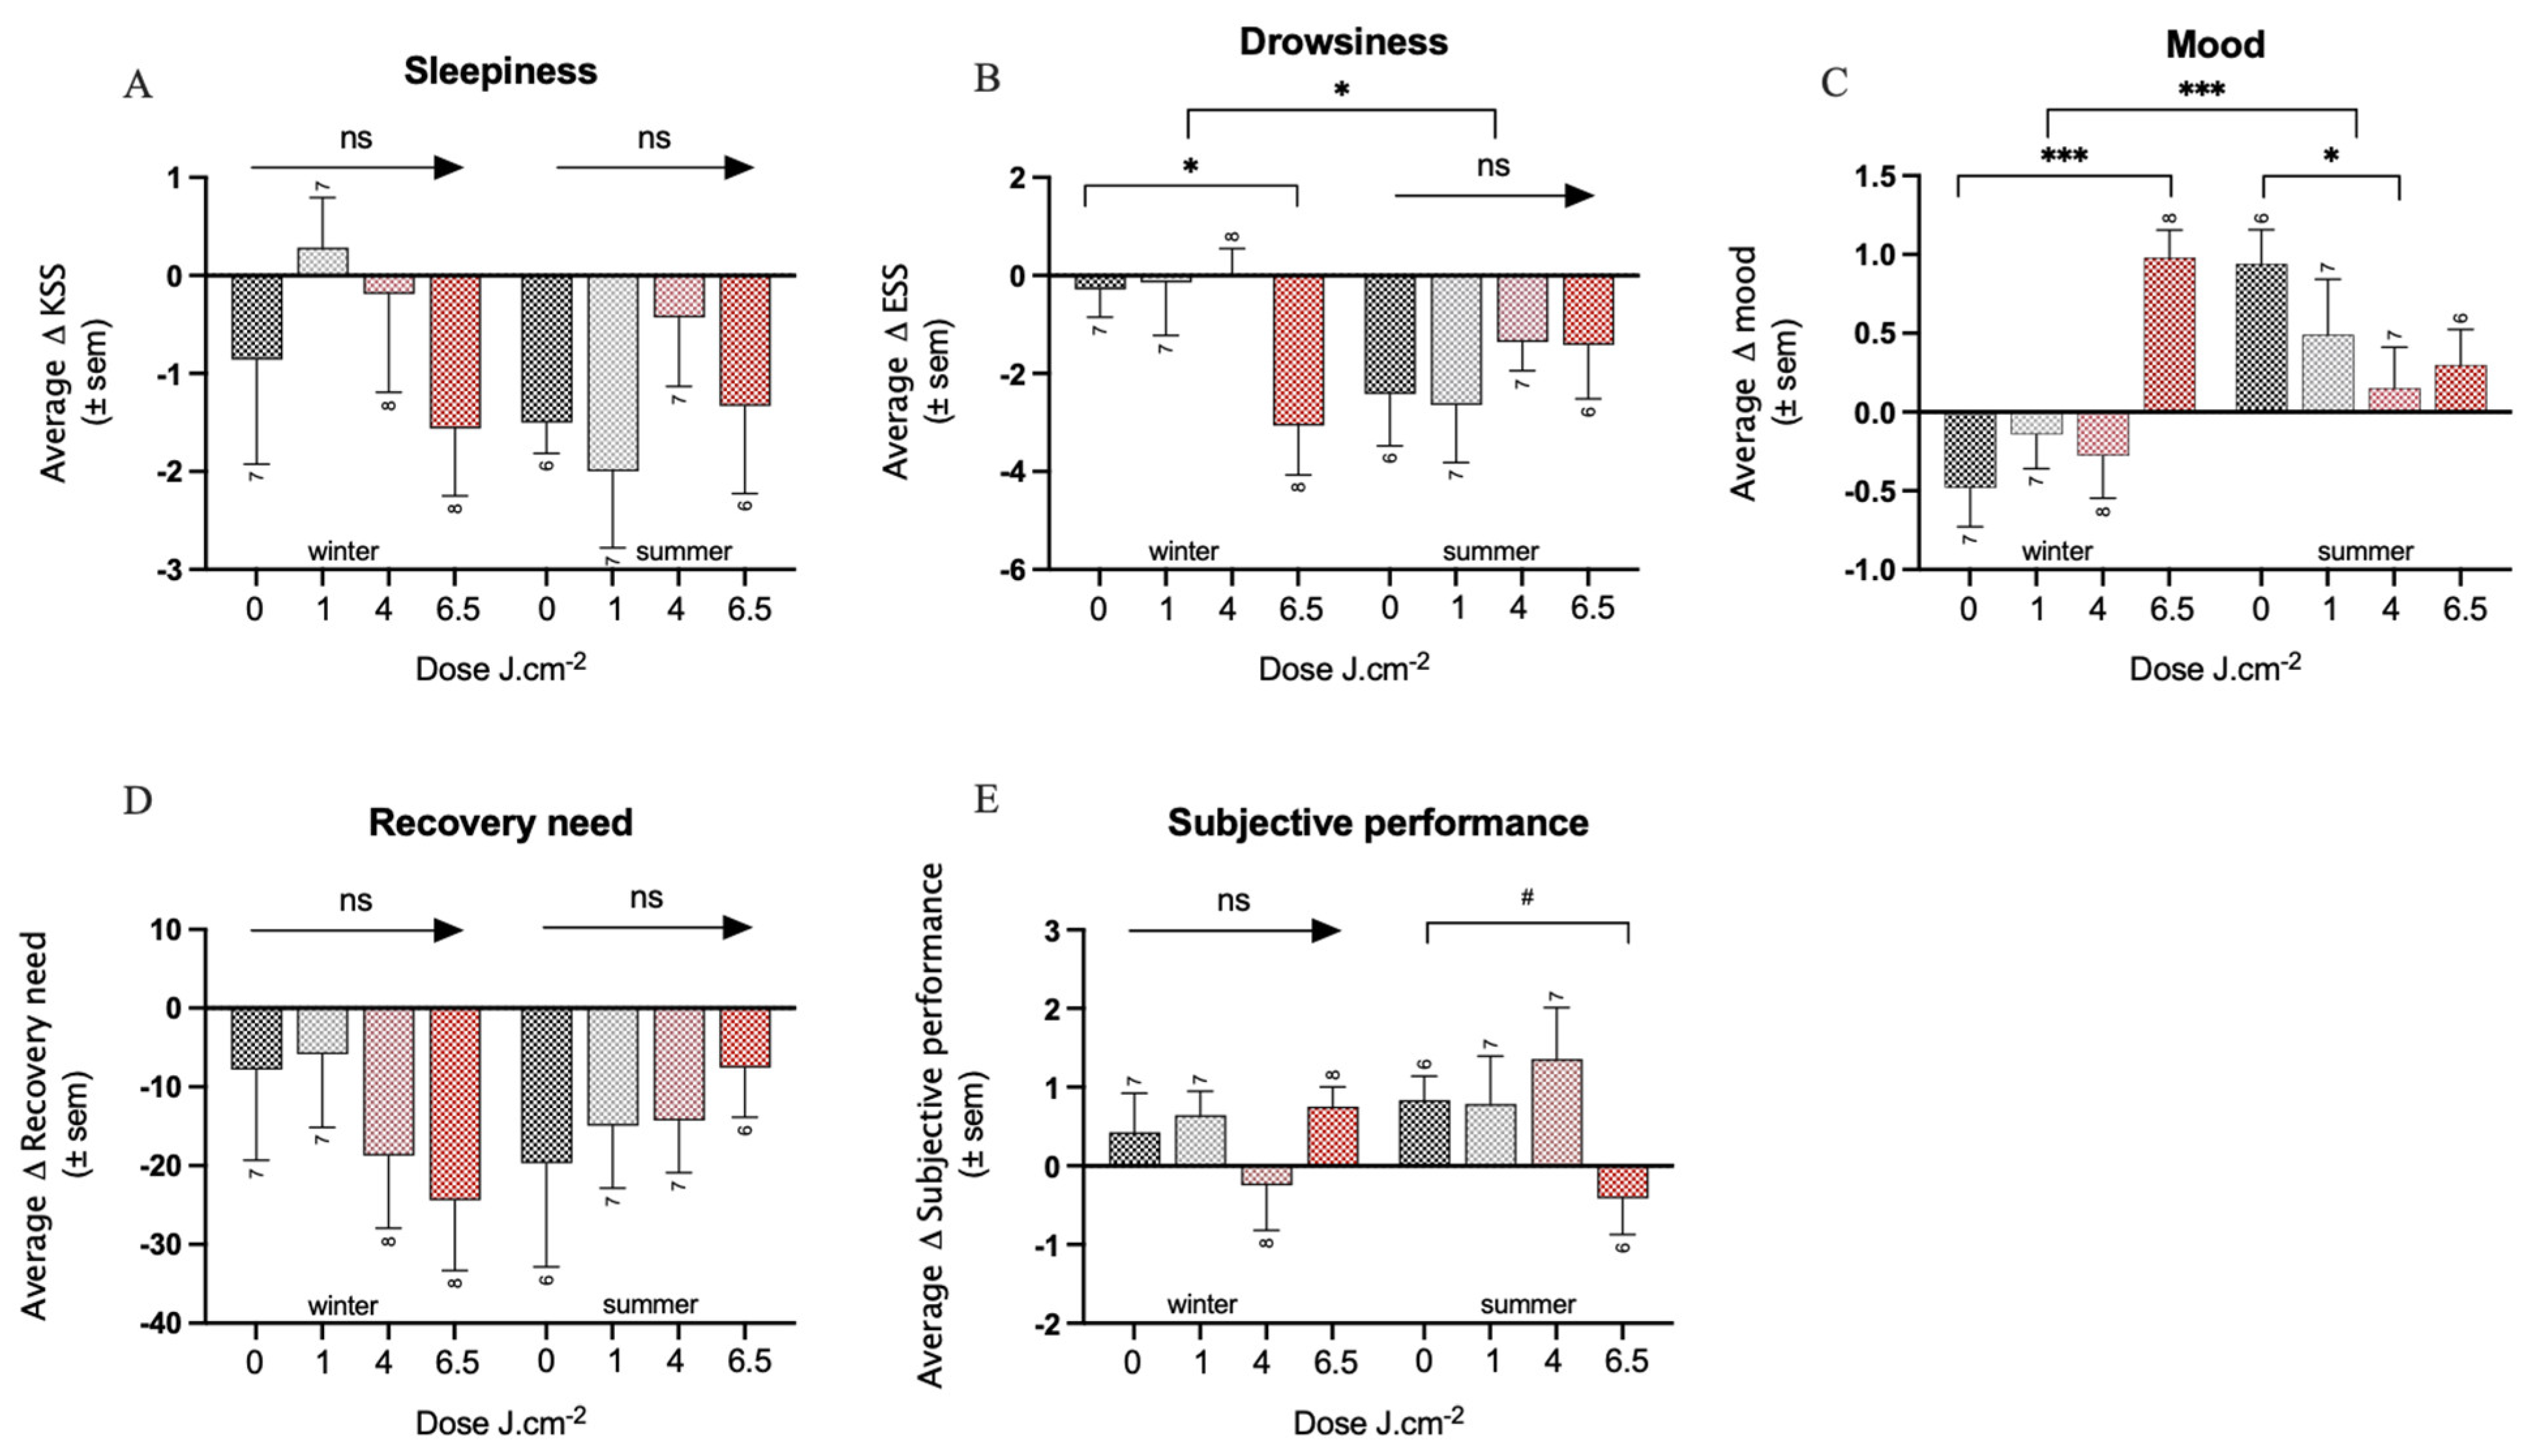
3.1. Effects of PBM Treatment on Well-Being
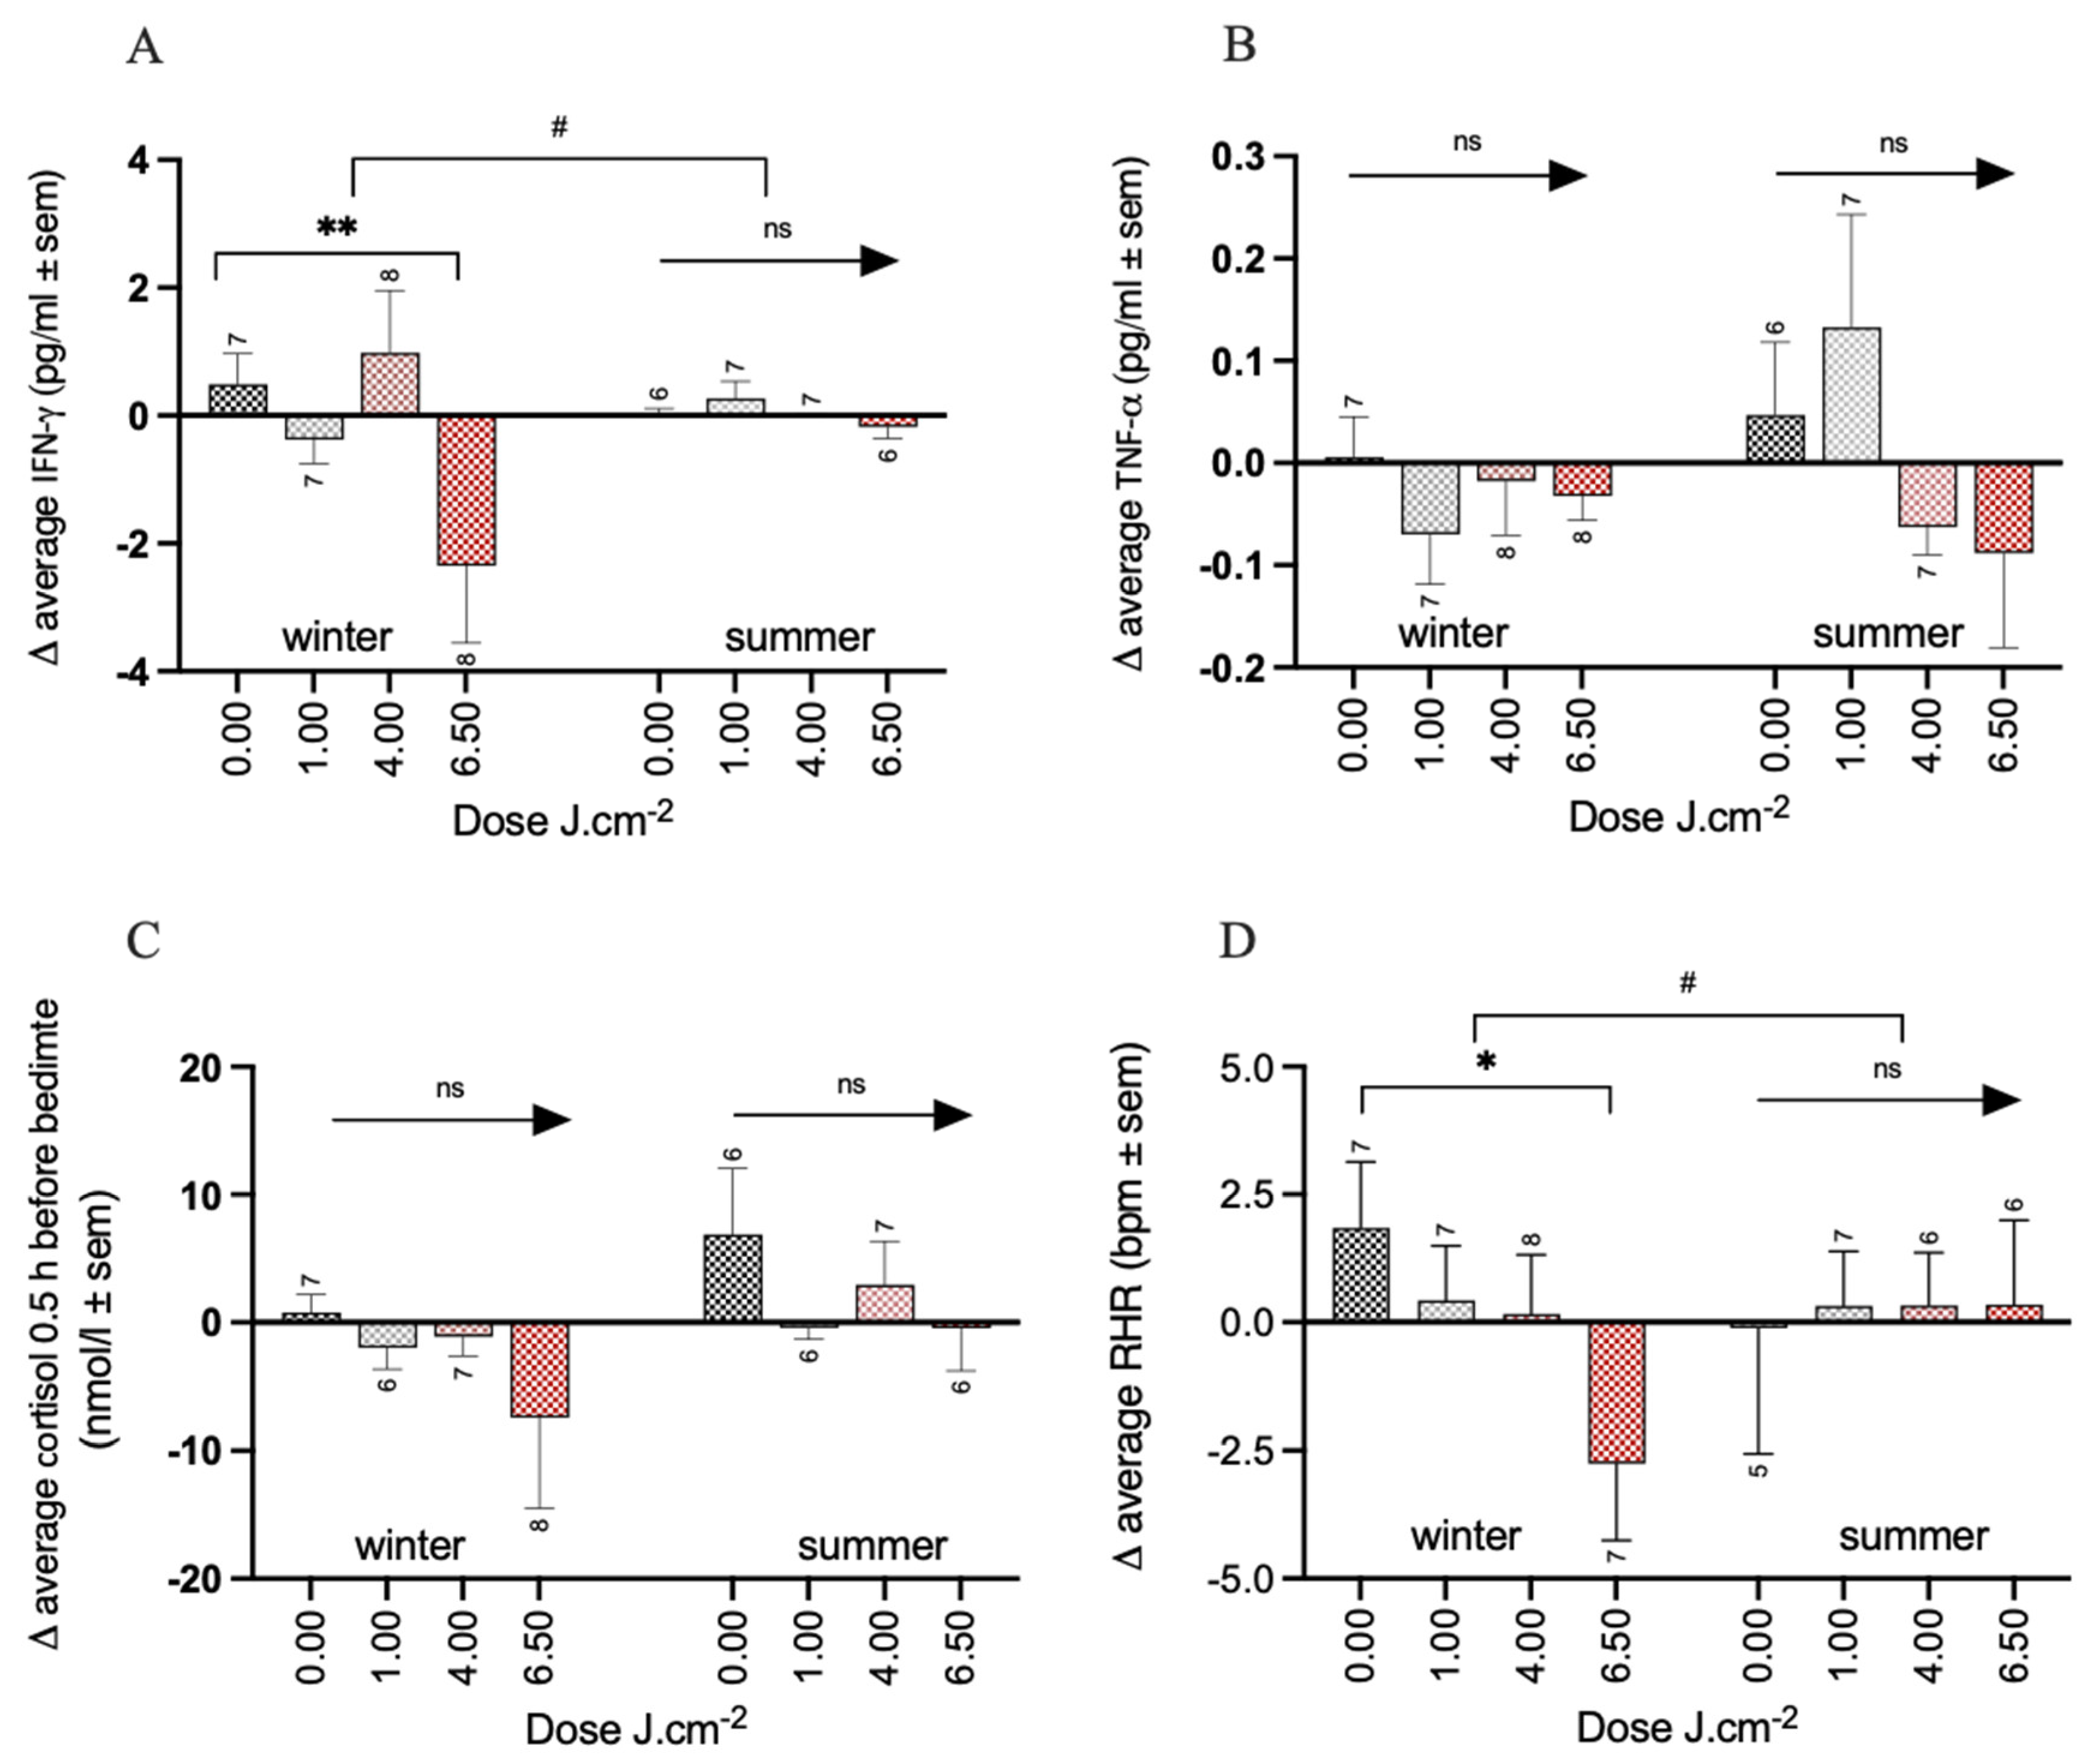
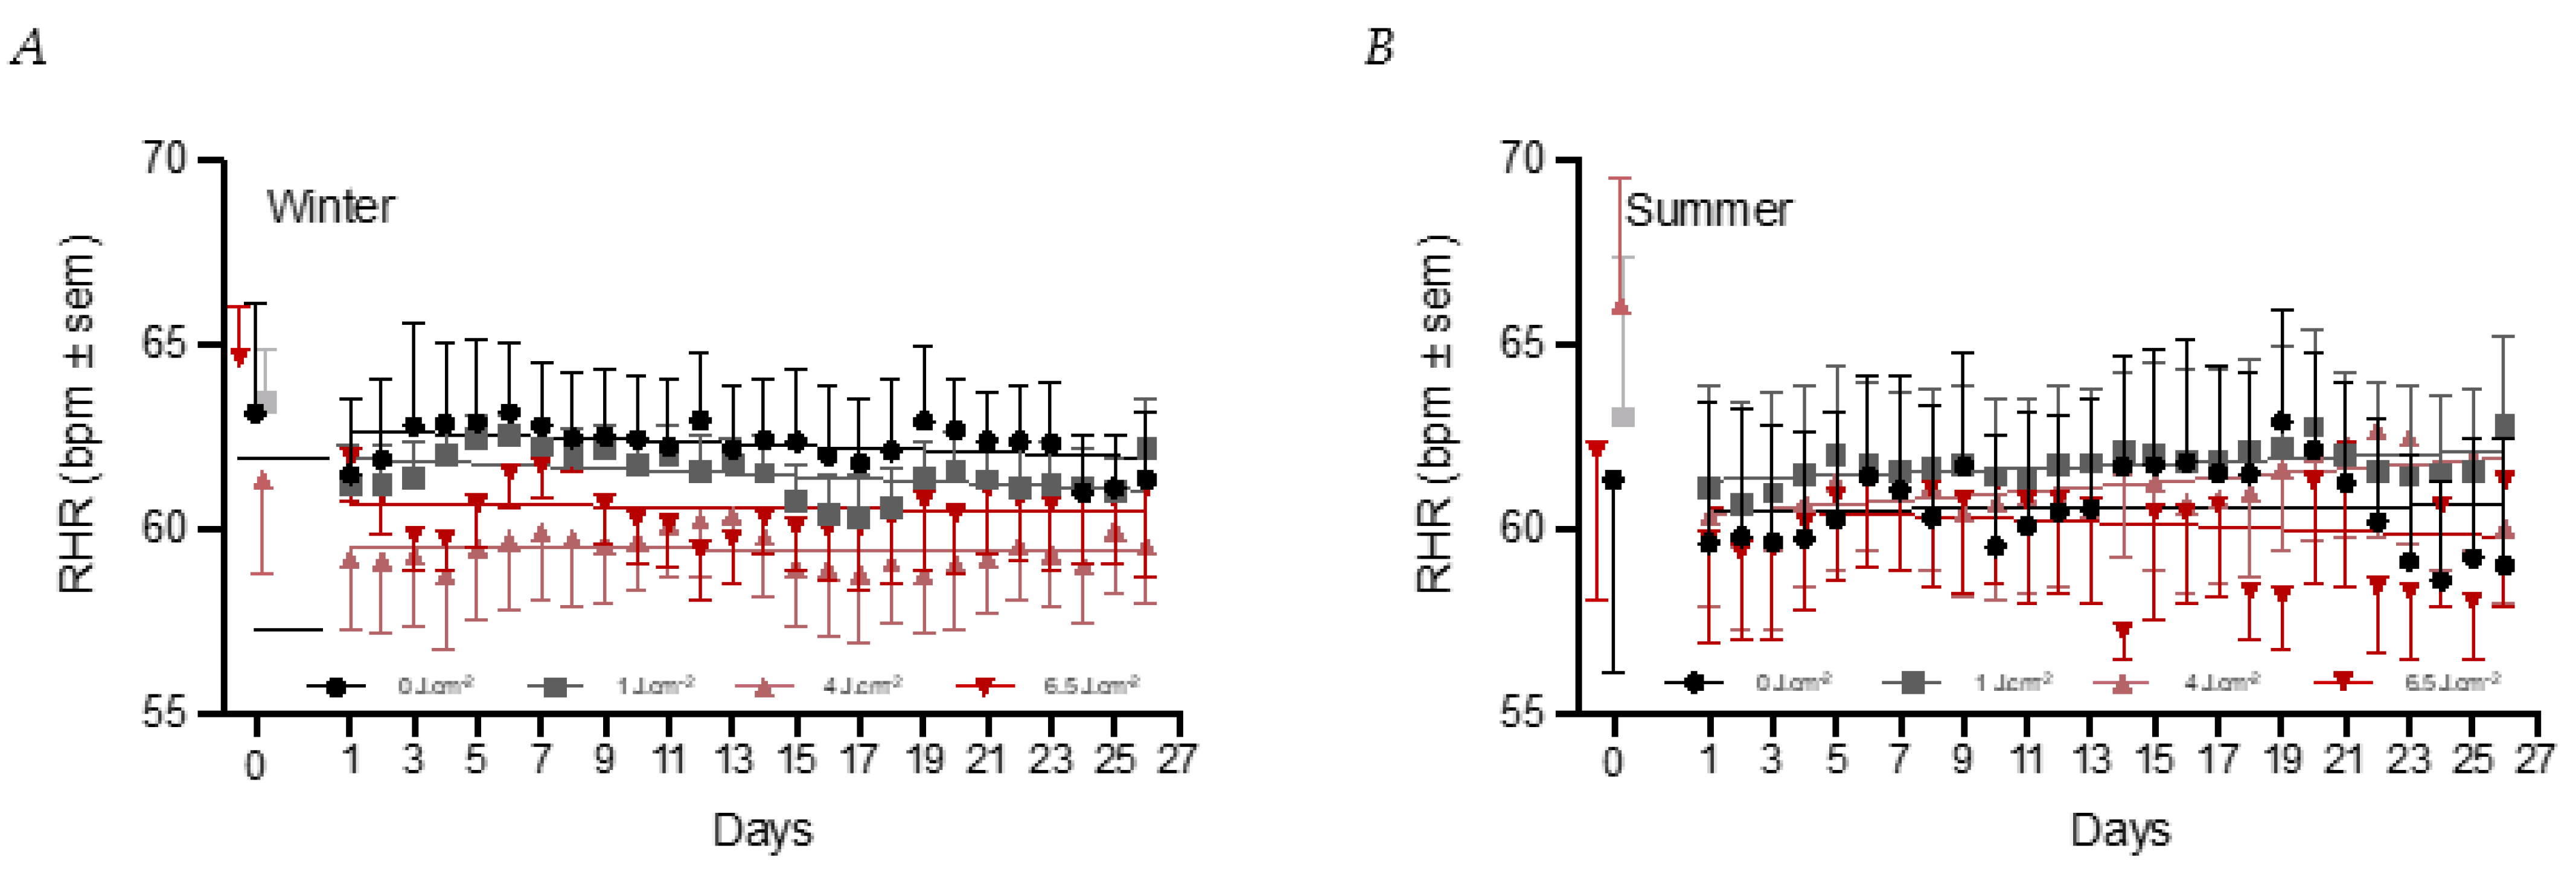
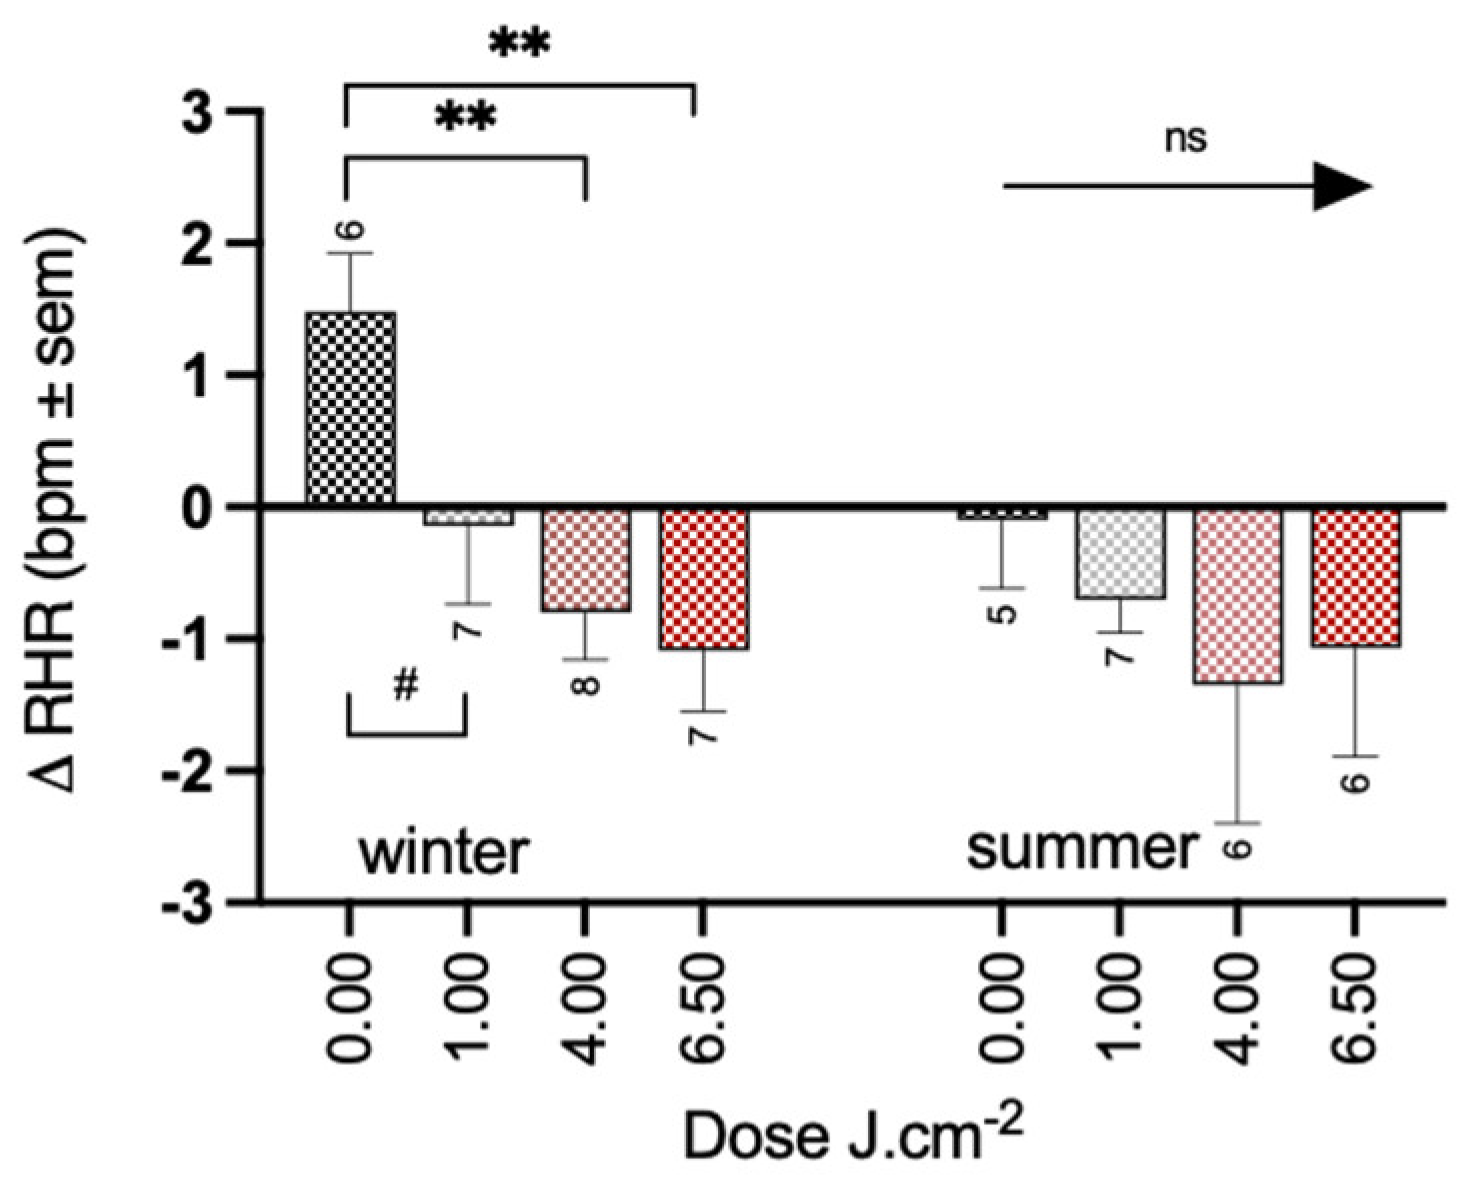
3.2. Effects of PBM Treatment on Health
3.3. Effects of PBM Treatment on Sleep Quality
3.4. Effects of PBM Treatment on Circadian Rhythm
3.5. Temperature
4. Discussion
5. Conclusions
6. Patents
Supplementary Materials
Author Contributions
Funding
Institutional Review Board Statement
Informed Consent Statement
Data Availability Statement
Acknowledgments
Conflicts of Interest
References
- Klepeis, N.E.; Nelson, W.C.; Ott, W.R.; Robinson, J.P.; Tsang, A.M.; Switzer, P.; Behar, J.V.; Hern, S.C.; Engelmann, W.H. The National Human Activity Pattern Survey (NHAPS): A resource for assessing exposure to environmental pollutants. J. Expo. Sci. Environ. Epidemiol. 2001, 11, 231–252. [Google Scholar] [CrossRef] [PubMed] [Green Version]
- Chang, S.-W.; Lee, H.-C. Vitamin D and health—The missing vitamin in humans. Pediatr. Neonatol. 2019, 60, 237–244. [Google Scholar] [CrossRef] [PubMed] [Green Version]
- Wacker, M.; Holick, M.F. Sunlight and Vitamin D: A Global Perspective for Health. Derm. Endocrinol. 2013, 5, 51–108. [Google Scholar] [CrossRef] [PubMed] [Green Version]
- Chellappa, S.L.; Gordijn, M.C.M.; Cajochen, C. Can light make us bright? Effects of light on cognition and sleep. In Progress in Brain Research; Elsevier: Amsterdam, The Netherlands, 2011; Volume 190, pp. 119–133. [Google Scholar]
- Barolet, D.; Christiaens, F.; Hamblin, M.R. Infrared and skin: Friend or foe. J. Photochem. Photobiol. B Biol. 2015, 155, 78–85. [Google Scholar] [CrossRef] [Green Version]
- Heiskanen, V.; Pfiffner, M.; Partonen, T. Sunlight and health: Shifting the focus from vitamin D3 to photobiomodulation by red and near-infrared light. Ageing Res. Rev. 2020, 61, 101089. [Google Scholar] [CrossRef]
- Mester, E.; Ludany, G.; Selyei, M.; Szende, B.; Total, G.J. The stimulating effect of low power laser rays on biological systems. Laser Rev. 1968, 1. [Google Scholar]
- Anders, J.J.; Lanzafame, R.J.; Arany, P.R. Low-Level Light/Laser Therapy Versus Photobiomodulation Therapy. Photomed. Laser Surg. 2015, 33, 183–184. [Google Scholar] [CrossRef] [Green Version]
- Hamblin, M.R.; Carroll, J.D.; de Freitas, L.F.; Huang, Y.-Y.; Ferraresi, C. Low-Level Light Therapy: Photobiomodulation; SPIE: Bellingham, WA, USA, 2018; ISBN 978-1-5106-1416-1. [Google Scholar]
- Khan, I.; Arany, P. Biophysical Approaches for Oral Wound Healing: Emphasis on Photobiomodulation. Adv. Wound Care 2015, 4, 724–737. [Google Scholar] [CrossRef] [Green Version]
- Fulop, A.M.; Dhimmer, S.; Deluca, J.R.; Johanson, D.D.; Lenz, R.V.; Patel, K.B.; Douris, P.C.; Enwemeka, C. A Meta-analysis of the Efficacy of Laser Phototherapy on Pain Relief. Clin. J. Pain 2010, 26, 729–736. [Google Scholar] [CrossRef]
- Elad, S.; Rn, K.K.F.C.; Lalla, R.V.; Yarom, N.; Hong, C.; Logan, R.M.; Bowen, J.; Gibson, R.; Dds, D.P.S.; Zadik, Y.; et al. MASCC/ISOO clinical practice guidelines for the management of mucositis secondary to cancer therapy. Cancer 2020, 126, 4423–4431. [Google Scholar] [CrossRef]
- Miranda-Silva, W.; Gomes-Silva, W.; Zadik, Y.; Yarom, N.; Al-Azri, A.R.; Hong, C.H.L.; Ariyawardana, A.; Saunders, D.P.; Correa, M.E.; Arany, P.R.; et al. MASCC/ISOO Clinical Practice Guidelines for the Management of Mucositis: Sub-Analysis of Current Interventions for the Management of Oral Mucositis in Pediatric Cancer Patients. Support. Care Cancer 2020, 29, 3539–3562. [Google Scholar] [CrossRef] [PubMed]
- Zadik, Y.; Arany, P.R.; Fregnani, E.R.; Bossi, P.; Antunes, H.S.; Bensadoun, R.-J.; Gueiros, L.A.; Majorana, A.; Nair, R.G.; Ranna, V.; et al. Systematic Review of Photobiomodulation for the Management of Oral Mucositis in Cancer Patients and Clinical Practice Guidelines. Support. Care Cancer 2019, 27, 3969–3983. [Google Scholar] [CrossRef] [PubMed] [Green Version]
- Huang, Y.-Y.; Sharma, S.K.; Carroll, J.; Hamblin, M.R. Biphasic Dose Response in Low Level Light Therapy—An Update. Dose-Response Publ. Int. Hormesis Soc. 2011, 9, 602–618. [Google Scholar] [CrossRef] [PubMed]
- Amaroli, A.; Ravera, S.; Baldini, F.; Benedicenti, S.; Panfoli, I.; Vergani, L. Photobiomodulation with 808-nm diode laser light promotes wound healing of human endothelial cells through increased reactive oxygen species production stimulating mitochondrial oxidative phosphorylation. Lasers Med. Sci. 2018, 34, 495–504. [Google Scholar] [CrossRef] [PubMed]
- Arany, P.R.; Cho, A.; Hunt, T.D.; Sidhu, G.; Shin, K.; Hahm, E.; Huang, G.X.; Weaver, J.; Chen, A.C.-H.; Padwa, B.L.; et al. Photoactivation of Endogenous Latent Transforming Growth Factor–β1 Directs Dental Stem Cell Differentiation for Regeneration. Sci. Transl. Med. 2014, 6, 238ra69. [Google Scholar] [CrossRef] [Green Version]
- Caldieraro, M.A.; Cassano, P. Transcranial and systemic photobiomodulation for major depressive disorder: A systematic review of efficacy, tolerability and biological mechanisms. J. Affect. Disord. 2018, 243, 262–273. [Google Scholar] [CrossRef]
- Chen, A.C.-H.; Arany, P.; Huang, Y.; Tomkinson, E.M.; Sharma, S.K.; Kharkwal, G.B.; Saleem, T.; Mooney, D.; Yull, F.; Blackwell, T.S.; et al. Low-Level Laser Therapy Activates NF-kB via Generation of Reactive Oxygen Species in Mouse Embryonic Fibroblasts. PLoS ONE 2011, 6, e22453. [Google Scholar] [CrossRef] [Green Version]
- Hamblin, M.R.; Liebert, A. Photobiomodulation Therapy Mechanisms Beyond Cytochrome c Oxidase. Photobiomodulation, Photomedicine, Laser Surg. 2022, 40, 75–77. [Google Scholar] [CrossRef]
- Karu, T. Mitochondrial Mechanisms of Photobiomodulation in Context of New Data About Multiple Roles of ATP. Photomed. Laser Surg. 2010, 28, 159–160. [Google Scholar] [CrossRef] [Green Version]
- Lan, C.-C.E.; Wu, S.-B.; Wu, C.-S.; Shen, Y.-C.; Chiang, T.-Y.; Wei, Y.-H.; Yu, H.-S. Induction of primitive pigment cell differentiation by visible light (helium–neon laser): A photoacceptor-specific response not replicable by UVB irradiation. J. Mol. Med. Berl. Ger. 2011, 90, 321–330. [Google Scholar] [CrossRef]
- Oron, U.; Ilic, S.; De Taboada, L.; Streeter, J. Ga-As (808 nm) Laser Irradiation Enhances ATP Production in Human Neuronal Cells in Culture. Photomed. Laser Surg. 2007, 25, 180–182. [Google Scholar] [CrossRef] [PubMed]
- Sommer, A.P. Mitochondrial cytochrome c oxidase is not the primary acceptor for near infrared light—It is mitochondrial bound water: The principles of low-level light therapy. Ann. Transl. Med. 2019, 7, S13. [Google Scholar] [CrossRef] [PubMed]
- Sommer, A.P.; Trelles, M.A. Light Pumping Energy Into Blood Mitochondria: A New Trend Against Depression? Photomed. Laser Surg. 2014, 32, 59–60. [Google Scholar] [CrossRef] [PubMed]
- Alonso, P.T.; Schapochnik, A.; Klein, S.; Brochetti, R.; Damazo, A.S.; Destro, M.F.D.S.S.; Lino-Dos-Santos-Franco, A. Transcutaneous systemic photobiomodulation reduced lung inflammation in experimental model of asthma by altering the mast cell degranulation and interleukin 10 level. Lasers Med. Sci. 2021, 37, 1101–1109. [Google Scholar] [CrossRef] [PubMed]
- Johnstone, D.M.; Hamilton, C.; Gordon, L.C.; Moro, C.; Torres, N.; Nicklason, F.; Stone, J.; Benabid, A.-L.; Mitrofanis, J. Exploring the Use of Intracranial and Extracranial (Remote) Photobiomodulation Devices in Parkinson’s Disease: A Comparison of Direct and Indirect Systemic Stimulations. J. Alzheimer’s Dis. 2021, 83, 1399–1413. [Google Scholar] [CrossRef]
- Rodrigo, S.M.; Cunha, A.; Pozza, D.H.; Blaya, D.S.; Moraes, J.F.; Weber, J.B.B.; De Oliveira, M.G. Analysis of the Systemic Effect of Red and Infrared Laser Therapy on Wound Repair. Photomed. Laser Surg. 2009, 27, 929–935. [Google Scholar] [CrossRef] [Green Version]
- Avci, P.; Gupta, A.; Sadasivam, M.; Vecchio, D.; Pam, Z.; Pam, N.; Hamblin, M.R. Low-level laser (light) therapy (LLLT) in skin: Stimulating, healing, restoring. Semin. Cutan. Med. Surg. 2013, 32, 41–52. [Google Scholar]
- Andreazza, A.C.; Andersen, M.L.; Alvarenga, T.A.; De-Oliveira, M.R.; Armani, F.; Ruiz, F.S.; Giglio, L.; Moreira, J.C.; Kapczinski, F.; Tufik, S. Impairment of the mitochondrial electron transport chain due to sleep deprivation in mice. J. Psychiatr. Res. 2010, 44, 775–780. [Google Scholar] [CrossRef]
- Saner, N.J.; Bishop, D.; Bartlett, J.D. Is exercise a viable therapeutic intervention to mitigate mitochondrial dysfunction and insulin resistance induced by sleep loss? Sleep Med. Rev. 2018, 37, 60–68. [Google Scholar] [CrossRef]
- Bourdillon, N.; Jeanneret, F.; Nilchian, M.; Albertoni, P.; Ha, P.; Millet, G.P. Sleep Deprivation Deteriorates Heart Rate Variability and Photoplethysmography. Front. Neurosci. 2021, 15, 642548. [Google Scholar] [CrossRef]
- Camps, J.; García-Heredia, A. Introduction: Oxidation and Inflammation, A Molecular Link Between Non-Communicable Diseases. In Oxidative Stress and Inflammation in Non-communicable Diseases—Molecular Mechanisms and Perspectives in Therapeutics; Camps, J., Ed.; Advances in Experimental Medicine and Biology; Springer International Publishing: Cham, Switzerland, 2014; pp. 1–4. ISBN 978-3-319-07320-0. [Google Scholar]
- Covassin, N.; Singh, P. Sleep Duration and Cardiovascular Disease Risk. Sleep Med. Clin. 2016, 11, 81–89. [Google Scholar] [CrossRef] [PubMed] [Green Version]
- Pieczenik, S.R.; Neustadt, J. Mitochondrial dysfunction and molecular pathways of disease. Exp. Mol. Pathol. 2007, 83, 84–92. [Google Scholar] [CrossRef] [PubMed]
- Hirshkowitz, M.; Whiton, K.; Albert, S.M.; Alessi, C.; Bruni, O.; DonCarlos, L.; Hazen, N.; Herman, J.; Adams Hillard, P.J.; Katz, E.S.; et al. National Sleep Foundation’s updated sleep duration recommendations: Final report. Sleep Health 2015, 1, 233–243. [Google Scholar] [CrossRef] [PubMed]
- Roenneberg, T.; Merrow, M. Entrainment of the Human Circadian Clock. Cold Spring Harb. Symp. Quant. Biol. 2007, 72, 293–299. [Google Scholar] [CrossRef] [Green Version]
- Buysse, D.J.; Reynolds, C.F., III; Monk, T.H.; Berman, S.R.; Kupfer, D.J. The Pittsburgh sleep quality index: A new instrument for psychiatric practice and research. Psychiatry Res. 1989, 28, 193–213. [Google Scholar] [CrossRef]
- Johns, M.W. A New Method for Measuring Daytime Sleepiness: The Epworth Sleepiness Scale. Sleep 1991, 14, 540–545. [Google Scholar] [CrossRef] [Green Version]
- Beck, A.T.; Ward, C.; Mendelson, M. Beck Depression Inventory (BDI). Arch. Gen. Psychiatry 1961, 4, 561–571. [Google Scholar] [CrossRef] [Green Version]
- Brondon, P.; Stadler, I.; Lanzafame, R.J. Pulsing influences photoradiation outcomes in cell culture. Lasers Surg. Med. 2009, 41, 222–226. [Google Scholar] [CrossRef]
- Hashmi, J.T.; Huang, Y.-Y.; Sharma, S.K.; Kurup, D.B.; De Taboada, L.; Carroll, J.D.; Hamblin, M.R. Effect of pulsing in low-level light therapy. Lasers Surg. Med. 2010, 42, 450–466. [Google Scholar] [CrossRef] [Green Version]
- Åkerstedt, T.; Gillberg, M. Subjective and Objective Sleepiness in the Active Individual. Int. J. Neurosci. 1990, 52, 29–37. [Google Scholar] [CrossRef]
- Sluiter, J.K.; de Croon, E.M.; Meijman, T.F.; Frings-Dresen, M.H.W. Need for recovery from work related fatigue and its role in the development and prediction of subjective health complaints. Occup. Environ. Med. 2003, 60, 62i–70. [Google Scholar] [CrossRef] [PubMed] [Green Version]
- van Ockenburg, S.; Schenk, H.; van der Veen, A.; van Rossum, E.; Kema, I.; Rosmalen, J. The relationship between 63 days of 24-h urinary free cortisol and hair cortisol levels in 10 healthy individuals. Psychoneuroendocrinology 2016, 73, 142–147. [Google Scholar] [CrossRef] [PubMed]
- Chinoy, E.D.; Cuellar, J.A.; Huwa, K.E.; Jameson, J.T.; Watson, C.H.; Bessman, S.C.; Hirsch, D.A.; Cooper, A.D.; Drummond, S.P.A.; Markwald, R.R. Performance of seven consumer sleep-tracking devices compared with polysomnography. Sleep 2021, 44, zsaa291. [Google Scholar] [CrossRef]
- Fell, G.L.; Robinson, K.C.; Mao, J.; Woolf, C.J.; Fisher, D.E. Skin β-Endorphin Mediates Addiction to UV Light. Cell 2014, 157, 1527–1534. [Google Scholar] [CrossRef] [PubMed] [Green Version]
- Holick, M.F. Vitamin D: A D-Lightful health perspective: Nutrition Reviews©. Nutr. Rev. 2008, 66, S182–S194. [Google Scholar] [CrossRef] [PubMed]
- Levins, P.; Carr, D.; Fisher, J.; Momtaz, K.; Parrish, J. Plasma β-endorphin and β-lipotropin response to ultraviolet radiation. Lancet 1983, 322, 166. [Google Scholar] [CrossRef] [PubMed]
- van Sark, W. Simulating performance of solar cells with spectral downshifting layers. Thin Solid Films 2008, 516, 6808–6812. [Google Scholar] [CrossRef] [Green Version]
- Salehpour, F.; Mahmoudi, J.; Kamari, F.; Sadigh-Eteghad, S.; Rasta, S.H.; Hamblin, M.R. Brain Photobiomodulation Therapy: A Narrative Review. Mol. Neurobiol. 2018, 55, 6601–6636. [Google Scholar] [CrossRef]
- Askalsky, P.; Iosifescu, D.V. Transcranial Photobiomodulation for The Management Of Depression: Current Perspectives. Neuropsychiatr. Dis. Treat. 2019, 15, 3255–3272. [Google Scholar] [CrossRef] [Green Version]
- Henderson, T.A.; Morries, L.; Cassano, P. Treatments for traumatic brain injury with emphasis on transcranial near-infrared laser phototherapy. Neuropsychiatr. Dis. Treat. 2015, 11, 2159–2175. [Google Scholar] [CrossRef] [Green Version]
- Mersch, P.; Middendorp, H.; Bouhuys, A.; Beersma, D.; van den Hoofdakker, R.H. The Prevelance of Seasonal Affective Disorder in the Netherlands: A Prospective and Retrospective Study of Seasonal Mood Variation in the General Population. Biol. Psychiatry 1999, 45, 1013–1022. [Google Scholar] [CrossRef] [PubMed] [Green Version]
- Billiau, A.; Matthys, P. Interferon-γ: A historical perspective. Cytokine Growth Factor Rev. 2009, 20, 97–113. [Google Scholar] [CrossRef] [PubMed]
- Kak, G.; Raza, M.; Tiwari, B.K. Interferon-gamma (IFN-γ): Exploring its implications in infectious diseases. Biomol. Concepts 2018, 9, 64–79. [Google Scholar] [CrossRef] [PubMed]
- Muili, K.A.; Gopalakrishnan, S.; Meyer, S.L.; Eells, J.T.; Lyons, J.-A. Amelioration of Experimental Autoimmune Encephalomyelitis in C57BL/6 Mice by Photobiomodulation Induced by 670 nm Light. PLoS ONE 2012, 7, e30655. [Google Scholar] [CrossRef] [PubMed] [Green Version]
- Tolentino, M.; Cho, C.C.; Lyons, J.-A. Photobiomodulation Therapy (PBMT) Regulates the Production of IL-10 and IFN-Ɣ by Peripheral Blood Mononuclear Cells (PBMC) and CD4+ T Cells Isolated from Subjects with Multiple Sclerosis (MS). J. Immunol. 2019, 202, 193.16. [Google Scholar] [CrossRef]
- R Hamblin, M. 1 Wellman Center for Photomedicine, Massachusetts General Hospital, BAR414, 40 Blossom Street, Boston, MA 02114, USA; 2 Department of Dermatology, Harvard Medical School, Boston, MA 02115, USA; 3 Harvard-MIT Division of Health Sciences and Technology, Cambridge, MA 02139, USA Mechanisms and Applications of the Anti-Inflammatory Effects of Photobiomodulation. AIMS Biophys. 2017, 4, 337–361. [Google Scholar] [CrossRef]
- Ailioaie, L.; Litscher, G. Probiotics, Photobiomodulation, and Disease Management: Controversies and Challenges. Int. J. Mol. Sci. 2021, 22, 4942. [Google Scholar] [CrossRef]
- Liebert, A.; Bicknell, B.; Markman, W.; Kiat, H. A Potential Role for Photobiomodulation Therapy in Disease Treatment and Prevention in the Era of COVID-19. Aging Dis. 2020, 11, 1352–1362. [Google Scholar] [CrossRef]
- Mal, P.; Mukherjee, T.; Upadhyay, A.K.; Mohanty, S.; Pattnaik, A.K. Connecting the dots between inflammatory cascades of obesity and COVID-19 in light of mortal consequences—A review. Environ. Sci. Pollut. Res. 2022, 29, 57040–57053. [Google Scholar] [CrossRef]
- AlZamil, H. Elevated Serum TNF-α Is Related to Obesity in Type 2 Diabetes Mellitus and Is Associated with Glycemic Control and Insulin Resistance. J. Obes. 2020, 2020, 5076858. [Google Scholar] [CrossRef] [Green Version]
- Wärnberg, J.; the AVENA group; Moreno, L.A.; Mesana, M.I.; Marcos, A. Inflammatory mediators in overweight and obese Spanish adolescents. The AVENA Study. Int. J. Obes. 2004, 28, S59–S63. [Google Scholar] [CrossRef] [PubMed] [Green Version]
- Ellulu, M.S.; Patimah, I.; KhazáAi, H.; Rahmat, A.; Abed, Y. Obesity and inflammation: The linking mechanism and the complications. Arch. Med. Sci. 2017, 13, 851–863. [Google Scholar] [CrossRef] [PubMed]
- Hotamisligil, G.S.; Shargill, N.S.; Spiegelman, B.M. Adipose Expression of Tumor Necrosis Factor-α: Direct Role in Obesity-Linked Insulin Resistance. Science 1993, 259, 87–91. [Google Scholar] [CrossRef] [PubMed]
- Wong-Riley, M.T.T.; Bai, X.; Buchmann, E.; Whelan, H.T. Light-emitting diode treatment reverses the effect of TTX on cytochrome oxidase in neurons. NeuroReport 2001, 12, 3033–3037. [Google Scholar] [CrossRef]
- Kim, B.; Brandli, A.; Mitrofanis, J.; Stone, J.; Purushothuman, S.; Johnstone, D.M. Remote tissue conditioning—An emerging approach for inducing body-wide protection against diseases of ageing. Ageing Res. Rev. 2017, 37, 69–78. [Google Scholar] [CrossRef]
- Oren, D.A. Humoral Phototransduction: Blood Is a Messenger. Neuroscience 1996, 2, 207–210. [Google Scholar] [CrossRef]
- Oren, D.A.; Koziorowski, M.; Desan, P.H. SAD and the Not-So-Single Photoreceptors. Am. J. Psychiatry 2013, 170, 1403–1412. [Google Scholar] [CrossRef]
- Koorengevel, K.M.; Gordijn, M.C.; Beersma, D.G.; Meesters, Y.; Boer, J.A.D.; Hoofdakker, R.H.V.D.; Daan, S. Extraocular light therapy in winter depression: A double-blind placebo-controlled study. Biol. Psychiatry 2001, 50, 691–698. [Google Scholar] [CrossRef] [Green Version]
- Arany, P.R. Photobiomodulation-Activated Latent Transforming Growth Factor-β1: A Critical Clinical Therapeutic Pathway and an Endogenous Optogenetic Tool for Discovery. Photobiomodul. Photomed. Laser Surg. 2022, 40, 136–147. [Google Scholar] [CrossRef]
- Benson, S.; Brinkhoff, A.; Lueg, L.; Roderigo, T.; Kribben, A.; Wilde, B.; Witzke, O.; Engler, H.; Schedlowski, M.; Elsenbruch, S. Effects of acute systemic inflammation on the interplay between sad mood and affective cognition. Transl. Psychiatry 2017, 7, 1281. [Google Scholar] [CrossRef] [Green Version]
- Dantzer, R.; O’Connor, J.C.; Freund, G.G.; Johnson, R.W.; Kelley, K.W. From inflammation to sickness and depression: When the immune system subjugates the brain. Nat. Rev. Neurosci. 2008, 9, 46–56. [Google Scholar] [CrossRef] [PubMed] [Green Version]
- van Eeden, W.A.; van Hemert, A.M.; Carlier, I.V.E.; Penninx, B.W.J.H.; Lamers, F.; Fried, E.I.; Schoevers, R.; Giltay, E.J. Basal and LPS-stimulated inflammatory markers and the course of individual symptoms of depression. Transl. Psychiatry 2020, 10, 235. [Google Scholar] [CrossRef] [PubMed]
- Grassi, G. Counteracting the sympathetic nervous system in essential hypertension. Curr. Opin. Nephrol. Hypertens. 2004, 13, 513–519. [Google Scholar] [CrossRef] [PubMed]
- Palatini, P. Resting Heart Rate as a Cardiovascular Risk Factor in Hypertensive Patients: An Update. Am. J. Hypertens. 2020, 34, 307–317. [Google Scholar] [CrossRef]
- Jagannath, A.; Peirson, S.N.; Foster, R.G. Sleep and circadian rhythm disruption in neuropsychiatric illness. Curr. Opin. Neurobiol. 2013, 23, 888–894. [Google Scholar] [CrossRef]
- Mendoza, J. Circadian insights into the biology of depression: Symptoms, treatments and animal models. Behav. Brain Res. 2019, 376, 112186. [Google Scholar] [CrossRef]
- Swaab, D.F.; Bao, A.-M.; Lucassen, P.J. The stress system in the human brain in depression and neurodegeneration. Ageing Res. Rev. 2005, 4, 141–194. [Google Scholar] [CrossRef]
- Omisade, A.; Buxton, O.M.; Rusak, B. Impact of acute sleep restriction on cortisol and leptin levels in young women. Physiol. Behav. 2010, 99, 651–656. [Google Scholar] [CrossRef]
- Vgontzas, A.N.; Zoumakis, M.; Bixler, E.O.; Lin, H.-M.; Prolo, P.; Vela-Bueno, A.; Kales, A.; Chrousos, G.P. Impaired Nighttime Sleep in Healthy Old Versus Young Adults Is Associated with Elevated Plasma Interleukin-6 and Cortisol Levels: Physiologic and Therapeutic Implications. J. Clin. Endocrinol. Metab. 2003, 88, 2087–2095. [Google Scholar] [CrossRef] [Green Version]
- Brown, T.M.; Brainard, G.C.; Cajochen, C.; Czeisler, C.A.; Hanifin, J.P.; Lockley, S.W.; Lucas, R.J.; Münch, M.; O’Hagan, J.B.; Peirson, S.N.; et al. Recommendations for daytime, evening, and nighttime indoor light exposure to best support physiology, sleep, and wakefulness in healthy adults. PLoS Biol. 2022, 20, e3001571. [Google Scholar] [CrossRef]
- Zimmerman, S.; Reiter, R. Melatonin and the Optics of the Human Body. Melatonin Res. 2019, 2, 138–160. [Google Scholar] [CrossRef]


| Dose | Duration | Duty Factor | Peak Irradiance | Photonic Dose | Molar Dose | ||
|---|---|---|---|---|---|---|---|
| J·cm–2 | m | s | % | mW. cm–2 | # .cm–2 | µmol. cm−2 | |
| Low | 1.0 | 42 | 2520 | 8% | 5 | 4.3 × 10¹⁸ | 7.2 |
| Med | 4.0 | 168 | 10,080 | 8% | 5 | 1.7 × 10¹⁹ | 28.6 |
| High | 6.5 | 180 | 10,800 | 12% | 5 | 2.8 × 10¹⁹ | 46.0 |
| 0 J·cm−2 | 1 J·cm−2 | 4 J·cm−2 | 6.5 J·cm−2 | Significance | |
|---|---|---|---|---|---|
| Number (M:F) | 13 (4:9) | 14 (5:9) | 15 (7:8) | 14 (6:8) | |
| Age (y) | 37.9 (3.4) | 38.2 (3.3) | 38.7 (5.8) | 37.4 (3.5) | ns |
| Chronotype (h) | 4.1 (0.4) | 4.2 (0.4) | 4.3 (0.4) | 4.3 (0.5) | ns |
| Sleep duration (h) | 7.0 (0.4) | 7.3 (0.3) | 7.4 (0.3) | 6.9 (0.3) | ns |
| Sleep deficit (h) | 1.4 (0.4) | 1.6 (0.3) | 1.0 (0.2) | 1.5 (0.5) | ns |
| PSQI | 10.7 (1.0) | 10.4 (1.1) | 9.8 (0.9) | 10.6 (0.7) | ns |
| ESS | 8.6 (1.1) | 7.7 (1.5) | 8.5 (1.3) | 9.6 (1.2) | ns |
| BDI | 10.5 (1.2) | 11.1 (1.6) | 12.3 (1.4) | 11.1 (1.5) | ns |
| BMI (kg) | 25.4 (1.1) | 25.3 (1.5) | 24.7 (1.1) | 24.6 (0.9) | ns |
Disclaimer/Publisher’s Note: The statements, opinions and data contained in all publications are solely those of the individual author(s) and contributor(s) and not of MDPI and/or the editor(s). MDPI and/or the editor(s) disclaim responsibility for any injury to people or property resulting from any ideas, methods, instructions or products referred to in the content. |
© 2022 by the authors. Licensee MDPI, Basel, Switzerland. This article is an open access article distributed under the terms and conditions of the Creative Commons Attribution (CC BY) license (https://creativecommons.org/licenses/by/4.0/).
Share and Cite
Giménez, M.C.; Luxwolda, M.; Van Stipriaan, E.G.; Bollen, P.P.; Hoekman, R.L.; Koopmans, M.A.; Arany, P.R.; Krames, M.R.; Berends, A.C.; Hut, R.A.; et al. Effects of Near-Infrared Light on Well-Being and Health in Human Subjects with Mild Sleep-Related Complaints: A Double-Blind, Randomized, Placebo-Controlled Study. Biology 2023, 12, 60. https://doi.org/10.3390/biology12010060
Giménez MC, Luxwolda M, Van Stipriaan EG, Bollen PP, Hoekman RL, Koopmans MA, Arany PR, Krames MR, Berends AC, Hut RA, et al. Effects of Near-Infrared Light on Well-Being and Health in Human Subjects with Mild Sleep-Related Complaints: A Double-Blind, Randomized, Placebo-Controlled Study. Biology. 2023; 12(1):60. https://doi.org/10.3390/biology12010060
Chicago/Turabian StyleGiménez, Marina Cecilia, Michelle Luxwolda, Eila G. Van Stipriaan, Pauline P. Bollen, Rieks L. Hoekman, Marthe A. Koopmans, Praveen R. Arany, Michael R. Krames, Anne C. Berends, Roelof A. Hut, and et al. 2023. "Effects of Near-Infrared Light on Well-Being and Health in Human Subjects with Mild Sleep-Related Complaints: A Double-Blind, Randomized, Placebo-Controlled Study" Biology 12, no. 1: 60. https://doi.org/10.3390/biology12010060