
Response of Cyanic and Acyanic Lettuce Cultivars to an Increased Proportion of Blue Light


Abstract
:Simple Summary
Abstract
1. Introduction
2. Materials and Methods
2.1. Experimental Design
2.2. Plant Cultivation and Light Treatments
2.3. Non-Destructive Measurements
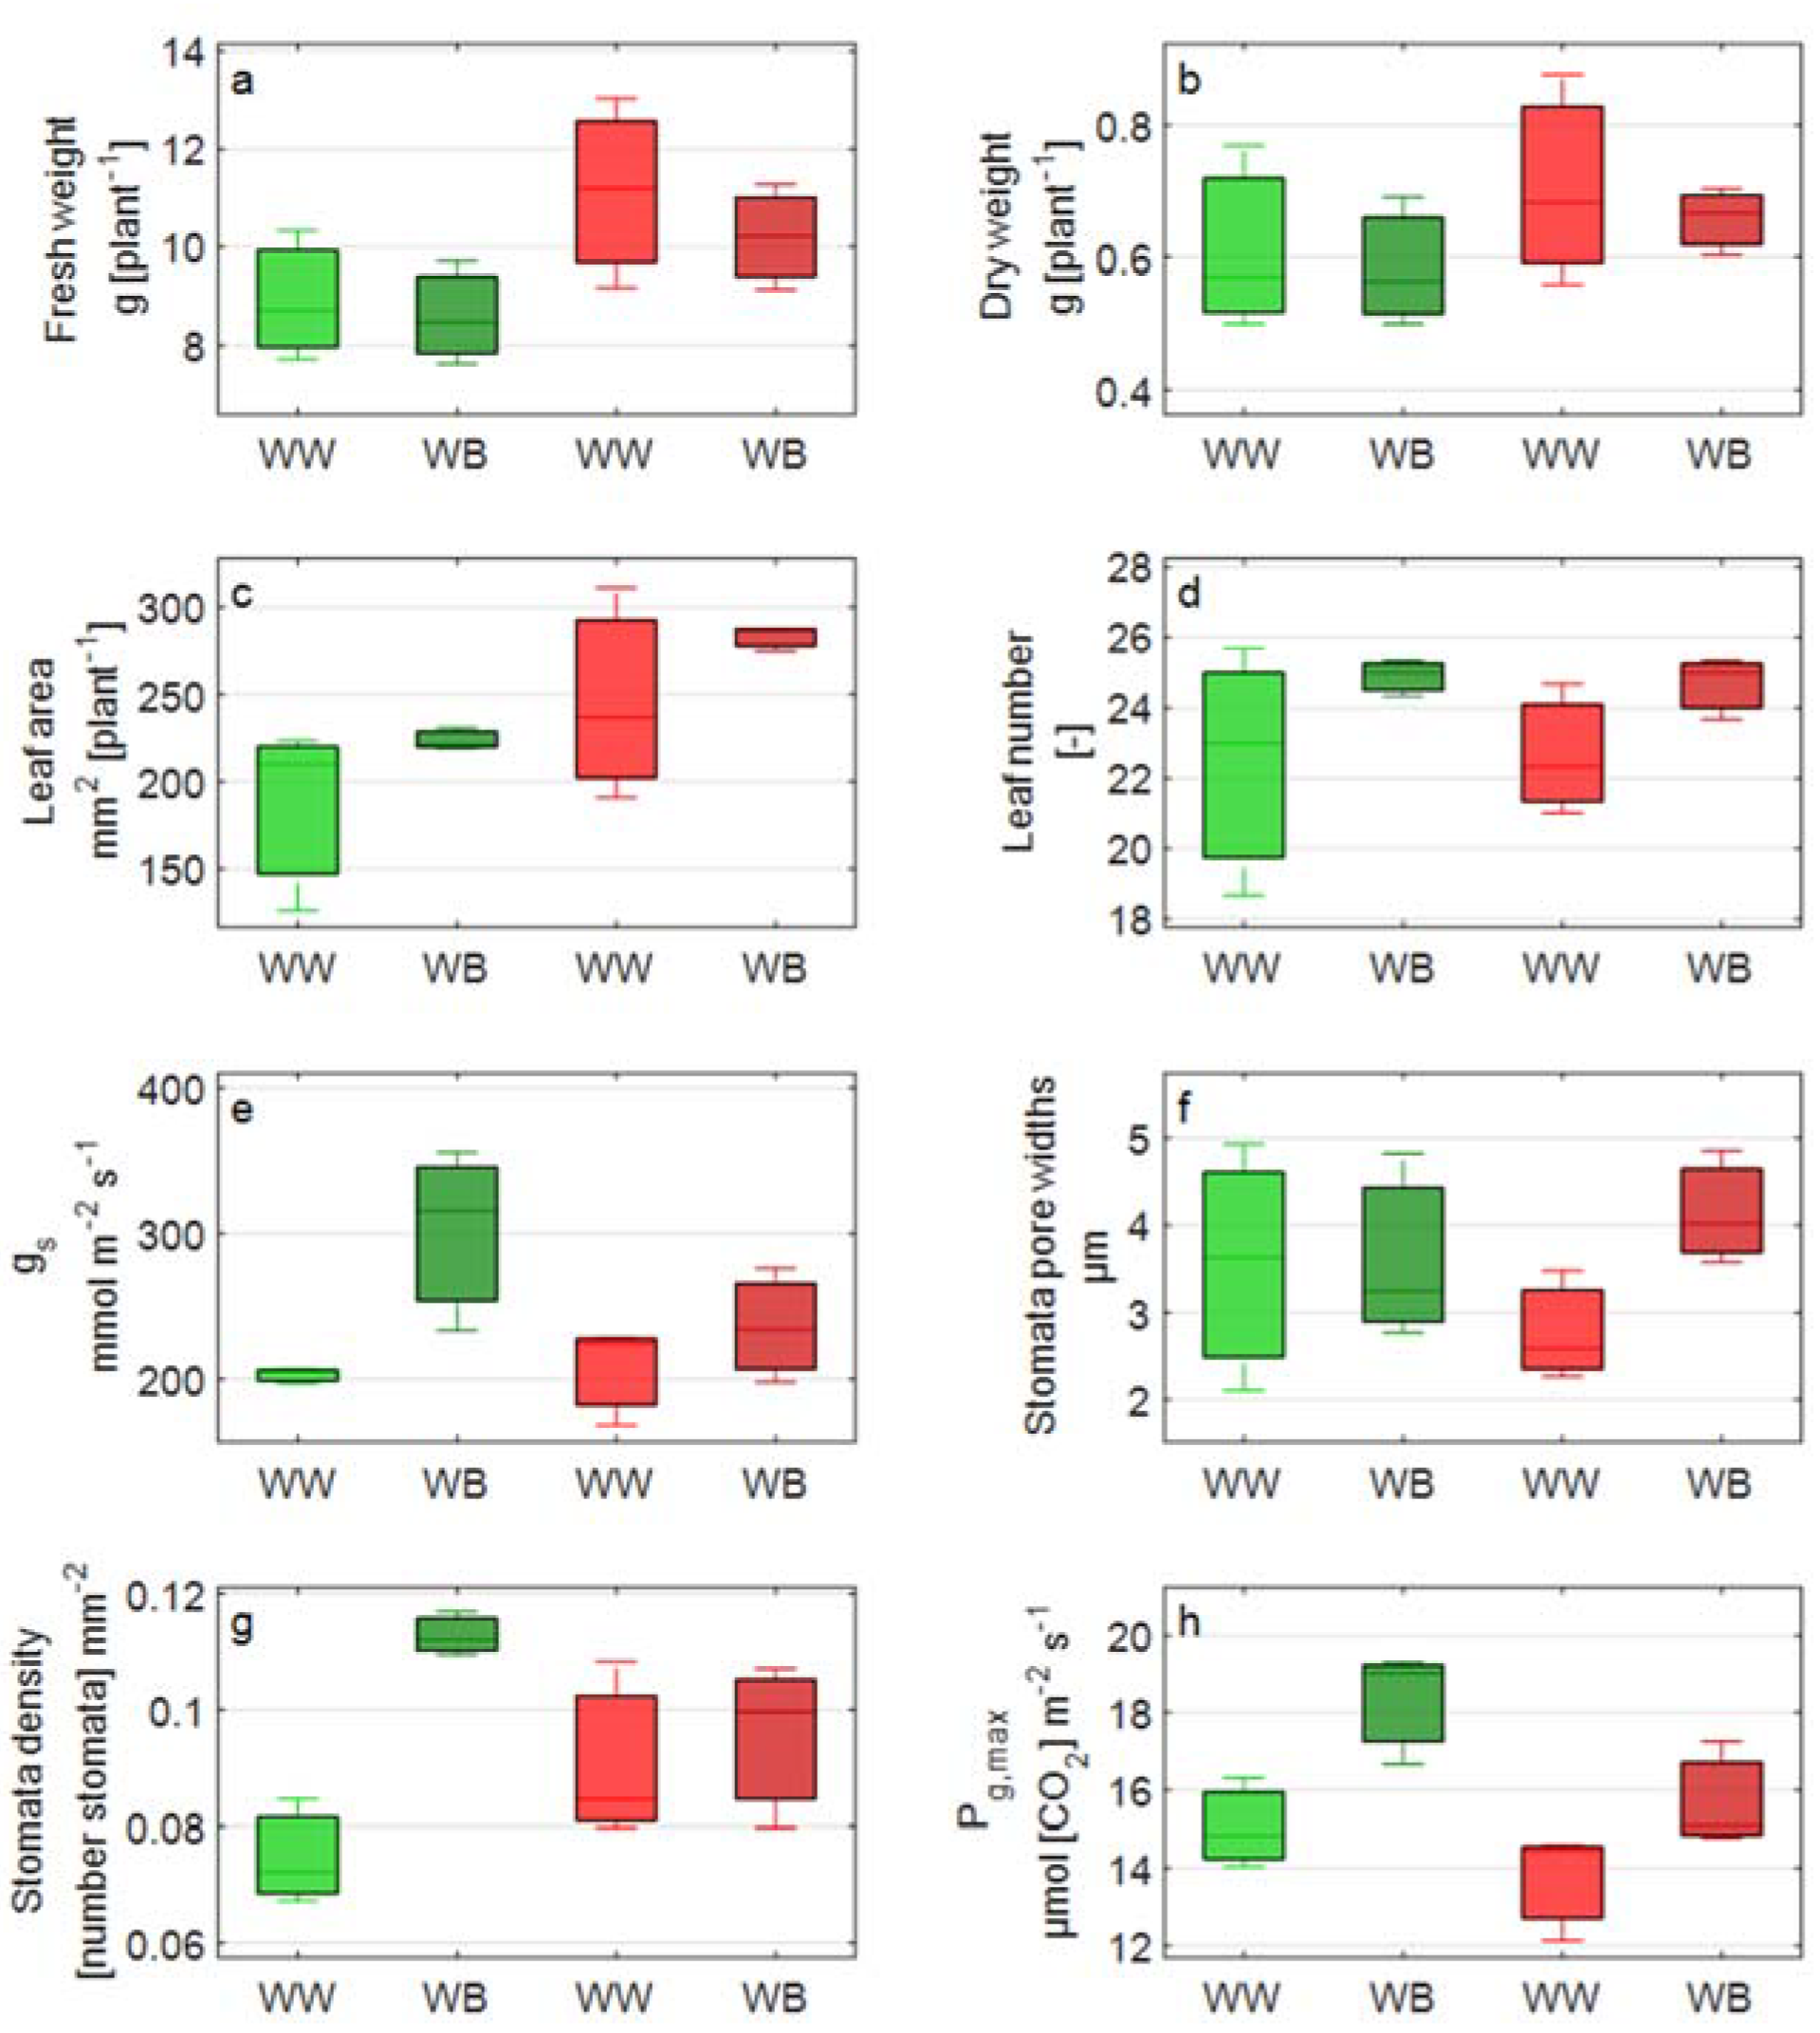
2.3.1. Plant Physiology and Morphology
2.3.2. Light-Adapted Imaging Chlorophyll a Fluorescence
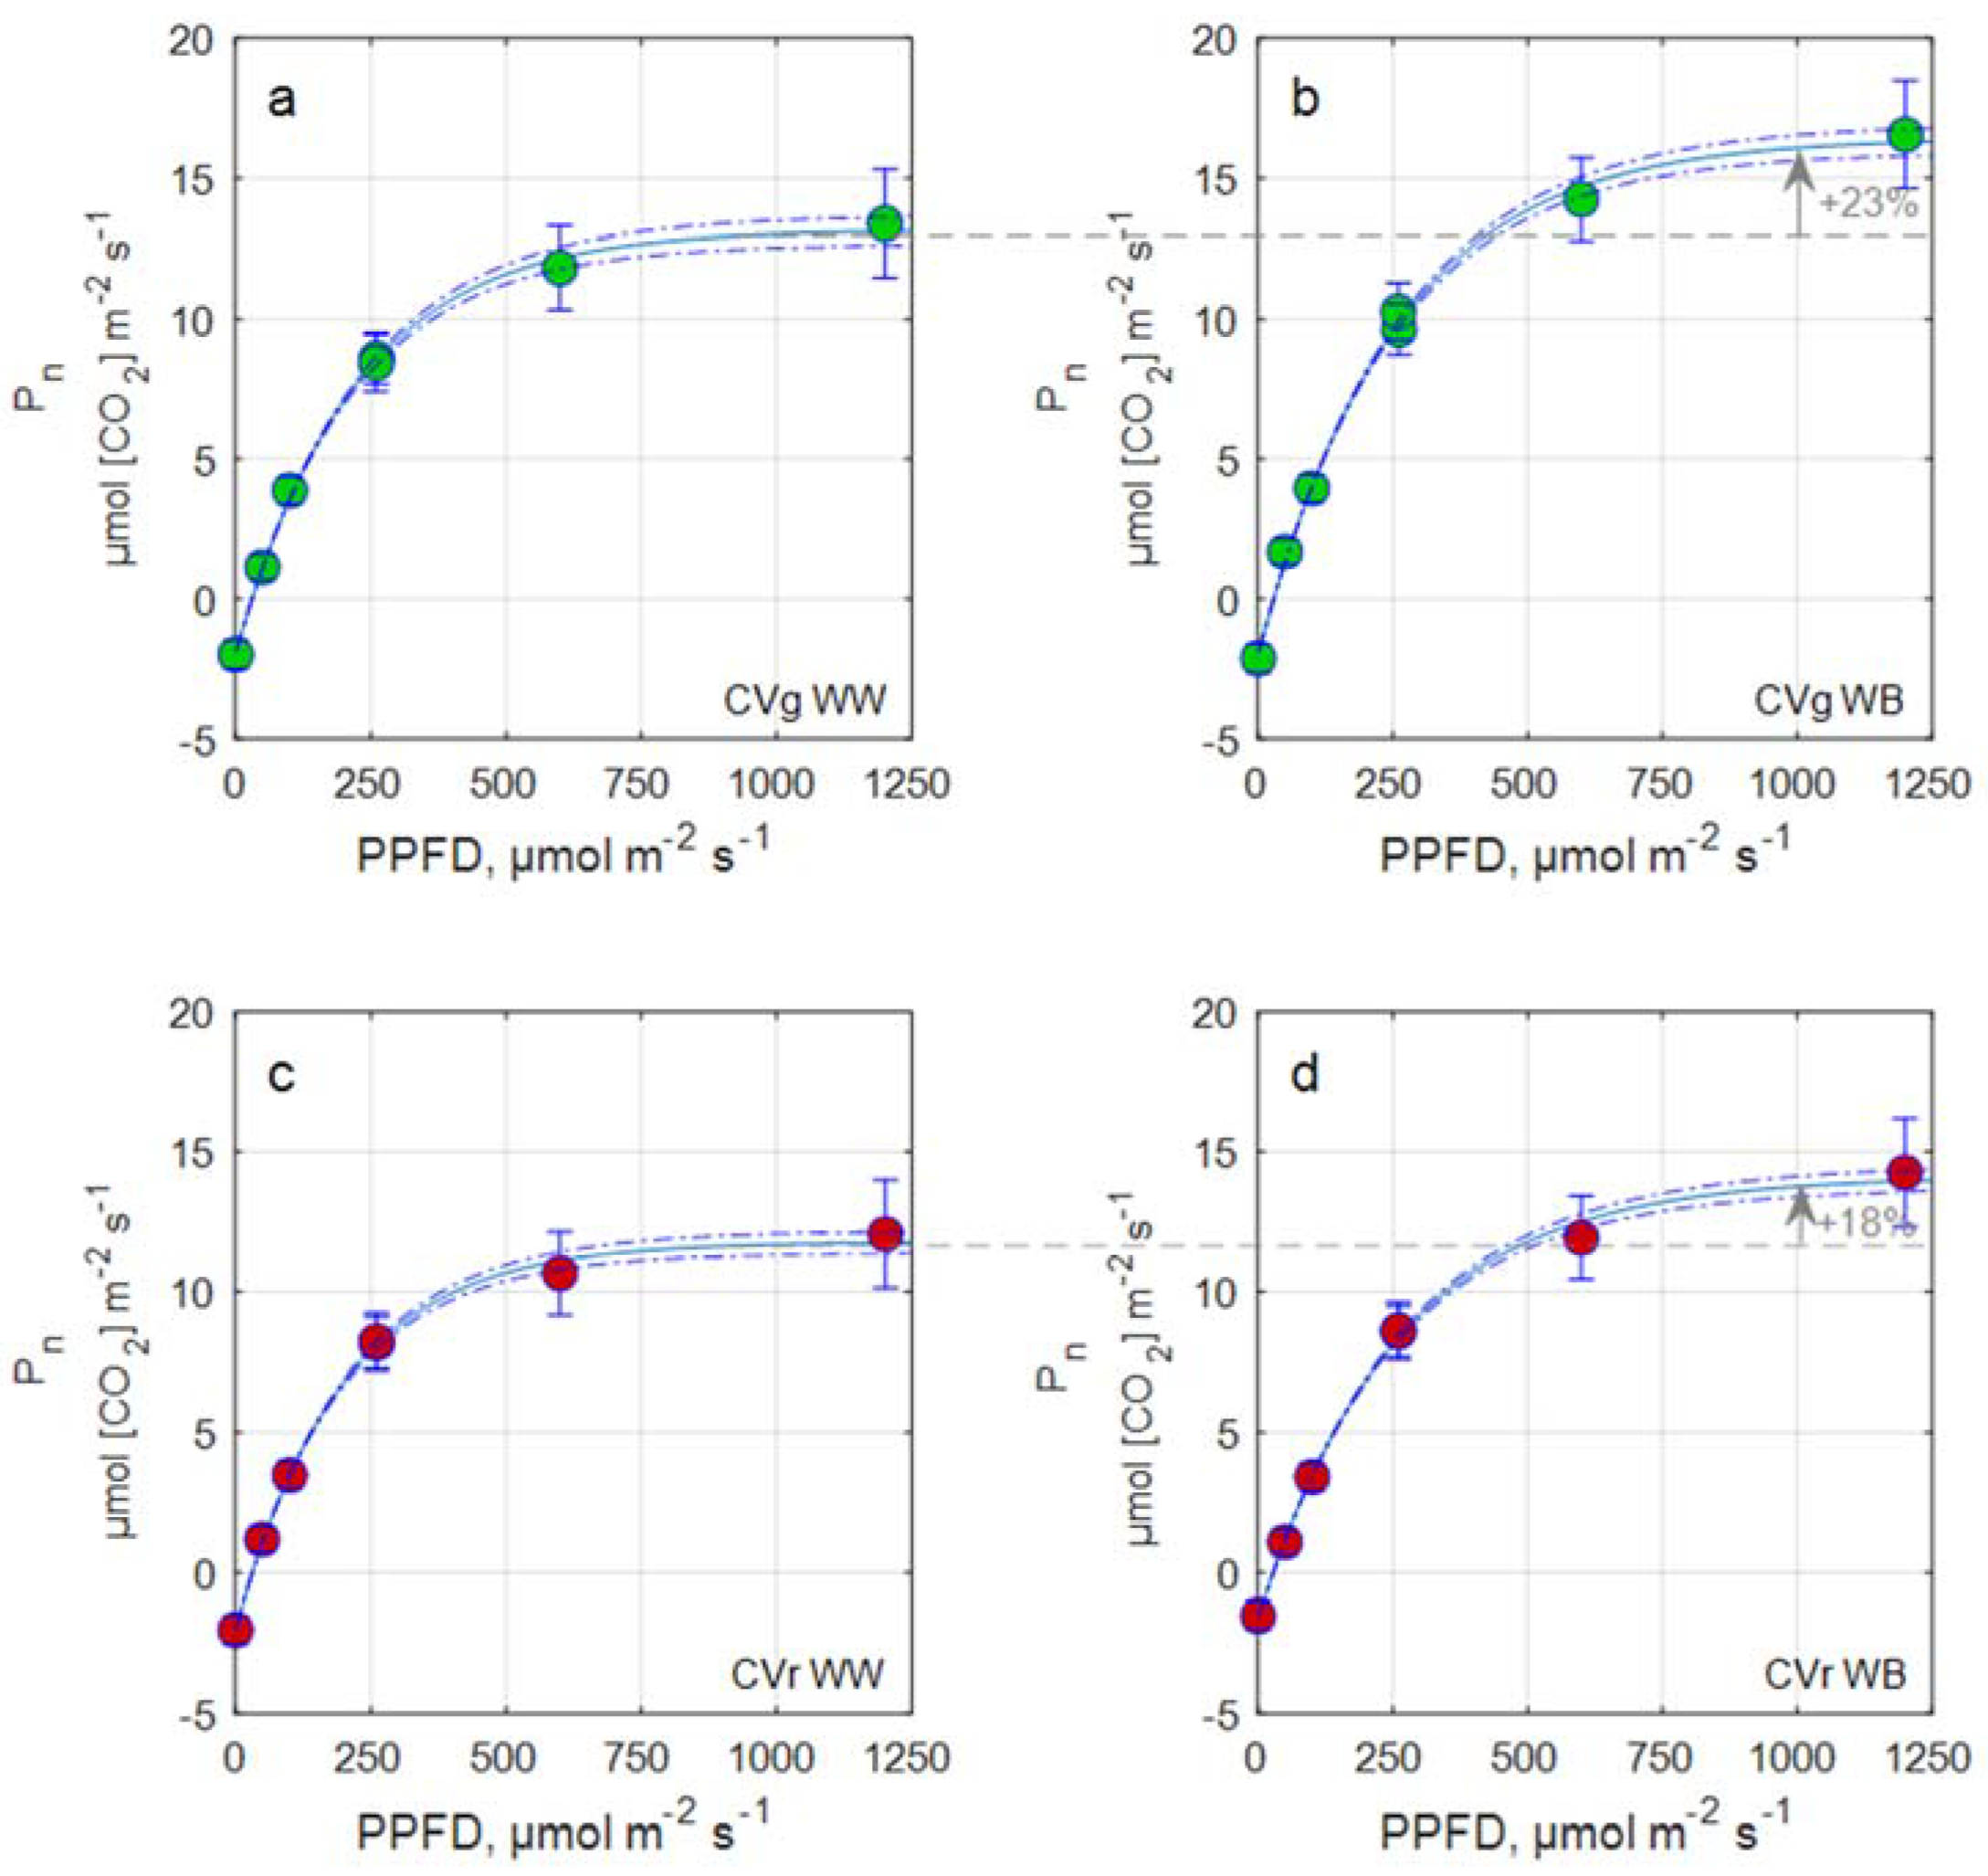
2.3.3. Light Response Curve and Leaf Photosynthetic Rate Estimation
2.3.4. Stomatal Conductance Traits
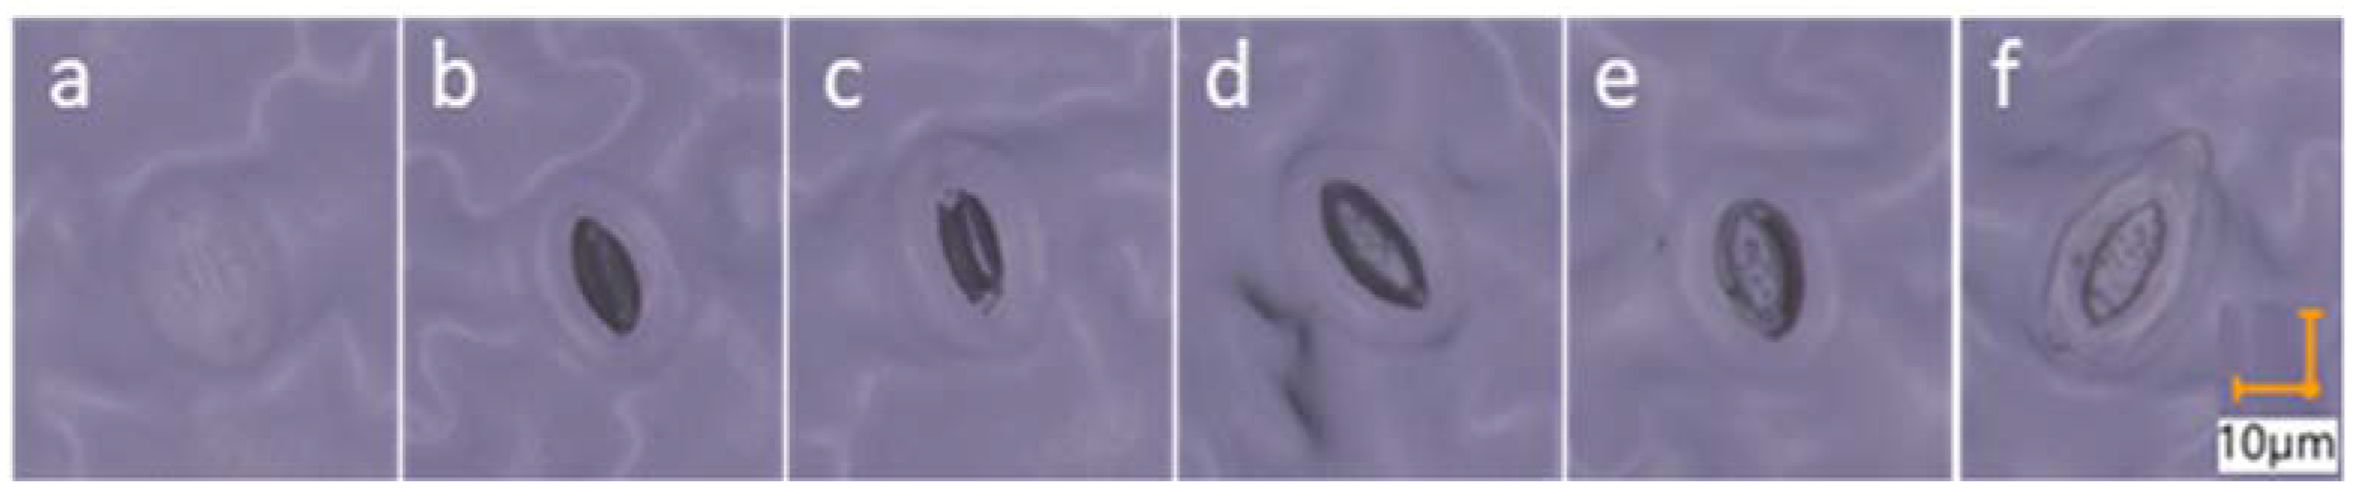
2.3.5. Stomata Morphology
2.4. Destructive Measurements
2.4.1. Quantification of Leaf Pigment Content and Estimation of Anthocyanin Content
2.4.2. Optical Leaf Measurements and Estimation of Anthocyanin Content
2.4.3. Extraction and Quantification of Leaf Pigment Content
2.4.4. Growth and Morphology Measurements
2.4.5. Data Processing and Statistics
3. Results
4. Discussion
5. Conclusions
Author Contributions
Funding
Institutional Review Board Statement
Informed Consent Statement
Data Availability Statement
Acknowledgments
Conflicts of Interest
Abbreviations
| Abbreviation | Meaning | Unit |
| IVF | Indoor vertical farming | - |
| LUE | Light use efficiency | g [DW] mol−1 |
| ε | Chemical light use efficiency | mol [CO2] mol−1 |
| LEDs | Light emitting diodes | - |
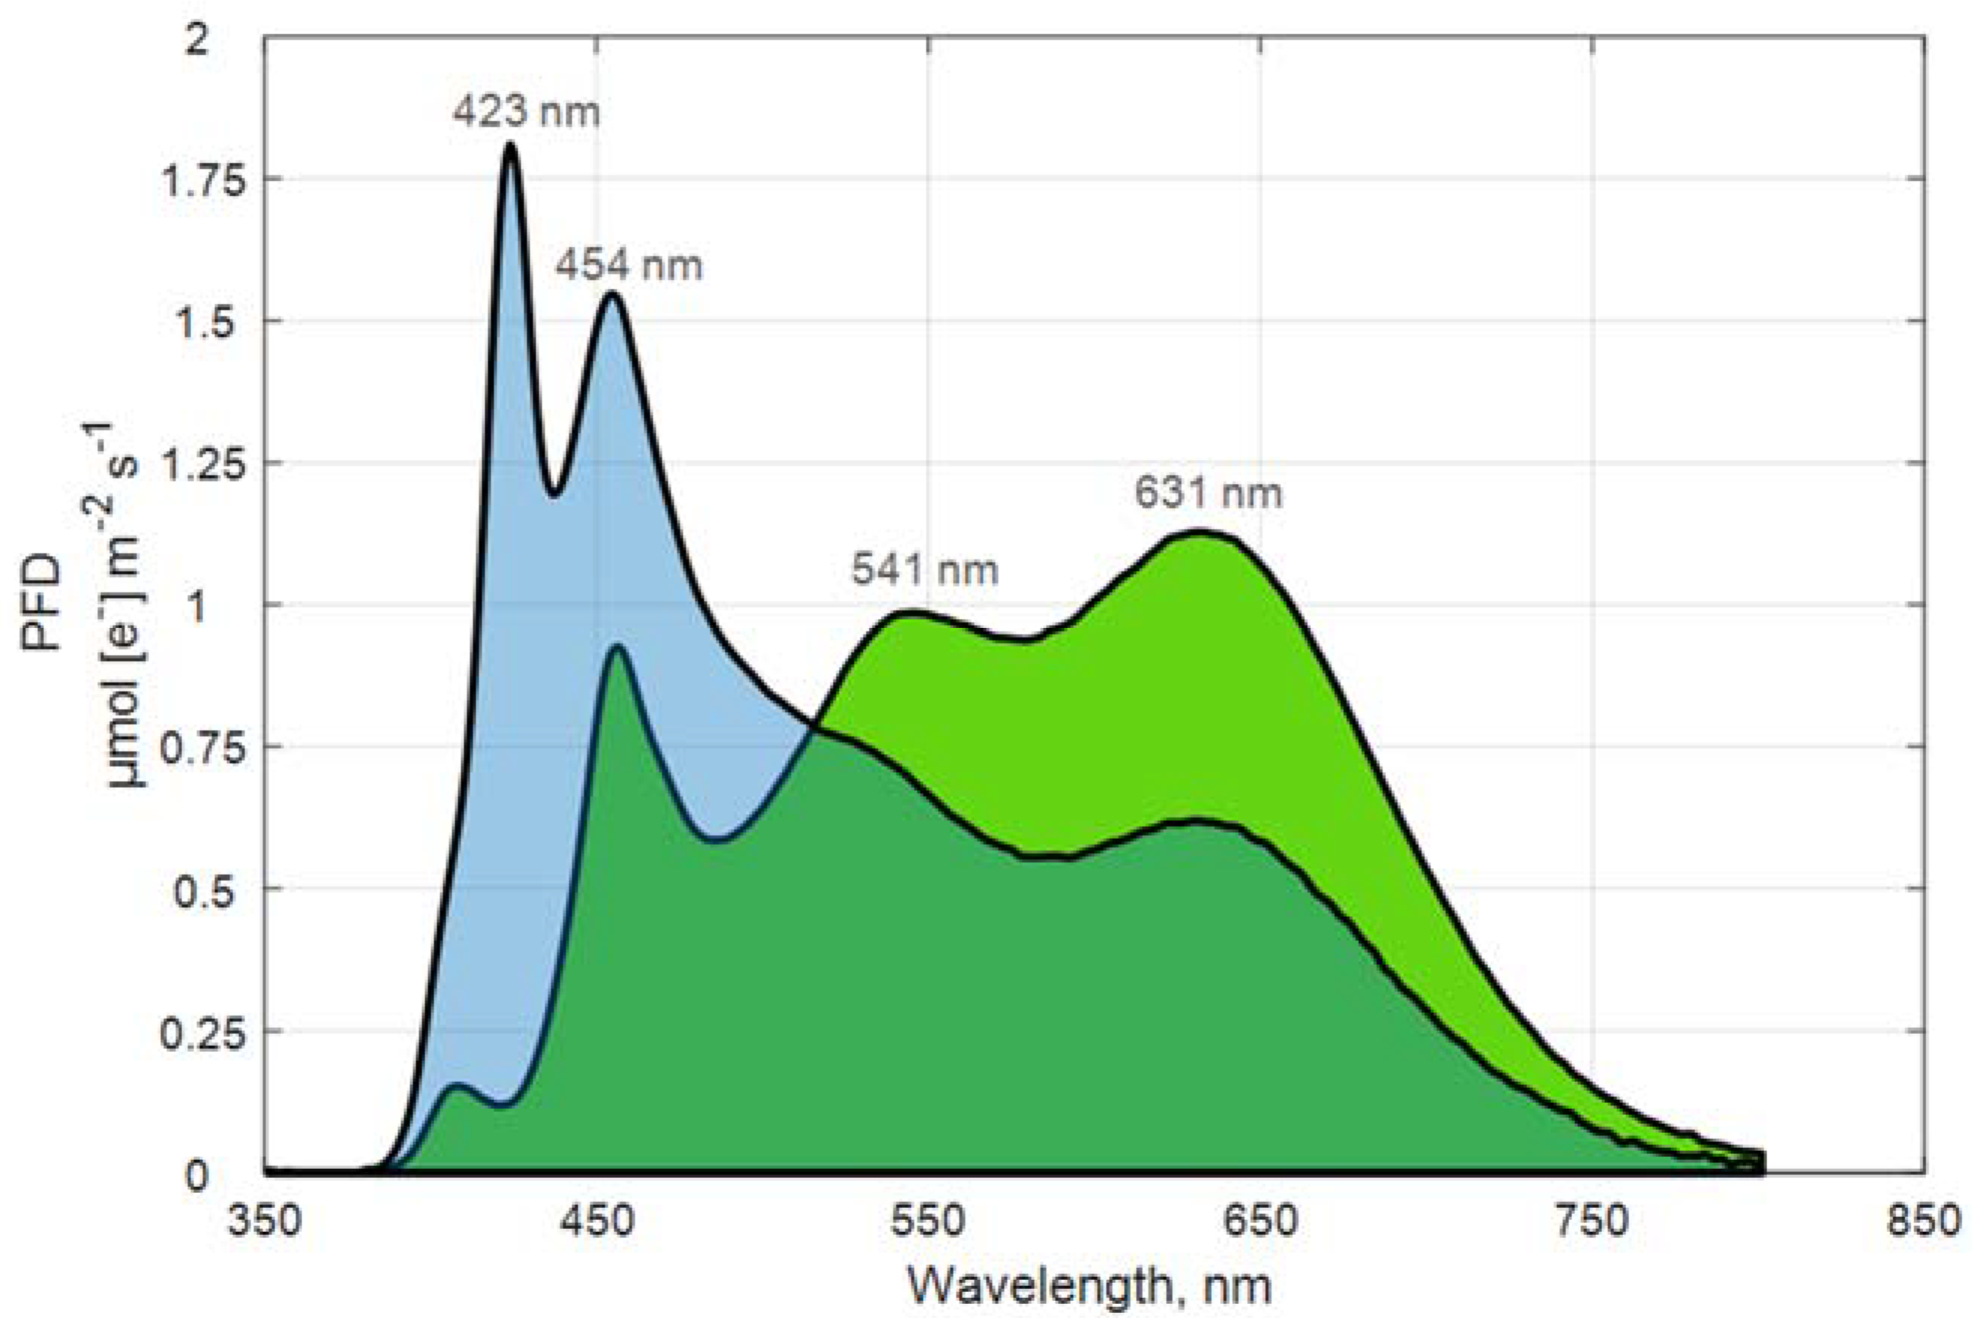
| PFD | Photon flux density (i.e., total flux) | µmol m−2 s−1 |
| PPFD | Photosynthetic photon flux density (i.e., photosynthetic exploitable flux) | µmol m−2 s−1 |
| B | Blue light, 400–480 nm | nm |
| UV | Ultraviolet light, 360–399 nm | nm |
| G | Green light, 481–599 nm | nm |
| R | Red light, 600–669 nm | nm |
| FR | Far red light, 670–800 nm | nm |
| λPeak | Peak wavelength | nm |
| EC | Electrical conductivity | dS m−1 |
| WW | White light control treatment | |
| WB | White-blue light treatment | |
| CVg | Green cultivar, green-leaf lettuce cv. Aquino RZ | |
| CVr | Red cultivar, red-leaf lettuce cv. Barlach RZ | |
| DAS | Days after sowing | day |
| F0′ | Minimum chlorophyll fluorescence intensity in the light | - |
| Fm’ | Maximum chlorophyll fluorescence intensity in the light | - |
| Fv/Fm’ | Maximum operating efficiency of PSII photochemistry in the light, = (Fm’–F0′)/FM’ | - |
| gs | Stomatal conductance | mmol m−2 s−1 |
| Pn,max | Maximal net photosynthetic rate | µmol m−2 s−1 |
| Pg,max | Maximal gross photosynthetic rate | µmol m−2 s−1 |
| Rd | Dark respiration | µmol m−2 s−1 |
| mARI | Modified anthocyanin reflectance index,= [(R530−570−1 − R690−710−1) * RNIR] | - |
| NIR | Near infrared reflectance (760–900 nm) | nm |
| PRIn | Normalized photochemical reflectance index,= PRI/[RDVI * (R700/R670)] | - |
| RDVI | Renormalized difference vegetation index= (R800 − R670)/√(R800 + R670) | - |
| PSII | Photosynthesis system II | - |
References
- Kozai, T. Sustainable plant factory: Closed plant production systems with artificial light for high resource use efficiencies and quality produce. Acta Hortic. 2013, 1004, 27–40. [Google Scholar] [CrossRef]
- Al-Chalabi, M. Vertical farming: Skyscraper sustainability? Sustain. Cities Soc. 2015, 18, 74–77. [Google Scholar] [CrossRef]
- Avgoustaki, D.D.; Xydis, G. Plant factories in the water-food-energy Nexus era: A systematic bibliographical review. Food Secur. 2020, 12, 253–268. [Google Scholar] [CrossRef]
- Avgoustaki, D.D.; Xydis, G. Indoor Vertical Farming in the Urban Nexus Context: Business Growth and Resource Savings. Sustainability 2020, 12, 1965. [Google Scholar] [CrossRef] [Green Version]
- Benke, K.; Tomkins, B. Future food-production systems: Vertical farming and controlled-environment agriculture. Sustain. Sci. Pract. Policy 2017, 13, 13–26. [Google Scholar] [CrossRef] [Green Version]
- Cammarisano, L.; Donnison, I.S.; Robson, P.R.H. Producing Enhanced Yield and Nutritional Pigmentation in Lollo Rosso Through Manipulating the Irradiance, Duration, and Periodicity of LEDs in the Visible Region of Light. Front. Plant Sci. 2020, 11, 598082. [Google Scholar] [CrossRef]
- Appolloni, E.; Pennisi, G.; Zauli, I.; Carotti, L.; Paucek, I.; Quaini, S.; Orsini, F.; Gianquinto, G. Beyond vegetables: Effects of indoor LED light on specialized metabolite biosynthesis in medicinal and aromatic plants, edible flowers, and microgreens. J. Sci. Food Agric. 2022, 102, 472–487. [Google Scholar] [CrossRef]
- Taulavuori, K.; Hyöky, V.; Oksanen, J.; Taulavuori, E.; Julkunen-Tiitto, R. Species-specific differences in synthesis of flavonoids and phenolic acids under increasing periods of enhanced blue light. Environ. Exp. Bot. 2016, 121, 145–150. [Google Scholar] [CrossRef]
- Izzo, L.G.; Mickens, M.A.; Aronne, G.; Gómez, C. Spectral effects of blue and red light on growth, anatomy, and physiology of lettuce. Physiol. Plant. 2021, 172, 2191–2202. [Google Scholar] [CrossRef]
- Modarelli, G.C.; Paradiso, R.; Arena, C.; De Pascale, S.; Van Labeke, M.C. High Light Intensity from Blue-Red LEDs Enhance Photosynthetic Performance, Plant Growth, and Optical Properties of Red Lettuce in Controlled Environment. Horticulturae 2022, 8, 114. [Google Scholar] [CrossRef]
- Taulavuori, K.; Pyysalo, A.; Julkunen-Tiitto, R. Responses of phenolic acid and flavonoid synthesis to blue and blue-violet light depends on plant species. Environ. Exp. Bot. 2018, 150, 183–187. [Google Scholar] [CrossRef] [Green Version]
- Paradiso, R.; Proietti, S. Light-Quality Manipulation to Control Plant Growth and Photomorphogenesis in Greenhouse Horticulture: The State of the Art and the Opportunities of Modern LED Systems. J. Plant Growth Regul. 2021, 41, 742–780. [Google Scholar] [CrossRef]
- Snowden, M.C.; Cope, K.R.; Bugbee, B. Sensitivity of Seven Diverse Species to Blue and Green Light: Interactions with Photon Flux. PLoS ONE 2016, 11, e0163121. [Google Scholar] [CrossRef] [PubMed]
- Eriksen, R.L.; Knepper, C.; Cahn, M.D.; Mou, B. Screening of Lettuce Germplasm for Agronomic Traits under Low Water Conditions. HortScience 2016, 51, 669–679. [Google Scholar] [CrossRef] [Green Version]
- Barickman, T.C.; Sublett, W.L.; Miles, C.; Crow, D.; Scheenstra, E. Lettuce Biomass Accumulation and Phytonutrient Concentrations Are Influenced by Genotype, N Application Rate and Location. Horticulturae 2018, 4, 12. [Google Scholar] [CrossRef] [Green Version]
- Ramakrishna, A.; Ravishankar, G.A. Influence of abiotic stress signals on secondary metabolites in plants. Plant Signal Behav. 2011, 6, 1720–1731. [Google Scholar]
- Genzel, F.; Dicke, M.D.; Junker-Frohn, L.V.; Neuwohner, A.; Thiele, B.; Putz, A.; Usadel, B.; Wormit, A.; Wiese-Klinkenberg, A. Impact of Moderate Cold and Salt Stress on the Accumulation of Antioxidant Flavonoids in the Leaves of Two Capsicum Cultivars. J. Agric. Food Chem. 2021, 69, 6431–6443. [Google Scholar] [CrossRef]
- Kim, D.-E.; Shang, X.; Assefa, A.D.; Keum, Y.-S.; Saini, R.K. Metabolite profiling of green, green/red, and red lettuce cultivars: Variation in health beneficial compounds and antioxidant potential. Food Res. Int. 2018, 105, 361–370. [Google Scholar] [CrossRef]
- Park, Y.; Gómez, C.; Runkle, E.S. Indoor production of ornamental seedlings, vegetable transplants, and microgreens. In Plant Factory Basics, Applications and Advances; Kozai, T., Niu, G., Masabni, J., Eds.; Academic Press: Cambridge, MA, USA, 2022. [Google Scholar]
- Landi, M.; Agati, G.; Fini, A.; Guidi, L.; Sebastiani, F.; Tattini, M. Unveiling the shade nature of cyanic leaves: A view from the “blue absorbing side” of anthocyanins. Plant Cell Environ. 2021, 44, 1119–1129. [Google Scholar] [CrossRef]
- Kyparissis, A.; Grammatikopoulos, G.; Manetas, Y. Leaf morphological and physiological adjustments to the spectrally selective shade imposed by anthocyanins in Prunus cerasifera. Tree Physiol. 2007, 27, 849–857. [Google Scholar] [CrossRef] [Green Version]
- El-Nakhel, C.; Giordano, M.; Pannico, A.; Carillo, P.; Fusco, G.M.; De Pascale, S.; Rouphael, Y. Cultivar-Specific Performance and Qualitative Descriptors for Butterhead Salanova Lettuce Produced in Closed Soilless Cultivation as a Candidate Salad Crop for Human Life Support in Space. Life 2019, 9, 61. [Google Scholar] [CrossRef] [PubMed] [Green Version]
- Stetsenko, L.; Pashkovsky, P.; Voloshin, R.; Kreslavski, V.; Kuznetsov, V.; Allakhverdiev, S. Role of anthocyanin and carotenoids in the adaptation of the photosynthetic apparatus of purple- and green-leaved cultivars of sweet basil (Ocimum basilicum) to high-intensity light. Photosynthetica 2020, 58, 890–901. [Google Scholar] [CrossRef]
- Lee, A.; Liao, F.; Lo, H. Temperature, Daylength, and Cultivar Interact to Affect the Growth and Yield of Lettuce Grown in High Tunnels in Subtropical Regions. HortScience 2015, 50, 1412–1418. [Google Scholar] [CrossRef] [Green Version]
- Sapkota, S.; Sapkota, S.; Liu, Z. Effects of Nutrient Composition and Lettuce Cultivar on Crop Production in Hydroponic Culture. Horticulturae 2019, 5, 72. [Google Scholar] [CrossRef] [Green Version]
- Körner, O.; Fanourakis, D.; Hwang, M.C.-R.; Hyldgaard, B.; Tsaniklidis, G.; Nikoloudakis, N.; Larsen, D.H.; Ottosen, C.-O.; Rosenqvist, E. Incorporating cultivar-specific stomatal traits into stomatal conductance models improves the estimation of evapotranspiration enhancing greenhouse climate management. Biosyst. Eng. 2021, 208, 131–151. [Google Scholar] [CrossRef]
- Harbick, K.; Albright, L. Comparison of energy consumption: Greenhouses and plant factories. Acta Hortic. 2016, 1134, 285–292. [Google Scholar] [CrossRef] [Green Version]
- Ruban, A.V. Plants in light. Commun. Integr. Biol. 2009, 2, 50–55. [Google Scholar] [CrossRef]
- Gommers, C.M.M. Adapting to High Light: At a Different Time and Place? Plant Physiol. 2020, 182, 10–11. [Google Scholar] [CrossRef] [Green Version]
- Athanasiou, K.; Dyson, B.C.; Webster, R.E.; Johnson, G.N. Dynamic Acclimation of Photosynthesis Increases Plant Fitness in Changing Environments. Plant Physiol. 2010, 152, 366–373. [Google Scholar] [CrossRef] [Green Version]
- Sonneveld, C.; Straver, N. Nutrients Solutions for Vegetables and Flowers Grown in Water or Substrates. Voedingsoploss. Glastuinb. 1994, 8, 33. [Google Scholar]
- Maxwell, K.; Johnson, G.N. Chlorophyll fluorescence—A practical guide. J. Exp. Bot. 2000, 51, 659–668. [Google Scholar] [CrossRef] [PubMed]
- Cannel, R.M.G.; Thornley, J.H.M. Temperature and CO2 Responses of Leaf and Canopy Photosynthesis: A Clarification using the Non-rectangular Hyperbola Model of Photosynthesis. Ann. Bot. 1998, 82, 883–892. [Google Scholar] [CrossRef] [Green Version]
- Körner, O.; Heuvelink, E.; Niu, Q. Quantification of temperature, CO2, and light effects on crop photosynthesis as a basis for model-based greenhouse climate control. J. Hortic. Sci. Biotechnol. 2009, 84, 233–239. [Google Scholar] [CrossRef]
- Monteith, J.; Campbell, G.; Potter, E. Theory and performance of a dynamic diffusion porometer. Agric. For. Meteorol. 1988, 44, 27–38. [Google Scholar] [CrossRef]
- Scarpeci, T.; Zanor, M.; Valle, E. Estimation of Stomatal Aperture in Arabidopsis thaliana Using Silicone Rubber Imprints. Bio-Protocol 2017, 7, e2347. [Google Scholar] [CrossRef]
- Savvides, A.; Fanourakis, D.; van Ieperen, W. Co-ordination of hydraulic and stomatal conductances across light qualities in cucumber leaves. J. Exp. Bot. 2012, 63, 1135–1143. [Google Scholar] [CrossRef] [Green Version]
- Gamon, J.A.; Serrano, L.; Surfus, J.S. The photochemical reflectance index: An optical indicator of photosynthetic radiation use efficiency across species, functional types, and nutrient levels. Oecologia 1997, 112, 492–501. [Google Scholar] [CrossRef]
- Gitelson, A.A.; Keydan, G.P.; Merzlyak, M.N. Three-band model for noninvasive estimation of chlorophyll, carotenoids, and anthocyanin contents in higher plant leaves. Geophys. Res. Lett. 2006, 33, 1–5. [Google Scholar] [CrossRef] [Green Version]
- Zarco-Tejada, P.J.; Gonzalez-Dugo, V.; Williams, L.E.; Suárez, L.; Berni, J.A.J.; Goldhamer, D.; Fereres, E. A PRI-based water stress index combining structural and chlorophyll effects: Assessment using diurnal narrow-band airborne imagery and the CWSI thermal index. Remote Sens. Environ. 2013, 138, 38–50. [Google Scholar] [CrossRef]
- Kováč, D.; Veselovská, P.; Klem, K.; Večeřová, K.; Ač, A.; Peñuelas, J.; Urban, O. Potential of Photochemical Reflectance Index for Indicating Photochemistry and Light Use Efficiency in Leaves of European Beech and Norway Spruce Trees. Remote Sens. 2018, 10, 1202. [Google Scholar] [CrossRef] [Green Version]
- Cammarisano, L.; Donnison, I.S.; Robson, P.R.H. The Effect of Red & Blue Rich LEDs vs Fluorescent Light on Lollo Rosso Lettuce Morphology and Physiology. Front. Plant Sci. 2021, 12, 603411. [Google Scholar] [PubMed]
- Popat, R.; Banakara, K. Doebioresearch: Analysis of Design of Experiments for Biological Research. 2020. Available online: https://CRAN.R-project.org/package=doebioresearch (accessed on 28 May 2022).
- Jones, M.A. Using light to improve commercial value. Hortic. Res. 2018, 5, 47. [Google Scholar] [CrossRef] [PubMed] [Green Version]
- Ishii, T.; Iisako, R.; Kawano, K.; Akutsu, M. Growth Responses in Leaf Lettuce Cultivar Grown under Different Qualities of Light from LED Sources. Hortic. Res. 2018, 17, 439–447. [Google Scholar] [CrossRef] [Green Version]
- Carillo, P.; Giordano, M.; Raimondi, G.; Napolitano, F.; Di Stasio, E.; Kyriacou, M.C.; Sifola, M.I.; Rouphael, Y. Physiological and Nutraceutical Quality of Green and Red Pigmented Lettuce in Response to NaCl Concentration in Two Successive Harvests. Agronomy 2020, 10, 1358. [Google Scholar] [CrossRef]
- Becker, C.; Urlić, B.; Špika, M.J.; Kläring, H.-P.; Krumbein, A.; Baldermann, S.; Ban, S.G.; Perica, S.; Schwarz, D. Nitrogen Limited Red and Green Leaf Lettuce Accumulate Flavonoid Glycosides, Caffeic Acid Derivatives, and Sucrose while Losing Chlorophylls, Β-Carotene and Xanthophylls. PLoS ONE 2015, 10, e0142867. [Google Scholar] [CrossRef]
- Jia, M.; Li, D.; Colombo, R.; Wang, Y.; Wang, X.; Cheng, T.; Zhu, Y.; Yao, X.; Xu, C.; Ouer, G.; et al. Quantifying Chlorophyll Fluorescence Parameters from Hyperspectral Reflectance at the Leaf Scale under Various Nitrogen Treatment Regimes in Winter Wheat. Remote Sens. 2019, 11, 2838. [Google Scholar] [CrossRef] [Green Version]
- Yudina, L.; Sukhova, E.; Mudrilov, M.; Nerush, V.; Pecherina, A.; Smirnov, A.A.; Dorokhov, A.S.; Chilingaryan, N.O.; Vodeneev, V.; Sukhov, V. Ratio of Intensities of Blue and Red Light at Cultivation Influences Photosynthetic Light Reactions, Respiration, Growth, and Reflectance Indices in Lettuce. Biology 2022, 11, 60. [Google Scholar] [CrossRef]
- Gitelson, A.; Merzlyak, M.; Chivkunova, O. Optical Properties and Nondestructive Estimation of Anthocyanin Content in Plant Leaves. Photochem. Photobiol. 2001, 74, 38–45. [Google Scholar] [CrossRef]
- Schoch, P.-G.; Zinsou, C.; Sibi, M. Dependence of the Stomatal Index on Environmental Factors during Stomatal Differentiation in Leaves of Vigna sinensis L.: 1. Effect of Light Intensity. J. Exp. Bot. 1980, 31, 1211–1216. [Google Scholar] [CrossRef]
- Zheng, L.; Van Labeke, M.C. Long-Term Effects of Red- and Blue-Light Emitting Diodes on Leaf Anatomy and Photosynthetic Efficiency of Three Ornamental Pot Plants. Front. Plant Sci. 2017, 8, 917. [Google Scholar] [CrossRef] [PubMed] [Green Version]
- Vialet-Chabrand, S.; Matthews, J.S.A.; Lawson, T. Light, power, action! Interaction of respiratory energy- and blue light-induced stomatal movements. New Phytol. 2021, 231, 2231–2246. [Google Scholar] [CrossRef] [PubMed]
- Matthews, J.S.A.; Vialet-Chabrand, S.; Lawson, T. Role of blue and red light in stomatal dynamic behaviour. J. Exp. Bot. 2020, 71, 2253–2269. [Google Scholar] [CrossRef] [PubMed]
- Hogewoning, S.; Trouwborst, G.; Maljaars, H.; Poorter, H.; Van Ieperen, W.; Harbinson, J. Blue light dose-responses of leaf photosynthesis, morphology, and chemical composition of Cucumis sativus grown under different combinations of red and blue light. J. Exp. Bot. 2010, 61, 3107–3117. [Google Scholar] [CrossRef]
- Abidi, F.; Girault, T.; Douillet, O.; Guillemain, G.; Sintes, G.; Laffaire, M.; Ben Ahmed, H.; Smiti, S.; Huché-Thélier, L.; Leduc, N. Blue light effects on rose photosynthesis and photomorphogenesis. Plant Biol. 2013, 15, 67–74. [Google Scholar] [CrossRef] [PubMed]
- Landi, M.; Zivcak, M.; Sytar, O.; Brestic, M.; Allakhverdiev, S.I. Plasticity of photosynthetic processes and the accumulation of secondary metabolites in plants in response to monochromatic light environments: A review. Biochim. Biophys. Acta 2020, 1861, 148131. [Google Scholar] [CrossRef] [PubMed]
- Peñuelas, J.; Filella, I.; Gamon, J. Assessment of photosynthetic radiation-use efficiency with spectral. New Phytol. 1995, 131, 291–296. [Google Scholar] [CrossRef]


| WW | WB | |
|---|---|---|
| Blue (400–480 nm) | 15 | 40 |
| Green-yellow (481–599 nm) | 40 | 34 |
| Red (600–669 nm) | 29 | 16 |
| Far-red (670–800 nm) | 16 | 10 |
| λPeak, nm | 631 | 423 |
| Dependent Variables | Replication | Light Treatment | Cultivar | Interaction | ||||
|---|---|---|---|---|---|---|---|---|
| Df | MS | Df | MS | Df | MS | Df | MS | |
| Rosette fresh weight | 2 | 22.83. | 1 | 11.39 ns | 1 | 69.31 *** | 1 | 3.39 ns |
| Rosette dry weight | 2 | 0.21 ns | 1 | 0.07 ns | 1 | 0.10 ** | 1 | 0.01 ns |
| Number of leaves | 2 | 19.00 ns | 1 | 44.44 ns | 1 | 0.00 ns | 1 | 0.44 ns |
| Plant leaf area | 2 | 8969.00 ns | 1 | 12,428.00 ns | 1 | 31,840.00 *** | 1 | 0.00 ns |
| F0′ | 2 | 45.92 ns | 1 | 61.91 ns | 1 | 2.70 ** | 1 | 2.70 ns |
| Fm’ | 2 | 443.00 ns | 1 | 134.00 ns | 1 | 38,841.00 *** | 1 | 160.00 ns |
| Fv/Fm’ | 2 | 9.55 × 10⁻⁵ ns | 1 | 4.11 × 10⁻⁵ ns | 1 | 3.00 × 10⁻⁵ ns | 1 | 5.20 × 10⁻⁵ ns |
| gs | 2 | 23,337.30 * | 1 | 16,684.00 * | 1 | 2686.70 ns | 1 | 2.20 ns |
| Pore aperture | 2 | 5.32 ns | 1 | 0.14 ns | 1 | 2.78 ns | 1 | 10.70 ns |
| Stomata density | 1 | 0.00 ns | 1 | 0.00· | 1 | 0.00· | 1 | 0.00 ** |
| Stomata index | 2 | 1.64 ns | 1 | 3.32 ns | 1 | 2.24 ns | 1 | 2.23 ns |
| Chlorophyll a | 2 | 11.61 ns | 1 | 0.96 ns | 1 | 12.50 *** | 1 | 0.02 ns |
| Chlorophyll b | 2 | 11.01 * | 1 | 0.00 ns | 1 | 4.32 ** | 1 | 0.04 ns |
| Chlorophyll a:b | 2 | 1.60· | 1 | 0.10 ns | 1 | 0.49 ** | 1 | 0.01 ns |
| Carotenoids | 2 | 0.59 ns | 1 | 0.03 ns | 1 | 0.34 ** | 1 | 0.05 ns |
| Pg,max | 2 | 0.73 ns | 1 | 20.71 | 1 | 11.77· | 1 | 1.24 ns |
| PRIn | 2 | 0.00 ns | 1 | 0.00 ns | 1 | 0.00 *** | 1 | 0.00 ns |
| mARI | 2 | 0.11 ns | 1 | 5.49· | 1 | 85.62 *** | 1 | 5.29 * |
Publisher’s Note: MDPI stays neutral with regard to jurisdictional claims in published maps and institutional affiliations. |
© 2022 by the authors. Licensee MDPI, Basel, Switzerland. This article is an open access article distributed under the terms and conditions of the Creative Commons Attribution (CC BY) license (https://creativecommons.org/licenses/by/4.0/).
Share and Cite
Cammarisano, L.; Körner, O. Response of Cyanic and Acyanic Lettuce Cultivars to an Increased Proportion of Blue Light. Biology 2022, 11, 959. https://doi.org/10.3390/biology11070959
Cammarisano L, Körner O. Response of Cyanic and Acyanic Lettuce Cultivars to an Increased Proportion of Blue Light. Biology. 2022; 11(7):959. https://doi.org/10.3390/biology11070959
Chicago/Turabian StyleCammarisano, Laura, and Oliver Körner. 2022. "Response of Cyanic and Acyanic Lettuce Cultivars to an Increased Proportion of Blue Light" Biology 11, no. 7: 959. https://doi.org/10.3390/biology11070959