
MAGE: An Open-Source Tool for Meta-Analysis of Gene Expression Studies

 ,
,
Abstract
:Simple Summary
Abstract
1. Introduction
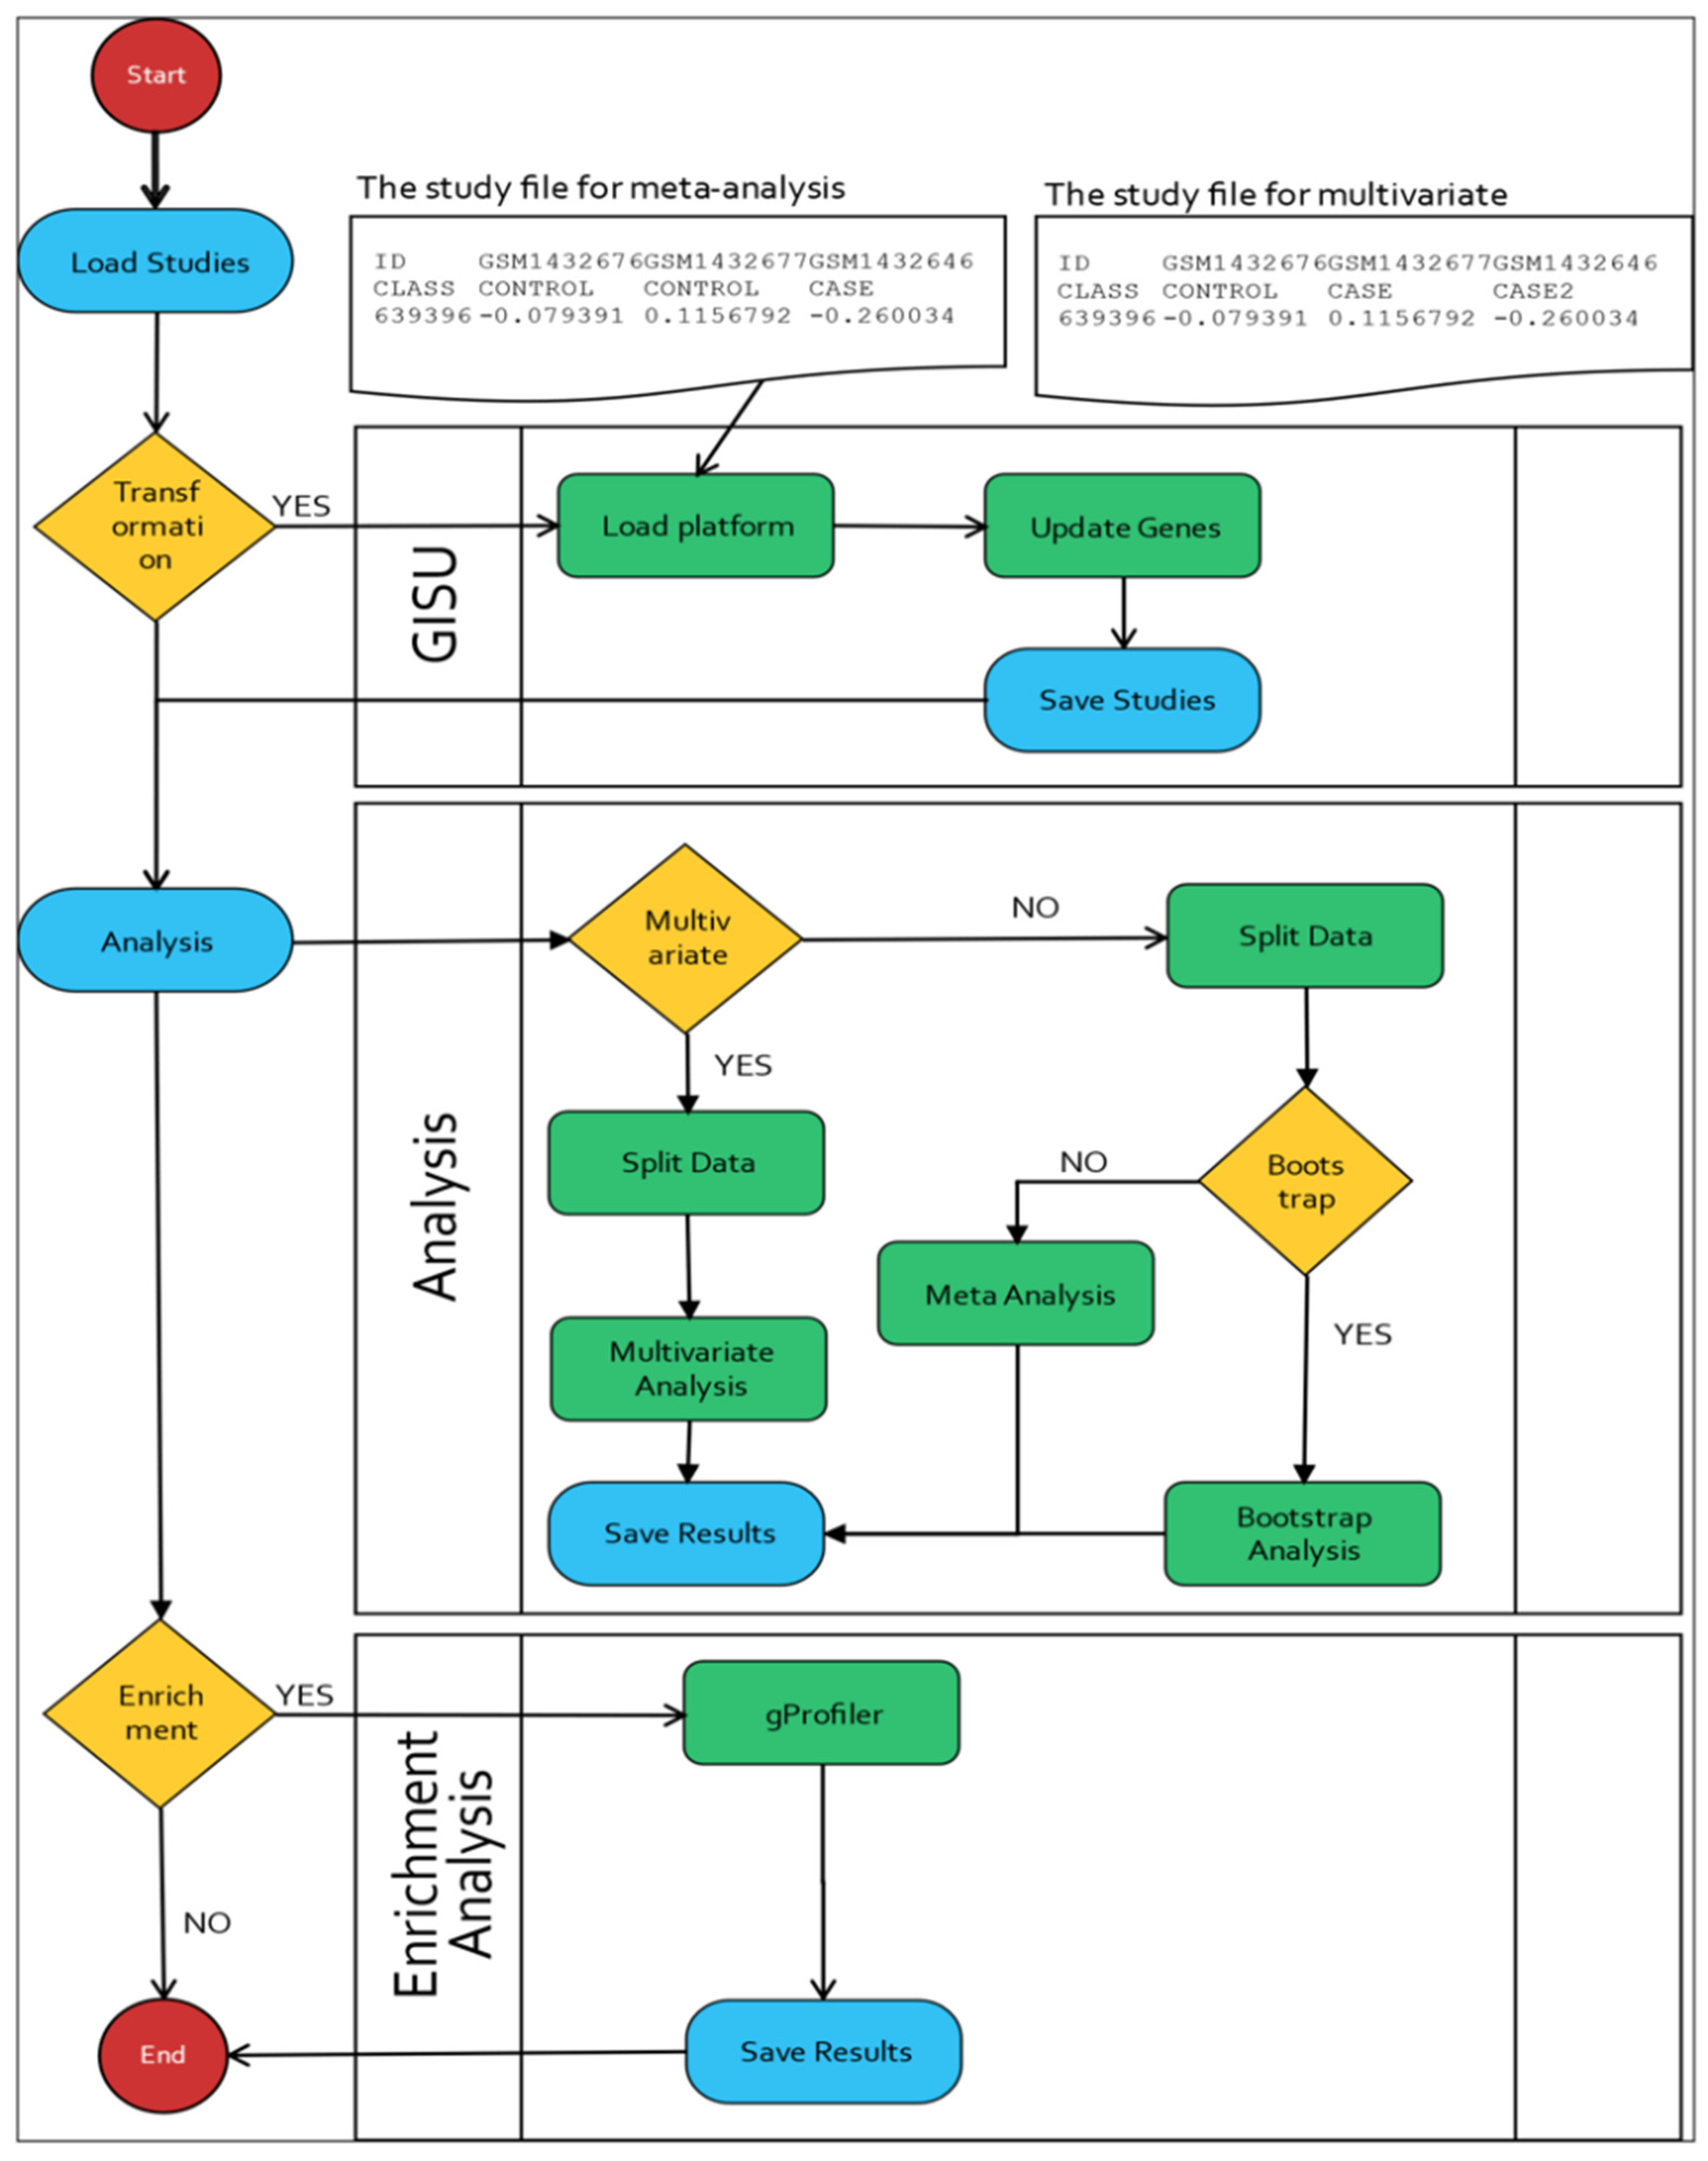
2. Materials and Methods
- Annotation and uploading of gene expression study files;
- Conversion of probes to gene identifiers;
- Performing meta-analysis with various methods;
- Conducting functional enrichment analysis.
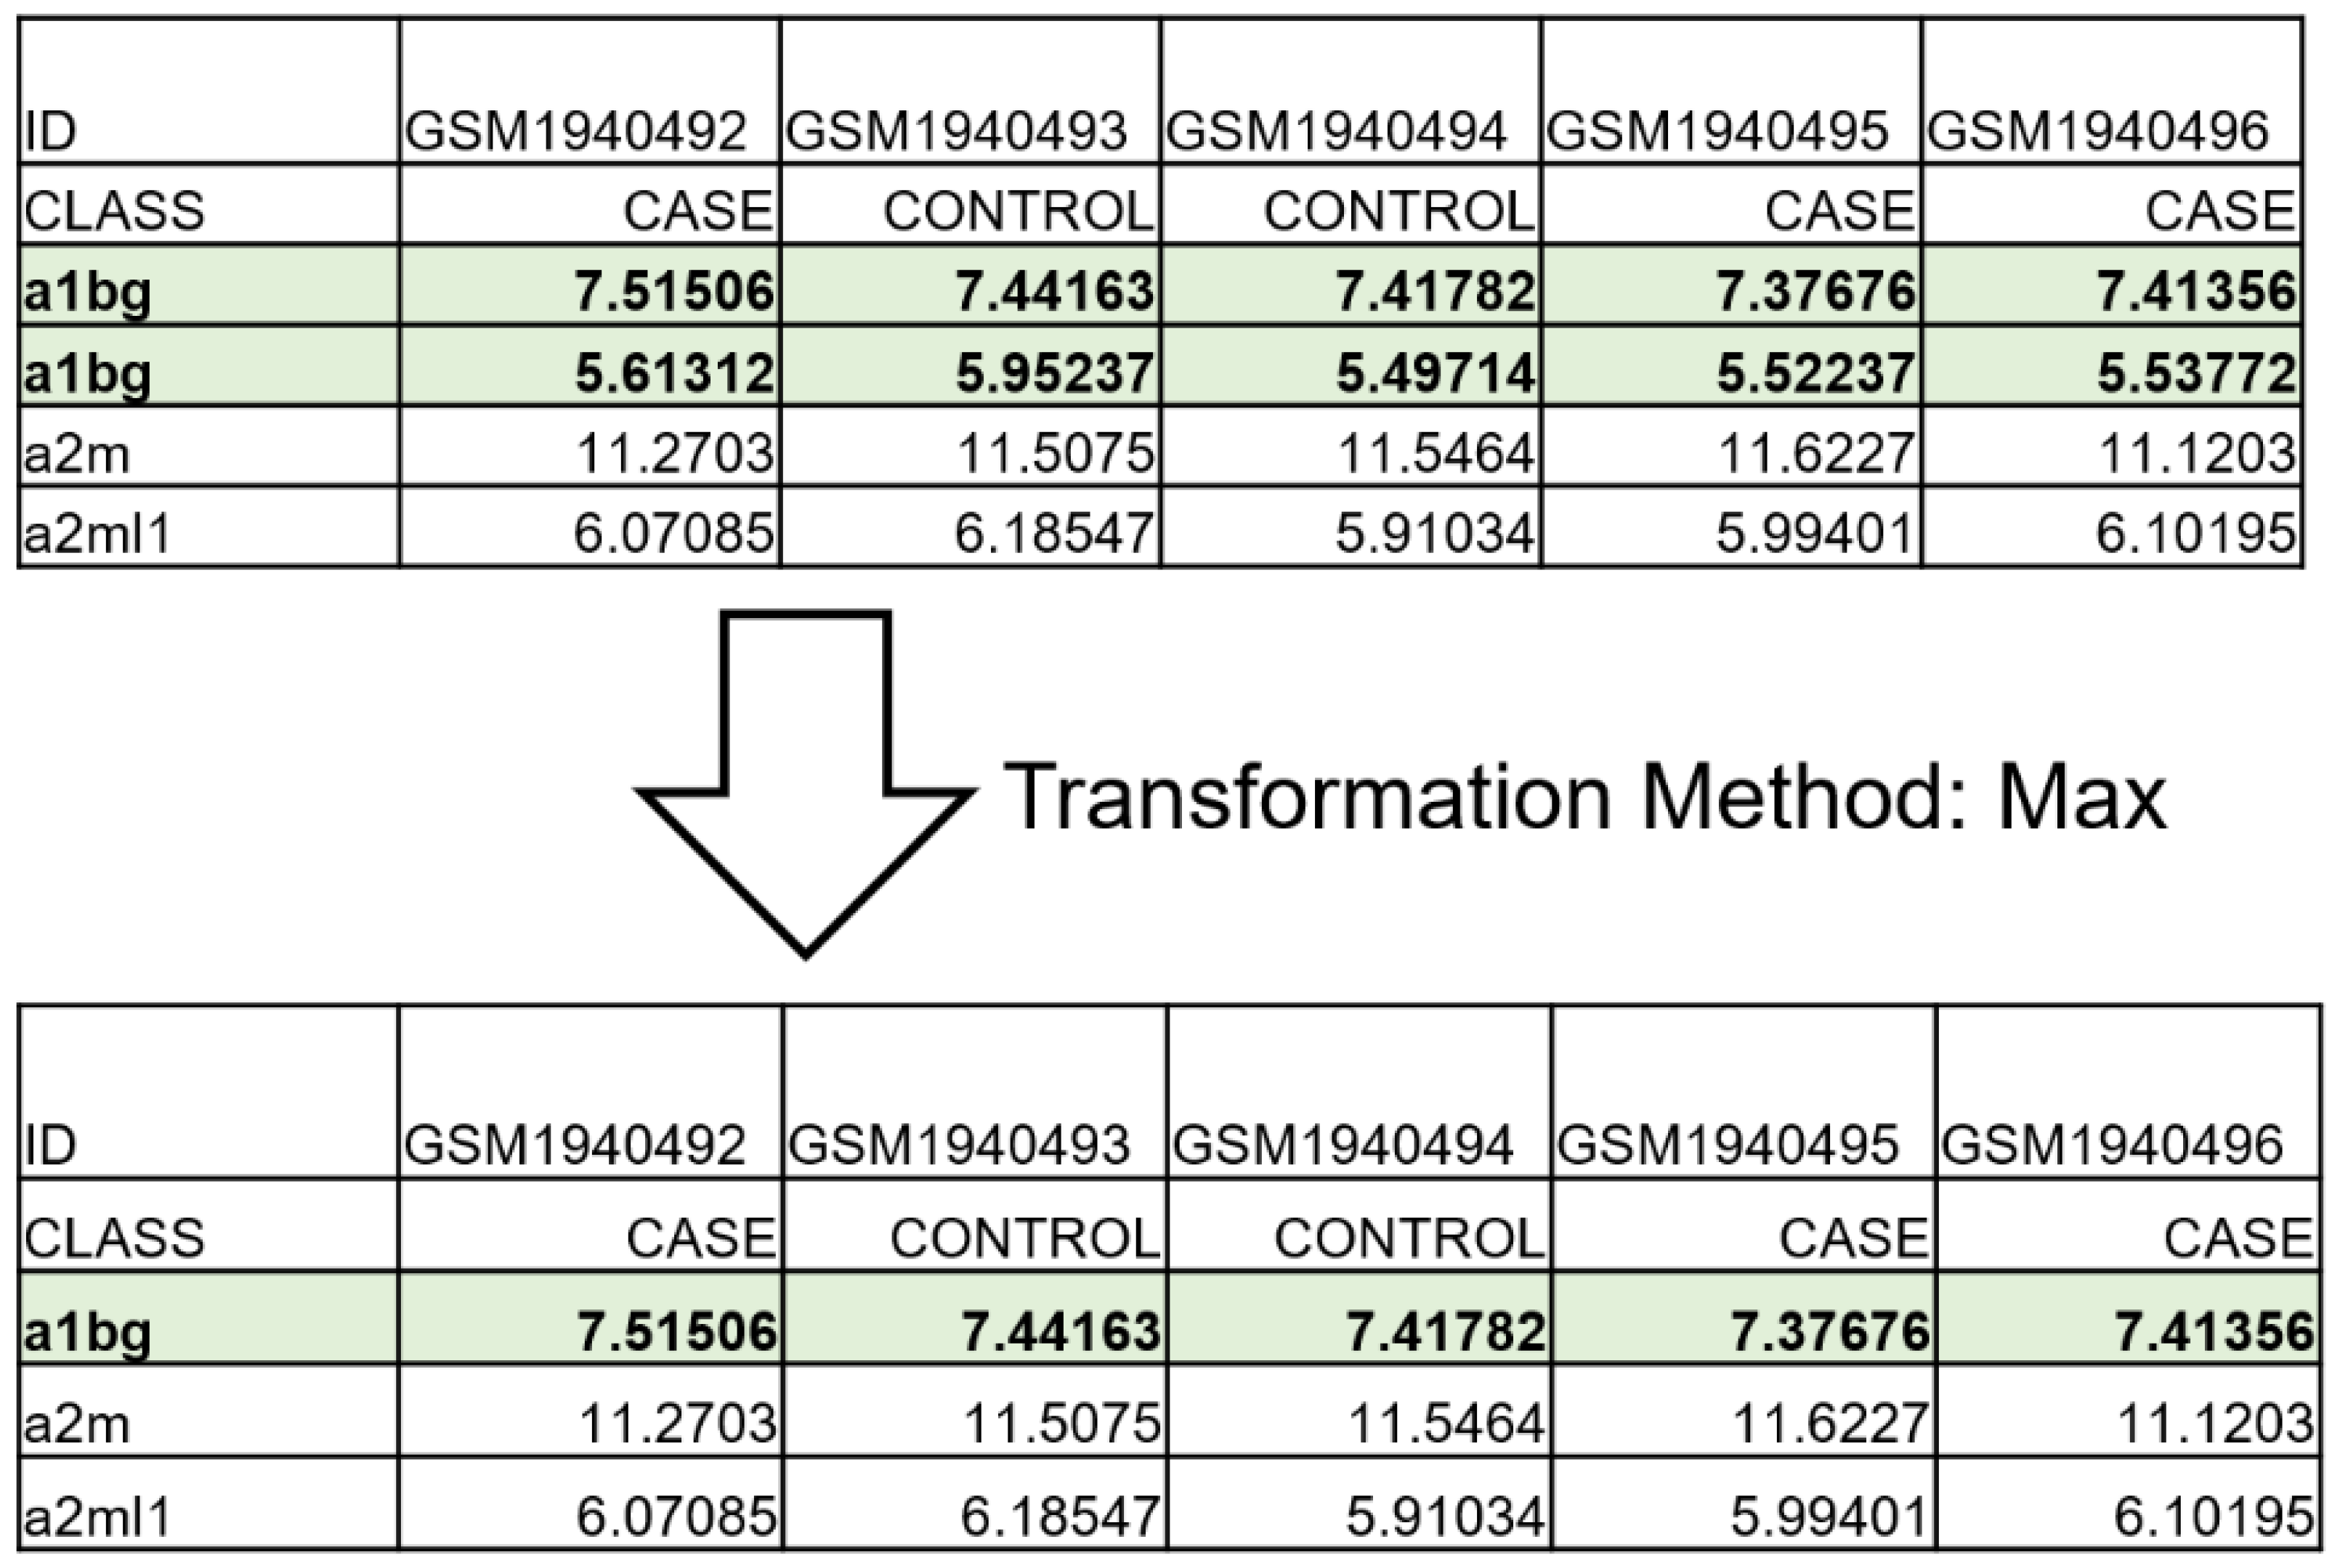
2.1. The Upload and Annotation Step
2.2. GISU Component
2.3. Standard Meta-Analysis
2.4. Bootstrap Standard Errors
2.5. Multiple Outcomes Meta-Analysis
2.6. Multiple-Comparison Methods
2.7. Enrichment Analysis
2.8. Implementation
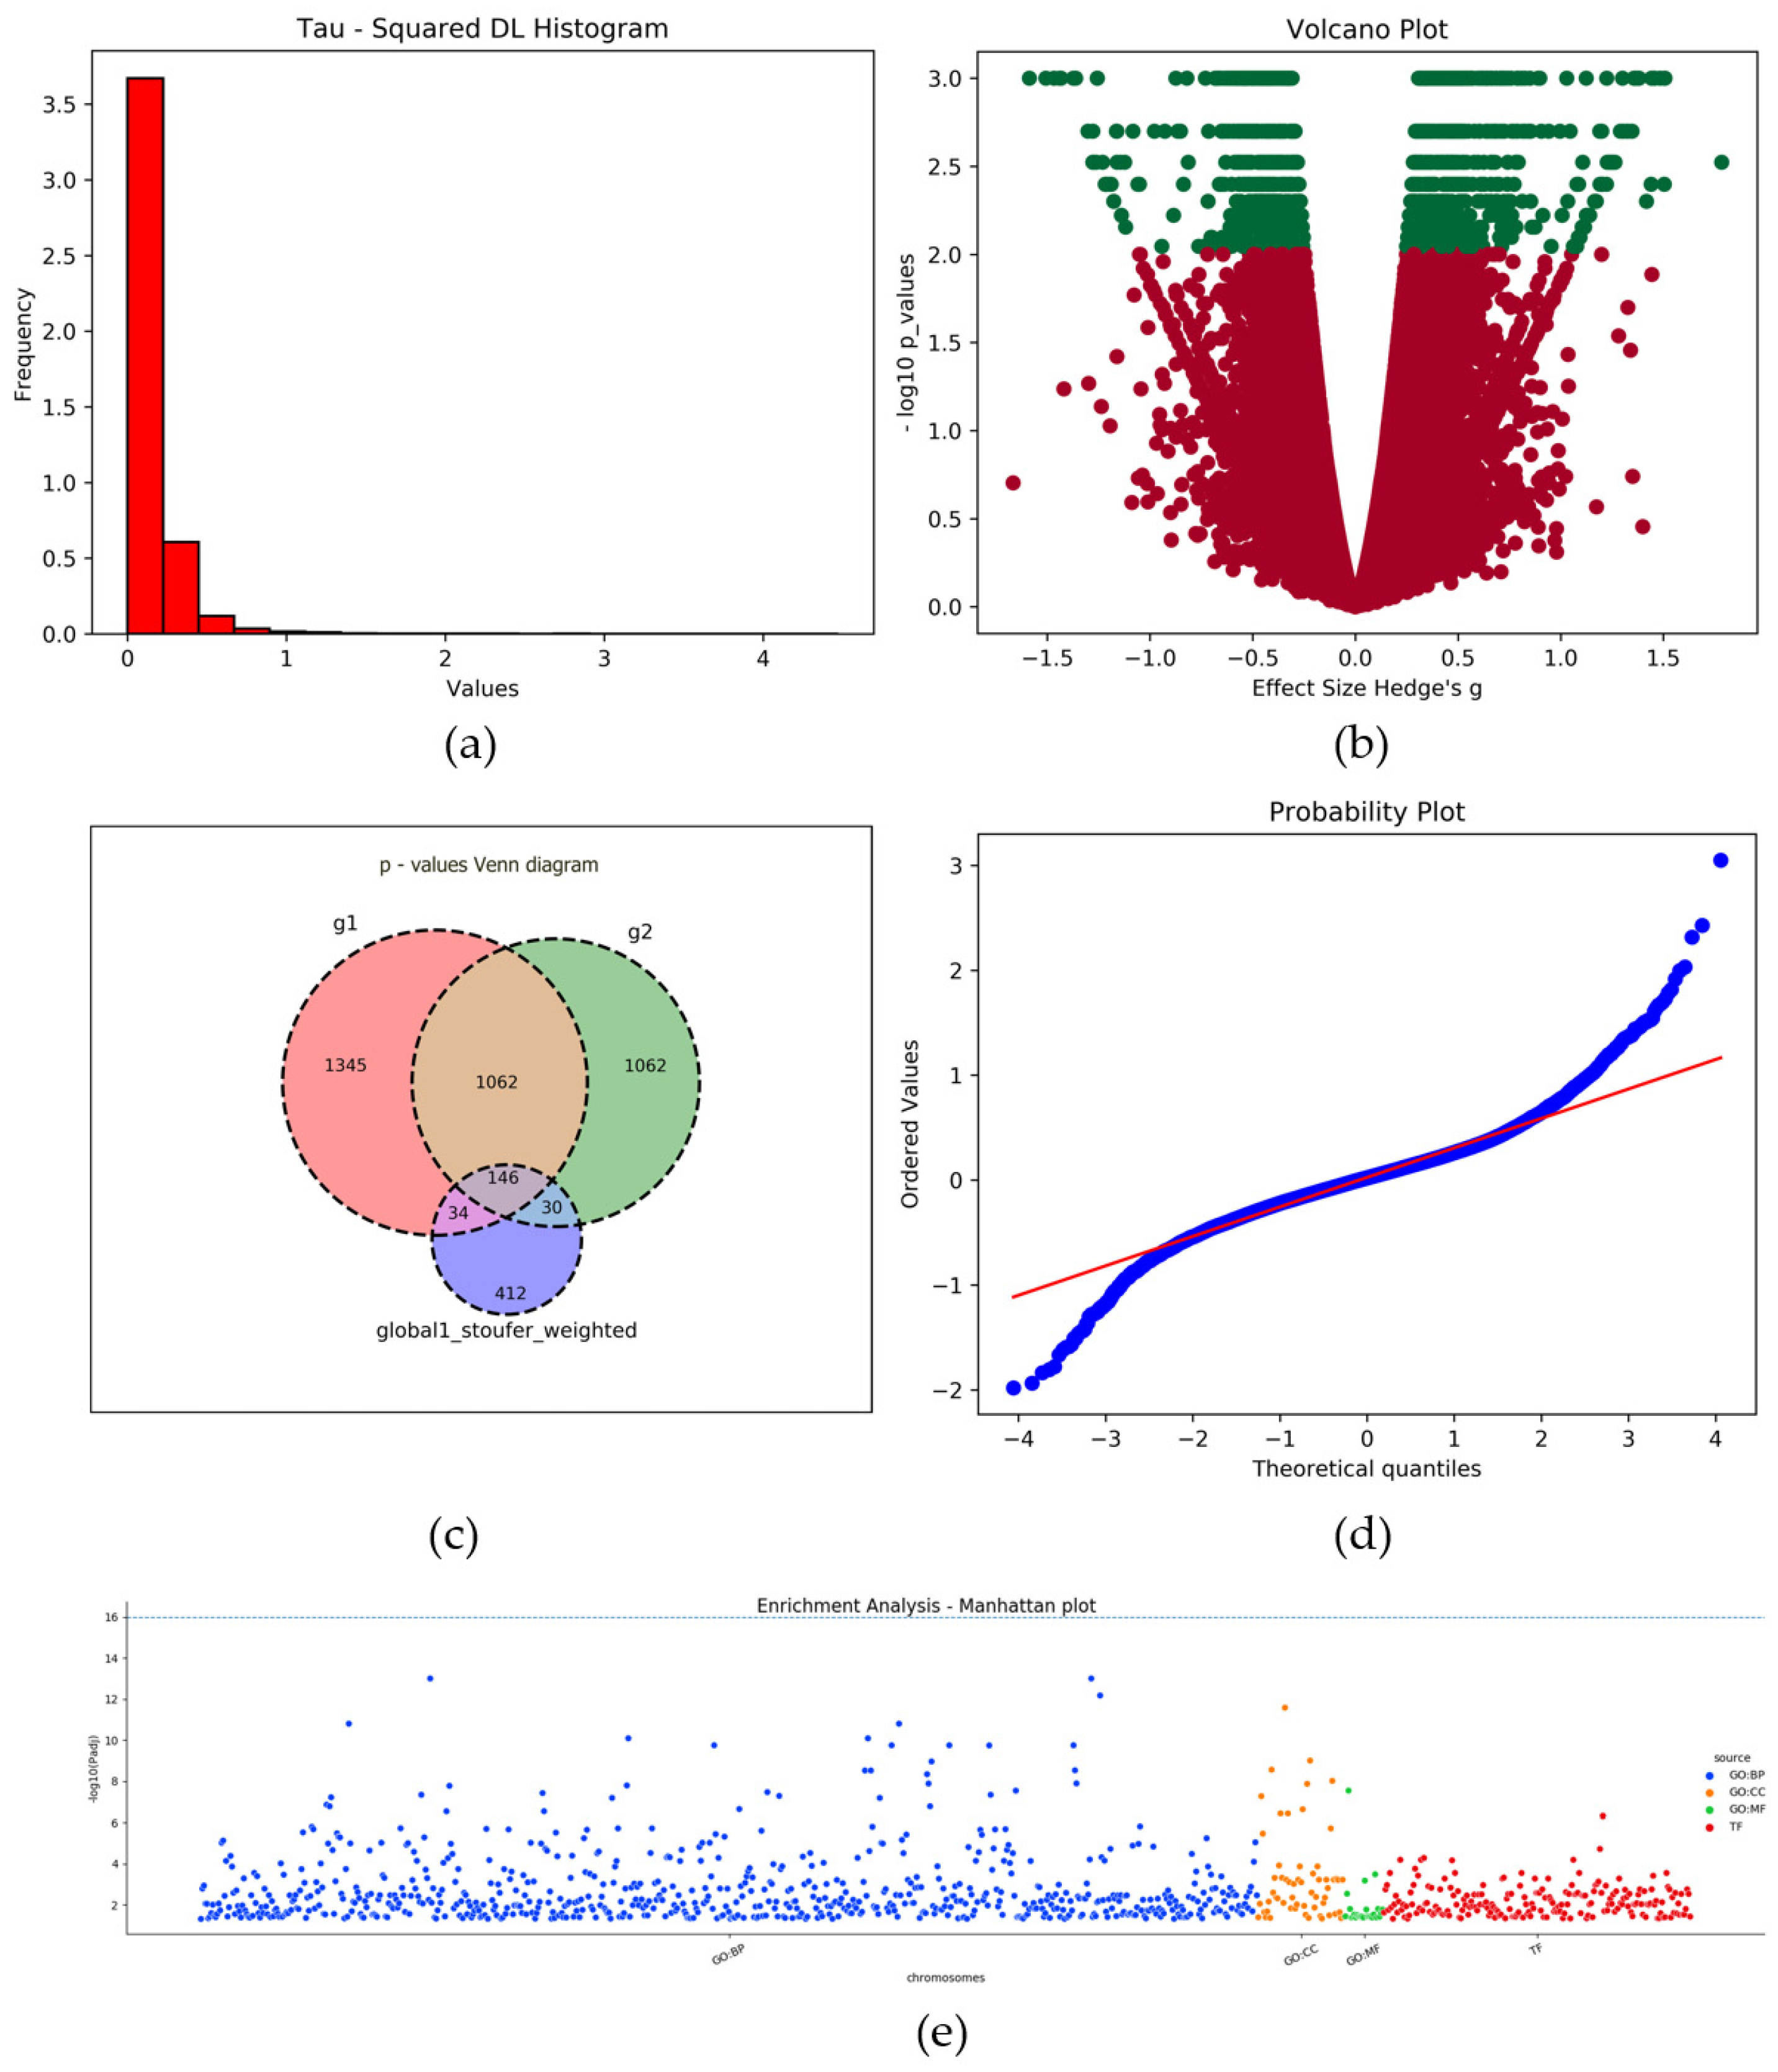
2.9. Plots
3. Results
4. Discussion
5. Conclusions
Supplementary Materials
Author Contributions
Funding
Institutional Review Board Statement
Informed Consent Statement
Data Availability Statement
Conflicts of Interest
References
- Forero, D.A.; Lopez-Leon, S.; González-Giraldo, Y.; Bagos, P.G. Ten Simple Rules for Carrying out and Writing Meta-Analyses. PLoS Comput. Biol. 2019, 15, e1006922. [Google Scholar] [CrossRef] [PubMed]
- Marot, G.; Foulley, J.-L.; Mayer, C.-D.; Jaffrézic, F. Moderated Effect Size and P-Value Combinations for Microarray Meta-Analyses. Bioinformatics 2009, 25, 2692–2699. [Google Scholar] [CrossRef] [PubMed] [Green Version]
- Haynes, W.A.; Vallania, F.; Liu, C.; Bongen, E.; Tomczak, A.; Andres-Terrè, M.; Lofgren, S.; Tam, A.; Deisseroth, C.A.; Li, M.D. Empowering Multi-Cohort Gene Expression Analysis to Increase Reproducibility. In Proceedings of the Pacific Symposium on Biocomputing 2017; World Scientific Publishing Co. Pte. Ltd.: Kohala Coast, HI, USA, 2017. [Google Scholar]
- Villatoro-García, J.A.; Carmona-Sáez, P. Differential Expression Meta-Analysis with DExMA Package. 2021. Available online: https://bioconductor.org/packages/release/bioc/html/DExMA.html (accessed on 12 May 2022).
- Wang, X.; Kang, D.D.; Shen, K.; Song, C.; Lu, S.; Chang, L.-C.; Liao, S.G.; Huo, Z.; Tang, S.; Ding, Y. An R Package Suite for Microarray Meta-Analysis in Quality Control, Differentially Expressed Gene Analysis and Pathway Enrichment Detection. Bioinformatics 2012, 28, 2534–2536. [Google Scholar] [CrossRef]
- Zhou, G.; Soufan, O.; Ewald, J.; Hancock, R.E.; Basu, N.; Xia, J. NetworkAnalyst 3.0: A Visual Analytics Platform for Comprehensive Gene Expression Profiling and Meta-Analysis. Nucleic Acids Res. 2019, 47, W234–W241. [Google Scholar] [CrossRef] [PubMed] [Green Version]
- Raudvere, U.; Kolberg, L.; Kuzmin, I.; Arak, T.; Adler, P.; Peterson, H.; Vilo, J. G: Profiler: A Web Server for Functional Enrichment Analysis and Conversions of Gene Lists (2019 Update). Nucleic Acids Res. 2019, 47, W191–W198. [Google Scholar] [CrossRef] [PubMed] [Green Version]
- Schölz, C.; Lyon, D.; Refsgaard, J.C.; Jensen, L.J.; Choudhary, C.; Weinert, B.T. Avoiding Abundance Bias in the Functional Annotation of Posttranslationally Modified Proteins. Nat. Methods 2015, 12, 1003–1004. [Google Scholar] [CrossRef] [PubMed]
- Liao, Y.; Wang, J.; Jaehnig, E.J.; Shi, Z.; Zhang, B. WebGestalt 2019: Gene Set Analysis Toolkit with Revamped UIs and APIs. Nucleic Acids Res. 2019, 47, W199–W205. [Google Scholar] [CrossRef] [PubMed] [Green Version]
- Mi, H.; Ebert, D.; Muruganujan, A.; Mills, C.; Albou, L.-P.; Mushayamaha, T.; Thomas, P.D. PANTHER Version 16: A Revised Family Classification, Tree-Based Classification Tool, Enhancer Regions and Extensive API. Nucleic Acids Res. 2021, 49, D394–D403. [Google Scholar] [CrossRef]
- Jiao, X.; Sherman, B.T.; Huang, D.W.; Stephens, R.; Baseler, M.W.; Lane, H.C.; Lempicki, R.A. DAVID-WS: A Stateful Web Service to Facilitate Gene/Protein List Analysis. Bioinformatics 2012, 28, 1805–1806. [Google Scholar] [CrossRef] [Green Version]
- Ramasamy, A.; Mondry, A.; Holmes, C.C.; Altman, D.G. Key Issues in Conducting a Meta-Analysis of Gene Expression Microarray Datasets. PLoS Med. 2008, 5, e184. [Google Scholar] [CrossRef]
- Kontou, P.I.; Pavlopoulou, A.; Bagos, P.G. Methods of Analysis and Meta-Analysis for Identifying Differentially Expressed Genes. Methods Mol. Biol. 2018, 1793, 183–210. [Google Scholar] [PubMed]
- Dai, M.; Wang, P.; Boyd, A.D.; Kostov, G.; Athey, B.; Jones, E.G.; Bunney, W.E.; Myers, R.M.; Speed, T.P.; Akil, H. Evolving Gene/Transcript Definitions Significantly Alter the Interpretation of GeneChip Data. Nucleic Acids Res. 2005, 33, e175. [Google Scholar] [CrossRef] [PubMed] [Green Version]
- DerSimonian, R.; Laird, N. Meta-Analysis in Clinical Trials. Control. Clin. Trials 1986, 7, 177–188. [Google Scholar] [CrossRef]
- Hedges, L.V. Distribution Theory for Glass’s Estimator of Effect Size and Related Estimators. J. Educ. Stat. 1981, 6, 107–128. [Google Scholar] [CrossRef]
- Choi, J.K.; Yu, U.; Kim, S.; Yoo, O.J. Combining Multiple Microarray Studies and Modeling Interstudy Variation. Bioinformatics 2003, 19 (Suppl. S1), i84–i90. [Google Scholar] [CrossRef] [PubMed] [Green Version]
- Doerge, R.W. Combining Affymetrix Microarray Results. BMC Bioinform. 2005, 6, 57. [Google Scholar]
- Diciccio, T.J.; Romano, J.P. A Review of Bootstrap Confidence Intervals. J. R. Stat. Soc. Ser. B Stat. Methodol. 1988, 50, 338–354. [Google Scholar] [CrossRef]
- Meuwissen, T.H.; Goddard, M.E. Bootstrapping of Gene-Expression Data Improves and Controls the False Discovery Rate of Differentially Expressed Genes. Genet. Sel. Evol. 2004, 36, 191–205. [Google Scholar] [CrossRef] [Green Version]
- Vennou, K.E.; Piovani, D.; Kontou, P.I.; Bonovas, S.; Bagos, P.G. Methods for Multiple Outcome Meta-Analysis of Gene-Expression Data. MethodsX 2020, 7, 100834. [Google Scholar] [CrossRef]
- Ludbrook, J. Multiple Comparison Procedures Updated. Clin. Exp. Pharmacol. Physiol. 1998, 25, 1032–1037. [Google Scholar] [CrossRef]
- Holm, S. A Simple Sequentially Rejective Multiple Test Procedure. Scand. J. Stat. 1979, 6, 65–70. [Google Scholar]
- Holland, B.S.; Copenhaver, M.D. An Improved Sequentially Rejective Bonferroni Test Procedure. Biometrics 1987, 43, 417–423. [Google Scholar] [CrossRef]
- Benjamini, Y. Discovering the False Discovery Rate. J. R. Stat. Soc. Ser. B Stat. Methodol. 2010, 72, 405–416. [Google Scholar] [CrossRef]
- Simes, R.J. An Improved Bonferroni Procedure for Multiple Tests of Significance. Biometrika 1986, 73, 751–754. [Google Scholar] [CrossRef]
- Vennou, K.E.; Kontou, P.I.; Braliou, G.G.; Bagos, P.G. Meta-Analysis of Gene Expression Profiles in Preeclampsia. Pregnancy Hypertens. 2020, 19, 52–60. [Google Scholar] [CrossRef] [PubMed]
- Lazar, C.; Meganck, S.; Taminau, J.; Steenhoff, D.; Coletta, A.; Molter, C.; Weiss-Solís, D.Y.; Duque, R.; Bersini, H.; Nowé, A. Batch Effect Removal Methods for Microarray Gene Expression Data Integration: A Survey. Brief. Bioinform. 2013, 14, 469–490. [Google Scholar] [CrossRef] [Green Version]
- Luo, J.; Schumacher, M.; Scherer, A.; Sanoudou, D.; Megherbi, D.; Davison, T.; Shi, T.; Tong, W.; Shi, L.; Hong, H.; et al. A Comparison of Batch Effect Removal Methods for Enhancement of Prediction Performance Using MAQC-II Microarray Gene Expression Data. Pharm. J. 2010, 10, 278–291. [Google Scholar] [CrossRef] [Green Version]
- Taminau, J.; Lazar, C.; Meganck, S.; Nowé, A. Comparison of Merging and Meta-Analysis as Alternative Approaches for Integrative Gene Expression Analysis. ISRN Bioinform. 2014, 2014, 345106. [Google Scholar] [CrossRef]
- Walsh, C.J.; Hu, P.; Batt, J.; Santos, C.C.D. Microarray Meta-Analysis and Cross-Platform Normalization: Integrative Genomics for Robust Biomarker Discovery. Microarrays 2015, 4, 389–406. [Google Scholar] [CrossRef]
- Guo, L.; Tsai, S.Q.; Hardison, N.E.; James, A.H.; Motsinger-Reif, A.A.; Thames, B.; Stone, E.A.; Deng, C.; Piedrahita, J.A. Differentially expressed microRNAs and affected biological pathways revealed by modulated modularity clustering (MMC) analysis of human preeclamptic and IUGR placentas. Placenta 2013, 34, 599–605. [Google Scholar] [CrossRef] [Green Version]
- Jebbink, J.M.; Boot, R.G.; Keijser, R.; Moerland, P.D.; Aten, J.; Veenboer, G.J.; van Wely, M.; Buimer, M.; Ver Loren van Themaat, E.; Aerts, J.M.; et al. Increased glucocerebrosidase expression and activity in preeclamptic placenta. Placenta 2015, 36, 160–169. [Google Scholar] [CrossRef] [PubMed]
- Leavey, K.; Benton, S.J.; Grynspan, D.; Kingdom, J.C.; Bainbridge, S.A.; Cox, B.J. Unsupervised Placental Gene Expression Profiling Identifies Clinically Relevant Subclasses of Human Preeclampsia. Hypertension 2016, 68, 137–147. [Google Scholar] [CrossRef] [PubMed] [Green Version]
- Liang, M.; Niu, J.; Zhang, L.; Deng, H.; Ma, J.; Zhou, W.; Duan, D.; Zhou, Y.; Xu, H.; Chen, L. Gene expression profiling reveals different molecular patterns in G-protein coupled receptor signaling pathways between early- and late-onset preeclampsia. Placenta 2016, 40, 52–59. [Google Scholar] [CrossRef]
- Meng, T.; Chen, H.; Sun, M.; Wang, H.; Zhao, G.; Wang, X. Identification of differential gene expression profiles in placentas from preeclamptic pregnancies versus normal pregnancies by DNA microarrays. OMICS 2012, 16, 301–311. [Google Scholar] [CrossRef] [PubMed] [Green Version]
- Nishizawa, H.; Ota, S.; Suzuki, M.; Kato, T.; Sekiya, T.; Kurahashi, H.; Udagawa, Y. Comparative gene expression profiling of placentas from patients with severe pre-eclampsia and unexplained fetal growth restriction. Reprod. Biol. Endocrinol. 2011, 9, 107. [Google Scholar] [CrossRef] [PubMed] [Green Version]
- Nishizawa, H.; Pryor-Koishi, K.; Kato, T.; Kowa, H.; Kurahashi, H.; Udagawa, Y. Microarray analysis of differentially expressed fetal genes in placental tissue derived from early and late onset severe pre-eclampsia. Placenta 2007, 28, 487–497. [Google Scholar] [CrossRef]
- Sitras, V.; Paulssen, R.H.; Grønaas, H.; Leirvik, J.; Hanssen, T.A.; Vårtun, A.; Acharya, G. Differential placental gene expression in severe preeclampsia. Placenta 2009, 30, 424–433. [Google Scholar] [CrossRef]
- Tsai, S.; Hardison, N.E.; James, A.H.; Motsinger-Reif, A.A.; Bischoff, S.R.; Thames, B.H.; Piedrahita, J.A. Transcriptional profiling of human placentas from pregnancies complicated by preeclampsia reveals disregulation of sialic acid acetylesterase and immune signalling pathways. Placenta 2011, 32, 175–182. [Google Scholar] [CrossRef] [Green Version]
- Winn, V.D.; Gormley, M.; Paquet, A.C.; Kjaer-Sorensen, K.; Kramer, A.; Rumer, K.K.; Haimov-Kochman, R.; Yeh, R.F.; Overgaard, M.T.; Varki, A.; et al. Severe preeclampsia-related changes in gene expression at the maternal-fetal interface include sialic acid-binding immunoglobulin-like lectin-6 and pappalysin-2. Endocrinology 2009, 150, 452–462. [Google Scholar] [CrossRef]


| Features | MAGE (2022) | metaMA (2009) | MetaDE (2012) | MetaIntegrator (2017) | Express Analyst (2019) | DExMA (2021) |
|---|---|---|---|---|---|---|
| Software type | Web based, Standalone | Standalone | Standalone | Standalone | Web based | Standalone |
| Programming language | Python | R | R | R | Javascript, R | R |
| License | Free | Free | Free | Free | Free | Free |
| Data Input | Expression tables | Expression tables | Expression tables | Expression tables | Expression tables | Expression tables |
| GEO data download | No | No | No | Yes | No | Yes |
| Probe annotation | Yes | No | Yes | Yes | Yes | No |
| Standard meta-analysis | Yes | Yes | Yes | Yes | Yes | Yes |
| Rank product meta-analysis | No | No | Yes | No | Yes | No |
| p-value combination | No | No | Yes | No | Yes | Yes |
| Hedge’s g | Yes | No | Yes | No | No | Yes |
| IDD/IRR | Yes | Yes | No | No | No | No |
| FDR methods | Yes | No | Yes | Yes | No | Yes |
| FWER methods | Yes | No | No | No | No | No |
| Bootstrap standard errors | Yes | No | No | No | No | No |
| Multiple outcomes meta-analysis | Yes | No | No | No | No | No |
| Enrichment analysis | Yes | No | Yes | No | Yes | No |
| Requires a common gene set across studies | No | Yes | Yes | No | No | No |
| Visualizations | Yes | Yes | Yes | Yes | Yes | Yes |
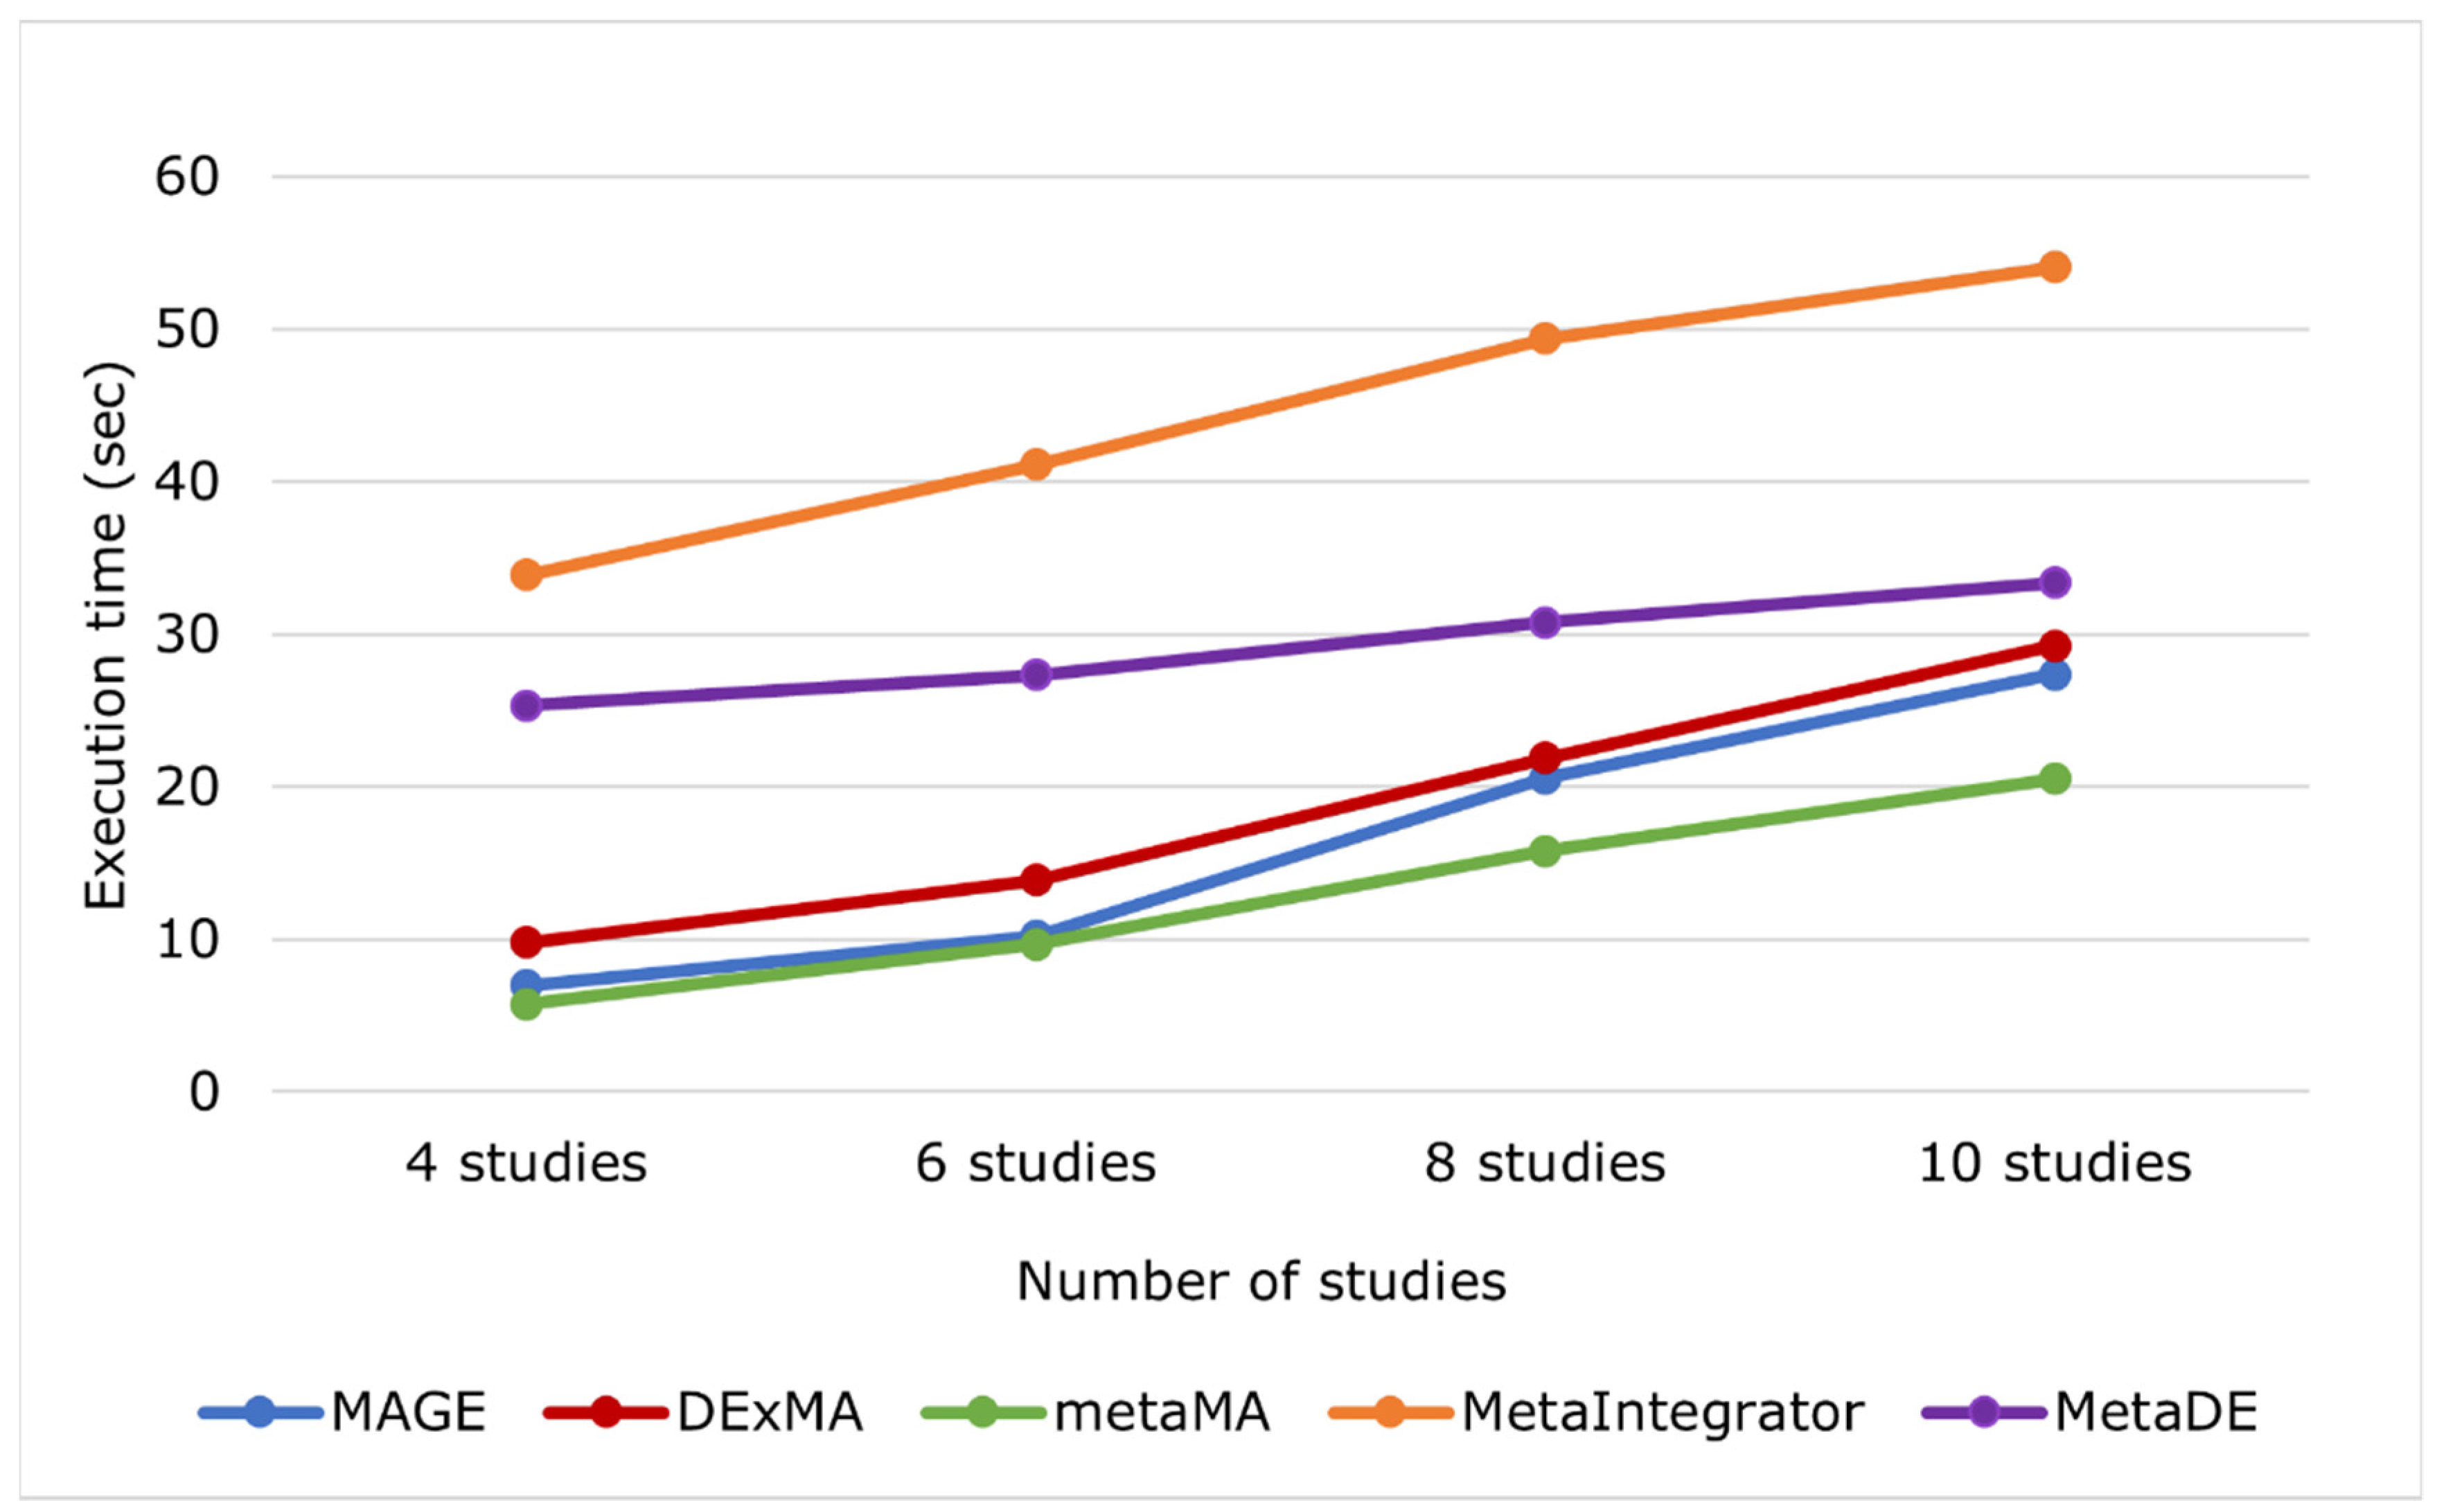
| Number of Studies | 4 Studies | 6 Studies | 8 Studies | 10 Studies |
|---|---|---|---|---|
| MAGE | 6.98 s | 10.23 s | 20.58 s | 27.36 s |
| DExMA | 9.81 s | 13.89 s | 21.87 s | 29.25 s |
| metaMA | 5.74 s | 9.67 s | 15.81 s | 20.54 s |
| MetaIntegrator | 33.91 s | 41.12 s | 49.39 s | 54.07 s |
| MetaDE | 25.32 s | 27.33 s | 30.78 s | 33.37 s |
Publisher’s Note: MDPI stays neutral with regard to jurisdictional claims in published maps and institutional affiliations. |
© 2022 by the authors. Licensee MDPI, Basel, Switzerland. This article is an open access article distributed under the terms and conditions of the Creative Commons Attribution (CC BY) license (https://creativecommons.org/licenses/by/4.0/).
Share and Cite
Tamposis, I.A.; Manios, G.A.; Charitou, T.; Vennou, K.E.; Kontou, P.I.; Bagos, P.G. MAGE: An Open-Source Tool for Meta-Analysis of Gene Expression Studies. Biology 2022, 11, 895. https://doi.org/10.3390/biology11060895
Tamposis IA, Manios GA, Charitou T, Vennou KE, Kontou PI, Bagos PG. MAGE: An Open-Source Tool for Meta-Analysis of Gene Expression Studies. Biology. 2022; 11(6):895. https://doi.org/10.3390/biology11060895
Chicago/Turabian StyleTamposis, Ioannis A., Georgios A. Manios, Theodosia Charitou, Konstantina E. Vennou, Panagiota I. Kontou, and Pantelis G. Bagos. 2022. "MAGE: An Open-Source Tool for Meta-Analysis of Gene Expression Studies" Biology 11, no. 6: 895. https://doi.org/10.3390/biology11060895