
A Noninvasive Gas Exchange Method to Test and Model Photosynthetic Proficiency and Growth Rates of In Vitro Plant Cultures: Preliminary Implication for Cannabis sativa L.


 , and
, and 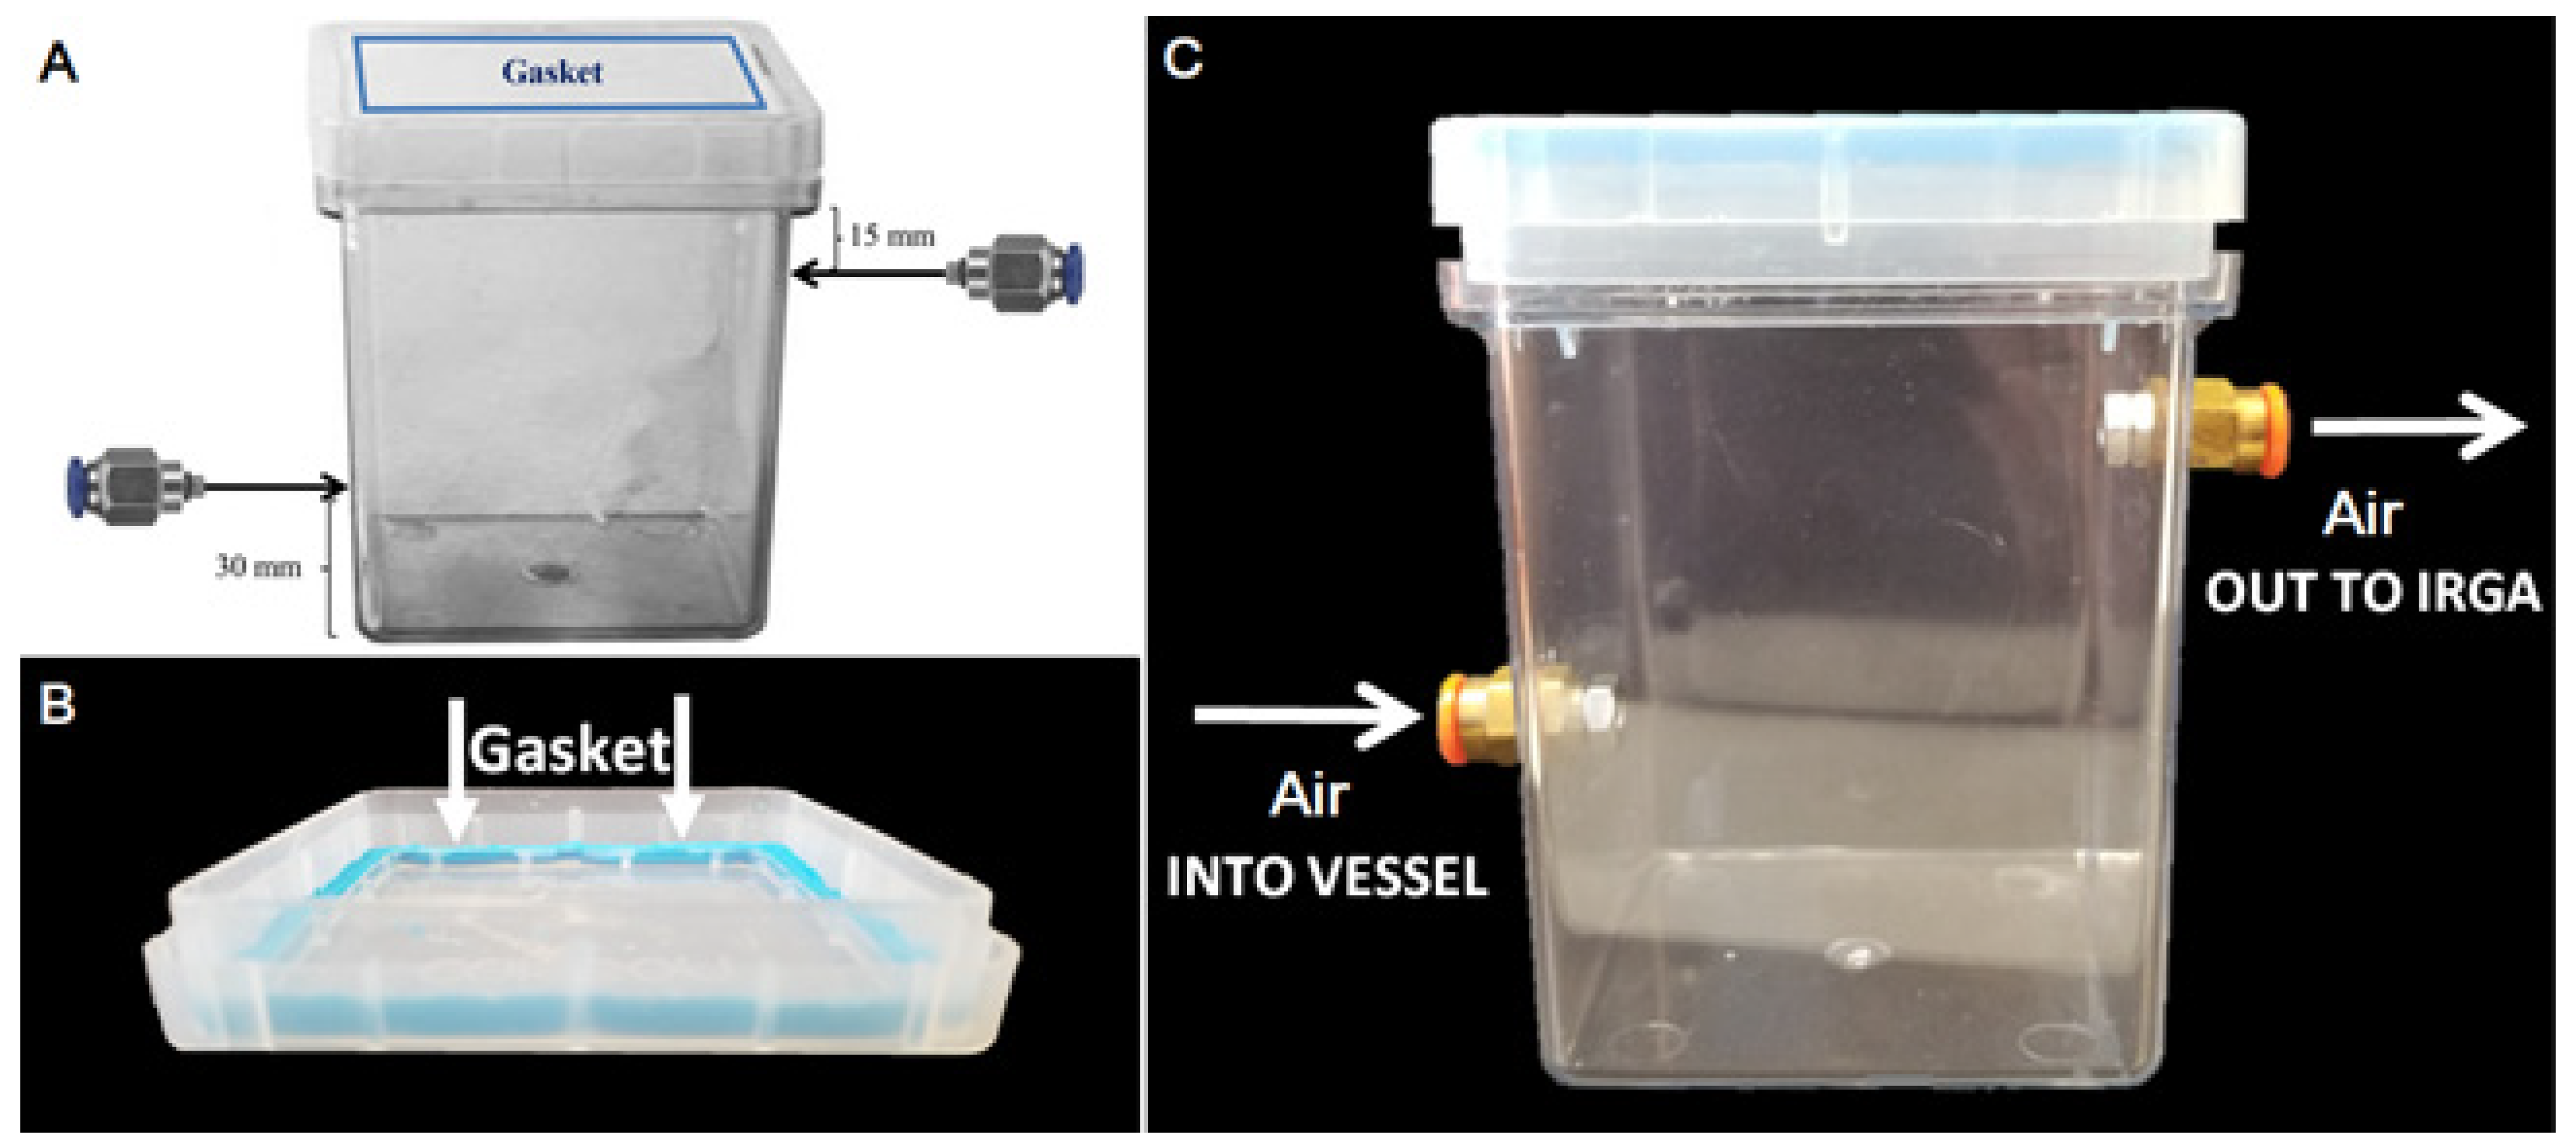
Abstract
:Simple Summary
Abstract
1. Introduction
2. Materials and Methods
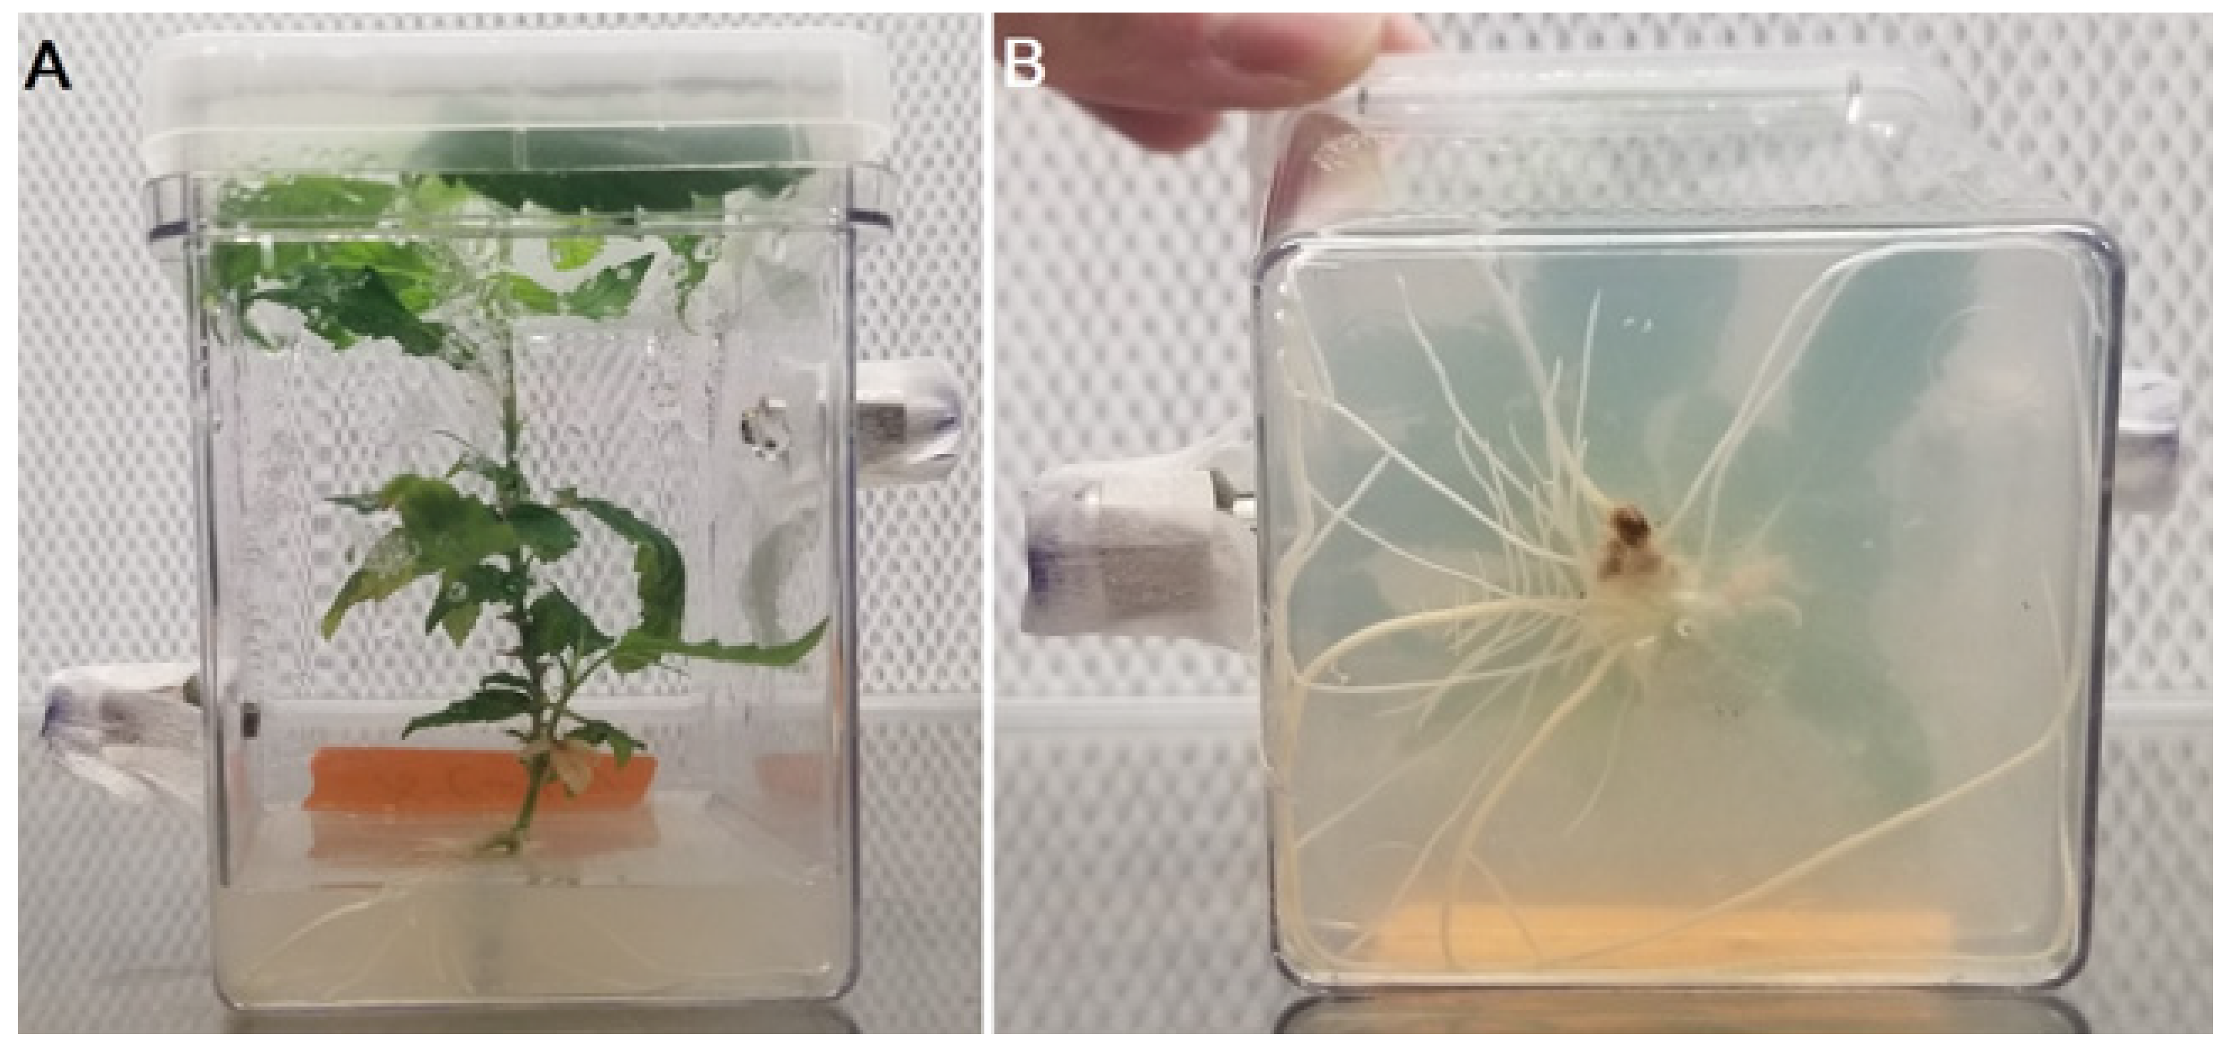
2.1. Plant Material and Culture Conditions
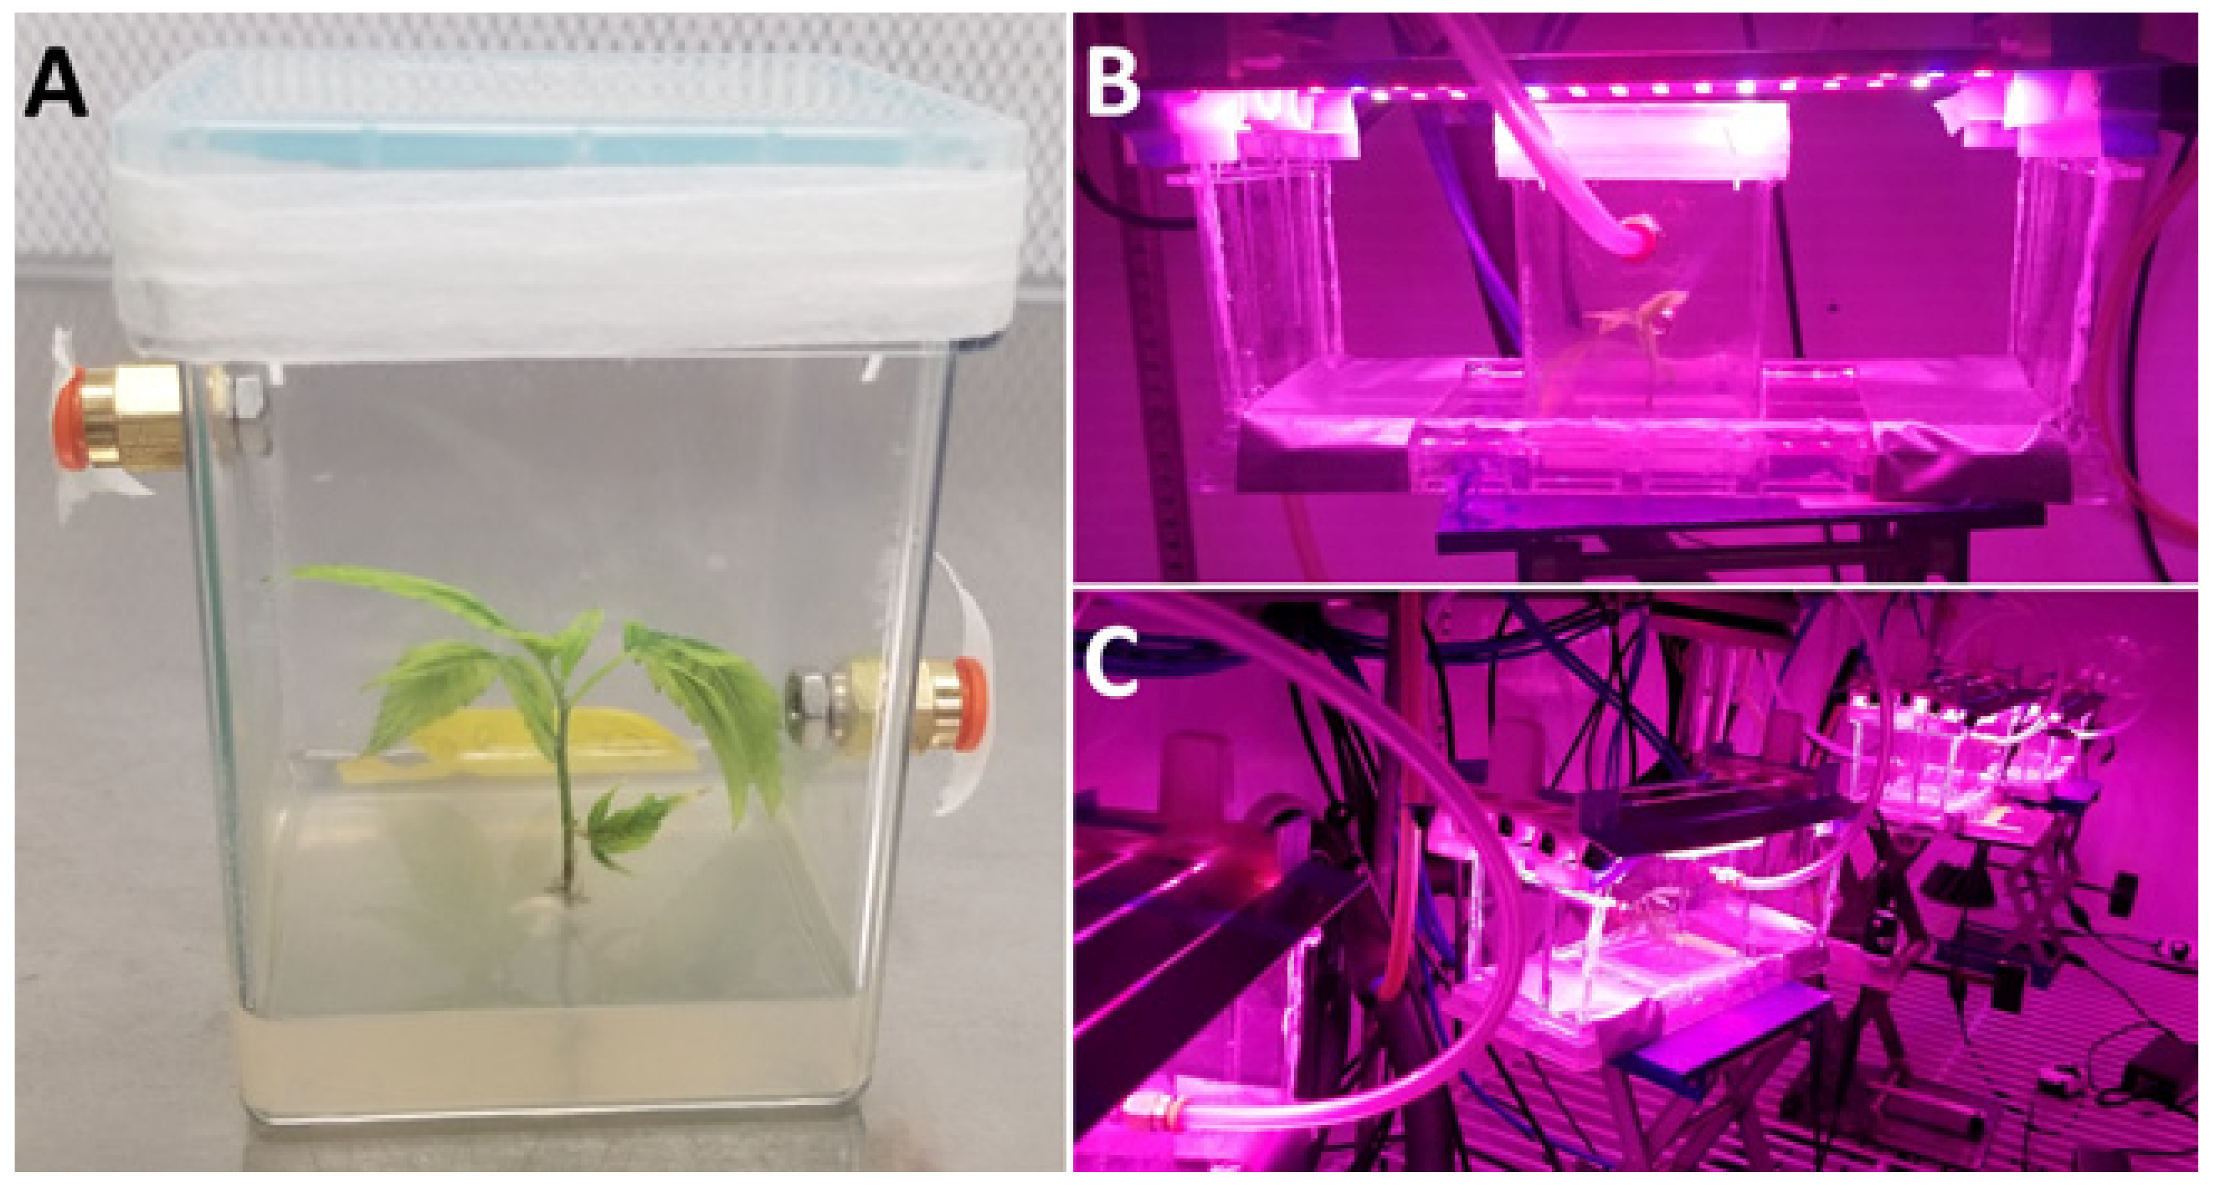
2.2. Gas Exchange System
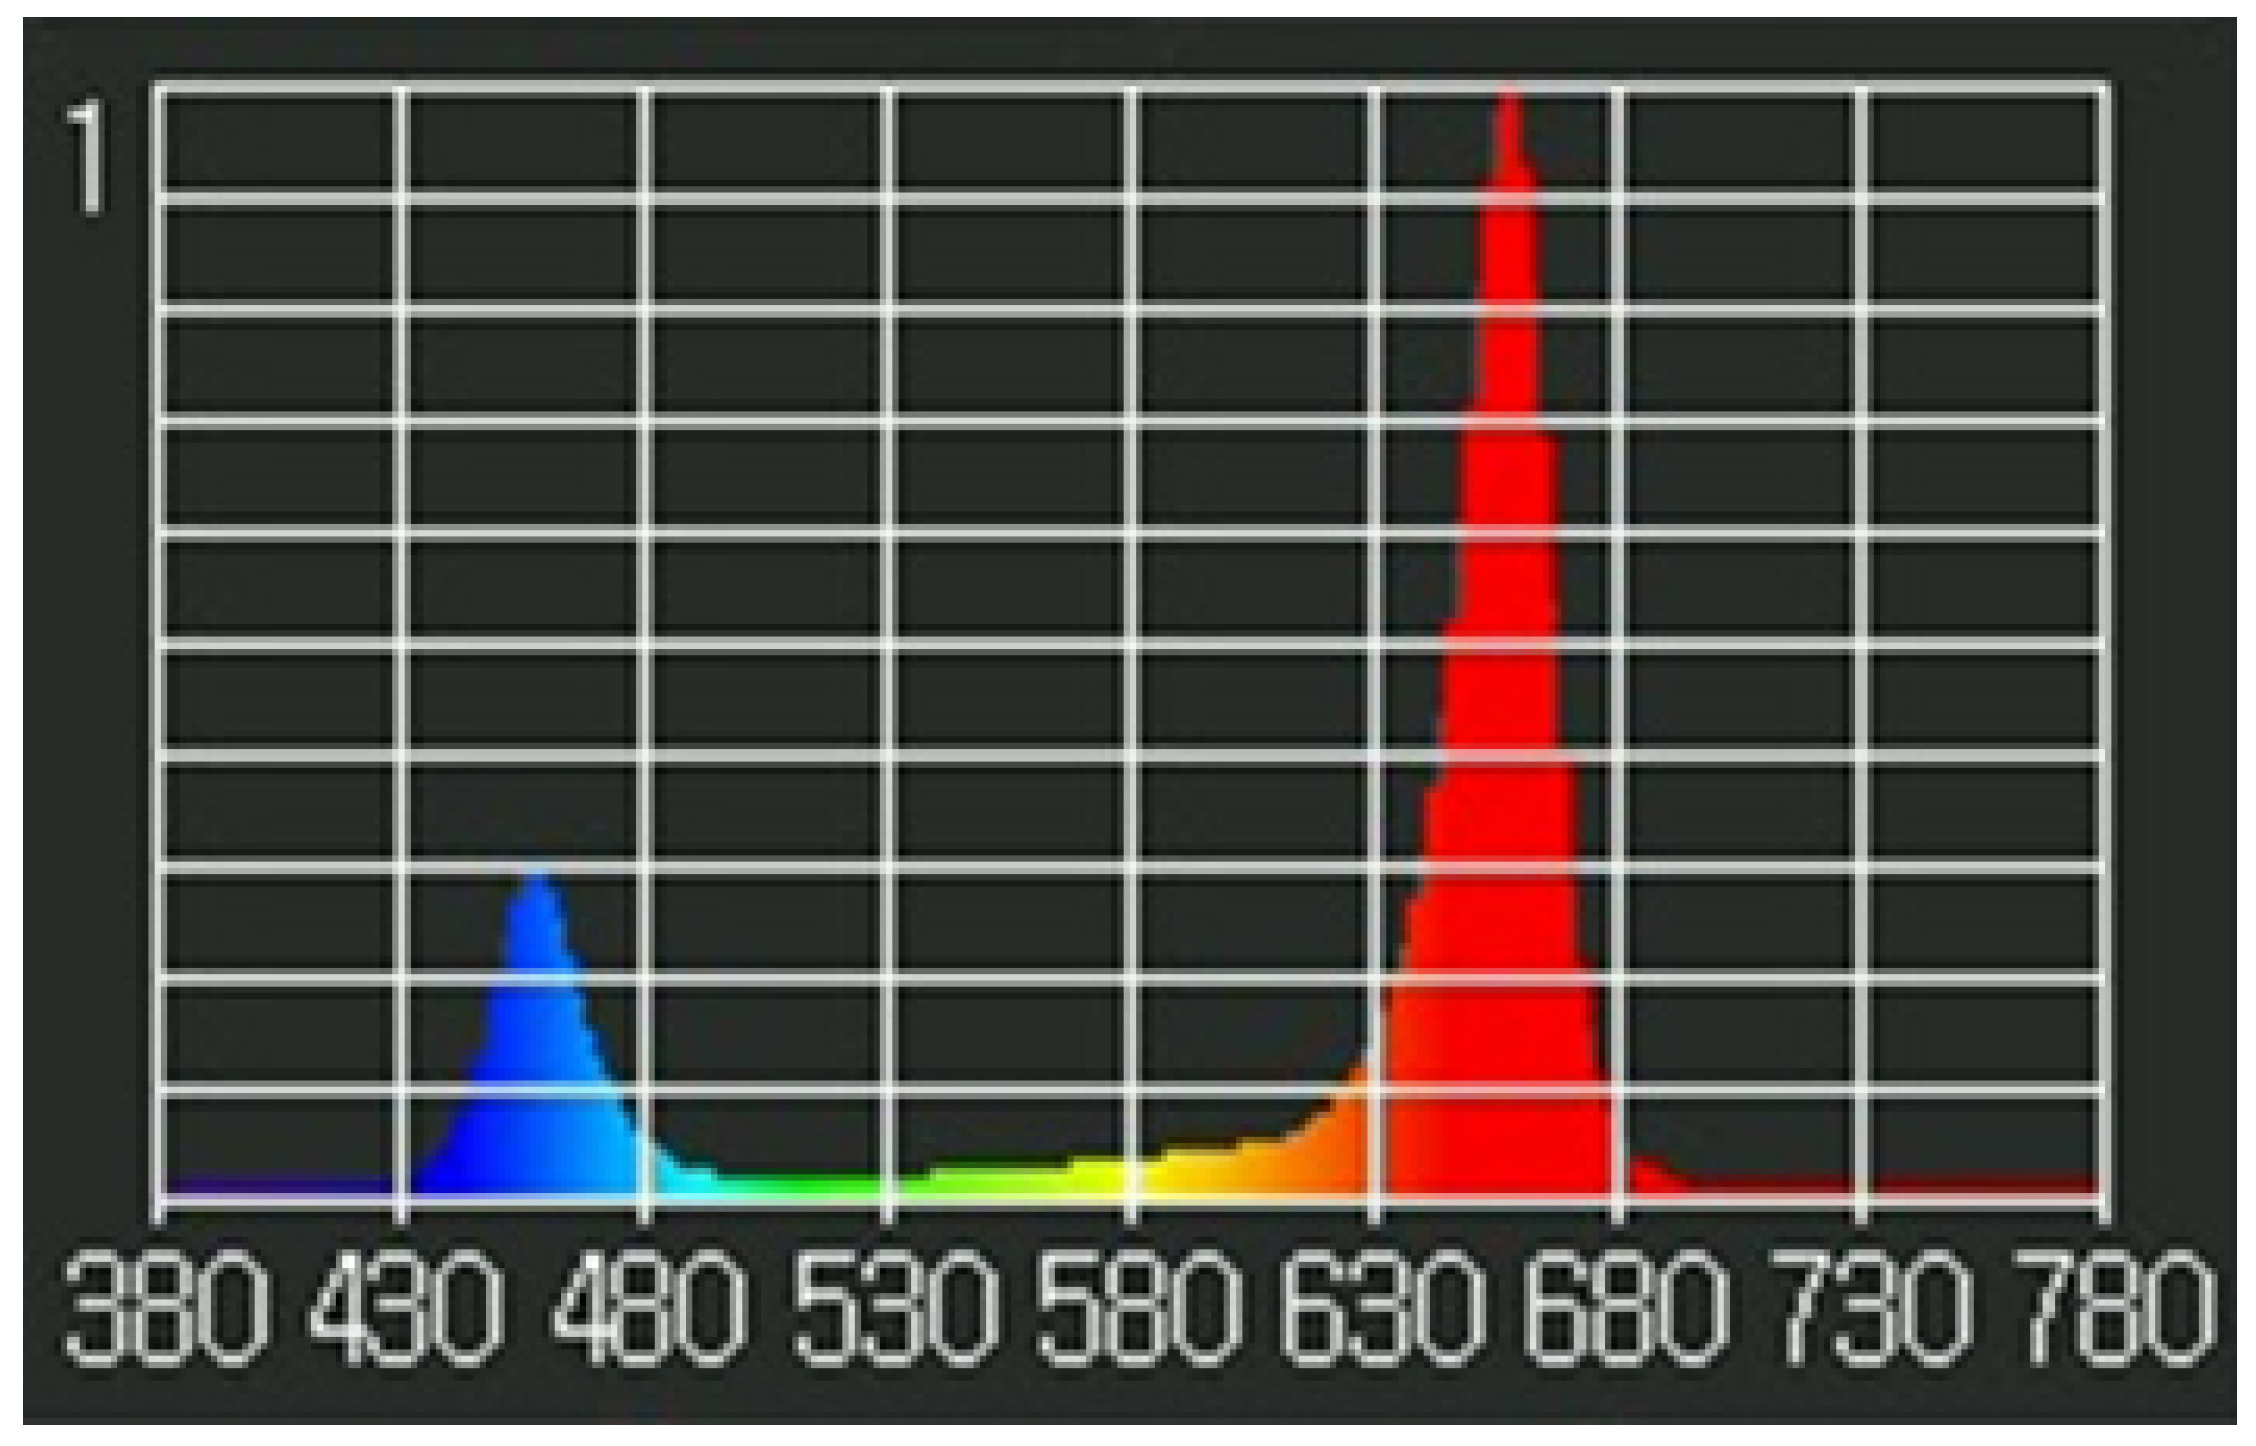
2.3. Experimental Lighting
2.4. Experimental Process 1
2.5. Experimental Process 2
2.6. Data Harvesting and Processing
3. Results
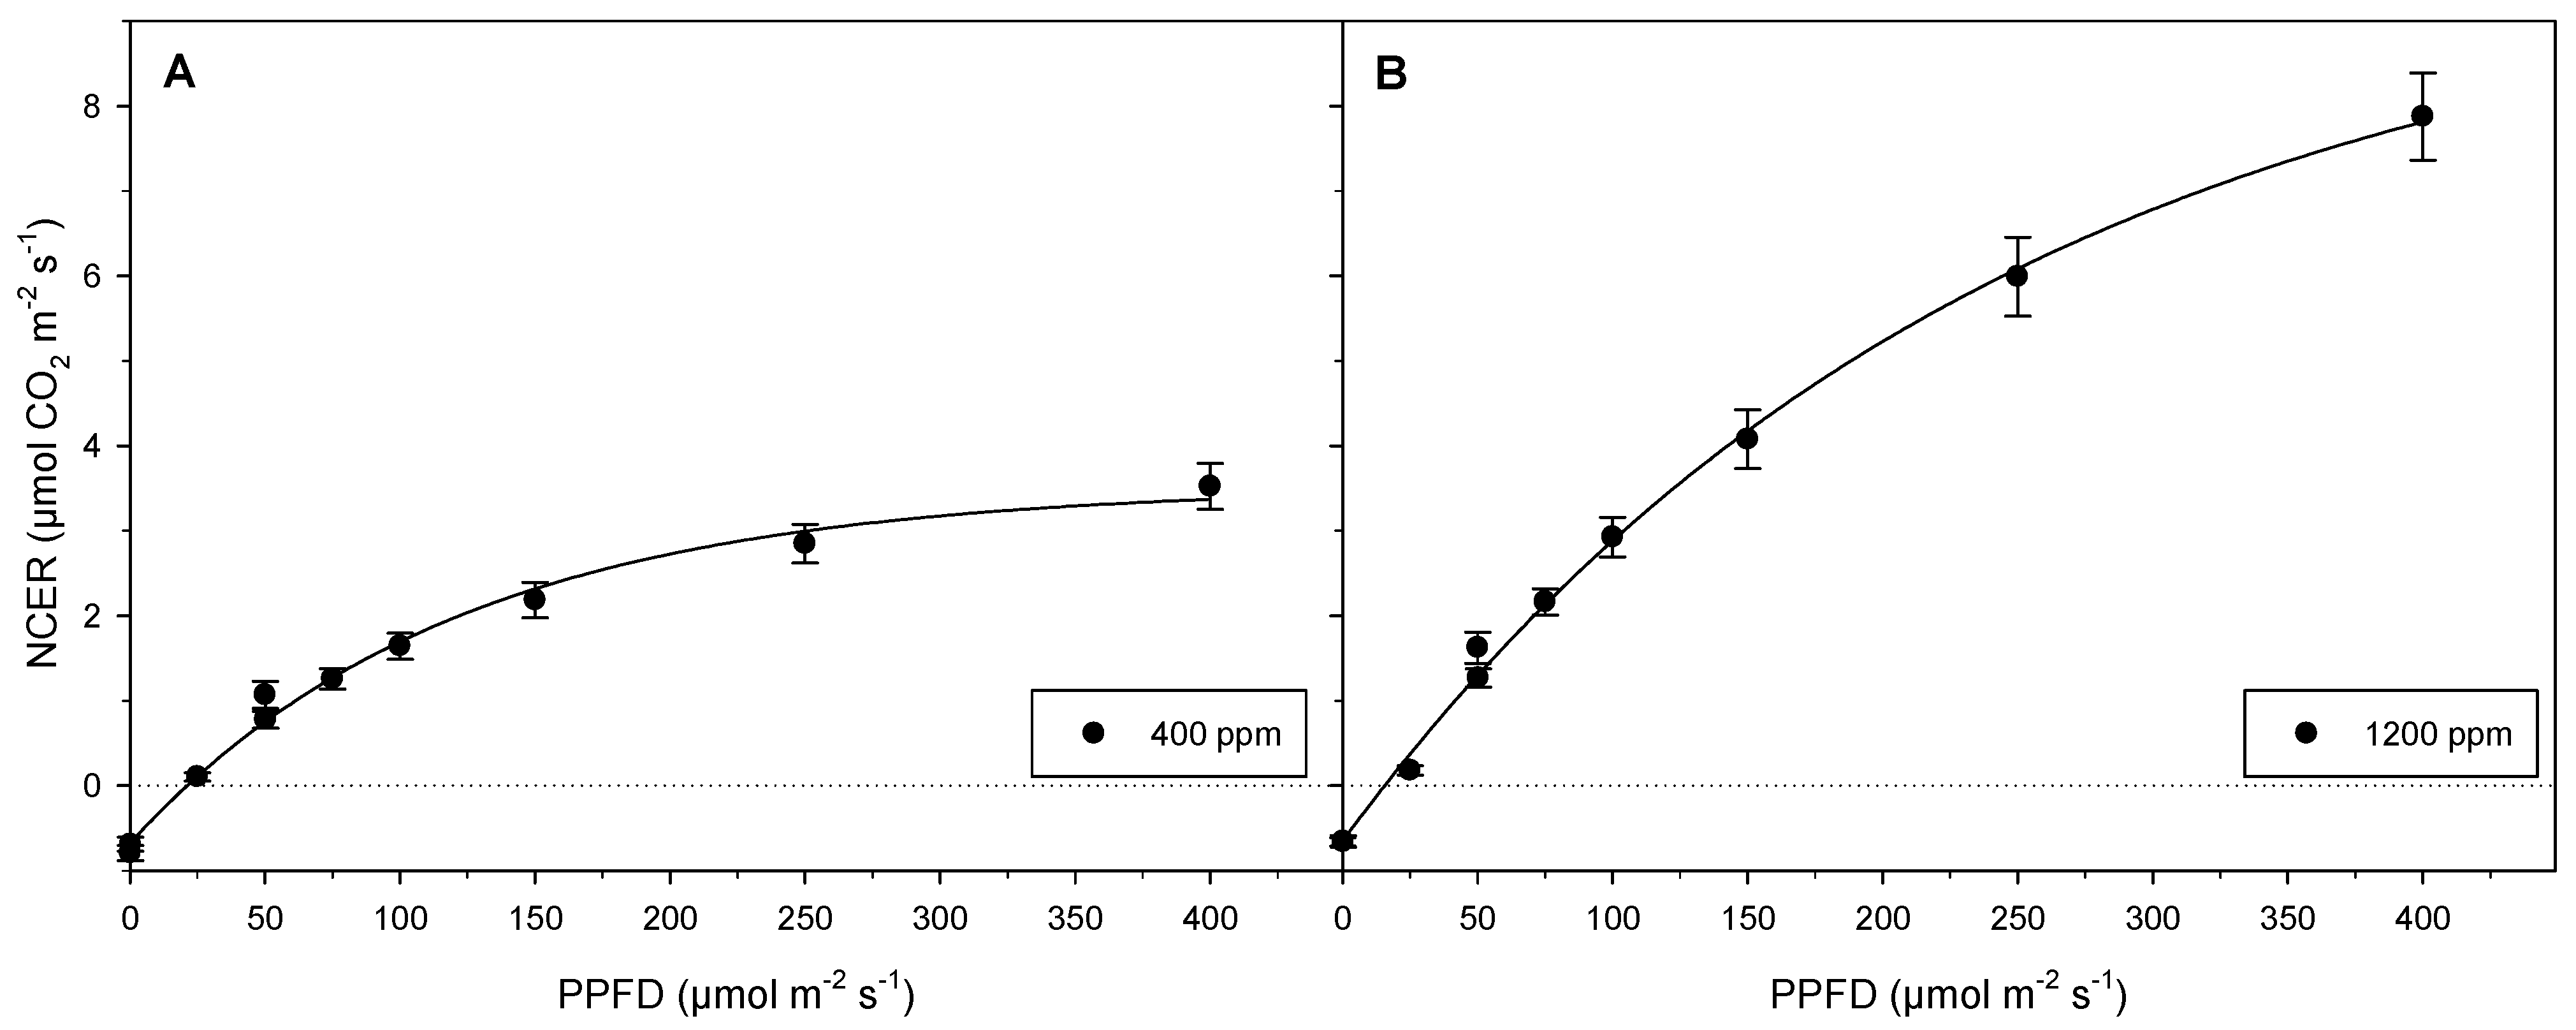
3.1. Experiment 1
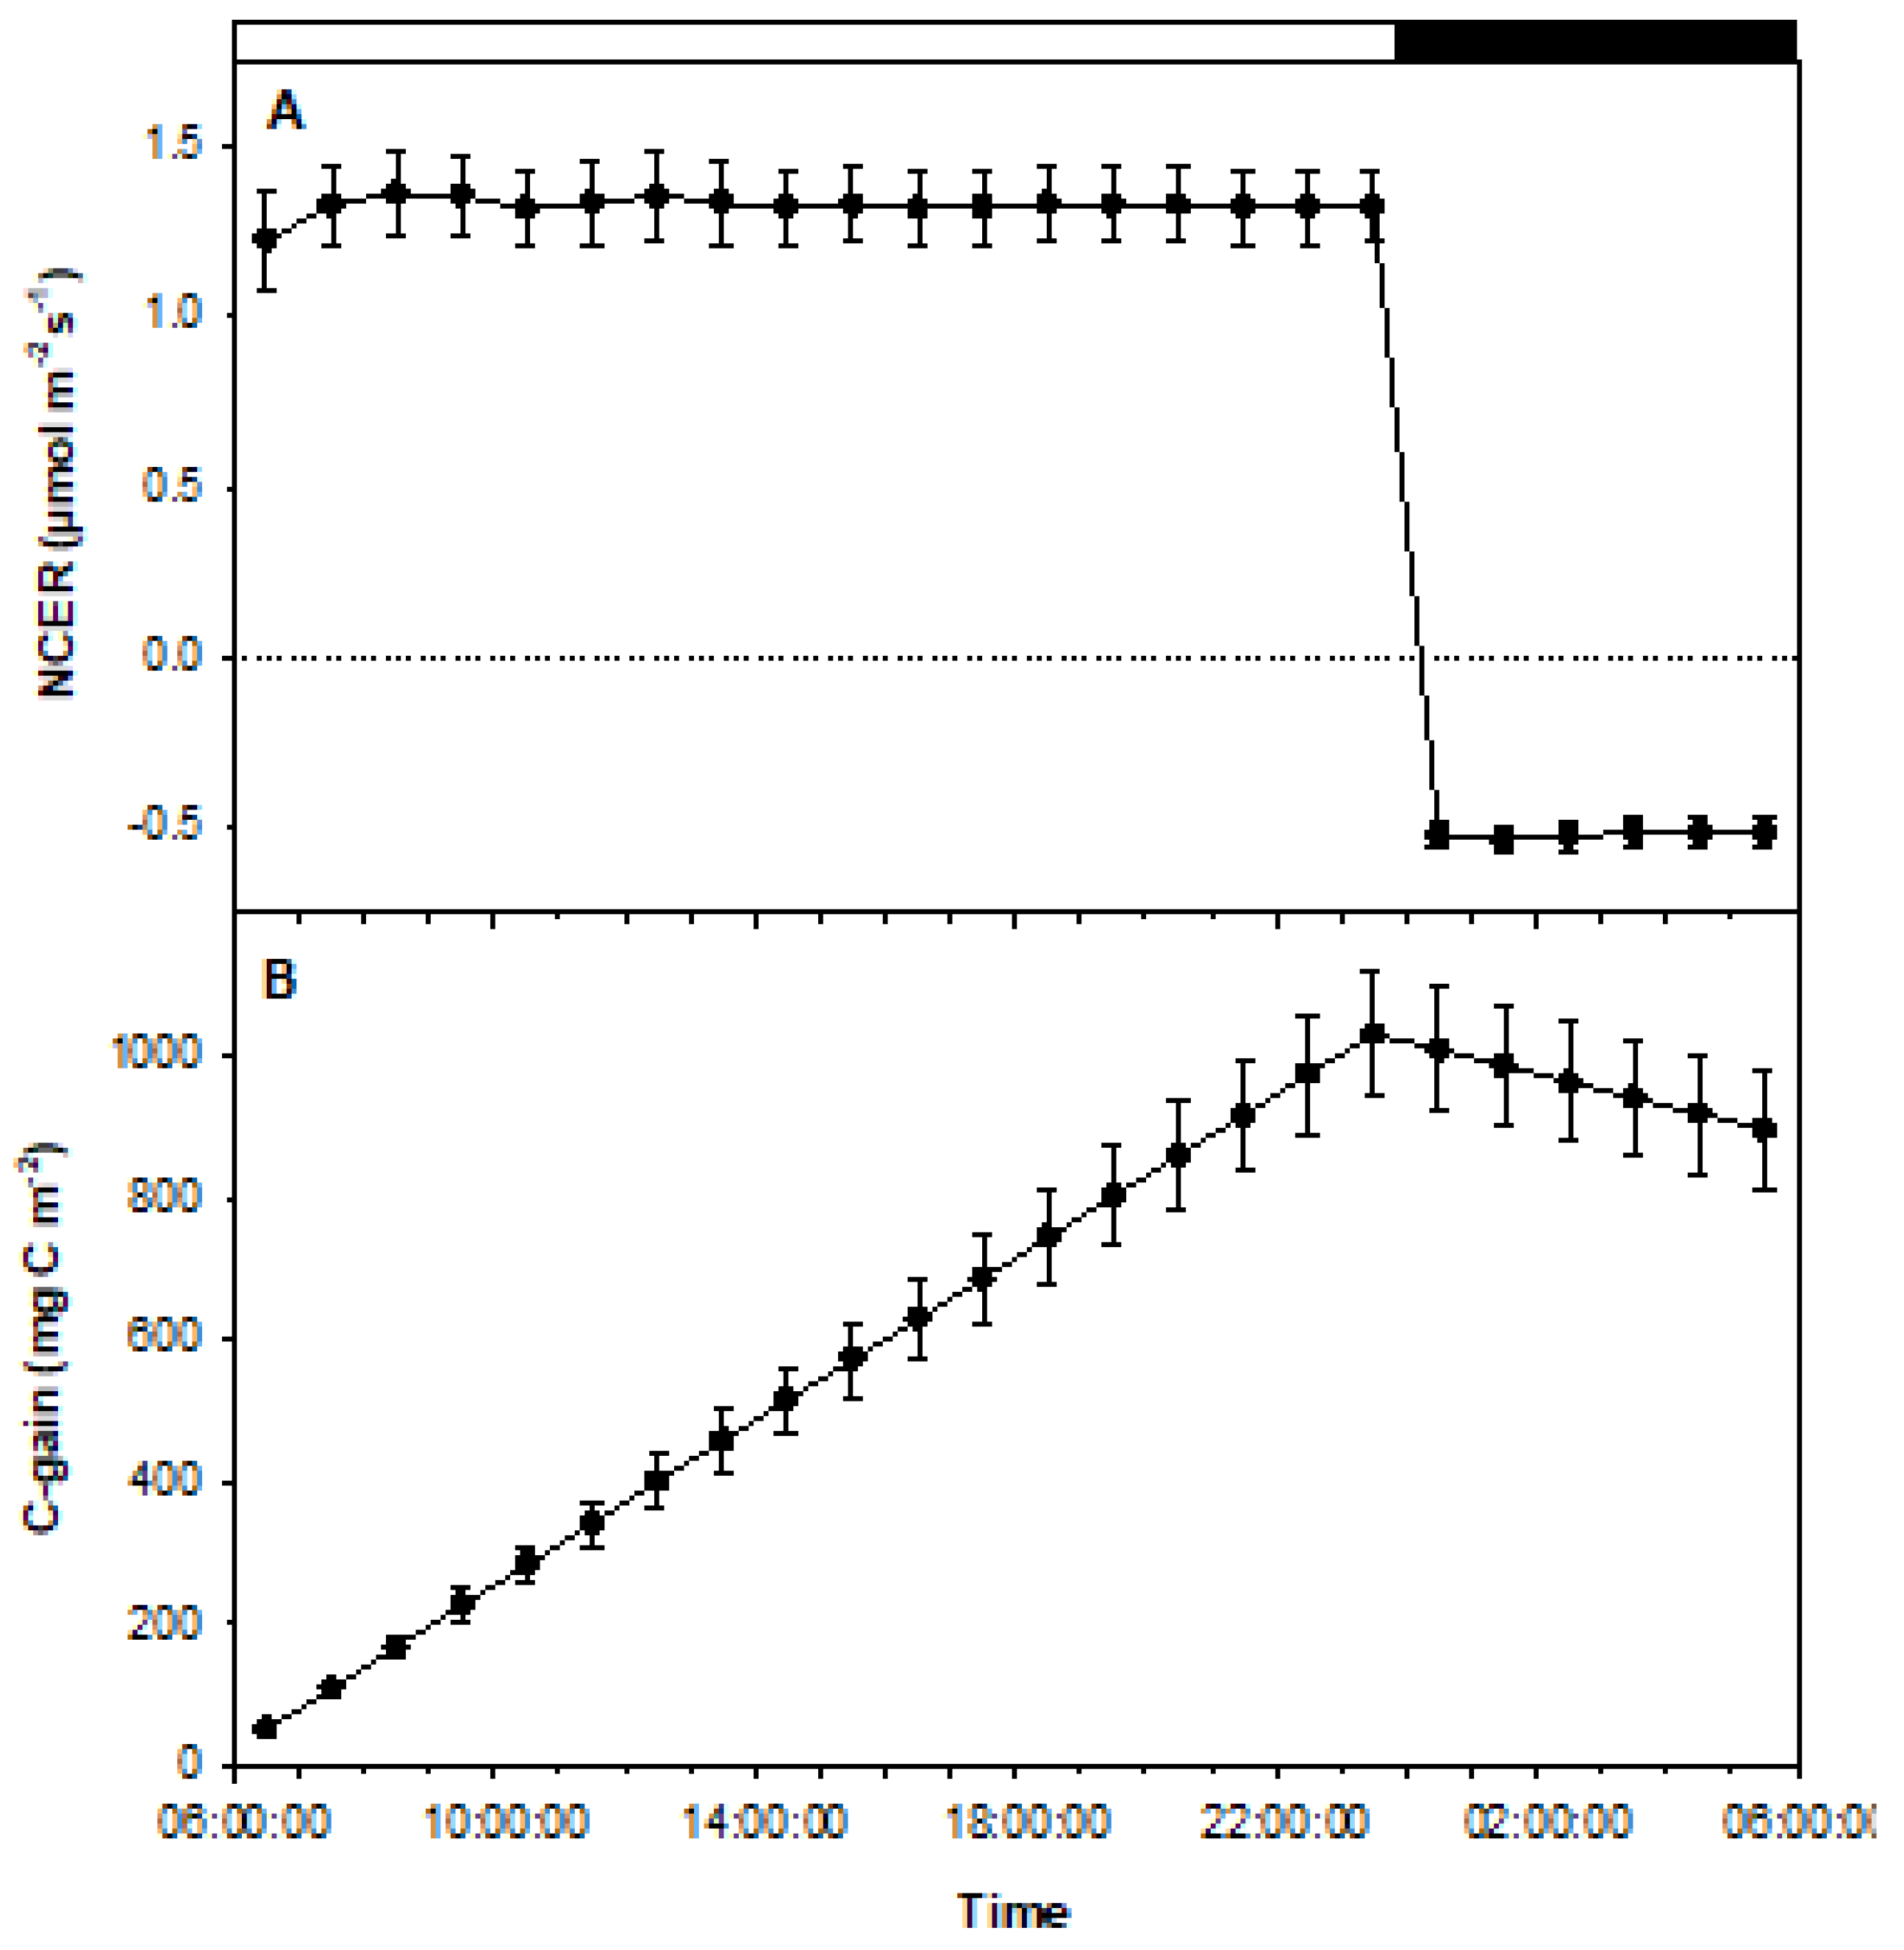
3.2. Experiment 2
4. Discussion
5. Conclusions
Author Contributions
Funding
Institutional Review Board Statement
Informed Consent Statement
Data Availability Statement
Conflicts of Interest
References
- Lubell-Brand, J.D.; Kurtz, L.E.; Brand, M.H. An In Vitro–Ex Vitro Micropropagation System for Hemp. HortTechnology 2021, 31, 199–207. [Google Scholar] [CrossRef]
- Mitra, A.; Dey, S.; Sawarkar, S.K. Photoautotrophic in vitro Multiplication of the Orchid Dendrobium under CO2 Enrichment. Biol. Plant. 1998, 41, 145–148. [Google Scholar] [CrossRef]
- Ramírez-Mosqueda, M.A.; Iglesias-Andreu, L.G.; Bautista-Aguilar, J.R. The Effect of Light Quality on Growth and Development of In Vitro Plantlet of Stevia rebaudiana Bertoni. Sugar Tech. 2017, 19, 331–336. [Google Scholar] [CrossRef]
- Nguyen, Q.T.; Xiao, Y.; Kozai, T. Photoautotrophic micropropagation. In Plant Factory, 2nd ed.; Kozai, T., Niu, G., Takagaki, M., Eds.; Academic Press: Cambridge, MA, USA, 2020; pp. 333–346. [Google Scholar] [CrossRef]
- Majada, J.P.; Tadeo, F.; Fal, M.A.; Sánchez-Tamés, R. Impact of culture vessel ventilation on the anatomy and morphology of micropropagated carnation. Plant. Cell Tissue Organ Cult. 2000, 63, 207–214. [Google Scholar] [CrossRef]
- Page, S.R.G.; Monthony, A.S.; Jones, A.M.P. DKW basal salts improve micropropagation and callogenesis compared with MS basal salts in multiple commercial cultivars of Cannabis sativa. Botany 2021, 99, 269–279. [Google Scholar] [CrossRef]
- Hesami, M.; Baiton, A.; Alizadeh, M.; Pepe, M.; Torkamaneh, D.; Jones, A.M. Advances and perspectives in tissue culture and genetic engineering of cannabis. Int. J. Mol. Sci. 2021, 22, 5671. [Google Scholar] [CrossRef]
- Gago, J.; Martínez-Núñez, L.; Landín, M.; Flexas, J.; Gallego, P.P. Modeling the Effects of Light and Sucrose on In Vitro Propagated Plants: A Multiscale System Analysis Using Artificial Intelligence Technology. PLoS ONE 2014, 9, e85989. [Google Scholar] [CrossRef]
- Ševčíková, H.; Lhotáková, Z.; Hamet, J.; Lipavská, H. Mixotrophic in vitro cultivations: The way to go astray in plant physiology. Physiol. Plant. 2019, 167, 365–377. [Google Scholar] [CrossRef]
- Lembrechts, R.; Verdoodt, V.; De Proft, M.P.; Ceusters, J. Influence of sucrose concentration on photosynthetic performance of Guzmania ‘Hilda’ in vitro. Acta Hortic. 2015, 1083, 403–408. [Google Scholar] [CrossRef]
- Nathiya, S.; Pradeepa, D.; Devasena, T.; Senthil, K. Studies on the effect of sucrose, light and hormones on micropropagation and in vitro flowering of Withania somnifera Var. JAWAHAR-20. J. Anim. Plant Sci. 2013, 23, 1391–1397. [Google Scholar]
- Podwyszynska, M.; Miszczak, A.; Gabryszewska, E. Effect of CO2 enrichment, light and sucrose on quality of rose and gerbera microcuttings in vitro and their subsequent ex vitro rooting. Acta Hortic. 2003, 616, 231–235. [Google Scholar] [CrossRef]
- Tichá, I.; Čáp, F.; Pacovská, D.; Hofman, P.; Haisel, D.; Čapková, V.; Schäfer, C. Culture on sugar medium enhances photosynthetic capacity and high light resistance of plantlets grown in vitro. Physiol. Plant. 1998, 102, 155–162. [Google Scholar] [CrossRef]
- Miler, N.; Kulus, D.; Woźny, A.; Rymarz, D.; Hajzer, M.; Wierzbowski, K.; Nelke, R.; Szeffs, L. Application of wide-spectrum light-emitting diodes in micropropagation of popular ornamental plant species: A study on plant quality and cost reduction. Vitr. Cell. Dev. Biol. Plant 2019, 55, 99–108. [Google Scholar] [CrossRef] [Green Version]
- Leonardos, E.D.; Grodzinski, B. Quantifying growth non-destructively using whole-plant CO2 exchange is a powerful tool for phenotyping. In Handbook of Photosynthesis; Pessarakli, M., Ed.; CRC Press: Boca Raton, FL, USA, 2016; pp. 571–589. [Google Scholar]
- Morini, S.; Melai, M. Net CO2 exchange rate of in vitro plum cultures during growth evolution at different photosynthetic photon flux density. Sci. Hortic. 2005, 105, 197–211. [Google Scholar] [CrossRef]
- Mitchell, C.A. Measurement of photosynthetic gas exchange in controlled environments. HortScience 1992, 27, 764–767. [Google Scholar] [CrossRef] [PubMed]
- Lanoue, J.; Leonardos, E.D.; Grodzinski, B. Effects of Light Quality and Intensity on Diurnal Patterns and Rates of Photo-Assimilate Translocation and Transpiration in Tomato Leaves. Front. Plant Sci. 2018, 9, 756. [Google Scholar] [CrossRef] [Green Version]
- Leonardos, E.D.; Ma, X.; Lanoue, J.; Grodzinski, B. Leaf and whole-plant gas exchange and water-use efficiency of chrysanthemums under HPS and LEDs during the vegetative and flower-induction stages. Can. J. Plant Sci. 2019, 99, 639–653. [Google Scholar] [CrossRef]
- Lanoue, J.; Leonardos, E.D.; Khosla, S.; Hao, X.; Grodzinski, B. Effect of elevated CO2 and spectral quality on whole plant gas exchange patterns in tomatoes. PLoS ONE 2018, 13, e0205861. [Google Scholar] [CrossRef]
- Niu, G.; Kozai, T.; Kubota, C. A system for measuring the in situ CO2 exchange rates of in vitro plantlets. HortScience 1998, 33, 1076–1078. [Google Scholar] [CrossRef]
- Cioć, M.; Szewczyk, A.; Żupnik, M.; Kalisz, A.; Pawłowska, B. LED lighting affects plant growth, morphogenesis and phytochemical contents of Myrtus communis L. in vitro. Plant Cell Tissue Organ Cult. 2018, 132, 433–447. [Google Scholar] [CrossRef] [Green Version]
- Manivannan, A.; Soundararajan, P.; Halimah, N.; Ko, C.H.; Jeong, B.R. Blue LED light enhances growth, phytochemical contents, and antioxidant enzyme activities of Rehmannia glutinosa cultured in vitro. Hortic. Environ. Biotechnol. 2015, 56, 105–113. [Google Scholar] [CrossRef]
- Ucar, E.; Caglayan, N.; Turgut, K. The Effects of Various LED Light Wavelengths to the Physiological and Morphological Parameters of Stevia (Stevia rebaudiana) Bertoni. Not. Sci. Biol. 2016, 8, 354–359. [Google Scholar] [CrossRef] [Green Version]
- Dutton, R.G.; Jiao, J.; Tsujita, M.J.; Grodzinski, B. Whole Plant CO2 Exchange Measurements for Nondestructive Estimation of Growth. Plant Physiol. 1988, 86, 355–358. [Google Scholar] [CrossRef] [PubMed] [Green Version]
- Monthony, A.S.; Kyne, S.T.; Grainger, C.M.; Jones, A.M.P. Recalcitrance of Cannabis sativa to de novo regeneration; a multi-genotype replication study. PLoS ONE 2021, 16, e0235525. [Google Scholar] [CrossRef]
- Leonardos, E.D.; Grodzinski, B. Quantifying Immediate Carbon Export from Leaves Predicts Source Strength. In Handbook of Plant and Crop Physiology; Pessarakli, M., Ed.; CRC Press: Boca Raton, FL, USA, 2014; pp. 309–330. [Google Scholar] [CrossRef]
- Fang, W.; Chen, C.-C.; Lee, Y.I.; Chang, M.-Y. Development of LED lids for tissue culture lighting. Acta Hortic. 2011, 907, 397–402. [Google Scholar] [CrossRef]
- Shukla, M.R.; Singh, A.S.; Piunno, K.; Saxena, P.K.; Jones, A.M.P. Application of 3D printing to prototype and develop novel plant tissue culture systems. Plant Methods 2017, 13, 6. [Google Scholar] [CrossRef] [Green Version]
- Rueden, C.T.; Schindelin, J.; Hiner, M.C.; DeZonia, B.E.; Walter, A.E.; Arena, E.T.; Eliceiri, K.W. ImageJ2: ImageJ for the next generation of scientific image data. BMC Bioinform. 2017, 18, 529. [Google Scholar] [CrossRef]
- Adhikary, D.; Kulkarni, M.; El-Mezawy, A.; Mobini, S.; Elhiti, M.; Gjuric, R.; Ray, A.; Polowick, P.; Slaski, J.J.; Jones, M.P.; et al. Medical Cannabis and Industrial Hemp Tissue Culture: Present Status and Future Potential. Front. Plant Sci. 2021, 12, 627240. [Google Scholar] [CrossRef]
- Kozai, T.; Fujiwara, K.; Watanabe, I. Fundamental Studies on Environments in Plant Tissue Culture Vessels (2) Effects of Stoppers and Vessels on Gas Exchange Rates between Inside and Outside of Vessels Closed with Stoppers. J. Agric. Meteorol. 1986, 42, 119–127. [Google Scholar] [CrossRef]
- Nguyen, Q.T.; Kozai, T.; Niu, G.; Nguyen, U.V. Photosynthetic characteristics of coffee (Coffea arabusta) plantlets in vitro in response to different CO2 concentrations and light intensities Plant. Cell. Tissue Organ Cult. 1998, 55, 133–139. [Google Scholar] [CrossRef]
- Galán-Ávila, A.; García-Fortea, E.; Prohens, J.; Herraiz, F.J. Development of a Direct in vitro Plant Regeneration Protocol from Cannabis sativa L. Seedling Explants: Developmental Morphology of Shoot Regeneration and Ploidy Level of Regenerated Plants. Front. Plant Sci. 2020, 11, 645. [Google Scholar] [CrossRef] [PubMed]
- Jin, D.; Jin, S.; Chen, J. Cannabis indoor growing conditions, management practices, and post-harvest treatment: A review. Am. J. Plant Sci. 2019, 10, 925–946. [Google Scholar] [CrossRef] [Green Version]
- Moher, M.; Jones, M.; Zheng, Y. Photoperiodic Response of In Vitro Cannabis sativa Plants. HortScience 2021, 56, 108–113. [Google Scholar] [CrossRef]
- Trupkin, S.A.; Legris, M.; Buchovsky, A.S.; Rivero, M.B.T.; Casal, J.J. Phytochrome B Nuclear Bodies Respond to the Low Red to Far-Red Ratio and to the Reduced Irradiance of Canopy Shade in Arabidopsis. Plant. Physiol. 2014, 165, 1698–1708. [Google Scholar] [CrossRef]
- Song, Y.; Jiang, C.; Gao, L. Polychromatic Supplemental Lighting from underneath Canopy Is More Effective to Enhance Tomato Plant Development by Improving Leaf Photosynthesis and Stomatal Regulation. Front. Plant Sci. 2016, 7, 1832. [Google Scholar] [CrossRef] [Green Version]
- Pepe, M.; Hesami, M.; Small, F.; Jones, A.M.P. Comparative Analysis of Machine Learning and Evolutionary Optimization Algorithms for Precision Micropropagation of Cannabis sativa: Prediction and Validation of in vitro Shoot Growth and Development Based on the Optimization of Light and Carbohydrate Sources. Front. Plant Sci. 2021, 12, 757869. [Google Scholar] [CrossRef]
- Rodriguez-Morrison, V.; Llewellyn, D.; Zheng, Y. Cannabis Yield, Potency, and Leaf Photosynthesis Respond Differently to Increasing Light Levels in an Indoor Environment. Front. Plant Sci. 2021, 12, 646020. [Google Scholar] [CrossRef]
- Chandra, S.; Lata, H.; Khan, I.A.; ElSohly, M.A. Photosynthetic response of Cannabis sativa L., an important medicinal plant, to elevated levels of CO2. Physiol. Mol. Biol. Plants 2011, 17, 291–295. [Google Scholar] [CrossRef] [Green Version]
- Kaiser, E.; Zhou, D.; Heuvelink, E.; Harbinson, J.; Morales, A.; Marcelis, L.F.M. Elevated CO2 increases photosynthesis in fluctuating irradiance regardless of photosynthetic induction state. J. Exp. Bot. 2017, 68, 5629–5640. [Google Scholar] [CrossRef] [Green Version]
- Naing, A.H.; Jeon, S.M.; Park, J.S.; Kim, C.K. Combined effects of supplementary light and CO2 on rose growth and the production of good quality cut flowers. Can. J. Plant Sci. 2016, 96, 503–510. [Google Scholar] [CrossRef] [Green Version]
- Thi Nguyen, Q.; Kozai, T.; Heo, J.; Xuan Thai, D. Photoautotrophic growth response of in vitro cultured coffee plantlets to ventilation methods and photosynthetic photon fluxes under carbon dioxide enriched condition. Plant. Cell. Tissue Organ Cult. 2001, 66, 217–225. [Google Scholar] [CrossRef]
- Shin, K.-S.; Park, S.-Y.; Paek, K.-Y. Sugar metabolism, photosynthesis, and growth of in vitro plantlets of Doritaenopsis under controlled microenvironmental conditions. Vitr. Cell. Dev. Biol. Plant 2013, 49, 445–454. [Google Scholar] [CrossRef]
- Figueira, A.; Whipkey, A.; Janick, J. Increased CO2 and Light Promote in Vitro Shoot Growth and Development of Theobroma cacao. J. Am. Soc. Hortic. Sci. 1991, 116, 585–589. [Google Scholar] [CrossRef] [Green Version]
- Arigita, L.; González, A.; Tamés, R.S. Influence of CO2 and sucrose on photosynthesis and transpiration of Actinidia deliciosa explants cultured in vitro. Physiol. Plant. 2002, 115, 166–173. [Google Scholar] [CrossRef]
- Jo, E.-A.; Tewari, R.K.; Hahn, E.-J.; Paek, K.-Y. In vitro sucrose concentration affects growth and acclimatization of Alocasia amazonica plantlets. Plant. Cell Tissue Organ Cult. 2008, 96, 307. [Google Scholar] [CrossRef]
- Premkumar, A.; Mercado, J.A.; Quesada, M.A. Effects of in vitro tissue culture conditions and acclimatization on the contents of Rubisco, leaf soluble proteins, photosynthetic pigments, and C/N ratio. J. Plant. Physiol. 2001, 158, 835–840. [Google Scholar] [CrossRef] [Green Version]
- Piqueras, A.; Han, B.H.; Van Huylenbroeck, J.M.; Debergh, P.C. Effect of different environmental conditions in vitro on sucrose metabolism and antioxidant enzymatic activities in cultured shoots of Nicotiana tabacum L. Plant. Growth Regul. 1998, 25, 5–10. [Google Scholar] [CrossRef]
- Lata, H.; Chandra, S.; Techen, N.; Khan, I.A.; ElSohly, M.A. In vitro mass propagation of Cannabis sativa L.: A protocol refinement using novel aromatic cytokinin meta-topolin and the assessment of eco-physiological, biochemical and genetic fidelity of micropropagated plants. J. Appl. Res. Med. Aromat. Plants 2016, 3, 18–26. [Google Scholar] [CrossRef]


Publisher’s Note: MDPI stays neutral with regard to jurisdictional claims in published maps and institutional affiliations. |
© 2022 by the authors. Licensee MDPI, Basel, Switzerland. This article is an open access article distributed under the terms and conditions of the Creative Commons Attribution (CC BY) license (https://creativecommons.org/licenses/by/4.0/).
Share and Cite
Pepe, M.; Leonardos, E.D.; Marie, T.R.J.G.; Kyne, S.T.; Hesami, M.; Jones, A.M.P.; Grodzinski, B. A Noninvasive Gas Exchange Method to Test and Model Photosynthetic Proficiency and Growth Rates of In Vitro Plant Cultures: Preliminary Implication for Cannabis sativa L. Biology 2022, 11, 729. https://doi.org/10.3390/biology11050729
Pepe M, Leonardos ED, Marie TRJG, Kyne ST, Hesami M, Jones AMP, Grodzinski B. A Noninvasive Gas Exchange Method to Test and Model Photosynthetic Proficiency and Growth Rates of In Vitro Plant Cultures: Preliminary Implication for Cannabis sativa L. Biology. 2022; 11(5):729. https://doi.org/10.3390/biology11050729
Chicago/Turabian StylePepe, Marco, Evangelos D. Leonardos, Telesphore R. J. G. Marie, Sean T. Kyne, Mohsen Hesami, Andrew Maxwell Phineas Jones, and Bernard Grodzinski. 2022. "A Noninvasive Gas Exchange Method to Test and Model Photosynthetic Proficiency and Growth Rates of In Vitro Plant Cultures: Preliminary Implication for Cannabis sativa L." Biology 11, no. 5: 729. https://doi.org/10.3390/biology11050729