
Prostanoid Signaling in Cancers: Expression and Regulation Patterns of Enzymes and Receptors

 , , ,
, , ,
Abstract
:Simple Summary
Abstract
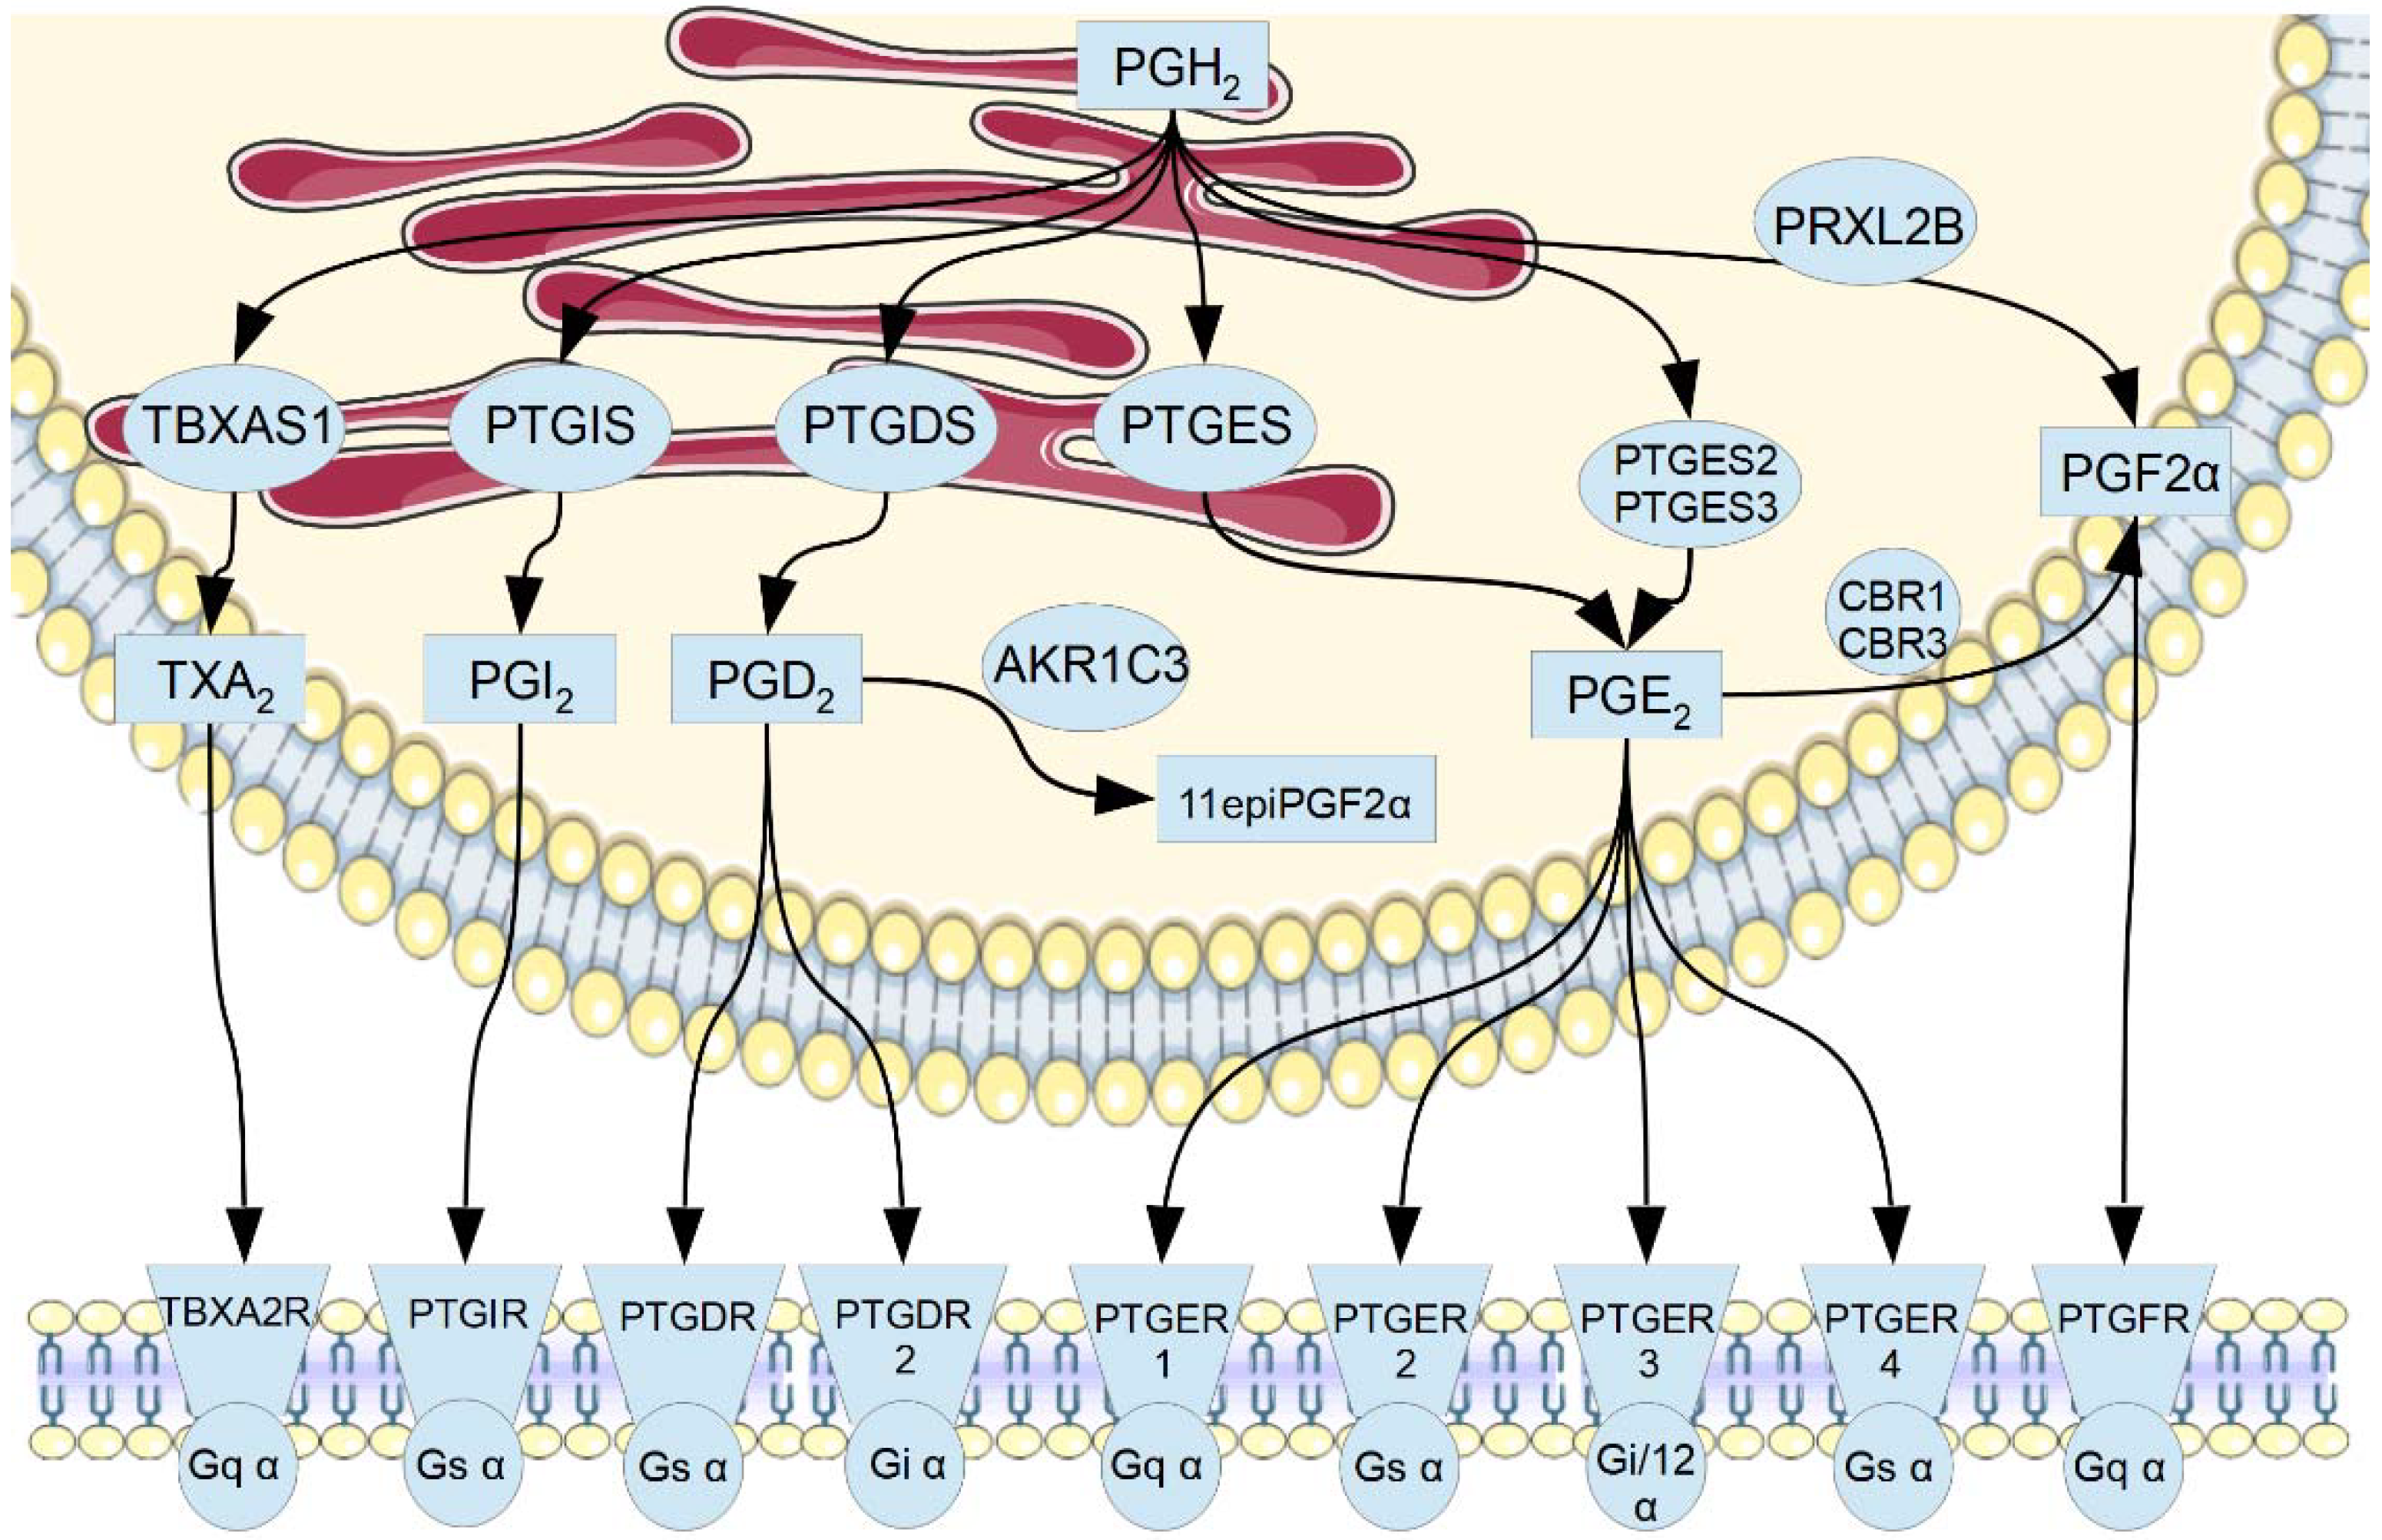
1. Introduction
2. Materials and Methods
2.1. Gene Expression Analysis
2.2. Mutation Status Analysis
2.3. Over-Representation Analysis
2.4. Master Regulators
2.5. Tumor-Specific Non-Coding microRNAs (oncomiRs)
2.6. Promoter Methylation Status
2.7. Protein Expression Analysis
2.8. Post-Translational Modifications
2.9. Protein-Protein Interaction Network Analysis
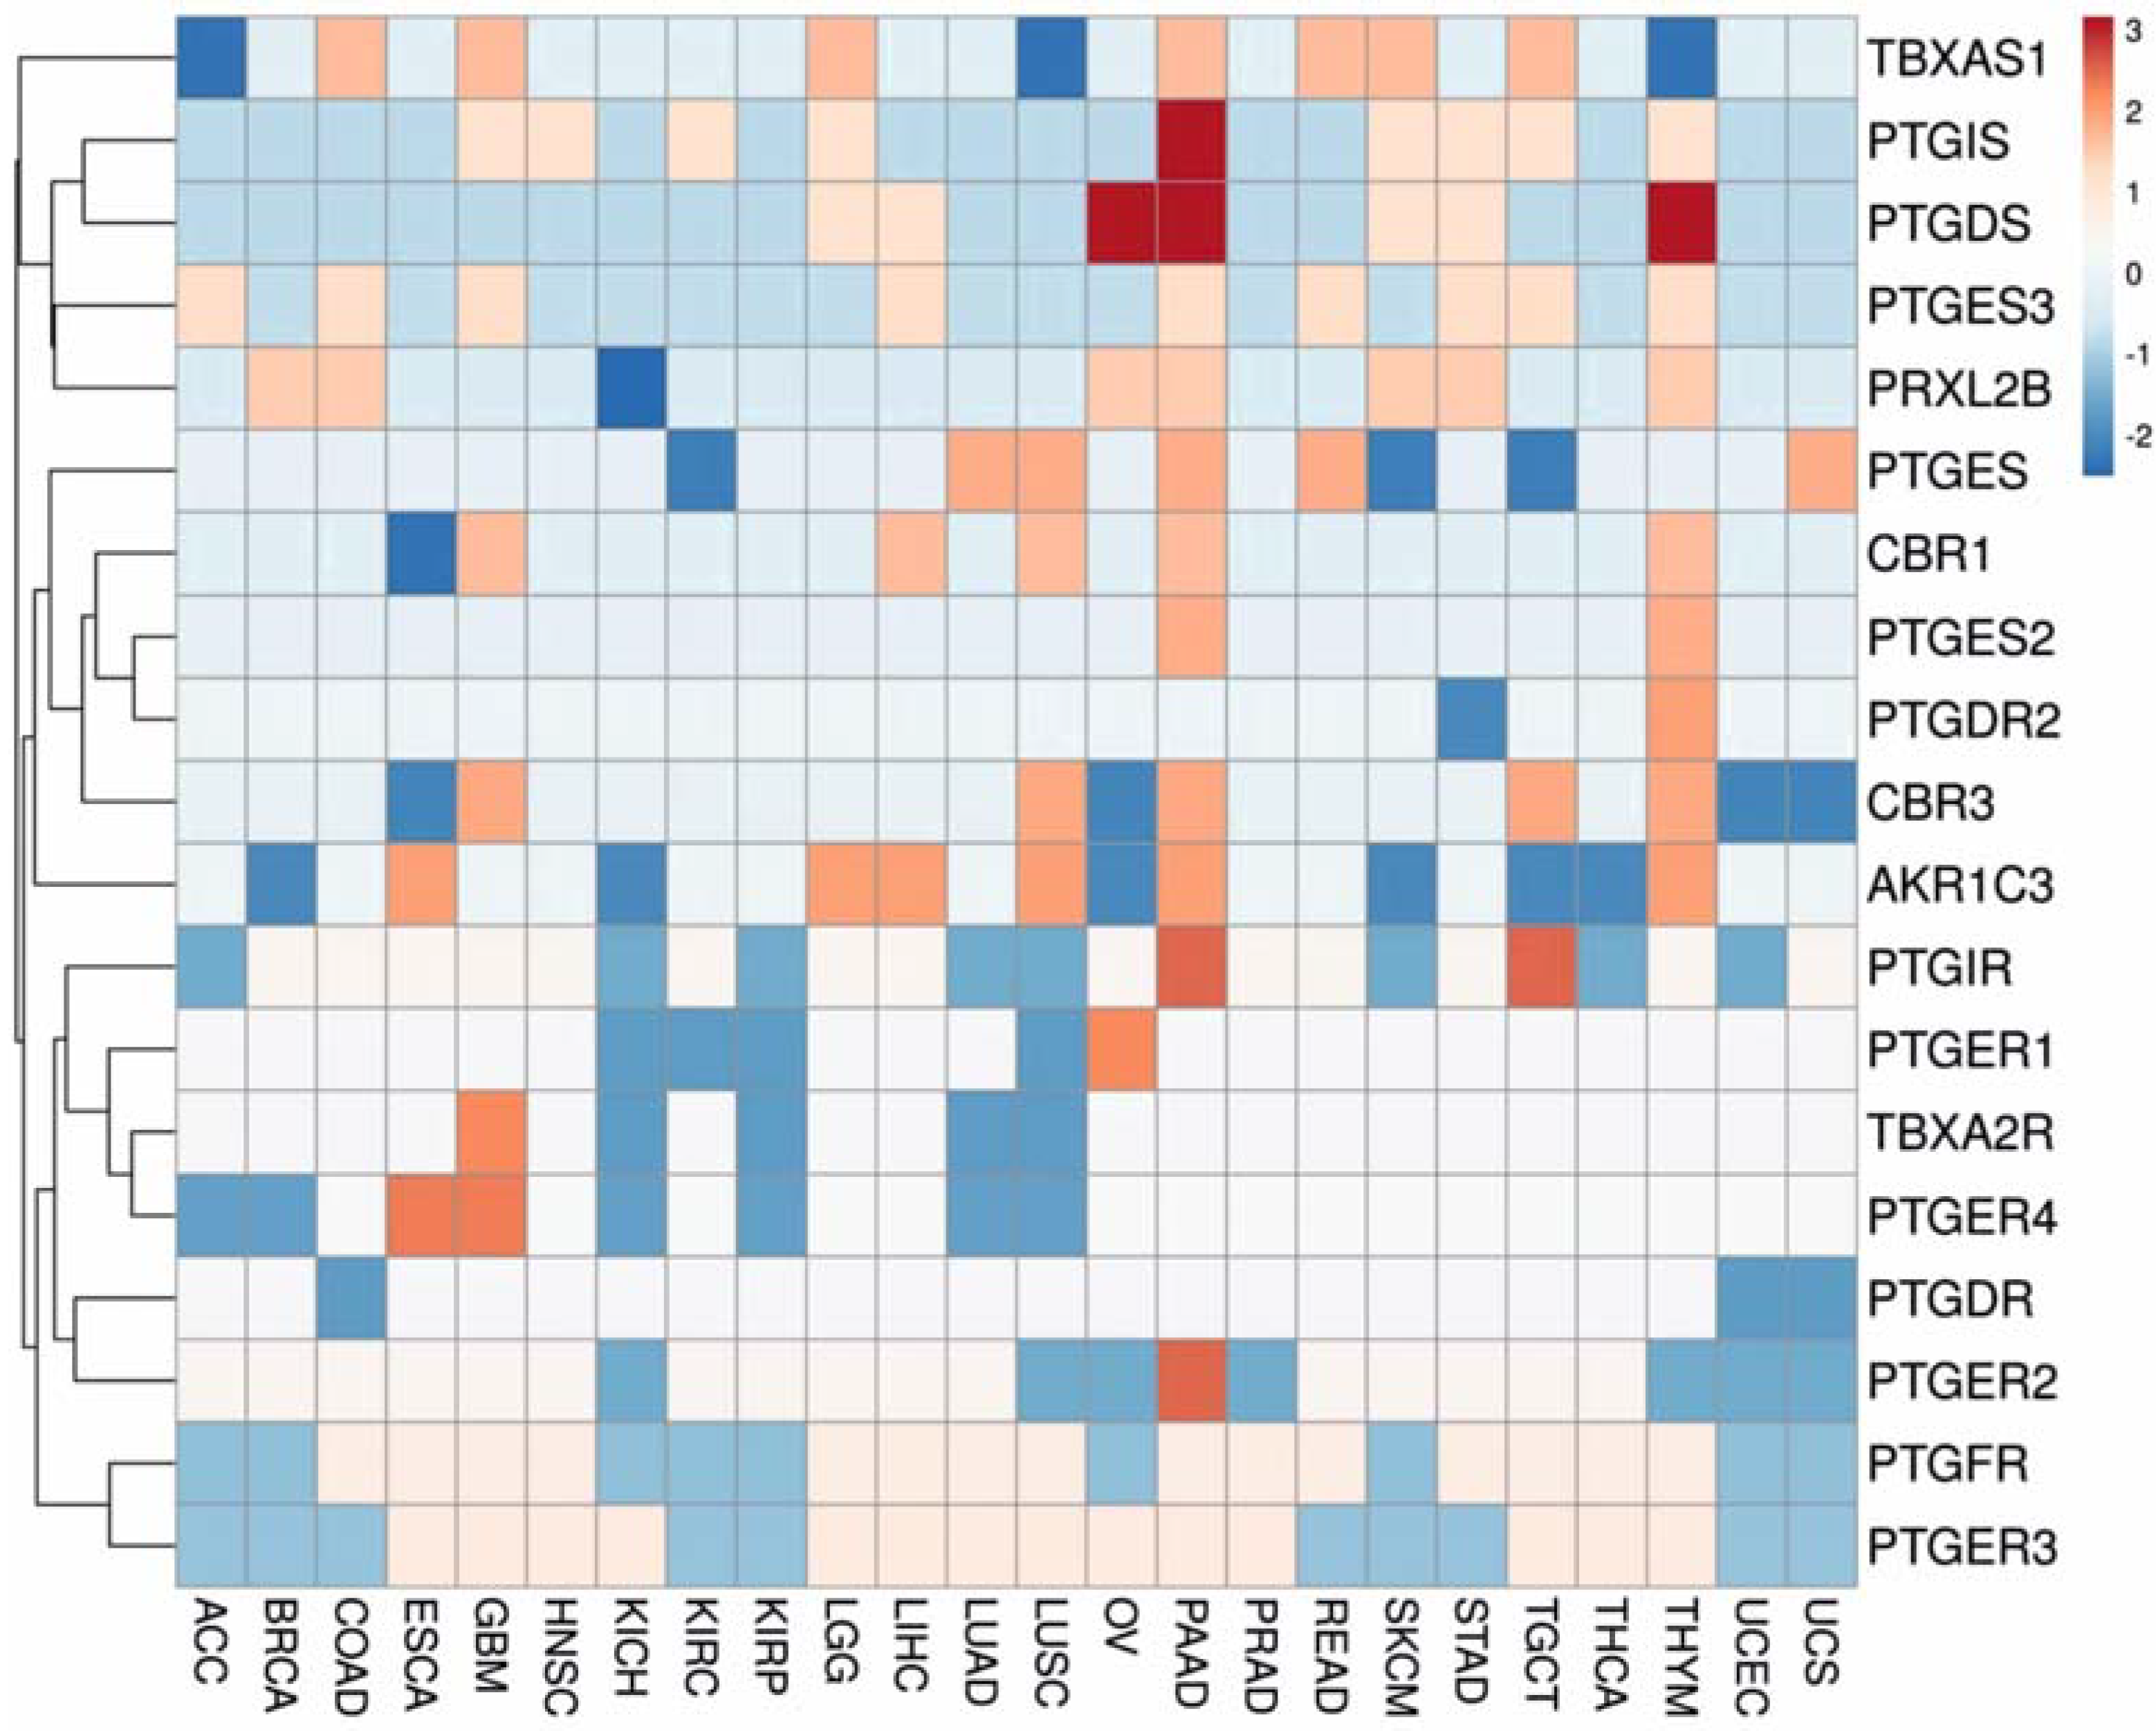
2.10. Cluster Analysis of Gene Expression Matrix
2.11. Other
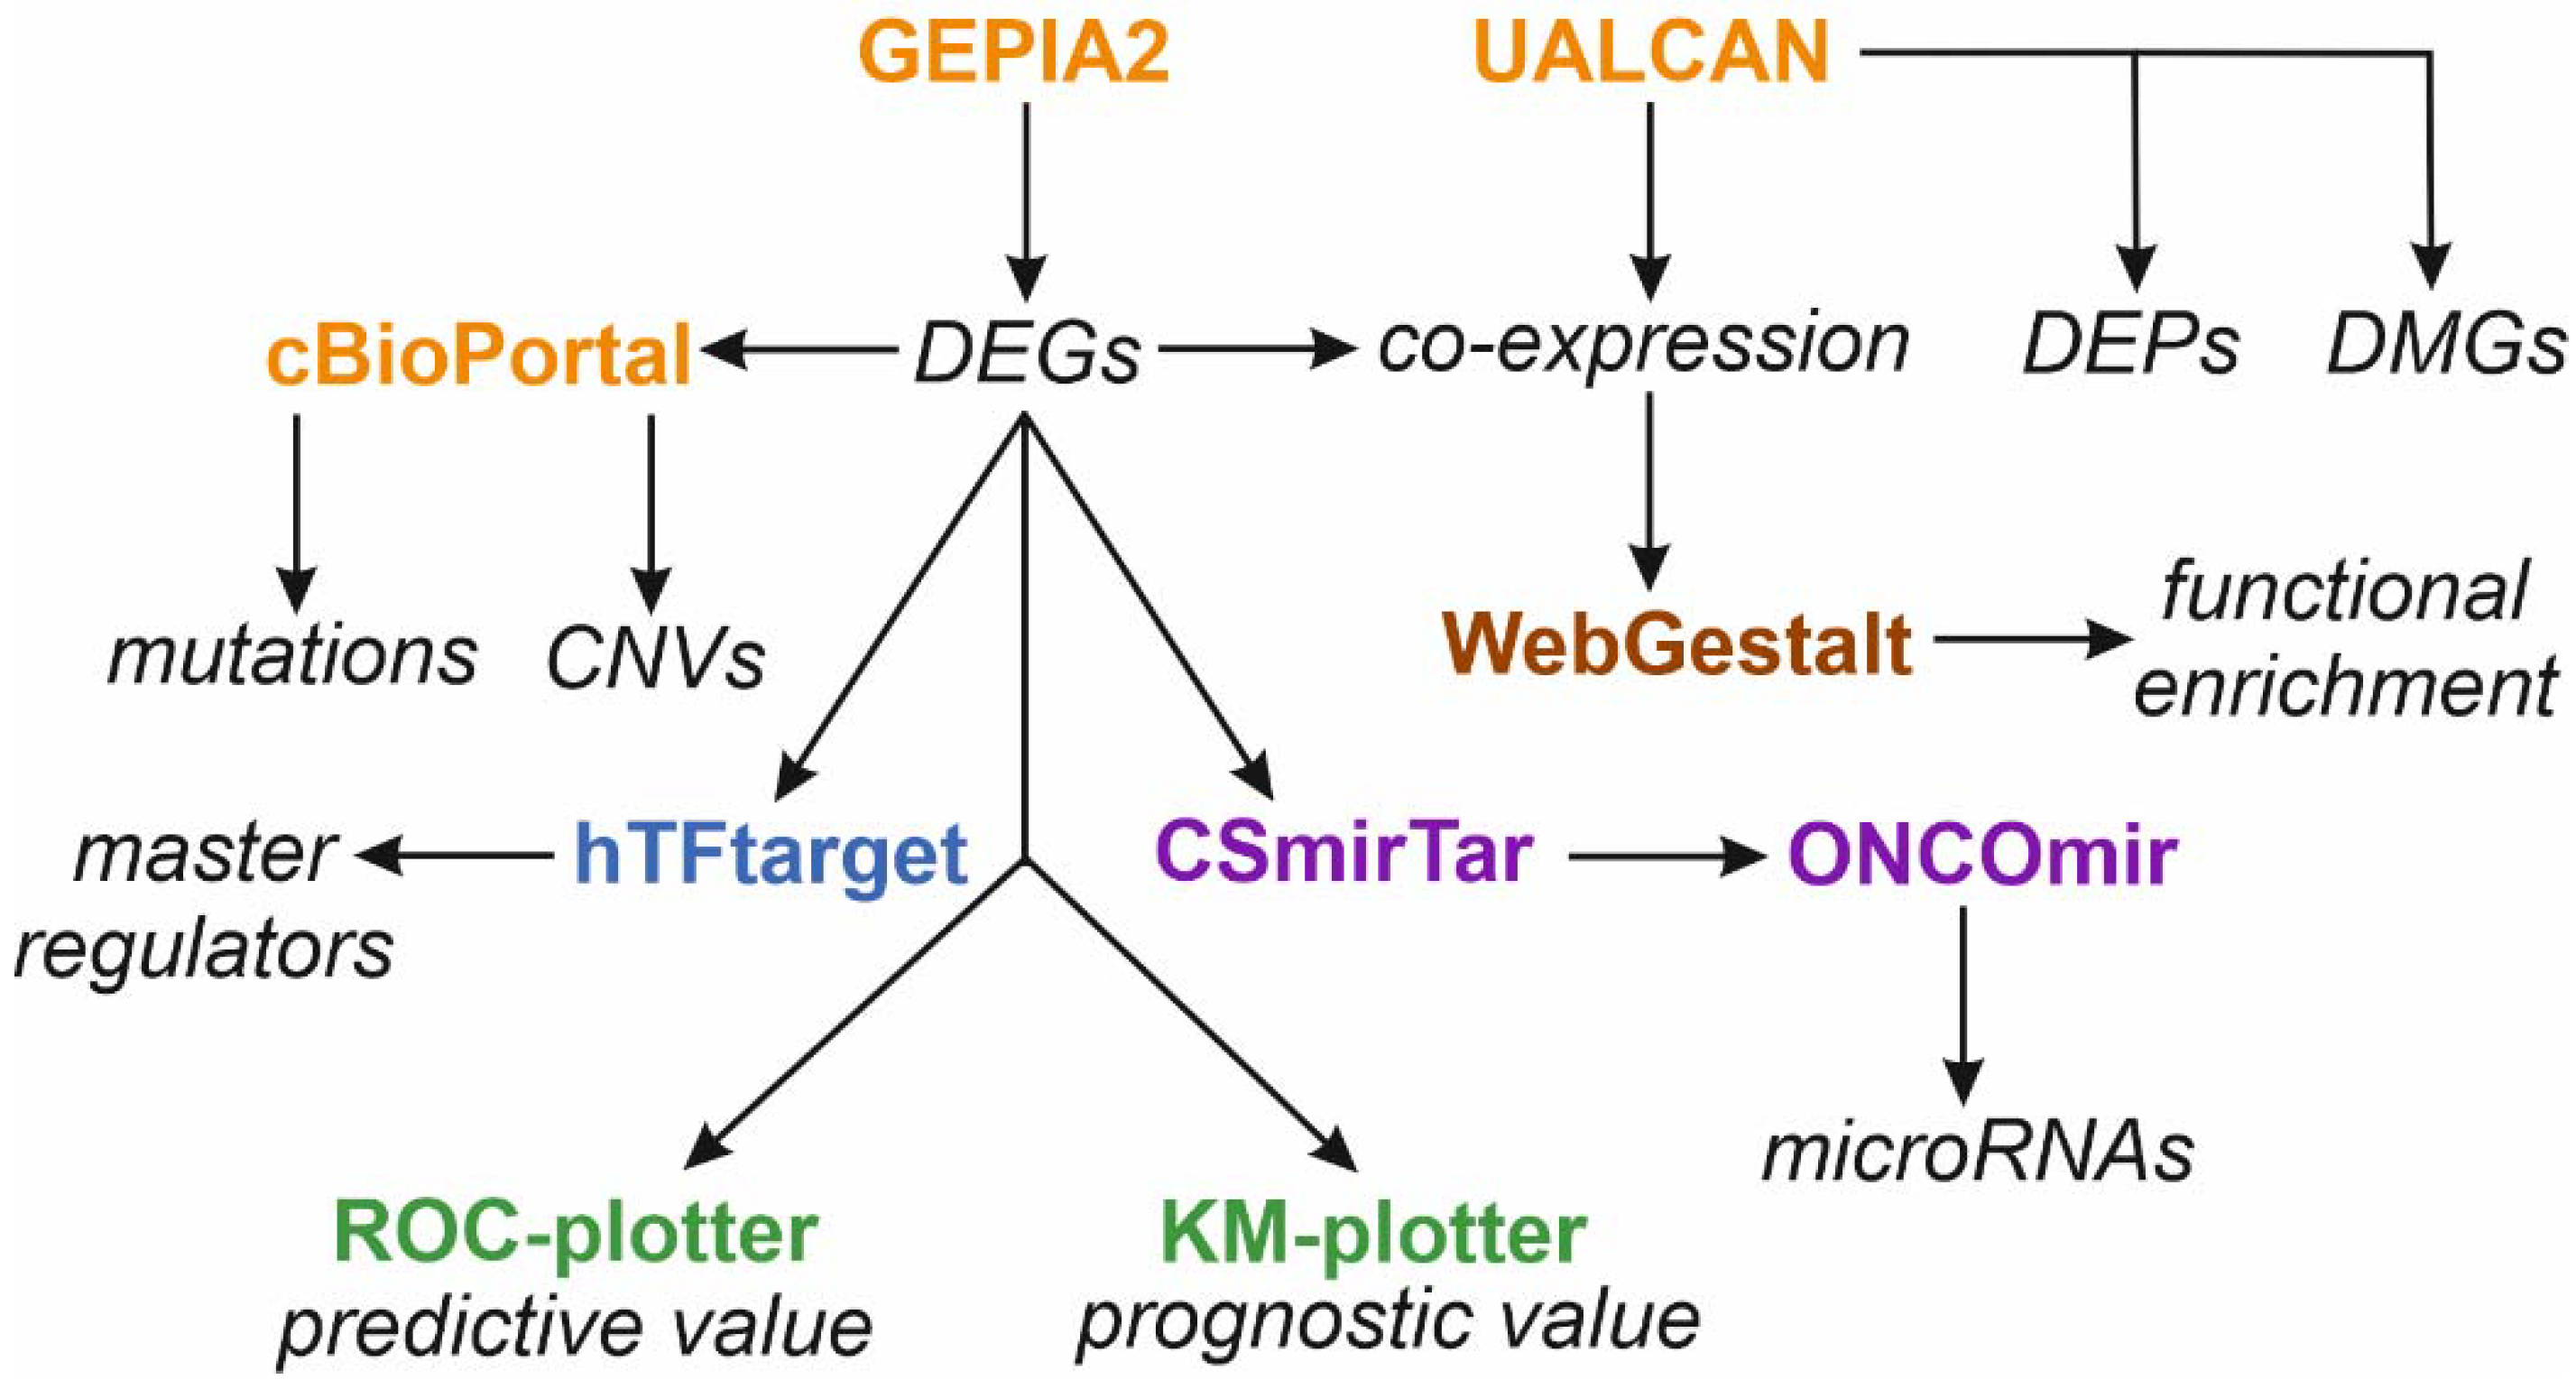
2.12. Data Mining
3. Results
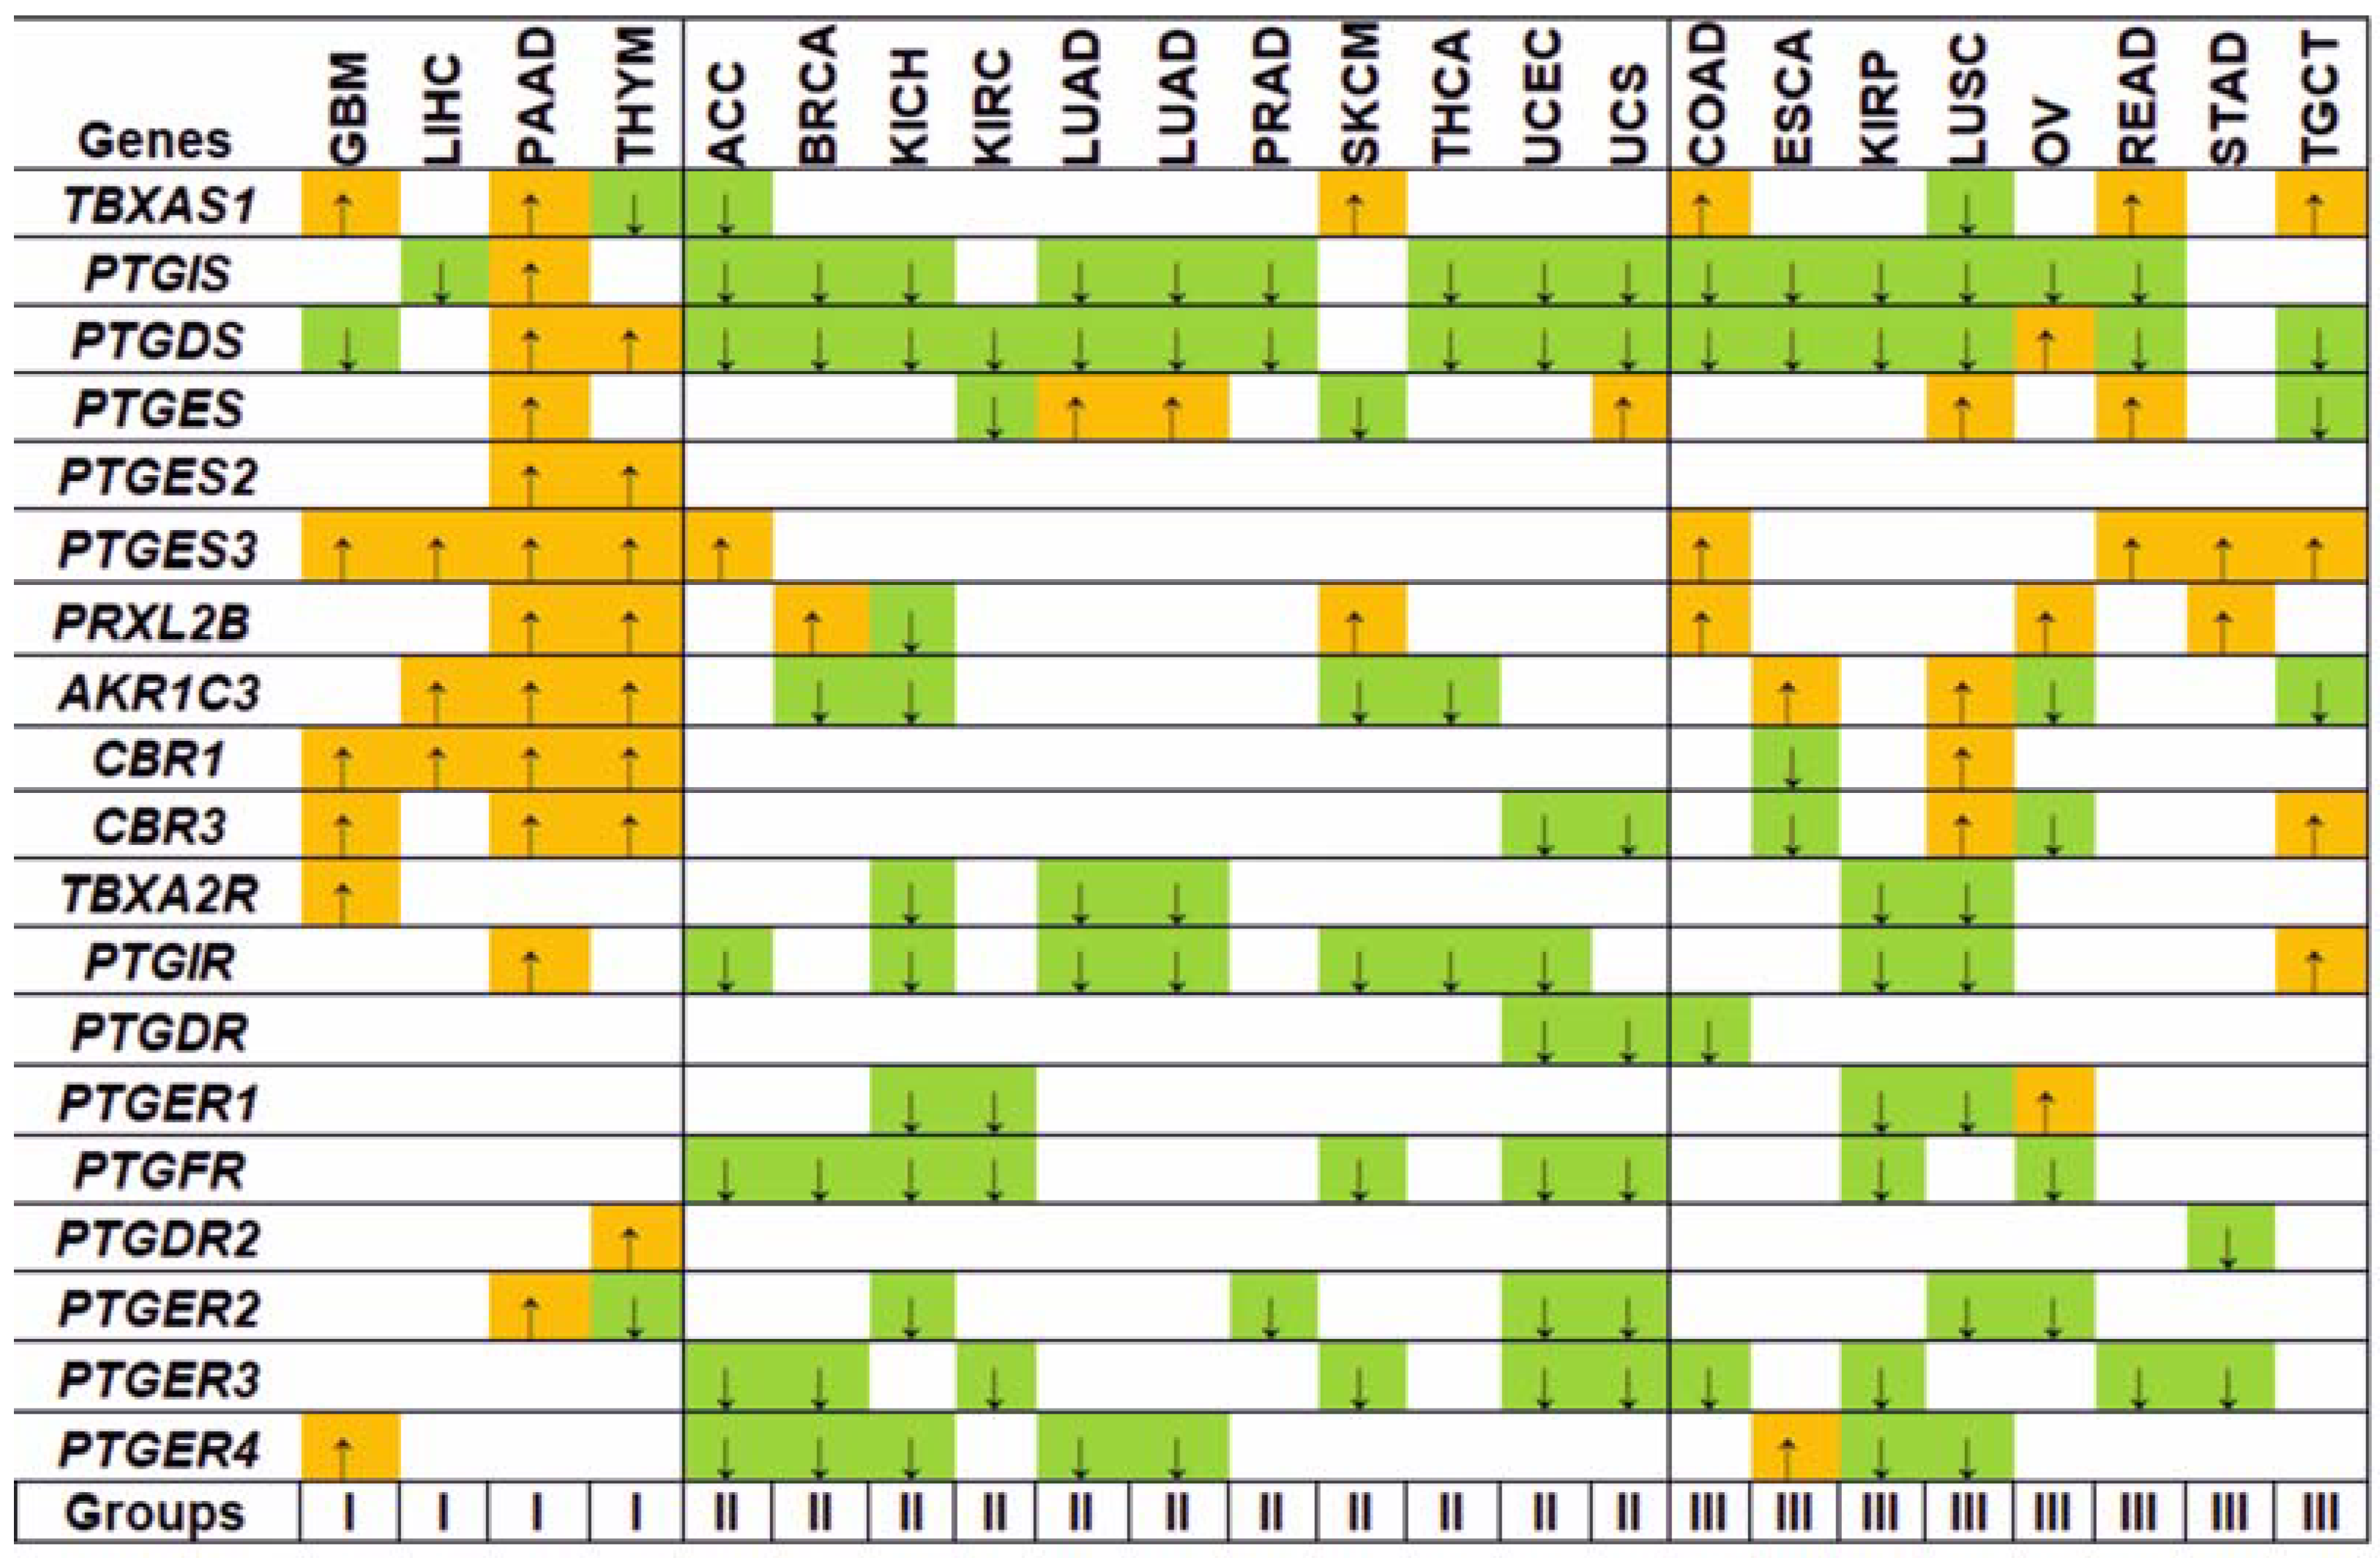
3.1. Gene Expression Analysis
3.2. Regulation Patterns of Differentially Expressed Genes
3.2.1. Promoter Methylation
3.2.2. Master Regulators
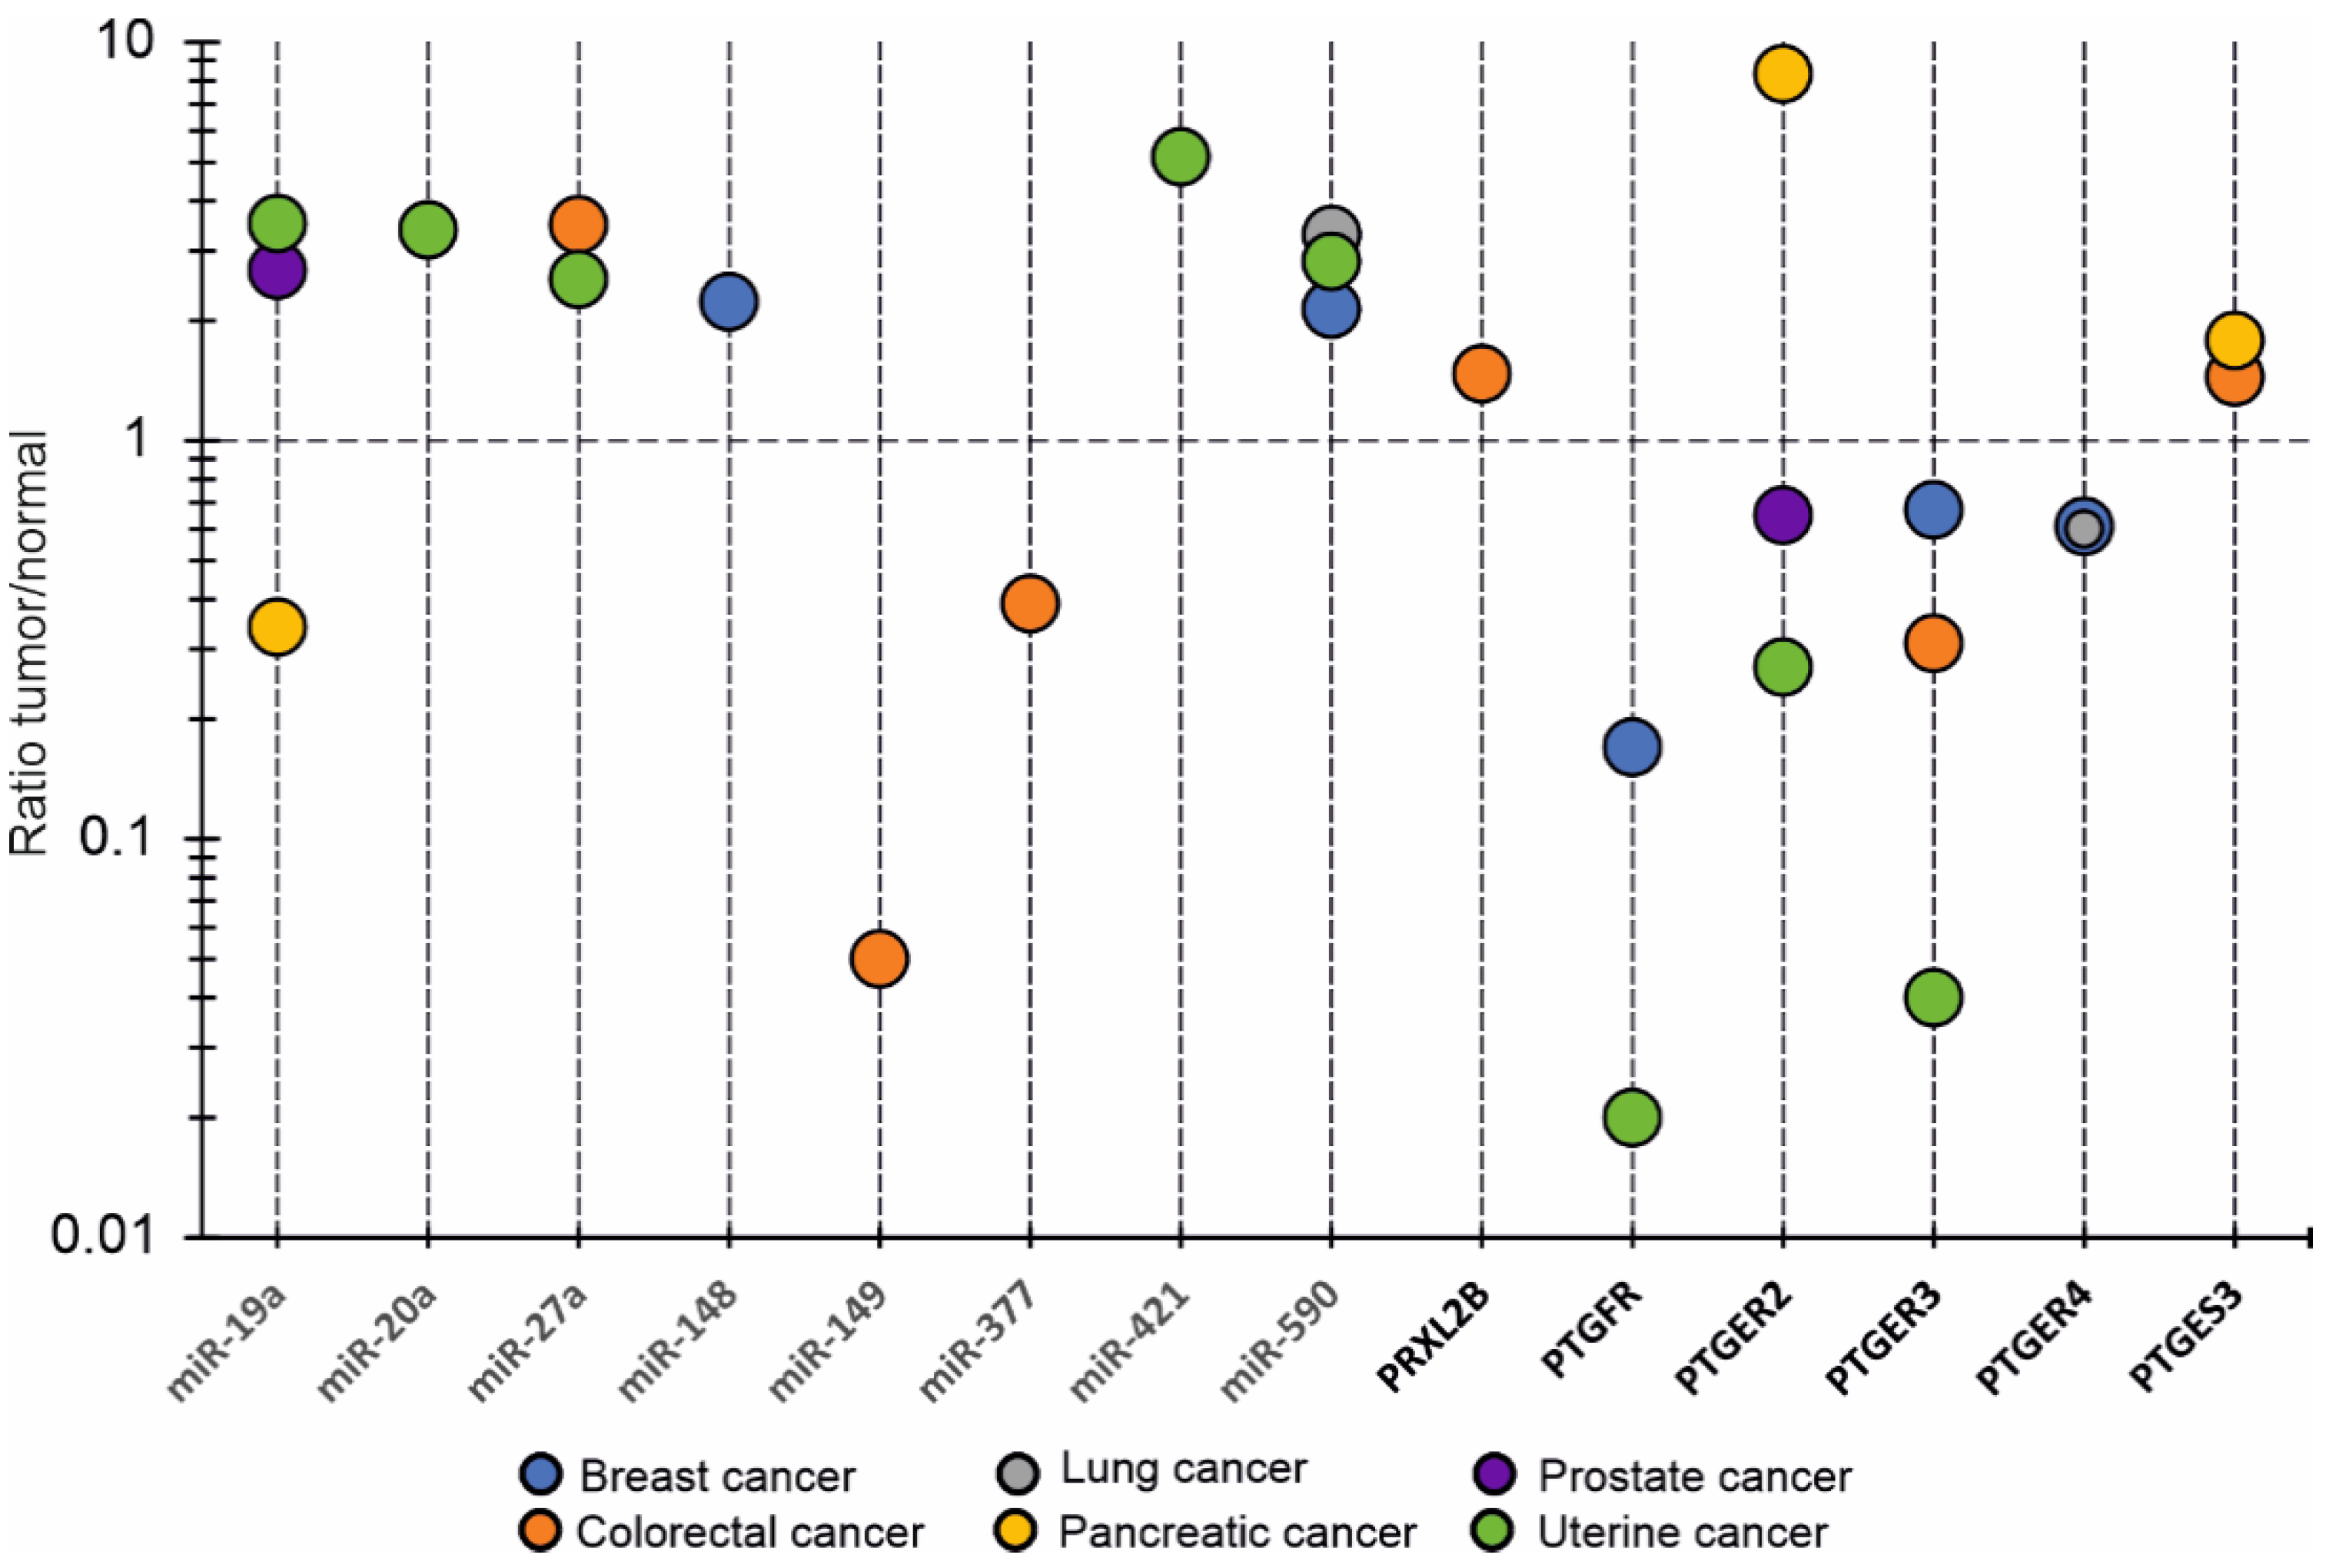
3.2.3. OncomiRs
3.3. Protein Expression Patterns
3.4. Prognostic Value of Transcriptomic Signatures
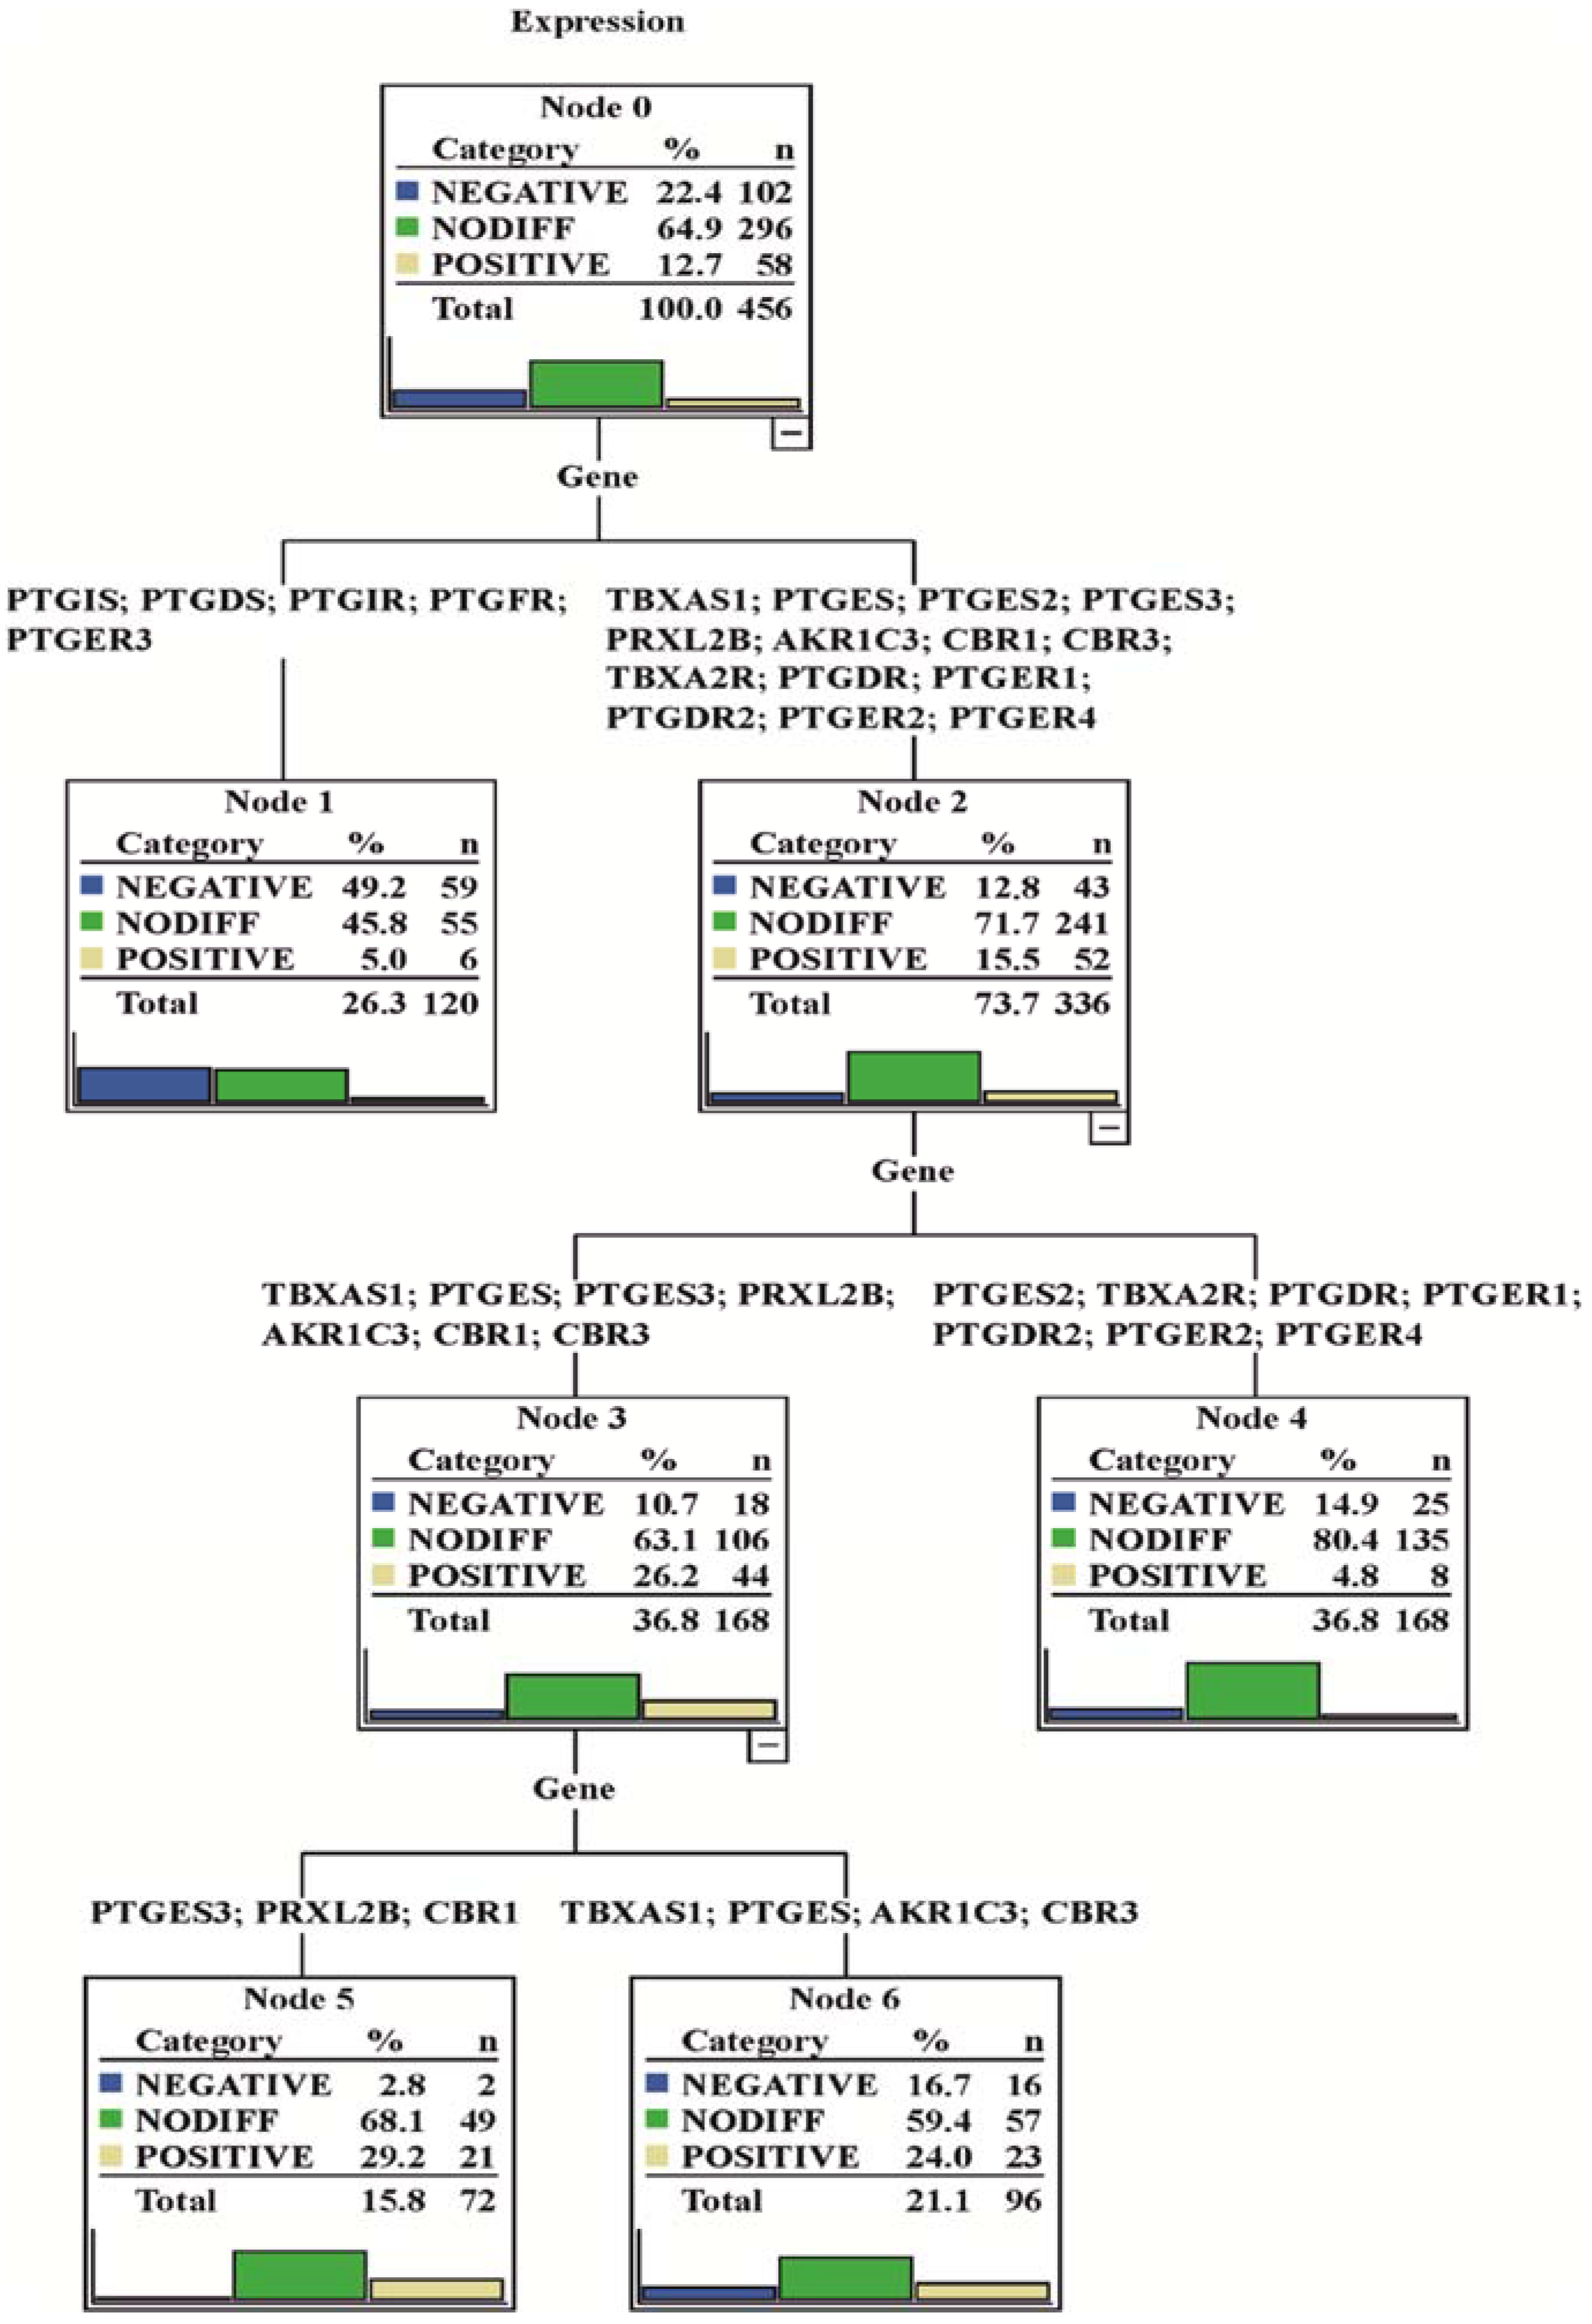
3.5. Predictive Value of Prostanoid Enzymes and Receptors Genes
3.6. Mutation Status Analysis
4. Discussion
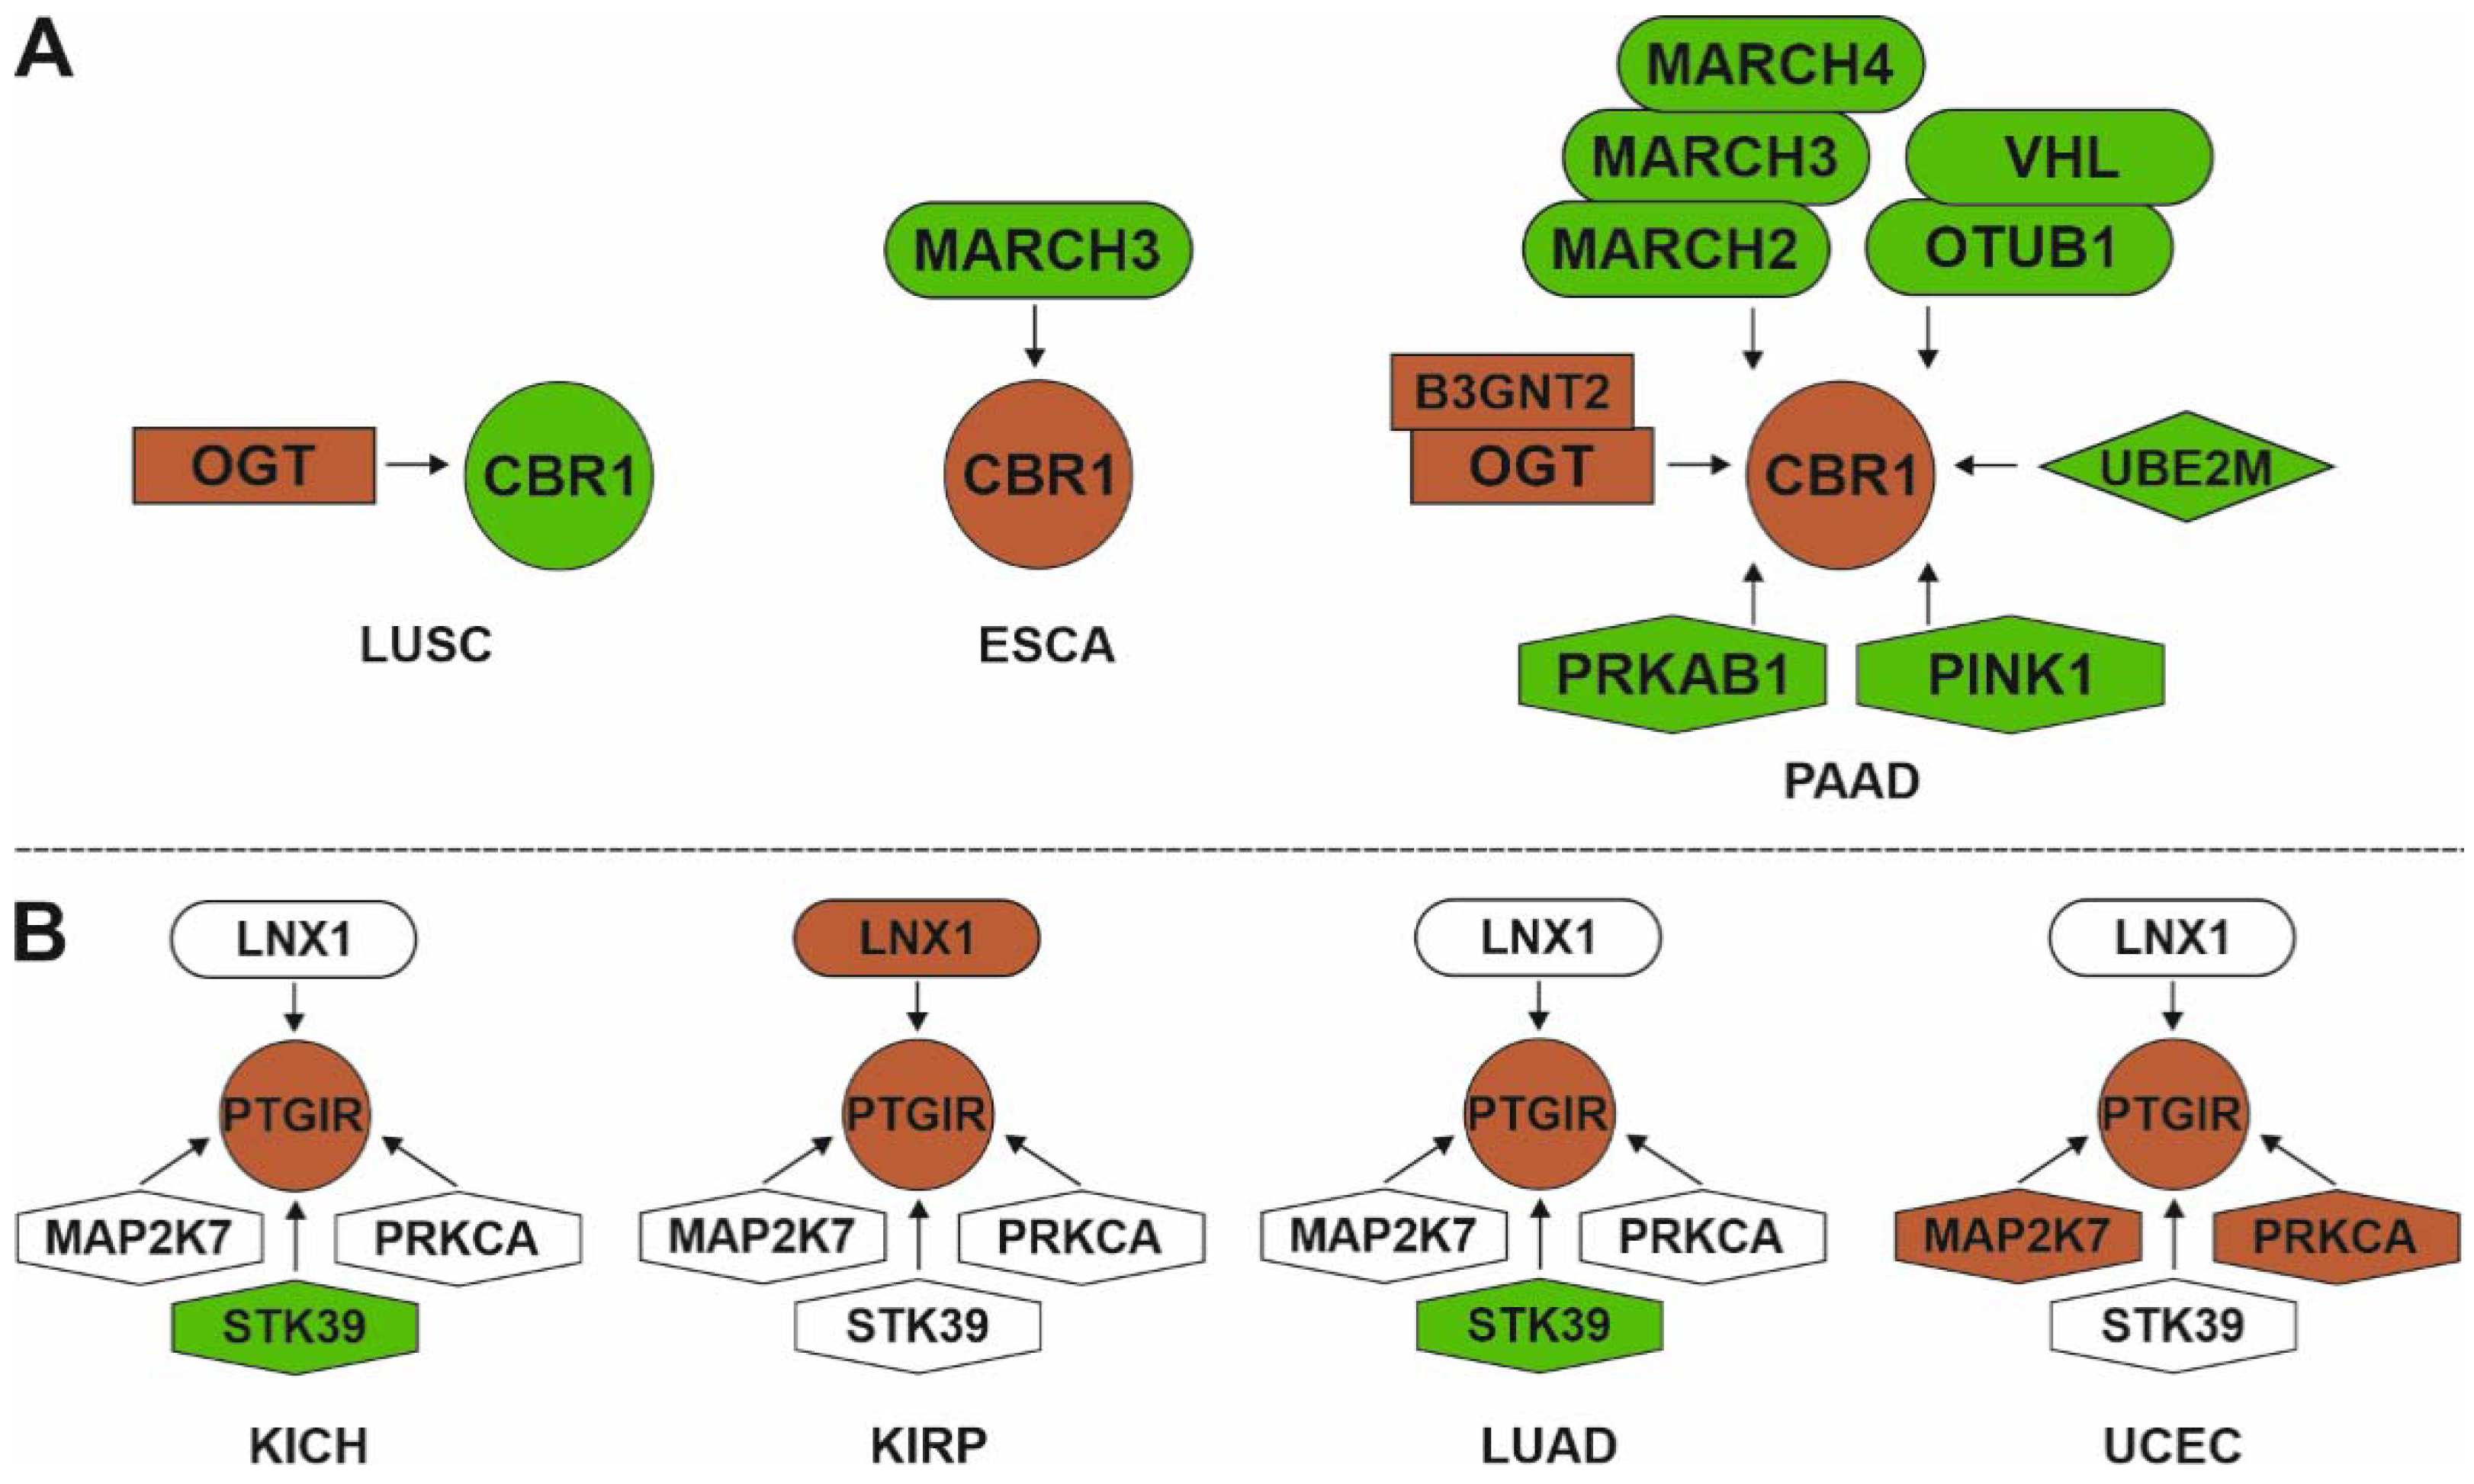
Protein-Protein Interactions and Post-Translational Modifications
5. Conclusions
Supplementary Materials
Author Contributions
Funding
Institutional Review Board Statement
Informed Consent Statement
Data Availability Statement
Conflicts of Interest
Abbreviations
| TXA2 | thromboxane A2 |
| TXB2 | thromboxane B2 |
| PGE2 | prostaglandin E2 |
| PGF2α | prostaglandin F2α |
| PGD2 | prostaglandin D2 |
| PGI2 | Prostacyclin |
| PGH2 | prostaglandin H2 |
| TBXAS1 | thromboxane A synthase 1 |
| PTGIS | prostaglandin I2 synthase |
| PTGDS | prostaglandin D2 synthase |
| PTGES | prostaglandin E synthase |
| PTGES2 | prostaglandin E synthase 2 |
| PTGES3 | prostaglandin E synthase 3 |
| PRXL2B | peroxiredoxin like 2B |
| AKR1C3 | aldo-keto reductase family 1 member C3 |
| CBR1 | carbonyl reductase 1 |
| CBR3 | carbonyl reductase 3 |
| TBXA2R | thromboxane A2 receptor |
| PTGIR | prostaglandin I2 receptor |
| PTGDR | prostaglandin D2 receptor |
| PTGFR | prostaglandin F receptor |
| PTGDR2 | prostaglandin D2 receptor 2 |
| PTGER1 | prostaglandin E receptor 1 |
| PTGER2 | prostaglandin E receptor 2 |
| PTGER3 | prostaglandin E receptor 3 |
| PTGER4 | prostaglandin E receptor 4 |
| Gq α | Gq protein alpha subunit |
| Gs α | Gs protein alpha subunit |
| Gi α | Gi protein alpha subunit |
| Gi/12 α | Gi & G12 protein subunit |
| ACC | adrenocortical carcinoma |
| BLCA | bladder urothelial carcinoma |
| BRCA | breast invasive carcinoma |
| CESC | cervical squamous cell carcinoma and endocervical adenocarcinoma |
| CHOL | cholangiocarcinoma |
| COAD | colon adenocarcinoma |
| DLBC | lymphoid neoplasm diffuse large B-cell lymphoma |
| ESCA | esophageal carcinoma |
| GBM | glioblastoma multiforme |
| HNSC | head and neck squamous cell carcinoma |
| KICH | kidney chromophobe renal cell carcinoma |
| KIRC | kidney renal clear cell carcinoma |
| KIRP | kidney renal papillary cell carcinoma |
| LAML | scute myeloid leukemia |
| LGG | brain lower grade glioma |
| LIHC | liver hepatocellular carcinoma |
| LUAD | lung adenocarcinoma |
| LUSC | lung squamous cell carcinoma |
| MESO | mesothelioma |
| OV | ovarian serous cystadenocarcinoma |
| PAAD | pancreatic adenocarcinoma |
| PCPG | pheochromocytoma and paraganglioma |
| PRAD | prostate adenocarcinoma, |
| READ | rectum adenocarcinoma |
| SARC | sarcoma |
| SKCM | skin cutaneous melanoma |
| STAD | stomach adenocarcinoma |
| TGCT | testicular germ cell tumors |
| THCA | thyroid carcinoma |
| THYM | thymoma |
| UCEC | uterine corpus endometrial carcinoma |
| UCS | uterine carcinosarcoma |
| UVM | uveal melanoma |
Appendix A

| Prostanoids | Description | References |
|---|---|---|
| TXA2 | TXA2 impacts the interface of platelet-tumor cell crosstalk and serves as a link between platelets in ovarian cancer. | [20] |
| TXA2 | Inhibition of TXA2 synthesis reduced human umbilical vein endothelial cells migration stimulated by VEGF or bFGF. The development of lung metastasis in mice models was significantly inhibited by thromboxane synthase inhibitors. | [21] |
| TXB2 | High TXB2 urinary level was associated with (i) prostate cancer in African American men (OR 1.50, 1.13–2.00), but not European American men (OR 1.07, 0.82–1.40); (ii) metastatic prostate cancer (OR 2.60, 1.08–6.28) compared with low levels of TXB2. | [22] |
| TXB2 | TXB2 was much higher in the non-small cell lung carcinoma tissue than in normal tissues and advanced-stage cancers had higher levels of TXB2 thus supporting the role of TXB2 in tumor growth promotion. | [23] |
| 11-dihydro-TXB2 | In 10 patients with colorectal cancer, the urinary excretion of 11-dehydro-TXB2 was significantly higher than in 10 controls. Enhanced platelet activation occurs in colorectal cancer patients and low-dose aspirin might restore anti-tumor reactivity. | [24] |
| PGE2 | PGE2 promotes gastrointestinal tumor progression and metastasis by (i) direct effect on tumor cell proliferation, survival, and migration/invasion; (ii) tumor-associated immunosuppression; (iii) by silencing certain tumor suppressor and DNA repair genes via DNA methylation. | [25] |
| PGE2 | PGE2 promotes resistance to apoptosis, metastasis, angiogenesis, and drug resistance in colon cancer. Increased levels of PGE2 are associated with cancer progression. Pharmacology targeting PGE2 receptors may be a potent therapeutic anti-cancer strategy. | [26] |
| PGF2α | 13,14-dihydro-15-keto PGF2α was significantly reduced in type II endometrial cancer (EC) compared with normal endometrium, however, PGF2α level increased in case of endometrium hyperplasia. | [27] |
| PGF2α | Urinary 8-epi-PGF2α levels were correlated with tumor histologic subtype of ovarian cancer. | [28] |
| PGF2α | Serum 8-iso-PGF2α showed high diagnostic performance in breast cancer (AUC = 0.99, sensitivity = 100%, specificity = 99% at a cutoff value of 36 pg/mL) thus providing evidence that the high level of serum 8-iso-PGF2α helps to distinguish breast cancer and benign tumors (p < 0.001). | [29] |
| PGF2α | Urinary 8-iso-PGF2α and 2,3-dinor-8-iso-PGF2α were increased in the carcinogenesis phase of colitis-associated colon cancer. | [30] |
| TXB2, PGD2, PGE2, PGF2α | Glioblastomas had higher concentrations of TXB2, PGD2, PGE2, and PGF2α versus grade II/III tumors. A significant decrease in survival rates was correlated with high levels of PGE2 and PGF2α in the tumor. | [31] |
| PGF1α-iso-prostanoids, TXB2 | Peripheral plasma levels of 6-keto-PGF1α and TXB2 were higher in patients with breast malignant tumors than in healthy controls. The high levels of 6-keto-PGF1α and TXB2 did not correlate with clinical and histopathological data. | [32] |
| PGF1α-iso-prostanoids | Patients with ovarian cancer excreted increased amounts of urinary 6-keto-PGF1α with no relation to tumor histology or stage. | [33] |
| PGA2, PGB2, PGE1, PGE2, TXB2, PGD2, PGI2, 6-keto PGF1α | Higher levels of PGA2, PGB2, PGE1, PGE2, and TXB2 were observed in muscle invasive bladder cancer in contrast to both normal urothelium and non-MIBC, whereas PGD2, PGI2, and 6-keto PGF1α were decreased in urothelial carcinoma. That points to different implications in cancer of up-regulated cyclooxygenase, PTGES and TBXAS,1 and down-regulated PTGDS as well as PTGIS. | [34] |
| PGI2 | Iloprost, a stable PGI2 analog, inhibited migration and invasion of ovarian cancer cells as well as downregulated the expression of metastasis-associated matrix metallopeptidase-2 and -9 (MMP-2 and MMP-9) via the prostacyclin receptor-mediated protein kinase A pathway. | [35] |
| PGI2 | Hyperproduction of intracellular PGI2 promotes apoptosis by activating peroxisome proliferator-activated receptor δ (PPARδ), acting as a second signaling pathway that controls cell apoptosis. | [36] |
| PGD2 | Signaling between PGD2 and PTGDR2 has the ability to restrict the self-renewal of gastric cancer cells in vitro and suppress tumor growth and metastasis in vivo. The study showed a novel function of PGD2/PTGDR2 signaling in cancer stem cells regulation that is critical for tumor neovascularization and invasiveness. | [37] |
Appendix B

References
- Bos, C.L.; Richel, D.J.; Ritsema, T.; Peppelenbosch, M.; Versteeg, H. Prostanoids and prostanoid receptors in signal transduction. Int. J. Biochem. Cell Biol. 2004, 36, 1187–1205. [Google Scholar] [CrossRef] [PubMed]
- Zhu, L.; Zhang, Y.; Guo, Z.; Wang, M. Cardiovascular Biology of Prostanoids and Drug Discovery. Arter. Thromb. Vasc. Biol. 2020, 40, 1454–1463. [Google Scholar] [CrossRef] [PubMed]
- Iñiguez, M.A.; Cacheiro-Llaguno, C.; Cuesta, N.; Díaz-Muñoz, M.D.; Fresno, M. Prostanoid function and cardiovascular disease. Arch. Physiol. Biochem. 2008, 114, 201–209. [Google Scholar] [CrossRef] [PubMed]
- Rahnama’I, M.S.; Van Kerrebroeck, P.E.V.; De Wachter, S.G.; Van Koeveringe, G.A. The role of prostanoids in urinary bladder physiology. Nat. Rev. Urol. 2012, 9, 283–290. [Google Scholar] [CrossRef] [PubMed]
- Jara-Gutiérrez, Á.; Baladrón, V. The Role of Prostaglandins in Different Types of Cancer. Cells 2021, 10, 1487. [Google Scholar] [CrossRef] [PubMed]
- Zhao, S.; Cheng, C.K.; Zhang, C.-L.; Huang, Y. Interplay between Oxidative Stress, Cyclooxygenases, and Prostanoids in Cardiovascular Diseases. Antioxid. Redox Signal. 2021, 34, 784–799. [Google Scholar] [CrossRef] [PubMed]
- Wang, B.; Wu, L.; Chen, J.; Dong, L.; Chen, C.; Wen, Z.; Hu, J.; Fleming, I.; Wang, D.W. Metabolism pathways of arachidonic acids: Mechanisms and potential therapeutic targets. Signal Transduct. Target. Ther. 2021, 6, 94. [Google Scholar] [CrossRef]
- Diakowska, D.; Markocka-Mączka, K.; Nienartowicz, M.; Lewandowski, A.; Grabowski, K. Increased level of serum prostaglandin-2 in early stage of esophageal squamous cell carcinoma. Arch. Med. Sci. 2014, 10, 956–961. [Google Scholar] [CrossRef] [Green Version]
- D’Eufemia, P.; Finocchiaro, R.; Celli, M.; Zambrano, A.; Tetti, M.; Villani, C.; Persiani, P.; Mari, E.; Zicari, A. High Levels of Serum Prostaglandin E2 in Children with Osteogenesis Imperfecta Are Reduced by Neridronate Treatment. Pediatr. Res. 2008, 63, 203–206. [Google Scholar] [CrossRef] [Green Version]
- Mitchell, M.D.; Flint, A.P.; Bibby, J.; Brunt, J.; Arnold, J.M.; Anderson, A.B.M.; Aturnbull, A.C. Plasma Concentrations of Prostaglandins during Late Human Pregnancy: Influence of Normal and Preterm Labor. J. Clin. Endocrinol. Metab. 1978, 46, 947–951. [Google Scholar] [CrossRef]
- Brun, C.; Daali, Y.; Combescure, C.; Zufferey, A.; Michelson, A.D.; Fontana, P.; Reny, J.-L.; Iii, A.L.F. Aspirin response: Differences in serum thromboxane B2 levels between clinical studies. Platelets 2016, 27, 196–202. [Google Scholar] [CrossRef] [PubMed]
- Gachet, M.S.; Rhyn, P.; Bosch, O.G.; Quednow, B.B.; Gertsch, J. A quantitiative LC-MS/MS method for the measurement of arachidonic acid, prostanoids, endocannabinoids, N-acylethanolamines and steroids in human plasma. J. Chromatogr. B 2015, 976-977, 6–18. [Google Scholar] [CrossRef] [PubMed]
- Kanehisa, M.; Goto, S. KEGG: Kyoto Encyclopedia of Genes and Genomes. Nucleic Acids Res. 2000, 28, 27–30. [Google Scholar] [CrossRef] [PubMed]
- Nakanishi, T.; Nakamura, Y.; Umeno, J. Recent advances in studies of SLCO2A1 as a key regulator of the delivery of prostaglandins to their sites of action. Pharmacol. Ther. 2021, 223, 107803. [Google Scholar] [CrossRef] [PubMed]
- Norel, X.; Sugimoto, Y.; Ozen, G.; Abdelazeem, H.; Amgoud, Y.; Bouhadoun, A.; Bassiouni, W.; Goepp, M.; Mani, S.; Manikpurage, H.D.; et al. International Union of Basic and Clinical Pharmacology. CIX. Differences and Similarities between Human and Rodent Prostaglandin E2Receptors (EP1–4) and Prostacyclin Receptor (IP): Specific Roles in Pathophysiologic Conditions. Pharmacol. Rev. 2020, 72, 910–968. [Google Scholar] [CrossRef] [PubMed]
- Biringer, R.G. A Review of Prostanoid Receptors: Expression, Characterization, Regulation, and Mechanism of Action. J. Cell Commun. Signal. 2021, 15, 155–184. [Google Scholar] [CrossRef] [PubMed]
- Kobsar, A.L.; Koessler, J.; Rajkovic, M.S.; Brunner, K.P.; Steigerwald, U.; Walter, U. Prostacyclin receptor stimulation facilitates detection of human platelet P2Y(12)receptor inhibition by the PFA-100 system. Platelets 2010, 21, 112–116. [Google Scholar] [CrossRef] [PubMed]
- Wang, D.; Cabalag, C.S.; Clemons, N.J.; DuBois, R.N. Cyclooxygenases and Prostaglandins in Tumor Immunology and Microenvironment of Gastrointestinal Cancer. Gastroenterology 2021, 161, 1813–1829. [Google Scholar] [CrossRef]
- Cathcart, M.-C.; Reynolds, J.V.; O’Byrne, K.J.; Pidgeon, G.P. The role of prostacyclin synthase and thromboxane synthase signaling in the development and progression of cancer. Biochim. Biophys. Acta 2010, 1805, 153–166. [Google Scholar] [CrossRef]
- Serhan, K.; Gartung, A.; Panigrahy, D. Drawing a link between the thromboxane A2 pathway and the role of platelets and tumor cells in ovarian cancer. Prostaglandins Other Lipid Mediat. 2018, 137, 40–45. [Google Scholar] [CrossRef]
- Nie, D.; Lamberti, M.; Zacharek, A.; Li, L.; Szekeres, K.; Tang, K.; Chen, Y.; Honn, K.V. Thromboxane A2 Regulation of Endothelial Cell Migration, Angiogenesis, and Tumor Metastasis. Biochem. Biophys. Res. Commun. 2000, 267, 245–251. [Google Scholar] [CrossRef] [PubMed]
- Kiely, M.; Milne, G.L.; Minas, T.Z.; Dorsey, T.H.; Tang, W.; Smith, C.J.; Baker, F.; Loffredo, C.A.; Yates, C.; Cook, M.B.; et al. Urinary Thromboxane B2 and Lethal Prostate Cancer in African American Men. JNCI J. Natl. Cancer Inst. 2021, 114, 123–129. [Google Scholar] [CrossRef] [PubMed]
- Chen, G.G.; Lee, T.W.; Yip, J.H.; Xu, H.; Lee, I.K.; Mok, T.S.; Warner, T.D.; Yim, A.P. Increased thromboxane B2 levels are associated with lipid peroxidation and Bcl-2 expression in human lung carcinoma. Cancer Lett. 2006, 234, 193–198. [Google Scholar] [CrossRef] [PubMed]
- Sciulli, M.; Filabozzi, P.; Tacconelli, S.; Padovano, R.; Ricciotti, E.; Capone, M.; Grana, M.; Carnevale, V.; Patrignani, P. Platelet activation in patients with colorectal cancer. Prostaglandins Leukot. Essent. Fat. Acids 2005, 72, 79–83. [Google Scholar] [CrossRef]
- Wang, D.; Dubois, R.N. Role of prostanoids in gastrointestinal cancer. J. Clin. Investig. 2018, 128, 2732–2742. [Google Scholar] [CrossRef]
- Karpisheh, V.; Nikkhoo, A.; Farsangi, M.H.; Namdar, A.; Azizi, G.; Ghalamfarsa, G.; Sabz, G.; Yousefi, M.; Yousefi, B.; Jadidi-Niaragh, F. Prostaglandin E2 as a potent therapeutic target for treatment of colon cancer. Prostaglandins Other Lipid Mediat. 2019, 144, 106338. [Google Scholar] [CrossRef]
- Cummings, M.; Massey, K.A.; Mappa, G.; Wilkinson, N.; Hutson, R.; Munot, S.; Saidi, S.; Nugent, D.; Broadhead, T.; Wright, A.I.; et al. Integrated eicosanoid lipidomics and gene expression reveal decreased prostaglandin catabolism and increased 5-lipoxygenase expression in aggressive subtypes of endometrial cancer. J. Pathol. 2019, 247, 21–34. [Google Scholar] [CrossRef]
- Caglayan, A.; Katlan, D.C.; Selcuk Tuncer, Z.; Yüce, K.; Sayal, H.B.; Coskun Salman, M.; Kocer-Gumusel, B. Impaired antioxidant enzyme functions with increased lipid peroxidation in epithelial ovarian cancer. IUBMB Life 2017, 69, 802–813. [Google Scholar] [CrossRef] [Green Version]
- Eldin, E.E.M.N.; Eldein, M.M.N.; El-Readi, M.Z.; Mirza, A.A.; Fatani, S.H.; Al-Amodi, H.S.; Althubiti, M.A.; Al-Ezzi, E.M.; Eid, S.Y.; Kamel, H.F.M. Evaluation of the Diagnostic and Predicative Values of 8-Iso-Prostaglandin F2α as a Biomarker of Breast Cancer. Oncol. Res. Treat. 2020, 43, 506–517. [Google Scholar] [CrossRef]
- Miyazaki, Y.; Nakamura, T.; Takenouchi, S.; Hayashi, A.; Omori, K.; Murata, T. Urinary 8-iso PGF2α and 2,3-dinor-8-iso PGF2α can be indexes of colitis-associated colorectal cancer in mice. PLoS ONE 2021, 16, e0245292. [Google Scholar] [CrossRef]
- Panagopoulos, A.T.; Gomes, R.N.; Almeida, F.G.; Souza, F.D.C.; Veiga, J.C.E.; Nicolaou, A.; Colquhoun, A. The prostanoid pathway contains potential prognostic markers for glioblastoma. Prostaglandins Other Lipid Mediat. 2018, 137, 52–62. [Google Scholar] [CrossRef] [PubMed] [Green Version]
- Nigam, S.; Becker, R.; Rosendahl, U.; Hammerstein, J.; Benedetto, C.; Barbero, M.; Slater, T. The concentration of 6-keto-PGF1α and TXB2 in plasma samples from patients with benign and malignant tumours of the breast. Prostaglandins 1985, 29, 513–528. [Google Scholar] [CrossRef]
- Aitokallio-Tallberg, A.; Viinikka, L.; Ylikorkala, O. Urinary 6-keto-prostaglandin F1a in patients with gynaecological tumours. Cancer Lett. 1987, 34, 201–206. [Google Scholar] [CrossRef]
- Sahu, D.; Lotan, Y.; Wittmann, B.; Neri, B.; Hansel, D.E. Metabolomics analysis reveals distinct profiles of nonmuscle-invasive and muscle-invasive bladder cancer. Cancer Med. 2017, 6, 2106–2120. [Google Scholar] [CrossRef] [PubMed]
- Ahn, J.-H.; Lee, K.-T.; Choi, Y.S.; Choi, J.-H. Iloprost, a prostacyclin analog, inhibits the invasion of ovarian cancer cells by downregulating matrix metallopeptidase-2 (MMP-2) through the IP-dependent pathway. Prostaglandins Other Lipid Mediat. 2018, 134, 47–56. [Google Scholar] [CrossRef] [PubMed]
- Hatae, T.; Wada, M.; Yokoyama, C.; Shimonishi, M.; Tanabe, T. Prostacyclin-dependent Apoptosis Mediated by PPAR Delta. J. Biol. Chem. 2001, 276, 46260–46267. [Google Scholar] [CrossRef] [PubMed] [Green Version]
- Zhang, B.; Bie, Q.; Wu, P.; Zhang, J.; You, B.; Shi, H.; Qian, H.; Xu, W. PGD2/PTGDR2 Signaling Restricts the Self-Renewal and Tumorigenesis of Gastric Cancer. Stem Cells 2018, 36, 990–1003. [Google Scholar] [CrossRef] [PubMed] [Green Version]
- Piñero, J.; Bravo, À.; Queralt-Rosinach, N.; Gutiérrez-Sacristán, A.; Deu-Pons, J.; Centeno, E.; García-García, J.; Sanz, F.; Furlong, L.I. DisGeNET: A comprehensive platform integrating information on human disease-associated genes and variants. Nucleic Acids Res. 2016, 45, D833–D839. [Google Scholar] [CrossRef]
- Deng, Q.-P.; Wang, M.-J.; Zeng, X.; Chen, G.G.; Huang, R.-Y. Effects of Glycyrrhizin in a Mouse Model of Lung Adenocarcinoma. Cell. Physiol. Biochem. 2017, 41, 1383–1392. [Google Scholar] [CrossRef]
- Liu, Y.; Yang, S.; Li, M.-Y.; Huang, R.; Ng, C.S.; Wan, I.Y.; Long, X.; Wu, J.; Wu, B.; Du, J.; et al. Tumorigenesis of smoking carcinogen 4-(methylnitrosamino)-1-(3-pyridyl)-1-butanone is related to its ability to stimulate thromboxane synthase and enhance stemness of non-small cell lung cancer stem cells. Cancer Lett. 2015, 370, 198–206. [Google Scholar] [CrossRef]
- Cathcart, M.C.; Gately, K.; Cummins, R.; Drakeford, C.; Kay, E.W.; O’Byrne, K.J.; Pidgeon, G.P. Thromboxane synthase expression and correlation with VEGF and angiogenesis in non-small cell lung cancer. Biochim. Biophys. Acta 2014, 1842, 747–755. [Google Scholar] [CrossRef]
- Li, H.; Lee, M.-H.; Liu, K.; Wang, T.; Song, M.; Han, Y.; Yao, K.; Xie, H.; Zhu, F.; Grossmann, M.; et al. Inhibiting breast cancer by targeting the thromboxane A2 pathway. NPJ Precis. Oncol. 2017, 1, 8. [Google Scholar] [CrossRef] [PubMed] [Green Version]
- Sasaki, Y.; Ochiai, T.; Takamura, M.; Kondo, Y.; Yokoyama, C.; Hara, S. Role of prostacyclin synthase in carcinogenesis. Prostaglandins Other Lipid Mediat. 2017, 133, 49–52. [Google Scholar] [CrossRef] [PubMed]
- Li, H.Y.; McSharry, M.; Walker, D.; Johnson, A.; Kwak, J.; Bullock, B.; Neuwelt, A.; Poczobutt, J.M.; Sippel, T.R.; Keith, R.L.; et al. Targeted overexpression of prostacyclin synthase inhibits lung tumor progression by recruiting CD4+ T lymphocytes in tumors that express MHC class II. OncoImmunology 2018, 7, e1423182. [Google Scholar] [CrossRef] [PubMed] [Green Version]
- Kwon, O.K.; Ha, Y.-S.; Na, A.-Y.; Chun, S.Y.; Kwon, T.G.; Lee, J.N.; Lee, S. Identification of Novel Prognosis and Prediction Markers in Advanced Prostate Cancer Tissues Based on Quantitative Proteomics. Cancer Genom. Proteom. 2020, 17, 195–208. [Google Scholar] [CrossRef] [PubMed]
- Lichao, S.; Liang, P.; Chunguang, G.; Fang, L.; ZhiHua, Y.; Yuliang, R. Overexpression of PTGIS Could Predict Liver Metastasis and is Correlated with Poor Prognosis in Colon Cancer Patients. Pathol. Oncol. Res. 2011, 18, 563–569. [Google Scholar] [CrossRef] [PubMed]
- Jin, R.; Strand, D.W.; Forbes, C.M.; Case, T.; Cates, J.M.M.; Liu, Q.; Ramirez-Solano, M.; Milne, G.L.; Bs, S.S.; Wang, Z.Y.; et al. The prostaglandin pathway is activated in patients who fail medical therapy for benign prostatic hyperplasia with lower urinary tract symptoms. Prostate 2021, 81, 944–955. [Google Scholar] [CrossRef]
- Zou, R.; Zheng, M.; Tan, M.; Xu, H.; Luan, N.; Zhu, L. Decreased PTGDS Expression Predicting Poor Survival of Endometrial Cancer by Integrating Weighted Gene Co-Expression Network Analysis and Immunohistochemical Validation. Cancer Manag. Res. 2020, 12, 5057–5075. [Google Scholar] [CrossRef]
- He, L.P.; Chen, Y.F.; Yang, J. Investigation on the role and mechanism of prostagland in D2 synthase in non-small cell lung cancer. Zhonghua Yi Xue Za Zhi 2017, 97, 3022–3027. [Google Scholar]
- Pan, J.; Zhang, L.; Huang, J. Prostaglandin D2 synthase/prostaglandin D2/TWIST2 signaling inhibits breast cancer proliferation. Anti Cancer Drugs 2021, 32, 1029–1037. [Google Scholar] [CrossRef]
- Hu, S.; Ren, S.; Cai, Y.; Liu, J.; Han, Y.; Zhao, Y.; Yang, J.; Zhou, X.; Wang, X. Glycoprotein PTGDS promotes tumorigenesis of diffuse large B-cell lymphoma by MYH9-mediated regulation of Wnt-β-catenin-STAT3 signaling. Cell Death Differ. 2021, 29, 642–656. [Google Scholar] [CrossRef] [PubMed]
- Jiang, P.; Cao, Y.; Gao, F.; Sun, W.; Liu, J.; Ma, Z.; Xie, M.; Fu, S. SNX10 and PTGDS are associated with the progression and prognosis of cervical squamous cell carcinoma. BMC Cancer 2021, 21, 694. [Google Scholar] [CrossRef] [PubMed]
- Bie, Q.; Li, X.; Liu, S.; Yang, X.; Qian, Z.; Zhao, R.; Zhang, X.; Zhang, B. YAP promotes self-renewal of gastric cancer cells by inhibiting expression of L-PTGDS and PTGDR2. Int. J. Clin. Oncol. 2020, 25, 2055–2065. [Google Scholar] [CrossRef] [PubMed]
- Liu, C.; Yang, J.C.; Armstrong, C.M.; Lou, W.; Liu, L.; Qiu, X.; Zou, B.; Lombard, A.P.; D’Abronzo, L.S.; Evans, C.P.; et al. AKR1C3 Promotes AR-V7 Protein Stabilization and Confers Resistance to AR-Targeted Therapies in Advanced Prostate Cancer. Mol. Cancer Ther. 2019, 18, 1875–1886. [Google Scholar] [CrossRef] [PubMed] [Green Version]
- Penning, T.M. AKR1C3 (type 5 17β-hydroxysteroid dehydrogenase/prostaglandin F synthase): Roles in malignancy and endocrine disorders. Mol. Cell. Endocrinol. 2019, 489, 82–91. [Google Scholar] [CrossRef]
- Russo, A.; Biselli-Chicote, P.M.; Kawasaki-Oyama, R.S.; Castanhole-Nunes, M.M.; Maniglia, J.V.; Neto, D.D.S.; Pavarino, É.C.; Goloni-Bertollo, E.M. Differential Expression of Prostaglandin I2 Synthase Associated with Arachidonic Acid Pathway in the Oral Squamous Cell Carcinoma. J. Oncol. 2018, 2018, 6301980. [Google Scholar] [CrossRef] [Green Version]
- Wang, T.; Jing, B.; Sun, B.; Liao, Y.; Song, H.; Xu, D.; Guo, W.; Li, K.; Hu, M.; Liu, S.; et al. Stabilization of PTGES by deubiquitinase USP9X promotes metastatic features of lung cancer via PGE2 signaling. Am. J. Cancer Res. 2019, 9, 1145–1160. [Google Scholar]
- Nagaraja, A.; Dorniak, P.L.; Sadaoui, N.C.; Kang, Y.; Lin, T.; Armaiz-Pena, G.N.; Wu, S.Y.; Rupaimoole, R.; Allen, J.K.; Gharpure, K.; et al. Sustained adrenergic signaling leads to increased metastasis in ovarian cancer via increased PGE2 synthesis. Oncogene 2016, 35, 2390–2397. [Google Scholar] [CrossRef] [Green Version]
- Wang, T.; Jing, B.; Xu, D.; Liao, Y.; Song, H.; Sun, B.; Guo, W.; Xu, J.; Li, K.; Hu, M.; et al. PTGES/PGE2 signaling links immunosuppression and lung metastasis in Gprc5a-knockout mouse model. Oncogene 2020, 39, 3179–3194. [Google Scholar] [CrossRef] [Green Version]
- Stamatakis, K.; Jimenez-Martinez, M.; Jimenez-Segovia, A.; Chico-Calero, I.; Conde-Moreno, E.; Martínez, J.G.; Ruiz, J.; Pascual, A.; Barrocal, B.; López, B.B.; et al. Prostaglandins induce early growth response 1 transcription factor mediated microsomal prostaglandin E2 synthase up-regulation for colorectal cancer progression. Oncotarget 2015, 6, 39941–39959. [Google Scholar] [CrossRef]
- Kim, S.-H.; Roszik, J.; Cho, S.-N.; Ogata, D.; Milton, D.R.; Peng, W.; Menter, D.G.; Ekmekcioglu, S.; Grimm, E.A. The COX2 Effector Microsomal PGE2 Synthase 1 is a Regulator of Immunosuppression in Cutaneous Melanoma. Clin. Cancer Res. 2019, 25, 1650–1663. [Google Scholar] [CrossRef] [PubMed] [Green Version]
- Kim, S.; Lee, E.S.; Jung, J.Y.; Lee, S.B.; Lee, H.J.; Kim, J.; Kim, H.J.; Lee, J.W.; Son, B.H.; Gong, G.; et al. Targeted eicosanoids profiling reveals a prostaglandin reprogramming in breast Cancer by microRNA-155. J. Exp. Clin. Cancer Res. 2021, 40, 43. [Google Scholar] [CrossRef] [PubMed]
- Garo, L.P.; Ajay, A.K.; Fujiwara, M.; Gabriely, G.; Raheja, R.; Kuhn, C.; Kenyon, B.; Skillin, N.; Kadowaki-Saga, R.; Saxena, S.; et al. MicroRNA-146a limits tumorigenic inflammation in colorectal cancer. Nat. Commun. 2021, 12, 2419. [Google Scholar] [CrossRef] [PubMed]
- Ke, J.; Shen, Z.; Li, M.; Peng, C.; Xu, P.; Wang, M.; Zhu, Y.; Zhang, X.; Wu, D. Prostaglandin E2 triggers cytochrome P450 17α hydroxylase overexpression via signal transducer and activator of transcription 3 phosphorylation and promotes invasion in endometrial cancer. Oncol. Lett. 2018, 16, 4577–4585. [Google Scholar] [CrossRef] [PubMed] [Green Version]
- Kong, J.; Shen, S.; Zhang, Z.; Wang, W. Identification of hub genes and pathways in cholangiocarcinoma by coexpression analysis. Cancer Biomark. 2020, 27, 505–517. [Google Scholar] [CrossRef]
- Gu, Y.; Chen, G.; Du, Y. Screening of Prognosis-Related Genes in Primary Breast Carcinoma Using Genomic Expression Data. J. Comput. Biol. 2020, 27, 1030–1040. [Google Scholar] [CrossRef]
- Zhou, L.; Yang, C.; Zhong, W.; Wang, Q.; Zhang, D.; Zhang, J.; Xie, S.; Xu, M. Chrysin induces autophagy-dependent ferroptosis to increase chemosensitivity to gemcitabine by targeting CBR1 in pancreatic cancer cells. Biochem. Pharmacol. 2021, 193, 114813. [Google Scholar] [CrossRef]
- Osawa, Y.; Yokoyama, Y.; Shigeto, T.; Futagami, M.; Mizunuma, H. Decreased expression of carbonyl reductase 1 promotes ovarian cancer growth and proliferation. Int. J. Oncol. 2014, 46, 1252–1258. [Google Scholar] [CrossRef] [Green Version]
- Yun, M.; Choi, A.J.; Woo, S.R.; Noh, J.K.; Sung, J.-Y.; Lee, J.-W.; Eun, Y.-G. Inhibition of Carbonyl Reductase 1 Enhances Metastasis of Head and Neck Squamous Cell Carcinoma through β-catenin-Mediated Epithelial-Mesenchymal Transition. J. Cancer 2020, 11, 533–541. [Google Scholar] [CrossRef] [Green Version]
- Yamanouchi, R.; Harada, K.; Ferdous, T.; Ueyama, Y. Low carbonyl reductase 1 expression is associated with poor prognosis in patients with oral squamous cell carcinoma. Mol. Clin. Oncol. 2018, 8, 400–406. [Google Scholar] [CrossRef]
- Zhang, M.; Wang, Y.; Jiang, L.; Song, X.; Zheng, A.; Gao, H.; Wei, M.; Zhao, L. LncRNA CBR3-AS1 regulates of breast cancer drug sensitivity as a competing endogenous RNA through the JNK1/MEK4-mediated MAPK signal pathway. J. Exp. Clin. Cancer Res. 2021, 40, 41. [Google Scholar] [CrossRef] [PubMed]
- Liu, S.; Zhan, N.; Gao, C.; Xu, P.; Wang, H.; Wang, S.; Piao, S.; Jing, S. Long noncoding RNA CBR3-AS1 mediates tumorigenesis and radiosensitivity of non-small cell lung cancer through redox and DNA repair by CBR3-AS1 /miR-409-3p/SOD1 axis. Cancer Lett. 2021, 526, 1–11. [Google Scholar] [CrossRef] [PubMed]
- Zhou, Q.; Ding, W.; Weng, Y.; Ding, G.; Xia, G.; Xu, J.; Xu, K.; Ding, Q. NOS3 895G>T and CBR3 730G>A Are Associated with Recurrence Risk in Non-Muscle-Invasive Bladder Cancer with Intravesical Instillations of THP. Chemotherapy 2018, 63, 191–197. [Google Scholar] [CrossRef] [PubMed]
- Misawa, K.; Mima, M.; Satoshi, Y.; Imai, A.; Mochizuki, D.; Ishikawa, R.; Kita, J.; Yamaguchi, Y.; Endo, S.; Misawa, Y.; et al. Prostanoid receptor genes confer poor prognosis in head and neck squamous cell carcinoma via epigenetic inactivation. J. Transl. Med. 2020, 18, 31. [Google Scholar] [CrossRef] [PubMed]
- Misawa, K.; Imai, A.; Kanazawa, T.; Mima, M.; Yamada, S.; Mochizuki, D.; Yamada, T.; Shinmura, D.; Ishikawa, R.; Kita, J.; et al. G Protein-Coupled Receptor Genes, PTGDR1, PTGDR2, and PTGIR, are Candidate Epigenetic Biomarkers and Predictors for Treated Patients with HPV-Associated Oropharyngeal Cancer. Microorganisms 2020, 8, 1504. [Google Scholar] [CrossRef] [PubMed]
- O’Sullivan, A.G.; Mulvaney, E.P.; Kinsella, B.T. Regulation of protein kinase C-related kinase (PRK) signalling by the TPα and TPβ isoforms of the human thromboxane A 2 receptor: Implications for thromboxane- and androgen- dependent neoplastic and epigenetic responses in prostate cancer. Biochim. Biophys. Acta 2017, 1863, 838–856. [Google Scholar] [CrossRef]
- Werfel, T.A.; Hicks, D.J.; Rahman, B.; Bendeman, W.E.; Duvernay, M.T.; Maeng, J.G.; Hamm, H.; Lavieri, R.R.; Joly, M.M.; Pulley, J.M.; et al. Repurposing of a Thromboxane Receptor Inhibitor Based on a Novel Role in Metastasis Identified by Phenome-Wide Association Study. Mol. Cancer Ther. 2020, 19, 2454–2464. [Google Scholar] [CrossRef]
- Orr, K.; Buckley, N.; Haddock, P.; James, C.; Parent, J.-L.; McQuaid, S.; Mullan, P.B. Thromboxane A2 receptor (TBXA2R) is a potent survival factor for triple negative breast cancers (TNBCs). Oncotarget 2016, 7, 55458–55472. [Google Scholar] [CrossRef] [Green Version]
- Mulvaney, E.P.; Shilling, C.; Eivers, S.B.; Perry, A.S.; Bjartell, A.; Kay, E.W.; Watson, R.W.; Kinsella, B.T. Expression of the TPα and TPβ isoforms of the thromboxane prostanoid receptor (TP) in prostate cancer: Clinical significance and diagnostic potential. Oncotarget 2016, 7, 73171–73187. [Google Scholar] [CrossRef] [Green Version]
- Dash, P.; Ghatak, S.; Topi, G.; Satapathy, S.R.; Ek, F.; Hellman, K.; Olsson, R.; Mehdawi, L.M.; Sjölander, A. High PGD2 receptor 2 levels are associated with poor prognosis in colorectal cancer patients and induce VEGF expression in colon cancer cells and migration in a zebrafish xenograft model. Br. J. Cancer 2021, 126, 586–597. [Google Scholar] [CrossRef]
- Lv, J.; Li, L. Hub Genes and Key Pathway Identification in Colorectal Cancer Based on Bioinformatic Analysis. Biomed Res. Int. 2019, 2019, 1545680. [Google Scholar] [CrossRef] [PubMed] [Green Version]
- Fu, C.; Mao, W.; Gao, R.; Deng, Y.; Gao, L.; Wu, J.; Zhang, S.; Shen, Y.; Liu, K.; Li, Q.; et al. Prostaglandin F2α-PTGFR signaling promotes proliferation of endometrial epithelial cells of cattle through cell cycle regulation. Anim. Reprod. Sci. 2020, 213, 106276. [Google Scholar] [CrossRef] [PubMed]
- Alkhateeb, A.; Rezaeian, I.; Singireddy, S.; Cavallo-Medved, D.; Porter, L.A.; Rueda, L. Transcriptomics Signature from Next-Generation Sequencing Data Reveals New Transcriptomic Biomarkers Related to Prostate Cancer. Cancer Inform. 2019, 18, 1176935119835522. [Google Scholar] [CrossRef] [PubMed] [Green Version]
- Akiyama, K.; Ohga, N.; Maishi, N.; Hida, Y.; Kitayama, K.; Kawamoto, T.; Osawa, T.; Suzuki, Y.; Shinohara, N.; Nonomura, K.; et al. The F-prostaglandin receptor is a novel marker for tumor endothelial cells in renal cell carcinoma. Pathol. Int. 2013, 63, 37–44. [Google Scholar] [CrossRef] [PubMed]
- Anderson, K.S.; Cramer, D.W.; Sibani, S.; Wallstrom, G.; Wong, J.; Park, J.; Qiu, J.; Vitonis, A.; LaBaer, J. Autoantibody Signature for the Serologic Detection of Ovarian Cancer. J. Proteome Res. 2015, 14, 578–586. [Google Scholar] [CrossRef] [Green Version]
- Jiménez-Segovia, A.; Mota, A.; Rojo-Sebastián, A.; Barrocal, B.; Rynne-Vidal, A.; García-Bermejo, M.-L.; Gómez-Bris, R.; Hawinkels, L.J.; Sandoval, P.; Garcia-Escudero, R.; et al. Prostaglandin F2α-induced Prostate Transmembrane Protein, Androgen Induced 1 mediates ovarian cancer progression increasing epithelial plasticity. Neoplasia 2019, 21, 1073–1084. [Google Scholar] [CrossRef]
- Masato, M.; Miyata, Y.; Kurata, H.; Ito, H.; Mitsunari, K.; Asai, A.; Nakamura, Y.; Araki, K.; Mukae, Y.; Matsuda, T.; et al. Oral administration of E-type prostanoid (EP) 1 receptor antagonist suppresses carcinogenesis and development of prostate cancer via upregulation of apoptosis in an animal model. Sci. Rep. 2021, 11, 20279. [Google Scholar] [CrossRef]
- Asting, A.G.; Iresjö, B.-M.; Nilsberth, C.; Smedh, U.; Lundholm, K. Host knockout of E-prostanoid 2 receptors reduces tumor growth and causes major alterations of gene expression in prostaglandin E2-producing tumors. Oncol. Lett. 2016, 13, 476–482. [Google Scholar] [CrossRef] [Green Version]
- Heidegger, H.; Dietlmeier, S.; Ye, Y.; Kuhn, C.; Vattai, A.; Aberl, C.; Jeschke, U.; Mahner, S.; Kost, B. The Prostaglandin EP3 Receptor Is an Independent Negative Prognostic Factor for Cervical Cancer Patients. Int. J. Mol. Sci. 2017, 18, 1571. [Google Scholar] [CrossRef] [Green Version]
- Czogalla, B.; Kuhn, C.; Heublein, S.; Schmöckel, E.; Mayr, D.; Kolben, T.; Trillsch, F.; Burges, A.; Mahner, S.; Jeschke, U.; et al. EP3 receptor is a prognostic factor in TA-MUC1-negative ovarian cancer. J. Cancer Res. Clin. Oncol. 2019, 145, 2519–2527. [Google Scholar] [CrossRef]
- Linares, G.D.P.; Opperman, R.; Majumder, M.; Lala, P. Prostaglandin E2 Receptor 4 (EP4) as a Therapeutic Target to Impede Breast Cancer-Associated Angiogenesis and Lymphangiogenesis. Cancers 2021, 13, 942. [Google Scholar] [CrossRef] [PubMed]
- Schotten, L.M.; Darwiche, K.; Seweryn, M.; Yildiz, V.; Kneuertz, P.J.; Eberhardt, W.E.; Eisenmann, S.; Welter, S.; Sisson, B.E.; Pietrzak, M.; et al. DNA methylation of PTGER4 in peripheral blood plasma helps to distinguish between lung cancer, benign pulmonary nodules and chronic obstructive pulmonary disease patients. Eur. J. Cancer 2021, 147, 142–150. [Google Scholar] [CrossRef] [PubMed]
- Zhang, Y.; Huang, J.; Zou, Q.; Che, J.; Yang, K.; Fan, Q.; Qian, D.; Wu, J.; Bao, E.; Song, L.; et al. Methylated PTGER4 is better than CA125, CEA, Cyfra211 and NSE as a therapeutic response assessment marker in stage IV lung cancer. Oncol. Lett. 2020, 19, 3229–3238. [Google Scholar] [CrossRef] [PubMed]
- Hiken, J.F.; McDonald, J.I.; Decker, K.F.; Sanchez, C.; Hoog, J.; VanderKraats, N.D.; Jung, K.L.; Akinhanmi, M.; Rois, L.E.; Ellis, M.J.; et al. Epigenetic activation of the prostaglandin receptor EP4 promotes resistance to endocrine therapy for breast cancer. Oncogene 2016, 36, 2319–2327. [Google Scholar] [CrossRef] [Green Version]
- Sinha, N.; Gaston, D.; Manders, D.; Goudie, M.; Matsuoka, M.; Xie, T.; Huang, W.-Y. Characterization of genome-wide copy number aberrations in colonic mixed adenoneuroendocrine carcinoma and neuroendocrine carcinoma reveals recurrent amplification of PTGER4 and MYC genes. Hum. Pathol. 2018, 73, 16–25. [Google Scholar] [CrossRef]
- Bruno, A.; Di Francesco, L.; Coletta, I.; Mangano, G.; Alisi, M.A.; Polenzani, L.; Milanese, C.; Anzellotti, P.; Ricciotti, E.; Dovizio, M.; et al. Effects of AF3442 [N-(9-ethyl-9H-carbazol-3-yl)-2-(trifluoromethyl)benzamide], a novel inhibitor of human microsomal prostaglandin E synthase-1, on prostanoid biosynthesis in human monocytes in vitro. Biochem. Pharmacol. 2010, 79, 974–981. [Google Scholar] [CrossRef] [Green Version]
- Powell, W.S. Eicosanoid receptors as therapeutic targets for asthma. Clin. Sci. 2021, 135, 1945–1980. [Google Scholar] [CrossRef]
- Pang, J.; Qi, X.; Luo, Y.; Li, X.; Shu, T.; Li, B.; Song, M.; Liu, Y.; Wei, D.; Chen, J.; et al. Multi-omics study of silicosis reveals the potential therapeutic targets PGD2 and TXA2. Theranostics 2021, 11, 2381–2394. [Google Scholar] [CrossRef]
- The Cancer Genome Atlas Research Network; Weinstein, J.N.; Collisson, E.A.; Mills, G.B.; Shaw, K.R.M.; Ozenberger, B.A.; Ellrott, K.; Shmulevich, I.; Sander, C.; Stuart, J.M. The Cancer Genome Atlas Pan-Cancer analysis project. Nat. Genet. 2013, 45, 1113–1120. [Google Scholar] [CrossRef]
- Tang, Z.; Kang, B.; Li, C.; Chen, T.; Zhang, Z. GEPIA2: An enhanced web server for large-scale expression profiling and interactive analysis. Nucleic Acids Res. 2019, 47, W556–W560. [Google Scholar] [CrossRef] [Green Version]
- Chandrashekar, D.S.; Bashel, B.; Balasubramanya, S.A.H.; Creighton, C.J.; Ponce-Rodriguez, I.; Chakravarthi, B.V.S.K.; Varambally, S. UALCAN: A portal for facilitating tumor subgroup gene expression and survival analyses. Neoplasia 2017, 19, 649–658. [Google Scholar] [CrossRef] [PubMed]
- Nagy, Á.; Munkácsy, G.; Győrffy, B. Pancancer survival analysis of cancer hallmark genes. Sci. Rep. 2021, 11, 6047. [Google Scholar] [CrossRef] [PubMed]
- Fekete, J.T.; Győrffy, B. ROCplot.org: Validating predictive biomarkers of chemotherapy/hormonal therapy/anti-HER2 therapy using transcriptomic data of 3,104 breast cancer patients. Int. J. Cancer 2019, 145, 3140–3151. [Google Scholar] [CrossRef] [PubMed]
- Fekete, J.T.; Ősz, Á.; Pete, I.; Nagy, G.R.; Vereczkey, I.; Győrffy, B. Predictive biomarkers of platinum and taxane resistance using the transcriptomic data of 1816 ovarian cancer patients. Gynecol. Oncol. 2020, 156, 654–661. [Google Scholar] [CrossRef] [PubMed]
- Menyhárt, O.; Fekete, J.T.; Győrffy, B. Gene expression-based biomarkers designating glioblastomas resistant to multiple treatment strategies. Carcinogenesis 2021, 42, 804–813. [Google Scholar] [CrossRef]
- Gao, J.; Aksoy, B.A.; Dogrusoz, U.; Dresdner, G.; Gross, B.E.; Sumer, S.O.; Sun, Y.; Jacobsen, A.; Sinha, R.; Larsson, E.; et al. Integrative Analysis of Complex Cancer Genomics and Clinical Profiles Using the cBioPortal. Sci. Signal. 2013, 6, pl1. [Google Scholar] [CrossRef] [Green Version]
- Cerami, E.; Gao, J.; Dogrusoz, U.; Gross, B.E.; Sumer, S.O.; Aksoy, B.A.; Jacobsen, A.; Byrne, C.J.; Heuer, M.L.; Larsson, E.; et al. The cBio cancer genomics portal: An open platform for exploring multidimensional cancer genomics data. Cancer Discov. 2012, 2, 401–404. [Google Scholar] [CrossRef] [Green Version]
- Nagy, Á.; Győrffy, B. muTarget: A platform linking gene expression changes and mutation status in solid tumors. Int. J. Cancer 2021, 148, 502–511. [Google Scholar] [CrossRef]
- Wang, J.; Duncan, D.; Shi, Z.; Zhang, B. WEB-based GEne SeT AnaLysis Toolkit (WebGestalt): Update 2013. Nucleic Acids Res. 2013, 41, W77–W83. [Google Scholar] [CrossRef] [Green Version]
- Liao, Y.; Wang, J.; Jaehnig, E.J.; Shi, Z.; Zhang, B. WebGestalt 2019: Gene set analysis toolkit with revamped UIs and APIs. Nucleic Acids Res. 2019, 47, W199–W205. [Google Scholar] [CrossRef] [Green Version]
- Zhang, Q.; Liu, W.; Zhang, H.-M.; Xie, G.-Y.; Miao, Y.-R.; Xia, M.; Guo, A.-Y. hTFtarget: A Comprehensive Database for Regulations of Human Transcription Factors and Their Targets. Genom. Proteom. Bioinform. 2020, 18, 120–128. [Google Scholar] [CrossRef] [PubMed]
- Sondka, Z.; Bamford, S.; Cole, C.G.; Ward, S.A.; Dunham, I.; Forbes, S.A. The COSMIC Cancer Gene Census: Describing genetic dysfunction across all human cancers. Nat. Rev. Cancer 2018, 18, 696–705. [Google Scholar] [CrossRef] [PubMed]
- Wu, W.-S.; Tu, B.-W.; Chen, T.-T.; Hou, S.-W.; Tseng, J.T. CSmiRTar: Condition-Specific microRNA targets database. PLoS ONE 2017, 12, e0181231. [Google Scholar] [CrossRef] [PubMed] [Green Version]
- Sarver, A.L.; Sarver, A.E.; Yuan, C.; Subramanian, S. OMCD: OncomiR Cancer Database. BMC Cancer 2018, 18, 1223. [Google Scholar] [CrossRef] [Green Version]
- Men, C.; Chai, H.; Song, X.; Li, Y.; Du, H.; Ren, Q. Identification of DNA methylation associated gene signatures in endometrial cancer via integrated analysis of DNA methylation and gene expression systematically. J. Gynecol. Oncol. 2017, 28, e83. [Google Scholar] [CrossRef] [Green Version]
- Shinawi, T.; Hill, V.K.; Krex, D.; Schackert, G.; Gentle, D.; Morris, M.R.; Wei, W.; Cruickshank, G.; Maher, E.R.; Latif, F. DNA methylation profiles of long- and short-term glioblastoma survivors. Epigenetics 2013, 8, 149–156. [Google Scholar] [CrossRef] [Green Version]
- Sjöstedt, E.; Zhong, W.; Fagerberg, L.; Karlsson, M.; Mitsios, N.; Adori, C.; Oksvold, P.; Edfors, F.; Limiszewska, A.; Hikmet, F.; et al. An atlas of the protein-coding genes in the human, pig, and mouse brain. Science 2020, 367. [Google Scholar] [CrossRef]
- Chen, F.; Chandrashekar, D.S.; Varambally, S.; Creighton, C.J. Pan-cancer molecular subtypes revealed by mass-spectrometry-based proteomic characterization of more than 500 human cancers. Nat. Commun. 2019, 10, 5679. [Google Scholar] [CrossRef] [Green Version]
- Oughtred, R.; Rust, J.; Chang, C.; Breitkreutz, B.; Stark, C.; Willems, A.; Boucher, L.; Leung, G.; Kolas, N.; Zhang, F.; et al. The BioGRID database: A comprehensive biomedical resource of curated protein, genetic, and chemical interactions. Protein Sci. 2021, 30, 187–200. [Google Scholar] [CrossRef]
- Binder, J.X.; Pletscher-Frankild, S.; Tsafou, K.; Stolte, C.; O’Donoghue, S.; Schneider, R.; Jensen, L.J. Compartments: Unification and visualization of protein subcellular localization evidence. Database 2014, 2014, bau012. [Google Scholar] [CrossRef] [Green Version]
- Szklarczyk, D.; Gable, A.L.; Nastou, K.C.; Lyon, D.; Kirsch, R.; Pyysalo, S.; Doncheva, N.T.; Legeay, M.; Fang, T.; Bork, P.; et al. The STRING database in 2021: Customizable protein–protein networks, and functional characterization of user-uploaded gene/measurement sets. Nucleic Acids Res. 2021, 49, D605–D612. [Google Scholar] [CrossRef] [PubMed]
- Shannon, P.; Markiel, A.; Ozier, O.; Baliga, N.S.; Wang, J.T.; Ramage, D.; Amin, N.; Schwikowski, B.; Ideker, T. Cytoscape: A software environment for integrated models of Biomolecular Interaction Networks. Genome Res. 2003, 13, 2498–2504. [Google Scholar] [CrossRef] [PubMed]
- Metsalu, T.; Vilo, J. ClustVis: A web tool for visualizing clustering of multivariate data using Principal Component Analysis and heatmap. Nucleic Acids Res. 2015, 43, W566–W570. [Google Scholar] [CrossRef] [PubMed]
- Tsherniak, A.; Vazquez, F.; Montgomery, P.G.; Weir, B.A.; Kryukov, G.; Cowley, G.S.; Gill, S.; Harrington, W.F.; Pantel, S.; Krill-Burger, J.; et al. Defining a Cancer Dependency Map. Cell 2017, 170, 564–576.e16. [Google Scholar] [CrossRef] [PubMed] [Green Version]
- Falcetti, E.; Hall, S.M.; Phillips, P.G.; Patel, J.; Morrell, N.W.; Haworth, S.G.; Clapp, L.H. Smooth Muscle Proliferation and Role of the Prostacyclin (IP) Receptor in Idiopathic Pulmonary Arterial Hypertension. Am. J. Respir. Crit. Care Med. 2010, 182, 1161–1170. [Google Scholar] [CrossRef] [Green Version]
- Fetalvero, K.M.; Shyu, M.; Nomikos, A.P.; Chiu, Y.-F.; Wagner, R.J.; Powell, R.J.; Hwa, J.; Martin, K.A. The prostacyclin receptor induces human vascular smooth muscle cell differentiation via the protein kinase A pathway. Am. J. Physiol. Heart. Circ. Physiol. 2006, 290, H1337–H1346. [Google Scholar] [CrossRef]
- Kawada, N.; Klein, H.; Decker, K. Eicosanoid-mediated contractility of hepatic stellate cells. Biochem. J. 1992, 285, 367–371. [Google Scholar] [CrossRef] [Green Version]
- Kabashima, K.; Murata, T.; Tanaka, H.; Matsuoka, T.; Sakata, D.; Yoshida, N.; Katagiri, K.; Kinashi, T.; Tanaka, T.; Miyasaka, M.; et al. Thromboxane A2 modulates interaction of dendritic cells and T cells and regulates acquired immunity. Nat. Immunol. 2003, 4, 694–701. [Google Scholar] [CrossRef]
- Moalli, F.; Cupovic, J.; Thelen, F.; Halbherr, P.; Fukui, Y.; Narumiya, S.; Ludewig, B.; Stein, J.V. Thromboxane A2 acts as tonic immunoregulator by preferential disruption of low-avidity CD4+ T cell–dendritic cell interactions. J. Exp. Med. 2014, 211, 2507–2517. [Google Scholar] [CrossRef] [Green Version]
- Fan, Z.; Duan, J.; Wang, L.; Xiao, S.; Li, L.; Yan, X.; Yao, W.; Wu, L.; Zhang, S.; Zhang, Y.; et al. PTK2 promotes cancer stem cell traits in hepatocellular carcinoma by activating Wnt/β-catenin signaling. Cancer Lett. 2019, 450, 132–143. [Google Scholar] [CrossRef]
- Wilson, S.; Filipp, F.V. A network of epigenomic and transcriptional cooperation encompassing an epigenomic master regulator in cancer. NPJ Syst. Biol. Appl. 2018, 4, 24. [Google Scholar] [CrossRef] [PubMed]
- Slamon, D.J.; Clark, G.M.; Wong, S.G.; Levin, W.J.; Ullrich, A.; McGuire, W.L. Human breast cancer: Correlation of relapse and survival with amplification of the HER-2/neu oncogene. Science 1987, 235, 177–182. [Google Scholar] [CrossRef] [PubMed] [Green Version]
- Slamon, D.J.; Godolphin, W.; Jones, L.A.; Holt, J.A.; Wong, S.G.; Keith, D.E.; Levin, W.J.; Stuart, S.G.; Udove, J.; Ullrich, A.; et al. Studies of the HER-2/neu proto-oncogene in human breast and ovarian cancer. Science 1989, 244, 707–712. [Google Scholar] [CrossRef] [PubMed]
- Rauluseviciute, I.; Drabløs, F.; Rye, M.B. DNA hypermethylation associated with upregulated gene expression in prostate cancer demonstrates the diversity of epigenetic regulation. BMC Med. Genom. 2020, 13, 6–15. [Google Scholar] [CrossRef]
- Chen, L.; Cao, Y.; Rong, D.; Wang, Y.; Cao, Y. MicroRNA-605 functions as a tumor suppressor by targeting INPP4B in melanoma. Oncol. Rep. 2017, 38, 1276–1286. [Google Scholar] [CrossRef] [PubMed] [Green Version]
- Yan, X.; Liu, X.; Wang, Z.; Cheng, Q.; Ji, G.; Yang, H.; Wan, L.; Ge, C.; Zeng, Q.; Huang, H.; et al. MicroRNA-486-5p functions as a tumor suppressor of proliferation and cancer stem-like cell properties by targeting Sirt1 in liver cancer. Oncol. Rep. 2018, 41, 1938–1948. [Google Scholar] [CrossRef] [PubMed] [Green Version]
- Qu, X.; Gao, D.; Ren, Q.; Jiang, X.; Bai, J.; Sheng, L. miR-211 inhibits proliferation, invasion and migration of cervical cancer via targeting SPARC. Oncol. Lett. 2018, 16, 853–860. [Google Scholar] [CrossRef] [Green Version]
- Gupta, R.; Malvi, P.; Parajuli, K.R.; Janostiak, R.; Bugide, S.; Cai, G.; Zhu, L.J.; Green, M.R.; Wajapeyee, N. KLF7 promotes pancreatic cancer growth and metastasis by up-regulating ISG expression and maintaining Golgi complex integrity. Proc. Natl. Acad. Sci. USA 2020, 117, 12341–12351. [Google Scholar] [CrossRef]
- Lai, Q.; Li, Q.; He, C.; Fang, Y.; Lin, S.; Cai, J.; Ding, J.; Zhong, Q.; Zhang, Y.; Wu, C.; et al. CTCF promotes colorectal cancer cell proliferation and chemotherapy resistance to 5-FU via the P53-Hedgehog axis. Aging 2020, 12, 16270–16293. [Google Scholar] [CrossRef]
- Xu, X.; Wu, Y.; Yi, K.; Hu, Y.; Ding, W.; Xing, C. IRF1 regulates the progression of colorectal cancer via interferon-induced proteins. Int. J. Mol. Med. 2021, 47, 104. [Google Scholar] [CrossRef]
- Sava, G.; Perissin, L.; Zorzet, S.; Piccini, P.; Giraldi, T. Antimetastatic action of the prostacyclin analog Iloprost in the mouse. Clin. Exp. Metastasis 1989, 7, 671–678. [Google Scholar] [CrossRef] [PubMed]
- Menter, D.G.; Harkins, C.; Onoda, J.; Riorden, W.; Sloane, B.F.; Taylor, J.D.; Honn, K.V. Inhibition of tumor cell induced platelet aggregation by prostacyclin and carbacyclin: An ultrastructural study. Invasion Metastasis 1987, 7, 109–128. [Google Scholar] [PubMed]
- Kalfert, D.; Ludvikova, M.; Pesta, M.; Ludvik, J.; Dostalova, L.; Kholová, I. Multifunctional Roles of miR-34a in Cancer: A Review with the Emphasis on Head and Neck Squamous Cell Carcinoma and Thyroid Cancer with Clinical Implications. Diagnostics 2020, 10, 563. [Google Scholar] [CrossRef] [PubMed]
- Li, Y.-Q.; Ren, X.; He, Q.-M.; Xu, Y.-F.; Tang, X.-R.; Sun, Y.; Zeng, M.-S.; Kang, T.-B.; Liu, N.; Ma, J. MiR-34c suppresses tumor growth and metastasis in nasopharyngeal carcinoma by targeting MET. Cell Death Dis. 2015, 6, e1618. [Google Scholar] [CrossRef] [Green Version]
- Sun, C.; Huang, C.; Li, S.; Yang, C.; Xi, Y.; Wang, L.; Zhang, F.; Fu, Y.; Li, D. Hsa-miR-326 targets CCND1 and inhibits non-small cell lung cancer development. Oncotarget 2016, 7, 8341–8359. [Google Scholar] [CrossRef] [Green Version]
- Geng, R.; Zheng, Y.; Zhou, D.; Li, Q.; Li, R.; Guo, X. ZBTB7A, a potential biomarker for prognosis and immune infiltrates, inhibits progression of endometrial cancer based on bioinformatics analysis and experiments. Cancer Cell Int. 2020, 20, 542. [Google Scholar] [CrossRef]
- Ershov, P.V.; Mezentsev, Y.V.; Kopylov, A.T.; Yablokov, E.O.; Svirid, A.; Lushchyk, A.Y.; Kaluzhskiy, L.A.; Gilep, A.A.; Usanov, S.A.; Medvedev, A.E.; et al. Affinity Isolation and Mass Spectrometry Identification of Prostacyclin Synthase (PTGIS) Subinteractome. Biology 2019, 8, 49. [Google Scholar] [CrossRef] [Green Version]
- Skogastierna, C.; Björkhem-Bergman, L.; Bergman, P.; Eliasson, E.; Rane, A.; Ekström, L. Influence of Simvastatin on the Thromboxane and Prostacyclin Pathways, In Vitro and In Vivo. J. Cardiovasc. Pharmacol. 2013, 61, 1–7. [Google Scholar] [CrossRef]
- Levine, L. Statins stimulate arachidonic acid release and prostaglandin I2 production in rat liver cells. Lipids Health Dis. 2003, 2, 1. [Google Scholar] [CrossRef]
- Chiefari, E.; Mirabelli, M.; La Vignera, S.; Tanyolaç, S.; Foti, D.P.; Aversa, A.; Brunetti, A. Insulin Resistance and Cancer: In Search for a Causal Link. Int. J. Mol. Sci. 2021, 22, 11137. [Google Scholar] [CrossRef]
- Kobayashi, T.; Nakatani, Y.; Tanioka, T.; Tsujimoto, M.; Nakajo, S.; Nakaya, K.; Murakami, M.; Kudo, I. Regulation of cytosolic prostaglandin E synthase by phosphorylation. Biochem. J. 2004, 381, 59–69. [Google Scholar] [CrossRef] [PubMed] [Green Version]
- Neuschäfer-Rube, F.; Hermosilla, R.; Rehwald, M.; Rönnstrand, L.; Schülein, R.; Wernstedt, C.; Püschel, G.P. Identification of a Ser/Thr cluster in the C-terminal domain of the human prostaglandin receptor EP4 that is essential for agonist-induced beta-arrestin1 recruitment but differs from the apparent principal phosphorylation site. Biochem. J. 2004, 379, 573–585. [Google Scholar] [CrossRef] [PubMed]
- Smyth, E.M.; Li, W.H.; FitzGerald, G.A. Phosphorylation of the Prostacyclin Receptor during Homologous Desensitization. J. Biol. Chem. 1998, 273, 23258–23266. [Google Scholar] [CrossRef] [PubMed] [Green Version]


| Cancer | Tissue-Specific Master Regulators |
|---|---|
| Breast cancer | BRD4 ▬, CTCF ▬, EP300 ▬, FOXA1 ▲▲, SPI1 ▬ |
| Brain cancer | POLR2A▬, SPI1 ▲▲▲ |
| Colorectal cancer | CTCF ▬, SP1▬ |
| Esophageal cancer | KDM4C ▬ |
| Kidney cancer | AR▲, RNF2▬, SPI1 ▲, ZNF263▬ |
| Liver cancer | FOXA2▬, HNF4A▬, MAX▬ |
| Lung cancer | LMNB1▲, MAZ▬, RELA▬, SPI1 ▼ |
| Pancreatic cancer | CTCF ▲, POLR2A▬ |
| Prostate cancer | AR▬, FOXA1 ▲ |
| Skin cancer | CTCF ▬, SPI1 ▲ |
| Stomach cancer | KLF5▲▲▲, SPI1 ▲ |
| Uterine cancer | NFIC▼, ZBTB7A ▼ |
| Tumor | BRCA | COAD | LUAD | OV | UCES | |||||
|---|---|---|---|---|---|---|---|---|---|---|
| Gene Names | TCGA | CPTAC | TCGA | CPTAC | TCGA | CPTAC | TCGA | CPTAC | TCGA | CPTAC |
| TBXAS1 | ▬ | ▬ | ▲ | ▲ | ▬ | ▬ | ▬ | ▬ | ▬ | ▬ |
| PTGIS | ▼ | ▼ | ▼ | ▼ | ▼ | ▼ | ▼ | ▼ | ▼ | ▼ |
| PTGDS | ▼ | ▼ | ▼ | ▼ | ▼ | ▼ | ▲ | ▼ | ▼ | ▼ |
| PTGES | ▬ | ▬ | ▬ | ▬ | ▲ | ▲ | ▬ | ▬ | ▬ | ▬ |
| PTGES3 | ▬ | ▬ | ▲ | ▲ | ▬ | ▬ | ▬ | ▬ | ▬ | ▬ |
| PRXL2B | ▲ | ▬ | ▲ | ▼ | ▬ | ▬ | ▲ | ▬ | ▬ | ▬ |
| AKR1C3 | ▼ | ▼ | ▬ | ▬ | ▬ | ▬ | ▼ | ▼ | ▬ | ▬ |
| CBR3 | ▬ | ▬ | ▬ | ▬ | ▬ | ▬ | ▼ | ▼ | ▼ | ▼ |
| Gene Expression Signature | Tumors, Subgroups | Hazard Ratio (CI), Logrank p-Value | Quartile, Survival (Months) Low-High Expression Cohorts | Signature Specificity Compared to Different Tumors |
|---|---|---|---|---|
| PTGIS, PTGDS, PTGFR, PTGER3 | BLCA | 2.1 (1.4–3.2), 9.2 × 10⁻⁵ | Q1, 21–12 | KIRP |
| BLCA, male gender | 2.5 (1.6–4.0), 7.3 × 10⁻⁵ | Q1, 22–12 | not found | |
| BLCA, stage 3 | 2.2 (1.0–4.7), 0.034 | Q1, 21–13 | not found | |
| PTGDS, CBR3, PTGIR PTGFR, PTGDR2, PTGER3 | HNSC | 0.6 (0.4–0.8), 0.00032 | Q1, 26–59 | BRCA, CESC, LUAD, SARC, UCES |
| HNSC, male gender, high mutation burden | 0.4 (0.2–0.8), 0.0058 | Q1, 13–47 | not found | |
| HNSC, male gender, low mutation burden | 0.5 (0.3–0.8), 0.0031 | Q1, 12–23 | not found | |
| HNSC, stage 3 | 0.2 (0.1–0.6), 0.00058 | Q1, 11–57 | not found | |
| PTGDS, AKR1C3, CBR1, CBR3, PTGDR, PTGDR2, PTGER2, PTGER4 | CESK | 0.5 (0.3–0.8), 0.0067 | Median, NA–NA | SARC |
| CESK, female gender, white race | 0.4 (0.2–0.8), 0.0027 | Q1, 21–42 | not found | |
| TBXAS1, PTGDS, AKR1C3, PTGIS, CBR3, TBXA2R, PTGDR, PTGFR, PTGER3, PTGER4 | SARC | 0.5 (0.3–0.7), 00026 | Q1, 16–37 | BRCA, CESK, |
| SARC, high mutation burden | 0.4 (0.2–0.7), 0.00043 | Q1, 11–37 | not found | |
| SARC, low mutation burden | 0.4 (0.2–0.7), 0.0023 | Q1, 17–41 | not found | |
| PTGER1, PTGER3, PTGER4 | UCES | 2.3 (1.5–3.5), 0.00012 | Median, NA–NA | not found |
| UCES, grade 3 | 2.0 (1.2–3.3), 0.0075 | Q1, 60–29 | not found | |
| PTGDS, PTGDR2 | LUAD | 0.4 (0.3–0.6), 4 × 10⁻⁵ | Q1, 21–42 | CESK, SARC |
| TBXAS1, PTGDS, AKR1C3, PTGIS, CBR3, TBXA2R, PTGDR, PTGFR, PTGER3, PTGER4 | LIHC | 2.2 (1.5–3.1), 1.5 × 10⁻⁵ | Q1, 28–10 | KIRP |
| PTGES2, PTGES3, PRXL2B, AKR1C3, PTGES | LIHC | 2.2 (1.5–3.1), 1.3 × 10⁻⁵ | Q1, 27–11 | LUAD, PAAD |
| LIHC, female gender | 2.7 (1.5–5.0), 0.00059 | Q1, 30–9 | not found | |
| LIHC, male gender | 2.4 (1.5–3.7), 9.2 × 10⁻⁵ | Q1, 28–10 | not found | |
| LIHC, grade 3 | 2.9 (1.5–5.8), 0.0014 | Q1, 50–12 | not found | |
| LIHC, high mutation burden | 2.7 (1.6–4.4), 5.8 × 10⁻⁵ | Q1, 60–14 | not found | |
| LIHC, low mutation burden | 2.0 (1.1–3.4), 0.015 | Q1, 26–20 | not found | |
| PTGIS, PTGDS, PTGES3, AKR1C3, CBR3, TBXA2R, PTGDR, PTGER1, PTGFR, PTGER3 | KIRP | 5.1 (2.7–9.7), 3.4 × 10⁻¹⁰ | Median, NA–NA | not found |
| KIRP, low mutation burden | 10.1 (3.6–28.3), 5.4 × 10⁻⁸ | Median, NA–NA | not found |
Publisher’s Note: MDPI stays neutral with regard to jurisdictional claims in published maps and institutional affiliations. |
© 2022 by the authors. Licensee MDPI, Basel, Switzerland. This article is an open access article distributed under the terms and conditions of the Creative Commons Attribution (CC BY) license (https://creativecommons.org/licenses/by/4.0/).
Share and Cite
Ershov, P.V.; Yablokov, E.O.; Kaluzhskiy, L.A.; Mezentsev, Y.V.; Ivanov, A.S. Prostanoid Signaling in Cancers: Expression and Regulation Patterns of Enzymes and Receptors. Biology 2022, 11, 590. https://doi.org/10.3390/biology11040590
Ershov PV, Yablokov EO, Kaluzhskiy LA, Mezentsev YV, Ivanov AS. Prostanoid Signaling in Cancers: Expression and Regulation Patterns of Enzymes and Receptors. Biology. 2022; 11(4):590. https://doi.org/10.3390/biology11040590
Chicago/Turabian StyleErshov, Pavel V., Evgeniy O. Yablokov, Leonid A. Kaluzhskiy, Yuri V. Mezentsev, and Alexis S. Ivanov. 2022. "Prostanoid Signaling in Cancers: Expression and Regulation Patterns of Enzymes and Receptors" Biology 11, no. 4: 590. https://doi.org/10.3390/biology11040590