
RNA-seq and Mitochondrial DNA Analysis of Adrenal Gland Metastatic Tissue in a Patient with Renal Cell Carcinoma

 , , ,
, , ,
Abstract
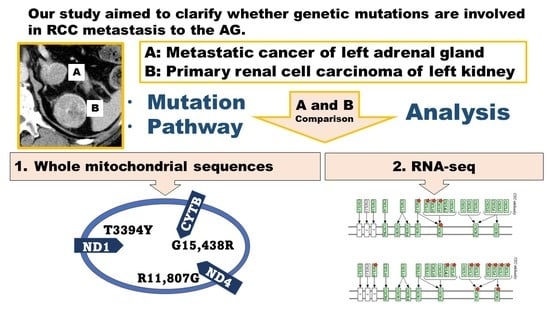
:Simple Summary
Abstract
1. Introduction
2. Materials and Methods
2.1. Case Description, Timeline, and Clinical Intervention
2.1.1. DNA Extraction
2.1.2. Extraction of DNA and RNA
2.1.3. Extraction of Mitochondrial DNA
2.2. PCR Amplification Conditions
2.3. Sequencing Analysis of Mitochondrial DNA
2.4. RNA-seq Analysis: Mapping and Expression Analysis
2.4.1. Sequencing Libraries
2.4.2. Sequencing (HiSeq2500 PE100)
2.4.3. Data Analysis (Human RNA-seq Tophat/Cufflinks)
2.5. RNA-seq Analysis and Gene Expression Analysis Based on DAVID
3. Results
3.1. Somatic Mutations in the Mitochondrial DNA Region
3.2. RNA-seq Analysis and Gene Expression Analysis Based on DAVID
3.3. Clinical Course after Surgery
4. Discussion
5. Conclusions
Supplementary Materials
Author Contributions
Funding
Institutional Review Board Statement
Informed Consent Statement
Data Availability Statement
Acknowledgments
Conflicts of Interest
References
- Kim, H.; Komiyama, T.; Inomoto, C.; Kamiguchi, H.; Kajiwara, H.; Kobayashi, H.; Nakamura, N.; Terachi, T.J. Mutations in the mitochondrial ND1 gene are associated with postoperative prognosis of localized renal cell carcinoma. Int. J. Mol. Sci. 2016, 17, 2049. [Google Scholar] [CrossRef] [PubMed]
- Kim, H.; Komiyama, T.; Nitta, M.; Kawamura, Y.; Hasegawa, M.; Shoji, S.; Orihashi, Y.; Inomoto, C.; Kajiwara, H.; Nakamura, N.; et al. D-loop mutations in renal cell carcinoma improve predictive accuracy for cancer-related death by integrating with mutations in the NADH dehydrogenase subunit 1 gene. Genes 2019, 10, 998. [Google Scholar] [CrossRef] [PubMed]
- Torchalla, P.; Czesak, M.; Osuch-Wójcikiewicz, E.J. Metastasis of clear cell renal cell carcinoma to the organs of the head and neck–an ongoing problem. Otolaryngol. Pol. 2021, 10, 42–48. [Google Scholar]
- Augustin, H.G.; Koh, G.Y. Organotypic vasculature: From descriptive heterogeneity to functional pathophysiology. Science 2017, 357, eaal2379. [Google Scholar] [CrossRef] [PubMed]
- Langley, R.R.; Fidler, I.J. Tumor cell-organ microenvironment interactions in the pathogenesis of cancer metastasis. Endocr. Rev. 2007, 28, 297–321. [Google Scholar] [CrossRef]
- Li, Y.; Ji, Z.; Wang, D.; Xie, Y. Bilateral adrenal metastasis of renal cell carcinoma 4 years after radical nephrectomy: A case report and review of literature. Medicine 2021, 100, e26838. [Google Scholar] [CrossRef]
- Roskoski, R., Jr. Vascular endothelial growth factor (VEGF) and VEGF receptor inhibitors in the treatment of renal cell carcinomas. Pharmacol. Res. 2017, 120, 116–132. [Google Scholar] [CrossRef]
- Graham, J.; Heng, D.Y. Real-world evidence in metastatic renal cell carcinoma. Tumori J. 2018, 104, 76–82. [Google Scholar] [CrossRef]
- Biles, M.J.; Patel, H.D.; Allaf, M.E. Cytoreductive nephrectomy in the era of tyrosine kinase and immuno-oncology checkpoint inhibitors. Urol. Clin. N. Am. 2020, 47, 359–370. [Google Scholar] [CrossRef]
- Goebell, P.J.; Ivanyi, P.; Bedke, J.; Bergmann, L.; Berthold, D.; Boegemann, M.; Busch, J.; Doehn, C.; Krege, S.; Retz, M.; et al. Consensus paper: Current state of first-and second-line therapy in advanced clear-cell renal cell carcinoma. Future Oncol. 2020, 16, 2307–2328. [Google Scholar] [CrossRef]
- Schmid, T.A.; Gore, M.E. Sunitinib in the treatment of metastatic renal cell carcinoma. Ther. Adv. Urol. 2016, 8, 348–371. [Google Scholar] [CrossRef] [PubMed]
- Janisch, F.; Klotzbücher, T.; Marks, P.; Kienapfel, C.; Meyer, C.P.; Yu, H.; Fühner, C.; Hillemacher, T.; Mori, K.; Mostafei, H.; et al. Predictive value of De Ritis ratio in metastatic renal cell carcinoma treated with tyrosine-kinase inhibitors. World J. Urol. 2021, 39, 2977–2985. [Google Scholar] [CrossRef] [PubMed]
- Vitale, M.G.; Bracarda, S.; Cosmai, L.; Crocetti, E.; Di Lorenzo, G.; Lapini, A.; Mandressi, A.; Martorana, G.; Masini, C.; Montironi, R.; et al. Management of kidney cancer patients: 2018 guidelines of the Italian Medical Oncology Association (AIOM). Tumori J. 2019, 105, 3–12. [Google Scholar] [CrossRef] [PubMed]
- Wong, S.E.; Quinn, D.I.; Bjarnason, G.A.; North, S.A.; Sridhar, S.S. Eligibility criteria and endpoints in metastatic renal cell carcinoma trials. Am. J. Clin. Oncol. 2020, 43, 559. [Google Scholar] [CrossRef]
- Arasaratnam, M.; Gurney, H. Nivolumab in the treatment of advanced renal cell carcinoma. Future Oncol. 2018, 14, 1679–1689. [Google Scholar] [CrossRef]
- Kim, H.; Inomoto, C.; Uchida, T.; Kajiwara, H.; Komiyama, T.; Kobayashi, H.; Nakamura, N.; Miyajima, A. Impact of rhabdoid differentiation on postoperative outcome for patients with N0M0 renal cell carcinoma. Urol. Oncol. 2019, 37, 711–720. [Google Scholar] [CrossRef]
- van der Mijn, J.C.; Mier, J.W.; Broxterman, H.J.; Verheul, H.M. Predictive biomarkers in renal cell cancer: Insights in drug resistance mechanisms. Drug Resist. Updates 2014, 17, 77–88. [Google Scholar] [CrossRef]
- Noon, A.P.; Vlatković, N.; Polański, R.; Maguire, M.; Shawki, H.; Parsons, K.; Boyd, M. p53 and MDM2 in renal cell carcinoma: Biomarkers for disease progression and future therapeutic targets? Cancer 2010, 116, 780–790. [Google Scholar] [CrossRef]
- Gossage, L.; Eisen, T. Alterations in VHL as potential biomarkers in renal-cell carcinoma. Nat. Rev. Clin. Oncol. 2010, 7, 277–288. [Google Scholar] [CrossRef]
- Braga, E.A.; Fridman, M.V.; Loginov, V.I.; Dmitriev, A.A.; Morozov, S. Molecular mechanisms in clear cell renal cell carcinoma: Role of miRNAs and hypermethylated miRNA genes in crucial oncogenic pathways and processes. Front. Genet. 2019, 10, 320. [Google Scholar] [CrossRef]
- Motzer, R.J.; Hutson, T.E.; Hudes, G.R.; Figlin, R.A.; Martini, J.-F.; English, P.A.; Huang, X.; Valota, O.; Williams, J. Investigation of novel circulating proteins, germ line single-nucleotide polymorphisms, and molecular tumor markers as potential efficacy biomarkers of first-line sunitinib therapy for advanced renal cell carcinoma. Cancer Chemother. Pharmacol. 2014, 74, 739–750. [Google Scholar] [CrossRef] [PubMed]
- Mihai, S.; Codrici, E.; Popescu, I.D.; Enciu, A.-M.; Albulescu, L.; Necula, L.G.; Mambet, C.; Anton, G.; Tanase, C. Inflammation-related mechanisms in chronic kidney disease prediction, progression, and outcome. J. Immunoll Res. 2018, 2018, 16. [Google Scholar] [CrossRef] [PubMed]
- Joosten, S.C.; Smits, K.M.; Aarts, M.J.; Melotte, V.; Koch, A.; Tjan-Heijnen, V.C.; van Engeland, M. Epigenetics in renal cell cancer: Mechanisms and clinical applications. Nat. Rev. Urol. 2018, 15, 430–451. [Google Scholar] [CrossRef] [PubMed]
- Reese, B.; Silwal, A.; Daugherity, E.; Daugherity, M.; Arabi, M.; Daly, P.; Paterson, Y.; Woolford, L.; Christie, A.; Elias, R. Complement as prognostic biomarker and potential therapeutic target in renal cell carcinoma. J. Immunol. 2020, 205, 3218–3229. [Google Scholar] [CrossRef]
- Rodriguez-Vida, A.; Strijbos, M.; Hutson, T. Predictive and prognostic biomarkers of targeted agents and modern immunotherapy in renal cell carcinoma. ESMO Open 2016, 1, e000013. [Google Scholar] [CrossRef]
- Jonasch, E.; Futreal, P.A.; Davis, I.J.; Bailey, S.T.; Kim, W.Y.; Brugarolas, J.; Giaccia, A.J.; Kurban, G.; Pause, A.; Frydman, J. State of the science: An update on renal cell carcinoma. Mol. Cancer Res. 2012, 10, 859–880. [Google Scholar] [CrossRef]
- Cowey, C.L.; Rathmell, W. VHL gene mutations in renal cell carcinoma: Role as a biomarker of disease outcome and drug efficacy. Curr. Oncol. Rep. 2009, 11, 94–101. [Google Scholar] [CrossRef]
- Topalian, S.L.; Taube, J.M.; Anders, R.A.; Pardoll, D. Mechanism-driven biomarkers to guide immune checkpoint blockade in cancer therapy. Nat. Rev. Cancer 2016, 16, 275–287. [Google Scholar] [CrossRef]
- Hsieh, J.J.; Purdue, M.P.; Signoretti, S.; Swanton, C.; Albiges, L.; Schmidinger, M.; Heng, D.Y.; Larkin, J.; Ficarra, V. Renal cell carcinoma. Nat. Rev. Dis. Primers 2017, 3, 1–19. [Google Scholar] [CrossRef]
- Tanaka, M.; Makiuchi, T.; Komiyama, T.; Shiina, T.; Osaki, K.; Tachibana, H. Whole genome sequencing of Entamoeba nuttalli reveals mammalian host-related molecular signatures and a novel octapeptide-repeat surface protein. PLoS Negl. Trop. Dis. 2019, 13, e0007923. [Google Scholar] [CrossRef]
- Kim, H.; Inomoto, C.; Uchida, T.; Furuya, H.; Komiyama, T.; Kajiwara, H.; Kobayashi, H.; Nakamura, N.; Miyajima, A. Verification of the International Society of Urological Pathology recommendations in Japanese patients with clear cell renal cell carcinoma. Int. J. Oncol. 2018, 52, 1139–1148. [Google Scholar] [CrossRef] [PubMed]
- Komiyama, T.; Ogura, A.; Hirokawa, T.; Zhijing, M.; Kamiguchi, H.; Asai, S.; Miyachi, H.; Kobayashi, H. Analysis to estimate genetic variations in the idarubicin-resistant derivative MOLT-3. Int. J. Mol. Sci. 2016, 18, 12. [Google Scholar] [CrossRef] [PubMed]
- Komiyama, T.; Ogura, A.; Kajiwara, T.; Okada, Y.; Kobayashi, H.J.G. Analysis of candidate idarubicin drug resistance genes in MOLT-3 cells using exome nuclear DNA. Genes 2018, 9, 390. [Google Scholar] [CrossRef] [PubMed]
- Hou, Z.; Jiang, P.; Swanson, S.A.; Elwell, A.L.; Nguyen, B.K.S.; Bolin, J.M.; Stewart, R.; Thomson, J. A cost-effective RNA sequencing protocol for large-scale gene expression studies. Sci. Rep. 2015, 5, 9570. [Google Scholar] [CrossRef]
- Chao, H.-P.; Chen, Y.; Takata, Y.; Tomida, M.W.; Lin, K.; Kirk, J.S.; Simper, M.S.; Mikulec, C.D.; Rundhaug, J.E.; Fischer, S. Systematic evaluation of RNA-seq preparation protocol performance. BMC Genom. 2019, 20, 571. [Google Scholar] [CrossRef] [PubMed]
- Trapnell, C.; Pachter, L.; Salzberg, S. TopHat: Discovering splice junctions with RNA-seq. Bioinformatics 2009, 25, 1105–1111. [Google Scholar] [CrossRef]
- Trapnell, C.; Roberts, A.; Goff, L.; Pertea, G.; Kim, D.; Kelley, D.R.; Pimentel, H.; Salzberg, S.L.; Rinn, J.L.; Pachter, L. Differential gene and transcript expression analysis of RNA-seq experiments with TopHat and Cufflinks. Nat. Protoc. 2012, 7, 562–578. [Google Scholar] [CrossRef]
- Ghosh, S.; Chan, C.-K.K. Analysis of RNA-seq data using TopHat and Cufflinks. Methods Mol. Biol. 2016, 1374, 339–361. [Google Scholar]
- Murakami, T.; Komiyama, T.; Matsumoto, S.; Kajiwara, H.; Kobayashi, H.; Ikari, Y. Examination of gender differences in patients with takotsubo syndrome according to left ventricular biopsy: Two case reports. J. Med. Case Rep. 2021, 15, 281. [Google Scholar] [CrossRef]
- Kanehisa, M.; Goto, S. KEGG: Kyoto Encyclopedia of Genes and Genomes. Nucleic Acids Res. 2000, 28, 27–30. [Google Scholar] [CrossRef]
- Koshikawa, N.; Akimoto, M.; Hayashi, J.-I.; Nagase, H.; Takenaga, K. Association of predicted pathogenic mutations in mitochondrial ND genes with distant metastasis in NSCLC and colon cancer. Sci. Rep. 2017, 7, 15535. [Google Scholar] [CrossRef] [PubMed]
- Linnartz, B.; Anglmayer, R.; Zanssen, S. Comprehensive scanning of somatic mitochondrial DNA alterations in acute leukemia developing from myelodysplastic syndromes. Cancer Res. 2004, 64, 1966–1971. [Google Scholar] [CrossRef] [PubMed]
- Hayashi, M.; Thomas, L.; Moriya, R.; Rettner, C.; Parkin, S. Current-controlled magnetic domain-wall nanowire shift register. Science 2008, 320, 209–211. [Google Scholar] [CrossRef] [PubMed]
- Ishikawa, K.; Takenaga, K.; Akimoto, M.; Koshikawa, N.; Yamaguchi, A.; Imanishi, H.; Nakada, K.; Honma, Y.; Hayashi, J.-I. ROS-generating mitochondrial DNA mutations can regulate tumor cell metastasis. Science 2008, 320, 661–664. [Google Scholar] [CrossRef]
- Zeng, Q.; Sun, S.; Li, Y.; Li, X.; Li, Z.; Liang, H. Identification of therapeutic targets and prognostic biomarkers among CXC chemokines in the renal cell carcinoma microenvironment. Front. Oncol. 2020, 9, 1555. [Google Scholar] [CrossRef] [PubMed]
- Oldham, K.A.; Parsonage, G.; Bhatt, R.I.; Wallace, D.M.A.; Deshmukh, N.; Chaudhri, S.; Adams, D.H.; Lee, S. T lymphocyte recruitment into renal cell carcinoma tissue: A role for chemokine receptors CXCR3, CXCR6, CCR5, and CCR6. Eur. Urol. 2012, 61, 385–394. [Google Scholar] [CrossRef]
- Fukuda, T.; Fukuda, R.; Miyazono, K.; Heldin, C.-H. Tumor promoting effect of BMP signaling in endometrial cancer. Int. J. Mol. Sci. 2021, 22, 7882. [Google Scholar] [CrossRef]
- Xu, J.; Lamouille, S.; Derynck, R. TGF-β-induced epithelial to mesenchymal transition. Cell Res. 2009, 19, 156–172. [Google Scholar] [CrossRef]
- Zhang, J.; Tian, X.-J.; Zhang, H.; Teng, Y.; Li, R.; Bai, F.; Elankumaran, S.; Xing, J. TGF-β-induced epithelial-to-mesenchymal transition proceeds through stepwise activation of multiple feedback loops. Sci. Signal. 2014, 7, ra91. [Google Scholar] [CrossRef]
- Lebrin, F.; Deckers, M.; Bertolino, P.; Ten Dijke, P. TGF-β receptor function in the endothelium. Cardiovasc. Res. 2005, 65, 599–608. [Google Scholar] [CrossRef]
- Lebrin, F.; Goumans, M.J.; Jonker, L.; Carvalho, R.L.; Valdimarsdottir, G.; Thorikay, M.; Mummery, C.; Arthur, H.M.; Dijke, P. Endoglin promotes endothelial cell proliferation and TGF-β/ALK1 signal transduction. EMBO J. 2004, 23, 4018–4028. [Google Scholar] [CrossRef] [PubMed]
- Goumans, M.-J.; Lebrin, F.; Valdimarsdottir, G. Controlling the angiogenic switch: A balance between two distinct TGF-b receptor signaling pathways. Trends Cardiovasc. Med. 2003, 13, 301–307. [Google Scholar] [CrossRef]
- Pardali, E.; Goumans, M.-J.; ten Dijke, P. Signaling by members of the TGF-β family in vascular morphogenesis and disease. Trends Cell Biol. 2010, 20, 556–567. [Google Scholar] [CrossRef] [PubMed]
- Mi, L.-Z.; Brown, C.T.; Gao, Y.; Tian, Y.; Le, V.Q.; Walz, T.; Springer, T. Structure of bone morphogenetic protein 9 procomplex. Proc. Natl. Acad. Sci. USA 2015, 112, 3710–3715. [Google Scholar] [CrossRef] [PubMed]
- Wang, R.N.; Green, J.; Wang, Z.; Deng, Y.; Qiao, M.; Peabody, M.; Zhang, Q.; Ye, J.; Yan, Z.; Denduluri, S.; et al. Bone Morphogenetic Protein (BMP) signaling in development and human diseases. Genes Dis. 2014, 1, 87–105. [Google Scholar] [CrossRef] [PubMed]
- Groppe, J.; Hinck, C.S.; Samavarchi-Tehrani, P.; Zubieta, C.; Schuermann, J.P.; Taylor, A.B.; Schwarz, P.M.; Wrana, J.L.; Hinck, A. Cooperative assembly of TGF-β superfamily signaling complexes is mediated by two disparate mechanisms and distinct modes of receptor binding. Mol. Cell 2008, 29, 157–168. [Google Scholar] [CrossRef]
- Heldin, C.-H.; Landström, M.; Moustakas, A. Mechanism of TGF-β signaling to growth arrest, apoptosis, and epithelial–mesenchymal transition. Curr. Opin. Cell Biol. 2009, 21, 166–176. [Google Scholar] [CrossRef]
- Kawabata, M.; Imamura, T.; Miyazono, K. Signal transduction by bone morphogenetic proteins. Cytokine Growth Factor Rev. 1998, 9, 49–61. [Google Scholar] [CrossRef]
- Weiss, A.; Attisano, L. The TGFbeta superfamily signaling pathway. Wiley Interdiscip. Rev. Dev. Biol. 2013, 2, 47–63. [Google Scholar] [CrossRef]
- Miyazono, K.; Kamiya, Y.; Morikawa, M. Bone morphogenetic protein receptors and signal transduction. J. Biochem. 2010, 147, 35–51. [Google Scholar] [CrossRef]
- Meynard, D.; Kautz, L.; Darnaud, V.; Canonne-Hergaux, F.; Coppin, H.; Roth, M.-P. Lack of the bone morphogenetic protein BMP6 induces massive iron overload. Nat. Genet. 2009, 41, 478–481. [Google Scholar] [CrossRef] [PubMed]
- Yamazaki, M.; Fukushima, H.; Shin, M.; Katagiri, T.; Doi, T.; Takahashi, T.; Jimi, E. Tumor necrosis factor α represses bone morphogenetic protein (BMP) signaling by interfering with the DNA binding of Smads through the activation of NF-κB. J. Biol. Chem. 2009, 284, 35987–35995. [Google Scholar] [CrossRef] [PubMed]
- Sieber, C.; Kopf, J.; Hiepen, C.; Knaus, P. Recent advances in BMP receptor signaling. Cytokine Growth Factor Rev. 2009, 20, 343–355. [Google Scholar] [CrossRef] [PubMed]
- Kautz, L.; Meynard, D.; Monnier, A.; Darnaud, V.; Bouvet, R.; Wang, R.-H.; Deng, C.; Vaulont, S.; Mosser, J.; Coppin, H.; et al. Iron regulates phosphorylation of Smad1/5/8 and gene expression of Bmp6, Smad7, Id1, and Atoh8 in the mouse liver. Blood 2008, 112, 1503–1509. [Google Scholar] [CrossRef]
- Ono, Y.; Calhabeu, F.; Morgan, J.E.; Katagiri, T.; Amthor, H.; Zammit, P.S. BMP signalling permits population expansion by preventing premature myogenic differentiation in muscle satellite cells. Cell Death Differ. 2011, 18, 222–234. [Google Scholar] [CrossRef]
- Sheng, N.; Xie, Z.; Wang, C.; Bai, G.; Zhang, K.; Zhu, Q.; Song, J.; Guillemot, F.; Chen, Y.-G.; Lin, A.; et al. Retinoic acid regulates bone morphogenic protein signal duration by promoting the degradation of phosphorylated Smad1. Proc. Natl. Acad. Sci. USA 2010, 107, 18886–18891. [Google Scholar] [CrossRef]


| No. | Sample Name | Nanodrop | Bioanalyzer | ||||
|---|---|---|---|---|---|---|---|
| A260/A280 | A260/A230 | ng/μL | 28S/18S | RIN | ng/μL | ||
| 1 | RCC: K58-R | 2.00 | 2.14 | 3991.2 | 1.2 | 9.2 | 3088.1 |
| 2 | AG: K58-M | 1.99 | 2.06 | 3298.0 | 1.5 | 9.4 | 2692.7 |
| Position | Reference | Normal Cells | Cancer Cells | Metastatic Cells | Gene Name | dbSNP (Build 154v2) |
|---|---|---|---|---|---|---|
| NC_012920 | K58-N | K58-R | K58-M | |||
| 71 | G | G | - | - | ||
| 73 | A | G | G | G | rs869183622 | |
| 153 | A | G | G | G | rs370716192 | |
| 263 | A | G | G | G | rs2853515 | |
| 315.1 | - | C | C | C | ||
| 489 | T | C | C | C | rs28625645 | |
| 750 | A | G | G | G | rs2853518 | |
| 1041 | A | G | G | G | rs58327546 | |
| 1438 | A | G | G | G | rs2001030 | |
| 1826 | G | G | R | R | ||
| 2706 | A | G | G | G | rs2854128 | |
| 3394 | T | C | Y | Y | ND1 | rs41460449 |
| 4491 | G | A | A | A | ND2 | rs201172504 |
| 4769 | A | G | G | G | ND2 | rs3021086 |
| 5951 | A | G | G | G | COX1 | rs7340122 |
| 7028 | C | T | T | T | COX1 | rs2015062 |
| 8701 | A | G | G | G | ATP6 | rs2000975 |
| 8860 | A | G | G | G | ATP6 | rs2001031 |
| 9115 | A | G | G | G | ATP6 | rs1603222091 |
| 9242 | A | G | G | G | COX3 | rs1603222192 |
| 9540 | T | C | C | C | COX3 | rs2248727 |
| 10,398 | A | G | G | G | ND3 | rs2853826 |
| 10,400 | C | T | T | T | ND3 | rs28358278 |
| 10,873 | T | C | C | C | ND4 | rs2857284 |
| 11,719 | G | A | A | A | ND4 | rs2853495 |
| 11,807 | A | R | G | G | ND4 | rs1603223419 |
| 12,705 | C | T | T | T | ND5 | rs193302956 |
| 13,434 | A | G | G | G | ND5 | rs1603224187 |
| 14,308 | T | C | C | C | ND6 | rs28357674 |
| 14,766 | C | T | T | T | CYTB | rs193302980 |
| 14,783 | T | C | C | C | CYTB | rs193302982 |
| 15,043 | G | A | A | A | CYTB | rs193302985 |
| 15,301 | G | A | A | A | CYTB | rs193302991 |
| 15,326 | A | G | G | G | CYTB | rs2853508 |
| 15,438 | G | G | R | A | CYTB | |
| 16,223 | C | T | T | T | rs2853513 | |
| 16,234 | C | T | T | T | rs368259300 | |
| 16,300 | A | G | G | G | rs879082592 | |
| 16,316 | A | G | G | G | rs1556424861 | |
| 16,362 | T | C | C | C | rs62581341 | |
| Total differences | 38 | 41 | 41 | |||
| Nucleotide Position | Reference | K58-N | K58-R | K58-M | Amino Acid Substitution | Gene Name | |||||
|---|---|---|---|---|---|---|---|---|---|---|---|
| NC_012920 | Amino Acid Substitution Site/Abbreviation | 1-Letter Abbreviation | Codon | 1-Letter Abbreviation | Codon | 1-Letter Abbreviation | Codon | 1-Letter Abbreviation | |||
| 3394 | TAT | 30/Tyr | Y | CAT | H | YAT | H/Y | YAT | H/Y | p.H30Y | ND1 |
| 11,807 | ACT | 350/Thr | T | RCT | T/A | GCT | A | GCT | A | p.T350A | ND4 |
| 15,438 | GGC | 231/Gly | G | GGC | G | GRC | G/D | GAC | D | p.G231D | CYTB |
| Pathway Name | Count | % Count | p-Value | Benjamini |
|---|---|---|---|---|
| Complement and coagulation cascades | 28 | 1.30111524 | 3.48 × 10⁻¹¹ | 9.84 × 10⁻⁹ |
| Metabolic pathways | 158 | 7.34200743 | 1.07 × 10⁻⁵ | 0.00151811 |
| Cytokine–cytokine receptor interaction | 43 | 1.99814126 | 7.99 × 10⁻⁵ | 0.00753899 |
| Glycine, serine, and threonine metabolism | 13 | 0.60408922 | 1.70 × 10⁻⁴ | 0.01082157 |
| Tryptophan metabolism | 13 | 0.60408922 | 2.23 × 10⁻⁴ | 0.01082157 |
| Retinol metabolism | 17 | 0.78996283 | 2.29 × 10⁻⁴ | 0.01082157 |
| Chemical carcinogenesis | 19 | 0.88289963 | 3.93 × 10⁻⁴ | 0.0158922 |
| Phenylalanine metabolism | 8 | 0.37174721 | 5.59 × 10⁻⁴ | 0.01977878 |
| Systemic lupus erythematosus | 26 | 1.20817844 | 7.05 × 10⁻⁴ | 0.0221624 |
| Steroid hormone biosynthesis | 15 | 0.69702602 | 8.17 × 10⁻⁴ | 0.02310869 |
| PPAR signaling pathway | 16 | 0.74349442 | 0.00124254 | 0.03173786 |
| Arachidonic acid metabolism | 15 | 0.69702602 | 0.00138728 | 0.03173786 |
| Drug metabolism—cytochrome P450 | 16 | 0.74349442 | 0.00145792 | 0.03173786 |
| Pathway Name | Count | % Count | p-Value | Benjamini |
|---|---|---|---|---|
| Cell adhesion molecules (CAMs) | 28 | 1.54696133 | 1.18 × 10⁻⁷ | 3.02 × 10⁻⁵ |
| Antigen processing and presentation | 19 | 1.04972376 | 5.56 × 10⁻⁷ | 7.14 × 10⁻⁵ |
| Type I diabetes mellitus | 13 | 0.71823204 | 5.49 × 10⁻⁶ | 4.70 × 10⁻⁴ |
| Cytokine–cytokine receptor interaction | 34 | 1.87845304 | 1.38 × 10⁻⁵ | 7.76 × 10⁻⁴ |
| Neuroactive ligand–receptor interaction | 37 | 2.0441989 | 1.51 × 10⁻⁵ | 7.76 × 10⁻⁴ |
| Graft-versus-host disease | 11 | 0.60773481 | 1.90 × 10⁻⁵ | 8.14 × 10⁻⁴ |
| Allograft rejection | 11 | 0.60773481 | 5.71 × 10⁻⁵ | 0.00209757 |
| Primary immunodeficiency | 9 | 0.49723757 | 8.80 × 10⁻⁴ | 0.02827813 |
| Calcium signaling pathway | 23 | 1.27071823 | 0.00149072 | 0.0425683 |
| Dilated cardiomyopathy | 14 | 0.77348066 | 0.00181114 | 0.04654619 |
Publisher’s Note: MDPI stays neutral with regard to jurisdictional claims in published maps and institutional affiliations. |
© 2022 by the authors. Licensee MDPI, Basel, Switzerland. This article is an open access article distributed under the terms and conditions of the Creative Commons Attribution (CC BY) license (https://creativecommons.org/licenses/by/4.0/).
Share and Cite
Komiyama, T.; Kim, H.; Tanaka, M.; Isaki, S.; Yokoyama, K.; Miyajima, A.; Kobayashi, H. RNA-seq and Mitochondrial DNA Analysis of Adrenal Gland Metastatic Tissue in a Patient with Renal Cell Carcinoma. Biology 2022, 11, 589. https://doi.org/10.3390/biology11040589
Komiyama T, Kim H, Tanaka M, Isaki S, Yokoyama K, Miyajima A, Kobayashi H. RNA-seq and Mitochondrial DNA Analysis of Adrenal Gland Metastatic Tissue in a Patient with Renal Cell Carcinoma. Biology. 2022; 11(4):589. https://doi.org/10.3390/biology11040589
Chicago/Turabian StyleKomiyama, Tomoyoshi, Hakushi Kim, Masayuki Tanaka, Sanae Isaki, Keiko Yokoyama, Akira Miyajima, and Hiroyuki Kobayashi. 2022. "RNA-seq and Mitochondrial DNA Analysis of Adrenal Gland Metastatic Tissue in a Patient with Renal Cell Carcinoma" Biology 11, no. 4: 589. https://doi.org/10.3390/biology11040589