
Increased Levels of IL-16 in the Central Nervous System during Neuroinflammation Are Associated with Infiltrating Immune Cells and Resident Glial Cells

 , and
, and 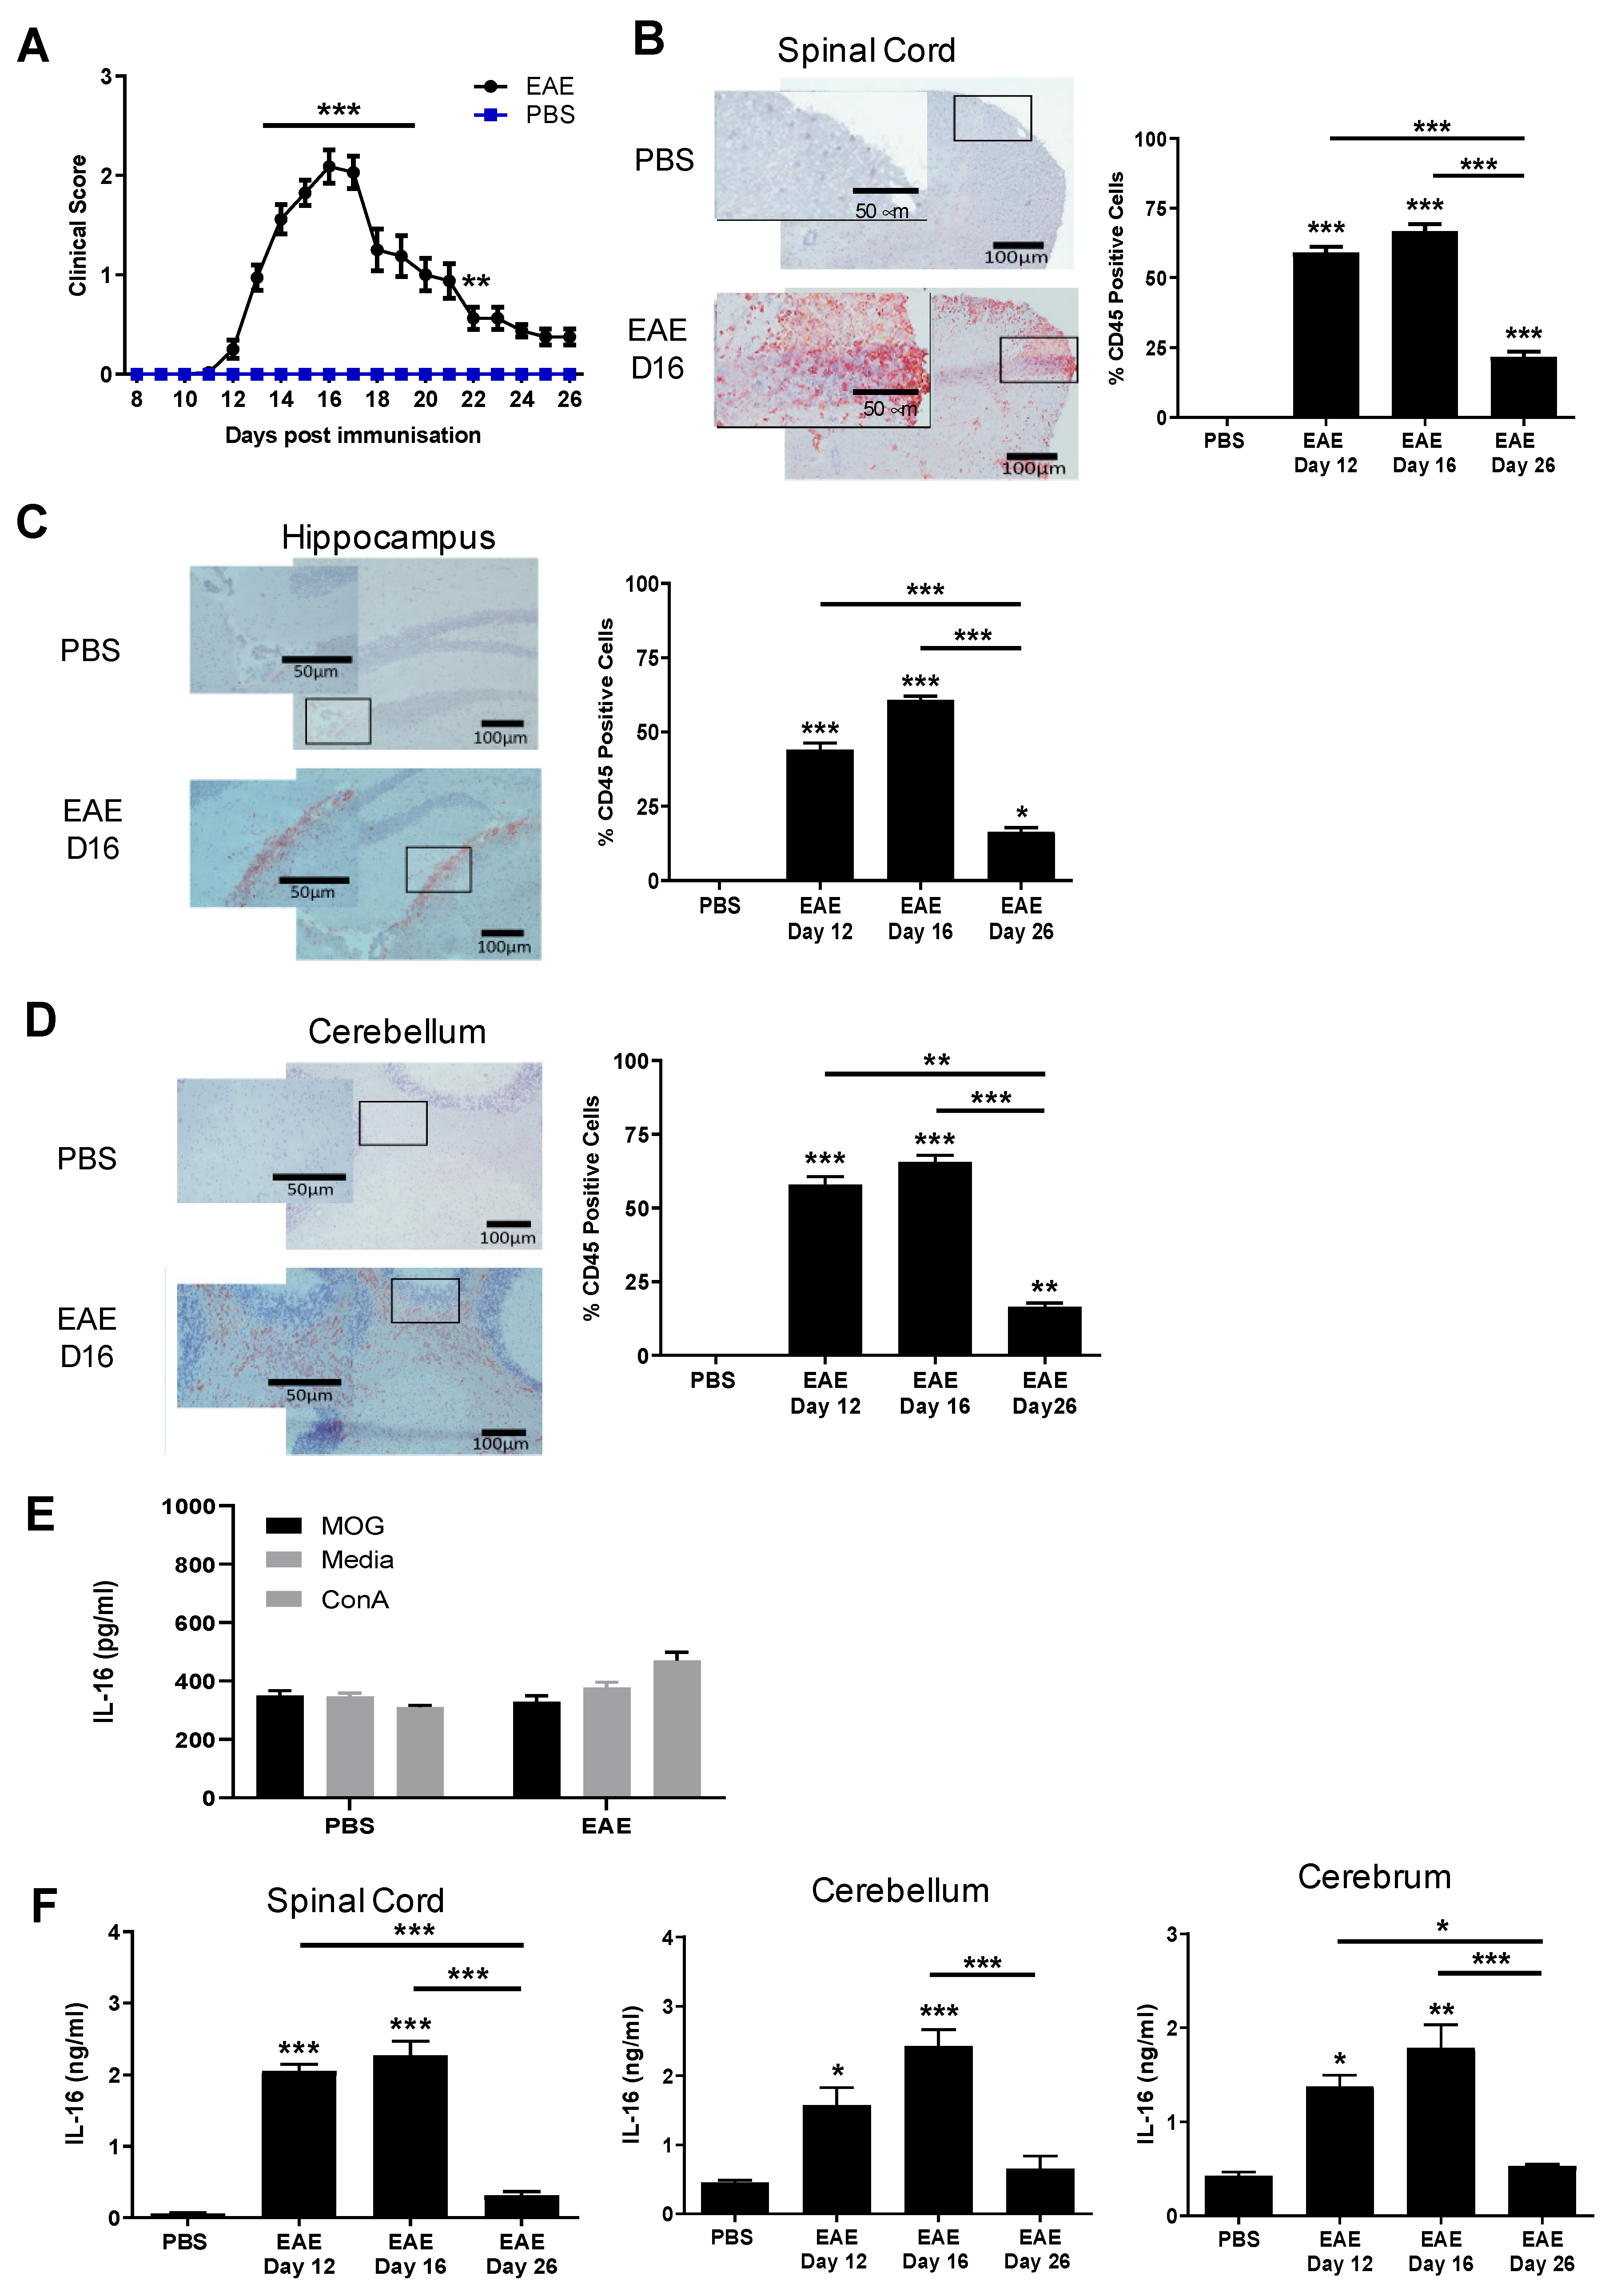
Abstract
:Simple Summary
Abstract
1. Introduction
2. Materials and Methods
2.1. Mice and EAE Induction
2.2. Brain and Spinal Cord Tissue Preparation for Immunohistochemistry
2.3. Immunohistochemistry
2.4. Quantification of Positive Staining Cells in the CNS
2.5. Tissue Preparation for ELISA
2.6. Statistics
3. Results
3.1. The Levels of IL-16 in CNS Tissues of EAE Mice Are Elevated and Correlate with the Severity of CNS Inflammation
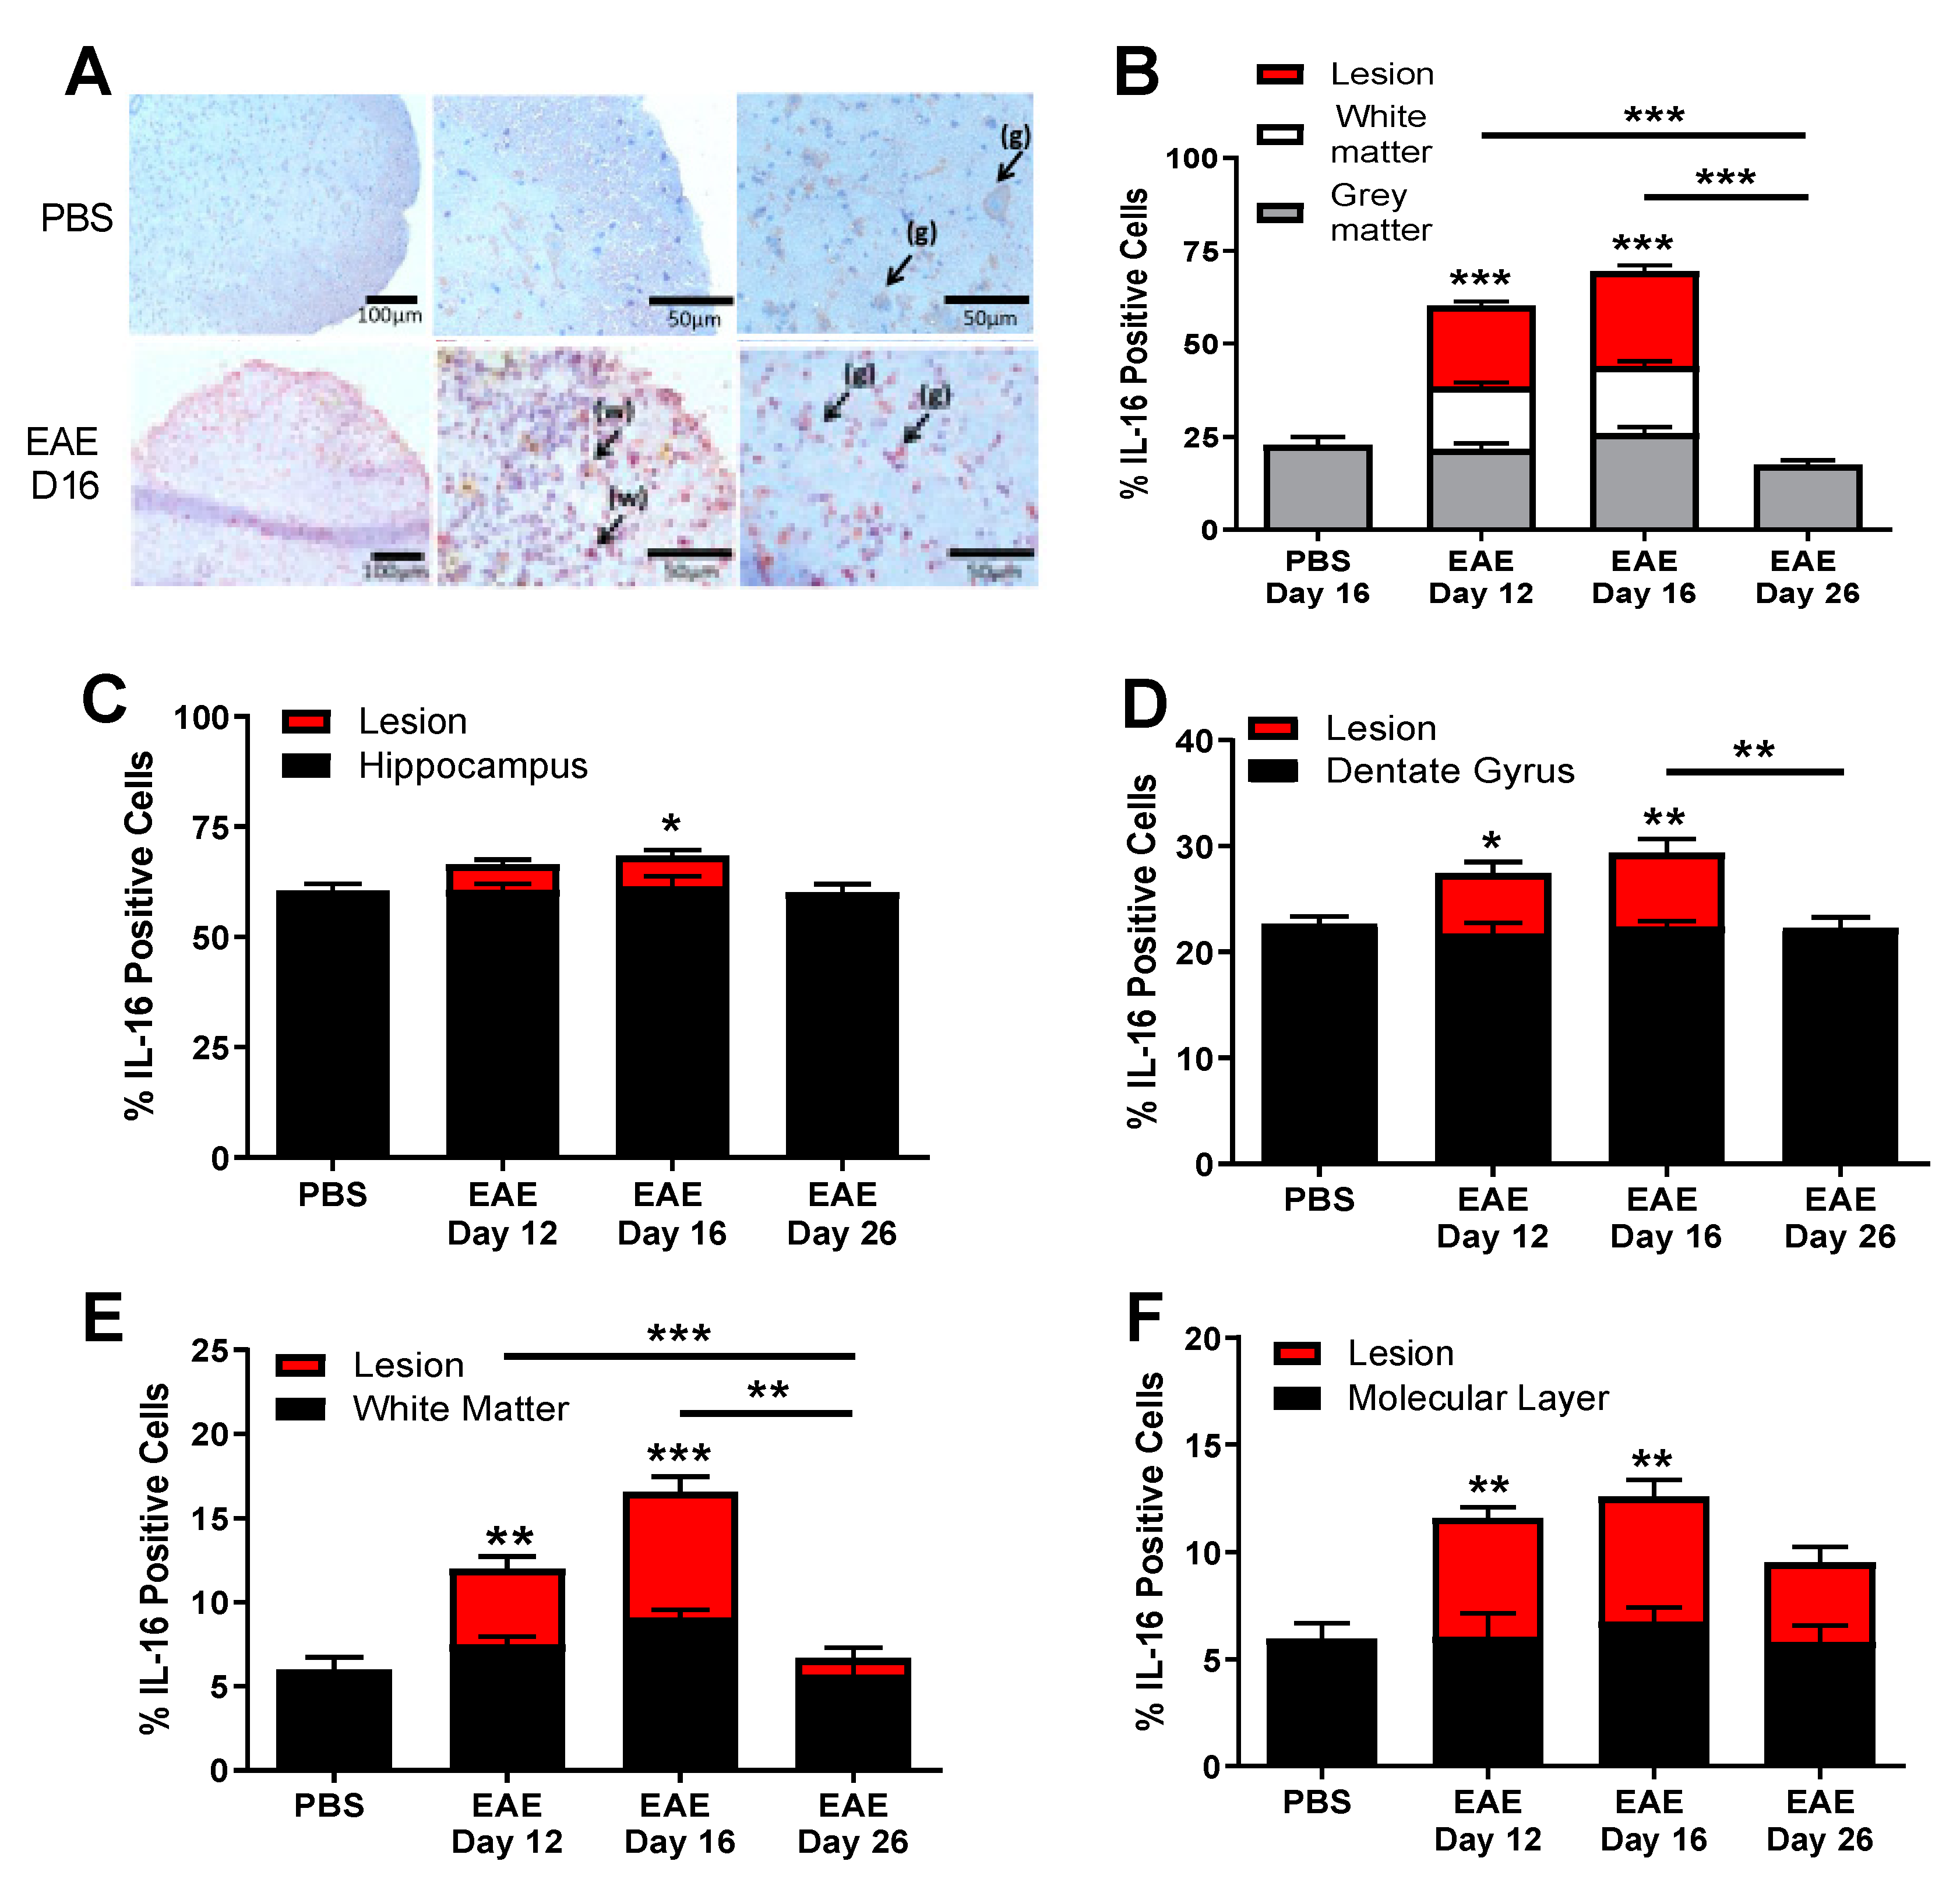
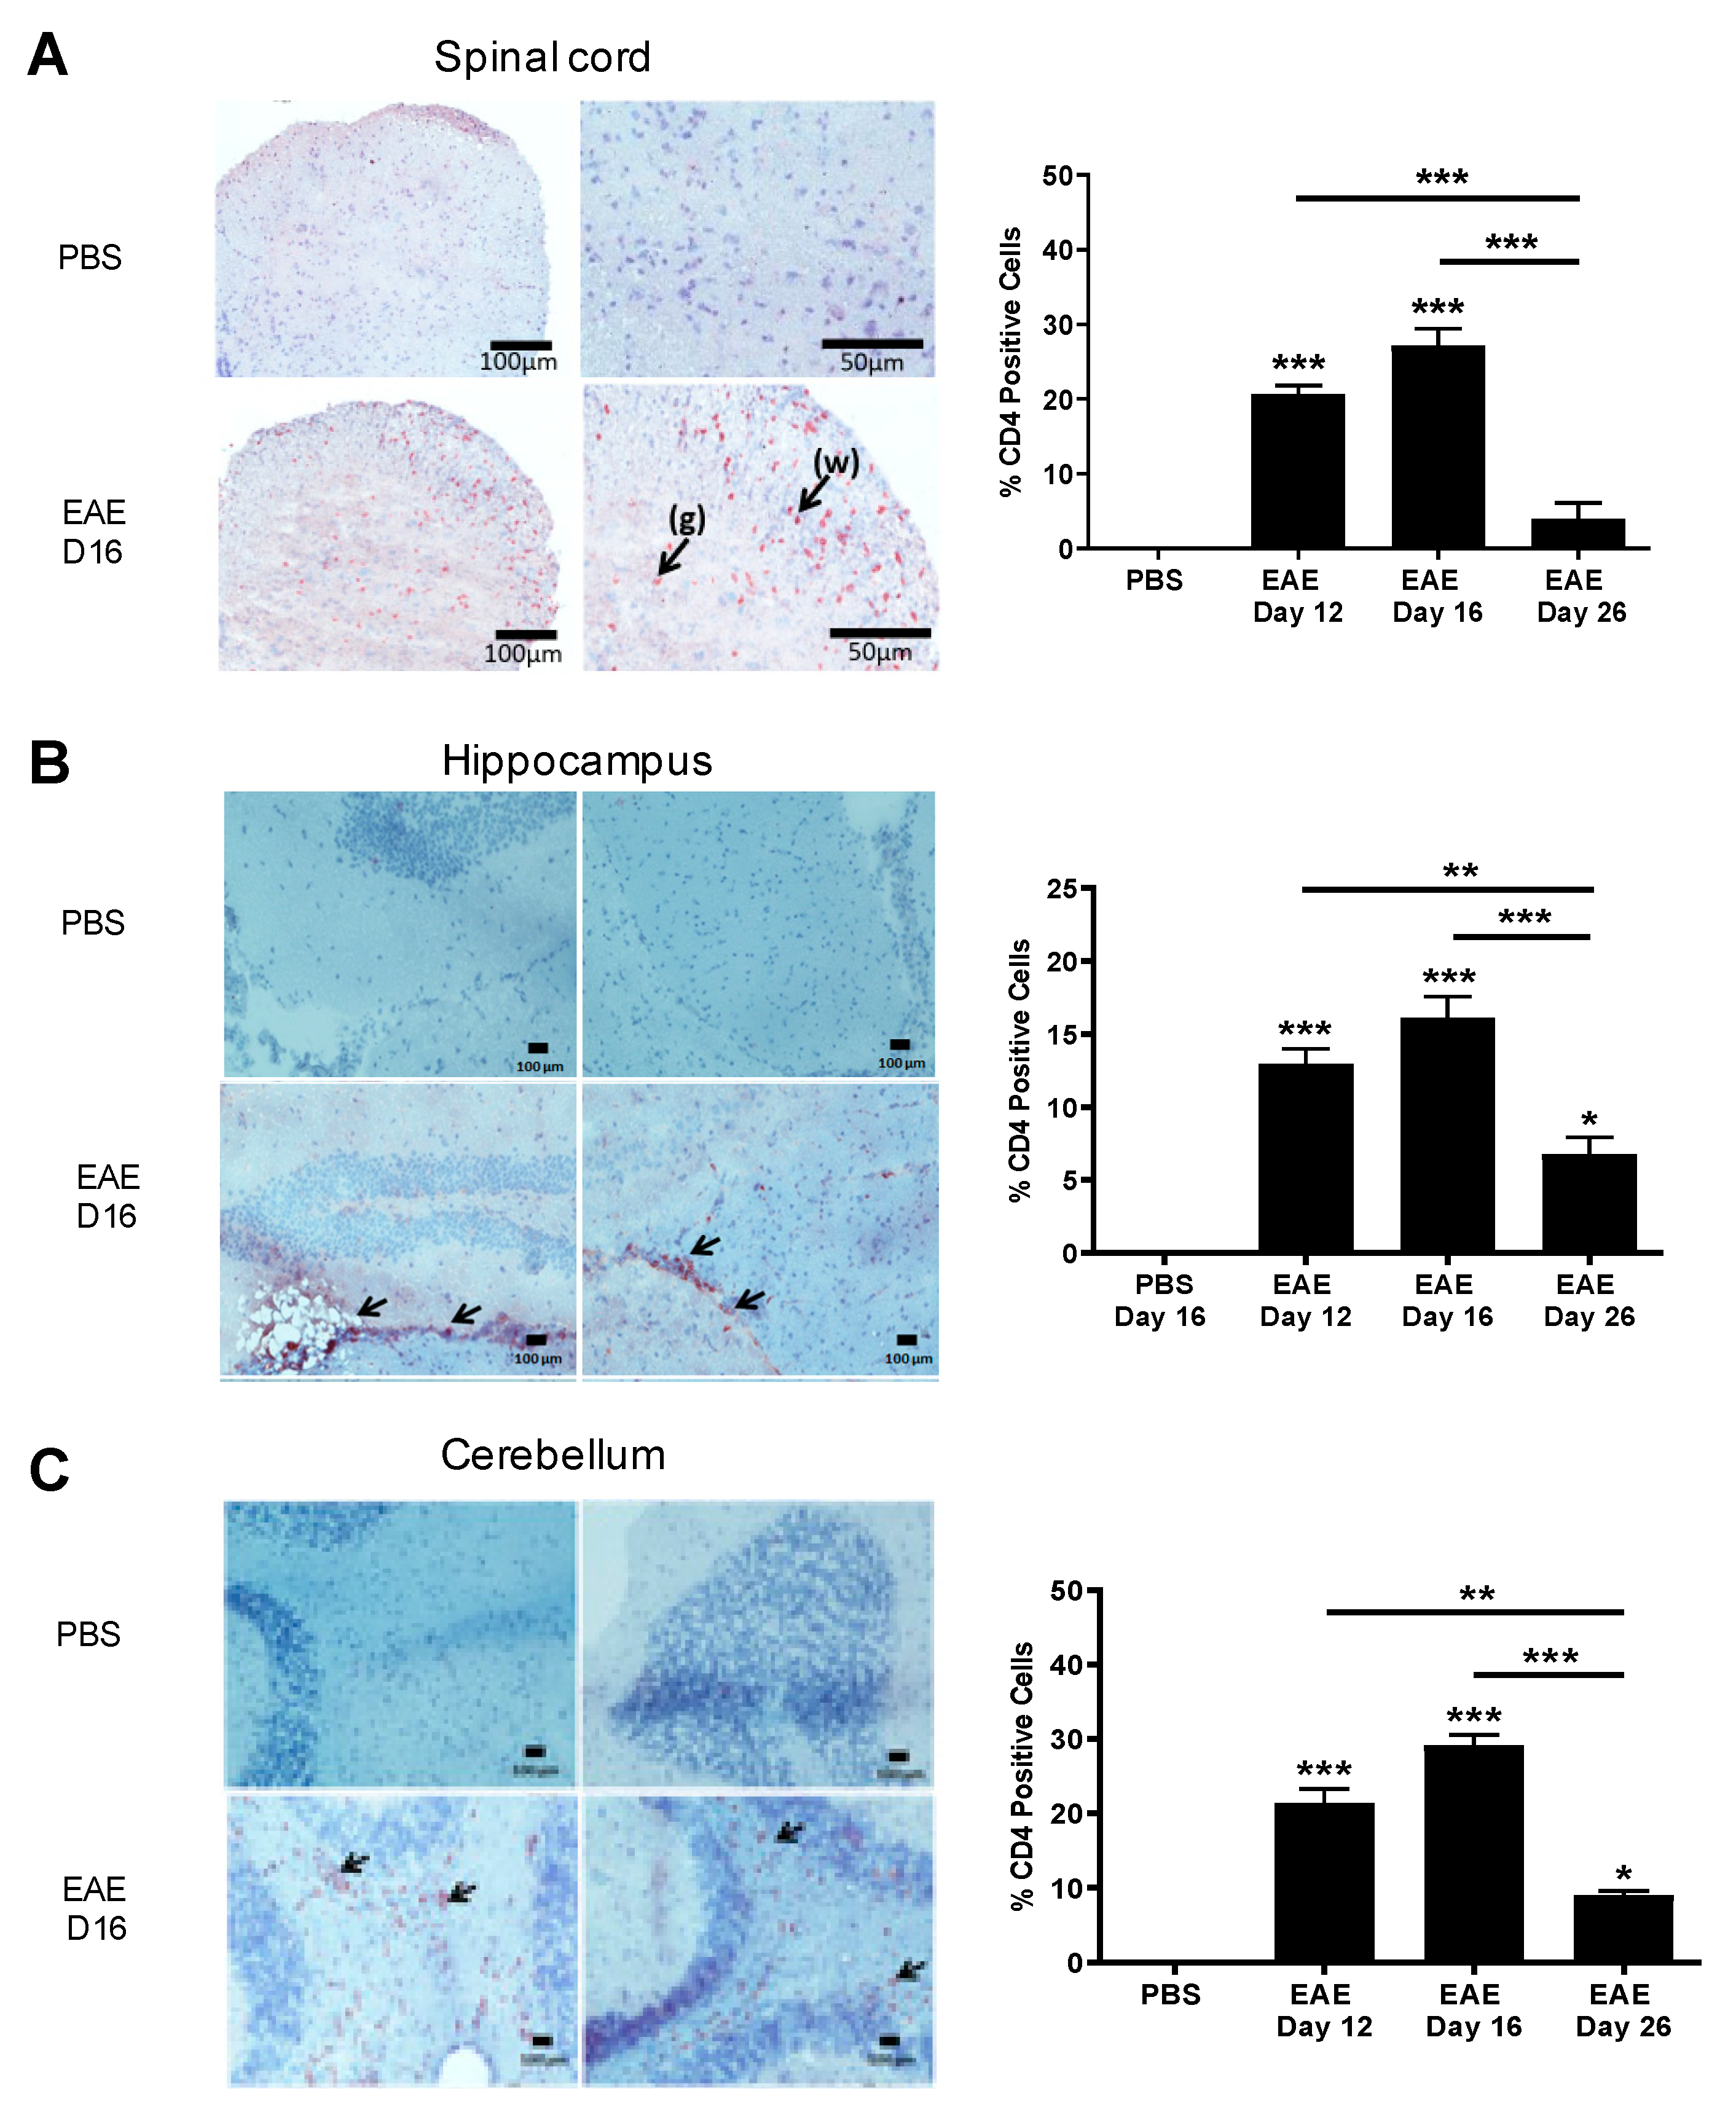
3.2. IL-16 and Its Receptor CD4 Expressing Cells Are Predominantly Located in the CNS Lesions
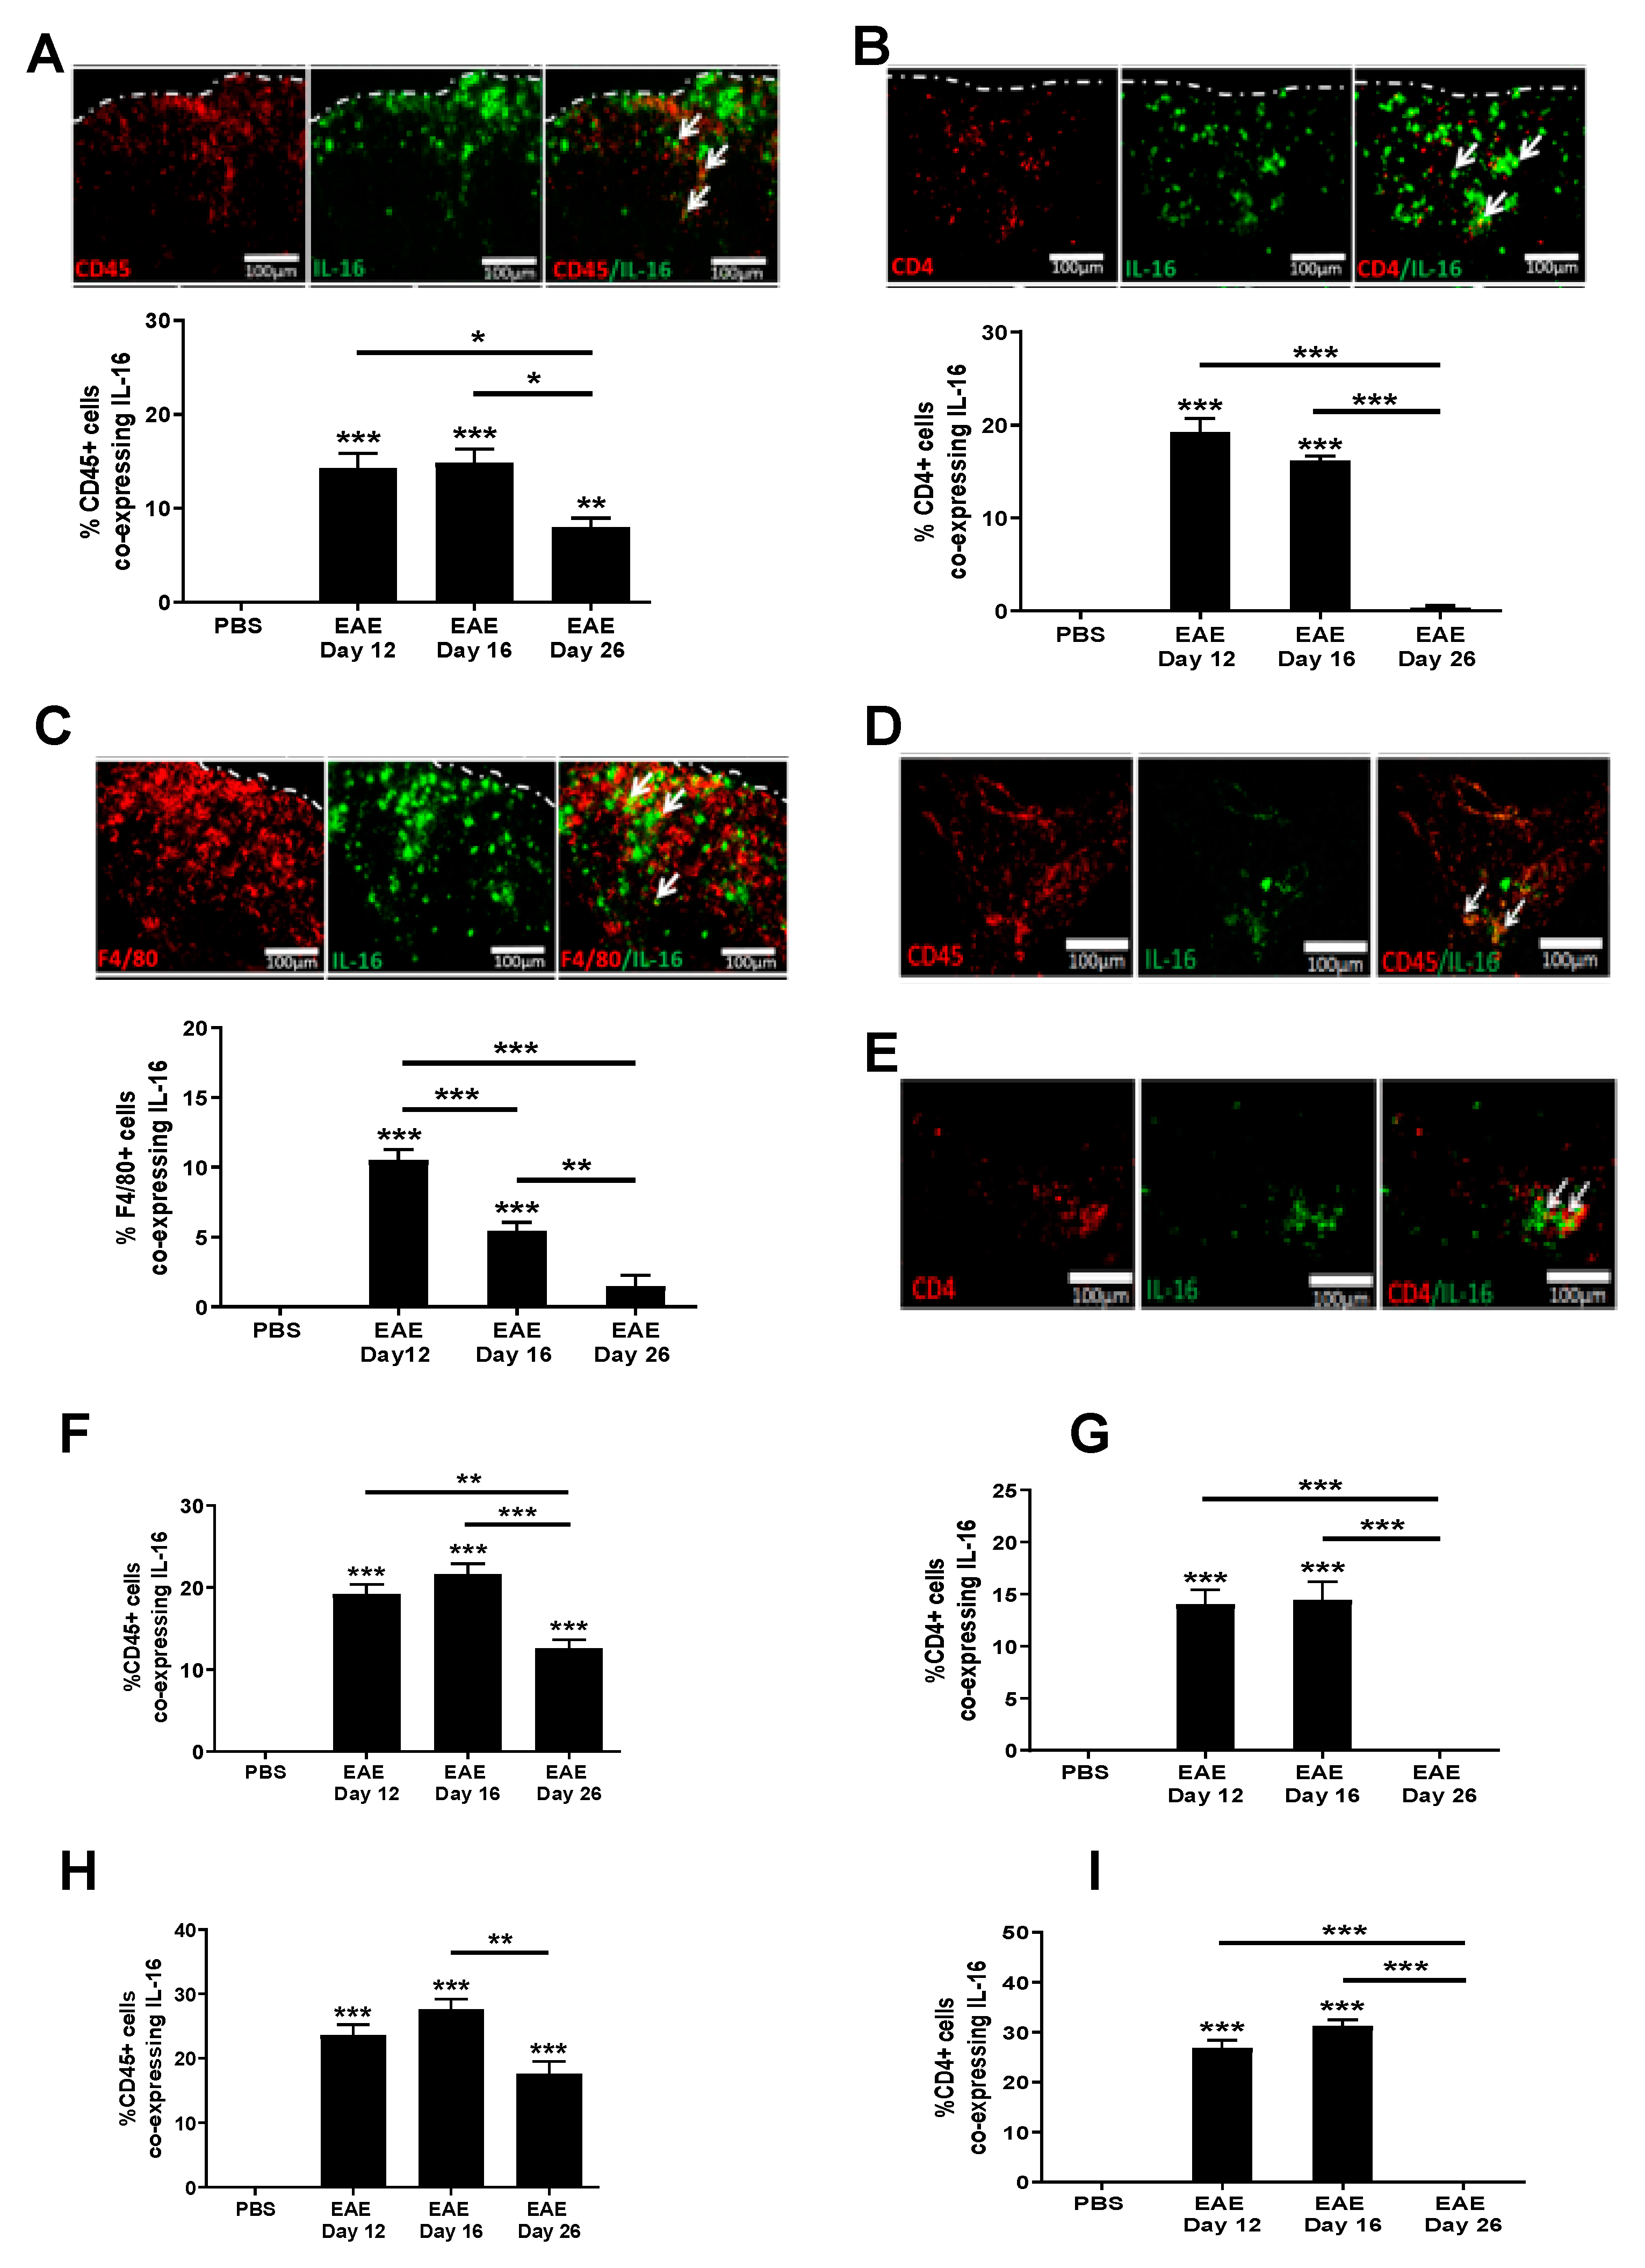
3.3. Increased IL-16 Expression Co-Localises with Infiltrating Immune Cells
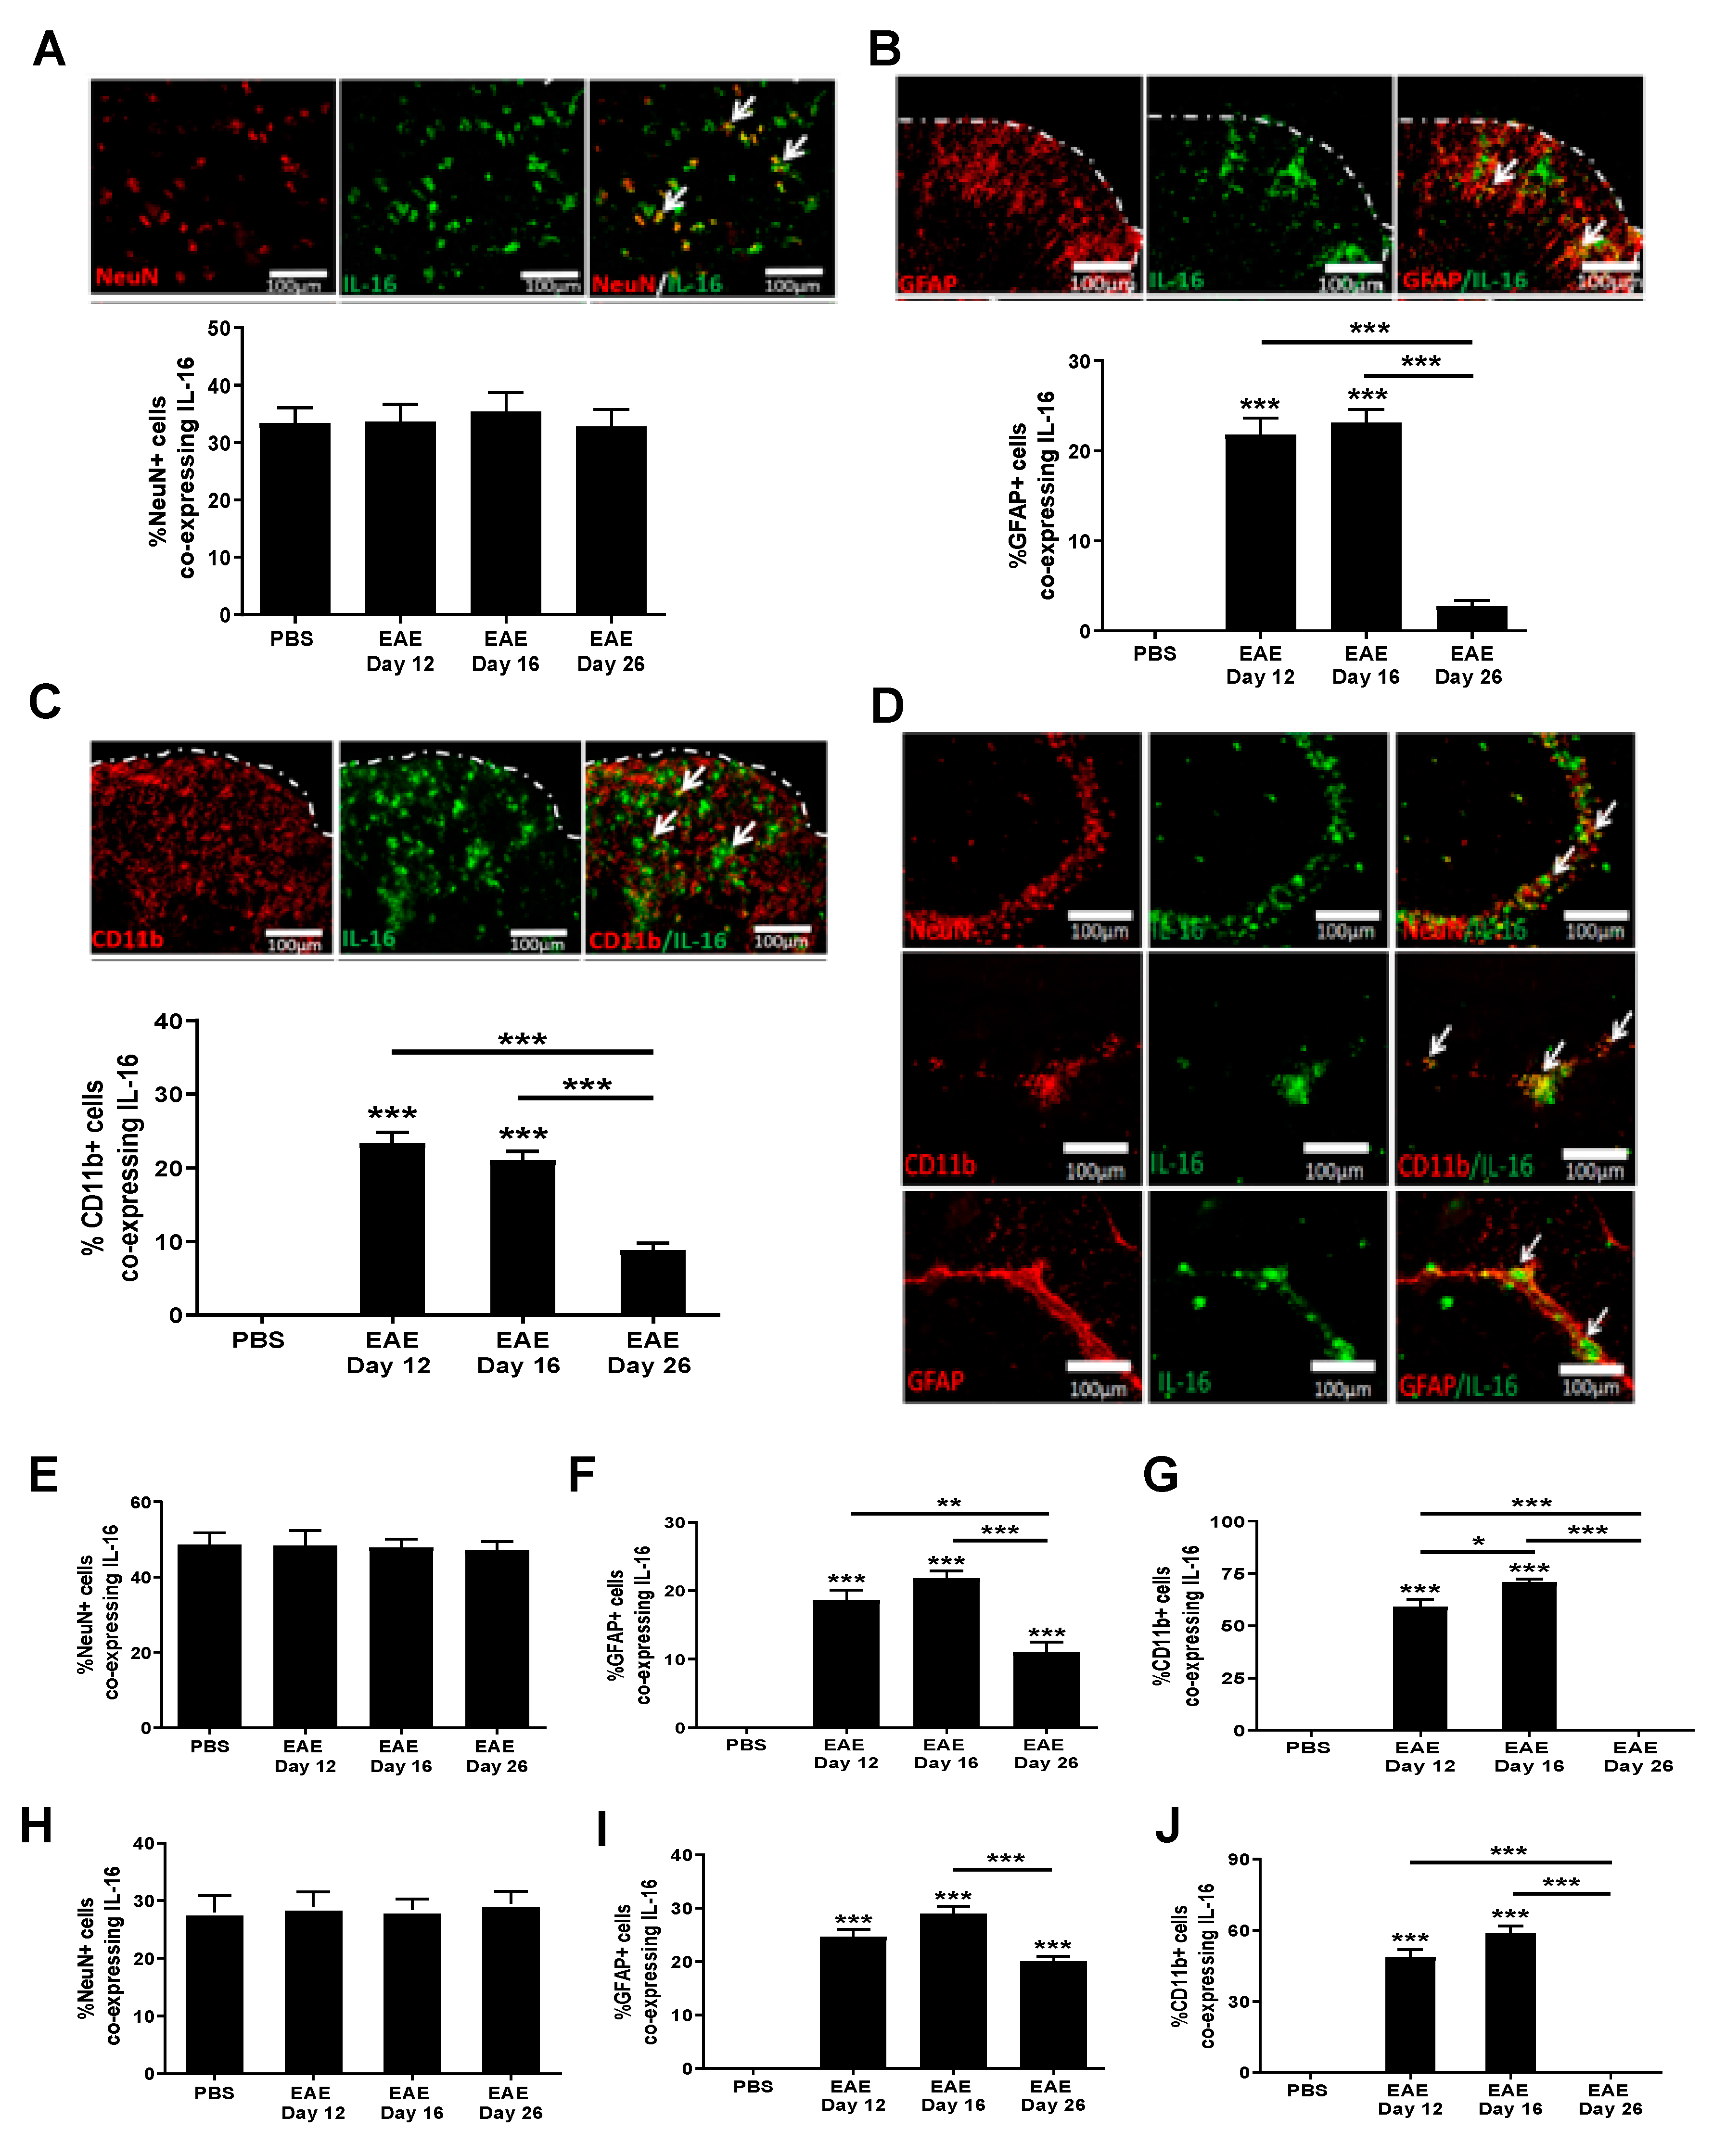
3.4. Increased IL-16 Co-Localises with Glial Cells but Not Neurons
4. Discussion
Author Contributions
Funding
Institutional Review Board Statement
Conflicts of Interest
References
- Rommer, P.S.; Milo, R.; Han, M.H.; Satyanarayan, S.; Sellner, J.; Hauer, L.; Illes, Z.; Warnke, C.; Laurent, S.; Weber, M.S.; et al. Immunological aspects of approved MS therapeutics. Front. Immunol. 2019, 10, 1–24. [Google Scholar] [CrossRef] [PubMed]
- Comabella, M.; Khoury, S.J. Immunopathogenesis of multiple sclerosis. Clin. Immunol. 2012, 142, 2–8. [Google Scholar] [CrossRef] [PubMed]
- Lindsey, J.W. Familial recurrence rates and genetic models of multiple sclerosis. Am. J. Med. Genet. 2005, 135A, 53–58. [Google Scholar] [CrossRef]
- van Langelaar, J.; Rijvers, L.; Smolders, J.; van Luijn, M.M. B and T Cells Driving Multiple Sclerosis: Identity, Mechanisms and Potential Triggers. Front. Immunol. 2020, 11, 1–12. [Google Scholar] [CrossRef]
- Ransohoff, R.M.; Hamilton, T.A.; Tani, M.; Stoler, M.H.; Shick, H.E.; Major, A.; Estes, M.L.; Thomas, D.M.; Vincent, K.; Tuohy, V.K. Astrocyte expression of mRNA encoding cytokines IP-10 and JE/MCP-1 in experimental autoimmune encephalomyelitis. FASEB J. 1993, 7, 592–600. [Google Scholar] [CrossRef]
- Sun, D.; Coleclough, C.; Whitaker, J.N. Nonactivated astrocytes downregulate T cell receptor expression and reduce antigen-specific proliferation and cytokine production of myelin basic protein (MBP)-reactive T cells. J. Neuroimmunol. 1997, 78, 69–78. [Google Scholar] [CrossRef]
- Oh, J.W.; Schwiebert, L.M.; Benveniste, E.N. Cytokine regulation of CC and CXC chemokine expression by human astrocytes. J. Neurovirol. 1999, 5, 82–94. [Google Scholar] [CrossRef] [PubMed] [Green Version]
- Center, D.M.; Cruikshank, W. Modulation of lymphocyte migration by human lymphokines. I. Identification and characterization of chemoattractant activity for lymphocytes from mitogen-stimulated mononuclear cells. J. Immunol. 1982, 128, 2569–2574. [Google Scholar]
- Cruikshank, W.W.; Kornfeld, H.; Center, D.M. Interleukin-16. J. Leukoc. Biol. 2000, 67, 757–766. [Google Scholar] [PubMed]
- Berman, J.S.; Cruikshank, W.W.; Center, D.M.; Theodore, A.C.; Beer, D.J. Chemoattractant lymphokines specific for the helper/inducer T-lymphocyte subset. Cell. Immunol. 1985, 95, 105–112. [Google Scholar] [CrossRef]
- Zhang, Y.; Center, D.M.; Wu, D.M.H.; Cruikshank, W.W.; Yuan, J.; Andrews, D.W.; Kornfeld, H. Processing and activation of pro-interleukin-16 by caspase-3. J. Biol. Chem. 1998, 273, 1144–1149. [Google Scholar] [CrossRef] [PubMed] [Green Version]
- Skundric, D.S.; Cruikshank, W.W.; Montgomery, P.C.; Lisak, R.P.; Tse, H.Y. Emerging role of IL-16 in cytokine-mediated regulation of multiple sclerosis. Cytokine 2015, 75, 234–248. [Google Scholar] [CrossRef] [PubMed]
- Blake, D.J.; Martiszus, J.D.; Lone, T.H.; Fenster, S.D. Ablation of the CD9 receptor in human lung cancer cells using CRISPR/Cas alters migration to chemoattractants including IL-16. Cytokine 2018, 111, 567–570. [Google Scholar] [CrossRef]
- Huang, Y.; Du, K.L.; Guo, P.Y.; Zhao, R.M.; Wang, B.; Zhao, X.L.; Zhang, C.Q. IL-16 regulates macrophage polarization as a target gene of mir-145-3p. Mol. Immunol. 2019, 107, 1–9. [Google Scholar] [CrossRef]
- Biddison, W.E.; Kubota, R.; Kawanishi, T.; Taub, D.D.; Cruikshank, W.W.; Center, D.M.; Connor, E.W.; Utz, U.; Jacobson, S. Human T cell leukemia virus type I (HTLV-I)-specific CD8+ CTL clones from patients with HTLV-I-associated neurologic disease secrete proinflammatory cytokines, chemokines, and matrix metalloproteinase. J. Immunol. 1997, 159, 2018–2025. [Google Scholar] [PubMed]
- Skundric, D.S.; Zhou, W.; Cruikshank, W.W.; Dai, R. Increased levels of bioactive IL-16 correlate with disease activity during relapsing experimental autoimmune encephalomyelitis (EAE). J. Autoimmun. 2005, 25, 206–214. [Google Scholar] [CrossRef]
- Biddison, W.E.; Taub, D.D.; Cruikshank, W.W.; Center, D.M.; Connor, E.W.; Honma, K. Chemokine and matrix metalloproteinase secretion by myelin proteolipid protein-specific CD8+ T cells: Potential roles in inflammation. J. Immunol. 1997, 158, 3046–3053. [Google Scholar] [PubMed]
- Skundric, D.S.; Dai, R.; Zakarian, V.L.; Bessert, D.; Skoff, R.P.; Cruikshank, W.W.; Kurjakovic, Z. Anti-IL-16 therapy reduces CD4+ T-cell infiltration and improves paralysis and histopathology of relapsing EAE. J. Neurosci. Res. 2005, 79, 680–693. [Google Scholar] [CrossRef]
- Shrestha, R.; Millington, O.; Brewer, J.; Dev, K.K.; Bushell, T.J. Lymphocyte-mediated neuroprotection in in vitro models of excitotoxicity involves astrocytic activation and the inhibition of MAP kinase signalling pathways. Neuropharmacology 2014, 76, 184–193. [Google Scholar] [CrossRef] [Green Version]
- Hridi, S.U.; Franssen, A.J.P.M.; Jiang, H.R.; Bushell, T.J. Interleukin-16 inhibits sodium channel function and GluA1 phosphorylation via CD4- and CD9-independent mechanisms to reduce hippocampal neuronal excitability and synaptic activity. Mol. Cell. Neurosci. 2019, 95, 71–78. [Google Scholar] [CrossRef] [PubMed] [Green Version]
- Barbour, M.; Wood, R.; Hridi, S.U.; Wilson, C.; McKay, G.; Bushell, T.J.; Jiang, H.R. The therapeutic effect of anti-CD52 treatment in murine experimental autoimmune encephalomyelitis is associated with altered IL-33 and ST2 expression levels. J. Neuroimmunol. 2018, 318, 87–96. [Google Scholar] [CrossRef] [Green Version]
- Jiang, H.R.; Milovanović, M.; Allan, D.; Niedbala, W.; Besnard, A.G.; Fukada, S.Y.; Alves-Filho, J.C.; Togbe, D.; Goodyear, C.S.; Linington, C.; et al. IL-33 attenuates EAE by suppressing IL-17 and IFN-γ production and inducing alternatively activated macrophages. Eur. J. Immunol. 2012, 42, 1804–1814. [Google Scholar] [CrossRef] [PubMed]
- Lindsey, W.J. EAE: History, Clinical Signs, and Disease Course. In Experimental Modeuls of Multiple Sclerosis; Lavi, E., Constantinescu, C.S., Eds.; Springer: Boston, MA, USA, 2005; ISBN 9780387255170. [Google Scholar]
- Danikowski, K.M.; Jayaraman, S.; Prabhakar, B.S. Regulatory T cells in multiple sclerosis and myasthenia gravis. J. Neuroinflamm. 2017, 14, 13–17. [Google Scholar] [CrossRef] [PubMed] [Green Version]
- Skundric, D.S.; Cai, J.; Cruikshank, W.W.; Gveric, D. Production of IL-16 correlates with CD4+ Th1 inflammation and phosphorylation of axonal cytoskeleton in multiple sclerosis lesions. J. Neuroinflamm. 2006, 3, 13. [Google Scholar] [CrossRef] [Green Version]
- Cruikshank, W.W.; Center, D.M.; Nisar, N.; Wu, M.; Natke, B.; Theodore, A.C.; Kornfeld, H. Molecular and functional analysis of a lymphocyte chemoattractant factor: Association of biologic function with CD4 expression. Proc. Natl. Acad. Sci. USA 1994, 91, 5109–5113. [Google Scholar] [CrossRef] [Green Version]
- Baier, M.; Bannert, N.; Werner, A.; Lang, K.; Kurth, R. Molecular cloning, sequence, expression, and processing of the interleukin 16 precursor. Proc. Natl. Acad. Sci. USA 1997, 94, 5273–5277. [Google Scholar] [CrossRef] [Green Version]
- Roosendaal, S.D.; Hulst, H.E.; Vrenken, H.; Feenstra, H.E.M.; Castelijns, J.A.; Pouwels, P.J.W.; Barkhof, F.; Geurts, J.J.G. Structural and functional hippocampal changes in multiple sclerosis patients with intact memory function. Radiology 2010, 255, 595–604. [Google Scholar] [CrossRef]
- Tornes, L.; Conway, B.; Sheremata, W. Multiple sclerosis and the cerebellum. Neurol. Clin. 2014, 32, 957–977. [Google Scholar] [CrossRef] [PubMed]
- Weier, K.; Banwell, B.; Cerasa, A.; Collins, D.L.; Dogonowski, A.M.; Lassmann, H.; Quattrone, A.; Sahraian, M.A.; Siebner, H.R.; Sprenger, T. The Role of the Cerebellum in Multiple Sclerosis. Cerebellum 2015, 14, 364–374. [Google Scholar] [CrossRef] [Green Version]
- Lynch, E.A.; Heijens, C.A.W.; Horst, N.F.; Center, D.M.; Cruikshank, W.W. Cutting Edge: IL-16/CD4 Preferentially Induces Th1 Cell Migration: Requirement of CCR5. J. Immunol. 2003, 171, 4965–4968. [Google Scholar] [CrossRef] [Green Version]
- Schwab, J.M.; Nguyen, T.D.; Meyermann, R.; Schluesener, H.J. Human focal cerebral infarctions induce differential lesional interleukin-16 (IL-16) expression confined to infiltrating granulocytes, CD8+ T-lymphocytes and activated microglia/macrophages. J. Neuroimmunol. 2001, 114, 232–241. [Google Scholar] [CrossRef]
- Jana, M.; Pahan, K. IL-12 p40 homodimer, but not IL-12 p70, induces the expression of IL-16 in microglia and macrophages. Mol. Immunol. 2009, 46, 773–783. [Google Scholar] [CrossRef] [PubMed] [Green Version]


Publisher’s Note: MDPI stays neutral with regard to jurisdictional claims in published maps and institutional affiliations. |
© 2021 by the authors. Licensee MDPI, Basel, Switzerland. This article is an open access article distributed under the terms and conditions of the Creative Commons Attribution (CC BY) license (https://creativecommons.org/licenses/by/4.0/).
Share and Cite
Hridi, S.U.; Barbour, M.; Wilson, C.; Franssen, A.J.; Harte, T.; Bushell, T.J.; Jiang, H.-R. Increased Levels of IL-16 in the Central Nervous System during Neuroinflammation Are Associated with Infiltrating Immune Cells and Resident Glial Cells. Biology 2021, 10, 472. https://doi.org/10.3390/biology10060472
Hridi SU, Barbour M, Wilson C, Franssen AJ, Harte T, Bushell TJ, Jiang H-R. Increased Levels of IL-16 in the Central Nervous System during Neuroinflammation Are Associated with Infiltrating Immune Cells and Resident Glial Cells. Biology. 2021; 10(6):472. https://doi.org/10.3390/biology10060472
Chicago/Turabian StyleHridi, Shehla U, Mark Barbour, Chelsey Wilson, Aimee JPM Franssen, Tanith Harte, Trevor J Bushell, and Hui-Rong Jiang. 2021. "Increased Levels of IL-16 in the Central Nervous System during Neuroinflammation Are Associated with Infiltrating Immune Cells and Resident Glial Cells" Biology 10, no. 6: 472. https://doi.org/10.3390/biology10060472