Article

Genetic Diversity in Invasive Populations of Lupinus polyphyllus Lindl. and Heracleum sosnowskyi Manden.

by
Ekaterina Sergeevna Osipova
*,
Anna Yurievna Stepanova
,
Dmitry Viktorovich Tereshonok
,
Evgeny Aleksandrovich Gladkov
and
Olga Nikolaevna Vysotskaya
K.A.Timiryazev Institute of Plant Physiology, Russian Academy of Sciences, 127276 Moscow, Russia
*
Author to whom correspondence should be addressed.
Biology 2021, 10(11), 1094; https://doi.org/10.3390/biology10111094
Submission received: 24 August 2021 / Revised: 19 October 2021 / Accepted: 20 October 2021 / Published: 25 October 2021

Abstract

:

Simple Summary

Aggressive-invasive species often interact with native ones, thus considerably changing the biological communities, with ecological, economic, and even social effects. It is a challenge to evaluate the direction and the rate of microevolution in native and introduced populations. One of the ways to do this is to estimate the genetic diversity. An introduction often imposes a reduction in population size (genetic drift, bottleneck, founder effect), which has the potential to reduce genetic diversity. However, after a lag, the genetic diversity can be restored due to repeated invasions (multiply introductions), hybridization between individuals from two different subspecies or species in the invaded ranges, as well as during rapid genetic changes under selection pressures in the novel environment. The purpose of this study was to determine the level of genetic diversity in successful invasive species Lupinus polyphyllus Lindl. and Heracleum sosnowskyi Manden. from Russia and Ukraine, and whether it may be associated with the strategy of their further expansion.

Abstract

In our study, two aggressive-invasive species, Lupinus polyphyllus Lindl. and Heracleum sosnowskyi Manden. from Russia and Ukraine, were investigated. The success in naturalization of both species is associated with human activities, since they have been used in agriculture and floriculture and both have qualities such as environmental tolerance, high fertility and phenotypic plasticity. The purpose of this study was to determine the level of genetic diversity of both species. For Heracleum sosnowskyi Manden., genetic diversity was compared in invasive and native populations. For Lupinus polyphyllus Lindl., the genetic diversity was compared in variety, feral and invasive populations. A genetic diversity was formulated using RAPD, ISSR and REMAP. For Heracleum sosnowskyi Manden., the average genetic diversity within the invasive population was similar (0.432), but slightly less (0.502) than within the native Caucasian population. This may suggest the successful naturalization of invaders and almost complete reconstruction of their genetic diversity. For Lupinus polyphyllus Lindl., the genetic diversity for the invasive population was the highest, with an average of 0.294, while for variety, it was the lowest, with an average of 0.194. The feral population had an intermediate place with an average of 0.248, which could suggest an increase of diversity in the process of naturalization.

1. Introduction

Invasive-alien species (IAS) can be considered the second most important threat to biodiversity, after habitat destruction [1]. When introduced into the ecosystem, IAS directly or indirectly affect human health [2]. Warnings from the scientific community for this serious environmental problem have led to the emergence of special international agreements and programs operating under the auspices of several trustworthy organisations. The issue of IAS is addressed in Europe by EU Regulation 1143/2014 of the European Parliament and Council. To support the decision of the EU IAS Regulation, it is important to organize a participatory approach involving scientists and practitioners, draft realistic management strategies for eradication and spread limitation of IAS [3]. Sometimes amendments to legislation may even be necessary [4]. The list of Invasive Alien Species of Union Concern is regularly updated [5]. The preliminary list of invasive plants in Russia includes 730 species [6]. In our work, two aggressive-invasive species, Lupinus polyphyllus Lindl. and Heracleum sosnowskyi Manden. From Russia and Ukraine, were studied.
L. polyphyllus is an herbaceous biennial or short-lived perennial of the Fabaceae with a height of 0.8–1.5 m. The flowers (up to 80 pieces) are blue, or less often pink or white, and are grouped in a terminal erect inflorescence. The natural habitat of L. polyphyllus is western North America—Canada (British Columbia) and the United States (Alaska, western Oregon and Washington, northern California). This species grows on riverbanks, meadows, roadsides, and the other disturbed habitats [7]. In 1826, the famous Scottish ‘plant hunter’ David Douglas brought L. polyphyllus to England, and soon lupins were cultivated in Europe as garden plants. As early as the 1840s, botanical gardens offered a variety of colour forms for this species. The distribution of lupins in Europe had increased by the beginning of the 20th century, as they were grown for soil amelioration and animal feed [8]. Soil amelioration occurred due to the symbiosis between L. polyphyllus and Bradyrhyzobium spp., which form nitrogen-fixing root nodules [9]. In Germany, lupins were grown especially on poor, acidic soils in mountainous regions. In Northern Europe (Norway, Baltic countries), lupins were used to stabilise the soil substrate [10], while in Belarus, Poland, and Russia, they were cultivated for green biomass and soil amelioration [11,12]. In Lithuania and Belarus, lupins were also used as a precautionary measure against the spread of forest fires [13]. In Russia, L. polyphyllus became widespread, to the extent that it became listed in the “Central Russia Floral Black Book” [14].
H. sosnowskyi, or hogweed, is a perennial monocarpic herbaceous plant of the Umbelliferae with a height of 3–4 m. The inflorescence is a large complex umbel (up to 50–80 cm in diameter) consisting of 30–75 rays. The flowers are white or, less often, pink, and each inflorescence has from 30 to 150 flowers. Thus, there can be more than 80,000 flowers on one plant. The natural range of hogweed is east of the Greater Caucasus, the east and southeast of Transcaucasia, and the northeast of Turkey. It grows in subalpine meadows, glades, and edges of beech and fir-beech forests in the middle and upper forest belt [15]. The plant was first described in 1944 in Georgia by botanist I. P. Mandenova. It is named after the famous explorer of flora of the Caucasus D. I. Sosnovsky [16]. Since 1947, H. sosnowskyi has been cultivated throughout the former USSR as a highly productive and stable silage plant. The active cultivation of H. sosnowskyi was promoted because of its extraordinary productivity (its green biomass is 3–4 times higher than all previously known silage crops) and high protein (10–20%), sugar (10–31%), vitamins, and mineral elements [17]. Selective breeding developed varieties with low furanocoumarins content (for example, the variety ‘Severyanin’ was created in the Komi Republic by Mishurov V.M.). Furanocoumarins are photosensitising compounds present in the cellular fluid of hogweed; they possess various physiological activities, including the increase of skin sensitivity to ultraviolet rays. Moreover, it was found that even in the absence of photoactivation, H. sosnowskyi cellular fluid has several pathogenic properties; it inhibits cell growth and leads to cell death, oppresses mitosis, induces chromosomal mutations and causes apoptosis [18]. The milk and meat of cows that have been fed for a long time on H. sosnowskyi acquire an unpleasant bitter taste, and then the phytoestrogens that are part of the plant induce infertility in animals. Consequently, when all these unpleasant side-effects became clear, the breeding of H. sosnowskyi was stopped. By the early 1980s, using hogweed for silage was mostly abandoned; however, the plant turned out to be very tenacious, and feral populations developed quickly. By 1990–2000, hogweed became a serious problem in many ranges of the European part of Russia. The spread of H. sosnowskyi was facilitated by the abandonment of once cultivated lands that occurred with the decline of agriculture following the collapse of the USSR. The consequence then was that hogweed began to spread especially actively. Thus, H. sosnowskyi is called “an indicator of mismanagement” [19]. H. sosnowskyi increased in its growth area by 10% annually, with its invaded ranges including the countries of the Baltic region (Denmark, Poland, Estonia, Lithuania, Latvia), Belarus, Ukraine, and Russia. In Russia, hogweed has spread widely in the European part of Russia, penetrating the Urals, the south of Western Siberia, and the Far East. It grows on the outskirts of roads, fields and forest belts, wastelands, forests, and floodplain meadows [20]. An active search for methods to control H. sosnowskyi began in the 2000s, with one of the first projects being the Giant Alien Project (2002–2005), dedicated to three giant hogweeds (H. mantegazzianum Sommier & Levier, H. sosnowsky, and H. persicum Desf. ex Fisch.). More than 40 scientists from seven countries participated, proposing, methods to combat all three species [20,21].
Upon introduction of a new species in an invaded range, the level of genetic diversity within populations is often reduced [22]. However, after a lag the genetic diversity can be restored [23,24,25]. Therefore, by understanding the level of genetic diversity it should be possible to predict the further spread of invasion. One of the most accessible, fast, and inexpensive techniques for detecting genetic diversity at the DNA level is a variant of PCR, multiple arbitrary amplicon profiling (MAAP), which includes Random Amplified Polymorphic DNA (RAPD) [26], Inter Simple Sequence Repeats (ISSR) [27], Retrotransposon-Microsatellite Amplified Polymorphisms (REMAP) [28]. Thus, our objectives were to estimate the genetic diversity in populations of L. polyphyllus and H. sosnowskyi by means of RAPD, ISSR, and REMAP. The genetic diversity of invasive populations of H. sosnowskyi was compared with its native population. The genetic diversity of invasive population of L. polyphyllus was compared with its variety and feral population, as examples at the beginning of the invasive process.

2. Materials and Methods

2.1. Plant Material

Plant material used in this study included 84 L. polyphyllus and 99 H. sosnowskyi samples (Table 1 and Table 2) from different Russian and Ukrainian regions (Supplementary Figures S1 and S2). Leaf material was collected in the summers of 2019 and 2020 from individual plants at a minimum of 10 m apart. Leaves were desiccated in silica gel until completely dried. ‘Minaret’ variety samples were grown in the greenhouse of K.A.Timiryazev Institute of Plant Physiology, Moscow. Feral population was obtained from a variety that had been running wild for about 5 years in the Main Botanical Garden. Feral population consisted of naturalized plants or established plants. Pyshek characterized such plants as self-replacing populations sustained for at least 10 years without direct intervention by people capable of independent growth [29]. They are already not variety, but are not yet invasive.

2.2. DNA Isolation

DNA was isolated according to Dellaporta et al. [30] with the procedure scaled down for 50 mg dry leaves. As a negative control, C1-, water was added to the lysis buffer instead of plant material.

2.3. DNA Amplification

Twenty-five microlitres of the reaction mixture contained 0.25 µM primer (Lytech, Moscow, Russia), 0.2 mM each dNTP, 2U of Taq DNA polymerase, standard 10× PCR buffer (700 mM Tris-Cl pH 8.6, 166 mM (NH4)2SO4 and 25 mM MgCl2) (Silex, Moscow, Russia) and 30 ng of DNA. The reaction mixture was overlayed by 30 µL of mineral oil. Following optimization, the amplification conditions were: denaturation at 94 °C for 2 min, 5 cycles as follows: denaturation at 94 °C for 20 s, annealing at t °C for 10 c, elongation at 72 °C for 10 c; 35 cycles as follows: denaturation at 94 °C for 5 c, annealing at t °C for 5 c, elongation at 72 °C for 5 c; 1 cycle as follows: elongation for 2 min at 72 °C; t °C was 37 °C for RAPD primers, 37–55 °C for ISSR primers and 50–60 °C for REMAP primers. Amplifications were done in a thermocycler MC2 (DNA-Technology, Moscow, Russia). To control the purity of reagents, water was added to the reaction mixture instead of DNA (reactions C1- and C-). The experiments were done in triplicate.

2.4. Gel Electrophoresis of the Amplification Products

Fifteen microlitres of the reaction products were analysed in 2% agarose-TBE gels with EtBr. The DNA molecular size marker M 100 bp+2 Kb+3 Kb (12 fragments from 100 bp to 3000 bp, Sibenzyme, Novosibirsk, Russia) was used to measure the sizes of DNA fragments.

2.5. Quantitative Estimates of Genetic Diversity

To quantitatively estimate the genetic diversity, the data are presented as binary trait matrices, where the presence or absence of the same size PCR bands were assigned values of 1 or 0, respectively. The value of 1 was assigned only to bands of high intensity consistently detected in all experiments. To estimate the diversity, the binary data for each population were summed, and the most common values were used to build the matrices.
The binary trait matrices were used to derive the difference matrices, with the Nei and Li genetic diversity (Gd) calculated as follows: Gd(xy) = 1 − 2Nxy/(Nx + Ny), where Nx is the number of fragments present in profile x, but absent in profile y; Ny is the number of fragments present in profile y, but absent in profile x; Nxy is the number of fragments present in both profiles [31].
The matrices obtained were used to build phylogenetic trees. The trees were built by the Unweighted Pair Group Method with Arithmetic Mean (UPGMA) [32] using Treecon 1.3b software [33]. To evaluate the confidence intervals of the trees, the bootstrap method with 100 samples was used [34].

3. Results

All primers yielded PCR bands amplified from plant genomic DNA. A total of 39 RAPD and 17 ISSR primers were used. Depending on the primer, the number of amplified fragments varied from 3 to 16, with their sizes varying from 200 to 2000 bp; the optimal annealing temperature was determined experimentally for each primer. The optimal primer pairs were designed for REMAP. Five REMAP pairs gave sharp and consistent profiles for lupin and seven REMAP pairs for hogweed (Supplementary Table S1).

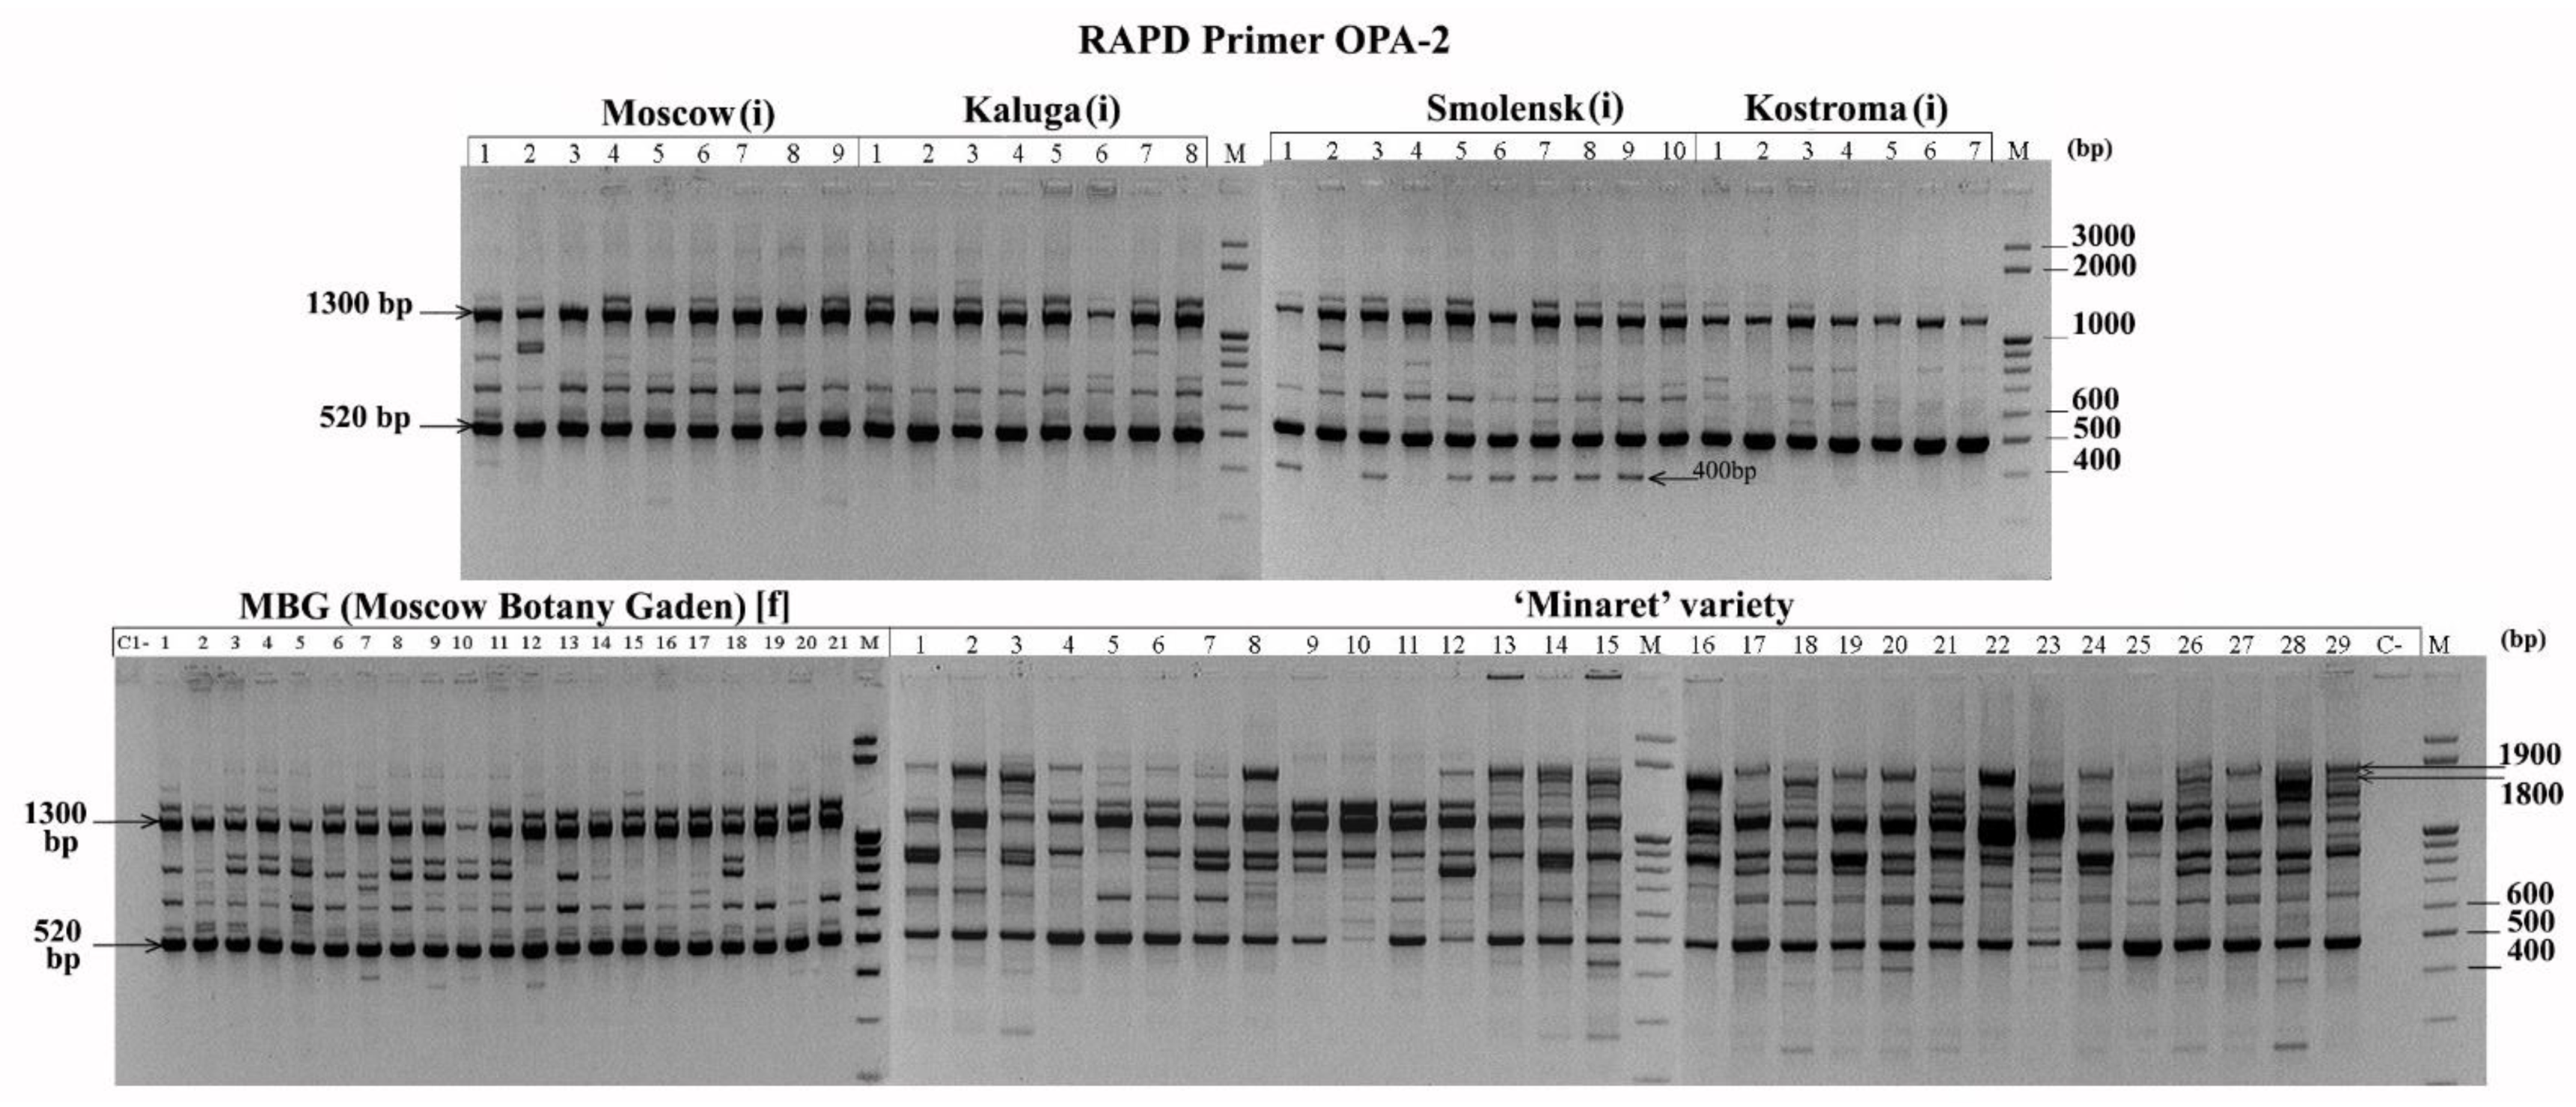
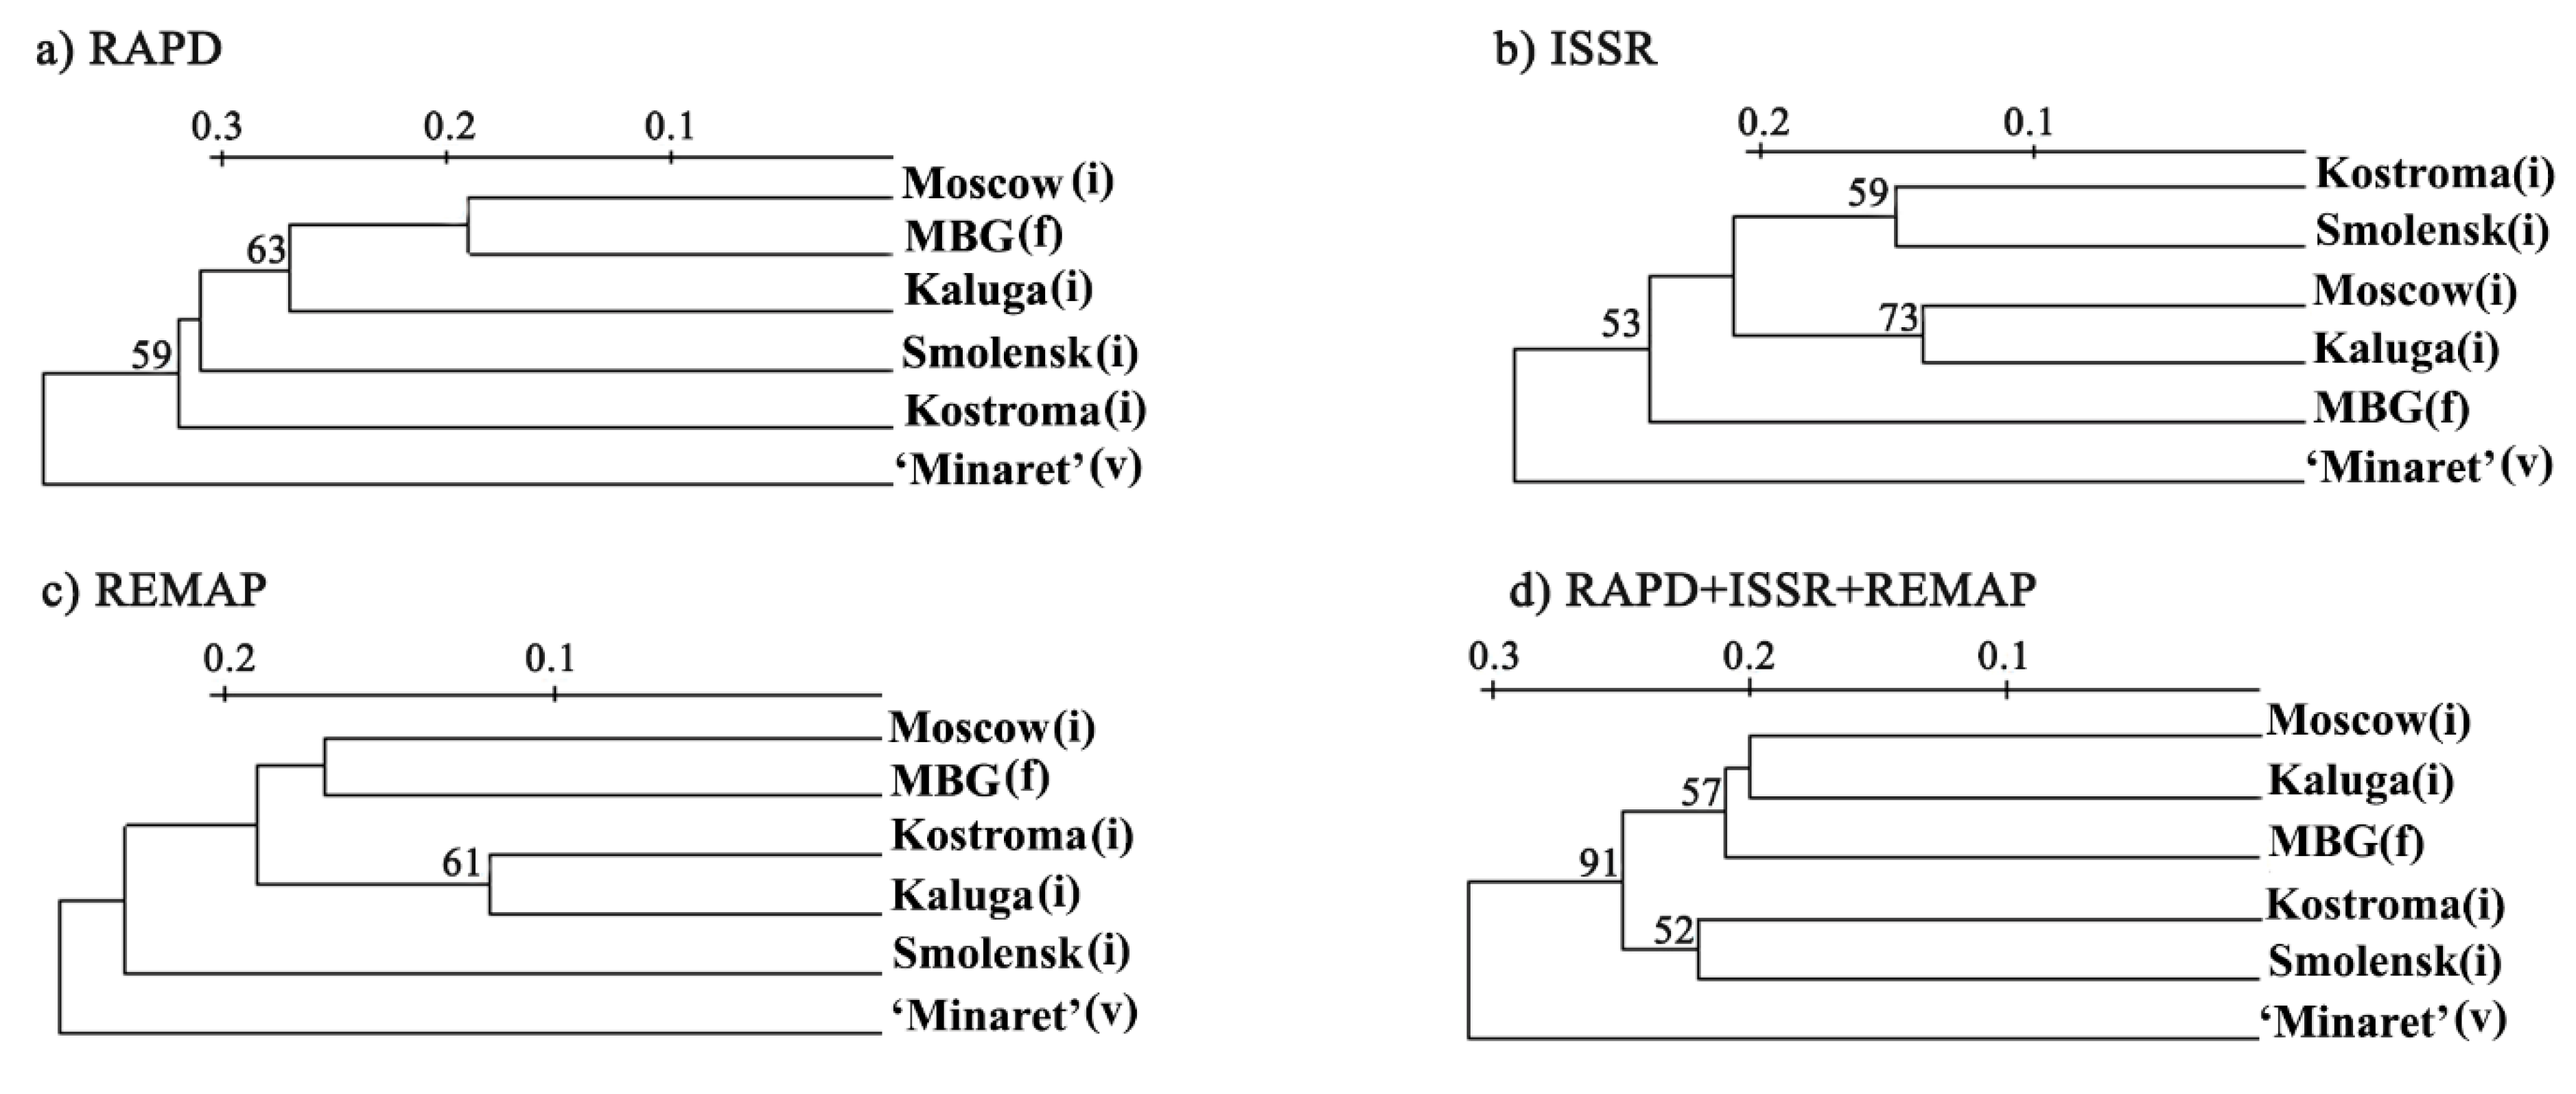
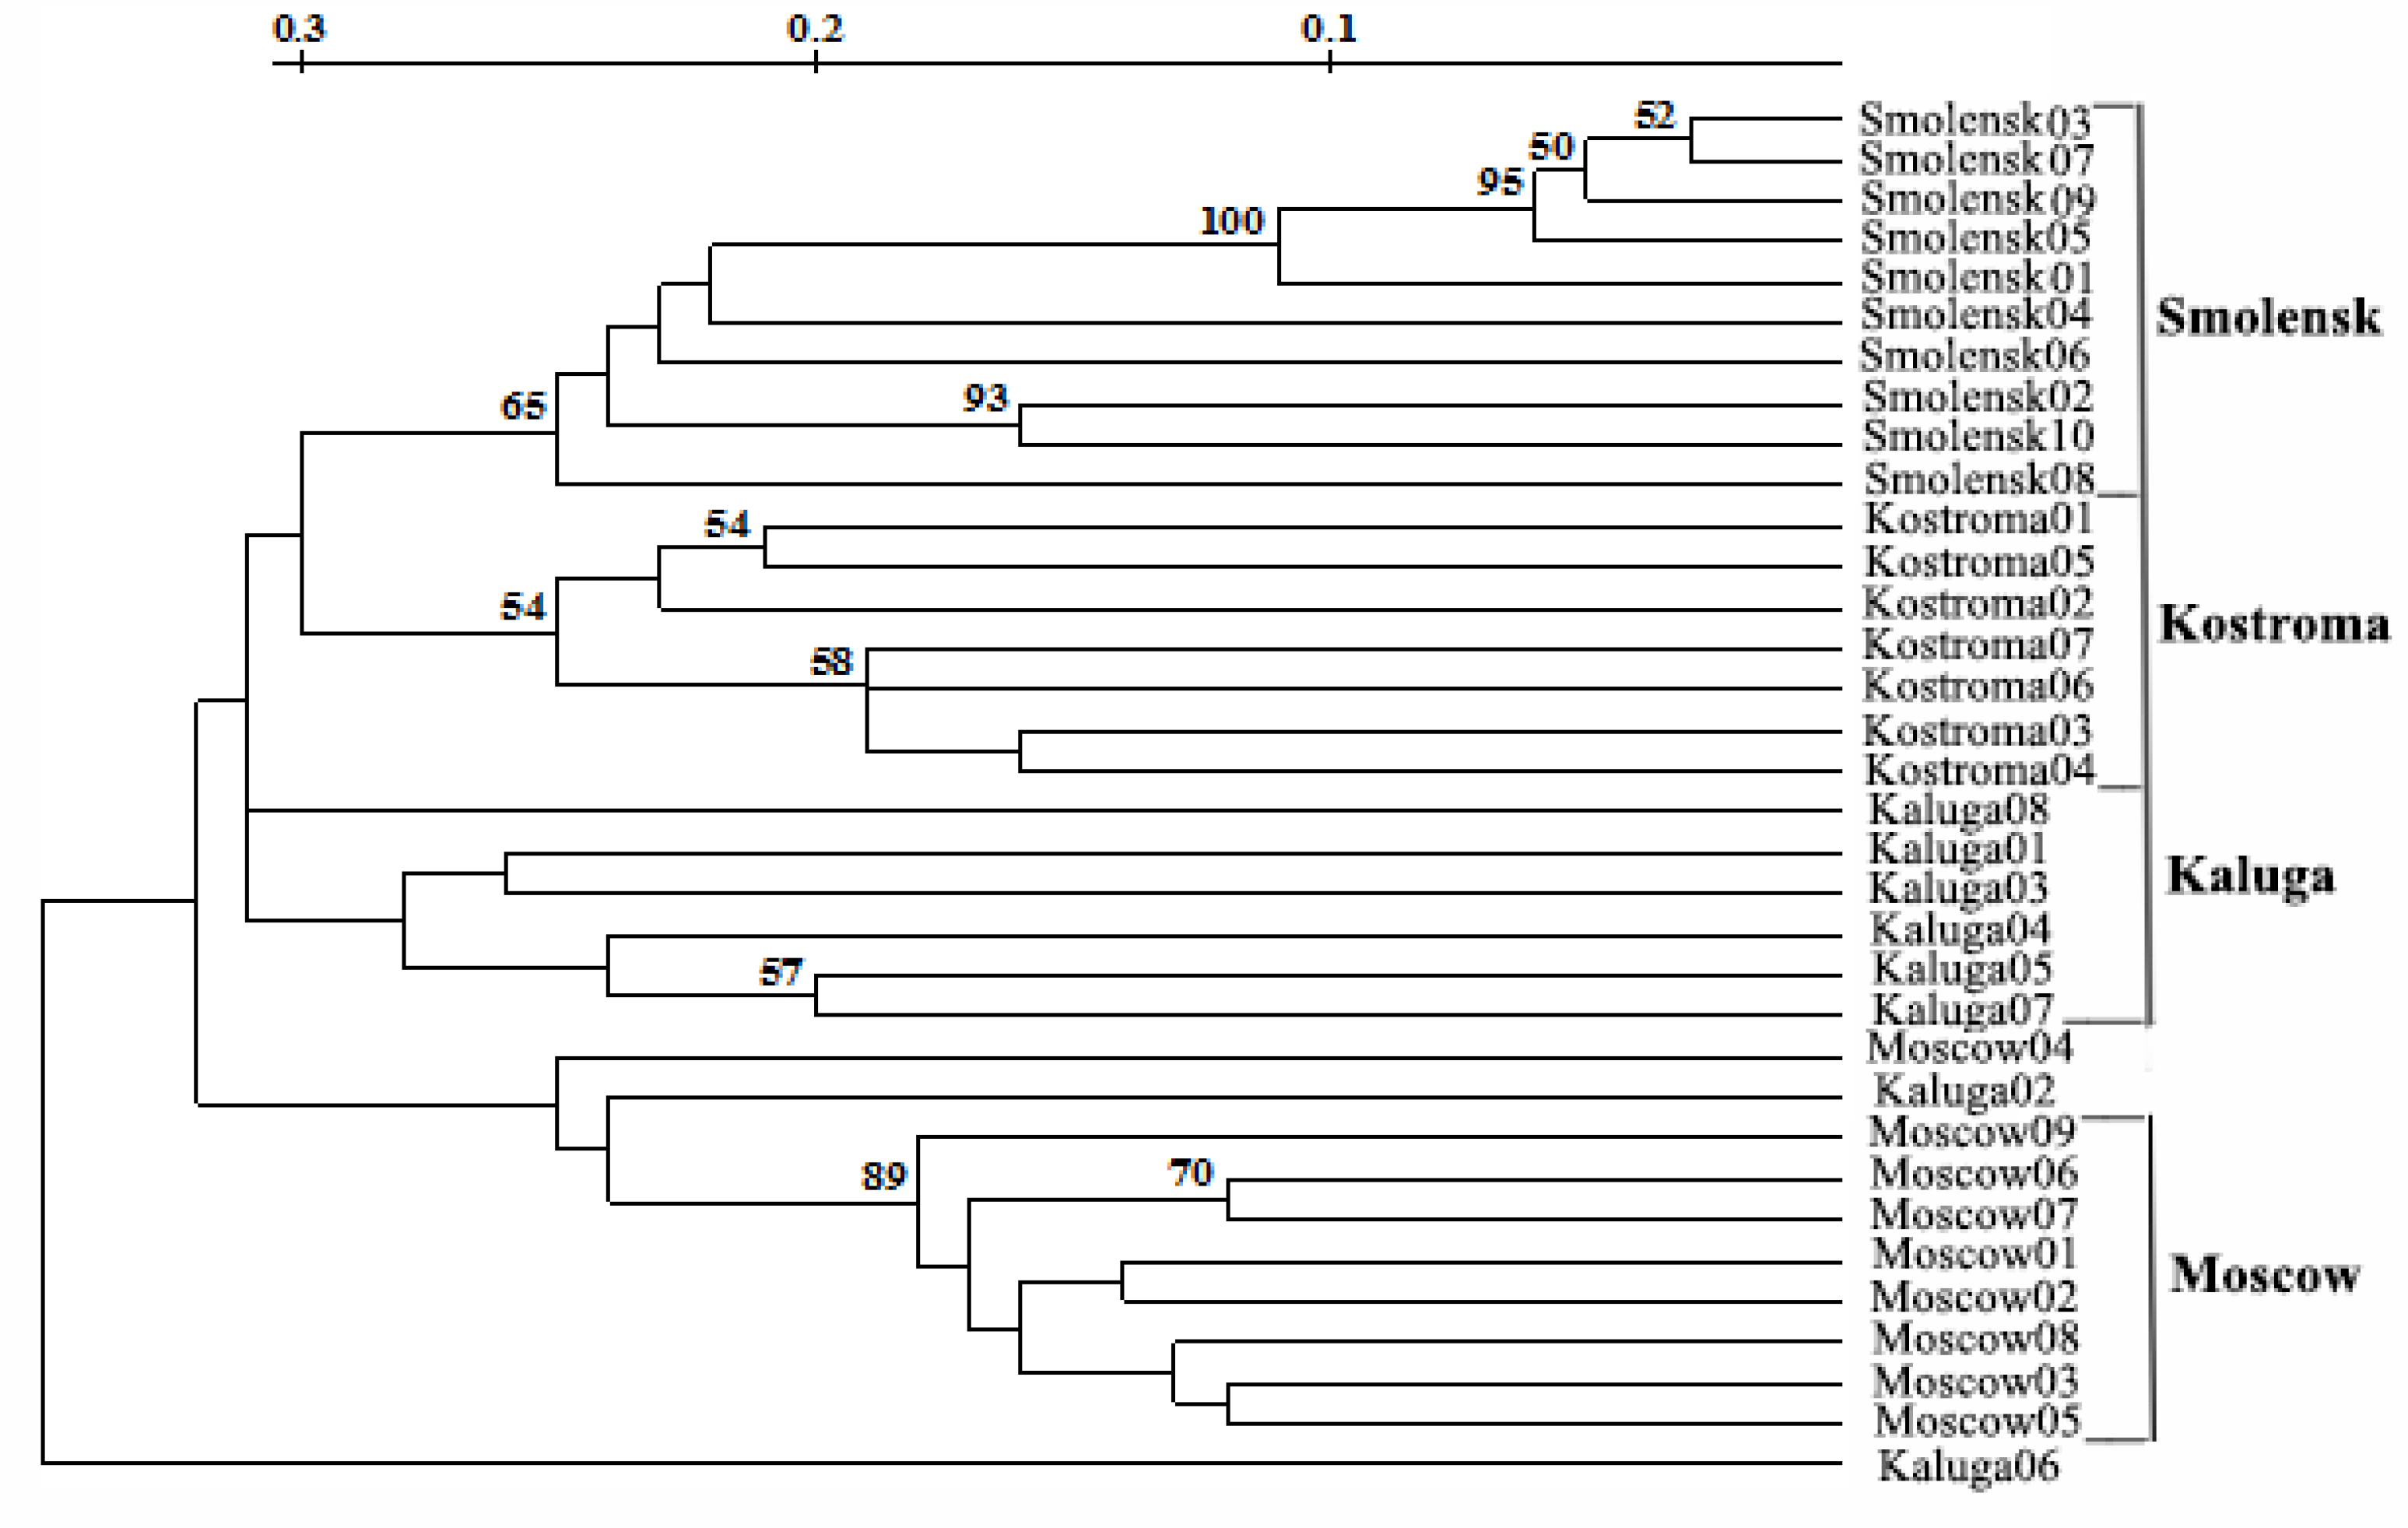
3.1. Molecular Analyses of L. polyphyllus

Some primers amplified fragments that were common for all analysed plants (RAPD: OPA-2—1300 bp and 520 bp, QR-5—730 bp, 450–850 bp; ISSR: MS1—400 bp; REMAP: MS4+TarI—210 bp, MS2+Thv19—170 bp). These fragments may represent nucleotide sequences specific to L. polyphyllus. Other primers amplified fragments specific for groups of plants (RAPD: OPA-2–large (about 2000 bp) fragments from the DNA of most plants of the ‘Minaret’ variety; a 400 bp fragment specific for Smolensk region plants; QR-5–1450; and 1500 bp fragments from the ‘Minaret’ variety; REMAP: MS7+Wis–900 bp from the feral population at MBG). Such fragments may be of interest as markers for those populations (Figure 1).
The genetic diversity between populations and the ‘Minaret’ variety varied from 0.196 to 0.341 and was 0.260, on average (Table 3).
Additionally, the genetic diversity within invasive and feral populations and the ‘Minaret’ variety was calculated. To evaluate the genetic diversity within invasive population, the populations from Moscow, Kaluga, Smolensk, and Kostroma regions were pooled (34 samples). The amplified fragment profiles from 34 plant samples were presented as binary matrices and used to determine genetic diversity values (Supplementary Table S2). Depending on the method (RAPD, ISSR, or REMAP), the mean values of genetic diversity varied, but the general trend was the same: the invasive population had the highest values, and the ‘Minaret’ variety had the lowest values. With all the methods combined, the mean value of genetic diversity was 0.294 for the invasive population and 0.248 for the feral MBG population, which was 1.2-times lower than that for the invasive population. For the ‘Minaret’ variety, genetic diversity was 0.194, which was 1.5 times lower than that for the invasive population (Table 4). Notably, genetic diversity among populations (0.260) was less than the genetic diversity within invasive population (0.294).
Phylogenetic trees were built by using individual methods (RAPD, ISSR, REMAP) and all methods combined (Figure 2).
Regardless of the method used, the ‘Minaret’ variety was considerably different from the other populations. RAPD and REMAP clustered together populations from the Moscow region and the feral population at MBG (Figure 2a,c). However, ISSR clustered Moscow and Kaluga region populations (Figure 2b). Altogether, the methods clustered the populations from Moscow and Kaluga regions with the feral MBG population; they also clustered Smolensk and Kostroma populations. This clustering almost reflects the geography of the populations. The Moscow Smolensk and Kaluga regions border each other, but the Kostroma region is far from them. The ‘Minaret’ variety was separated from these clusters (Figure 2).
The phylogenetic tree of the invasive population had four clusters that almost coincided with the geographic origins of Moscow, Kaluga, Smolensk, and Kostroma populations (Figure 3).
The genetic diversity values within the feral MBG population (21 samples) and the ‘Minaret’ variety (29 samples) were calculated similarly (Supplementary Tables S3 and S4, respectively), and phylogenetic trees were built (data not shown).

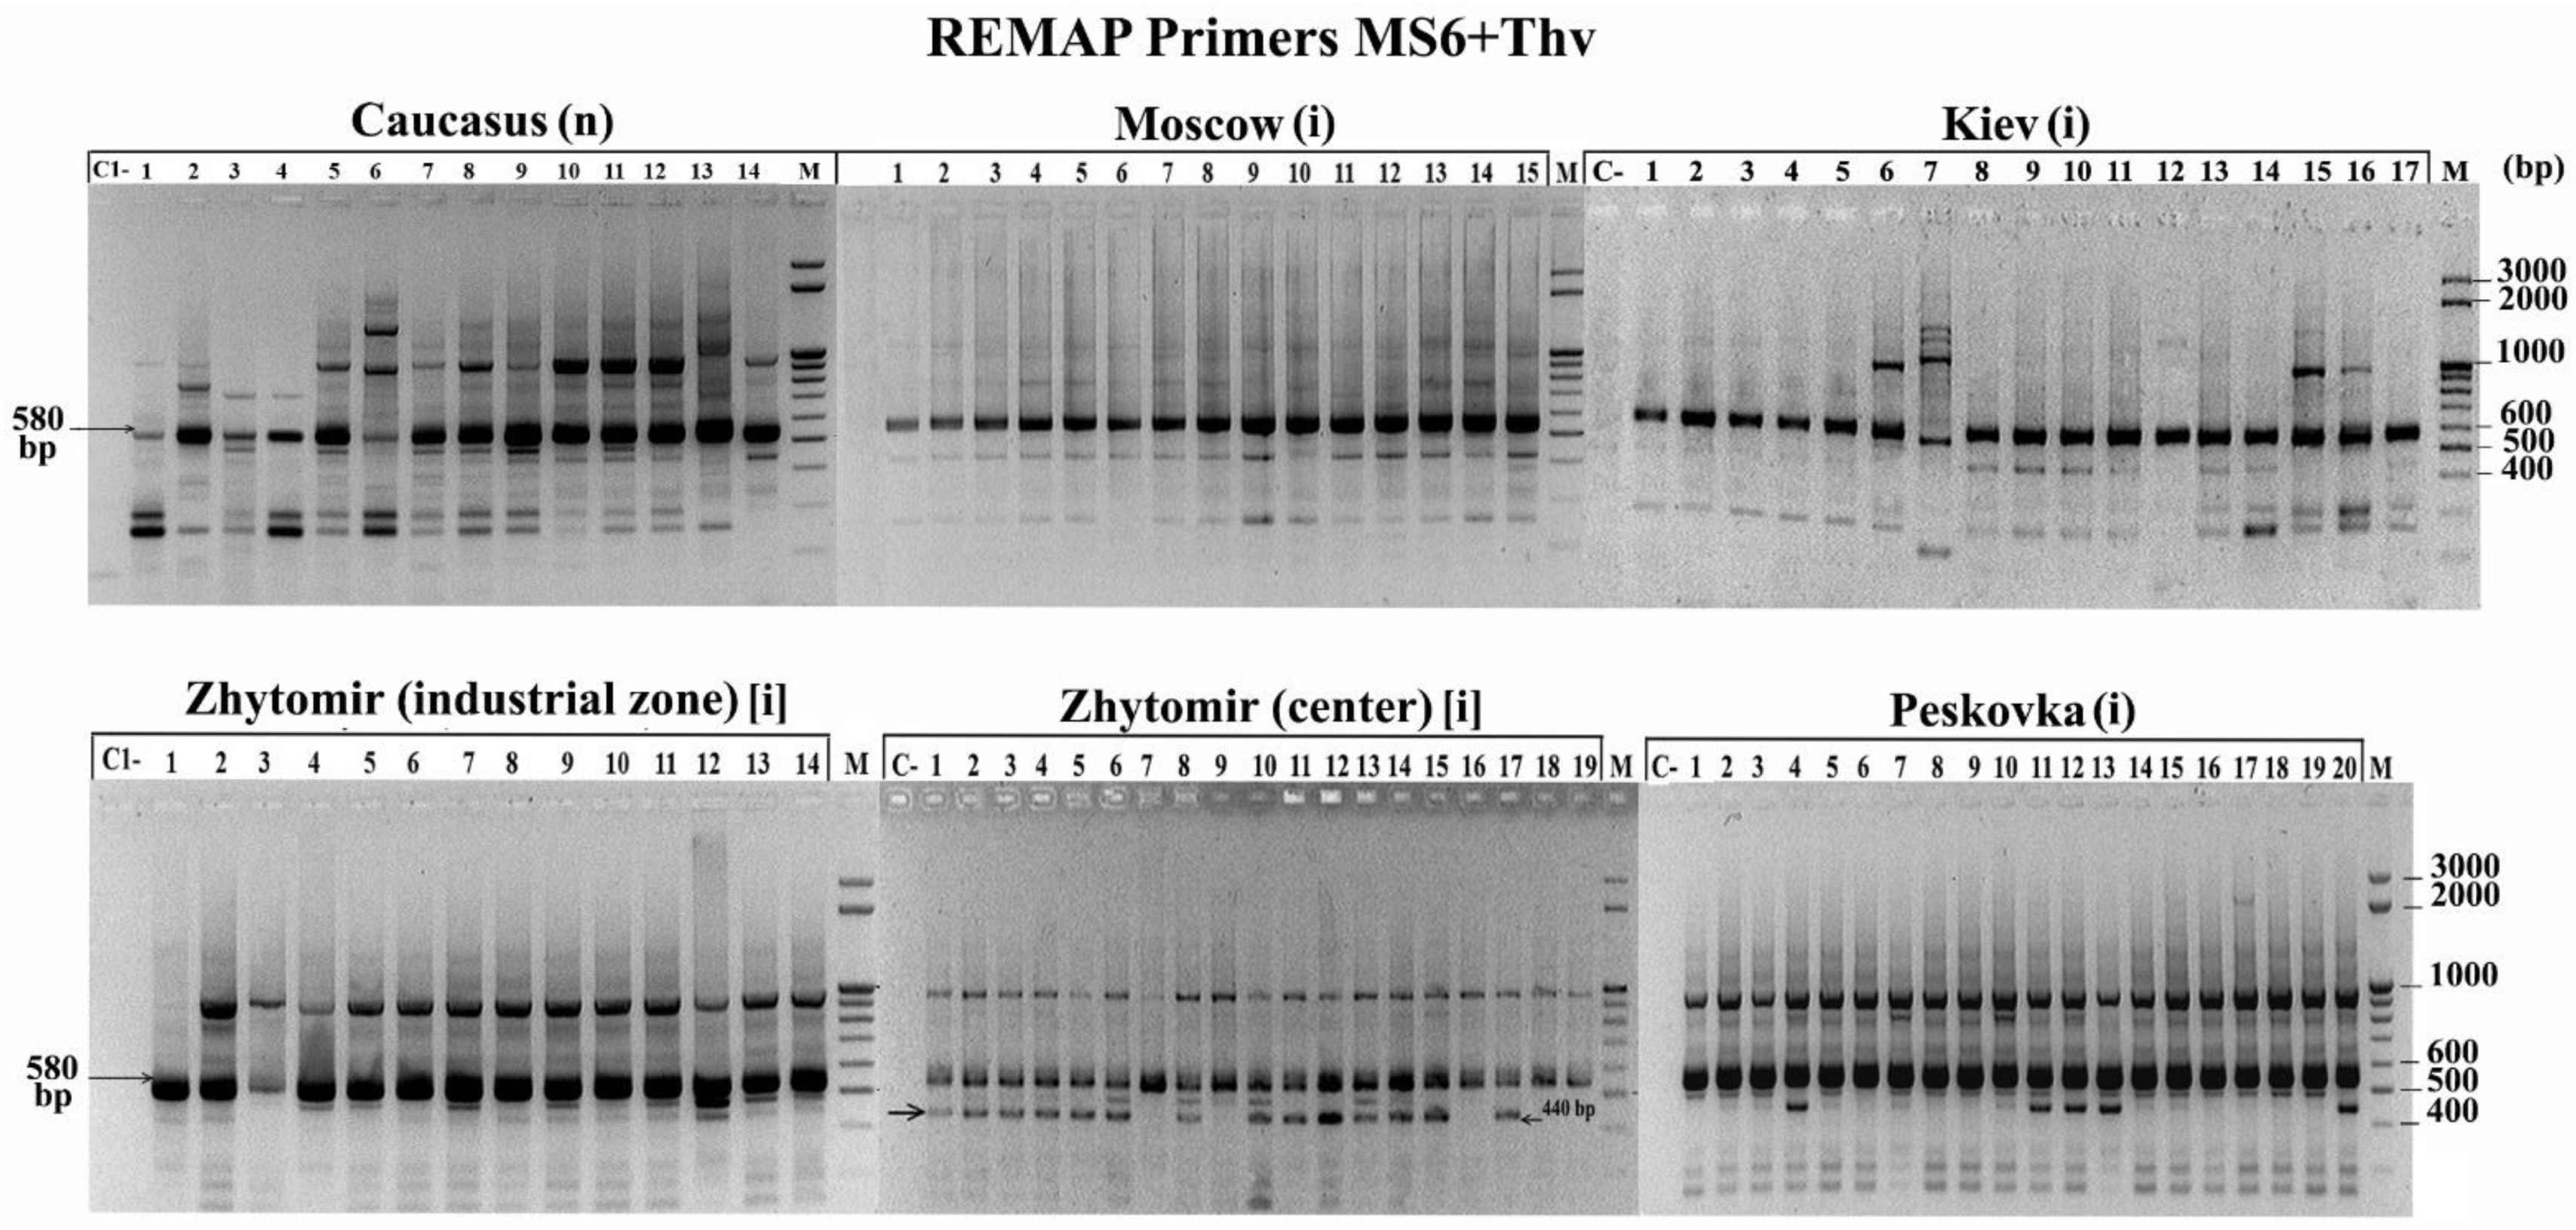
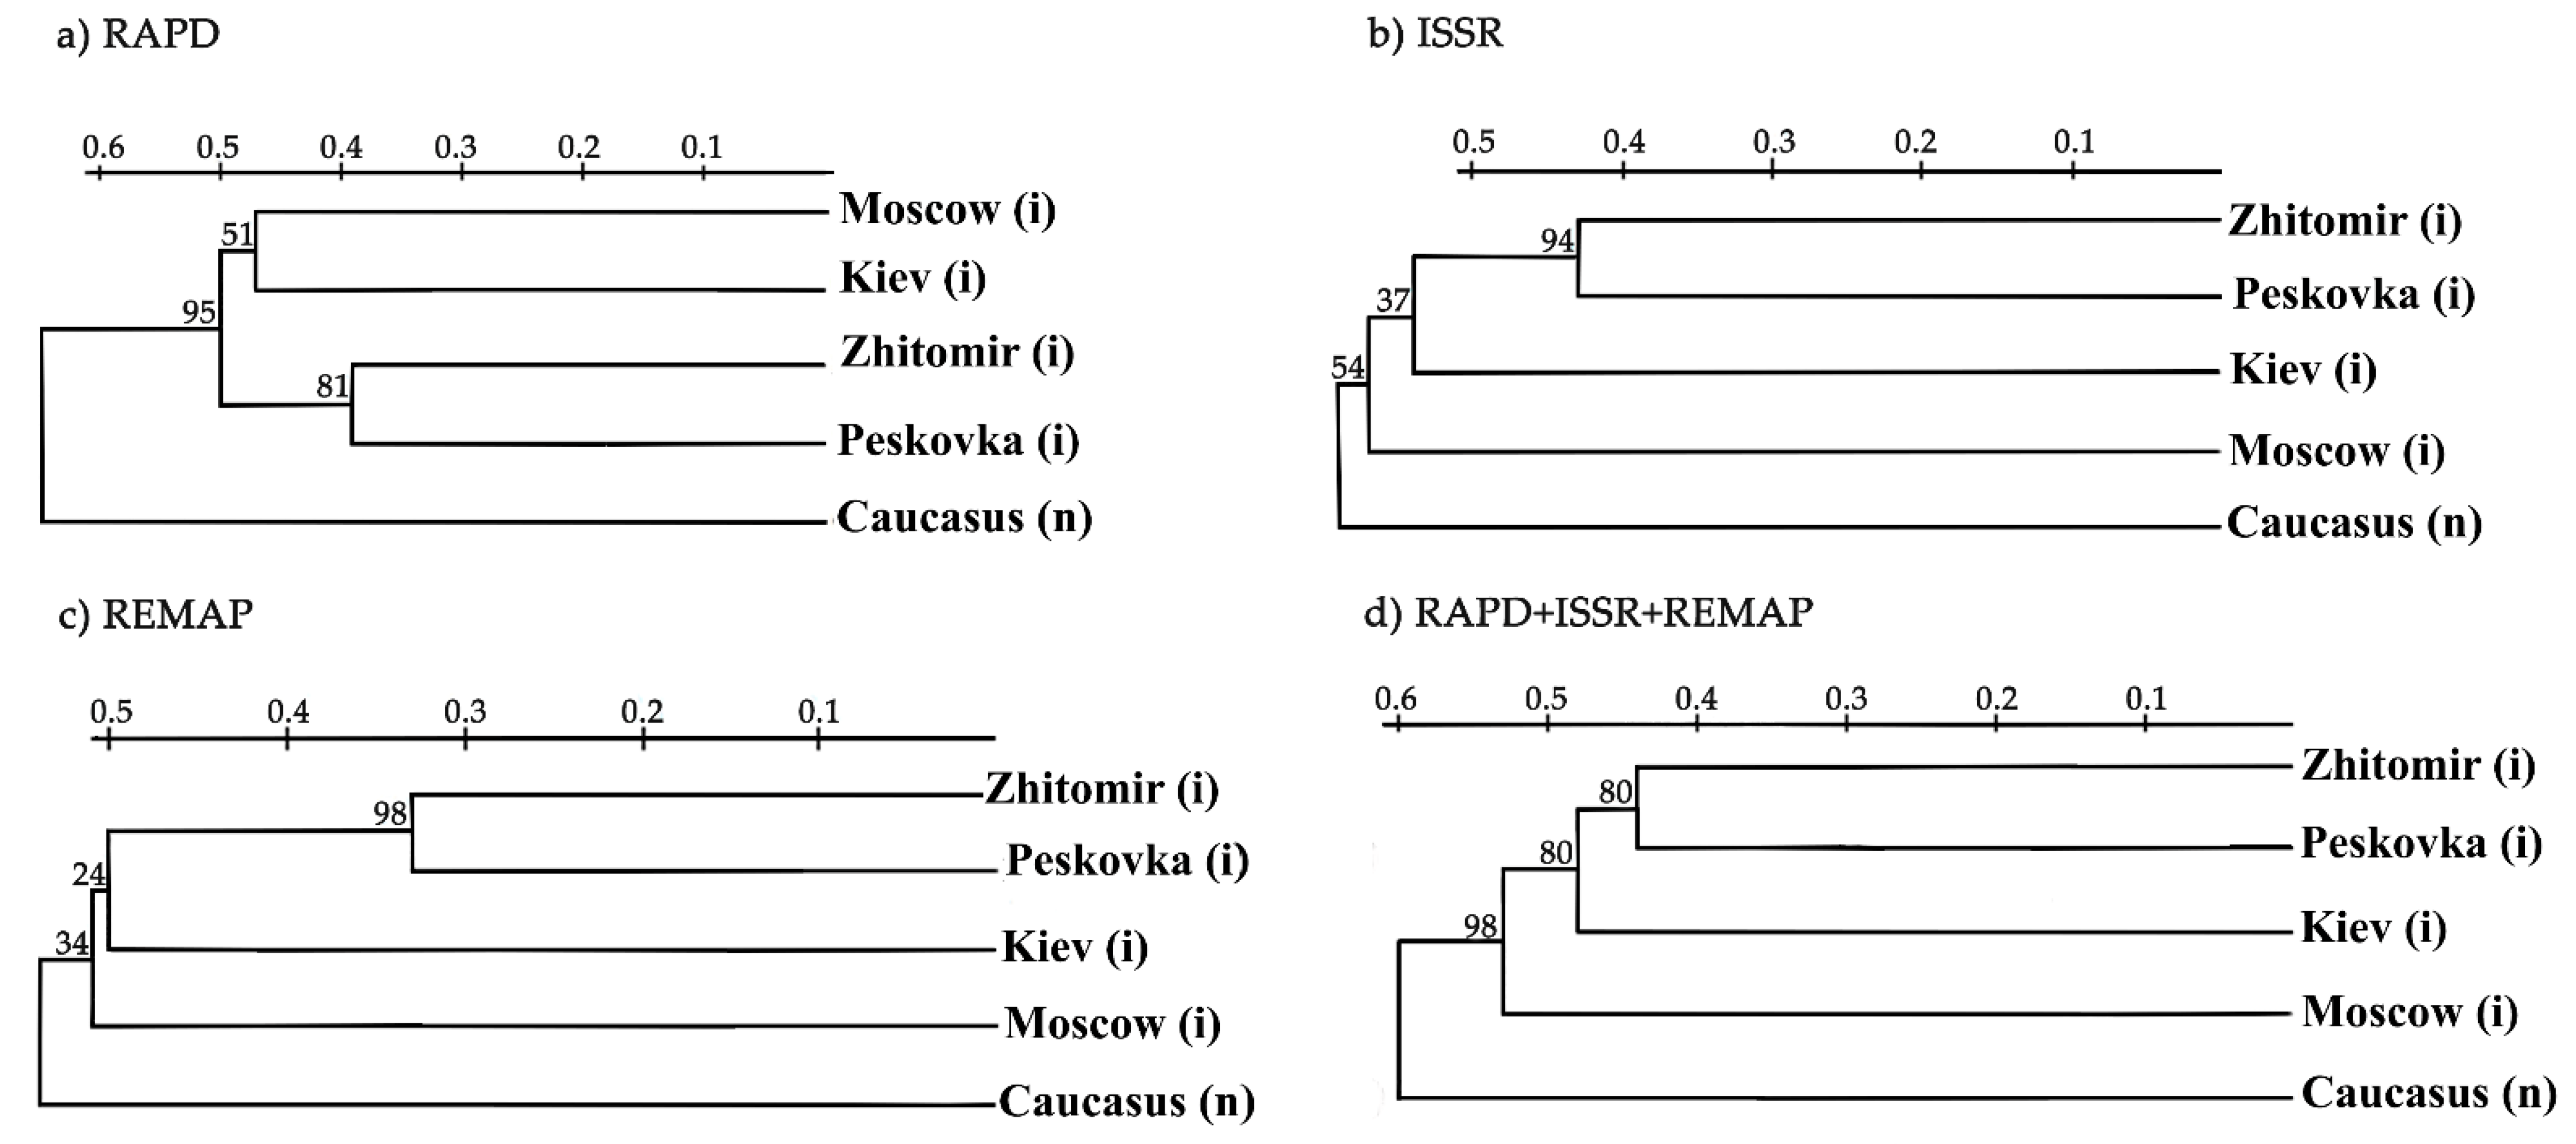
3.2. Molecular Analyses of H. sosnowskyi

In hogweed, in contrast to lupin, only a few primers amplified monomorphic fragments typical for all plants and some populations (RAPD: QR-1—900 bp, QR-2—590 and 800 bp; ISSR: MS1—1500 bp; REMAP: MS6 + Thv19—580 bp). Interestingly, with primers MS6 + Thv19, a 440 bp fragment was detected, which is characteristic of plants growing in the centre of Zhytomir but absent in plants of the industrial zone of Zhytomyr (Figure 4).
The populations from industrial zones and the centre of Zhitomir were pooled (33 samples), and the genetic diversity between the populations of hogweed was significant, varying from 0.438 to 0.614, and was 0.539, on average (Table 5).
The greatest genetic diversity was between populations from Moscow and Caucasus (0.614). This could be explained by the significant remoteness of the Moscow population and its evolution in the process of adaptation to a new habitat. The least genetic diversity was found between the Zhitomir and Peskovka populations (0.438). This could be explained by anthropogenic dispersal from one region to another. This is hardly a possible result of gene flow, since the distance between the Zhitomir and Peskovka is about 100 km (Supplementary Figure S2). The genetic diversity within each of the populations was calculated and varied for the Moscow region from 0.217 to 0.606, with an average of 0.398 (Supplementary Tables S5), for Peskovka from 0.224 to 0.678 with an average of 0.418 (Supplementary Tables S6), for Kiev from 0.265 to 0.622 with an average of 0.441 (Supplementary Tables S7), for the Zhitomir industrial zone from 0.216 to 0.640 with an average of 0.446 (Supplementary Tables S8), for Zhitomir centre from 0.248 to 0.629 with an average of 0.457 (Supplementary Tables S9), and within the native Caucasian population from 0.244 to 0.739 with an average of 0.502 (Supplementary Tables S10). There were no significant differences in genetic diversity in populations from different regions of Zhytomyr. The genetic diversity within the native Caucasian population was compared with that within the invasive population but was not significantly higher (Table 6). Unlike lupin, the genetic diversity between hogweed populations was greater than the genetic diversity within populations.
Phylogenetic trees were built using individual methods (RAPD, ISSR, REMAP) and all methods combined (Figure 5).
Regardless of the method used, the Zhytomyr and Peskovka populations clustered together with high bootstrap values, indicating their close relationship (Figure 5). Hogweed from Zhitomir may have been introduced to Peskovka or vice versa. ISSR and REMAP clustered populations from Kiev, Zhitomir, and Peskovka that corresponded to their close geographical locations (Figure 5b,c). The use of RAPD combined Moscow and Kiev populations, but the dendrogram obtained by the combination of RAPD, ISSR, and REMAP revealed only one cluster with Zhitomir and Peskovka, although the Kiev population was close to them (Figure 5d). The Caucasian population was separated in all the dendrograms, suggesting a significant divergence between the native and invasive populations (Figure 5).

4. Discussion

4.1. Discussion of the Genetic Diversity within Populations of Lupin

RAPD, ISSR, and REMAP techniques were used to study the genetic diversity of various populations of L. polyphyllus. All techniques gave reproducible results with an adequate number of polymorphic and monomorphic fragments necessary for estimating the genetic diversity both within and between populations. As there are few investigations of L. polyphyllus by means of PCR markers, especially where genetic diversity was calculated [35,36], we considered studies of other species of Lupinus.
Qiu et al. [37] used short eight-nucleotide primers for studying L. albus L. Wolko et al. [38] identified polymorphisms using RAPD among four cultivars of L. albus, seven cultivars of L. angustifolius L., and twelve cultivars of L. luteus. Gilbert et al. [39] used ISSR to reveal genetic variability within and between L. albus accessions from a collection of lupin germplasm. Yorgancilar et al. [40] successfully used RAPD and ISSR to determine the genetic relationships among 20 Old World lupin genotypes of three lupin species (L. albus, L. angustifolius, and L. luteus). Using ISSR, Artyukhova [41] developed a technique for the identification of varieties of three lupin species: L. angustifolius, L. hiteus, and L. albus. Clements et al. [42] investigated 10 L. angustifolius genotypes using ISSR markers. Similarly, Guilengue et al. [43] analysed L. mutabilis using ISSR. Khapilina et al. [44] succeeded in using REMAP and other retrotransposon analysis methods to estimate the genetic diversity of L. angustifolius.
The reliability of ISSR, REMAP and, especially, RAPD is supported by the results obtained. Firstly, three phylogenetic trees of the analysed populations built upon RAPD, ISSR, and REMAP data showed the ‘Minaret’ variety is considerably divergent from the other populations (presumably due to its independent origin) (Figure 2). Secondly, the tree of the invasive population built on the combined data had four clusters that almost coincided with the locations of the respective populations, namely Moscow, Kaluga, Smolensk, and Kostroma regions (Figure 3). Thirdly, the genetic diversity values obtained by RAPD, ISSR, and REMAP for each population tightly correlated (Table 4).
The genetic diversity for the invasive population was the highest, and varied from 0.045 to 0.411 (Supplementary Table S2), with an average of 0.294 (Table 4). The genetic diversity among populations varied from 0.196 to 0.341 (Table 3) and was 0.260, on average, which was less than the genetic diversity within invasive population. Similar results have been previously published for other species of lupin. Vysniauskiene et al. [35] analysed 10 invasive populations of L. polypyllus in Lithuania with RAPD and found that Nei’s average genetic distance between populations was 0.148 ± 0.021, which was also less than the average genetic distance between individuals in the forest (0.290 ± 0.062) and field populations (0.229 ± 0.037). The authors observed significant genetic differentiation among populations in genetically heterogeneous seed stock, low gene flow between populations, and, possibly, in local adaptations [35]. Li et. al. [36] investigated 51 L. polypyllus populations in Finland using 13 polymorphic microsatellite loci. The authors found that the genetic variation among populations was 0.05; it was significantly higher (0.25) within populations. Pairwise FST values among populations ranged from 0.02 to 0.25 and the global FST value was 0.19, suggesting moderate levels of genetic differentiation. The authors suggested that it was the result of human-mediated dispersal with multiple introductions from different sources rather than the natural spread of L. polyphyllus from a single or few sources in Finland [36]. Oumer et al. [45] used ISSR to study four L. albus populations from two zones of Ethiopia and found that the genetic diversity was 0.223 for Merawi, 0.198 for Addis Kidam, 0.189 for Sekela, and 0.167 for Wembera: larger genetic diversity was found within rather than between populations. The authors supposed that high genetic diversity between populations might be the result of moderate gene flow and within the populations could be caused by the presence of preferential or diverse adaptive genes [45]. Similar data on the level of genetic distances were described by Mahfouze et al. [46], who estimated the genetic similarity among seven genotypes of L. albus using RAPD and ISSR, where the Nei genetic similarity index ranged from 0.74 to 0.88 (diversity from 0.12 to 0.26) [46].
In our study, the high level of genetic diversity within populations (among individual plants) was most likely associated with genetically heterogeneous seed stock and cross-pollination. The lower level of genetic diversity between populations was hardly a possible result of gene flow, since the distance between the Smolensk and Kostroma regions was about 700 km (Supplementary Figure S1), but more likely the result of seed source. Since lupin was cultivated for green mass or as an intermediate crop, the same standardised seed stock approved for cultivation was imported to different regions and could be the reason for the clustering of Smolensk and Kostroma populations on the dendrogram (Figure 2d).
There are studies where the values of genetic diversity within species are much higher than ours. Al Rawashdeh et al. [47] studied L. pilosus using RAPD and found its genetic similarity to range from 0.02 to 0.450 (diversity 0.550–0.980). The low similarity could have been due to a high, long diverging process in non-coding regions [47]. There are studies where the values of genetic diversity within species are more variable. Sbabou et al. [48] revealed the genetic similarity between and within Moroccan germplasm (L. albus, L. angustifolius, L. cosentinii, and L. luteus) by means of AFLP and ISSR markers. Similarity values were 0.70–0.82 (diversity 0.18–0.30) among accessions of L. albus, 0.24–0.61 (diversity 0.39–0.76) among accessions of L. cosentinii, and 0.68–0.88 (diversity 0.12–0.32) among accessions of L. luteus [48]. There are also studies where the values of genetic diversity within species are very low. Talhinhas et al. [49] used RAPD, ISSR, and AFLP to detect interspecific and intraspecific polymorphism in Lupinus spp. The intraspecific polymorphisms were revealed by AFLPs with similarity values of 0.908–0.955 (diversity 0.045–0.092) among L. albus accessions, 0.913–0.954 (0.046–0.087) in L. angustifolius, 0.920–0.988 (0.012–0.080) in L. hispanicus, 0.867–0.940 (0.060–0.033) in L. luteus, and 0.957–1.000 (0.043–0.000) in L. mutabilis [49].
Unfortunately, it was not possible to compare the genetic diversity of the invasive population in our study with the native population of L. polypyllus due to the lack of samples. Thus, it is unclear whether the invasive population has recovered after invasion and adaptation, or whether its genetic diversity is increasing. As far as we are aware, there are no published data on the genetic diversity or similarity of the native population of L. polypyllus.
In our research, in addition to the invasive and feral populations, the ‘Minaret’ variety was analysed. That this variety is not the source of the feral population is confirmed by all the dendrograms (Figure 2; unfortunately, information about the original variety has been lost). Although ‘Minaret’ cannot be a negative control for this feral population, low genetic diversity was expected as nearly all varieties have specific genotypes with selected characteristics which reduces their genetic diversity. Indeed, ‘Minaret’ had the lowest genetic diversity, varying from 0.099 to 0.288 (Supplementary Table S4), with 0.194, on average (Table 4).
The genetic diversity of the feral population (MBG) varied from 0.130 to 0.363 (Supplementary Table S3), with an average of 0.248 (Table 4), and was greater when compared to ‘Minaret’, but lower when compared to the invasive population. We believe that genetic diversity could have increased in the process of naturalization. The feral population, represented by the escaped variety, could be regarded as the beginning of the invasion. Additionally, the blue flowers characteristic for the wild species began to prevail. This may be due to gene flow by cross-pollination with other lupin plants growing nearby.
Tkacheva [50] compared the biomorphological traits of feral (5 years of naturalisation) and Smolensk populations (30 and 40 years of naturalisation). The author found that the number of leaves and lateral flowering shoots per plant increased with a longer naturalisation period, but the number of seeds and plant height did not differ significantly. Although Ramula and Kalske [51] revealed that L. polyphyllus from the introduced populations were larger in size, they flowered less frequently and with fewer flowering shoots than plants from the native populations. Tkacheva [50] also studied the density of populations growing in forests and fields (Moscow and Smolensk regions). No significant differences in both populations were noted, indicating the ability of lupin to occupy biotopes with different levels of illumination. The author supposed that the success of L. polyphyllus as an invasive species could be explained by the increased competitive ability (EICA) hypothesis, which proposes that a larger size is selected due to intense intraspecific competition or reduced herbivore pressure in a new area [52].
The intermediate level of genetic diversity in the lupin feral population and high level in the invasive population discovered in our research, together with the other data revealed for the same populations (the increase of some biomorphological traits, and the ability to occupy new biotopes [50]) suggests the further expansion of L. polyphyllus invasion.

4.2. Discussion of the Genetic Diversity within Populations of Hogweed

Unfortunately, as with L. polyphyllus, there are few published investigations of H. sosnowskyi by means of PCR markers, especially where the values of genetic diversity have been calculated [53]. Therefore, again we analysed studies of other Heracleum spp. A study of H. sosnowskyi was performed previously using RAPD [54,55]. Strygina et al. [56] analysed the genus Heracleum using RAPD and ITS analysis, while noting its high genetic and morphological heterogeneity.
We compared published data with our study, where the genetic diversity among the populations varied from 0.438 to 0.614 with an average of 0.539 (Table 5). Niinikoski and Korpelainen [57] investigated H. mantegazzianum from eight populations in Finland using microsatellite markers. The authors found that the range of pairwise FST values between populations was high (0.052–0.797), and the mean FST among all populations was 0.498, showing a significant difference. The authors observed differentiation between populations, resulting from multiple introductions combined with limited gene flow [57].
It is difficult to say why the average genetic diversity for lupin (0.260) was two times lower than for hogweed (0.539). Both species are diploid, L. polyphyllus with 2n = 48 [58] and Heracleum spp. with 2n = 22 [59]. It is probable that the hogweed genome contains more non-coding repeating regions, where as a rule, MAAP primers are annealing.
Unlike lupin, the genetic diversity among hogweed populations was greater (0.539) (Table 5) than that within the populations (0.398–0.502) (Table 6). This greater diversity might be explained by the large spread of values in genetic diversity within the population; for example, for the Caucasus from 0.244 to 0.739 (Supplementary Table S10), while the spread of values between populations was not so large 0.438 to 0.614 (Table 5). The lower genetic diversity within the populations also could be explained by the ability of H. sosnowskyi to self-pollinate. Walker et al. [60] investigated 13 H. mantegazzianum populations in northeast England using four nuclear microsatellite and one plastid marker. Similar to our research, the genetic differentiation between populations from different river catchments was higher (FST mean pairwise 0.28 ± 0.1) than that within populations from the same area (FST mean pairwise 0.11 ± 0.08). The overall FST mean pairwise was 0.24 ± 0.13. The authors suggested that the high genetic differentiation between populations may indicate a large initial founder population or multiple introductions. Within population, seeds of this species are dispersed in water, resulting in a relatively small dispersal area and the relatively small dispersal range of likely pollinators [60].
The genetic diversity within invasive populations varied from 0.398 to 0.457 with an average of 0.432 (Table 6); diversity was similar, but slightly less within the native Caucasian population with an average of 0.502 (Table 6). This suggests the successful naturalisation of invaders and reconstruction of their genetic diversity, probably by means of hybridisation and rapid evolution. In our study, similar genetic diversity values for invasive and native populations were observed. However, according to the literature, different cases have been described. Invasive populations may display higher genetic diversity than native populations and vice versa. Jahodová et al. [53] analysed three invasive Heracleum species using AFLPs. The genetic similarity (Pairwise Dice’s similarity coefficient) in H. sosnowskyi among all populations was 0.891, on average (diversity 0.109); within Europe, it was 0.901, on average (diversity 0.099), and within the native range, it was 0.908 (diversity 0.092). The authors noted that more within-taxon variation was detected in the invaded range (Europe) than in the region of the native distribution, probably driven by hybridisation and inbreeding. The results also indicate that multiple introductions, rapid evolution and drift are likely to have occurred [53]. Henry et al. [61] investigated 49 H. mantegazzianum populations from the western Swiss Alps and 11 Caucasian populations using eight nuclear microsatellite loci together with plastid DNA markers and sequences. FST mean pairwise genetic differentiation for nuclear microsatellite loci between invasive populations varied from 0.180 to 0.396 with an average of 0.315 and between native populations from 0.092 to 0.202 with an average of 0.162. The authors indicated that the high population differentiation observed in the invasive range compared to the native range could have been generated by sequential founder events. The species may have been introduced multiple times, possibly from disparate source populations [61]. Rijal et al. [62] studied 50 native and introduced populations of H. persicum with 27 microsatellite markers and estimated that FST mean pairwise genetic differentiation (averaged over the population) was lowest between England and Sweden (0.267 ± 0.006), and highest between Norway and Denmark (0.552 ± 0.005). The mean FST was lower in the native (0.25) compared to the introduced range (0.30), but the difference was marginal and nonsignificant [62].
Analysing other data such as the percentage of polymorphic loci, observed and expected heterozygosity, allelic richness and inbreeding coefficient, Henry et al. [61] and Rijal et al. [62] noted the loss of genetic diversity in the introduced ranges compared to native ranges. In our investigation, MAAP markers detected differences throughout the entire genome. As a rule, these markers are dominant and can detect only two alleles (present or absent fragment). At the same time, nuclear microsatellite markers, plastid, ribosomal, and mitochondrial DNA markers are locus specific and can detect several alleles, since their PCR fragments are sequenced. Therefore, the definition of ‘genetic diversity’ used for these techniques could be different. For our purposes, ‘genetic differentiation’ could be similar to ‘genetic diversity.’
According to the literature, invasive populations often have lower genetic diversity compared to the native population due to bottlenecking, genetic drift during colonisation, and founder effects [63]. However, in the territory of the former USSR, H. sosnowskyi was widely introduced at the state level. The Institute of Biology of the Komi Republic received H. sosnowskyi seeds from many botanical gardens and from native ranges (Nalchik). In the decade 1940–1950, accumulation of seeds and cultivation of this plant was of great importance in five main centres: Murmansk, Moscow, and Leningrad regions, the Republic of Komi, and Kabardino-Balkaria. For example, 140 hectares of H. sosnowskyi were planted in the Rzhevsky region, and 7600 kg of its seeds were sent to 60 addresses [64].
A rapid local adaptation and evolution in invasive ranges is characteristic of H. Sosnowskyi. The sizes of all parts of invasive plants of H. sosnowsky are larger than plants of native populations: the height of the stem (1–1.5 m in the Caucasus and 2–4 m in Europe) and the size of the seeds (in Caucasian species, 9 mm long and 6 mm wide; in Europe, 15 mm long and 8 mm wide). In addition, Caucasian plants grow in forests and meadows, whereas plants of the invaded range are photophilous and mainly found in open habitats [65].
A high level of genetic diversity in hogweed invasive populations, similar to the native Caucasion population, was found in our research, suggesting reconstruction of their genetic diversity. This high level of genetic diversity, together with data suggesting the increase of some biomorphological traits, the ability to occupy new biotopes [65], and to hybridize with the native H. sibiricum and H. spondyllium and other introduced hogweeds [66] reported in the literature, could drive the further expansion of H. sosnowskyi invasion.

5. Conclusions

Both L. polyphyllus and H. sosnowskyi have been used in agriculture (lupin since 1922 [11], hogweed since 1947 [16]). Many seeds of both crops were imported from different ranges, including their natural habitats, so that multiple introductions resulted in a large number of founders. It is probable that the genetic diversity did not initially decrease. Moreover, the genetic diversity could have increased as a result of genetic exchanges between populations originating from different regions. Therefore, in this case we cannot speak to the genetic paradox of invasion, because genetic variation in populations is not lower than the native source population and has not passed through a bottleneck [67]. Where varieties were bred, genetic diversity was likely reduced, but after naturalization to a new habitat, diversity in feral populations began to increase again. Therefore, our results suggest that anthropogenic dispersal may be a major factor contributing to the successful invasion of L. polyphyllus and H. sosnowskyi, together with their individual characteristics, which include environmental tolerance, high fertility, phenotypic plasticity, cold resistance, and the ability to occupy new biotopes. Both species have turned into transformers and supplanted the native species, significantly reducing the diversity of biogeocenoses [65,68]. Thus, these species require further study to successfully control their invasion.

Supplementary Materials

The following materials are available online at https://www.mdpi.com/article/10.3390/biology10111094/s1, Figure S1: Map of the lupin sampled populations, Figure S2: Map of the hogweed sampled populations, Table S1: The primers used in the experiments, Table S2: Genetic diversity within lupin invasive population obtained by combination of RAPD, ISSR and REMAP data, Table S3: Genetic diversity within lupin feral MBG population obtained by combination of RAPD, ISSR and REMAP data, Table S4: Genetic diversity within the ‘Minaret’ variety obtained by combination of RAPD, ISSR and REMAP data, Table S5: Genetic diversity within hogweed Moscow invasive population obtained by combination of RAPD, ISSR and REMAP data, Table S6: Genetic diversity within hogweed Peskovka invasive population obtained by combination of RAPD, ISSR and REMAP data, Table S7: Genetic diversity within hogweed Kiev invasive population obtained by combination of RAPD, ISSR and REMAP data, Table S8: Genetic diversity within hogweed Zhitomir industrial zone invasive population obtained by combination of RAPD, ISSR and REMAP data, Table S9: Genetic diversity within hogweed Zhitomir centre invasive population obtained by combination of RAPD, ISSR and REMAP data, Table S10: Genetic diversity within hogweed Caucasus native population obtained by combination of RAPD, ISSR and REMAP data.

Author Contributions

E.S.O. developed the concept, designed the experiments and wrote the article; A.Y.S. did PCR amplifications; D.V.T. and E.A.G. analysed the data; O.N.V. designed the experiments and wrote the article. All authors have read and agreed to the published version of the manuscript.

Funding

This work was supported by the Ministry of Education and Science of the Russian Federation (theme No. 121041200194-7).

Institutional Review Board Statement

Not applicable.

Informed Consent Statement

Not applicable.

Data Availability Statement

The data presented in this study are available upon request from the corresponding author.

Acknowledgments

The authors thank Yu.K. Vinogradova and E.V. Tkacheva from the Main Botanical Garden, named after N.V. Tsitsin of the Russian Academy of Sciences, for providing us dry leaves of Lupinus polyphyllus Lindl., Yavorskaya O.G. for providing us DNA samples of Heracleum sosnowskyi Manden, Denis V. Beliaev and Vadim S. Volkov for help in translation, and Timothy J. Flowers for proofreading.

Conflicts of Interest

The authors declare no conflict of interest.

References

  1. Olmstead, R.G. Review: Are invasive plants an inevitable consequence of evolution? Am. J. Bot. 2006, 93, 1236–1239. [Google Scholar] [CrossRef]
  2. Capizzi, D.; Genovesi, P.; Monaco, A.; Scalera, R.; Carnevali, L. Impact of alien mammals on human health. In Invasive Species and Human Health; Mazza, G., Tricarico, E., Eds.; CABI: New York, NY, USA, 2018. [Google Scholar] [CrossRef]
  3. Adriaens, T.; Branquart, E.; Gosse, D.; Reniers, J.; Vanderhoeven, S. Feasibility of Eradication and Spread Limitation for Species of Union Concern Sensu the EU IAS Regulation (EU 1143/2014) in Belgium; Report Prepared in Support of Implementing the IAS Regulation in Belgium; INBO: Brussel, Belgium, 2019. [Google Scholar] [CrossRef]
  4. Bertolino, S.; Vimercati, G.; Paoloni, D.; Martinoli, A.; Wauters, L.A.; Genovesi, P.; La Morgia, V. Restricted access to private properties limits management of invasive alien species: A literature review and case studies. J Environ. Manag. 2021, 297, 113318. [Google Scholar] [CrossRef] [PubMed]
  5. Available online: https://ec.europa.eu/environment/nature/invasivealien/index_en.htm (accessed on 12 August 2021).
  6. Vinogradova, Y.K.; Aistova, E.V.; Antonova, L.A.; Chernyagina, O.A.; Chubar, E.A.; Darman, G.F.; Devyatova, E.A.; Khoreva, M.G.; Kotenko, O.V.; Marchuk, E.A.; et al. Invasive plants in flora of the Russian far east: The checklist and comments. Bot. Pacifica 2020, 9, 103–129. [Google Scholar] [CrossRef]
  7. Scoggan, H.J. The Flora of Canada. Pt 3; National Museums of Canada: Ottawa, ON, Canada, 1978; p. 1115. [Google Scholar] [CrossRef]
  8. Schmid, R.; Preston, C.D.; Pearman, D.A.; Dines, T.D.; Arnold, H.R.; Croft, J.M. New Atlas of the British and Irish Flora: An Atlas of the Vascular Plants of Britain, Ireland, the Isle of Man and the Channel Islands; Taxon: Oxford, UK, 2003; Volume 52, p. 884. [Google Scholar] [CrossRef]
  9. Andrews, M.; James, E.K.; Sprent, J.I.; Boddey, R.M.; Fábio, E.; Bueno dos Reis, F., Jr. Nitrogen fixation in legumes and actinorhizal plants in natural ecosystems: Values obtained using 15N natural abundance. Plant Ecol. Divers. 2011, 4, 131–140. [Google Scholar] [CrossRef]
  10. Fremstad, E. NOBANIS—Invasive Alien Species Fact Sheet—Lupinus polyphyllus. In Online Database of the European Network on Invasive Alien Species—NOBANIS; 2010; Available online: https://www.nobanis.org/globalassets/speciesinfo/l/lupinus-polyphyllus/lupinus-polyphyllus.pdf (accessed on 12 August 2021).
  11. Prjanishnikov, D.N. Ob Udobrenii Polej i Sevooborotah; Moscow Publisher of Agriculture economy RSFSR: Moscow, Russia, 1962; p. 422. [Google Scholar]
  12. Kurlovich, B.S.; Repyev, S.I. The gene bank and breeding of grain legumes; Institute of Plant Industry: Moscow, Russia, 1995; 438p. [Google Scholar]
  13. Majsurjan, N.A.; Atabekova, A.I. Ljupin; Moskva Kolos: Moscow, Russia, 1974; p. 463. [Google Scholar]
  14. Vinogradova, J.K.; Majorov, S.R.; Horun, L.V. Chernaja kniga flory Srednej Rossii; Moskva GEOS: Moscow, Russia, 2010; p. 512. [Google Scholar]
  15. Pimenov, M.G.; Ostroumova, T.A. Zontichnye (Umbelliferae) Rossii; Tovarishhestvo nauchnyh izdanij KMK: Moskva, Russia, 2012; p. 477. [Google Scholar]
  16. Mandenova, I.P. Kavkazskie vidy roda Heracleum; Akademia Nauk Gruzinskoy SSR: Tbilisi, Georgia, 1950; p. 104. [Google Scholar]
  17. Satsyperova, I.F. Borshheviki Flory SSSR—Novye Kormovye Rastenija: Perspektivy Ispol’zovanija v Narodnom Hozjajstve; Nauka: Leningrad, Russia, 1984; p. 223. [Google Scholar]
  18. Pesnya, D.S.; Serov, D.A.; Vakorin, S.A.; Prokhorova, I.M. Research of the Toxic, Mitosis Modifying and Mutagen Effect of Heracleum Sosnowskyi. Yarosl. Pedagog. Bull. Sci. Mag. 2011, 3, 93–98. [Google Scholar]
  19. Ivanov, M.F.; Kolosov, A.A. Bor’ba s borshhevikom Sosnovskogo v Novgorodskoj oblasti. Zashhita Karantin Rastenij 2012, 9, 26–27. [Google Scholar]
  20. Nielsen, C.; Ravn, H.P.; Nentwig, W.; Wade, M. The Giant Hogweed Best Practice Manual. Guidelines for the Management and Control of an Invasive Weed in Europe; Forest & Landscape Denmark: Hoersholm, Denmark, 2005; p. 44. [Google Scholar]
  21. Pyšek, P.; Cock, M.J.W.; Nentwig, W.; Ravn, H.P. Ecology and Management of Giant Hogweed: (Heracleum mantegazzianum); CABI: Cambridge, MA, USA, 2007; pp. 1–324. [Google Scholar] [CrossRef]
  22. Sakai, A.K.; Allendorf, F.W.; Holt, J.S.; Lodge, D.M.; Molofsky, J.; With, K.A.; Baughman, S.; Cabin, R.J.; Cohen, J.E.; Ellstrand, N.C.; et al. The Population Biology of Invasive Species. Annu. Rev. Ecol. Syst. 2003, 32, 305–332. [Google Scholar] [CrossRef] [Green Version]
  23. Ellstrand, N.C.; Schierenbeck, K.A. Hybridization as a stimulus for the evolution of invasiveness in plants? Proc. Natl. Acad. Sci. USA 2000, 97, 7043–7050. [Google Scholar] [CrossRef] [PubMed] [Green Version]
  24. Bossdorf, O.; Auge, H.; Lafuma, L.; Rogers, W.E.; Siemann, E.; Prati, D. Phenotypic and genetic differentiation between native and introduced plant populations. Oecologia 2005, 144, 1–11. [Google Scholar] [CrossRef]
  25. Novak, S.; Mack, R.N. Genetic bottlenecks in alien plant species: Influence of mating systems and introduction dynamics. In Species Invasions: Insights into Ecology, Evolution, and Biogeography; Sax, D.F., Stachowicz, J.J., Gaines, S.D., Eds.; Sinauer Associates: Sunderland, MA, USA, 2005; pp. 201–228. [Google Scholar]
  26. Williams, J.G.K.; Kubelik, A.R.; Livak, K.J.; Rafalski, J.A.; Tingey, S.V. DNA polymorphisms amplified by arbitrary primers are useful as genetic markers. Nucleic Acids Res. 1990, 18, 6531–6535. [Google Scholar] [CrossRef] [Green Version]
  27. Kantety, R.V.; Zeng, X.; Bennetzen, J.L.; Zehr, B.E. Assessment of genetic diversity in dent and popcorn (Zea mays L.) inbred lines using inter-simple sequence repeat (ISSR) amplification. Mol. Breed. 1995, 1, 365–373. [Google Scholar] [CrossRef]
  28. Kalendar, R.; Grob, T.; Regina, M.; Suoniemi, A.; Schulman, A.H. IRAP and REMAP: Two new retrotransposon-based DNA fingerprinting techniques. Theor. Appl. Genet. 1999, 98, 704–711. [Google Scholar] [CrossRef]
  29. Pyshek, P.; Richardson, D.M.; Rejmanek, M.; Webster, G.L.; Williamson, M.; Kirschuer, J. Alien plants in checklists and floras: Towards better communication between taxonomists and ecologists. Taxon 2004, 53, 131–143. [Google Scholar] [CrossRef]
  30. Dellaporta, S.L.; Wood, J.; Hicks, J.B. A plant DNA minipreparation: Version II. Plant Mol. Biol. 1983, 1, 19–21. [Google Scholar] [CrossRef]
  31. Nei, M.; Li, W.H. Mathematical model for studying genetic variation in terms of restriction endonucleases. Proc. Natl. Acad. Sci. USA 1979, 76, 5269–5273. [Google Scholar] [CrossRef] [PubMed] [Green Version]
  32. Sokal, R.; Michener, C. A statistical method for evaluating systematic relationships. Univ. Kansas Bull. 1958, 38, 1409–1438. [Google Scholar]
  33. Van De Peer, Y.; De Wachter, R. Treecon for windows: A software package for the construction and drawing of evolutionary trees for the microsoft windows environment. Bioinformatics 1994, 10, 569–570. [Google Scholar] [CrossRef] [PubMed]
  34. Felsenstein, J. Confidence limits on phylogenies: An approach using the bootstrap. Evolution 1985, 39, 783. [Google Scholar] [CrossRef] [PubMed]
  35. Vysniauskiene, R.; Ranftlientl, V.; Zvingila, D. Genetic diversity of invasive alien species Lupinus polyphyllus populations in Lithuania. Zemdirbyste 2011, 98, 383–390. [Google Scholar]
  36. Li, S.-L.; Vasemägi, A.; Ramula, S. Genetic variation and population structure of the garden escaper Lupinus polyphyllus in Finland. Plant Syst. Evol. 2016, 302, 399–407. [Google Scholar] [CrossRef]
  37. Qiu, J.; van Santen, E.; Tuzun, S. Optimization of DNA amplification fingerprinting techniques to study genetic relationships of white lupin germplasm. Plant Breed. 1995, 114, 525–529. [Google Scholar] [CrossRef]
  38. Wolko, B.; Świȩcicki, W.K.; Kruszka, K.; Irzykowska, L. Isozyme and RAPD markers for the identification of pea, field bean and lupin cultivars. J. Appl. Genet. 2000, 41, 151–165. [Google Scholar]
  39. Gilbert, J.E.; Lewis, R.V.; Wilkinson, M.J.; Caligari, P.D.S. Developing an appropriate strategy to assess genetic variability in plant germplasm collections. Theor. Appl. Genet. 1999, 98, 1125–1131. [Google Scholar] [CrossRef]
  40. Yorgancilar, M.; Babaoglu, M.; Hakki, E.E.; Atalay, E. Determination of the relationship among Old World Lupin (Lupinus sp.) species using RAPD and ISSR markers. Afr. J. Biotechnol. 2009, 8, 3524–3530. [Google Scholar]
  41. Artyukhova, A.V. Passportization of Lupin varieties by ISSR-PCR and RAPD-PCR methods for biotechnological research. Ph.D. Thesis, Bryansk State Acad. I.G. Petrovsky University, Ufa, Russia, 2011. [Google Scholar]
  42. Clements, J.; Galek, R.; Kozak, B.; Michalczyk, D.J.; Piotrowicz-Cieślak, A.I.; Sawicka-Sienkiewicz, E.; Stawiński, S.; Zalewski, D. Diversity of selected Lupinus angustifolius L. genotypes at the phenotypic and DNA level with respect to microscopic seed coat structure and thickness. PLoS One 2014, 9, e102874. [Google Scholar] [CrossRef] [PubMed]
  43. Guilengue, N.; Alves, S.; Talhinhas, P.; Neves–Martins, J. Genetic and genomic diversity in a Tarwi (Lupinus mutabilis Sweet) germplasm collection and adaptability to mediterranean climate conditions. Agronomy 2020, 10, 21. [Google Scholar] [CrossRef] [Green Version]
  44. Khapilina, O.N.; Daniyarov, A.Z.; Amenov, A.A.; Novakovskaya, A.P.; Turzhanova, A.S.; Tagimanova, D.S.; Filippova, N.I.; Kalendar, R.N. Analysis of genetic diversity in legumes germplasm using retrotransposon based molecular markers. Biotechnol. Theory Pract. 2017. [Google Scholar] [CrossRef]
  45. Oumer, A.; Petros, Y.; Tesfaye, K.; Abel, T.; Endashaw, B. Inter simple sequence repeat (ISSR) analysis of Ethiopian white lupine (Lupinus albus L.). Afr. J. Biotechnol. 2015, 14, 1552–1563. [Google Scholar] [CrossRef] [Green Version]
  46. Mahfouze, S.A.; Mahfouze, H.A.; Mubarak, D.M.F.; Esmail, R.M. Evaluation of six imported accessions of Lupinus albus for nutritional and molecular characterizations under Egyptian conditions. Jordan J. Biol. Sci. 2018, 11, 47–56. [Google Scholar]
  47. AlRawashdeh, I.M.; AlRawashdeh, N.Q. Evaluating the genetic relatedness within Lupinus pilosus L. species based on RAPD analysis. Jordan J. Biol. Sci. 2015, 8, 61–64. [Google Scholar] [CrossRef]
  48. Sbabou, L.; Brhada, F.; Alami, I.T.; Maltouf, A.F. Genetic diversity of moroccan Lupinus germplasm investigated using ISSR and AFLP Markers. Int. J. Agric. Biol. 2010, 12, 26–32. [Google Scholar]
  49. Talhinhas, P.; Neves-Martins, J.; Leitão, J. AFLP, ISSR and RAPD markers reveal high levels of genetic diversity among Lupinus spp. Plant Breed. 2003, 122, 507–510. [Google Scholar] [CrossRef]
  50. Tkacheva, E.V. Biological features of species Leguminosae Juss. with different invasive levels. Ph.D. Thesis, Main Botanical Garden of the Russian Academy of Sciences, Moscow, Russia, 2011. [Google Scholar]
  51. Ramula, S.; Kalske, A. Introduced plants of Lupinus polyphyllus are larger but flower less frequently than conspecifics from the native range: Results of the first year. Ecol. Evol. 2020, 10, 13742–13751. [Google Scholar] [CrossRef]
  52. Blossey, B.; Notzold, R. Evolution of increased competitive ability in invasive nonindigenous plants: A Hypothesis. J. Ecol. 1995, 83, 887–889. [Google Scholar] [CrossRef]
  53. Jahodova, S.; Trybush, S.; Pyshek, P.; Wade, M.; Karp, A. Invasive species of Heracleum in Europe: An insight into genetic relationships and invasion history. Divers. Distrib. 2007, 13, 99–114. [Google Scholar] [CrossRef]
  54. Solov’ova, A.I.; Dolgikh, Y.I.; Osipova, E.S.; Stepanova, A.Y.; Yavorskaya, O.G. Reveling of HERACLEUM SOSNOWSKYI polymorphism by means RAPD, ISSR, REMAP. In Proceedings of the Biologija Rastenij i Biotehnologija, Ukraine, Belaja cerkov’, October 2011; Institut Pishhevoj Biotehnologii i Genomiki, Nacional’noj Akademii Nauk Ukrainy: Belaja cerkov’, Ukraine, 2011. [Google Scholar]
  55. Kolmakov, P.Y.; Vysotsky, Y.I.; Bavtuno, A.V.; Kisova, A.S. Jekstrakcija DNK i vyjavlenie polimorfizma Heracleum sp. s pomoshh’ju RAPD-diagnostiki. In Proceedings of the Science—Education, Production, Economy; VGU imeni P.M.Masherova: Vitebsk, Belarus, 2017; pp. 72–73. Available online: https://rep.vsu.by/handle/123456789/10351 (accessed on 24 August 2021).
  56. Stry`gina, K.V.; Shipilina, L.Y.; Chuxina, I. Pervy`e Shagi v Izuchenii Genoma Borshhevika. 2020. Available online: https://sochisirius.ru/uploads/files2/4-abt.pdf (accessed on 12 August 2021).
  57. Niinikoski, P.; Korpelainen, H. Population genetics of the invasive giant hogweed (Heracleum sp.) in a northern European region. Plant Ecol. 2015, 216, 1155–1162. [Google Scholar] [CrossRef]
  58. Gacek, P.; Góralski, G.; Joachimiak, A.J. Chromosome numbers and polyploidy in Polish angiosperms. Acta Biol. Crac. Ser. Bot. 2011, 53, 37–49. [Google Scholar] [CrossRef]
  59. Weimarck, G.; Stewart, F.; Grace, J. Morphometric and chromatographic variation and male meiosis in the hybrid Heracleum mantegazzianum X H. sphondylium (Apiaceae) and its parents. Hereditas 1979, 91, 117–127. [Google Scholar] [CrossRef]
  60. Walker, N.F.; Hulme, P.E.; Hoelzel, A.R. Population genetics of an invasive species, Heracleum mantegazzianum: Implications for the role of life history, demographics and independent introductions. Mol. Ecol. 2003, 12, 1747–1756. [Google Scholar] [CrossRef]
  61. Henry, P.; Le Lay, G.; Goudet, J.; Guisan, A.; Jahodova, Š.; Besnard, G. Reduced genetic diversity, increased isolation and multiple introductions of invasive giant hogweed in the western Swiss Alps. Mol. Ecol. 2009, 18, 2819–2831. [Google Scholar] [CrossRef]
  62. Rijal, D.P.; Alm, T.; Jahodová, Š.; Stenøien, H.K.; Alsos, I.G. Reconstructing the invasion history of Heracleum persicum (Apiaceae) into Europe. Mol. Ecol. 2015, 24, 5522–5543. [Google Scholar] [CrossRef] [PubMed] [Green Version]
  63. Barrett, S.C.H.; Kohn, J.R. Genetic and evolutionary consequences of small population size in plants: Implications for conservation. In Genetics and Conservation of Rare Plants; Falk, D.A., Holsinger, K.E., Eds.; CABI: New York, NY, USA, 1991; p. 283. [Google Scholar]
  64. Ozerova, N.A.; Krivosheina, M.G. Patterns of secondary range formation for Heracleum sosnowskyi and H. mantegazzianum on the territory of Russia. Russ. J. Biol. Invasions 2018, 9, 155–162. [Google Scholar] [CrossRef]
  65. Ebel’, A.L.; Strelnikova, T.O.; Kuprijanov, A.N.; Verkhozina, A.V.; Mikhailova, S.I.; Prokopyev, A.S.; Strelnikova, T.O.; Sheremetova, S.A.; Khrustaleva, I.A. Chernaja Kniga flory Sibiri; Vinogradova, J.K., Kuprijanov, A.N., Eds.; Novosibirsk: Geo, Russia, 2016; p. 439. [Google Scholar]
  66. Kabuce, N.; Priede, A. NOBANIS—Invasive Alien Species Fact Sheet—Heracleum sosnowskyi. In Online Database of the European Network on Invasive Alien Species—NOBANIS; 2010; Available online: https://gd.eppo.int/taxon/HERSO/distribution/LT (accessed on 12 August 2021).
  67. Estoup, A.; Ravigné, V.; Hufbauer, R.; Vitalis, R.; Gautier, M.; Facon, B. Is TIs There a Genetic Paradox of Biological Invasion?here a Genetic Paradox of Biological Invasion? Annu. Rev. Ecol. Evol. Syst. 2016, 47, 51–72. [Google Scholar] [CrossRef]
  68. Rijal, D.P.; Alm, T.; Nilsen, L.; Alsos, I.G. Giant invasive Heracleum persicum: Friend or foe of plant diversity? Ecol. Evol. 2017, 7, 4936–4950. [Google Scholar] [CrossRef] [PubMed]
Figure 1. RAPD profile with the OPA-2 primer for L. polyphyllus. (i)—invasive population, [f]—feral population.
Biology 10 01094 g001
Figure 2. Phylogenetic trees of the analysed populations of L. polyphyllus derived from the data obtained by different methods. (a) Phylogenetic tree derived from the RAPD data, (b) Phylogenetic tree derived from the ISSR data, (c) Phylogenetic tree derived from the REMAP data, (d) Phylogenetic tree derived from the combination of RAPD, ISSR and REMAP data. The bootstrap values are given in %, (i)—invasive population, (f)—feral population, (v)—variety.
Biology 10 01094 g002
Figure 3. Phylogenetic tree of the invasive population of L. polyphyllus derived from the combination of RAPD, ISSR and REMAP data. The bootstrap values are given in %.
Biology 10 01094 g003
Figure 4. REMAP profile with the MS+Thv19 primers for H. sosnowskyi. (i)—invasive population, (n)—native population.
Biology 10 01094 g004
Figure 5. Phylogenetic trees of the analysed populations of H. sosnowskyi derived from the data obtained by different methods. (a) Phylogenetic tree derived from the RAPD data, (b) Phylogenetic tree derived from the ISSR data, (c) Phylogenetic tree derived from the REMAP data, (d) Phylogenetic tree derived from the combination of RAPD, ISSR and REMAP data. The bootstrap values are given in %, (i)—invasive population, (n)—native population.
Biology 10 01094 g005
Table 1. Phenotypes, collection sites and population types of the L. polyphyllus samples.
Collection SitePopulation TypeNumber of SamplesColour of FlowersLatitudeLongitude
MBG (Moscow Botany Garden) territory, RussiaFeral, running wild for about five years21blue, pink, white55°83′52.9″37°60′92.0″
Moscow region, RussiaInvasive, grows
for decades
9blue, pink, white55°38′64.6″39°18′24.1″
Kaluga region, Russia8blue54°50′91.3″36°21′24.6″
Kostroma region, Russia7blue57°81′45.7″40°98′37.7″
Smolensk region, Russia10blue, pink54°72′77.5″32°99′65.3″
Plants grown from the seeds
in the greenhouse
‘Minaret’ variety29blue, pink, white
Table 2. Phenotypes, collection sites and population types of the H. sosnowskyi samples.
Collection SitePopulation TypeNumber of SamplesColour of FlowersLatitudeLongitude
Moscow, RussiaInvasive, grows for decades15white55°57′41.7″37°55′56.2″
Peskovka, Ukraine20white50°70′69.1″29°58′15.3″
Kiev, Ukraine17white50°46′12.2″30°55′63.1″
Zhitomir (industrial), Ukraine14white50°24′14.3″28°74′12.8″
Zhitomir (center), Ukraine19white50°25′29.0″28°65′14.9″
Caucasus, Russianative14white43°77′66.0″43°28′72.5″
Table 3. Genetic diversity between the analysed populations of L. polyphyllus calculated according to Nei and Li using the combination of methods RAPD, ISSR and REMAP.
Collection SiteKostroma (i)Smolensk (i)Moscow (i)Kaluga (i)MBG (f)‘Minaret’ Variety
Kostroma (i)0.000
Smolensk (i)0.2160.000
Moscow (i)0.2090.2600.000
Kaluga (i)0.2310.2580.1960.000
MBG (f)0.2690.2840.1980.2300.000
‘Minaret’ Variety0.3020.3150.3180.3410.2760.000
(i)—invasive population, (f)—feral population.
Table 4. The mean values of genetic diversity (GD) for L. polyphyllus invasive and feral populations and the ‘Minaret’ variety obtained by RAPD, ISSR, REMAP and the combination thereof; (RATIO), the ratio of the genetic diversity of the invasive population over the genetic diversity of the given population.
Collection SiteRAPDISSRREMAPRAPD+ISSR+REMAP
GDRATIOGDRATIOGDRATIOGDRATIO
Invasive population0.322 0.253 0.328 0.294
Feral MBG Population0.2341.40.2381.10.2901.10.2481.2
‘Minaret’ Variety0.2051.60.1711.50.2201.50.1941.5
Table 5. Genetic diversity between the analysed populations of H. sosnowskyi calculated according to Nei and Li using the combination of methods RAPD, ISSR and REMAP.
Collection site Caucasus (n)Moscow (i)Kiev (i)Zhitomir (i)Pescovka (i)
Caucasus (n)0.000
Moscow (i)0.6140.000
Kiev (i)0.6110.5120.000
Zhitomir (i)0.5910.5300.4930.000
Pescovka (i)0.5690.5620.4660.4380.000
(i)—invasive population, (n)—native population.
Table 6. The mean values of genetic diversity (GD), and their maximum and minimum values for H. sosnowskyi invasive and native populations obtained by combination of methods RAPD, ISSR and REMAP.
PopulationsRAPD+ISSR+REMAP
Min GDMax GDMean GDDifference of GD between
Native and Invasive Populations
Moscow (i)0.2170.6060.3980.104
Peskovka (i)0.2240.6780.4180.084
Kiev (i)0.2650.6220.4410.061
Zhitomir (industrial) (i)0.2160.6400.4460.056
Zhitomir (center) (i)0.2480.6290.4570.045
The average Value of Genetic Diversity within Invasive Populations0.2340.6350.4320.070
Caucasus (n)0.2440.7390.502
(i)—invasive population, (n)—native population.
Publisher’s Note: MDPI stays neutral with regard to jurisdictional claims in published maps and institutional affiliations.

