Article

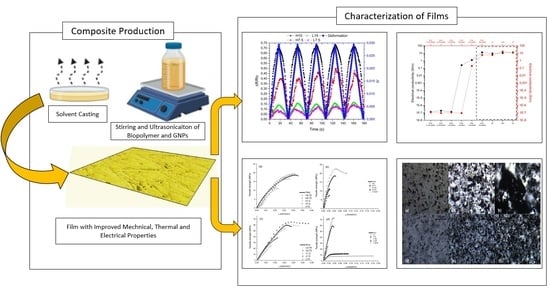
Effect of GNPs on the Piezoresistive, Electrical and Mechanical Properties of PHA and PLA Films

by
Gonzalo Mármol
1,2,
Usha Kiran Sanivada
3,4,5 and
Raul Fangueiro
2,3,5,*
1
LAQV-REQUIMTE, Institute for Research and Advanced Studies (IIFA), University of Évora, Rua Romão Ramalho, 59, 7000-671 Evora, Portugal
2
Centre for Textile Science and Technology (2C2T), University of Minho, Azurém Campus, 4800-058 Guimaraes, Portugal
3
Department of Mechanical Engineering, University of Minho, Azurém Campus, 4800-058 Guimaraes, Portugal
4
Mechanical Engineering and Resources Sustainability Centre (MEtRICS), University of Minho, Azurém Campus, 4800-058 Guimaraes, Portugal
5
Fibrenamics—Institute of Innovation in Fiber-Based Materials and Composites, Azurém Campus, 4800-058 Guimaraes, Portugal
*
Author to whom correspondence should be addressed.
Fibers 2021, 9(12), 86; https://doi.org/10.3390/fib9120086
Submission received: 29 October 2021 / Revised: 24 November 2021 / Accepted: 10 December 2021 / Published: 15 December 2021

Abstract

:
Sustainability has become the primary focus for researchers lately. Biopolymers such as polyhydroxyalkanoate (PHA) and polylactic acid (PLA) are biocompatible and biodegradable. Introducing piezoresistive response in the films produced by PLA and PHA by adding nanoparticles can be interesting. Hence, a study was performed to evaluate the mechanical, electrical and piezoresistive response of films made from PHA and PLA. The films were produced by solvent casting, and they were reinforced with graphene nanoplatelets (GNPs) at different nanoparticle concentrations (from 0.15 to 15 wt.%). Moreover, cellulose nanocrystals (CNC) as reinforcing elements and polyethylene glycol (PEG) as plasticizers were added. After the assessment of the nanoparticle distribution, the films were subjected to tests such as tensile, electrical conductivity and piezoresistive response. The dispersion was found to be good in PLA films and there exist some agglomerations in PHA films. The results suggested that the incorporation of GNPs enhanced the mechanical properties until 0.75 wt.% and they reduced thereon. The addition of 1% CNCs and 20% PEG in 15 wt.% GNPs’ tensile values deteriorated further. The PHA films showed better electrical conductivity compared to the PLA films for the same GNPs wt.%. Gauge factor (GF) values of 6.30 and 4.31 were obtained for PHA and PLA, respectively.

Graphical Abstract

1. Introduction

To attend to the increasing demands of the markets and provide solutions for a constantly evolving society, a new generation of materials with multiple functionalities is emerging. These functionalized materials are finding their applications in various sectors such as heating, sensing, fuel cells, food packaging, transport, agriculture, electronics, etc. [1,2]. From a material science point of view, these materials may exhibit one or several properties that can activate a reaction as a response to environmental conditions or stimuli, which may be mechanical, electrical, magnetic, thermal and chemical, among others. This new generation of materials with advanced properties that allow the application and suitability of conventional materials to be enlarged are classified as smart materials. Nevertheless, many questions still require attention to develop smart materials, as they need to meet high demands regarding every envisioned functionality. Moreover, the conception of these products brings high costs associated with the difficulty of incorporating particles of different nature, turning them into an alternative with a high expense for commercialization.
One of the most promising attributes of smart materials is the piezoresistive capacity of sensors to transduce the change in an electrical signal, i.e., the resistance of a device is converted into an applied pressure [3]. In recent times, elastic and deformable strain–stress sensors have been evaluated for diverse purposes such as wearable devices, portable electronic devices, biomedical devices and human motion monitoring sensors [4]. Due to the increasing scientific advances achieved in this area and the development of nanotechnology, composite materials functionalized with nanoparticles with attracting properties, such as electrical conductivity and a piezoresistive response, are gaining considerable attention [5,6,7]. An excellent sensing capacity combined with high levels of flexibility and deformability is essential for these strain–stress sensitive devices, given the extensive variety of applications [8], especially for the recognition of dynamic responses [6,7]. Thus, polymer-based materials may operate as sensors with a low amount of conductive material. Moreover, the addition of conductive nanoparticles in composite materials helps to reduce the production costs while increasing the efficiency of the materials from the final customer perspective.
As per the researchers from the Queen Mary University of London, graphene is a 3D as well as 2D material [9] and is one of the most investigated nanoparticles [10]. Owing to its structure, graphene, when compared to other materials, has exceptional electrical, mechanical, optical and thermal properties [11]. Despite all these benefits and possible functions, the production of graphene at an industrial scale is not yet competitive with conventional products due to its high price [12]. To address this, graphene nanoplatelets (GNPs) are coming forward as a cost-effective substitute with a far superior large-scale manufacturing capacity. GNPs can be produced by several processes, such as the exfoliation of graphite in the liquid phase, the exposure of graphite intercalated with acid to microwave radiation, shear-exfoliation and by ball-milling [13,14]. A large variety of GNPs can be produced by using the above-mentioned techniques with different thickness, lateral sizes and concentrations of defects [14]. GNPs are formed by a combination of monolayer graphene, few-layer graphene and graphite [14]. Moreover, GNPs are appealing for nanocomposite applications, as they can be simply added to in polymeric matrices with the help of techniques such as solvent casting or melt compounding [15]. Moreover, GNPs’ electrical conductivity is higher in comparison with the graphene oxide particles [16]. The value of the electrical conductivity for graphene oxide is 6 × 10³ (S/m), whereas it is in the order of 106 for the graphite flakes [17].
Owing to the negative impacts on the environments, researchers are, nowadays, focusing on utilizing reinforcements such as nanocellulose, which can be extracted from cellulose, with a diameter below 100 nm and length in the range of few micrometers. Nanocellulose can be classified into several categories (cellulose nanocrystals, nanofibrillated cellulose, bacterial cellulose) based on the production methods. Bacterial cellulose nanocrystals are produced from acid hydrolysis [18].
To take advantage of the properties of composites prepared from nanoparticles, such as the facility of shape and form design for a multitude of applications, many polymers’ matrices are available. Most of these materials are of no value after they are discarded, as they become a residue with hazardous consequences for the environment. A possible strategy to develop biodegradable composites is the use of bio-based or biodegradable polymers [19,20]. The use of this specific type of polymers promotes a circular economy since the composites produced possess a closed lifecycle. Once biopolymers reach the end of their lifespan, other industrial processes, such as the production of fuel or feedstock for more biopolymer manufacture, may reuse them [21]. The possible biodegradable bioplastics, e.g., chitosan, cellulose, PLA, starch, polycaprolactone (PCL) and PHA, are the most researched recently. Standing out from the rest, PLA and PHA are used extensively due to their intrinsic properties.
PLA is widely reported as a successful polymer in biomedical and packing applications, apart from being a prospective option to substitute regular plastic products with a reduced environmental impact [22,23]. PLA presents some limitations such as brittleness, low impact strength and heat resistance, which require special attention before its usage in engineered products [24]. Similarly, PHAs are becoming a more environmentally friendly choice in the development of composites; therefore, intensive work has been conducted in this regard. PHAs can be produced by using several bacteria with outstanding features for disruptive functions with a low carbon footprint [25,26]. Therapeutic and medical care uses such as in circulatory tissue production, cartilage regeneration, ophthalmological transplantations, nerve restoration and skincare are the very relevant applications of this type of polymers [25]. PHA is also likely to be a potential material for nonmedical purposes such as packaging, paper finishing, nanoparticles’ stabilization, fiber material and biofuels in addition to many others [25]. However, the employment of PHA for composite commodities is difficult since the elevated production cost only makes it possible to utilize them in high-added-value products [27].
Combining all the considerations above addressed, this study compares the performance of PHA and PLA polymers for possible sensor applications. In this paper, PHA and PLA films produced by solvent casting were reinforced with GNPs to evaluate both the mechanical and electrical behavior at different nanoparticle concentrations. Once the percolation threshold was determined, films were produced to assess their piezoresistive response. Moreover, CNCs as reinforcing elements and PEG as plasticizers were added to assess their impact on both the mechanical and electrical properties of the composite films. Microstructural characterization of the films was also conducted.

2. Materials and Methods

2.1. Materials

Polymers such as PHA and PLA and nanofillers such as GNPs and CNCs were used in this study. Chloroform (CHCl3) and PEG were used as the dispersing agent and the plasticizer, respectively. The technical data of the above-mentioned materials are displayed in Table 1.

2.2. Sample Production

Rectangular biopolymer films (15 × 15 cm) were solvent cast in ceramic trays. To assure proper nanoparticle dispersion, a vortex shaker IKA VORTEX 3 was used where 10 mL of GNPs and/or CNC suspensions in CHCl3 were kept in centrifuge tubes and subjected to mechanical vibrations for 10 min and, as a result, the deagglomeration of nanoparticles took place. Subsequently, CHCl3 was added to the suspensions such that it reached a total volume of 50 mL to dilute the suspensions. Ultrasonication was performed for 15 min to stabilize the suspensions assuring the GNPs cluster breakage in CHCl3. For every film formulation, 2.84 g of solids (polymer + GNPs) in 50 mL was used to obtain a material with a thickness of between 0.15 and 0.20 mm. The dissolution of the biopolymers was conducted with the help of a magnetic stirrer for 1 h at 60 °C and followed by 1 h of cooling down at room temperature. Once the solution was completed and at room temperature, an ultrasonic bath took place for 1 h to assure a homogeneous distribution of the nanoparticles in the solution. Film casting took place under ventilated room conditions for 24 h. Before films’ characterization, a thermal treatment was applied for 48 h at 80 °C to avoid the influence of environmental conditions on the composites.

2.3. Sample Testing

The obtained samples were subjected to tensile testing with the help of a universal testing machine with a 2.5 kN load cell mounted in it (Hounsfield Tinius Olsen, model H100KPS). The tests were accomplished as per the standard ASTM D882–02. To perform the testing, 100 × 10 mm stripes were cut and placed in the grips of the machine. Then, loads were applied on the specimens by maintaining a crosshead displacement of 5 mm/min. For each formulation, a minimum of 5 specimens were tested.
A Metler Toledo (822e) differential scanning calorimeter was used to perform Differential Scanning Calorimetry (DSC) analysis as per the ASTM D3418 standard. The specimens were placed in an aluminum crucible and nitrogen was used and the flow was maintained at 100 mL/min. To obtain the melting temperature (Tm), transition temperature (Tg) and cold crystallization temperature (Tcc), samples were heated up to a temperature of 180 °C at a rate of 10 °C/min and this was followed by a subsequent cooling down to room temperature. The heat of fusion and degree of crystallinity was calculated (Xc). The degree of crystallinity (Xc) was calculated according to the following formula shown in Equation (1) [28]:
X c % = H m W × H p o l y m e r x 100
where
ΔHm = melting enthalpy of the samples;
ΔHpolymer = enthalpy for 100% crystalline PLA (93.6 J/g) and PHA (146 J/g) [28,29];
W = net weight fraction of PLA or PHA in the composites.
The melting enthalpies were estimated using the area under the endothermic peak.
A thermal analyzer (HITACHI STA 7200) was used to carry out the thermogravimetric analysis. The samples placed in an alumina crucible were exposed to heat where the temperature was raised from 20 to 400 °C at a rate of 10 °C/min, while the flow of nitrogen flow was maintained at 40 mL/min.
An optical microscopy and scanning electron microscopy (SEM) were utilized to observe the GNPs’ dispersion and distribution. An optical microscope Leica DM750M at a 50× magnification was used. ImageJ software was used to measure the planar size of the GNPs in the film produced using 15 wt.% of GNPs and an average of 100 image measurements were taken. NOVA 200 Nano SEM, FEI Company and Ultra-high resolution Field Emission Gun Scanning Electron Microscopy (FEG-SEM) were employed to analyze the fracture surface. FEG-SEM was operated at an acceleration voltage of 10 kV with a thin film (8 nm) of Au-Pd (80–20 mass fraction).
Electrical conductivity was determined as σ = 1/ρ where ρ is the resistivity of a material that is defined as ρ = R × A/L, where R is the electrical resistance, A is the cross-sectional area of the material and L is the length between the electrodes. For R determination, an Agilent 34461A Multimeter/Voltage source was used between −1 to 1 V with a step of 0.1 V at room temperature, while A and L were kept constant with values of 5 mm2 and 2 mm, respectively. After measuring the intensity for each potential step, R was defined as the slope of the intensity–potential curves. Electrical resistivity was averaged with the values of the electrical resistance in 8 different points of each film. Electrical resistance was measured by the setup that is shown in Figure 1.
The piezoresistive performance was determined by monitoring R through a series of cyclic loading. Each cycle consisted of a compression loading stage at 0.12 mm/min for 15 s, followed by an unloading stage at the same pace and time; therefore, the crosshead recovered its initial position. A universal testing machine with a 250 N load cell (Hounsfield Tinius Olsen, model H100KPS) was used to apply the loading and unloading cycles. During 5 consecutive mechanical loading cycles, R was recorded with an Agilent 34461A Multimeter, connected to 2 electrodes coupled at the clamps, as described in Figure 1. Piezoresistivity was evaluated as a comparison of the GF of each formulation. GF was calculated independently for each cycle according to Equation (2), where R is the variation of the electrical resistance, R 0 is the resistance at the beginning of each cycle and ε is the specific deformation of the material, defined in Equation (3), where z is the vertical displacement over time and d is the thickness of the film.
ε = z d
G F = Δ R R 0 ε

3. Results

3.1. GNPs Dispersion

A uniform and homogeneous distribution of the conductive nanoparticles in a polymer is essential to obtain the optimal properties of nanocomposites. Microscopic images were employed to correlate the homogeneity of the composites with the assessed properties. Figure 2 displays optical microscopy images with a 50× magnification of the PHA and PLA films with GNPs at various concentrations, 0.15, 0.75 and 1.50 wt.%. For GNPs concentration over 1.5 wt.%, the thin sections were so dark that the quantitative analysis of the macro-dispersions was not possible due to the high concentration of GNPs. Based on Figure 2, the GNPs in PLA present a better distribution and dispersion (Figure 2d–f) compared to the PHA samples (Figure 2a–c). At lower GNPs’ loading (0.15 wt.%), both types of biopolymers present a good nanoplatelet distribution. However, the nanoparticles in PHA (Figure 2a) present a higher size than those in PLA (Figure 2d), with average diameter values of 16 µm and 9 mm, respectively. This bigger size of the GNPs is related to the formation of clusters, which reveals a worse dispersion of the nanoparticles. This agglomeration is even more evident when the GNPs’ concentrations increase since the clusters in the PHA matrix are bigger.
A decrease in the polymer matrix viscosity is usually accompanied by an upgrade in dispersion. Nevertheless, the PHA and PLA employed in this work have similar viscosities, as shown in Section 2.1; therefore, this variable can be omitted from the discussion. Despite the good properties introduced by the addition of graphene-based nanoparticles, the dispersion of GNPs in a polymer matrix is poor [30]. Therefore, to improve the distribution of graphene nanoparticles, many physical and chemical approaches have been used by researchers [31,32]. In the case of PHA samples, many authors employed CHCl3 during the production of the composites as solvent agents [33,34]; therefore, here, CHCl3 was used. Graphene disperses poorly in chloroform as the Vander Walls forces are greater in between carbon atoms, which are the main elements in graphene [35]. Therefore, the formation of clusters in PHA samples in this work is due to the deficient ultrasound dispersion, which is sufficient for PLA samples.
This trend, observed with the aid of optical microscopy, is also validated by the SEM images of the fractured biopolymer films after tensile tests. In the PHA samples (Figure 3), GNPs appear agglomerated in some regions, while some others remain free of nanoparticles (white arrows). This is in contrast with PLA samples that exhibit a surface free of any voids without GNPs. Moreover, the void between GNPs and the polymer matrices suggests that there is no proper adhesion between the fillers and the polymer [36]. Thus, the minor voids observed between the nanoparticles and PLA, as compared to PHA, confirm the better compatibility between GNPs and PLA.

3.2. Differential Scanning Calorimetry

The film melting behavior and the changes induced in the crystalline structure of both types of polymers were analyzed using DSC measurements. The thermal heat flow analysis through DSC (Figure 4) reveals a different effect of the addition of GNPs on these two types of biopolymers. In the PHA films, the incorporation of GNPs has little influence on the melting temperature since the melting process achieves its peak at around 154 °C [37,38] with slight differences (Table 2).
In the case of the PLA samples, the inclusion of GNPs to the polymer reduces the melting temperature from 152 °C to around 145 °C; a similar observation was reported by various research studies [39,40]. This reduction in the melting temperature due to the incorporation of GNPs is related to an alteration of the crystal structure and lamellar thickness [40]. Therefore, the addition of GNPs affects the processing parameter of PLA-based products in which melting is involved, such as extrusion or injection. Moreover, GNPS reduces the crystallinity of the polymer matrix for both types of polymers (Table 2).
This crystallinity change produced by the GNP incorporation in polymer matrices is correlated with the mechanical and thermal properties of the nanocomposite [40,41]. This reduction in crystallinity is significantly higher for PLA samples, where crystallinity is nearly halved, from 40.0 J/m up to 22.2 J/m for samples containing both GNPs and CNC, whereas PHA undergoes a reduction by around 10%. Despite the little influence of these graphene nanoparticles on the melting of PHA, the addition of GNPs increases the peak to over 90 °C, which is responsible for the susceptibility of the material to secondary crystallization [42]. Therefore, the temperature of the secondary crystallization is reduced from 96.8 °C for plain PHA to around 90 °C for the samples containing GNPs. Similarly, the addition of GNPs requires special attention to obtain the desired product in processes involving temperature variations. A very sharp endothermic peak is displayed for the PHA samples containing PEG due to the melting process of this polymer [43]. Therefore, these polymer-blended matrices have a bimodal thermal performance. The PLA samples containing PEG also show a bimodal given the two-step broader low-intensity cold crystallization peak (≈150 °C) compared to the first heating. This trend observed in the PLA samples containing PEG is due to a heterogeneous crystal distribution [44]. From Table 2, it can be understood that the addition of both CNC and PEG decreases the crystallinity of the composites. The reduction in crystallinity is greater with the addition of PEG because of the plasticizing effect. It is remarkable that the reduction in crystallinity is greater in PLA composites and the values were diminished by around 25 and 50% with the addition of CNC and PEG, respectively, in comparison with the plain PLA films.

3.3. Thermogravimetric Analysis

The thermal analysis of the samples produced in this experiment was evaluated using thermogravimetric analysis. The different mass loss (%) values obtained at 300, 350 and 400 °C are presented in Table 2. Comparing the thermal degradation of both types of polymers (Figure 5), neat PHA exhibits a two-step degradation process, while pure PLA displayed a single-step thermal decomposition. Regarding PHA, the mass loss that takes place between 170 and 300 °C is due to the polymer losing its low molecular weight compounds [45] with a maximum mass loss rate at 275 °C and the maximum mass loss is due to the PHA ester cleavage [45]. The loss of mass at elevated temperatures is due to processes such as the carbonization of hydro-carbonated compounds [45]. The PLA samples show a single-step thermal degradation at greater temperatures than the PHA samples with a maximum decomposition rate at 375 °C. Chain homolysis and reaction involving hydroxyl end-initiated ester interchange are responsible for the degradation of PLA [46].
For both types of biopolymers, the introduction of GNPs has a similar outcome on the thermal stability of the films. With the addition of GNPs at 7.5 wt.%, the mass loss at every temperature is almost identical to the mass loss for the plain biopolymer (Table 1). However, the mass loss is reduced at every temperature (300, 350 and 400 °C) when the concentration of GNPs is increased up to 15 wt.% in both types of polymers. This improved thermal stability of biopolymers with an increasing GNPs content is owing to the shielding effect induced by the flake-like shape of this type of particle [36,47]. Therefore, GNP particles delay the diffusion of volatile decomposition products within the biofilms. Another explanation relies on the high thermal conductivity of GNPs that enables the heat transfer hindering the early polymer degradation [48]. The main difference in the thermal stability between the two polymers takes place when PEG is added. Given the mass loss reduction in the films containing PEG at both 300 and 350 °C, the use of PEG in the formulation of PHA-based samples contributes to the increasing thermal stability of the films. The introduction of PEG blocks within the co-polymer leads to this higher thermal stability, which is confirmed by the additional weight stage loss at higher temperatures [49,50]. On the contrary, for PLA-based films, there is a reduction in the thermal stability given the increased mass loss at lower temperatures (Table 2). This decrease in the thermal stability of the PLA and PEG blended matrices compared to the neat polymers has been already reported in the literature [51,52]. This reduction in the thermal stability of this PLA copolymer is a consequence of the simple rearrangement of the polymer chains to crystallize with the increased molecular weight of the copolymer.

3.4. Tensile Tests

The addition of GNPs to biopolymer films (PHA and PLA) has a clear effect on their mechanical performance (Figure 6). When GNPs of up to 0.75 wt.% are added to the films, the tensile strength increases from 18.7 to 19.8 MPa and 59.6 to 62.2 MPa, for PHA and PLA samples, respectively (Table 3). For concentrations over 0.75 wt.%, the tensile strength decreases in both polymers; therefore, the higher concentration is, the lower the tensile strength values are. Despite the limited reinforcing capacity of GNPs, this type of nanoparticles has, at least, the same stiffening effect compared to CNC (Table 3). For the PHA films, GNPs lead to a higher Young’s modulus, even for high concentrations (7.5 and 15 wt.%). This stiffening of the films with a slight reinforcing effect is due to the platelet shape of the graphene nanoparticle used in this study. While the rigidity increases as a result of a high Young’s modulus of the GNPs [53], the 2D shaped structure of the GNPs (lateral dimensions of around 0.5–2.0 μm) is less effective for the pull-put mechanism and polymer strengthening compared to 1D reinforcement (i.e., fiber-shaped elements) [54]. This explains the reduction in the strain values for most of the samples with GNPs (Table 3). Although the PLA films exhibit a stain enhancement in samples with low concentrations of GNPs (only 0.15 and 0.75 wt.%), the deformation values of the polymer films decreased.
Considering that the highest GNPs concentration evaluated in this study (15 wt.%) leads to the highest electrical conductivity values and piezoresistive performances, other additions were included to assess their influence on the mechanical performance. Therefore, their influence on the tensile parameter was also studied. The addition of CNC to biopolymer matrices (HC and LC in Figure 6) has a better reinforcing effect compared to the samples where only GNPs were added. The samples containing only CNC (HC and LC in Figure 6) reached higher values (72.9 and 22.5 MPa, respectively) than the strongest ones only reinforced with GNPs (H0.75 and L0.75 in Figure 6). On the other side, for the samples with 15 wt.% GNPs, the addition of 1 wt.% CNC has a different effect depending on the type of polymer. For the PHA films, the tensile strength increased from 11.1 (H15 in Figure 6) to 12.37 MPa (H15C in Figure 6), whereas the PLA films underwent a reduction in tensile strength from 28.3 to 23.2 MPa.
Low-molecular-weight PEG is conventionally used to improve the ductility of PLA-based materials [55] and here it was used to assess its influence on biopolymer matrices with GNPs. This trend reported in the literature is also confirmed by the PLA samples blended with PEG (Figure 6d), which experience a notorious increase in ductility (between 400 and 700% higher) while decreasing Young’s modulus and the tensile strength. However, this copolymerization in PHA samples has little effect and the strain at break remains stable. Moreover, the addition of PEG in the PHA samples leads to lower tensile strength and stiffness; therefore, no beneficial effects are obtained.

3.5. Electrical Conductivity

It is observed from Figure 7 that the electrical conductivity of the PLA/GNPs and PHA/GNPs films depends on the wt.% GNPs in the composite films. The presence of conductive particles modifies the electrical performance of a polymer due to two different sources. One way of achieving electrical conductivity is the direct contact of the nanoparticles, while electron tunnels (tunneling effect) are responsible for the conductivity when there is no contact [56]. Therefore, in a composite where a solid continuous phase surrounds an electrically conductive dispersed phase, the electrical conductivity of the material relies on the concertation of the conductive material. This principle is also confirmed with the results of this study since the addition of GNPs results in considerably enhanced electrical conductivity at higher filler loadings for both types of biopolymers. Up to a concentration of 1.5 wt.%, the electrical conductivity of the films remains stable at low values, typical of non-conductive materials (10−7 S/m). At these low loadings of GNPs, the transport of electrons is non-important due to the inadequate conductive paths and the excessive space between the particles [36]. Regarding the PHA composites, the electrical conductivity clearly increases at a GNPs fraction of 3 wt.% (0.22 S/m), exhibiting a lower percolation threshold compared to the PLA composites that only undergo a conductivity increase at a GNPs loading of 7.5 wt.% (0.19 S/m). The enhanced flow of the migrating and hopping electrons of the fillers is responsible for the increment in the electrical conductivity of the composite films [36].
These values of PLA composites agree with the results reported in the literature [41,47,56,57], where a GNP concentration between 7–10 wt.% is estimated as the percolation threshold. A PHA sample produced during this experiment led to a lower percolation threshold in comparison with the values reported in the research studies with a similar order of magnitude to the PLA samples [58]. Moreover, the results obtained here show that PHA has a better electrical conductivity compared to the PLA films for the same GNP concentration. Additionally, for higher concentrations, PHA shows higher conductivity, which suggests a better connectivity among the GNPs in PHA than in PLA, 12.9 and 5.6 S/m, respectively, at a GNP concentration of 15 wt.%.

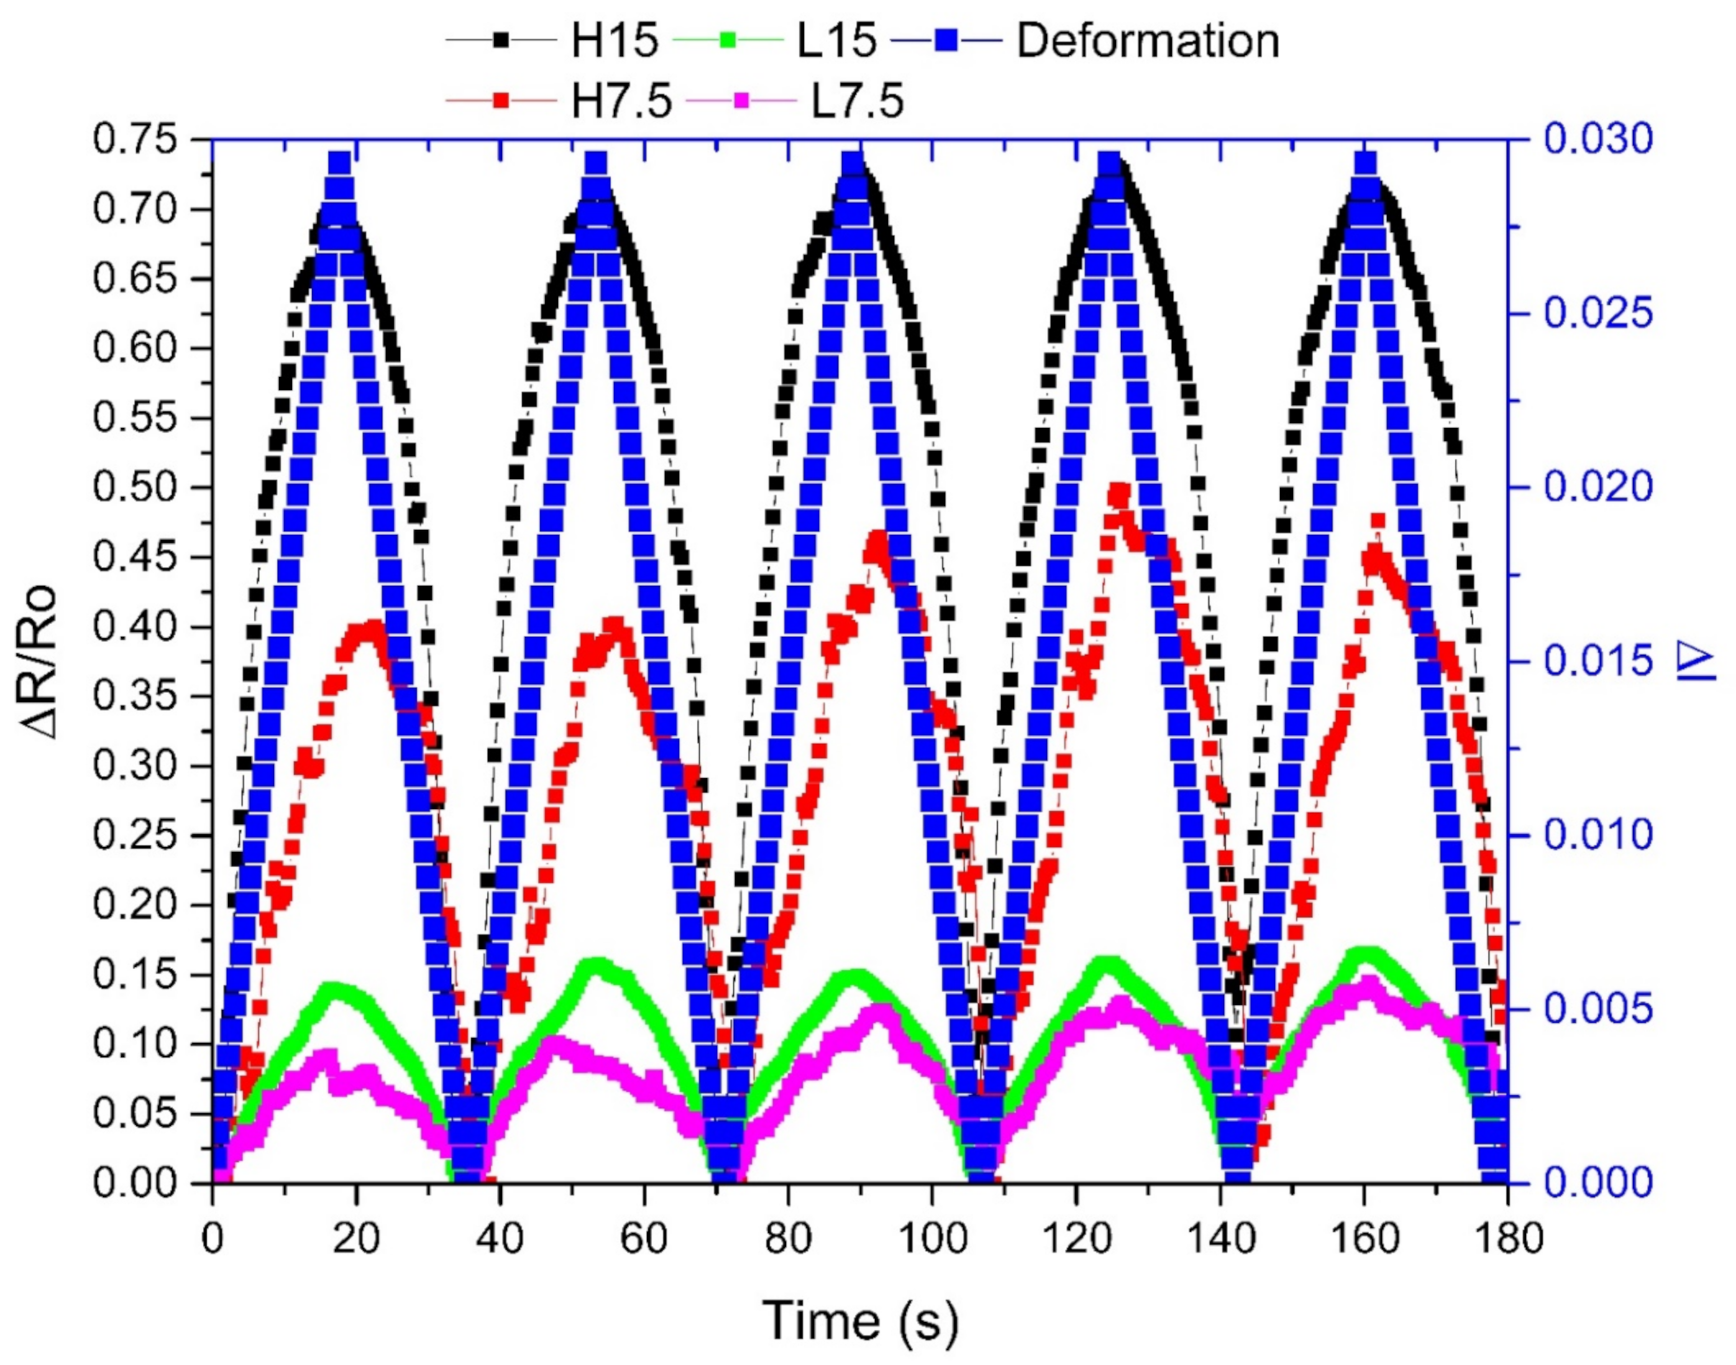
3.6. Piezoresistive Performance

Figure 8 depicts the curves of the piezoresistive test performed on the PHA and PLA films with two different GNP contents above the conductive threshold, 7.5 and 15 wt.%. The left axis (in black) represents the piezoresistivity of each sample. On the right axis (in blue), the variation in thickness of the films is represented. Based on these results, the most responsive piezoresistive behavior is displayed by the PHA samples, given the greater amplitude of their curves. From Figure 8, the piezoresistivity of the PHA films was enhanced when the concentration of GNPs was increased up to 15 wt.% (Figure 8) compared to the PHA films with only 7.5 wt.%. Contrary to this, the PLA films experience little gain in piezoresistivity with a higher concentration of GNPs. In addition, the increase in GNP loading leads to a more homogeneous piezoresistive performance for both types of biopolymers, since the coefficient of variation of GF decreases from 44.4 to 27.7% and from 39.7 to 23.2% for PHA and PLA, respectively (Table 3).
Another remarkable feature derived from this study is the different effects of the PEG addition depending on the type of biopolymer. In this regard, the addition of PEG in PLA leads to an enhancement of the piezoresistivity of the material. On the contrary, the copolymerization of PHA with PEG has a negative impact on the piezoresistive performance of the polymer. Piezoresistivity is defined as the change in the electrical resistivity of a semiconductor in response to applied mechanical stress [59]. In the case of the films assessed in this study, the compression strain in every cycle promotes the approaching of the nanoparticles and, consequently, the direct contact between them. The greater contact of the conductive nanofillers increases the conductivity of the whole composite. From a mechanical point of view, this compression strain is related to the rigidity of the material; therefore, the higher flexibility of the matrix allows a higher deformation. Consequently, the PHA films experience higher deformation given their lower Young’s modulus and, therefore, higher resistivity variation under mechanical loading (Table 3). In the same sense, the PLA films copolymerized with PEG have a lower rigidity; therefore, their Gauge Factor increases notably (Table 3). However, an excessive reduction in the polymer rigidity also leads to a reduction in the Gauge Factor, as observed in the PHA films copolymerized with PEG. In any case, the thin films produced here with biopolymeric matrices present an excellent piezoresistive performance, with good Gauge Factor values (6.30 and 4.31 for the PHA and PLA samples, respectively).

4. Conclusions

The production of biofilms using different types of biopolymers, PHA and PLA, with the addition of GNPs has been explored. The morphological characterization of the composites through microscopy analysis reveals that the PLA films have a proper distribution and dispersion of the nanofiller within the matrix. However, the PHA samples exhibit an agglomeration of the GNPs at lower concentrations (<1.50 wt.%) that hampers the proper dispersion of the nanoparticles. Further research is required to achieve both a good distribution and dispersion of the nanoplatelets in both types of biopolymers.
Regarding the effect of the addition on the microstructure of the biofilms, GNPs have a different effect depending on the sort of matrix. While GNPs have a slight influence on the PHA samples, in the PLA samples, this addition reduces the melting temperature of the composite due to a change of the crystal structure. Therefore, changes in the crystallinity and processing conditions of the films may be considered in processes where melting is applied. Regarding the thermal stability of the films, the addition of GNPs set back the diffusion of unstable decomposition products within the matrices, making these materials more stable at higher temperatures.
Given the results obtained here, the addition of GNPs in different types of biopolymer films has exhibited a different performance depending on the concentration. A reinforcing effect is observed when GNPs are added up to 0.05 wt.% For higher GNPs concentrations, 3 and 7.5 wt.%. for PHA and PLA, respectively, the films also display electrical conductivity. Although a worse dispersion of the GNPs is observed in the PHA films, these films require a lower GNP content to be conductive and present higher conductivity at a higher GNP concentration (>7.5 wt.%).
The hybridization of the films by the addition of CNC combined with GNPs has little effect on both the electrical conductivity and mechanical properties. When PEG is used to copolymerize the biopolymer matrices, it has no beneficial effect on the PHA films. However, the addition of PEG largely increases the deformation of the PLA films, which is translated into better piezoresistive performance. The Gauge Factor values obtained in this study show the potential of these type of materials for sensing applications where biodegradability and biocompatibility are required.

Author Contributions

Conceptualization, G.M.; methodology, G.M.; formal analysis, G.M. and U.K.S.; investigation, G.M. and U.K.S.; resources, G.M.; data curation, G.M.; writing—original draft preparation, G.M.; writing—review and editing, U.K.S. and R.F.; visualization, G.M.; supervision, R.F.; project administration, R.F.; funding acquisition, R.F. All authors have read and agreed to the published version of the manuscript.

Funding

This research received no external funding.

Institutional Review Board Statement

Not applicable.

Informed Consent Statement

Not applicable.

Acknowledgments

The authors thanks to TSSiPRO; NORTE-01-0145-FEDER-000015- project, Technologies for Sustainable and Smart Innovative Products, which involves this research work and financed by the European Regional Development Fund (ERDF) through the Support System for Scientific and Technological Research (Structured R & D & I Projects) of the Regional Operational Program for Northern Portugal 2020.

Conflicts of Interest

The authors declare no conflict of interest.

References

  1. Díez-Pascual, A.M. Synthesis and Applications of Biopolymer Composites. Int. J. Mol. Sci. 2019, 20, 2321. [Google Scholar] [CrossRef] [PubMed] [Green Version]
  2. Rambabu, G.; Bhat, S.D.; Figueiredo, F.M.L. Carbon Nanocomposite Membrane Electrolytes for Direct Methanol Fuel Cells—A Concise Review. Nanomaterials 2019, 9, 1292. [Google Scholar] [CrossRef] [Green Version]
  3. He, J.; Zhang, Y.; Zhou, R.; Meng, L.; Chen, T.; Mai, W.; Pan, C. Recent Advances of Wearable and Flexible Piezoresistivity Pressure Sensor Devices and Its Future Prospects. J. Mater. 2020, 6, 86–101. [Google Scholar] [CrossRef]
  4. Jang, D.; Yoon, H.N.; Nam, I.W.; Lee, H.K. Effect of Carbonyl Iron Powder Incorporation on the Piezoresistive Sensing Characteristics of CNT-Based Polymeric Sensor. Compos. Struct. 2020, 244, 112260. [Google Scholar] [CrossRef]
  5. Chang, X.; Sun, S.; Sun, S.; Liu, T.; Xiong, X.; Lei, Y.; Dong, L.; Yin, Y. ZnO Nanorods/Carbon Black-Based Flexible Strain Sensor for Detecting Human Motions. J. Alloys Compd. 2018, 738, 111–117. [Google Scholar] [CrossRef]
  6. Morteza, A.; Aekachan, P.; Sangjun, L.; Seunghwa, R.; Inkyu, P. Highly Stretchable and Sensitive Strain Sensor Based on Silver Nanowire-Elastomer Nanocomposite. ACS Nano 2014, 8, 5154–5163. [Google Scholar]
  7. Park, J.J.; Hyun, W.J.; Mun, S.C.; Park, Y.T.; Park, O.O. Highly Stretchable and Wearable Graphene Strain Sensors with Controllable Sensitivity for Human Motion Monitoring. ACS Appl. Mater. Interfaces 2015, 7, 6317–6324. [Google Scholar] [CrossRef] [PubMed]
  8. Salski, B.; Gwarek, W.; Korpas, P.; Reszewicz, S.; Chong, A.Y.B.; Theodorakeas, P.; Hatziioannidis, I.; Kappatos, V.; Selcuk, C.; Gan, T.H.; et al. Non-Destructive Testing of Carbon-Fibre-Reinforced Polymer Materials with a Radio-Frequency Inductive Sensor. Compos. Struct. 2015, 122, 104–112. [Google Scholar] [CrossRef]
  9. Sun, Y.W.; Liu, W.; Hernandez, I.; Gonzalez, J.; Rodriguez, F.; Dunstan, D.J.; Humphreys, C.J. 3D Strain in 2D Materials: To What Extent Is Monolayer Graphene Graphite? Phys. Rev. Lett. 2019, 123, 135501. [Google Scholar] [CrossRef] [Green Version]
  10. Rafiei, Z.; Zahedi-Dizaji, S.M.; Kang, A.K. Two-Dimensional Nanomaterials. In Nanostructures; Intech Open: London, UK, 2019. [Google Scholar] [CrossRef] [Green Version]
  11. Peres, N.M.R. Colloquium: The Transport Properties of Graphene: An Introduction. Rev. Mod. Phys. 2010, 82, 2673–2700. [Google Scholar] [CrossRef] [Green Version]
  12. Trikkaliotis, D.G.; Mitropoulos, A.C.; Kyzas, G.Z. Low-Cost Route for Top-down Synthesis of over- and Low-Oxidized Graphene Oxide. Colloids Surfaces A Physicochem. Eng. Asp. 2020, 600, 124928. [Google Scholar] [CrossRef]
  13. Dimiev, A.M.; Ceriotti, G.; Metzger, A.; Kim, N.D.; Tour, J.M. Chemical Mass Production of Graphene Nanoplatelets in ∼100% Yield. ACS Nano 2016, 10, 274–279. [Google Scholar] [CrossRef]
  14. Cataldi, P.; Athanassiou, A.; Bayer, I.S. Graphene Nanoplatelets-Based Advanced Materials and Recent Progress in Sustainable Applications. Appl. Sci. 2018, 8, 1438. [Google Scholar] [CrossRef] [Green Version]
  15. Chung, D.D.L. A Review of Exfoliated Graphite. J. Mater. Sci. 2015, 51, 554–568. [Google Scholar] [CrossRef]
  16. Shen, J.; Hu, Y.; Li, C.; Qin, C.; Ye, M. Synthesis of Amphiphilic Graphene Nanoplatelets. Small 2009, 5, 82–85. [Google Scholar] [CrossRef] [PubMed]
  17. Moreira, I.P.; Sanivada, U.K.; Bessa, J.; Cunha, F.; Fangueiro, R. A Review of Multiple Scale Fibrous and Composite Systems for Heating Applications. Molecules 2021, 26, 3686. [Google Scholar] [CrossRef] [PubMed]
  18. Sanivada, U.K.; MarMol, G.; Fangueiro, R. Hierarchical Vegetal Fiber Reinforced Composites. In Vegetable Fiber Composites and their Technological Applications; Jawaid, M., Khan, A., Eds.; Springer Nature: Singapore, 2021; pp. 379–412. [Google Scholar] [CrossRef]
  19. Shekar, H.S.S.; Ramachandra, M. Green Composites: A Review. Mater. Today Proc. 2018, 5, 2518–2526. [Google Scholar] [CrossRef]
  20. Ramesh, M.; Palanikumar, K.; Reddy, K.H. Plant Fibre Based Bio-Composites: Sustainable and Renewable Green Materials. Renew. Sustain. Energy Rev. 2017, 79, 558–584. [Google Scholar] [CrossRef]
  21. Christian, S.J.; Billington, S.L. Mechanical Response of PHB- and Cellulose Acetate Natural Fiber-Reinforced Composites for Construction Applications. Compos. Part B Eng. 2011, 42, 1920–1928. [Google Scholar] [CrossRef]
  22. Zhang, Q.; Shi, L.; Nie, J.; Wang, H.; Yang, D. Study of Poly(Lactic Acid)/Natural Fiber Composites. J. Appl. Polym. Sci. 2012, 125, E526–E533. [Google Scholar] [CrossRef]
  23. Sanivada, U.K.; MarMol, G.; Brito, F.P.; Fangueiro, R. PLA Composites Reinforced with Flax and Jute Fibers—A Review of Recent Trends, Processing Parameters and Mechanical Properties. Polymers 2020, 12, 2373. [Google Scholar] [CrossRef] [PubMed]
  24. Saba, N.; Jawaid, M.; Al-Othman, O. An Overview on Polylactic Acid, Its Cellulosic Composites and Applications. Curr. Org. Synth. 2017, 14, 156–170. [Google Scholar] [CrossRef] [Green Version]
  25. Mathuriya, A.S.; Yakhmi, J.V. Polyhydroxyalkanoates: Biodegradable Plastics and Their Applications. In Handbook of Ecomaterials; Martínez, L.M.T., Kharissova, O.V., Kharisov, B.I., Eds.; Springer: Cham, Switzerland, 2019; Volume 4, pp. 2873–2900. [Google Scholar] [CrossRef]
  26. Bugnicourt, E.; Cinelli, P.; Lazzeri, A.; Alvarez, V. Polyhydroxyalkanoate (PHA): Review of Synthesis, Characteristics, Processing and Potential Applications in Packaging. Express Polym. Lett. 2014, 8, 791–808. [Google Scholar] [CrossRef] [Green Version]
  27. Chen, G.-Q.; Chen, X.-Y.; Wu, F.-Q.; Chen, J.-C. Polyhydroxyalkanoates (PHA) toward Cost Competitiveness and Functionality. Adv. Ind. Eng. Polym. Res. 2020, 3, 1–7. [Google Scholar] [CrossRef]
  28. Seoane, I.T.; Manfredi, L.B.; Cyras, V.P.; Torre, L.; Fortunati, E.; Puglia, D. Effect of Cellulose Nanocrystals and Bacterial Cellulose on Disintegrability in Composting Conditions of Plasticized PHB Nanocomposites. Polymers 2017, 9, 561. [Google Scholar] [CrossRef] [PubMed] [Green Version]
  29. Rigotti, D.; Checchetto, R.; Tarter, S.; Caretti, D.; Rizzuto, M.; Fambri, L.; Pegoretti, A. Polylactic Acid-Lauryl Functionalized Nanocellulose Nanocomposites: Microstructural, Thermo-Mechanical and Gas Transport Properties. Express Polym. Lett. 2019, 13, 858–876. [Google Scholar] [CrossRef]
  30. Xu, P.; Yang, W.; Niu, D.; Yu, M.; Du, M.; Dong, W.; Chen, M.; Jan Lemstra, P.; Ma, P. Multifunctional and Robust Polyhydroxyalkanoate Nanocomposites with Superior Gas Barrier, Heat Resistant and Inherent Antibacterial Performances. Chem. Eng. J. 2020, 382, 122864. [Google Scholar] [CrossRef]
  31. Niyogi, S.; Bekyarova, E.; Itkis, M.E.; McWilliams, J.L.; Hamon, M.A.; Haddon, R.C. Solution Properties of Graphite and Graphene. J. Am. Chem. Soc. 2006, 128, 7720–7721. [Google Scholar] [CrossRef] [PubMed]
  32. Shim, S.H.; Kim, K.T.; Lee, J.U.; Jo, W.H. Facile Method to Functionalize Graphene Oxide and Its Application to Poly(Ethylene Terephthalate)/Graphene Composite. ACS Appl. Mater. Interfaces 2012, 4, 4184–4191. [Google Scholar] [CrossRef]
  33. Mukheem, A.; Muthoosamy, K.; Manickam, S.; Sudesh, K.; Shahabuddin, S.; Saidur, R.; Akbar, N.; Sridewi, N. Fabrication and Characterization of an Electrospun PHA/Graphene Silver Nanocomposite Scaffold for Antibacterial Applications. Materials 2018, 11, 1673. [Google Scholar] [CrossRef] [PubMed] [Green Version]
  34. Yao, H.; Wu, L.P.; Chen, G.Q. Synthesis and Characterization of Electroconductive PHA- Graft-Graphene Nanocomposites. Biomacromolecules 2019, 20, 645–652. [Google Scholar] [CrossRef] [PubMed]
  35. Jung, I.; Dikin, D.A.; Piner, R.D.; Ruoff, R.S. Tunable Electrical Conductivity of Individual Graphene Oxide Sheets Reduced at “Low” Temperatures. Nano Lett. 2008, 8, 4283–4287. [Google Scholar] [CrossRef] [PubMed]
  36. Kashi, S.; Gupta, R.K.; Kao, N.; Hadigheh, S.A.; Bhattacharya, S.N. Influence of Graphene Nanoplatelet Incorporation and Dispersion State on Thermal, Mechanical and Electrical Properties of Biodegradable Matrices. J. Mater. Sci. Technol. 2018, 34, 1026–1034. [Google Scholar] [CrossRef]
  37. Bhardwaj, U.; Dhar, P.; Kumar, A.; Katiyar, V. Polyhydroxyalkanoates (PHA)-Cellulose Based Nanobiocomposites for Food Packaging Applications. In Food Additives and Packaging; Komolprasert, V., Turowski, P., Eds.; ACS Publications: Washington, DC, USA, 2014; Volume 1162, pp. 275–314. [Google Scholar] [CrossRef]
  38. Reddy, M.V.; Mawatari, Y.; Onodera, R.; Nakamura, Y.; Yajima, Y.; Chang, Y.C. Polyhydroxyalkanoates (PHA) Production from Synthetic Waste Using Pseudomonas Pseudoflava: PHA Synthase Enzyme Activity Analysis from P. Pseudoflava and P. Palleronii. Bioresour. Technol. 2017, 234, 99–105. [Google Scholar] [CrossRef] [PubMed] [Green Version]
  39. Sundar, N.; Kumar, S.A.; Pavithra, A.; Ghosh, S. Studies on Semi-Crystalline Poly Lactic Acid (PLA) as a Hydrophobic Coating Material on Kraft Paper for Imparting Barrier Properties in Coated Abrasive Applications. Prog. Org. Coat. 2020, 145. [Google Scholar] [CrossRef]
  40. Adesina, O.T.; Sadiku, E.R.; Jamiru, T.; Ogunbiyi, O.F.; Adesina, O.S. Thermal Properties of Spark Plasma -Sintered Polylactide/Graphene Composites. Mater. Chem. Phys. 2020, 242, 122545. [Google Scholar] [CrossRef]
  41. Gao, Y.; Picot, O.T.; Bilotti, E.; Peijs, T. Influence of Filler Size on the Properties of Poly(Lactic Acid) (PLA)/Graphene Nanoplatelet (GNP) Nanocomposites. Eur. Polym. J. 2017, 86, 117–131. [Google Scholar] [CrossRef]
  42. Szuman, K.; Krucińska, I.; Boguń, M.; Draczyński, Z. PLA/PHA- Biodegradable Blends for Pneumothermic Fabrication of Nonwovens. Autex Res. J. 2016, 16, 119–127. [Google Scholar] [CrossRef] [Green Version]
  43. Jayaramudu, T.; Raghavendra, G.M.; Varaprasad, K.; Reddy, G.V.S.; Reddy, A.B.; Sudhakar, K.; Sadiku, E.R. Preparation and Characterization of Poly(Ethylene Glycol) Stabilized Nano Silver Particles by a Mechanochemical Assisted Ball Mill Process. J. Appl. Polym. Sci. 2016, 133, 1–8. [Google Scholar] [CrossRef]
  44. Gupta, A.; Simmons, W.; Schueneman, G.T.; Hylton, D.; Mintz, E.A. Rheological and Thermo-Mechanical Properties of Poly(Lactic Acid)/Lignin-Coated Cellulose Nanocrystal Composites. ACS Sustain. Chem. Eng. 2017, 5, 1711–1720. [Google Scholar] [CrossRef]
  45. Ojha, N.; Das, N. A Statistical Approach to Optimize the Production of Polyhydroxyalkanoates from Wickerhamomyces Anomalus VIT-NN01 Using Response Surface Methodology. Int. J. Biol. Macromol. 2018, 107, 2157–2170. [Google Scholar] [CrossRef] [PubMed]
  46. Zou, H.; Yi, C.; Wang, L.; Liu, H.; Xu, W. Thermal Degradation of Poly(Lactic Acid) Measured by Thermogravimetry Coupled to Fourier Transform Infrared Spectroscopy. J. Therm. Anal. Calorim. 2009, 97, 929–935. [Google Scholar] [CrossRef]
  47. Achaby, M.E.; Arrakhiz, F.; Vaudreuil, S.; Qaiss, A.K.; Bousmina, M.; Fassi-Fehri, O. Mechanical, Thermal, and Rheological Properties of Graphene-Based Polypropylene Mechanical, Thermal, and Rheological Properties of Graphene-Based Polypropylene Nanocomposites Prepared by Melt of Graphene-Based Polypropylene Nanocomposites Prepared by Melt. Polym. Compos. 2012, 33, 733–744. [Google Scholar] [CrossRef]
  48. Kotsilkova, R.; Petrova-Doycheva, I.; Menseidov, D.; Ivanov, E.; Paddubskaya, A.; Kuzhir, P. Exploring Thermal Annealing and Graphene-Carbon Nanotube Additives to Enhance Crystallinity, Thermal, Electrical and Tensile Properties of Aged Poly(Lactic) Acid-Based Filament for 3D Printing. Compos. Sci. Technol. 2019, 181, 107712. [Google Scholar] [CrossRef]
  49. Li, J.; Li, X.; Ni, X.; Leong, K.W. Synthesis and Characterization of New Biodegradable Amphiphilic Poly(Ethylene Oxide)-b-Poly [(R)-3-Hydroxy Butyrate]-b-Poly(Ethylene Oxide) Triblock Copolymers. Macromolecules 2003, 36, 2661–2667. [Google Scholar] [CrossRef]
  50. Pan, J.; Li, G.; Chen, Z.; Chen, X.; Zhu, W.; Xu, K. Alternative Block Polyurethanes Based on Poly(3-Hydroxybutyrate-Co-4-Hydroxybutyrate) and Poly(Ethylene Glycol). Biomaterials 2009, 30, 2975–2984. [Google Scholar] [CrossRef]
  51. Ozdemir, E.; Hacaloglu, J. Characterizations of PLA-PEG Blends Involving Organically Modified Montmorillonite. J. Anal. Appl. Pyrolysis 2017, 127, 343–349. [Google Scholar] [CrossRef]
  52. Ghalia, M.A.; Dahman, Y. Investigating the Effect of Multi-Functional Chain Extenders on PLA/PEG Copolymer Properties; Elsevier B.V.: Amsterdam, The Netherlands, 2017; Volume 95. [Google Scholar] [CrossRef]
  53. Graphene, L.; Rafiee, M.; Rafiee, J.; Wang, Z.; Song, H.; Yu, Z.; Koratkar, N. Enhanced Mechanical Properties of Nanocomposites at Low Graphene Content. ACS Nano 2009, 3, 3884–3890. [Google Scholar] [CrossRef]
  54. Ladani, R.B.; Bhasin, M.; Wu, S.; Ravindran, A.R.; Ghorbani, K.; Zhang, J.; Kinloch, A.J.; Mouritz, A.P.; Wang, C.H. Fracture and Fatigue Behaviour of Epoxy Nanocomposites Containing 1-D and 2-D Nanoscale Carbon Fillers. Eng. Fract. Mech. 2018, 203, 102–114. [Google Scholar] [CrossRef]
  55. Li, L.; Bao, R.Y.; Gao, T.; Liu, Z.Y.; Xie, B.H.; Yang, M.B.; Yang, W. Dopamine-Induced Functionalization of Cellulose Nanocrystals with Polyethylene Glycol towards Poly(L-Lactic Acid) Bionanocomposites for Green Packaging. Carbohydr. Polym. 2019, 203, 275–284. [Google Scholar] [CrossRef]
  56. Kashi, S.; Gupta, R.K.; Baum, T.; Kao, N.; Bhattacharya, S.N. Morphology, Electromagnetic Properties and Electromagnetic Interference Shielding Performance of Poly Lactide/Graphene Nanoplatelet Nanocomposites. Mater. Des. 2016, 95, 119–126. [Google Scholar] [CrossRef]
  57. Kim, I.H.; Jeong, Y.G. Polylactide/Exfoliated Graphite Nanocomposites with Enhanced Thermal Stability, Mechanical Modulus, and Electrical Conductivity. J. Polym. Sci. Part B Polym. Phys. 2010, 48, 850–858. [Google Scholar] [CrossRef]
  58. Papadopoulou, E.L.; Basnett, P.; Paul, U.C.; Marras, S.; Ceseracciu, L.; Roy, I.; Athanassiou, A. Green Composites of Poly(3-Hydroxybutyrate) Containing Graphene Nanoplatelets with Desirable Electrical Conductivity and Oxygen Barrier Properties. ACS Omega 2019, 4, 19746–19755. [Google Scholar] [CrossRef] [PubMed] [Green Version]
  59. Skoog, D.A.; Holler, F.J.; Crouch, S.R. Principles of Instrumental Analysis, 6th ed.; Skoog, D.A., Holler, F.J., Crouch, S.R., Eds.; Thomson Brooks/Cole: Belmont, CA, USA, 2007. [Google Scholar]
Figure 1. Equipment used to measure the superficial electrical resistance (left) and representation of the setup to evaluate the piezoresistivity of the samples (right).
Fibers 09 00086 g001
Figure 2. Optical microscopy images of the film samples of the different polymer matrices with different GNPs concentrations. (a) PHA + 0.15 wt.% GNPs, (b) PHA + 0.75 wt.% GNPs, (c) PHA + 1.50 wt.% GNPs, (d) PLA + 0.15 wt.% GNPs, (e) PLA + 0.75 wt.% GNPs and (f) PLA + 1.50 wt.% GNPs.
Fibers 09 00086 g002
Figure 3. SEM images of the fractured samples of (a) PHA and (b) PLA films with 15 wt.% of GNPs.
Fibers 09 00086 g003
Figure 4. (a) DSC curves of the PHA films with different additions by mass: graphene nanoparticles (GNPs), cellulose nanocrystals (CNC) and polyethylene glycol (PEG). (b) DSC curves of the PLA films with different additions by mass: graphene nanoparticles (GNPs), cellulose nanocrystals (CNC) and polyethylene glycol (PEG).
Fibers 09 00086 g004aFibers 09 00086 g004b
Figure 5. (a) Thermogravimetric curves of PHA films with different additions by mass: graphene nanoparticles (GNPs), cellulose nanocrystals (CNC) and polyethylene glycol (PEG). (b) Thermogravimetric curves of PLA films with different additions by mass: graphene nanoparticles (GNPs), cellulose nanocrystals (CNC) and polyethylene glycol (PEG).
Fibers 09 00086 g005
Figure 6. Tensile–strain curves of the films with different GNPs concentrations, from 0.15 to 15 wt.% (a,c) display tensile curves of PHA and PLA, respectively, with different GNP content (from 0.15 to 15 wt.%). (b,d) are PHA and PLA samples reinforced with 15 wt.% GNP and the different additions here explored, CNC and PEG.
Fibers 09 00086 g006
Figure 7. Electrical conductivity values of the films with different GNPs concentrations—PHA (black) and PLA (red) and with the highest GNPs concentration (15 wt.%) and the different additions, CNC and PEG (in the black dashed square on the right).
Fibers 09 00086 g007
Figure 8. Piezoresistive curves (black axis) of the films with different GNPs concentrations (7.5 and 15 wt.%) and the strain curves (blue axis) over time.
Fibers 09 00086 g008
Table 1. Technical Data of the Materials.
MaterialTechnical SpecificationsCompany Details
PHAMelt Flow Rate = 3 g/10 min at 170 °CGoodfellow Cambridge, Huntingdon, UK
Peak Melt Temperature = 140–160 °C
Specific Gravity = 1.24 g/cm3
PLAMelt Flow Rate = 3 g/10 min at 170 °CNature Works®, Blair, WI, USA
Peak Melt Temperature = 140–160 °C
Specific Gravity = 1.24 g/cm3
GNPs8–30 layersGraphenest, Aveiro, Portugal
Thickness = 3 and 10 nm
Planar size = 0.5 to 0.2 μm
Surface Area = 150 m2/g
CNCsAverage Particle Size = 75 nmCelluforce, Windsor, QC, Canada
Polydispersity Index = 0.181
Spray dried form
ChloroformDensity = 1.48 g/cm3 (20 °C)Honeywell, Seelze, Germany
Vapor pressure = 210 hPa (25 °C)
99% purity
PEG 4000Solidification point = 54.1 °CAcofarma, Barcelona, Spain
OHCH2-(CH2OCH2)n-CH2OH n: 68–84
Viscosity = 121.0 mPas
Table 2. Summary of results obtained by physical characterization of PHA and PLA composites with different additions (GNPs, CNC and PEG).
ΔHmXcTmMass Loss (%)
(mJ)(J/g)(%)(°C)300 °C350 °C400 °C
PHA98.911.88.1153.859.691.896.5
PHA + 1% CNC88.410.47.2152.659.792.495.8
PHA + 7.5% GNPs********58.392.895.6
PHA + 15% GNPs75.88.97.2153.848.779.981.4
PHA + 15% GNPs + 1%CNC80.99.17.4154.350.681.182.3
PHA + 15% GNPs + 20%PEG81.59.57.6153.945.865.877.6
PHA + 15% GNPs + 1%CNC + 20%PEG********54.865.276.9
PLA323.840.042.7151.22.119.199.9
PLA + 1% CNC254.530.733.1150.71.617.498.9
PLA + 7.5% GNPs********1.830.198.1
PLA + 15% GNPs245.427.622.2146.41.519.985.2
PLA + 15% GNPs + 1%CNC192.822.218.1145.02.922.286.2
PLA + 15% GNPs + 20%PEG223.024.519.8145.26.751.684.4
PLA + 15% GNPs + 1%CNC + 20%PEG********10.965.782.3
** Non-Availability of Results
Table 3. Summary of the mechanical (tensile strength, strain at break and Elastic Modulus) and electrical properties (electrical conductivity and Gauge factor) of PHA and PLA composites with different additions (GNPs, CNC and PEG).
GNPS (wt.%)
00.150.751.537.515
Additives (wt.%)
***1% CNC******************1% CNC20% PEG20% PEG + 1% CNC
Tensile propertiesTensile strength (MPa)PLA59.6572.9161.4562.1949.49***38.1328.3324.2012.358.42
σ3.173.983.401.671.28***2.432.403.170.7323.69
CV5.31%5.46%5.53%2.68%2.59%***6.36%8.48%13.08%5.90%2.82%
PHA18.6722.4819.0619.7716.85***11.7311.1412.377.726.36
σ0.790.521.090.581.04***1.222.001.080.970.30
CV4.22%2.30%5.74%2.92%6.20%***10.38%17.93%8.71%12.51%4.74%
Strain at break(%)PLA3.943.944.565.803.25***2.702.492.0710.2417.31
σ0.440.490.640.450.50***0.320.120.272.960.94
CV11.27%12.42%14.08%7.68%15.50%***11.75%4.97%13.04%28.91%5.40%
PHA4.7510.704.383.993.68***2.192.352.292.451.77
σ0.210.060.160.350.18***0.210.020.290.480.07
CV4.42%0.59%3.67%8.80%4.92%***9.65%1.06%12.57%19.42%3.81%
Elastic Modulus(GPa)PLA1.952.122.112.101.98***1.751.301.840.560.30
σ0.070.140.110.100.15***0.140.240.140.120.03
CV3.40%6.66%5.44%4.94%7.56%***8.16%18.15%7.73%20.95%9.24%
PHA0.540.720.720.950.96***0.800.560.930.480.35
σ0.080.020.080.060.01***0.030.130.110.010.03
CV14.97%2.42%11.38%6.27%1.40%***3.59%23.68%11.30%2.27%8.28%
Electrical propertiesPiezoresistiveanalysis(GF)PLA******************1.021.121.384.313.24
σ******************0.410.260.381.510.87
CV******************39.723.227.835.026.9
PHA******************3.776.301.911.022.00
σ******************1.671.751.10.500.85
CV******************44.38%27.74%60.03%49.20%42.64%
Electricalconductivity(S/m)PLA******1.1 × 10−79.2 × 10−81.1 × 10−79.0 × 10−80.205.815.5916.1111.54
σ******5.24 × 10−91.31 × 10−89.17 × 10−91.02 × 10−80.020.250.781.910.60
CV******4.65%14.20%8.39%***11.57%4.36%13.93%11.88%5.20%
PHA******1.37 × 10−71.86 × 10−71.38 × 10−70.251.2012.949.0710.5212.87
σ******8.21 × 10−91.54 × 10−89.20 × 10−90.020.181.511.282.292.39
CV******5.98%8.28%6.68%***15.24%11.68%14.08%21.78%18.56%
ℜ—Average values; σ—Standard deviation; CV—Coefficient of Variation; *** Non-Availability of Results
Publisher’s Note: MDPI stays neutral with regard to jurisdictional claims in published maps and institutional affiliations.

