Article

Characterisation of Elementary Kenaf Fibres Extracted Using HNO3 and H2O2/CH3COOH

by
Niphaphun Soatthiyanon
and
Alan Crosky
*
School of Materials Science and Engineering, UNSW Sydney, Sydney, NSW 2052, Australia
*
Author to whom correspondence should be addressed.
Fibers 2022, 10(8), 63; https://doi.org/10.3390/fib10080063
Submission received: 9 May 2022 / Revised: 30 June 2022 / Accepted: 20 July 2022 / Published: 25 July 2022

Abstract

:
In this study, elementary kenaf fibres were separated from fibre bundles using two different treatments. The first involved treating with nitric acid (HNO3) while the second used a mixture of hydrogen peroxide (H2O2) and acetic acid (CH3COOH). Both treatments were successful in isolating the elementary fibres but the H2O2/CH3COOH gave a better fibre yield and required a shorter treatment time. The fibres treated with HNO3 had an average length of 0.2 mm, an aspect ratio of 15 and a defect density of 21 defects per mm. In contrast, the H2O2/CH3COOH treated fibres had a length of 2.3 mm, an aspect ratio of 179 and a defect density of 14 defects per mm. Both treatments removed lignin, pectin, and waxes. They also increased cellulose crystallinity in the fibres, especially for HNO3 treatment. However, they resulted in some oxidation of cellulose. The H2O2/CH3COOH treatment gave a substantial improvement in the thermal stability of the fibres while a marked decrease was observed for the HNO3 treatment.

1. Introduction

Natural fibres, particularly bast fibres such as flax, hemp, kenaf, ramie, and jute [1,2,3,4], have started to be used in recent years as the reinforcement in polymer-matrix composites. This is part of a wider thrust to use eco-friendly materials in lieu of their less environmentally-friendly counterparts. Eco-friendly materials offer benefits extending from their production right through to their end-of-life disposal. In the case of natural plant fibres, they are a renewable material, while their production is much less energy intensive than that of synthetic reinforcing fibres. The fibres are also less harmful to workers. Being intrinsically biodegradable, they are also less problematic for end-of-life disposal. Moreover, they are CO2 neutral [4].
Several methods have been used to improve the performance of composites reinforced with natural fibres. Most of these involve fibre surface modification using chemical, physical or thermal treatments. The chemical treatments include alkaline [5,6,7], silane [8] and acetylation treatments [9]. The physical treatments include stretching, calendaring and electric discharge (corona and cold plasma treatments) [10]. Thermal treatment [11] involves the use of thermal energy at the glass transition temperature of lignin [12], which removes the lignin that supports and holds the elementary fibres together [2].
Another method which can be used is to increase the fibre aspect ratio by isolating the elementary fibres (individual single cell fibres). This method is thought to have more potential compared to fibre surface modifications in enhancing composite mechanical properties [13]. This is supported by the work of Stuart et al. [14] who separated flax fibres into elementary fibres using pectinase and/or ethylenediaminetetraacetic acid. The elementary flax fibres were used to reinforce epoxy-matrix composites. It was observed that the use of elementary fibres increased the mechanical properties of the composites, especially the tensile strength and work of fracture. However, otherwise, there has been very little research carried out in this area.
Several workers have examined the extraction of elementaries from kenaf fibres for pulp or paper production. Shin et al. [15] found that chemical treatments using sodium hydroxide and anthraquinone, and bleaching using sodium chlorite, acetic acid, and sodium hypochlorite, were ineffective in separating the elementary fibres. However, elementary fibres were successfully isolated when they were treated with water, bleached with sodium chlorite, acetic acid, and sodium hypochlorite, and then treated using electron beam irradiation. Mazumder et al. extracted elementary fibres from kenaf using nitric acid (HNO3) and also a mixture of hydrogen peroxide (H2O2) and acetic acid (CH3COOH) [16]. Calamari et al. also isolated kenaf elementaries using an H2O2/CH3COOH mixture following pretreatment with alkali [17].
Elementary fibres are particularly attractive for use in injection moulded and extruded thermoplastic composites. Good reinforcement efficiency cannot be achieved in these processes using the fibre bundles since they must be chopped into low aspect ratio segments in order to provide short enough fibres for the feed. However, elementary fibres are short enough to feed into the moulder or extruder while also having an inherently high aspect ratio. As a result, they have the potential to provide a potent reinforcement in these composites.
While extraction of kenaf elementaries has been examined for pulp or paper production, no research appears to have been conducted previously on extraction of kenaf elementaries specifically for use as the reinforcement in polymer matrix composites.
The objectives of the present study were to break down the kenaf fibre bundles into individual separated elementary fibres, so as to be in a form that would be suitable for use in injection moulded and extruded thermoplastic composites, and to undertake a detailed characterisation of the fibres produced in this way.
Both HNO3 and H2O2/CH3COOH treatments were examined. These treatments were chosen as being a more traditional and a more recent treatment, respectively, commonly used for pulp production. The aspect ratio, chemical composition, and thermal degradation of the untreated and treated fibres were examined. Crystallinity of cellulose in both the untreated and treated fibres was also investigated. In addition, the defect density of the treated fibres and the degree of oxidation of cellulose in the fibres were determined.

2. Materials and Methods

2.1. Materials

Kenaf fibre bundles (KF) were obtained from the Malaysian Agriculture Research and Development Institute (MARDI). The kenaf fibres are shown as received in Figure 1 while a chemical analysis conducted on the same batch of fibres, using the Technical Association of Pulp and Paper Industries (TAPPI) test methods, is given in Table 1 [18]. Seventy percent nitric acid (HNO3), thirty percent hydrogen peroxide (H2O2) and glacial acetic acid (CH3COOH) were obtained from Ajax Finechem.

2.2. Kenaf Fibre Extraction

Elementary kenaf fibres were chemically extracted from the kenaf fibre bundles. Two techniques were used, adapted from treatments given in the literature for pulp production [16,19,20,21,22]. The chemicals, temperature, and time used in the treatments are important parameters since they affect the yield, dimensions and level of degradation of the resulting elementary fibres. Agglomeration of the fibres due to hydrogen bonding must also be minimised during the drying process.
One of the two techniques used nitric acid (HNO3) while the second used a mixture of hydrogen peroxide (H2O2) and acetic acid (CH3COOH). Prior to treatment, the kenaf fibre bundles were cut to a length of 100 mm. The first treatment involved soaking the fibres bundles in 60% HNO3 [19] at 80 ± 2 °C for 30 min. The treated kenaf fibres were then soaked in 60% HNO3 at room temperature for five weeks to increase the yield of elementaries. In the second treatment, the fibre bundles were soaked in a mixture of 20% H2O2 and glacial CH3COOH (50:50) [20] at 98 ± 2 °C for 7 h [16]. The extracted fibres were filtered then washed using tap water, distilled water and deionized water, respectively, until the pH value of the solution was approximately 7. The extracted kenaf fibres were kept in deionized water and then frozen to reduce agglomeration. The frozen fibres were then freeze dried in a Lyovac GT 2 freeze drier for one to two days [21,22]. A flowchart showing the two treatments is given in Figure 2.
The elementary kenaf fibres isolated using 60% HNO3 are referred to here as KFTN while the those separated using the mixture of H2O2 and CH3COOH are referred to as KFTHA. Untreated kenaf fibre bundles, chopped into 2 mm lengths, were used as a control. These are referred to as chopped KF.

2.3. Scanning Electron Microscopy (SEM)

The KFTN and KFTHA fibres were imaged with a Hitachi S3400-X scanning electron microscope (SEM) using secondary electrons. The specimens were first sputter coated with gold. The SEM was operated in high vacuum at an accelerating voltage of 10 kV.

2.4. Aspect Ratio of Extracted Kenaf Fibres

The length and diameter were measured for 500 KFTN and 50 KFTHA fibres and the aspect ratio then determined for each process using the average values of these two parameters. The fibres were sprinkled onto glass slides and then examined using a Nikon Eclipse ME600 optical microscope. The measurements were made using the UTHSCSA ImageTool program.

2.5. Fibre Defects

Defects in the extracted fibres (kinks, micro-compressions, pits, nodes, dislocations and initial breaks) were examined using a Hitachi S3400-X scanning electron microscope using the method given in Section 2.3 but with an accelerating voltage of 15 KV. Ten fibres of each type were examined.

2.6. Fourier Transform Infrared (FTIR) Spectroscopy

The chopped and extracted fibres were examined using a Perkin Elmer Spotlight 400 FTIR instrument in attenuated total reflectance (ATR) mode in the range of 650–4000 cm−1 with a resolution of 4 cm−1. Sufficient material (~1 g) was placed on the crystal window to completely cover its area. A single sample containing a substantial number of fibres was analysed for each of the different fibre treatments. All of the fibres in each sample were analysed simultaneously with the spectra obtained being the average result from the individual fibres. The chemical composition of the fibre surfaces was then characterised from absorption peaks of the FTIR spectra.

2.7. Raman Spectroscopy

Cellulose and lignin in the chopped and extracted fibres were analysed using a Perkin Elmer Ramanstation 785-nm (near-IR) laser-based Raman spectrometer in the spectrum range of 200–2000 cm−1. A single sample approximately 1 g in weight (containing a substantial number of fibres) was analysed in each case. All of the fibres in each sample were analysed simultaneously with the spectra obtained being the average result from the individual fibres.

2.8. Cellulose Crystallinity

The cellulose crystallinity of the fibres was determined using both X-ray diffraction (XRD) and solid state nuclear magnetic resonance (NMR). A single sample containing a substantial number of fibres was analysed in each case. All of the fibres in each sample were analysed simultaneously with the spectra obtained being the average result from the individual fibres.
XRD was carried out using a Philips X’pert Multipurpose XRD system. The specimens were scanned from 8° to 55° at 2Ө. A step size of 0.026°, a voltage of 45 kV and a current of 40 mA were used. Time per step and revolution time were 51 and 4 s, respectively. The crystallinity index CrI was calculated using the Segal’s equation [23] given by:
C r I = I 002 I a m I 002
where I 002 denotes the maximum intensity of the 002 peak at about 2Ө = 22.0–22.5° and I a m is the lowest intensity corresponding to the 2Ө value near 18.0–18.5° (amorphous background) [24,25].
Solid state 13C NMR was carried out using a Bruker Avance III 300 Solid State NMR instrument. The crystalline and amorphous peaks at 89 ppm and 84 ppm were used for determining the cellulose crystallinity [26].

2.9. Degree of Oxidation

Some oxidation of the cellulose is to be expected from the treatments used to extract the elementaries from the fibre bundles. This can be detrimental to the mechanical performance of the fibres. Accordingly, the degree of oxidation was determined from the solid state 13C NMR spectra by integrating the peak at 174 ppm (C-6′) corresponding to the carboxyl groups [27]. The degree of oxidation indicates the weight percent of carboxyl in the cellulose [28].

2.10. Thermogravimetic Analysis (TGA)

Thermogravimetric analysis (TGA) was conducted using a TGA Q5000 thermogravimetric analyser under an air atmosphere with a flow rate of 15 mL/min in order to examine thermal decomposition of the chopped and treated fibres. The fibres were heated from room temperature to 700 °C in a platinum pan at a heating rate of 10 °C/min.

3. Results and Discussion

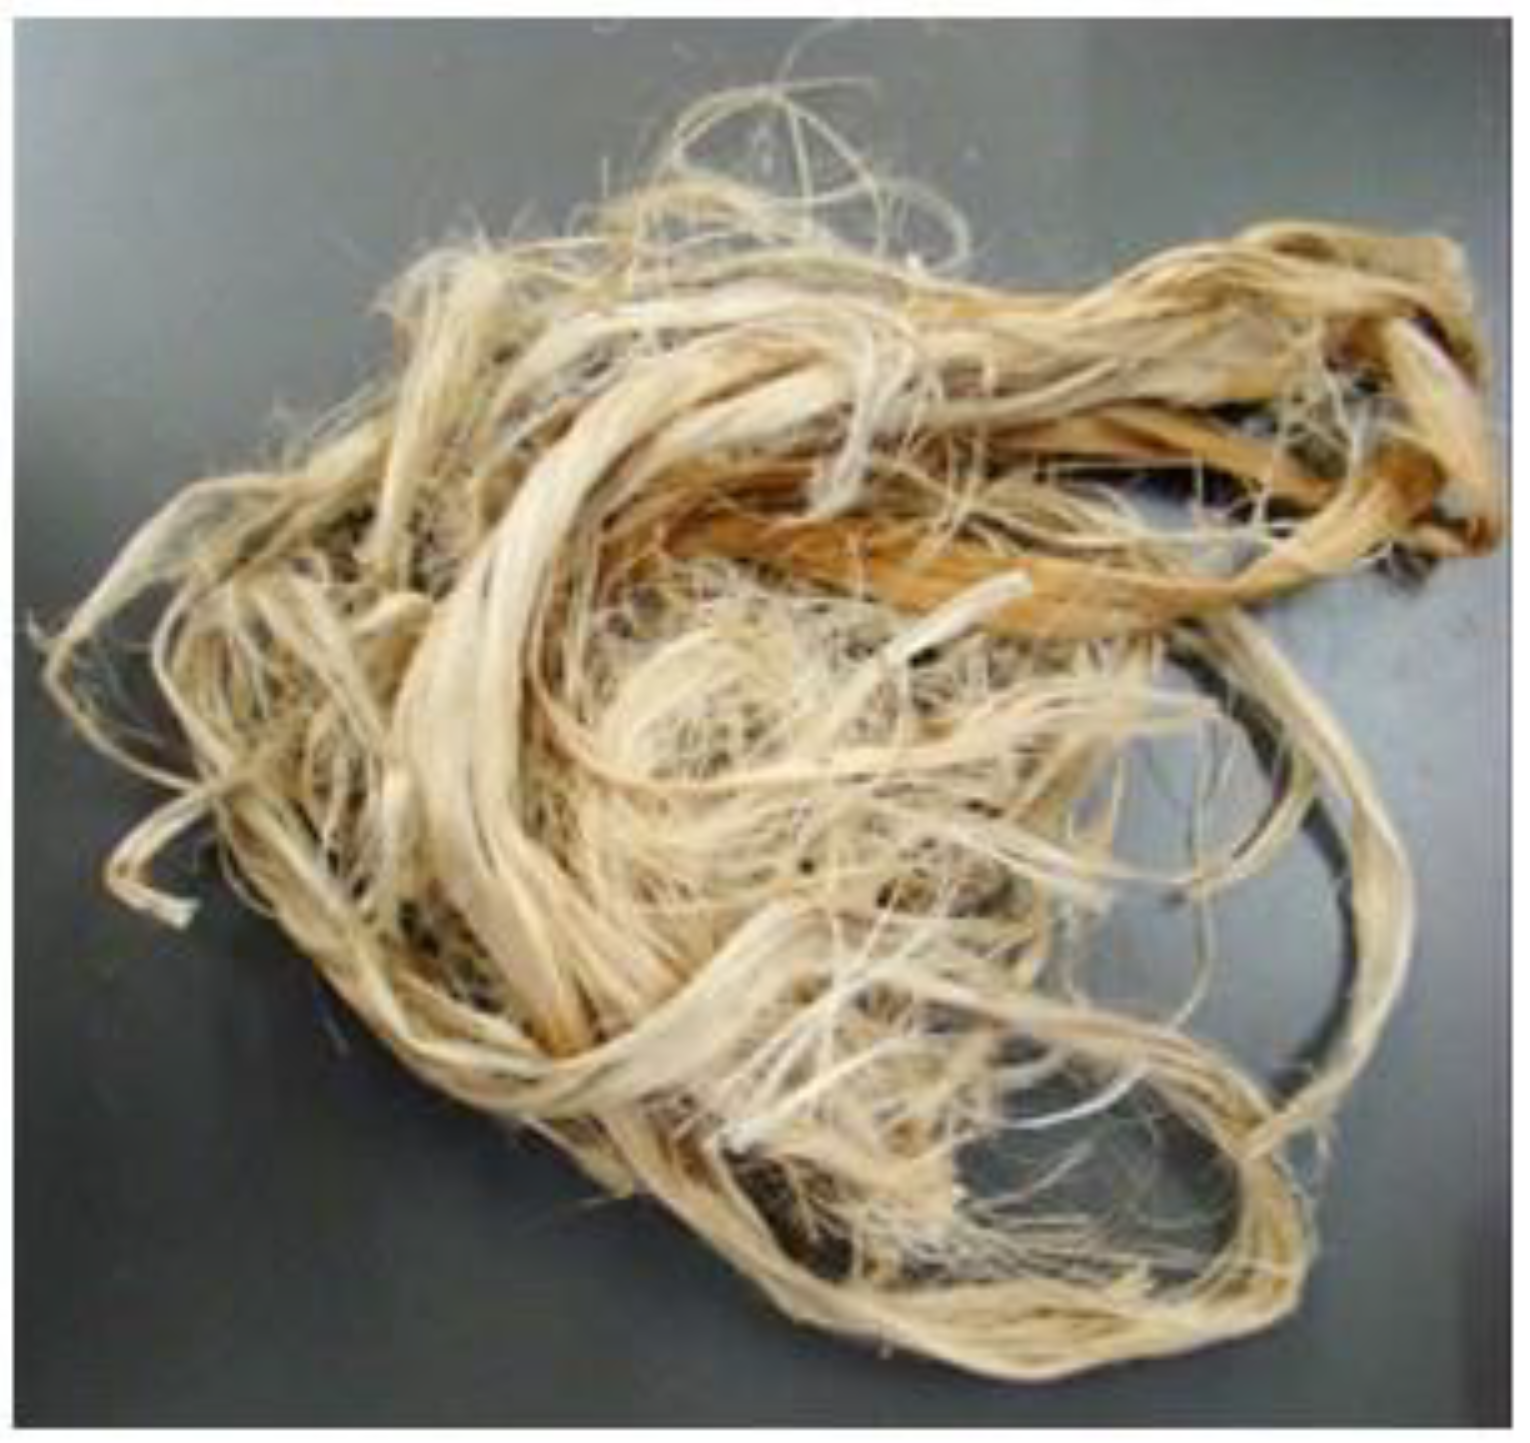
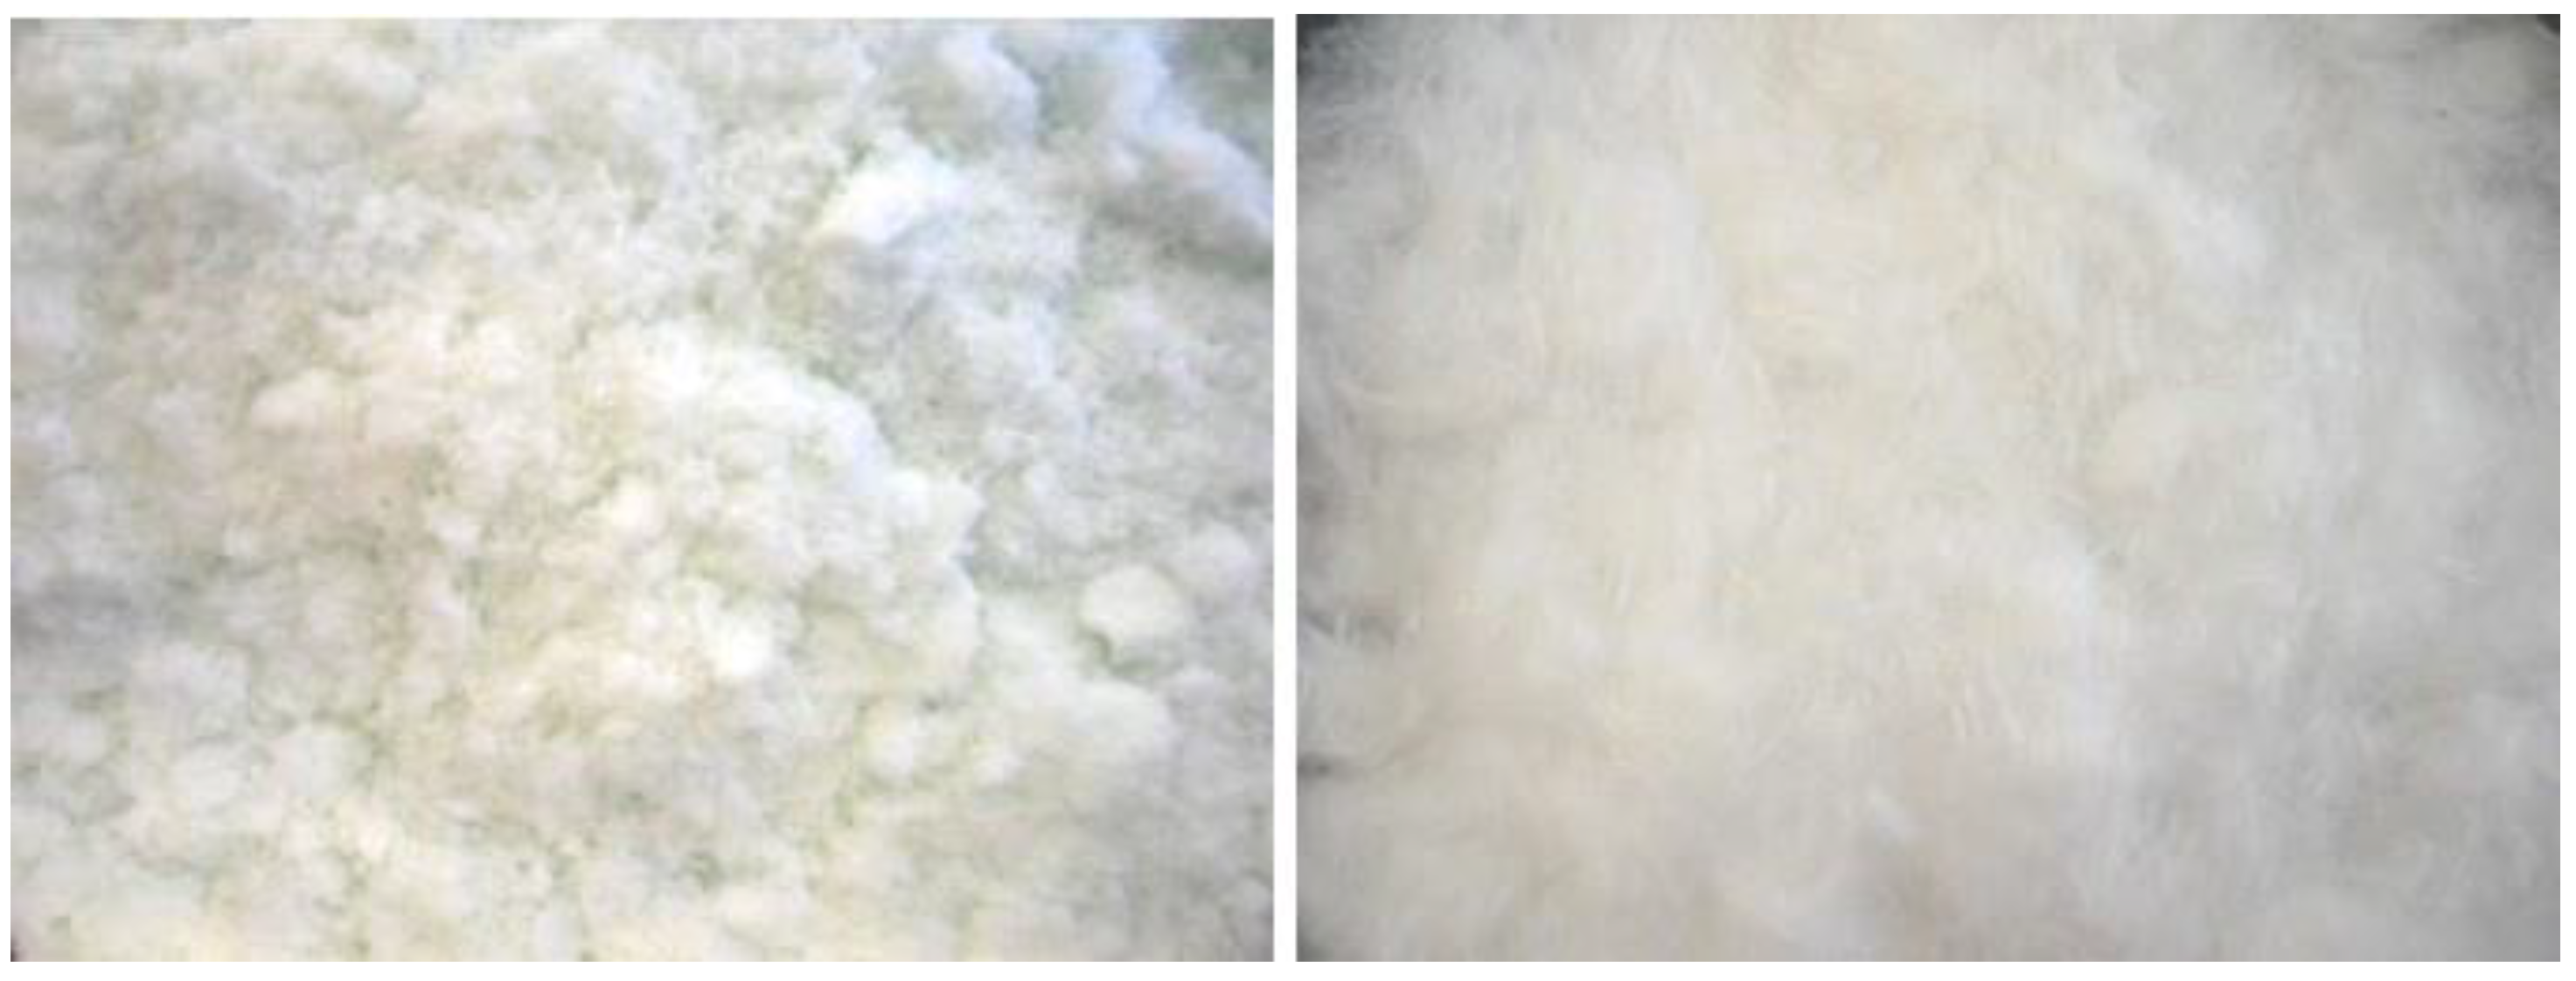
3.1. Extracted Kenaf Fibres

Elementary fibres were successfully extracted from the fibre bundles using both techniques. The extracted elementary fibres are shown in Figure 3, Figure 4 and Figure 5. It can be seen from Figure 4 that the ends of the fibres were quite different for the two treatments. The KFTHA fibres had narrow tapered ends, as is usual for elementary fibres, but the ends of the KFTN fibres were square, indicating that the fibres had been broken during the treatment. As a result of breakage, the KFTN fibres were shorter than the KFTHA fibres, as is shown in the following section.
The yields of the KFTN and KFTHA fibres were quite low being 36% and 58% of the initial weight, respectively. The low yields are attributed to loss of elementaries during the washing step together with fibre degradation during the treatments [29].

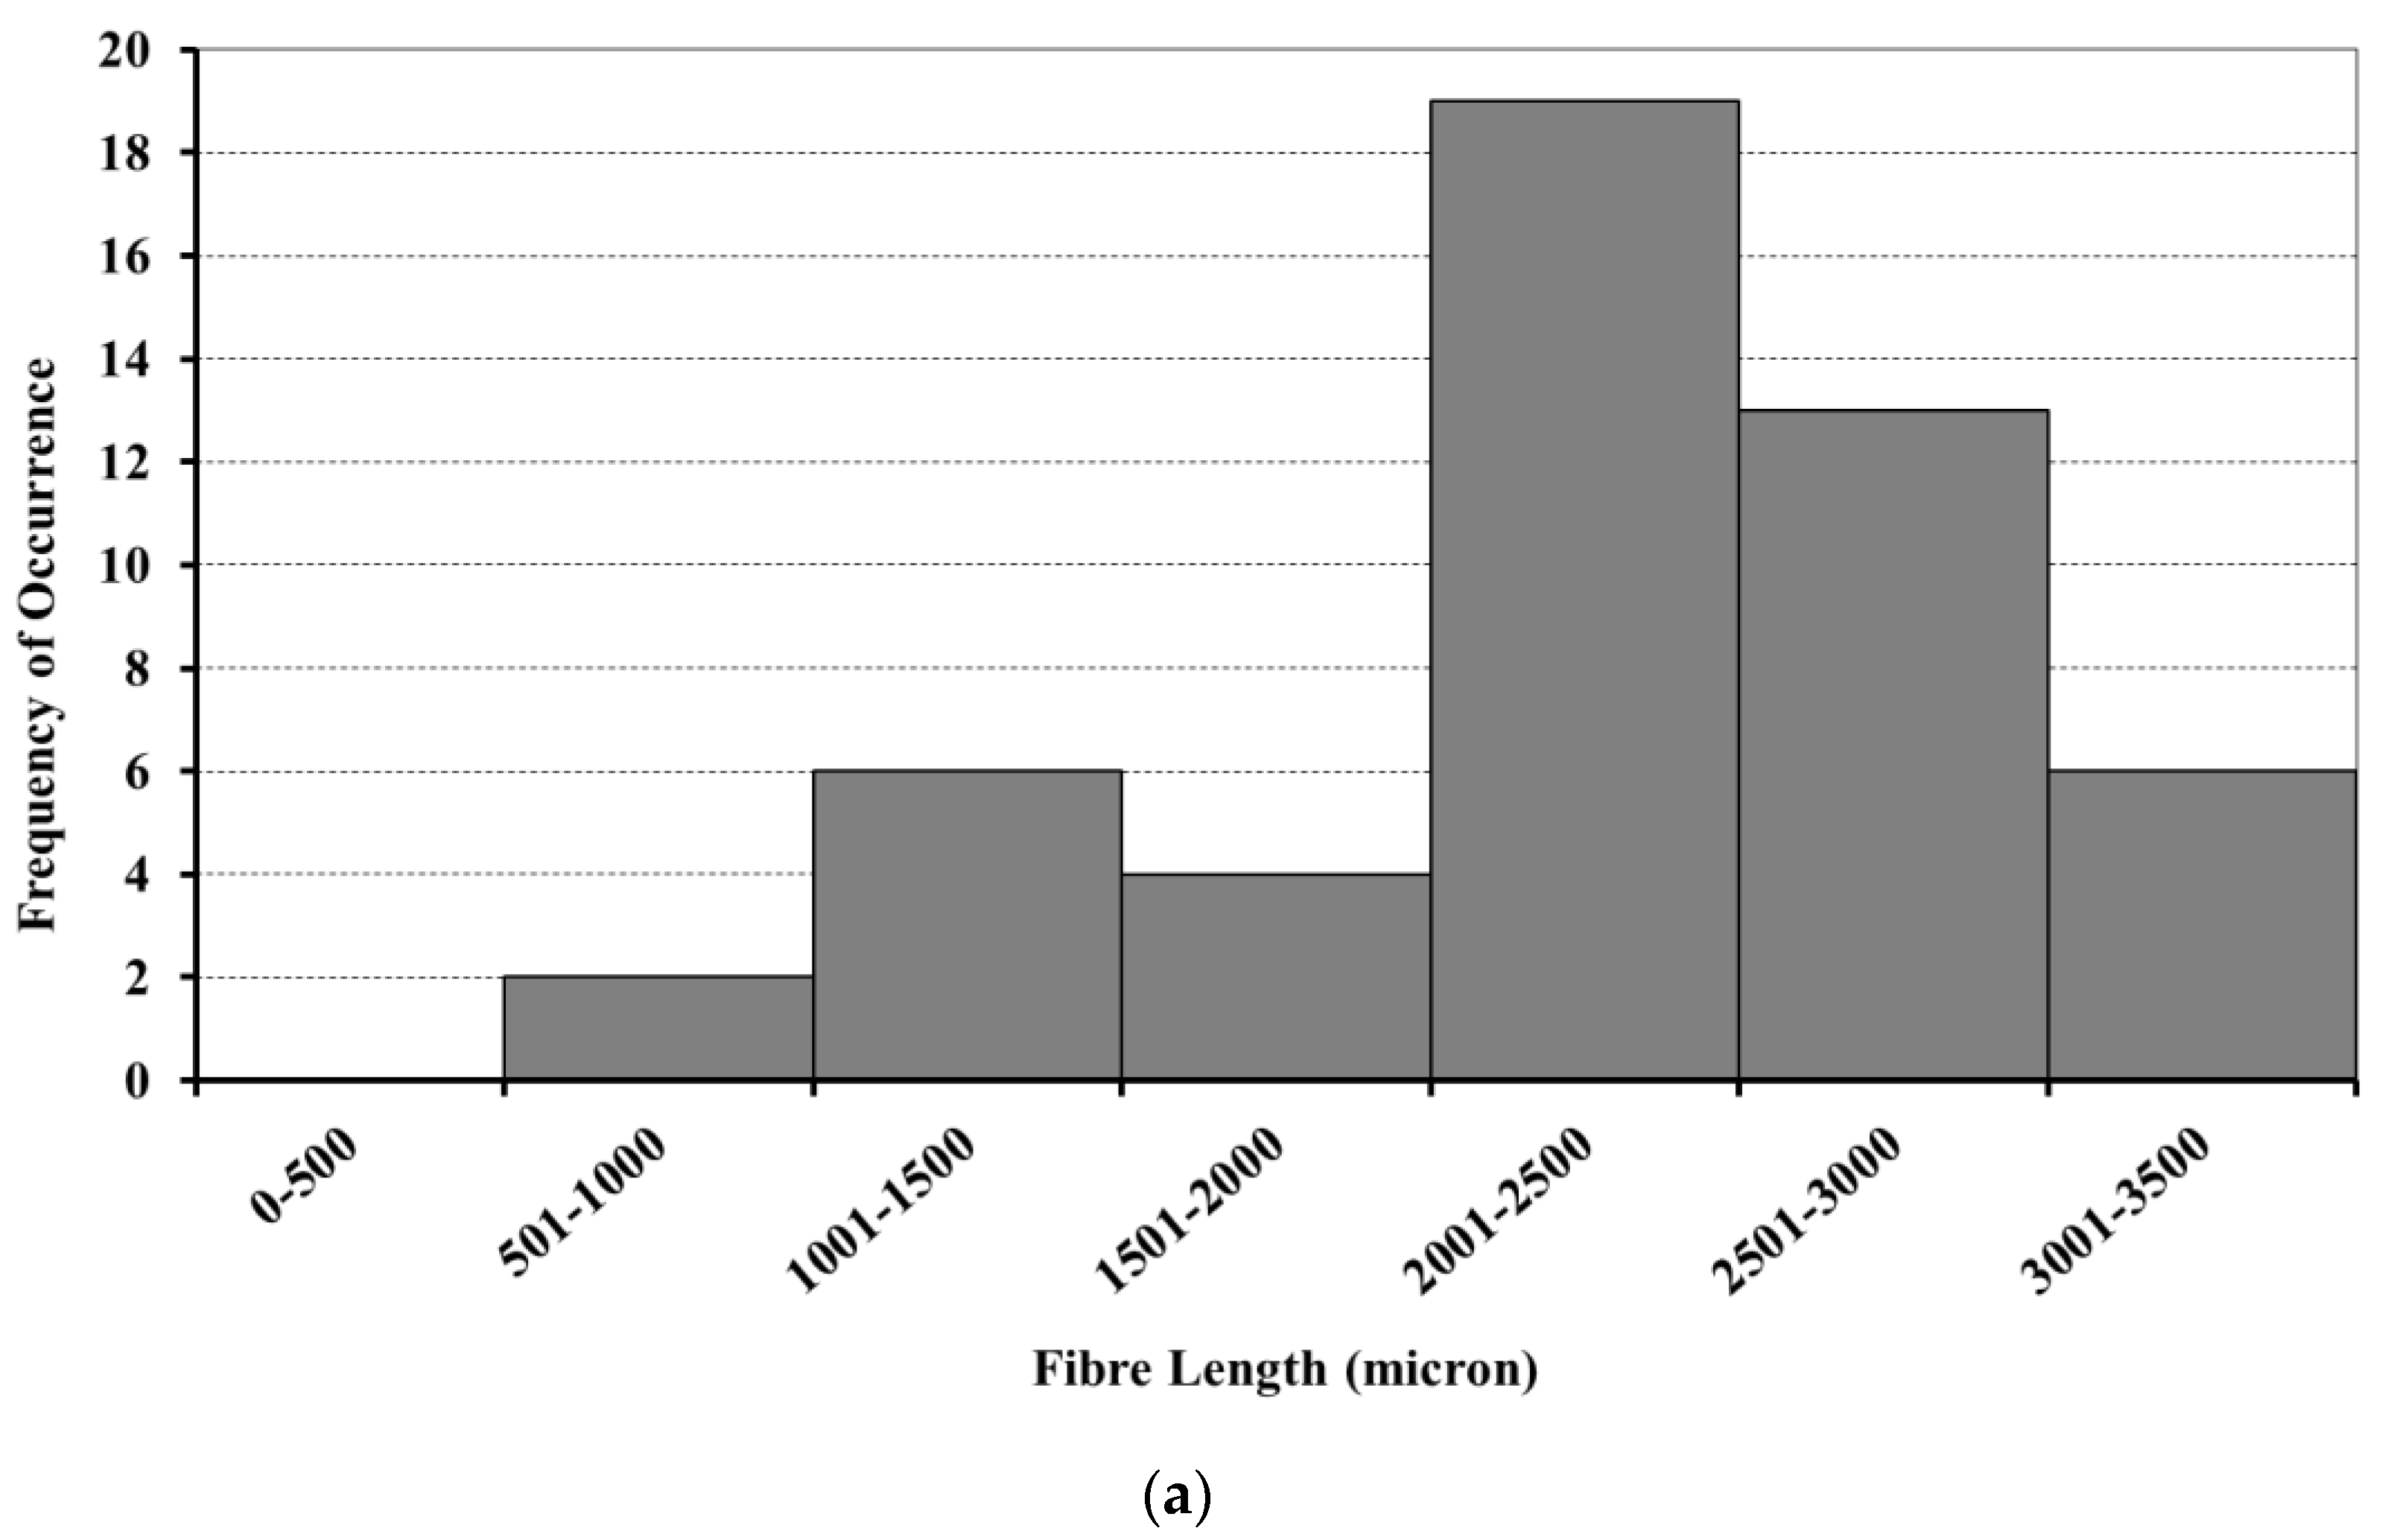
3.2. Aspect Ratio of Extracted Fibres

Histograms showing the length and diameter of the treated fibres are given in Figure 6 and Figure 7. The fibre length histogram for the KFTN fibres is skewed to lower values due to fibre breakage. The other histograms show essentially normal distributions.
The lengths and diameters of the KFTN and KFTHA fibres are given in Table 2, together with their calculated aspect ratios. The KFTHA fibres were an order of magnitude longer than the KFTN fibres with an average length of 2312 µm compared with 180 µm for the KFTHA fibres. The average diameter was, however, similar, being 13.0 µm compared with 11.7 µm, respectively. In comparison the untreated fibres had an average diameter of 97 µm. The diameters of the treated fibres are within the range considered to be indicative of elementary fibres [30] providing quantitative confirmation that the treatments had been successful.
As a result of their much longer length, the KFTHA fibres had a much higher aspect ratio of 179 compared with a value of 15 for the KFTN fibres. The low fibre length and resulting low aspect ratio for the KFTN fibres is attributed to the higher strength of the acid used and the longer treatment time [31].
Overall, the results indicate that the KFTHA treatment is superior to the KFTN treatment in terms of yield, treatment time and aspect ratio.
Other workers have also extracted elementaries from kenaf using both HNO3 and H2O2/CH3COOH treatments. Mazumder et al. [16] obtained elementaries somewhat longer than those obtained from the KFTN treatment used here using a more dilute HNO3 solution and a shorter treatment time. They also used an H2O2/CH3COOH treatment and obtained fibres of similar length to those obtained here for the KFTHA treatment, as also obtained by Calamari et al. [17]. The results from these workers are compared with those from the present study in Table 3.

3.3. Defect Density of Elementary Fibres

The treated fibres exhibited defects such as kinks, micro-compressions, pits, nodes, dislocations, and initial breaks. Representative SEM images of the fibre defects are shown in Figure 8. The defect density was significantly higher (t-test 95% confidence interval) for the KFTN fibres than for the KFTHA fibres, with the average values being 20.8 (standard deviation 8.8) and 13.6 (standard deviation 3.8) defects/mm, respectively.
The higher defect density of the KFTN fibres than the KFTHA fibres is again attributed to the strength of the acids used [31]. The HNO3 treatment caused breakage of the fibres, as indicated by their square ends and shorter length. This is considered to be due to the fibres being attacked by the acid at defects such as dislocations and kinks [32,33].

3.4. FTIR Spectra

FTIR spectra of the chopped KF, KFTN and KFTHA fibres are shown in Figure 9. The absorption peaks for the chopped KF fibres were the same as those observed by Ozturk et al. [34] for kenaf stem.
The spectra from the chopped KF, KFTN and KFTHA fibres all showed absorption peaks at 3329 cm−1 (O-H stretching [35]), 2900 cm−1 (C-H stretching [35], 1635 cm−1 (O-H bending [35]), 1420 cm−1 (-CH2 and OCH in-plane bending [36]), 1360 cm−1 (C-H bending [36]), 1313 cm−1 (-CH2 wagging [36]), 1170–1082 cm−1 (pyranose ring skeletal C-O-C [36]), 1102 cm−1 (C-OH group [36]) and 893 cm−1 (COC, CCO and CCH deformation and stretching [36]). These peaks are all characteristic of cellulose, although the peaks at 3329 cm−1, 2900 cm−1 and 1102 cm−1 are also seen in hemicellulose and lignin. The spectra also showed a peak at 1635 cm−1 which is attributed to the presence of moisture.
There were however significant differences between the spectra obtained for the treated and untreated fibres. The untreated fibres showed a peak at 1500 cm−1 which is attributed to the C=C aromatic in plane vibrations in lignin [37]. This peak was absent in the treated fibres, indicating that the fibre treatments had removed the lignin.
The untreated fibres also showed a peak at 1716 cm−1, which is attributed to C=O stretching of ketone and carbonyl groups in hemicellulose [35], pectin, and waxes [36,38]. This peak was again absent for the KFTN fibres but a peak at the same wavenumber was present for the KFTHA fibres. However, for these fibres, the peak is attributed to C=O stretching corresponding to carboxylic groups [39] from oxidized cellulose and/or acetyl groups [40] due to the KFTHA treatment. The results are therefore considered to indicate that pectin and waxes have been removed by the fibre treatments.
In addition, the untreated fibres showed a peak at 1593 cm−1. This is attributed to C=C aromatic in-plane vibrations combined with C=O stretching, which is again indicative of lignin [37,41]. This peak was absent for the KFTHA treatment although a peak at the same wavenumber was present for KFTN. This peak is, however, considered to be due to -NO2 asymmetrical stretching vibrations [42] resulting from the reaction between cellulose and HNO3 [43].
A further peak was evident for the untreated fibres at 1238 cm−1 and this is attributed to C-O stretching of acetyl groups from lignin [8]. A peak was also present at the same wavenumber for the KFTHA treatment, but this is attributed to C-O stretching of acetates [44] resulting from reaction of cellulose with H2O2/CH3COOH. The assignment of this peak to species other than lignin is consistent with the absence of the 1500 cm−1 lignin peak in the treated fibres.
The KFTN fibres exhibited a peak at 1280 cm−1 which was not present for the other treatments. This peak is attributed to -NO2 symmetrical stretching [39,45] due to reaction between cellulose and HNO3 [43] and is not considered to be due to the presence of lignin.

3.5. Raman Spectra

Raman spectra of the chopped KF, KFTN and KFTHA fibres are given in Figure 10. The chopped KF, KFTN and KFTHA presented Raman shifts at 376 cm−1, 1094 cm−1, 1118 cm−1, 1340 cm−1, 1350 cm−1 and 1374 cm−1 corresponding to HCC and HCO bending and stretching vibrations in cellulose [46]. A Raman shift at 1600 cm−1 was present in the spectrum of the chopped KF fibres due to aromatic parts in lignin [46,47,48]. However, this Raman shift was not present for the KFTN and KFTHA fibres, further confirming the removal of lignin.

3.6. Crystallinity of Cellulose

The crystallinity indexes of cellulose in the chopped KF, KFTN and KFTHA fibres obtained using XRD and NMR are shown in Figure 11. The crystallinity index could also be determined from the FTIR spectra using the ratio of the 1420 cm−1 to 893 cm−1 peaks [36] and these values are also included in Figure 11. The results shown in Figure 11 were obtained from the average spectra from the individual fibres in each of the samples. It is noted that XRD gave substantially higher values than NMR, with the values from FTIR being intermediate between the two. However, apart from the FTIR result for the KFTHA fibres, the trends were the same for all three methods, with the crystallinity being higher in the treated fibres than in the untreated ones. This indicates that amorphous components were removed when the fibre bundles were broken down into elementaries, providing further evidence of the removal of hemicellulose and lignin [40] during the fibre treatments.
The results from all three methods also indicate that the crystallinity is higher in the KFTN fibres than in the KFTHA ones. This is considered to be due to the formation of ester groups created by the reaction of carboxylic groups with unreacted hydroxyl groups in the cellulose treated with HNO3 [49].

3.7. Degree of Oxidation

The degree of oxidation of cellulose, as determined using solid state 13C NMR, was similar for both treatments with values of 7.4% and 6.9% being obtained for the KFTN and KFTHA fibres, respectively. As noted earlier, the degree of oxidation indicates the weight percent of the carboxyl in the cellulose [28].

3.8. Thermogravimetric Analysis

Thermogravimetric analysis (TGA) and first derivative thermogravimetric analysis (DTG) curves of the chopped KF, KFTN and KFTHA are shown in Figure 12 and Figure 13, respectively. The extrapolated onset (Tonset) and endset (Tendset) decomposition temperatures of the chopped KF, KFTN and KFTHA and their maximum weight loss temperatures (Tmax) are given in Table 4.
The curves showed three important steps. The weight loss at the first step was caused by moisture in the fibres [50]. The second step resulted from thermal decomposition of hemicellulose which occurred over the temperature range 280 °C to 320 °C [7] and that of cellulose over the temperature range 320 °C to 380 °C [51]. The weight loss at the third step was due to oxidation of the degradation products from the second step [52]. The third step could also involve decomposition of thermally stable residues such as lignin [14,53].
The thermal stability of the KFTN fibres was noticeably poorer than that of the untreated fibres, especially at the second step where the onset of degradation occurred at 187 °C compared with 258 °C for the untreated fibres. The maximum weight loss also occurred at a lower temperature (309 °C) than in the untreated fibres (339 °C). These differences are considered to be due to the presence of cellulose nitrate in the fibres resulting from the HNO3 treatment, as indicated by the FTIR results. The decomposition at approximately 200 °C is consistent with the denitration of cellulose nitrate [54].
In contrast, the KFTHA fibres showed a substantially higher thermal stability at the second step than the untreated fibres, with the onset temperature being 310 °C compared with 258 °C for the untreated fibres. This is considered to be due to the removal of lignin [55].
This work has shown that high aspect ratio elementary fibres can be produced by the H2O2/CH3COOH treatment. This is of considerable practical importance since, as a result of their high aspect ratio, the elementary fibres have the potential for substantially improving the reinforcement efficiency in injection moulded and extruded thermoplastic natural fibre composites.
A novel finding of the work was that the thermal stability of the fibres was increased considerably by the H2O2/CH3COOH treatment. This is of particular significance for thermoplastic composites since it would permit higher processing temperatures. In turn, this would expand the range of thermoplastic polymers that could be used as the matrix for natural fibre thermoplastic composites.

4. Conclusions

Elementary fibres were successfully separated from kenaf fibre bundles using both 60% HNO3 (KFTN) and a mixture of 20% H2O2 and glacial CH3COOH (KFTHA). The KFTHA treatment gave a substantially higher fibre yield than the KFTN treatment while the fibre aspect ratio was much larger. The defect density in the KFTHA fibres was also considerably lower. FTIR and Raman spectra of the untreated and treated fibres confirmed that lignin had been removed from the fibres by the chemical treatments. Both treatments produced some oxidation of the cellulose in the fibres but increased cellulose crystallinity with the increase being somewhat greater for the KFTN fibres. The thermal stability of the fibres was increased substantially by the KFTHA treatment but decreased substantially by the KFTN treatment. The increase in thermal stability obtained from the KFTHA treatment would permit higher processing temperatures which would allow a wider range of thermoplastics to be used as the matrix material in natural fibre composites.

Author Contributions

Conceptualization, A.C.; methodology, A.C. and N.S.; formal analysis, N.S. and A.C.; investigation, N.S.; writing—original draft preparation, N.S.; writing—review and editing, A.C.; supervision, A.C. All authors have read and agreed to the published version of the manuscript.

Funding

This research received no external funding.

Institutional Review Board Statement

Not applicable.

Informed Consent Statement

Not applicable.

Data Availability Statement

Publicly available datasets were analyzed in this study. This data can be found here: http://unsworks.unsw.edu.au/fapi/datastream/unsworks:12280/SOURCE02?view=true, accessed on 5 May 2022.

Acknowledgments

This study was undertaken as part of the research project of the Cooperative Research Centre for Advanced Composite Structures Ltd. (CRC-ACS). The authors would also like to acknowledge the facilities, and the scientific and technical assistance of the Australian Microscopy & Microanalysis Research Facility (AMMRF) and the Mark Wainwright Analytical Centre (MWAC) at UNSW Sydney.

Conflicts of Interest

The authors declare no conflict of interest.

References

  1. Choudhury, M.R.; Debnath, K. Green composites: Introductory overview. In Green Composites. Materials Horizons: From Nature to Nanomaterials; Thomas, S., Balakrishnan, P., Eds.; Springer: Singapore, 2021; pp. 1–20. [Google Scholar]
  2. Sain, M.; Panthapulakkal, S. Green fibre thermoplastic composites. In Green Composites—Polymer Composites and the Environment; Baillie, C., Ed.; CRC Press: Cambridge, UK, 2004; pp. 181–206. [Google Scholar]
  3. Pickering, K.L.; Aruan Efendy, M.G.; Le, T.M. A review of recent developments in natural fibre composites and their mechanical performance. Compos. Part A 2016, 83, 98–112. [Google Scholar] [CrossRef] [Green Version]
  4. Lofti, A.; Li, H.; Dao, D.V.; Prusty, G. Natural fiber-reinforced composites: A review on material, manufacturing, and machinability. J. Thermoplast. Compos. Mater. 2021, 34, 238–284. [Google Scholar]
  5. Aziz, S.H.; Ansell, M.P. The effect of alkalization and fibre alignment on the mechanical and thermal properties of kenaf and hemp bast fibre composites: Part 1—Polyester resin matrix. Compos. Sci. Technol. 2004, 64, 1219–1230. [Google Scholar] [CrossRef]
  6. Edeerozey, A.M.M.; Akhil, H.M.; Azhar, A.B.; Ariffin, M.I.Z. Chemical modification of kenaf fibers. Mater. Lett. 2007, 61, 2023–2025. [Google Scholar] [CrossRef]
  7. Han, Y.; Han, S.; Cho, D.; Kim, H. Kenaf/polypropylene biocomposites: Effects of electron beam irradiation and alkali treatment on kenaf natural fibers. Compos. Interfaces 2007, 14, 559–578. [Google Scholar] [CrossRef]
  8. Sgriccia, N.; Hawley, M.; Misra, M. Characterization of natural fiber surfaces and natural fiber composites. Compos. Part A Appl. Sci. Manuf. 2008, 39, 1632–1637. [Google Scholar] [CrossRef]
  9. Hill, C.A.S.; Khalil, H.P.S.A.; Hale, M.D. A study of the potential of acetylation to improve the properties of plant fibres. Ind. Crops Prod. 1998, 8, 53–63. [Google Scholar] [CrossRef]
  10. Bledzki, A.K.; Gassan, J. Composites reinforced with cellulose based fibres. Prog. Polym. Sci. 1999, 24, 221–274. [Google Scholar] [CrossRef]
  11. Xue, Y.; Du, Y.; Elder, S.; Wang, K.; Zhang, J. Temperature and loading rate effects on tensile properties of kenaf bast fiber bundles and composites. Compos. Part B Eng. 2009, 40, 189–196. [Google Scholar] [CrossRef]
  12. Rinne, K.T.; Boettger, T.; Loader, N.J.; Robertson, I.; Switsur, V.R.; Waterhouse, J.S. On the purification of alpha-cellulose from resinous wood for stable isotope (H, C and O) analysis. Chem. Geol. 2005, 222, 75–82. [Google Scholar] [CrossRef]
  13. Hughes, M. Defects in natural fibres: Their origin, characteristics and implications for natural fibre-reinforced composites. J. Mater. Sci. 2012, 47, 599–609. [Google Scholar] [CrossRef]
  14. Stuart, T.; Liu, Q.; Hughes, M.; McCall, R.D.; Sharma, H.S.S.; Norton, A. Structural biocomposites from flax—Part I: Effect of bio-technical fibre modification on composite properties. Compos. Part A Appl. Sci. Manuf. 2006, 37, 393–404. [Google Scholar] [CrossRef]
  15. Shin, H.K.; Jeun, J.P.; Kim, H.B.; Kang, P.H. Isolation of cellulose fibers from kenaf using electron beam. Radiat. Phys. Chem. 2012, 81, 936–940. [Google Scholar] [CrossRef]
  16. Mazumder, B.B.; Ohtani, Y.; Cheng, Z.; Sameshima, K. Combination treatment of kenaf bast fiber for high viscosity pulp. J. Wood Sci. 2000, 46, 364–370. [Google Scholar] [CrossRef]
  17. Calamari, T.A.; Tao, J.W.; Akin, D.E. Some important physical characteristics of kenaf fiber bundles and of the ultimate kenaf fibers. In Kenaf Properties Processing and Products; Sellers, T., Reichert, N.A., Eds.; Mississippi State University: Starkville, MS, USA, 1999; pp. 187–191. [Google Scholar]
  18. Zakaria, M.N. Effect of Hot Water Fibre Treatment on the Properties of Kenaf/Polyester Composites. Ph.D. Thesis, University of New South Wales, Sydney, NSW, Australia, 2014. [Google Scholar]
  19. Ogbonnaya, C.I.; Roy-Macauley, H.; Nwalozie, M.C.; Annerose, D.J.M. Physical and histochemical properties of kenaf (Hibiscus cannabinus L.) grown under water deficit on a sandy soil. Ind. Crops Prod. 1997, 7, 9–18. [Google Scholar] [CrossRef]
  20. Gominho, J.; Fernandez, J.; Pereira, H. Cynara cardunculus L.—A new fibre crop for pulp and paper production. Ind. Crops Prod. 2001, 13, 1–10. [Google Scholar] [CrossRef]
  21. Carlsen, S. Effects of Freeze Drying on Paper. 1999. Available online: https://cool.culturalheritage.org/iada/ta99_115.pdf (accessed on 23 November 2021).
  22. Spence, K.; Habibi, Y.; Dufresne, A. Nanocellulose-based composites. In Cellulose Fibers: Bio- and Nano-Polymer Composites; Kalia, S., Kaith, B.S., Kaur, I., Eds.; Springer: London, UK, 2011; pp. 179–213. [Google Scholar]
  23. Sayeba, S.; Marzouga, I.; Hassena, M.; Saklia, F.; Rodeslib, S. Study of water sorption properties for esparto grass ultimate fibre (ALFA fibre). J. Text. Inst. 2010, 101, 19–27. [Google Scholar] [CrossRef]
  24. Segal, L.; Creely, L.; Martin, A.; Conrad, C. An empirical method of estimating the degree of crystallinity of native cellulose using the X-ray diffractometer. Text. Res. J. 1959, 29, 786–794. [Google Scholar] [CrossRef]
  25. Wang, D.; Shang, S.; Song, Z.; Lee, M. Evaluation of microcrystalline cellulose prepared from kenaf fibers. J. Ind. Eng. Chem. 2010, 16, 152–156. [Google Scholar] [CrossRef]
  26. Park, S.; Baker, J.; Himmel, M.; Parilla, P.; Johnson, D. Cellulose crystallinity index: Measurement techniques and their impact on interpreting cellulase performance. Biotechnol. Biofuels 2010, 3, 1–10. [Google Scholar] [CrossRef] [Green Version]
  27. Lasseuguette, E. Grafting onto microfibrils of native cellulose. Cellulose 2008, 15, 571–580. [Google Scholar] [CrossRef]
  28. Ashton, W.H.; Moser, C.E. Oxidized Cellulose Product and Method for Preparing the Same. 1968. Available online: https://patents.google.com/patent/US3364200A/en (accessed on 23 November 2021).
  29. Bondeson, D.; Kvien, I.; Oksman, K. Strategies for Preparation of Cellulose Whiskers from Microcrystallinine Cellulose as Reinforcement in Nanocomposites. In Cellulose Nanocomposites: Processing, Characterization, and Properties; Oksman, K., Sain, M., Eds.; American Chemical Society: Washington, DC, USA, 2006; pp. 10–25. [Google Scholar]
  30. Van den Oever, M.; Bos, H.; Van Kemenade, M. Influence of the physical structure of flax fibres on the mechanical properties of flax fibre reinforced polypropylene composites. Appl. Compos. Mater. 2000, 7, 387–402. [Google Scholar] [CrossRef]
  31. Bailar, J.C.; Moeller, T.; Kleinberg, J.; Guss, C.O.; Castellion, M.E.; Metz, C. Chemistry; Harcourt Brace Jovanovich: New York, NY, USA, 1989. [Google Scholar]
  32. Hanninen, T.; Michud, A.; Hughes, M. Kink bands in bast fibres and their effects on mechanical properties. Plast. Rubber Compos. 2011, 40, 307–310. [Google Scholar] [CrossRef]
  33. Thygesen, L.G. Quantification of dislocations in hemp fibers using acid hydrolysis and fiber segment length distributions. J. Mater. Sci. 2008, 43, 1311–1317. [Google Scholar] [CrossRef]
  34. Ozturk, I.; Irmak, S.; Hesenov, A.; Erbatur, O. Hydrolysis of kenaf (Hibiscus cannabinus L.) stems by catalytical thermal treatment in subcritical water. Biomass Bioenergy 2010, 34, 1578–1585. [Google Scholar] [CrossRef]
  35. Moran, J.; Alvarez, V.; Cyras, V.; Vazquez, A. Extraction of cellulose and preparation of nanocellulose from sisal fibers. Cellulose 2008, 15, 149–159. [Google Scholar] [CrossRef]
  36. Dai, D.; Fan, M. Characteristic and Performance of Elementary Hemp Fibre. Mater. Sci. Appl. 2010, 1, 336–342. [Google Scholar] [CrossRef] [Green Version]
  37. Kubo, S.; Kadla, J.F. Hydrogen bonding in lignin: A Fourier transform infrared model compound study. Biomacromolecules 2005, 6, 2815–2821. [Google Scholar] [CrossRef]
  38. Li, Y.; Pickering, K.L. Hemp fibre reinforced composites using chelator and enzyme treatments. Compos. Sci. Technol. 2008, 68, 3293–3298. [Google Scholar] [CrossRef]
  39. Silverstein, R.M.; Webster, F.X.; Kiemle, D.J. Spectrometric Identification of Organic Compounds; John Wiley & Sons: Hoboken, NJ, USA, 2005. [Google Scholar]
  40. Luz, S.M.; Del Tio, J.; Rocha, G.J.M.; Goncalves, A.R.; Del’Arco, A.P., Jr. Cellulose and cellulignin from sugarcane bagasse reinforced polypropylene composites: Effect of acetylation on mechanical and thermal properties. Compos. Part A Appl. Sci. Manuf. 2008, 39, 1362–1369. [Google Scholar] [CrossRef]
  41. Garside, P.; Wyeth, P. Identification of cellulosic fibres by FTIR spectroscopy: Thread and single fibre analysis by attenuated total reflectance. Stud. Conserv. 2003, 48, 269–275. [Google Scholar] [CrossRef] [Green Version]
  42. Samal, R.K.; Ray, M.C. Effect of chemical modifications on FTIR spectra. II. Physicochemical behavior of pineapple leaf fiber (PALF). J. Appl. Polym. Sci. 1997, 64, 2119–2125. [Google Scholar] [CrossRef]
  43. Gert, E.; Morales, A.S.; Zubets, O.; Kaputskii, F. The features of nitric acid ‘mercerization’ of cellulose. Cellulose 2000, 7, 57–66. [Google Scholar] [CrossRef]
  44. Tserki, V.; Zafeiropoulos, N.E.; Simon, F.; Panayiotou, C. A study of the effect of acetylation and propionylation surface treatments on natural fibres. Compos. Part A Appl. Sci. Manuf. 2005, 36, 1110–1118. [Google Scholar] [CrossRef]
  45. Edge, M.; Allen, N.S.; Hayes, M.; Riley, P.N.K.; Horie, C.V.; Luc-Gardette, J. Mechanisms of deterioration in cellulose nitrate base archival cinematograph film. Eur. Polym. J. 1990, 26, 623–630. [Google Scholar] [CrossRef]
  46. Ooi, B.G.; Rambo, A.L.; Hurtado, M.A. Overcoming the Recalcitrance for the Conversion of Kenaf Pulp to Glucose via Microwave-Assisted Pre-Treatment Processes. Int. J. Mol. Sci. 2011, 12, 1451–1463. [Google Scholar] [CrossRef] [Green Version]
  47. Agarwal, U.P. Raman imaging to investigate ultrastructure and composition of plant cell walls: Distribution of lignin and cellulose in black spruce wood (Picea mariana). Planta 2006, 224, 1141–1153. [Google Scholar] [CrossRef]
  48. Atalla, R.; Agarwal, U. Recording Raman spectra from plant cell walls. J. Raman Spectrosc. 1986, 17, 229–231. [Google Scholar] [CrossRef]
  49. Abdel Moteleb, M.M.; El Akabawy, Y.K. Dielectric investigation of some oxyviscoses. Polymer 1999, 40, 895–903. [Google Scholar] [CrossRef]
  50. Pereira, A.L.S.; Nascimento., D.M.S.; Cordeiro, E.M.S.; Morais, J.P.S.; Sousa, M.D.S.M.; Rosa, M.D.F. Characterization of lignocellulosic materials extracted from the banana pseudostem. In XII International Macromolecular Colloquium and 7th International Symposium on Natural Polymers and Composites; Asociacao Brasileira de Polimeros: Gramado, Brazil, 2010; pp. 1077–1079. [Google Scholar]
  51. Keshk, S.M.A.S.; Haija, M.A. A new method for producing microcrystalline cellulose from Gluconacetobacter xylinus and kenaf. Carbohydr. Polym. 2011, 84, 1301–1305. [Google Scholar] [CrossRef]
  52. Ciannamea, E.M.; Stefani, P.M.; Ruseckaite, R.A. Medium-density particleboards from modified rice husks and soybean protein concentrate-based adhesives. Bioresour. Technol. 2010, 101, 818–825. [Google Scholar] [CrossRef] [PubMed]
  53. Sharma, H.S.S.; Kernaghan, K. Thermogravimetric analysis of flax fibres. Thermochim. Acta 1988, 132, 101–109. [Google Scholar] [CrossRef]
  54. Huang, M.R.; Li, X.G. Thermal degradation of cellulose and cellulose esters. J. Appl. Polym. Sci. 1998, 68, 293–304. [Google Scholar] [CrossRef]
  55. Zhao, X.; van der Heide, E.; Zhang, T.; Liu, D. Delignification of sugarcane bagasse with alkali and peracetic acid and characterization of the pulp. BioResources 2010, 5, 1565–1580. [Google Scholar]
Figure 1. Kenaf fibres as received.
Fibers 10 00063 g001
Figure 2. Flowchart showing HNO3 and H2O2/CH3COOH treatments.
Fibers 10 00063 g002
Figure 3. Extracted KFTN (left) and KFTHA (right) fibres.
Fibers 10 00063 g003
Figure 4. Optical microscope images of KFTN (left) and KFTHA (right) fibres.
Fibers 10 00063 g004
Figure 5. SEM images of (a) KFTN and (b) KFTHA fibres at ×150 and ×400 magnifications.
Fibers 10 00063 g005aFibers 10 00063 g005b
Figure 6. Histograms of (a) fibre length and (b) fibre diameter for KFTN fibres.
Fibers 10 00063 g006aFibers 10 00063 g006b
Figure 7. Histograms of (a) fibre length and (b) fibre diameter for KFTHA fibres.
Fibers 10 00063 g007aFibers 10 00063 g007b
Figure 8. SEM micrographs showing fibre defects in KFTN fibres (left–top: dislocation; bottom: kink) and KFTHA fibres (right–top: pits; bottom: kink) at ×2000 (top) and ×4700 (bottom) magnifications.
Fibers 10 00063 g008
Figure 9. FTIR spectra of (a) chopped KF, (b) KFTN and (c) KFTHA fibres.
Fibers 10 00063 g009
Figure 10. Raman spectra of (a) chopped KF, (b) KFTN, and (c) KFTHA fibres.
Fibers 10 00063 g010
Figure 11. Crystallinity indexes of cellulose in chopped KF, KFTN and KFTHA fibres obtained using XRD, NMR, and FTIR.
Fibers 10 00063 g011
Figure 12. TGA curves of chopped KF, KFTN, and KFTHA fibres.
Fibers 10 00063 g012
Figure 13. DTG curves of chopped KF, KFTN, and KFTHA fibres.
Fibers 10 00063 g013
Table 1. Chemical analysis (wt%) of kenaf fibres [18].
DescriptionTest MethodAnalysis (wt%)
HolocelluloseTAPPI T 249-7591.2
CelluloseTAPPI T 203 os-7460.9
HemicellulosesTAPPI T 203 cm-9930.3
PentosanTAPPI T 223 cm-0117.3
Alkali solubilityTAPPI T 212 om-0216.8
Lignin contentTAPPI T 222 om-0211.1
Moisture contentTAPPI T 264 om-8810.0
Hot water solubleTAPPI T 207 cm-991.19
Ethanol-tolueneTAPPI T 204 cm-970.73
Ash contentTAPPI T 211 om-020.65
Table 2. Length, diameter, and aspect ratio of KFTN and KFTHA fibres. Error shown is one standard deviation.
SampleMeasured Fibre Length (µm)Measured Fibre Diameter (µm)Aspect Ratio
Minimum LengthMaximum LengthAverage LengthMinimum DiameterMaximum DiameterAverage Diameter
KFTN53.5685.0179.5 ± 95.63.724.011.7 ± 3.115.3
KFTHA872.13462.42312.3 ± 627.36.921.913.0 ± 3.0178.5
Table 3. Comparison of fibre dimensions from present work with those from previous studies.
Chemical TreatmentFibre Dimensions
This WorkPrevious Studies
HNO3
-
average fibre length: 0.18 mm
-
average fibre width: 0.012 mm
-
aspect ratio: 15
Mazumder et al. [16]
-
average fibre length: 0.64 mm
H2O2/CH3COOH
-
average fibre length: 2.31 mm
-
average fibre width: 0.013 mm
-
aspect ratio: 179
Mazumder et al. [16]
-
average fibre length: 2.18 mm
Calamari et al. [17]
-
average fibre length: 2.45 mm
-
average fibre width: 0.012 mm
-
aspect ratio: 204
Table 4. Decomposition temperatures of chopped KF, KFTN, and KFTHA fibres.
SampleTemperatureChopped KFKFTNKFTHA
1st StepTonset (°C)232124
Tmax (°C)---
Tendset (°C)608758
2nd StepTonset (°C)258187310
Tmax (°C)339309330
Tendset (°C)353347343
3rd StepTonset (°C)439413422
Tmax (°C)462424432
Tendset (°C)481441440
Publisher’s Note: MDPI stays neutral with regard to jurisdictional claims in published maps and institutional affiliations.

