Article

Observation of Visible Upconversion Luminescence of Soft Glass Multimode Fibers

1
Department of Physics, University of Calabria, Via P. Bucci, 87069 Rende, Italy
2
CNR Nanotec, Via P. Bucci, 87069 Rende, Italy
3
Department of Information Engineering, Electronics and Telecommunications, Sapienza University of Rome, Via Eudossiana 18, 00184 Rome, Italy
4
XLIM, UMR CNRS 7252, University of Limoges, 123 Avenue A. Thomas, 87060 Limoges, France
5
Faculty of Physics, University of Warsaw, Pasteura 5, 02-093 Warsaw, Poland
6
Lukasiewicz Research Network—Institute of Microelectronics and Photonics, Al. Lotnikow 32/46, 02-668 Warsaw, Poland
7
CNR-INO, Istituto Nazionale di Ottica, Via Campi Flegrei 34, 80078 Pozzuoli, Italy
*
Author to whom correspondence should be addressed.
These authors contributed equally to this work.
Fibers 2024, 12(2), 15; https://doi.org/10.3390/fib12020015
Submission received: 30 November 2023 / Revised: 15 January 2024 / Accepted: 30 January 2024 / Published: 4 February 2024

Abstract

:
This research investigates the visible upconversion luminescence which is induced by multiphoton absorption of soft glass fiber defects. The study of this phenomenon has thus far been restricted to standard silica fibers. We observed the emission of green and cyan light as a consequence of fiber material ionization. We investigate both the commercial ZBLAN step index and in-house-made tellurite nanostructured graded-index fibers. For the latter, the analysis of the luminescence signal permits us to determine the core and cladding refractive index difference. Upconversion luminescence is a powerful tool for characterizing soft glass fibers and a promising platform for innovative photonic technologies and mid-IR applications.

1. Introduction

Standard optical fibers are made of silica, which has negligible absorption at telecom wavelengths. Generally speaking, most of the standard optical fiber applications (e.g., telecommunication-oriented and those based on nonlinear optical effects), are confined to the near-infrared (IR) spectral range [1,2]. Aside from that, owing to its strong absorption, silica is unfit for applications of optical fibers at mid-IR frequencies, such as molecular fingerprinting [3,4], sensing [5,6], and biomedicine [7,8]. For this spectral range, soft glass materials are preferred because of their negligible optical losses and high nonlinear refractive index ( n 2 ). Conventional soft glass materials for fiber optics are ZBLAN or indate and germanate glasses doped with heavy elements such as lead, bismuth, and rare earths [9,10,11].
Most of the commercially available silica fibers are doped with either fluorine or germanium, as this permits creating a difference between the refractive indices of core and cladding [12,13]. In particular, fluorine doping is responsible for a decrease in the refractive index of the host material. Thus, it is conventionally used as the cladding material. On the contrary, germanium-doped silica is often the fiber core material, since the inclusion of germanium atoms in the silica lattice produces an increase in its refractive index. The doping of silica preforms is generally achieved via chemical vapor deposition (CVD) [14], which can be used to obtain arbitrary shapes of the core refractive index, the most common of which are the so-called step index (SI) and graded index (GI) fibers, which correspond to the flat and parabolic profiles of the core’s refractive index, respectively [15]. The latter is particularly compelling, since it leads to an equal spacing of the propagation constants of the fiber modes. As a consequence, an input beam is subject to periodic spatial self-imaging (SSI) [16,17] (i.e., the spatial equivalent of the Talbot effect). SSI is an enabling factor for many applications. For instance, SSI is crucial for achieving the so-called spatial beam self-cleaning effect, whose observation has enabled the demonstration of a new generation of multimode fiber-based technologies.
In the case of soft glasses, CVD is unfit for manufacturing GI fibers. This is one of the main reasons why there is no such thing as GI soft glass fibers available in the market yet. In analogy with the manufacturing of hollow-core photonic crystal fibers [18,19], it has been proposed to recur to the stack-and-draw method to manufacture GI fibers [20]. When applied to soft glass fibers, the stack-and-draw method allows for engineering the optical properties of the fiber core at the nanoscale. Interestingly, a direct measure of the core’s refractive index profile of such nanostructured GI fibers based on X-ray microtomography was recently reported [21]. In addition, GI soft glass fibers have been used for the experimental demonstration of different nonlinear effects, such as quasi-periodic pulse breathing [22] and spatial beam self-cleaning [23], which exploit the parabolic shape of the core’s refractive index profile.
Both these phenomena belong to the so-called weakly nonlinear regime (i.e., a regime in which the power of the beam that propagates inside the fiber is several orders of magnitude lower than the damage threshold power). On the contrary, when the power of femtosecond near-IR beams is close to the material’s optical breakdown (i.e., in the strongly nonlinear regime), silica optical fibers are characterized by the emission of visible upconversion luminescence (UL). This results from the multiphoton absorption (MPA) of some silica defects like non-bridging oxygen hole centers and oxygen deficiency centers [24]. The emission of visible light is even more spectacular when the beam power is above the breakdown threshold, as multiphoton ionization (MPI) effects lead to the formation of bright plasma filaments (PFs) [25,26], which can be curved in a helical fashion by exploiting the cylindrical geometry of the fiber [27]. Interestingly, aside from fundamental studies, exploiting UL allows for practical outcomes. For example, analyzing the UL has permitted determining the cutoff frequency of SMF-28 [28], and the core and cladding refractive index difference of GI fibers [29]. Remarkably, although soft glass fibers have been targeted for broadband spectrum applications, such as those based on supercontinuum generation mechanisms [30], which require high beam powers, only a few groups have studied the ignition of PFs and the optical breakdown in soft glasses [31,32,33], whereas to our knowledge, studies dedicated to the UL of material defects driven by MPA and MPI have not yet been carried out.
In this work, we fill this gap by investigating visible UL which is induced by the MPI of soft glass fiber via MPA of its material defects. We investigated both commercial SI and in-house-made nanostructured GI fibers. We observed the emission of green and cyan light, depending on the fiber material. Analogous to the case of silica, analyzing the UL of GI soft glass fibers permits us to estimate their core and cladding refractive index difference. In this sense, our results pave an innovative way to characterize the optical properties of GI soft glass fibers. We anticipate that our results will be of value for different technologies based on soft glass fibers, such as broadband endoscopes and supercontinuum light sources.

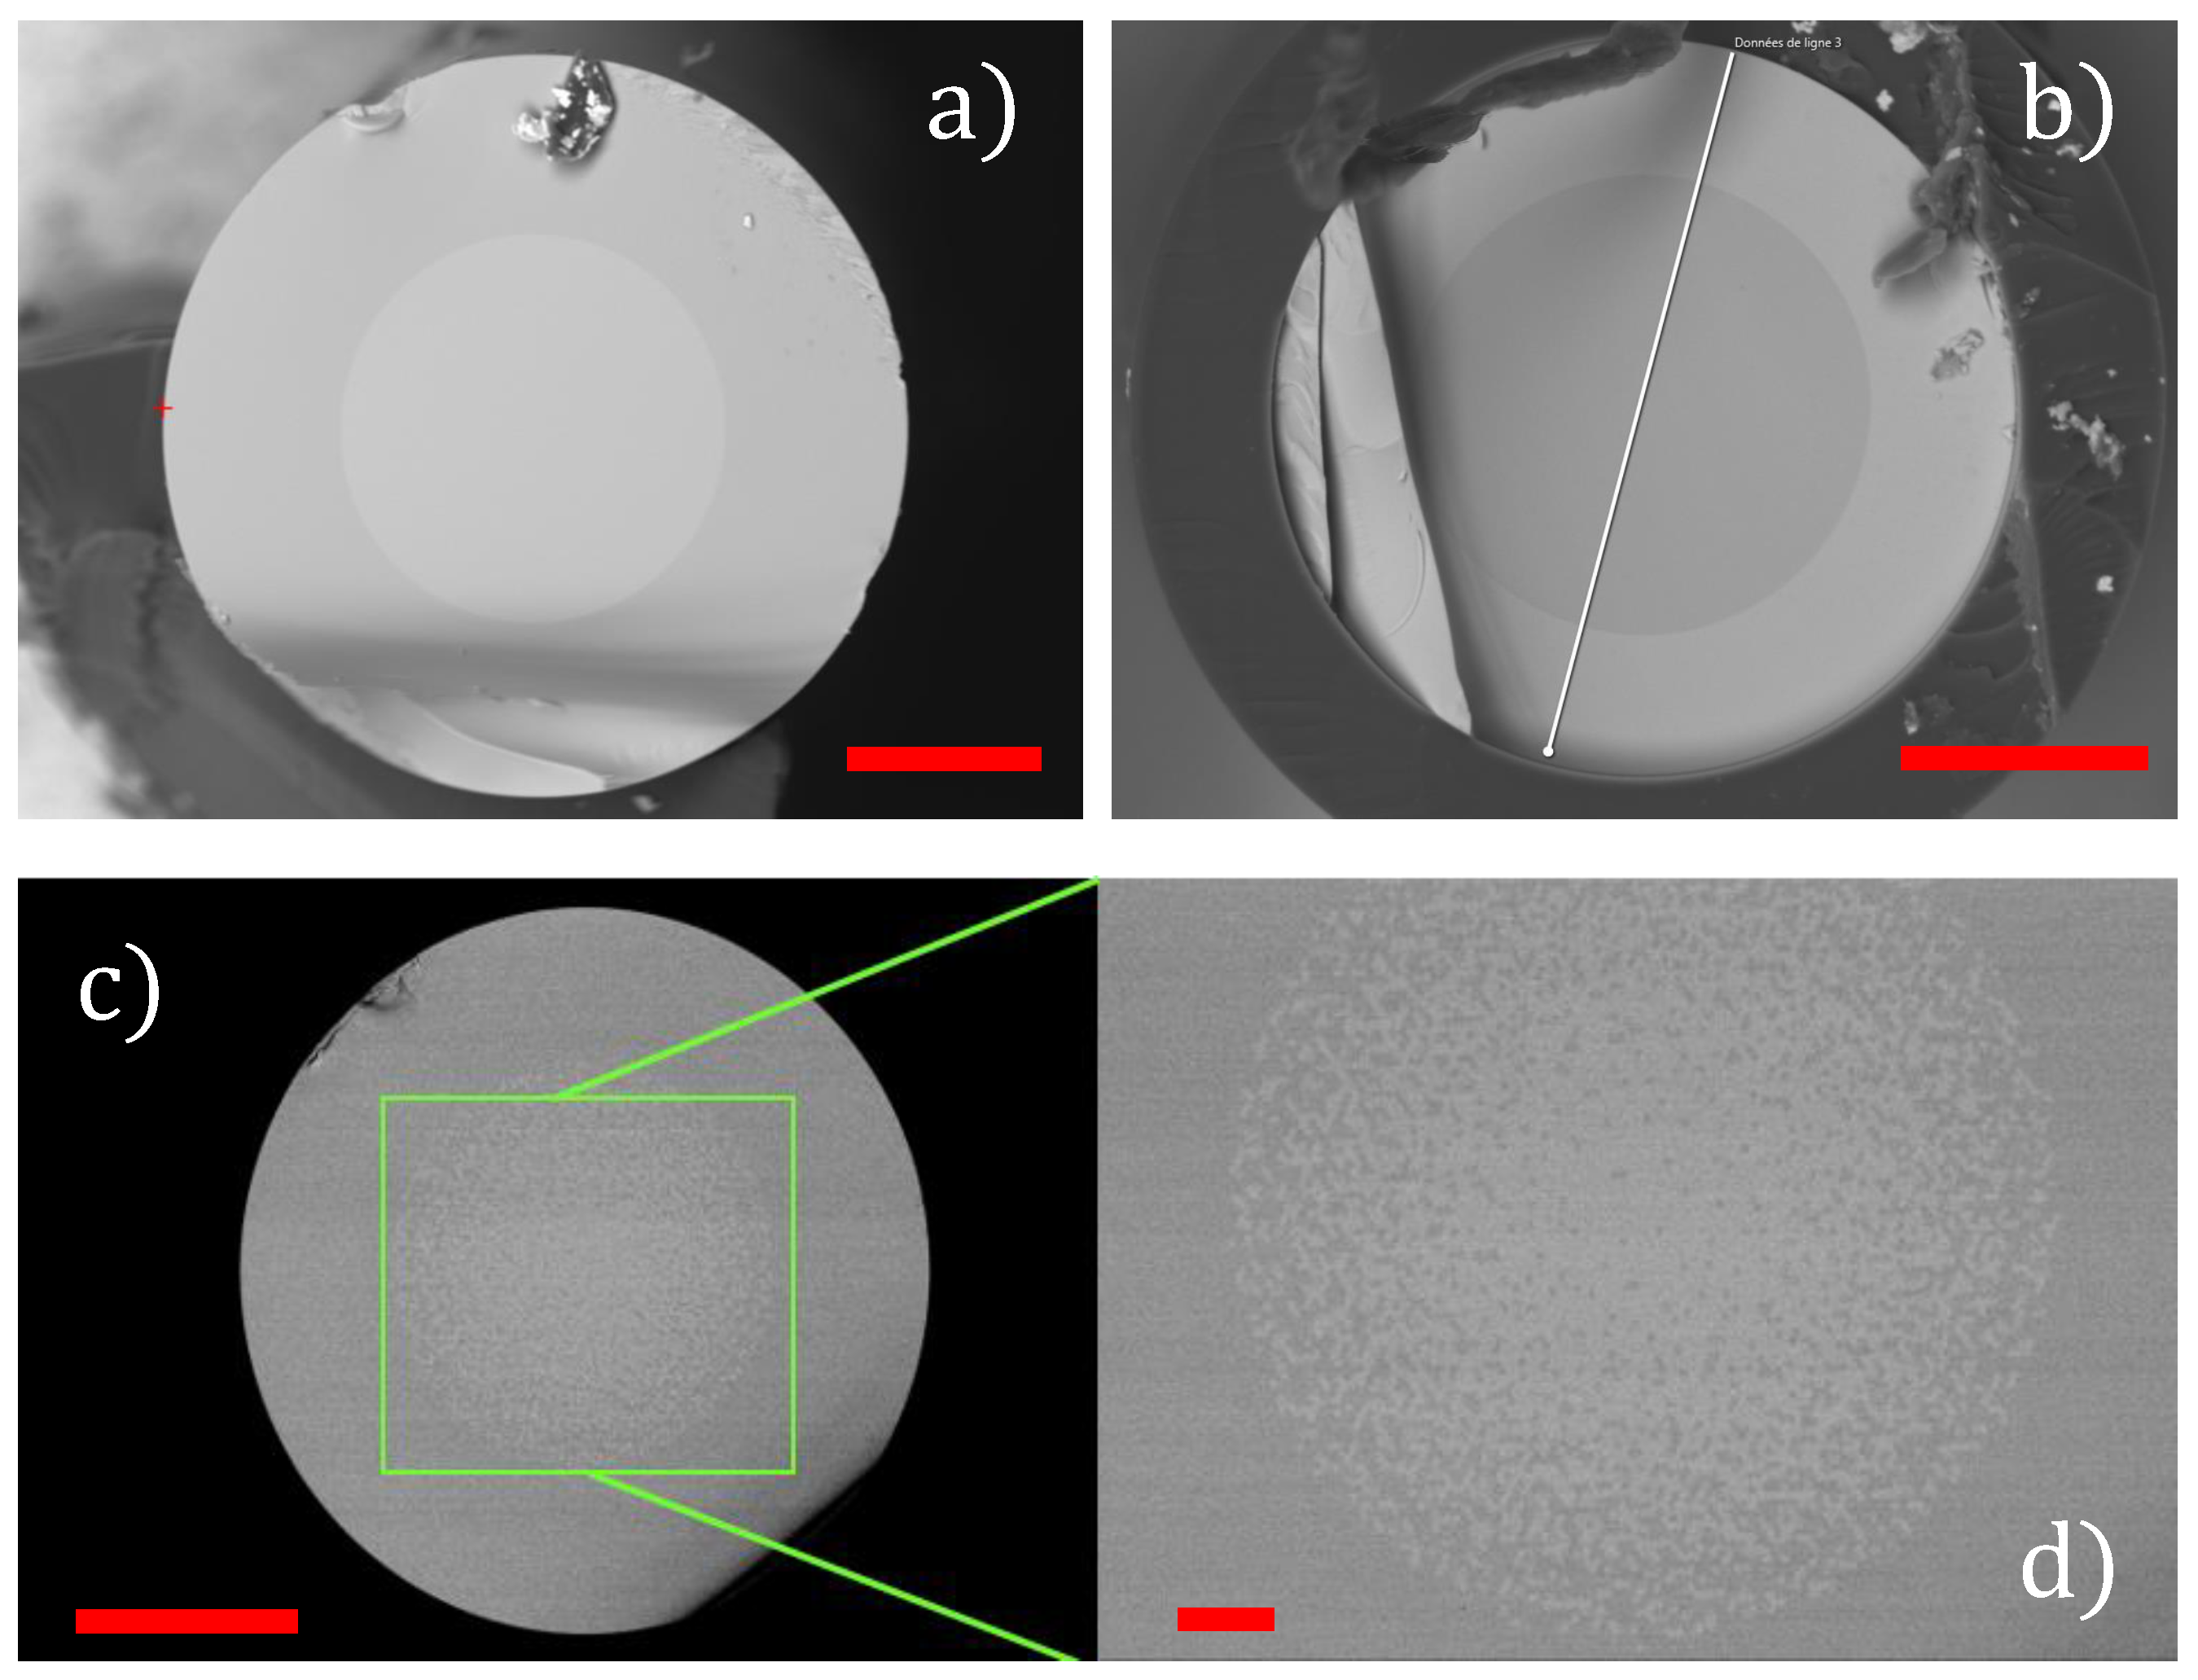
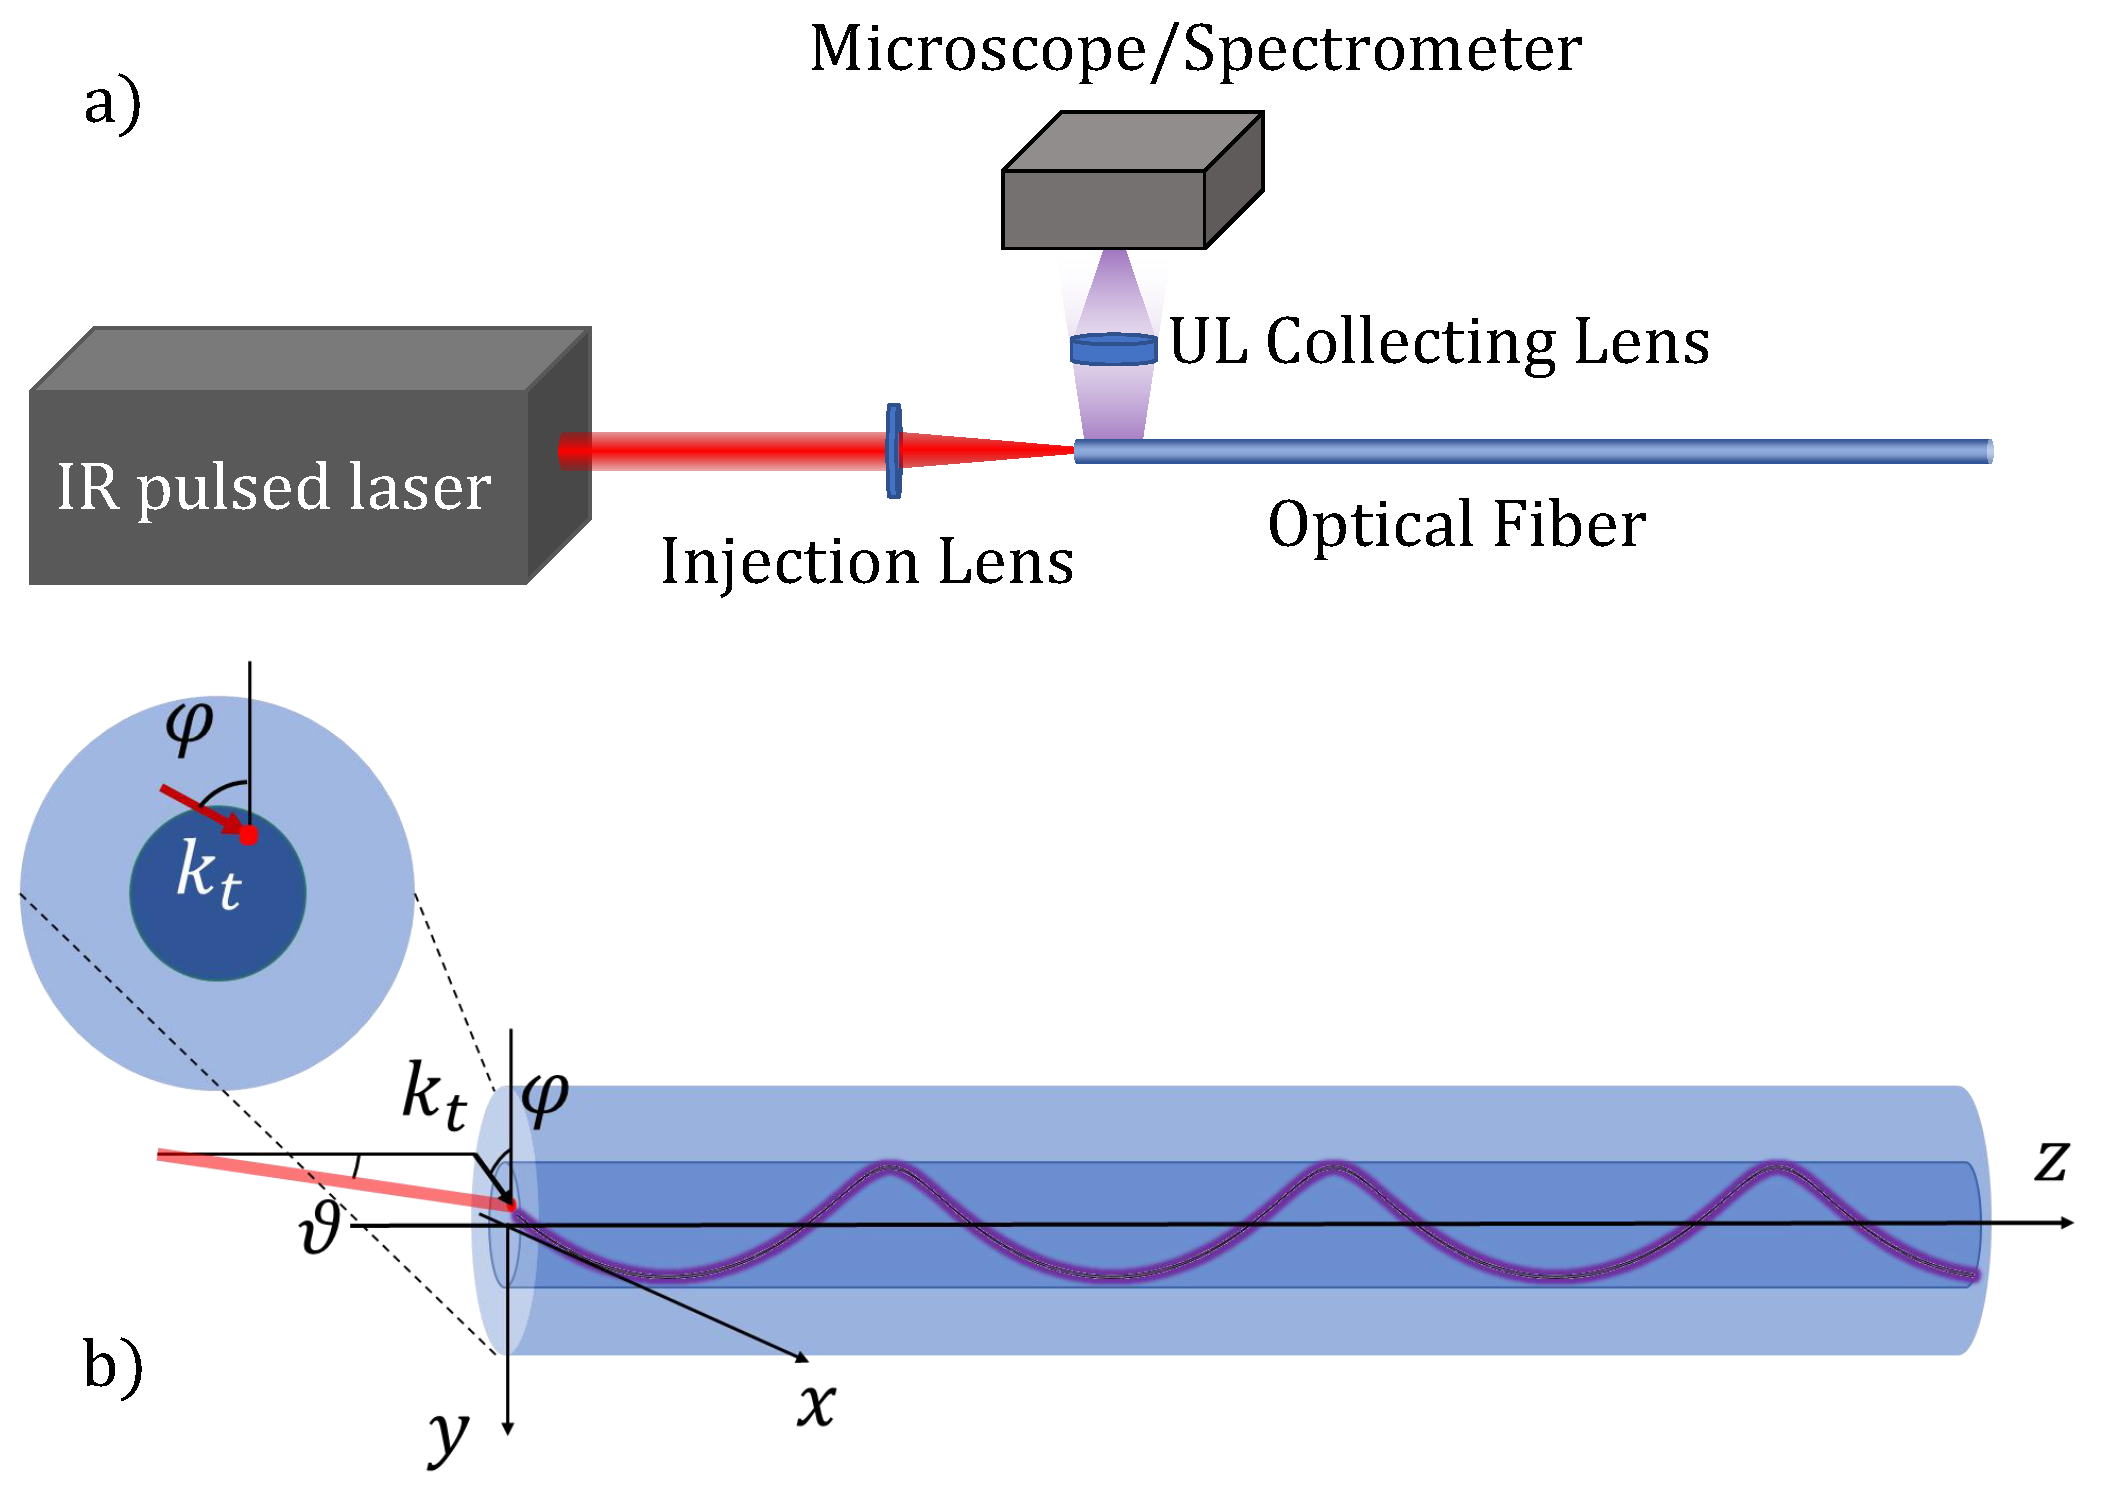
2. Materials and Methods
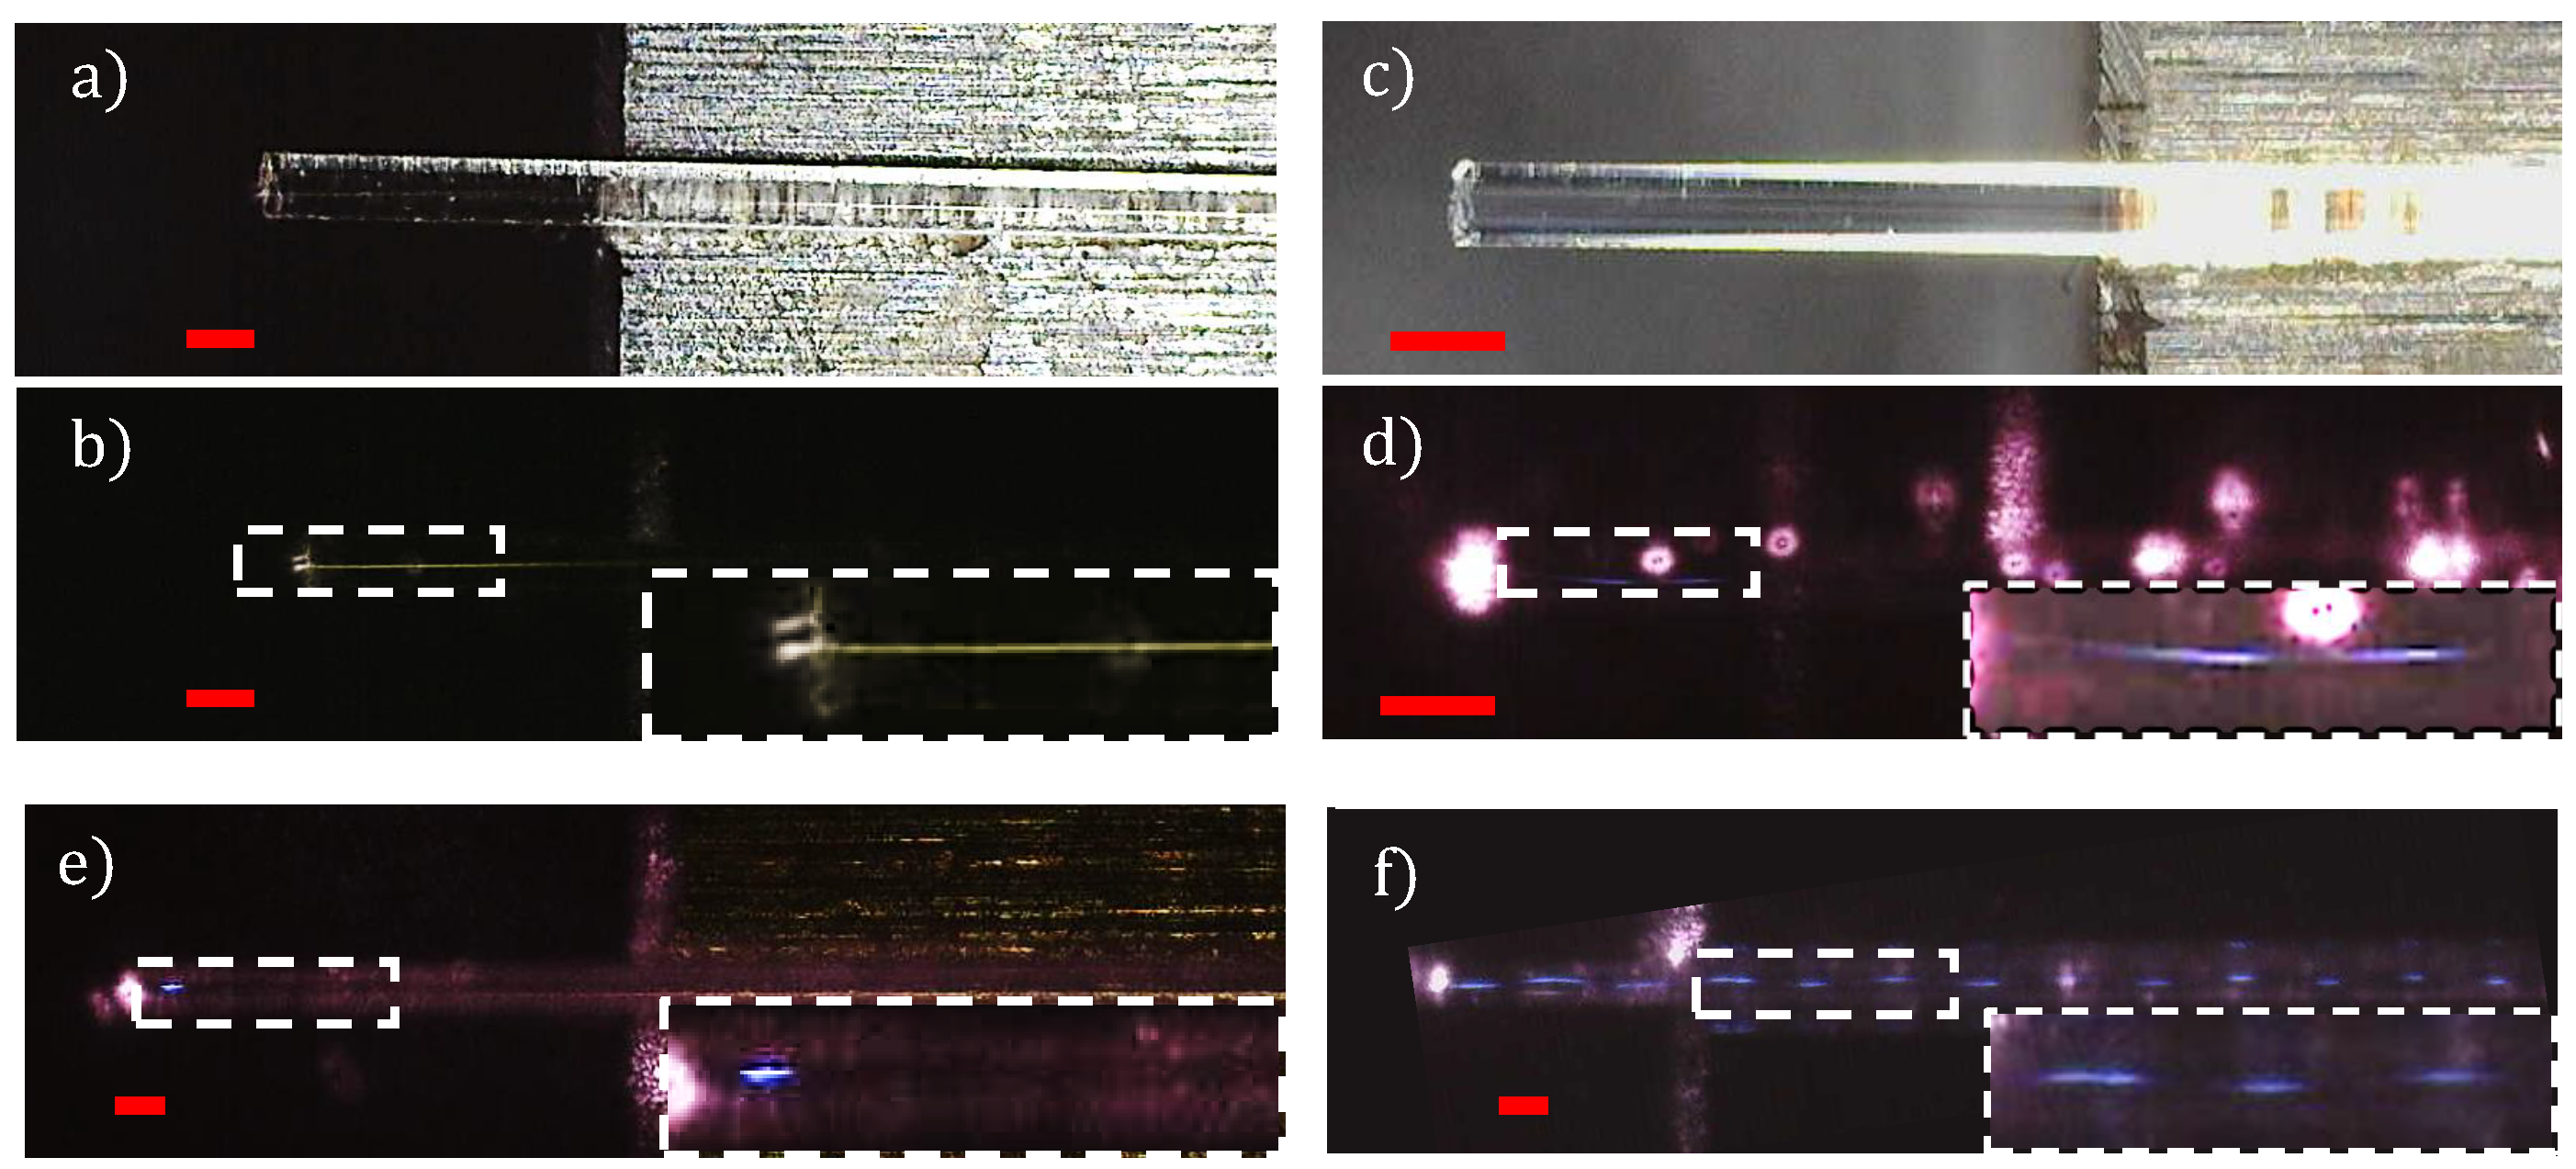
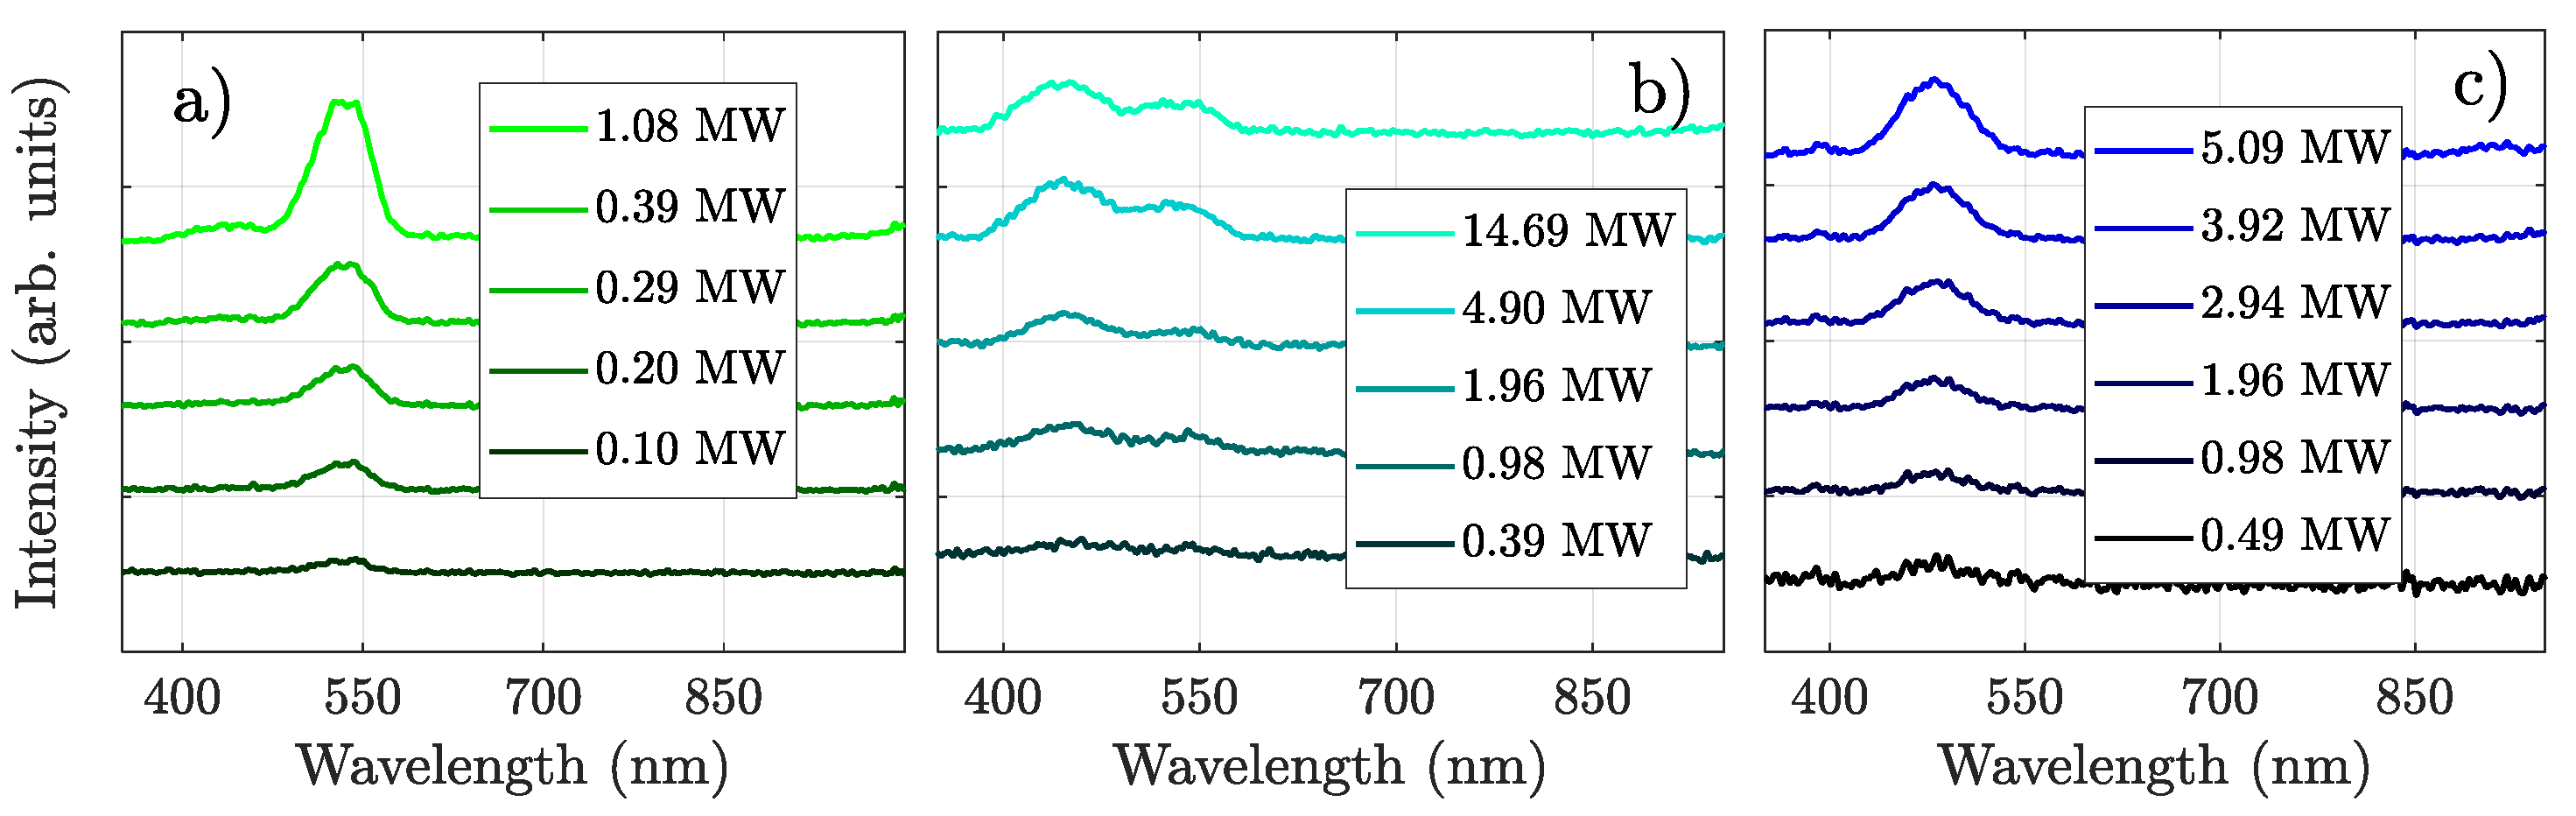
A list of tested fibers is reported in Table 1. We used two spans of commercial soft glass step index fiber, which were made by different manufacturers (samples A and B), as well as one span of in-house-made soft glass GI fiber (sample C). For the latter, the value of the numerical aperture (NA) and n 2 at a 1064 nm wavelength were measured to be 0.39 and 5.11 × 10 19   m 2 /W, respectively.
Scanning electron microscope (SEM) images of samples A–C are shown in Figure 1a–c. Specifically, images of samples A and B were obtained with a Zeiss crossbeam 550 SEM. We imaged the facet of sample C with a Thermo Scientific Phenom ProX SEM (Waltham, MA, USA) . In all cases, the energy of the electron beam was 15 keV. In order to increase the resolution and stability of the images, sample C was first coated by using a manual sputterer (Agar Scientific AGB7340 (Essex, UK)). The continuous conductive layer used for the coating consisted of 7 nm of gold. This process allowed for visualizing the core internal structure as shown in Figure 1d.
All soft glass fiber samples investigated in this work were also subjected to prior energy-dispersed X-ray spectroscopy (EDX) measurements using a backscattered electron detector at 20 kV. The atomic concentrations of the elements detected by EDX are listed in Table 2.
In our experiments, we used a femtosecond Yb-based laser (Lightconversion PHAROS-SP-HP) emitting pulses of 174 fs at 1030 nm with a 100 kHz repetition rate and peak power ( P p ) of up to several tens of megawatts. This allowed us to trigger MPI effects. Indeed, the power levels used in our experiments were well above the threshold for the optical breakdown of the fiber material. In a first approximation, the latter could be identified with the power for critical self-focusing P c s f = λ 2 / 2 π n 0 n 2 , where λ is the optical beam wavelength and n 0 is the core’s refractive index [36,37]. In the case of soft glasses, whose typical values of linear and nonlinear refractive indices at λ = 1   μ m are n 0 2 and n 2 10 19   m 2 /W, respectively, P c s f 0.1 MW (i.e., up to two orders of magnitude lower than the power that we used in our experiments).
The laser beam was injected into the soft glass fibers with a piano-convex lens (see the sketch of the experimental set-up in Figure 2a) so that the 1 / e 2 diameter at the fiber input facet was equal to 11 μ m. We used different coupling conditions depending on the type of fiber. Specifically, we injected the beam straight on the axis of the GI fiber (sample C), whereas in the case of the SI fibers (samples A and B), we excited UL with a tilted geometry (the beam direction and the fiber axis formed an angle θ 2 ), focusing the beam at the core/cladding interface. An illustration of the injection condition is reported in Figure 2b. Such peculiar injection geometry permitted us to have a better confinement of the light beam which was guided by the cladding/air interface, as discussed in [27]. Specifically, the beam was injected in such a way that the transverse component of the wavevector ( k t ) was tangent to the core/cladding interface (see Figure 2b). This led light to a helical luminescence trace as sketched in Figure 2b. UL from the soft glass fibers was collected by means of a collecting (positive) lens into either a miniature fiber optics spectrometer (Avaspec-2048L (Avantes B.V., Apeldoorn, The Netherlands)) or a digital microscope (Dino-Lite WF4915ZT (Dino-Lite Europe IDCP B.V., Almere, The Netherlands)), which has a 20–220X magnification and uses a CMOS sensor of 1.3 megapixels with a maximum frame rate of 30 fps. The UL collecting lens was placed over the fiber (see Figure 2a) so that only one part of the solid angle of UL emission was sent to the spectrometer or microscope.

3. Results

Microscope images of the UL of all samples are shown in Figure 3. Specifically, Figure 3a,b illustrates sample A with the room light switch on and off, respectively, and Figure 3c,d shows sample B with the same conditions. As can be seen, samples A and B showed green and cyan UL, respectively. Finally, in Figure 3e,f we show the UL of sample C at P p = 0.98 and 5.09 MW, respectively. Similar to sample B, the UL of sample C is cyan, albeit a little darker. One may notice that the PFs in Figure 3b,d are curved. This is due to the injection of the laser beam in the cladding, which generated PFs with a helical shape [27]. On the other hand, the UL in the GI fibers appeared as a discrete array of dashes (see Figure 3f). Such a peculiar UL shape, which was due to the SSI effect, was only visible if enough power was injected at the fiber input. Indeed, as shown in Figure 3e, for P p = 0.98 MW, we only observed a bright spot at the self-focusing point. As soon as the array was formed, its period did not change when the input power grew larger, in agreement with the theory of SSI in GI multimode fibers [29,38]. The array represents the replica of the self-focusing point because of the SSI effect.
The spectra of the UL shown in Figure 3 are reported in Figure 4. Specifically, the spectra associated with samples A–C are shown in Figure 4a–c, respectively. In each panel, we report the spectral intensity on a linear scale at different values of P p . Samples A and B had two UL peaks at 435 and 530 nm, respectively (that of sample A at 435 nm is clearly visible at P p = 1.08 MW in Figure 4a), whereas the UL spectrum of sample C had only one peak at 480 nm.

4. Discussion

Oftentimes, soft glass fibers are doped with rare earths in order to enhance their luminescence properties, mostly for light source applications [39,40,41,42]. Conversely, the UL of the soft glass fibers considered in this work did not arise from the doping of the material with fluorescent elements. Here, the visible luminescence was associated with the MPA of material defects, analogous with our previous studies involving silica fibers [24]. In the latter, determining the origin of the UL was immediate upon inspection of the spectra because SiO 2 is a well-known material whose defects have been largely studied [43]. In the case of soft glasses, studying the material properties is relatively more complex, owing to the large number of high-valence chemical elements involved (see Table 2). As such, a proper material analysis would require further investigations aside from the simple analysis of the UL spectra.
Still, we found some interesting analogies between the UL spectra measured in this work and some of the spectral features which have been reported in the literature for similar materials. Specifically, the occurrence of green luminescence peaked at 530 nm, as shown in sample A in Figure 3b and Figure 4a and as recently observed by Pietros et al. in barium fluorosilicate fibers [44,45]. This indicates that the green luminescence of sample A may be ascribed to BaF 2 -related defects, which is consistent with the measurement of a roughly 4% atomic concentration of barium in sample A (see Table 2). Moreover, a peak at 530 nm was also observed in the emission spectrum of sample B, which had comparable Ba and F concentrations to those of sample A (see Table 2). The comparison between the UL spectra and element concentration of samples A and B also allowed for shedding light on the origin of the cyan luminescence of sample B. The UL spectral peak at 435 nm may be associated with Hf-related defects, analogous with studies carried out on zirconium fluoride glasses [46]. The fact that the Hf concentration in sample A was as low as 0.1% is consistent with the low intensity of the 435 nm lobe in the spectrum of sample A. Finally, the UL peak at 480 nm for sample C may be associated with the presence of WO 3 -like localized defects. As a matter of fact, similar emission spectra have been observed in tungsten oxide quantum dots [47] and thin films [48].
Regardless of the origin of the UL from sample C, the analysis of its peculiar periodic structure (see Figure 3f) permitted obtaining useful information about the core and cladding refractive index difference ( Δ ). This can be calculated as follows [29]:
Δ = 2 π 2 r c 2 z S S I 2 ,
where r c is the core’s radius and z S S I is the SSI period. The latter is equal to twice the period of the UL in GRIN fibers because the UL intensity depends on the beam intensity, whereas the SSI condition involves both the amplitude and the phase of the electromagnetic field [27]. The UL period measured from Figure 3f was 467 μ m, which returned Δ = 0.0134 according to Equation (1). This was compatible with the index difference which was calculated from the NA (i.e., Δ = NA 2 /2 n 0 2 = 0.0170). The discrepancy between these two values of Δ may be ascribed to the relatively low resolution of our digital microscope.
Before concluding, let us provide an estimation of the degree of nonlinearity of the MPA processes that are responsible for the emission of the UL. As a first approximation, one may suppose that the intensity of the UL ( I U L ) is related to the laser peak power by a power law such that
I U L = α P p N ,
where N represents the average number of photons involved in the MPA processes that are responsible for the excitation of the UL, while α is just a proportionality constant. In Figure 5a–c, we report the values of I U L calculated from the integral of the curves in Figure 4a–c, respectively, over a given spectral range. Specifically, the data represented by empty squares correspond to the 467–600 nm integration interval, whereas empty circles are associated with the integral of the spectra between 400 and 467 nm. For samples A and C, we calculated a single integral since the spectrum of the latter showed a single peak (see Figure 4c), while the peak at 435 nm of the former was sufficiently higher than the spectrometer background noise at P p = 1.08 MW only (see Figure 4a). On the other hand, sample B showed two pronounced UL peaks (see Figure 4b). Correspondingly, two sets of data are reported in Figure 5b.
In Figure 5, we chose to plot the logarithm of I U L versus the logarithm of P p so that the fits through Equation (2) were straight lines. As can be seen in Figure 5a–c, all experimental data were fit well by Equation (2) (solid lines in the figure). Specifically, we found that the values of N ranged between 1.55 and 2.22, depending on the fiber material and interval of integration of the UL spectrum. This is the hallmark of the nonlinear nature of the processes that excite the material defects, which then emit UL. Interestingly, these values of N are much smaller than those reported with silica fibers at the same laser wavelength, where N = 5 photons were simultaneously absorbed in order to excite silica luminescent defects [24]. This indicates that the absorption bands of the luminescent defects of ZBLAN and tellurite glasses are red-shifted when compared with the case of silica.

5. Conclusions

In this work, we characterized the visible UL of multimode soft glass fibers. At variance with the study of the luminescence properties of rare earth-doped soft glass fibers, we investigated the UL which occurs as a consequence of the excitation of material defects via MPA mechanisms. We observed the appearance of helical PFs in the cladding of SI fibers and a periodic array of luminescent points in the core of nanostructured in-house-made GI fibers. The latter was exploited to determine the difference between the refractive index of the fiber core and cladding. We found that there was good agreement with the value of Δ , which one may directly estimate from the measurement of the numerical aperture of the fiber. We associated the luminescence spectral peaks with material defects. We showed that in soft glass fibers, a lower number of photons ( N 2 ) is involved in the MPA process that produces luminescence when compared with silica fibers ( N 5 ) at about a 1 μ m excitation wavelength. In addition, it is worth mentioning that the analysis of UL in single-mode soft glass fibers permits estimating their cutoff frequency, analogous with standard silica SMF-28 fibers [28]. Our results are of interest for the development of a variety of soft glass fiber-based technologies, such as broadband lasers and devices for biomedical imaging and laser spectroscopy.

Author Contributions

Investigation, M.F., F.M., V.C. and G.S.; data analysis, F.M. and R.F.; writing—original draft, M.F.; writing—review and editing, all authors; funding acquisition, V.C., R.B. and S.W. All authors have read and agreed to the published version of the manuscript.

Funding

We acknowledge financial support from the European Union under the NRRP of NextGenerationEU, with a partnership on “Telecommunications of the Future” (PE00000001-“RESTART”), Marie Sklodowska-Curie Actions (101064614, 101023717), Sapienza University (RG12117A84DA7437, SP122 18480C7D1E9, AR2221815ED243A0); Agence Nationale de la Recherche (ANR-18-CE080016-01, ANR-10-LABX-0074-01); Fundacja na rzecz Nauki Polskiej (TEAM NET POIR.04.04.00-00-1644/18); and Sapienza University Grant AddSapiExcellence (NOSTERDIS).

Data Availability Statement

Data underlying the results presented in this paper are not publicly available at this time but may be obtained from the authors upon reasonable request.

Conflicts of Interest

The authors declare no conflicts of interest.

References

  1. Miller, S. Optical Fiber Telecommunications; Elsevier: Amsterdam, The Netherlands, 2012. [Google Scholar]
  2. Agrawal, G.P. Nonlinear fiber optics. In Nonlinear Science at the Dawn of the 21st Century; Springer: Berlin/Heidelberg, Germany, 2000; pp. 195–211. [Google Scholar]
  3. Petersen, C.R.; Møller, U.; Kubat, I.; Zhou, B.; Dupont, S.; Ramsay, J.; Benson, T.; Sujecki, S.; Abdel-Moneim, N.; Tang, Z.; et al. Mid-infrared supercontinuum covering the 1.4–13.3 μm molecular fingerprint region using ultra-high NA chalcogenide step-index fibre. Nat. Photonics 2014, 8, 830–834. [Google Scholar] [CrossRef]
  4. Saini, T.S.; Sinha, R.K. Mid-infrared supercontinuum generation in soft-glass specialty optical fibers: A review. Prog. Quantum Electron. 2021, 78, 100342. [Google Scholar] [CrossRef]
  5. Werle, P.; Slemr, F.; Maurer, K.; Kormann, R.; Mücke, R.; Jänker, B. Near-and mid-infrared laser-optical sensors for gas analysis. Opt. Lasers Eng. 2002, 37, 101–114. [Google Scholar] [CrossRef]
  6. Gao, W.; Li, X.; Wang, P.; Chen, L.; Ni, C.; Chen, L.; Chen, X.; Zhou, Y.; Zhang, W.; Hu, J.; et al. Investigation on sensing characteristics of fiber Bragg gratings based on soft glass fibers. Optik 2018, 156, 13–21. [Google Scholar] [CrossRef]
  7. Shi, L.; Alfano, R.R. Deep Imaging in Tissue and Biomedical Materials: Using Linear and Nonlinear Optical Methods; CRC Press: Boca Raton, FL, USA, 2017. [Google Scholar]
  8. Barik, A.K.; Lukose, J.; Upadhya, R.; Pai, M.V.; Kartha, V.; Chidangil, S. In vivo spectroscopy: Optical fiber probes for clinical applications. Expert Rev. Med. Devices 2022, 19, 657–675. [Google Scholar] [CrossRef]
  9. Wang, W.; Zhou, B.; Xu, S.; Yang, Z.; Zhang, Q. Recent advances in soft optical glass fiber and fiber lasers. Prog. Mater. Sci. 2019, 101, 90–171. [Google Scholar] [CrossRef]
  10. Xia, C.; Kumar, M.; Kulkarni, O.P.; Islam, M.N.; Terry Jr, F.L.; Freeman, M.J.; Poulain, M.; Mazé, G. Mid-infrared supercontinuum generation to 4.5 μm in ZBLAN fluoride fibers by nanosecond diode pumping. Opt. Lett. 2006, 31, 2553–2555. [Google Scholar] [CrossRef]
  11. Désévédavy, F.; Strutynski, C.; Lemière, A.; Mathey, P.; Gadret, G.; Jules, J.C.; Kibler, B.; Smektala, F. Review of tellurite glasses purification issues for mid-IR optical fiber applications. J. Am. Ceram. Soc. 2020, 103, 4017–4034. [Google Scholar] [CrossRef]
  12. Chen, C.; Jaluria, Y. Effects of doping on the optical fiber drawing process. Int. J. Heat Mass Transf. 2009, 52, 4812–4822. [Google Scholar] [CrossRef]
  13. Fokine, M. Thermal stability of chemical composition gratings in fluorine–germanium-doped silica fibers. Opt. Lett. 2002, 27, 1016–1018. [Google Scholar] [CrossRef] [PubMed]
  14. Nagel, S.R.; MacChesney, J.B.; Walker, K.L. An overview of the modified chemical vapor deposition (MCVD) process and performance. IEEE Trans. Microw. Theory Tech. 1982, 30, 305–322. [Google Scholar] [CrossRef]
  15. Méndez, A.; Morse, T.F. Specialty Optical Fibers Handbook; Elsevier: Amsterdam, The Netherlands, 2011. [Google Scholar]
  16. Agrawal, G.P. Invite paper: Self-imaging in multimode graded-index fibers and its impact on the nonlinear phenomena. Opt. Fiber Technol. 2019, 50, 309–316. [Google Scholar] [CrossRef]
  17. Poletti, F.; Horak, P. Description of ultrashort pulse propagation in multimode optical fibers. JOSA B 2008, 25, 1645–1654. [Google Scholar] [CrossRef]
  18. Couny, F.; Benabid, F.; Light, P. Large-pitch kagome-structured hollow-core photonic crystal fiber. Opt. Lett. 2006, 31, 3574–3576. [Google Scholar] [CrossRef]
  19. Strutynski, C.; Meza, R.A.; Teulé-Gay, L.; El-Dib, G.; Poulon-Quintin, A.; Salvetat, J.p.; Vellutini, L.; Dussauze, M.; Cardinal, T.; Danto, S. Stack-and-Draw Applied to the Engineering of Multi-Material Fibers with Non-Cylindrical Profiles. Adv. Funct. Mater. 2021, 31, 2011063. [Google Scholar] [CrossRef]
  20. Buczyński, R.; Klimczak, M.; Stefaniuk, T.; Kasztelanic, R.; Siwicki, B.; Stępniewski, G.; Cimek, J.; Pysz, D.; Stępień, R. Optical fibers with gradient index nanostructured core. Opt. Express 2015, 23, 25588–25596. [Google Scholar] [CrossRef]
  21. Crocco, M.C.; Mangini, F.; Filosa, R.; Solano, A.; Agostino, R.G.; Barberi, R.C.; Couderc, V.; Klimczak, M.; Filipkowski, A.; Buczynski, R.; et al. Soft glass optical fiber characterization with X-ray computed microtomography. Opt. Mater. Express 2024, 14, 70–81. [Google Scholar] [CrossRef]
  22. Karpate, T.; Stępniewski, G.; Kardaś, T.; Pysz, D.; Kasztalanic, R.; Stepanenko, Y.; Buczyński, R.; Krupa, K.; Klimczak, M. Quasi-periodic spectro-temporal pulse breathing in a femtosecond-pumped tellurite graded-index multimode fiber. Opt. Express 2023, 31, 13269–13278. [Google Scholar] [CrossRef]
  23. Eslami, Z.; Salmela, L.; Filipkowski, A.; Pysz, D.; Klimczak, M.; Buczynski, R.; Dudley, J.M.; Genty, G. Two octave supercontinuum generation in a non-silica graded-index multimode fiber. Nat. Commun. 2022, 13, 1–10. [Google Scholar]
  24. Mangini, F.; Ferraro, M.; Zitelli, M.; Niang, A.; Tonello, A.; Couderc, V.; Wabnitz, S. Multiphoton-absorption-excited up-conversion luminescence in optical fibers. Phys. Rev. Appl. 2020, 14, 054063. [Google Scholar] [CrossRef]
  25. Cho, S.H.; Kumagai, H.; Yokota, I.; Midorikawa, K.; Obara, M. Observation of self-channeled plasma formation and bulk modification in optical fibers using high-intensity femtosecond laser. Jpn. J. Appl. Phys. 1998, 37, L737. [Google Scholar] [CrossRef]
  26. Cho, S.H.; Kumagai, H.; Midorikawa, K.; Obara, M. Fabrication of double cladding structure in optical multimode fibers using plasma channeling excited by a high-intensity femtosecond laser. Opt. Commun. 1999, 168, 287–295. [Google Scholar] [CrossRef]
  27. Mangini, F.; Ferraro, M.; Zitelli, M.; Niang, A.; Mansuryan, T.; Tonello, A.; Couderc, V.; De Luca, A.; Babin, S.; Frezza, F.; et al. Helical plasma filaments from the self-channeling of intense femtosecond laser pulses in optical fibers. Opt. Lett. 2022, 47, 1–4. [Google Scholar] [CrossRef]
  28. Mangini, F.; Ferraro, M.; Zitelli, M.; Niang, A.; Tonello, A.; Couderc, V.; Sidelnikov, O.; Frezza, F.; Wabnitz, S. Experimental observation of self-imaging in SMF-28 optical fibers. Opt. Express 2021, 29, 12625–12633. [Google Scholar] [CrossRef]
  29. Hansson, T.; Tonello, A.; Mansuryan, T.; Mangini, F.; Zitelli, M.; Ferraro, M.; Niang, A.; Crescenzi, R.; Wabnitz, S.; Couderc, V. Nonlinear beam self-imaging and self-focusing dynamics in a GRIN multimode optical fiber: Theory and experiments. Opt. Express 2020, 28, 24005–24021. [Google Scholar] [CrossRef]
  30. Kumar, V.R.K.; George, A.; Reeves, W.; Knight, J.; Russell, P.S.J.; Omenetto, F.; Taylor, A. Extruded soft glass photonic crystal fiber for ultrabroad supercontinuum generation. Opt. Express 2002, 10, 1520–1525. [Google Scholar] [CrossRef]
  31. Cho, S.H.; Kumagai, H.; Midorikawa, K. Dynamics of permanent structural transformations in ZBLAN induced by self-channeled plasma filament. Opt. Mater. 2004, 26, 57–63. [Google Scholar] [CrossRef]
  32. Bernier, M.; Faucher, D.; Vallée, R.; Saliminia, A.; Androz, G.; Sheng, Y.; Chin, S. Bragg gratings photoinduced in ZBLAN fibers by femtosecond pulses at 800 nm. Opt. Lett. 2007, 32, 454–456. [Google Scholar] [CrossRef]
  33. Courrol, L.C.; Messaddeq, Y.; Messaddeq, S.H.; Ribeiro, S.J.; Samad, R.E.; de Freitas, A.Z.; Vieira Jr, N.D. Production of defects in ZBLAN, ZBLAN: Tm3+ and ZBLAN: Cr3+ glasses by ultra-short pulses laser interaction. J. Phys. Chem. Solids 2008, 69, 55–59. [Google Scholar] [CrossRef]
  34. Available online: https://www.thorlabs.com/newgrouppage9.cfm?objectgroup_id=15877 (accessed on 1 February 2024).
  35. Available online: https://leverrefluore.com/scientific-world/fluoride-fibers/general-properties/ (accessed on 1 February 2024).
  36. Von der Linde, D.; Schüler, H. Breakdown threshold and plasma formation in femtosecond laser–solid interaction. JOSA B 1996, 13, 216–222. [Google Scholar] [CrossRef]
  37. Zhihua, H.; Jianjun, W.; Honghuan, L.; Dangpeng, X.; Rui, Z.; Mingzhong, L.; Xiaofeng, W. Self-focusing length in highly multimode ultra-large-mode-area fibers. Opt. Express 2012, 20, 14604–14613. [Google Scholar] [CrossRef]
  38. Karlsson, M.; Anderson, D.; Desaix, M. Dynamics of self-focusing and self-phase modulation in a parabolic index optical fiber. Opt. Lett. 1992, 17, 22–24. [Google Scholar] [CrossRef]
  39. He, Z.; Li, W.; Yu, A.; Wu, Y.; Cai, Z. Efficient UV-visible emission enabled by 532 nm CW excitation in an Ho 3+-doped ZBLAN fiber. Opt. Express 2022, 30, 10414–10427. [Google Scholar] [CrossRef]
  40. Ma, J.; Sun, Y.; Yu, F.; Xue, T.; Hu, L. Boosting visible luminescence of Tb3+-activated ZBLAN fluoride glasses by Dy3+ co-doping. J. Lumin. 2021, 238, 118247. [Google Scholar] [CrossRef]
  41. Remillieux, A.; Jacquier, B. IR-to-visible up-conversion mechanisms in Pr3+-doped ZBLAN fluoride glasses and fibers. J. Lumin. 1996, 68, 279–289. [Google Scholar] [CrossRef]
  42. Peysokhan, M.; Mobini, E.; Allahverdi, A.; Abaie, B.; Mafi, A. Characterization of Yb-doped ZBLAN fiber as a platform for radiation-balanced lasers. Photonics Res. 2020, 8, 202–210. [Google Scholar] [CrossRef]
  43. Girard, S.; Alessi, A.; Richard, N.; Martin-Samos, L.; De Michele, V.; Giacomazzi, L.; Agnello, S.; Di Francesca, D.; Morana, A.; Winkler, B.; et al. Overview of radiation induced point defects in silica-based optical fibers. Rev. Phys. 2019, 4, 100032. [Google Scholar] [CrossRef]
  44. Pietros, A.R.; Rebeszko, K.; Rosenbaum, J.R.; Stone, M.P.; Brasovs, A.; Kornev, K.G.; Hawkins, T.; Cavillon, M.; Ballato, J.; Dragic, P.D. Investigation of intense visible defect luminescence from visible and infrared pumped barium fluorosilicate glass-core fiber. Opt. Mater. X 2023, 19, 100231. [Google Scholar] [CrossRef]
  45. Pietros, A.R.; Rebeszko, K.; Rosenbaum, J.R.; Stone, M.P.; Hawkins, T.; Cavillon, M.; Ballato, J.; Dragic, P.D. Luminescence Thermometry via Intense Green Defect Emission from an Infrared-Pumped Fluorosilicate Optical Fiber. In Proceedings of the Optical Fiber Sensors, Alexandria, VA, USA, 29 August–2 September 2022; pp. W4–W49. [Google Scholar]
  46. Underwood, C.C.; McMillen, C.D.; Chen, H.; Anker, J.N.; Kolis, J.W. Hydrothermal chemistry, structures, and luminescence studies of alkali hafnium fluorides. Inorg. Chem. 2013, 52, 237–244. [Google Scholar] [CrossRef]
  47. Wang, S.; Kershaw, S.V.; Li, G.; Leung, M.K. The self-assembly synthesis of tungsten oxide quantum dots with enhanced optical properties. J. Mater. Chem. C 2015, 3, 3280–3285. [Google Scholar] [CrossRef]
  48. Feng, M.; Pan, A.; Zhang, H.; Li, Z.; Liu, F.; Liu, H.; Shi, D.; Zou, B.; Gao, H. Strong photoluminescence of nanostructured crystalline tungsten oxide thin films. Appl. Phys. Lett. 2005, 86. [Google Scholar] [CrossRef]
Figure 1. (ac) SEM images of samples A–C. (d) Zoomed-in image of (c), highlighting the nanostructure of the core of sample C. The red bars in (ac) are 50 μ m long, while that in (d) is 10 μ m long.
Fibers 12 00015 g001
Figure 2. Sketch of the experimental set-up. (a) Positioning of the fiber with respect to the laser and the microscope or spectrometer for UL imaging and characterization. (b) Geometry of the injection conditions to provide a helically shaped UL trace.
Fibers 12 00015 g002
Figure 3. Upconversion luminescence of soft glass fibers. (a,b) Sample A with a room light switch off and on, respectively. (c,d) Same as (a,b) for sample B. (e,f) UL of sample C at P p = 0.98 and 5.09 MW, respectively. In all panels, the red bar is 200 μ m long. The dashed line frame insets are zoomed-in images of the fibers’ tips, and the zoomed-in zones are indicated by smaller dashed line frames as well.
Fibers 12 00015 g003
Figure 4. Luminescence spectra of fibers for samples A–C (ac). The values reported in the legend are those of the laser peak power P p . The spectra show the intensity (on a linear scale) detected by the spectrometer in arbitrary units. In order to better appreciate the variation in the spectral peak amplitudes with power, the values of the intensity were not normalized. Moreover, in order to increase figure readability, we added a fixed vertical offset that avoids the overlap of the curves.
Fibers 12 00015 g004
Figure 5. (ac) Analysis of the luminescence spectra in Figure 4a–c, respectively. Circles and squares represent the integral of the UL spectra over 400–467 nm and 467–600 nm spectral ranges, respectively. Solid lines were fit via Equation (2).
Fibers 12 00015 g005
Table 1. Soft glass fibers used in this work.
Sample LabelTypePreform MethodManufacturerMaterialCore/Cladding Size ( μ m)Reference
ASICVDThorlabsZBLAN100/190[34]
BSICVDVerre FluoréZBLAN90/150[35]
CGIStack and drawUniversity of WarsawTellurite78/137[22]
Table 2. List of elements and their concentrations (atomic %) detected via EDX for all samples. The elements are sorted by their atomic numbers (Z).
ZElementSample ASample BSample C
6C16.124.712.3
8O--45.6
9F61.857.2-
11Na4.12.23.8
13Al0.80.617.7
30Zn--0.4
39Y-0.5-
40Zr11.35.9-
41Nb--0.9
52Te--13.8
56Ba4.84.1-
57La1.00.8-
72Hf0.13.9-
74W--5.5
Disclaimer/Publisher’s Note: The statements, opinions and data contained in all publications are solely those of the individual author(s) and contributor(s) and not of MDPI and/or the editor(s). MDPI and/or the editor(s) disclaim responsibility for any injury to people or property resulting from any ideas, methods, instructions or products referred to in the content.

