Article

Effect of Adding Phragmites-Australis Fiber on the Mechanical Properties and Volume Stability of Mortar

1
Faculty of Engineering, Beirut Arab University, Beirut 12-5020, Lebanon
2
Faculty of Engineering, University of Wolverhampton, Wolverhampton WV1 1LY, UK
3
Faculty of Engineering, Alexandria University, Alexandria 5423021, Egypt
*
Author to whom correspondence should be addressed.
Fibers 2024, 12(2), 14; https://doi.org/10.3390/fib12020014
Submission received: 9 December 2023 / Revised: 17 January 2024 / Accepted: 26 January 2024 / Published: 30 January 2024

Abstract

:
In this research, the investigation focuses on the influence of Phragmites-Australis (PA) fibers on the mechanical properties and volume stability of mortar. A total of four mixtures were employed with varying amounts of locally sourced PA fibers ranging from 0.5% to 2% (by volume). Testing includes flexural strength, compressive strength, chemical shrinkage, drying shrinkage, autogenous shrinkage, and expansion. The findings show that the use of PA fibers caused a reduction in compressive and flexural strength. However, beyond 3 days of curing, an increase in flexural strength ranging from 7 to 21% was observed at 1% PA fiber compared to the control sample. Furthermore, the addition of PA fibers up to 2% effectively mitigates the dimensional stability of mortar samples. A gradual decrease in chemical, autogenous, and drying shrinkage as well as expansion occurs in mortar samples when % of PA fibers increases. At 180 days, this reduction was 37, 19, 15 and 20% in chemical shrinkage, autogenous shrinkage, drying shrinkage, and expansion, respectively, for a mix containing 2% PA fiber. Additionally, a hyperbolic model is proposed to predict the variation of length change with time. Also, a strong relationship is observed between chemical shrinkage and other length change parameters. Consequently, the environmentally friendly utilization of PA fibers demonstrates its potential to significantly enhance mortar durability in construction applications.

Graphical Abstract

1. Introduction

In recent years, environmental issues have taken center stage as societies around the world struggle with the urgent need to address the pressing challenges affecting our planet [1,2]. From climate change and deforestation to pollution and resource depletion, these issues pose significant threats to the delicate balance of our ecosystems and the wellbeing of both human and non-human inhabitants. One of the significant contributors to environmental pollution is the production of cement, which releases substantial amounts of carbon dioxide (CO2) into the atmosphere [3,4]. Cement production accounts for a significant portion of global CO2 emissions, primarily due to the calcination of limestone and the energy-intensive processes involved. This increased CO2 output exacerbates the greenhouse effect, leading to further climate changing impacts and air pollution [5]. In this context, the concept of sustainability emerges as a guiding principle for mitigating and resolving environmental concerns. Sustainability seeks to harmonize human activities with the natural environment, ensuring that present needs are met without compromising the ability of future generations to meet their own needs [6,7]. By recognizing the intricate relationship between the environment and sustainability, responsible practices can be promoted that not only reduce CO2 emissions from cement production, but also safeguard the earth’s resources, protect biodiversity, and foster resilient ecosystems [8,9]. Embracing sustainability principles in policymaking, industry, and individual actions is crucial for charting a course towards a more balanced and regenerative coexistence with the environment, thus securing a healthier and more prosperous future for all.
Natural fibers have played a pivotal role in human civilization for thousands of years, finding diverse applications across various domains. From ancient times, they have been an indispensable resource in textiles and clothing, with cotton and silk providing comfortable and luxurious fabrics. Additionally, natural fibers like sisal, jute, and coir have been crucial in creating robust ropes and cordage for tasks ranging from maritime rigging to agricultural work [10,11,12,13]. In the past, builders utilized the strength of fibers like straw, bamboo, and hemp to reinforce structures, incorporating these materials into mud bricks and clay plaster. Moreover, ancient societies utilized natural fibers such as papyrus and rice paper for writing and documentation. These versatile fibers were also fashioned into containers, agricultural implements, bedding, and mats, showcasing the resourcefulness of our ancestors in maximizing the potential of their natural surroundings [14].
With concrete being one of the most widely used construction materials worldwide, the incorporation of natural fibers offers numerous benefits. Natural fibers can be used as reinforcements to improve the concrete’s tensile strength, ductility, and resistance to cracking [15,16]. Their renewable and biodegradable nature aligns with the growing demand for greener building practices, reducing the environmental impact of construction activities. The integration of these natural fibers in concrete signifies a paradigm shift in the construction industry, one that seeks to strike a harmonious balance between human development and ecological preservation [17].
Numerous investigations have been conducted on incorporating natural sustainable fibers, such as jute, hemp, pineapple, basalt, sisal, and banana, into concrete, leading to observed enhancements in mechanical properties and a reduction in crack propagation within the concrete [18,19,20,21]. For instance, adding up to 1% of natural fibers (sisal, jute and banana) by mass of cement has shown improvements in compressional properties, while limiting sudden brittle failures [20,21,22]. Another study focused on reinforcing concrete with jute fibers to boost compressive, bending, and impact strengths [23,24,25]. Results demonstrated that properties improved up to a certain threshold of jute fiber reinforcement. Additionally, Ede et al. [26] investigated the utilization of coconut husk fiber (CHF) to improve the compressive and flexural strength of concrete. Results showed that the addition of more than 0.5% CHF fiber dosage (0.5%, 0.75%, and 1.0% fiber by volume) reduced the workability, compressive and flexural strength. Okeola et al. [27] investigated the physical and mechanical properties of sisal fiber-reinforced concrete. The percentage of fiber additions were 0, 0.5, 1 and 2%. Results displayed that as the fiber content increased, the compressive strength decreased. However, in terms of tensile strength, the study observed an increase as the fiber content increased. This means that higher amounts of fibers in the concrete mixture corresponded to higher tensile strength values.
Phragmites Australis, commonly known as the common reed, is a perennial grass that typically thrives in wetland areas and can grow to heights of 15 ft. (4.6 m) or more. It features thick, upright stalks with wide, pointed leaves measuring 6–23.6 in. (15–60 cm) in length and 0.4–2.4 in. (1–6 cm) in width, possessing a flat and smooth texture [28,29]. The plant’s flower heads are dense, fluffy, and come in shades of gray or purple, while all parts of the plant are versatile and serve various purposes. In construction, the primary utilization lies in the stems of the Phragmites Australis plant. This species has garnered attention as a renewable, biodegradable, and readily available source of natural fibers for enhancing concrete [30,31]. It was demonstrated that the incorporation of 1.5% PA fibers in concrete significantly improved its capillary and water absorption properties [32]. In another study, it was demonstrated that the inclusion of Phragmites Australis plants in reinforced concrete beams resulted in improved performance, including increased load-carrying capacity and ductility compared to plain concrete beams [33]. These findings highlight the potential of using this plant as a beneficial reinforcement material for structural applications [34,35]
To the best of the author’s knowledge, there is hardly any research on volume stability and mechanical properties of mortar containing PA fibers, thus this paper aims to address these properties. For this reason, a series of tests were conducted on mortar with varying amounts of PA addition. Tests included compressive strength, flexural strength, chemical shrinkage, drying shrinkage, autogenous shrinkage and expansion.

2. Materials and Testing Methods

2.1. Materials

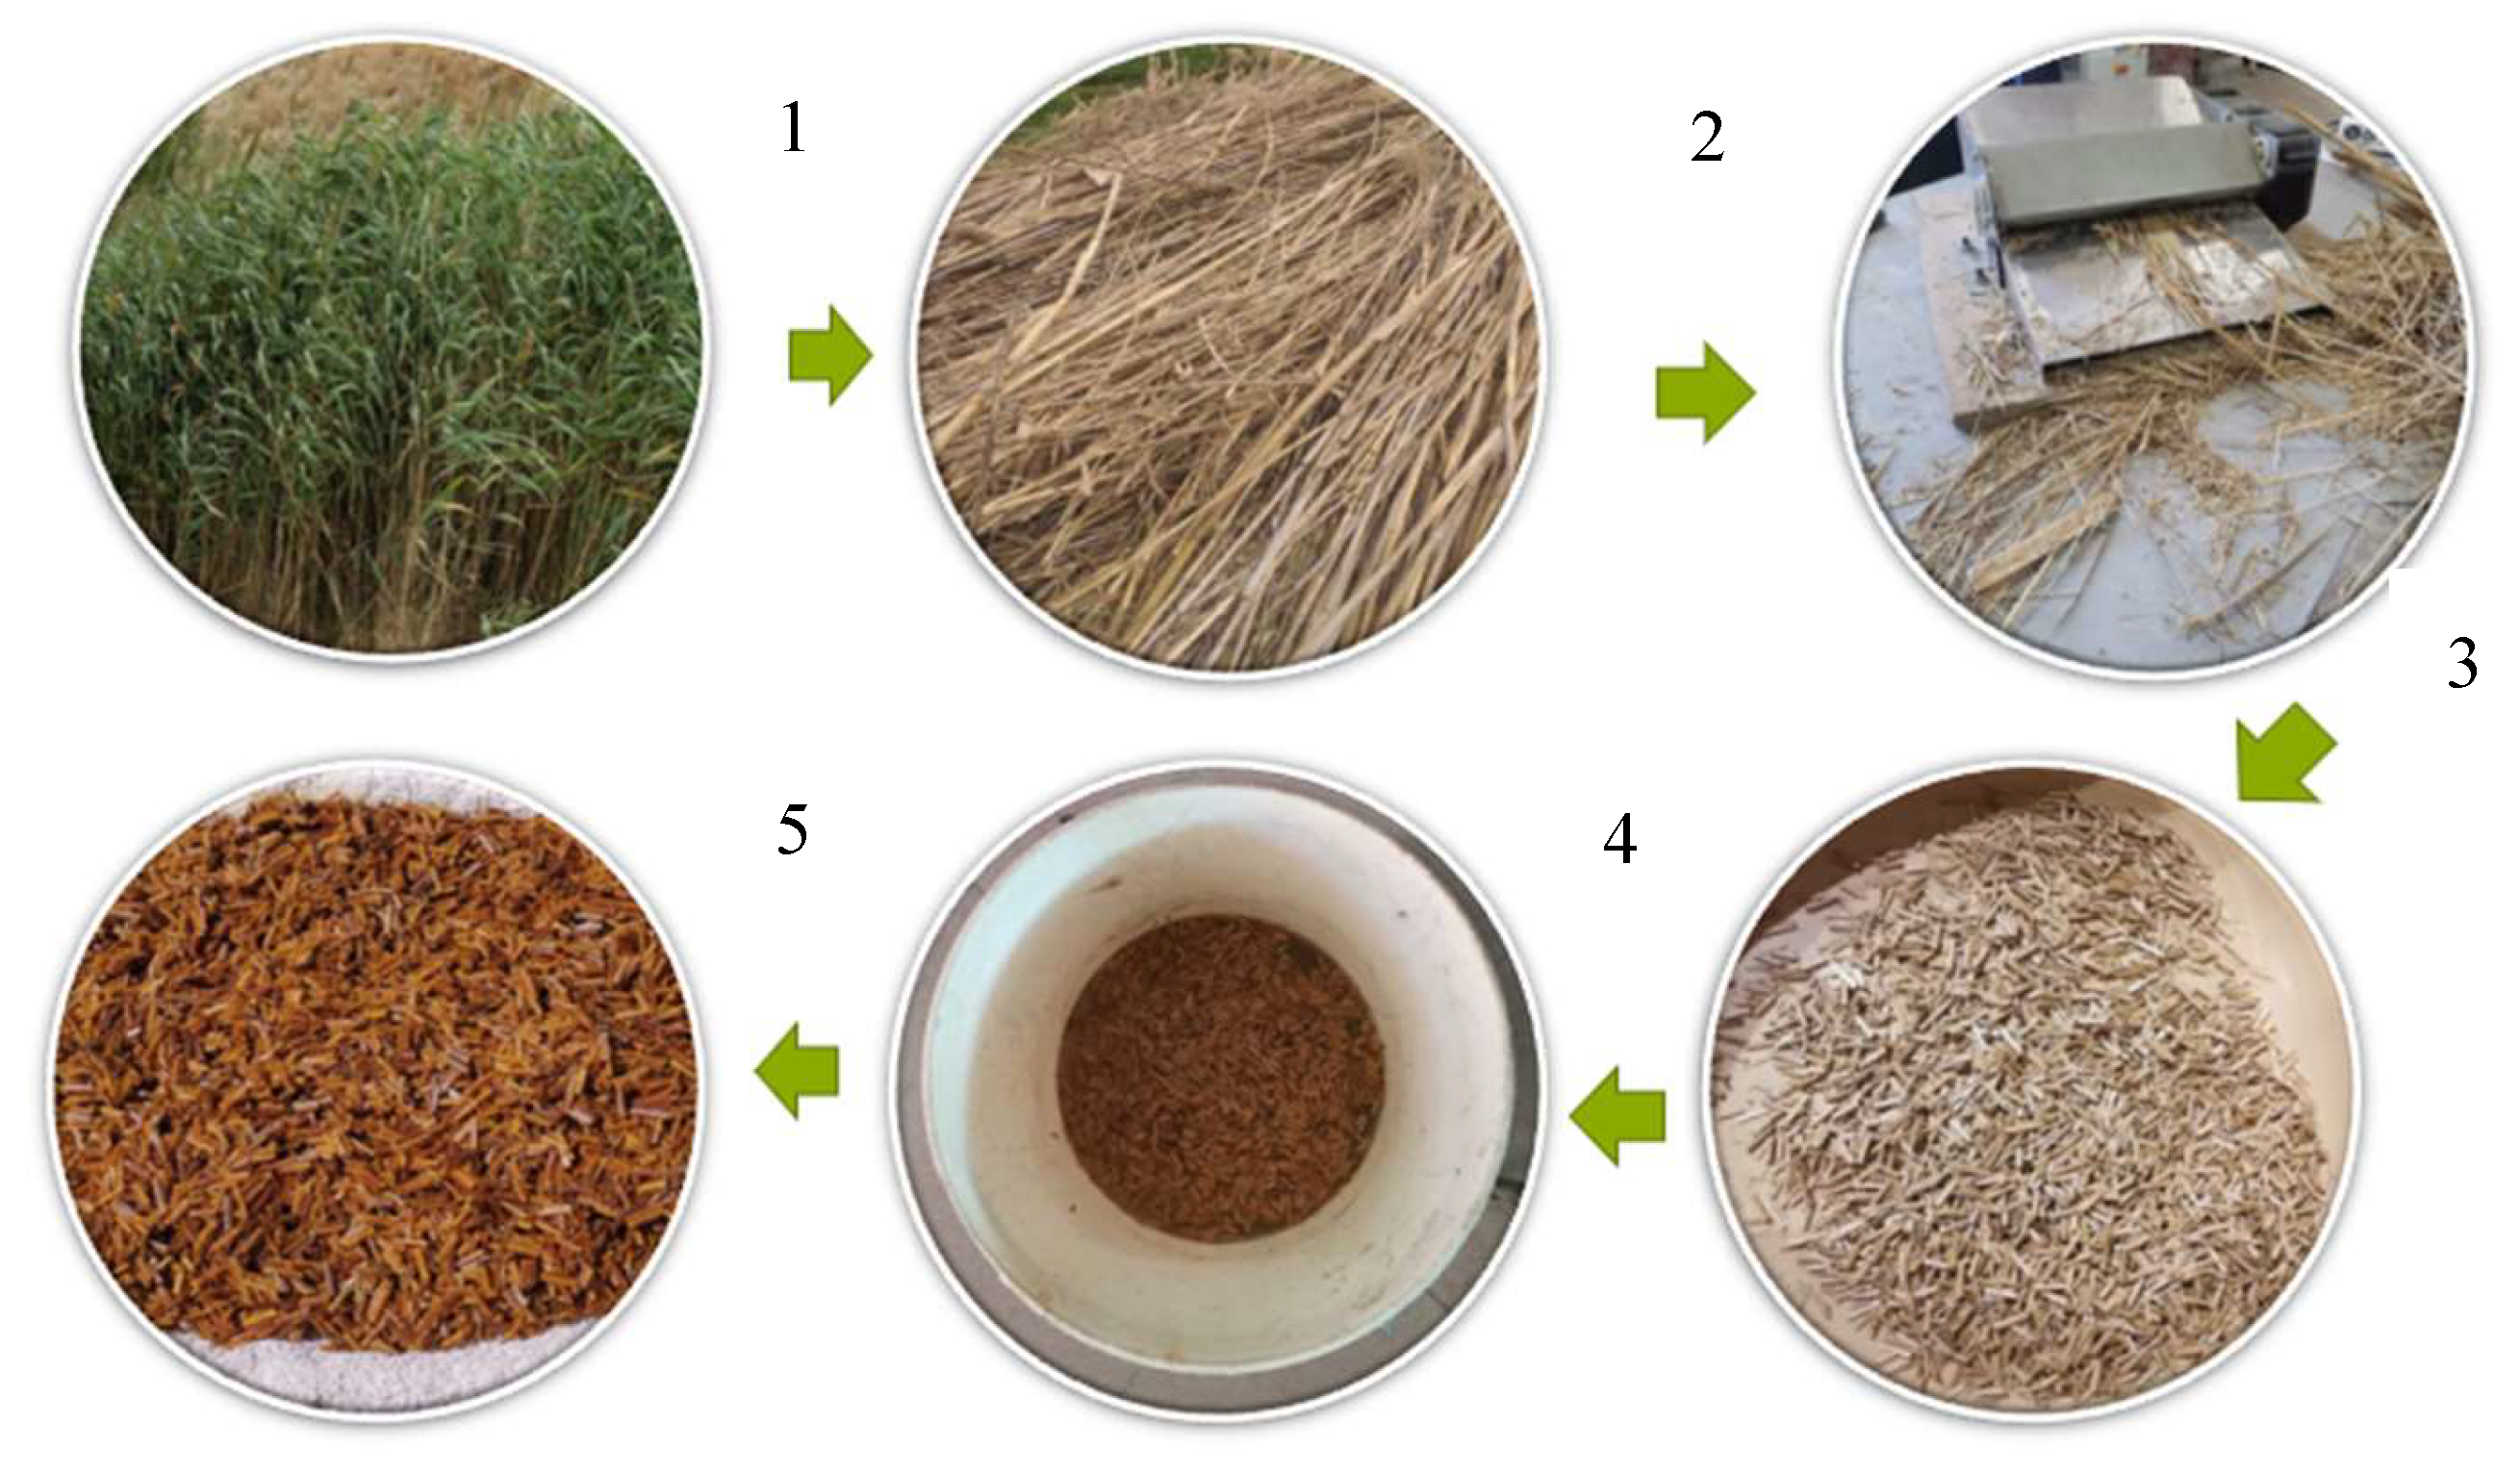
2.1.1. Phragmites-Australis Fiber

The PA plant was collected from Lebanon’s Bekaa Valley, where it grows abundantly alongside rivers and canals. The plant stems underwent processing using a cut machine to convert them into fibers, resulting in fibers with dimensions of 1 cm in length and 2 mm in width. The process for obtaining PA fibers is illustrated in Figure 1. Subsequently, these fibers were immersed in a 4% NaOH solution, a common chemical treatment used for reinforcing thermoplastics and thermosets with natural fibers [36]. After undergoing cleaning and drying procedures and being placed in plastic bags, the fibers were ready for use. The bulk density of the PA fibers was approximately 665 kg/m3. The assessment of fiber tensile strength reveals an ultimate load capacity of approximately 27 kN with an elongation of 2.5 mm. This observation underscores their strength and strong load-bearing capacity.

2.1.2. Mix Proportions

In this experiment, four mortar mixes were performed. The mix ratio was 1:0.55:2 (cement: water: sand). The tested PA fibers volume fractions were 0%, 0.5%, 1% and 2%. All of the mix design details were displayed in Table 1. The selections of cement and sand were as follows:
(1)
Ordinary Portland cement type I conforming to the Lebanese norms: PA-L 42.5N with a density, specific gravity and Blaine surface area of 1440 kg/m3, 3.15 and 399.8 m2/kg respectively.
(2)
Siliceous sand with a specific gravity, water absorption and fineness modulus of 2.65, 2.33% and 2.8, respectively.

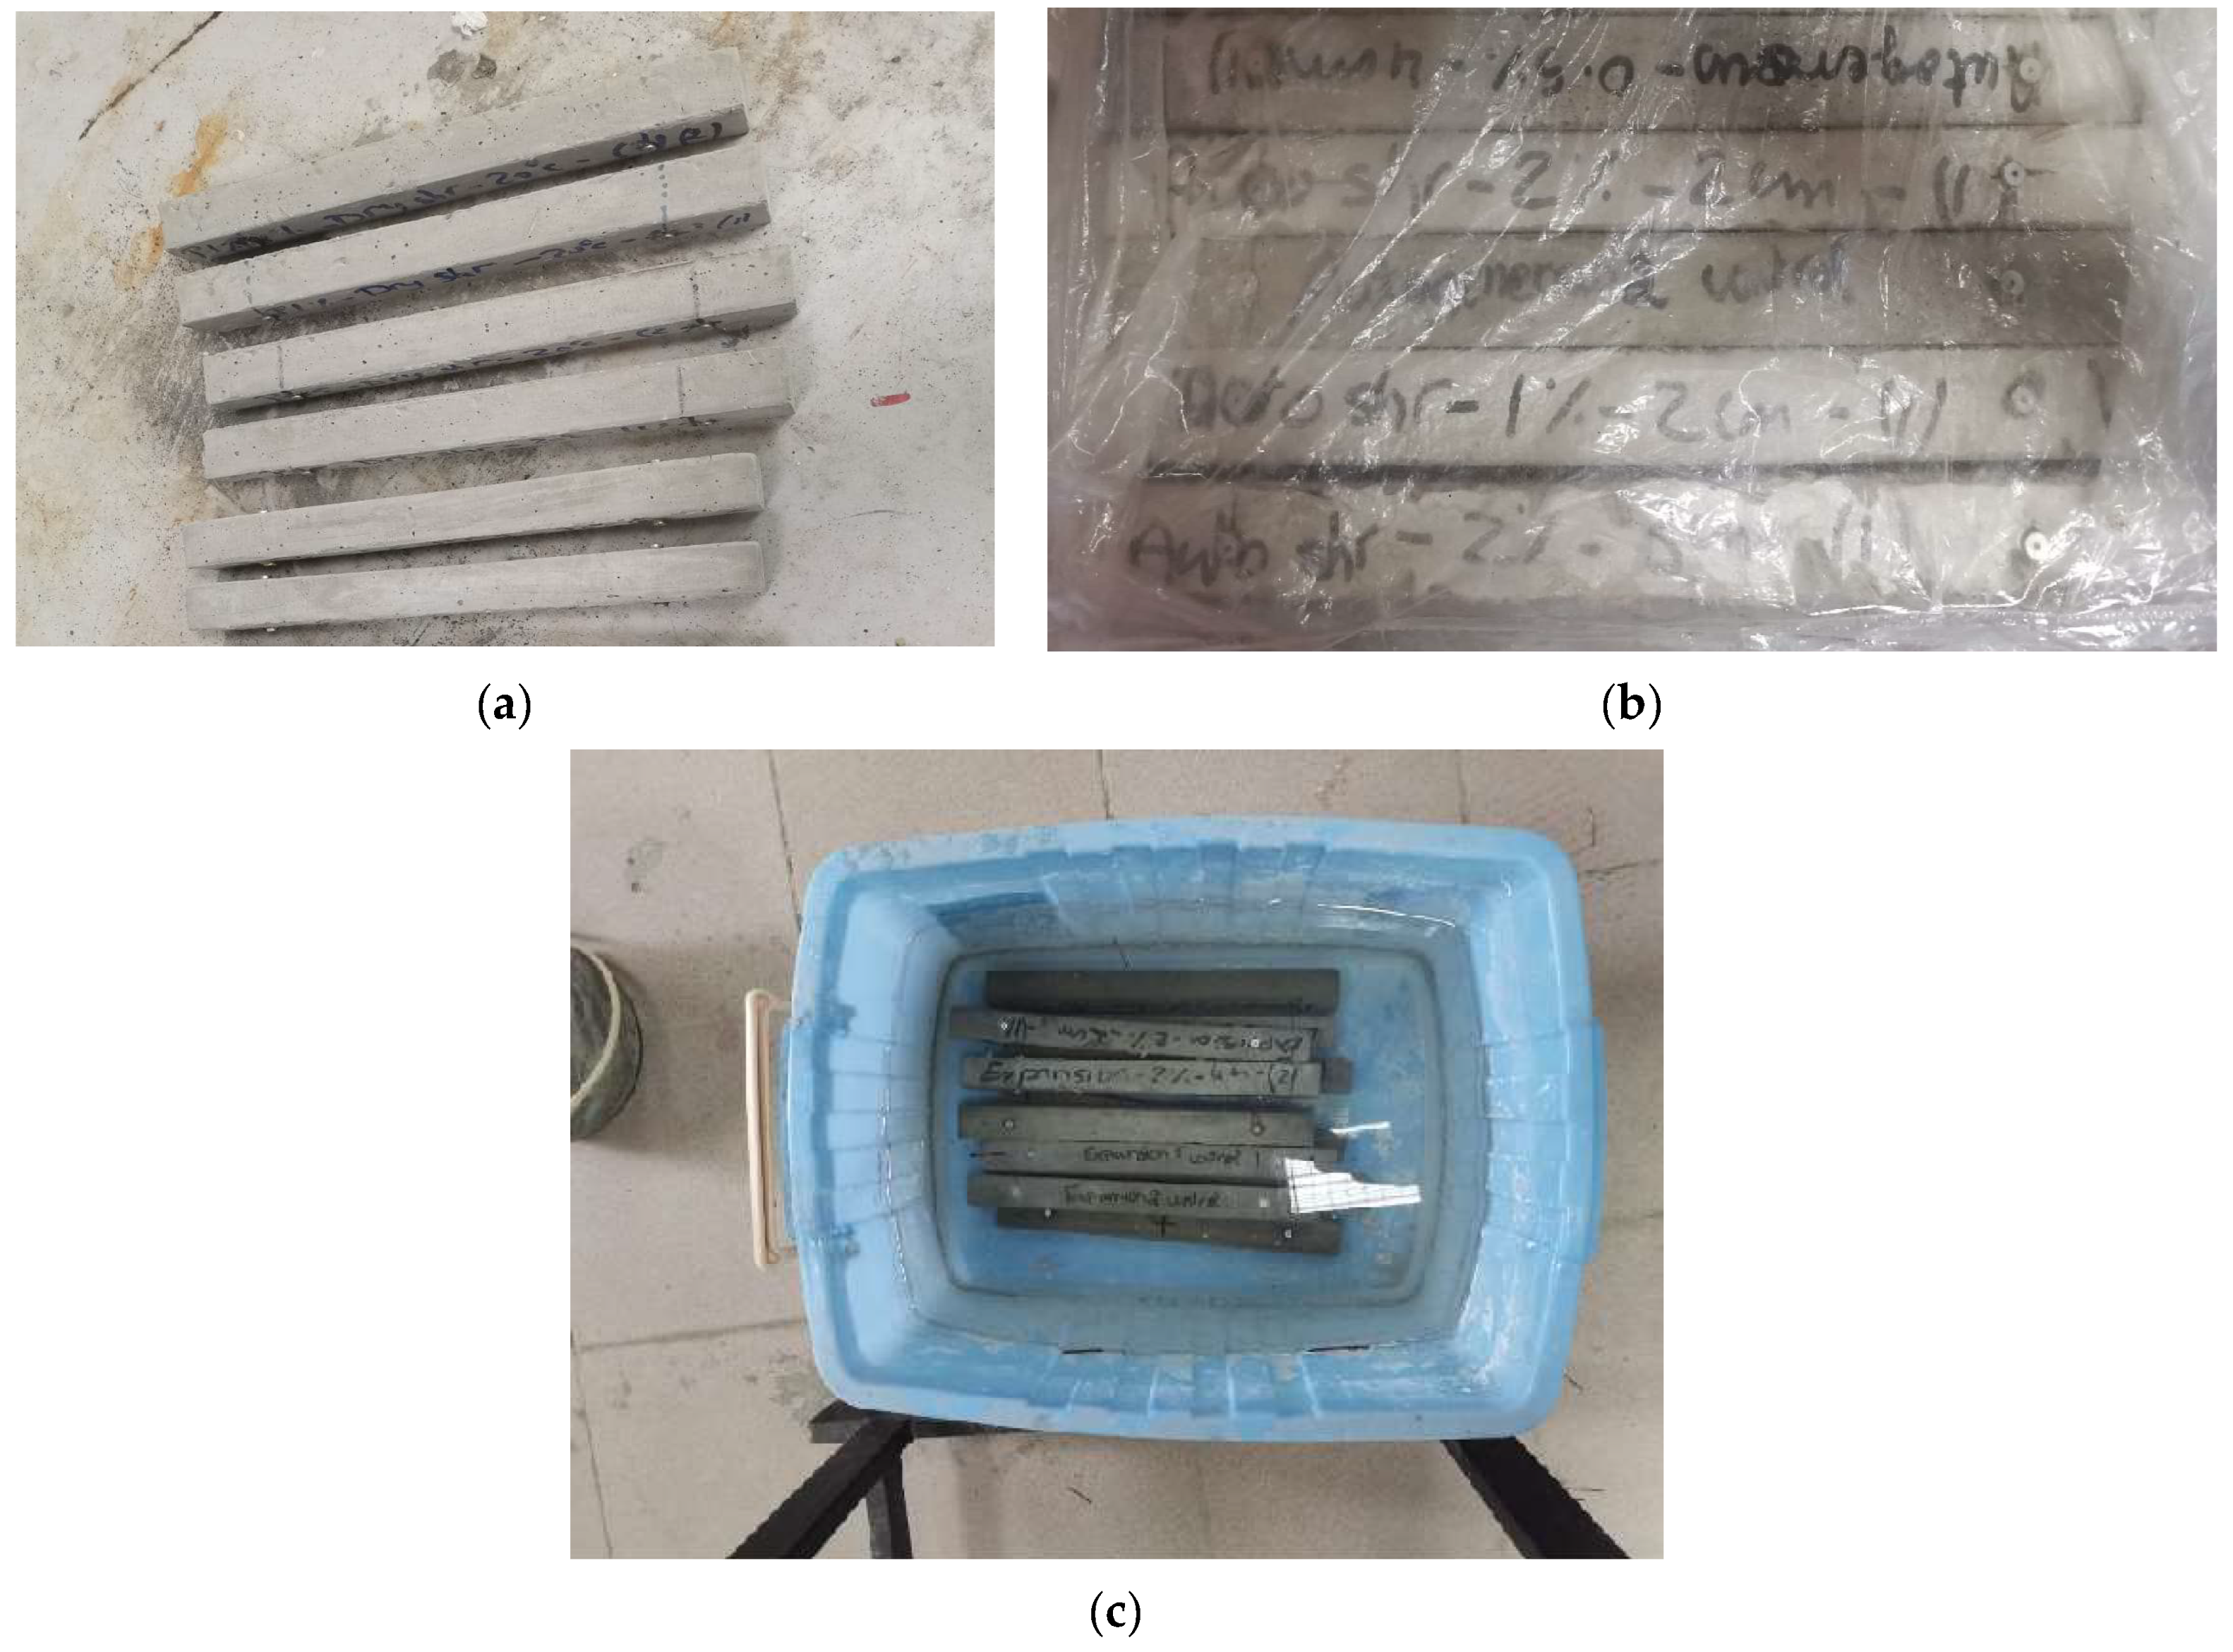
2.1.3. Samples Preparation

The process began by mixing cement, sand, and the PA fibers together for 30 s. Water was then added and mixed for an additional 2 min. Following mixing, the flow test was conducted to determine mortar consistency. The flow was 105, 94, 86, and 79% for M-0%PA, M-0.5%PA, M-1%PA and M-2%PA, respectively. The sample dimensions used for measuring the flexural strength and the compressive strength were (40 × 40 × 160) mm. For the volume change test, a glass bottle with a volume of 250 mL was utilized to perform the chemical shrinkage test. The sample size for drying shrinkage, autogenous shrinkage, and expansion was (25 × 25 × 285) mm.

2.2. Testing Methods

2.2.1. Mechanical Properties

Regarding the flexural and compressive strength test, a universal testing machine was used with a maximum load capacity of 2000 kN. As per EN 1015-11 [37] standard, the bending strength test was performed on mortar beams at specific testing days (1, 3, 7, 28, 90, and 180 days), using a universal testing machine with a rate of loading at 0.25 MPa/s. A total of two samples were performed for each testing day. The total number of specimens was 48. After the flexural testing, the two fractured components were further subjected to a compressive strength test. The broken part was positioned between two plates, each measuring (40 × 40) mm, so that the area of the resulting cube was 1600 mm2.

2.2.2. Length Change Test

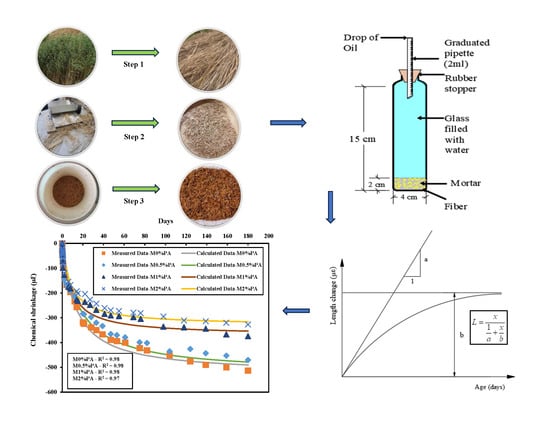
Drying Shrinkage, Autogenous Shrinkage, and Expansion Tests

ASTM C490 [38] was followed to conduct tests for drying shrinkage, autogenous shrinkage, and expansion. After demolding, the samples were marked with two points 200 mm apart on each side. Subsequently, the drying shrinkage samples were placed in the air at a constant temperature of 25 °C (Figure 2a). To prevent moisture loss, autogenous shrinkage samples were placed in plastic bags (Figure 2b). As for expansion testing, the samples were immersed in water at a constant temperature of 20 ± 1 °C (Figure 2c). The length changes were measured using a dial gauge. Over a period of 180 days, the samples’ lengths were measured every two days. For each mix, the length changes were determined as the average of the six readings taken from the two samples. The total number of samples was 24, with a distribution of 6 samples per mix, allocated as follows: 2 for drying shrinkage, 2 for autogenous shrinkage, and 2 for expansion.

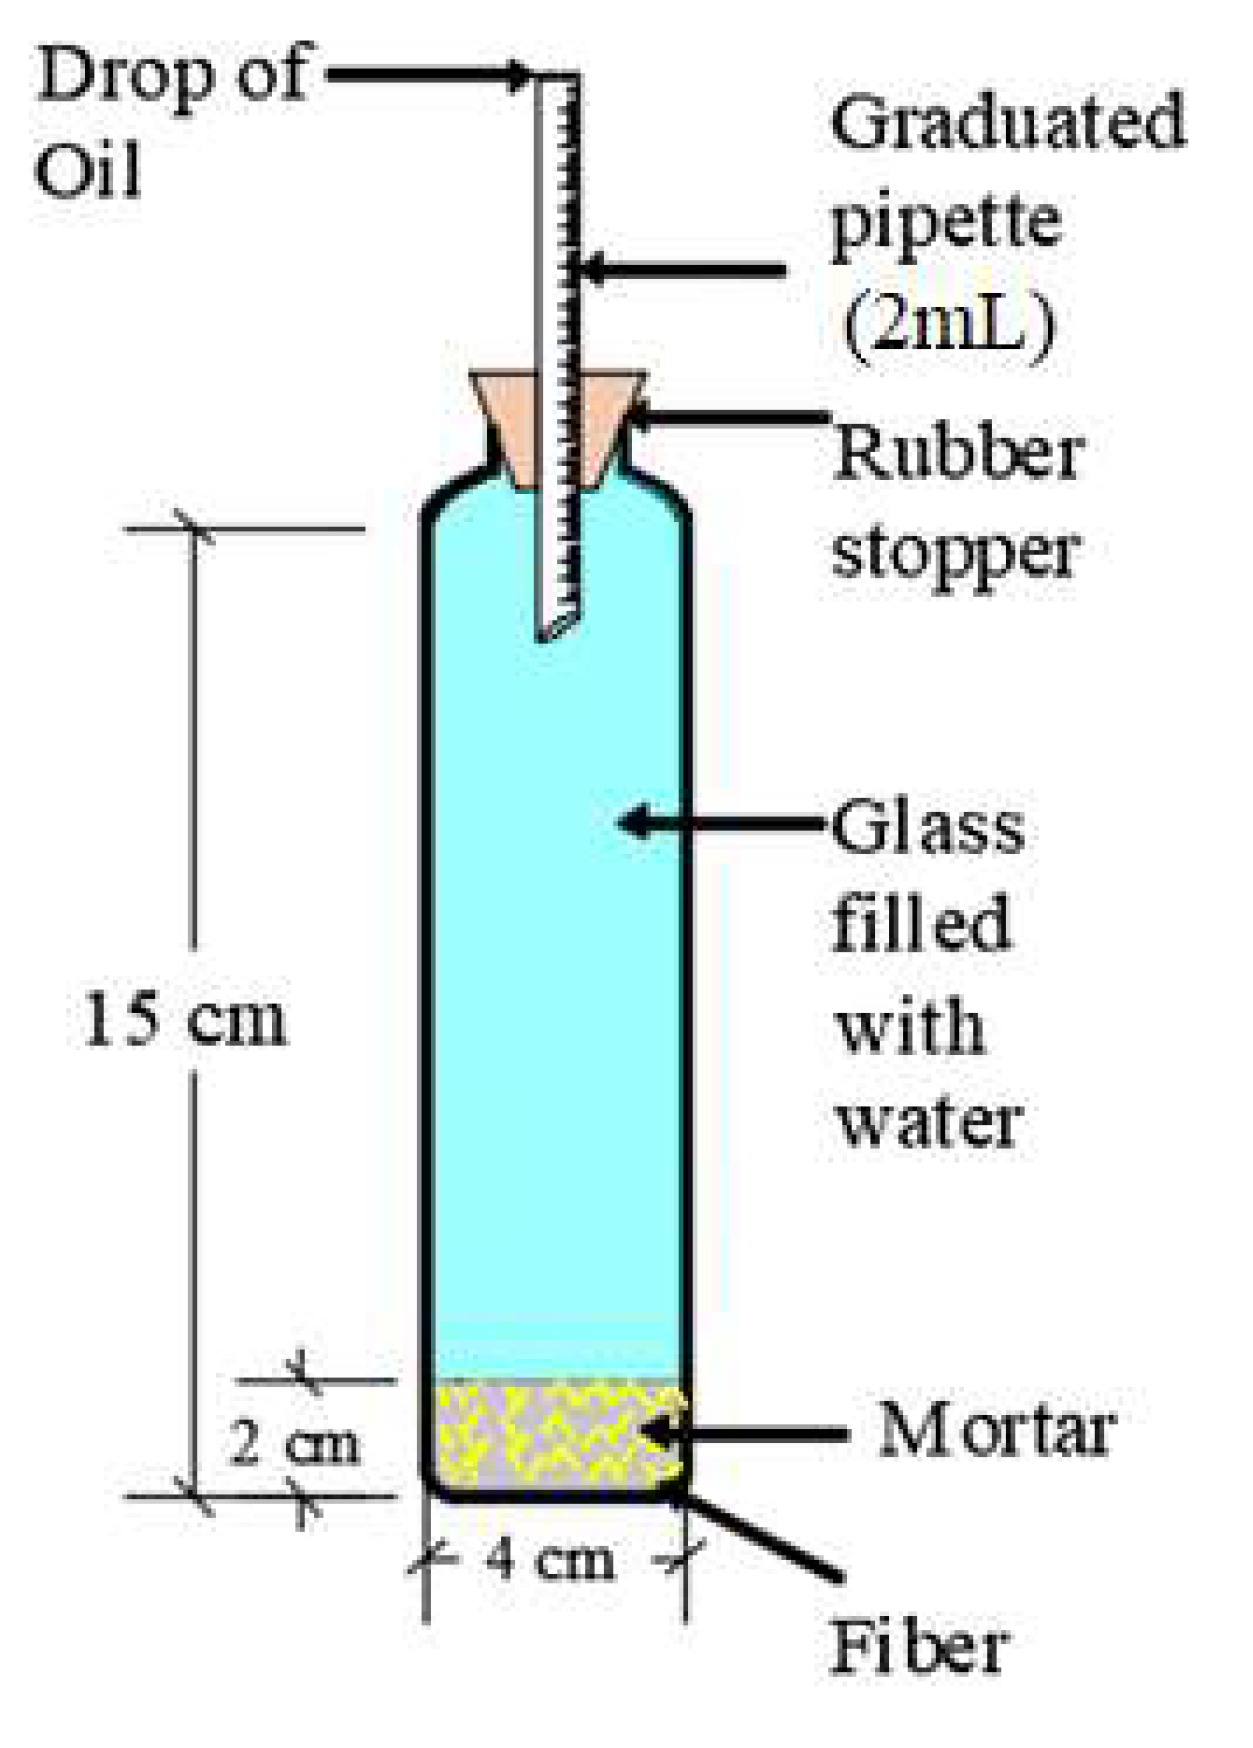
Chemical Shrinkage Test

Chemical shrinkage measurements were conducted following the ASTM C1608 standard [39] and established previous studies [40,41,42,43] were followed for consistency. The experimental procedure involved placing a mortar mix comprising PA fibers, cement, sand, and water into a 250 mL glass bottle to a depth of 2 cm (see Figure 3). A rubber stopper, moistened with water, was used to seal the bottle, and water was added to fill it to its maximum capacity. Subsequently, the rubber stopper was punctured, and a 2 mL pipette was utilized to inject water into it. The rubber stopper, filled with water, was then forcefully pushed into the bottle. To prevent water evaporation, a drop of oil was added. Each batch was tested with two replicate samples per mix, contributing to a total of 8 bottles. The volume change, represented by the decrease in water level (chemical shrinkage), was then converted to length change (µε) and compared with various shrinkage parameters using the following equation [6]:
V 3 V = L L

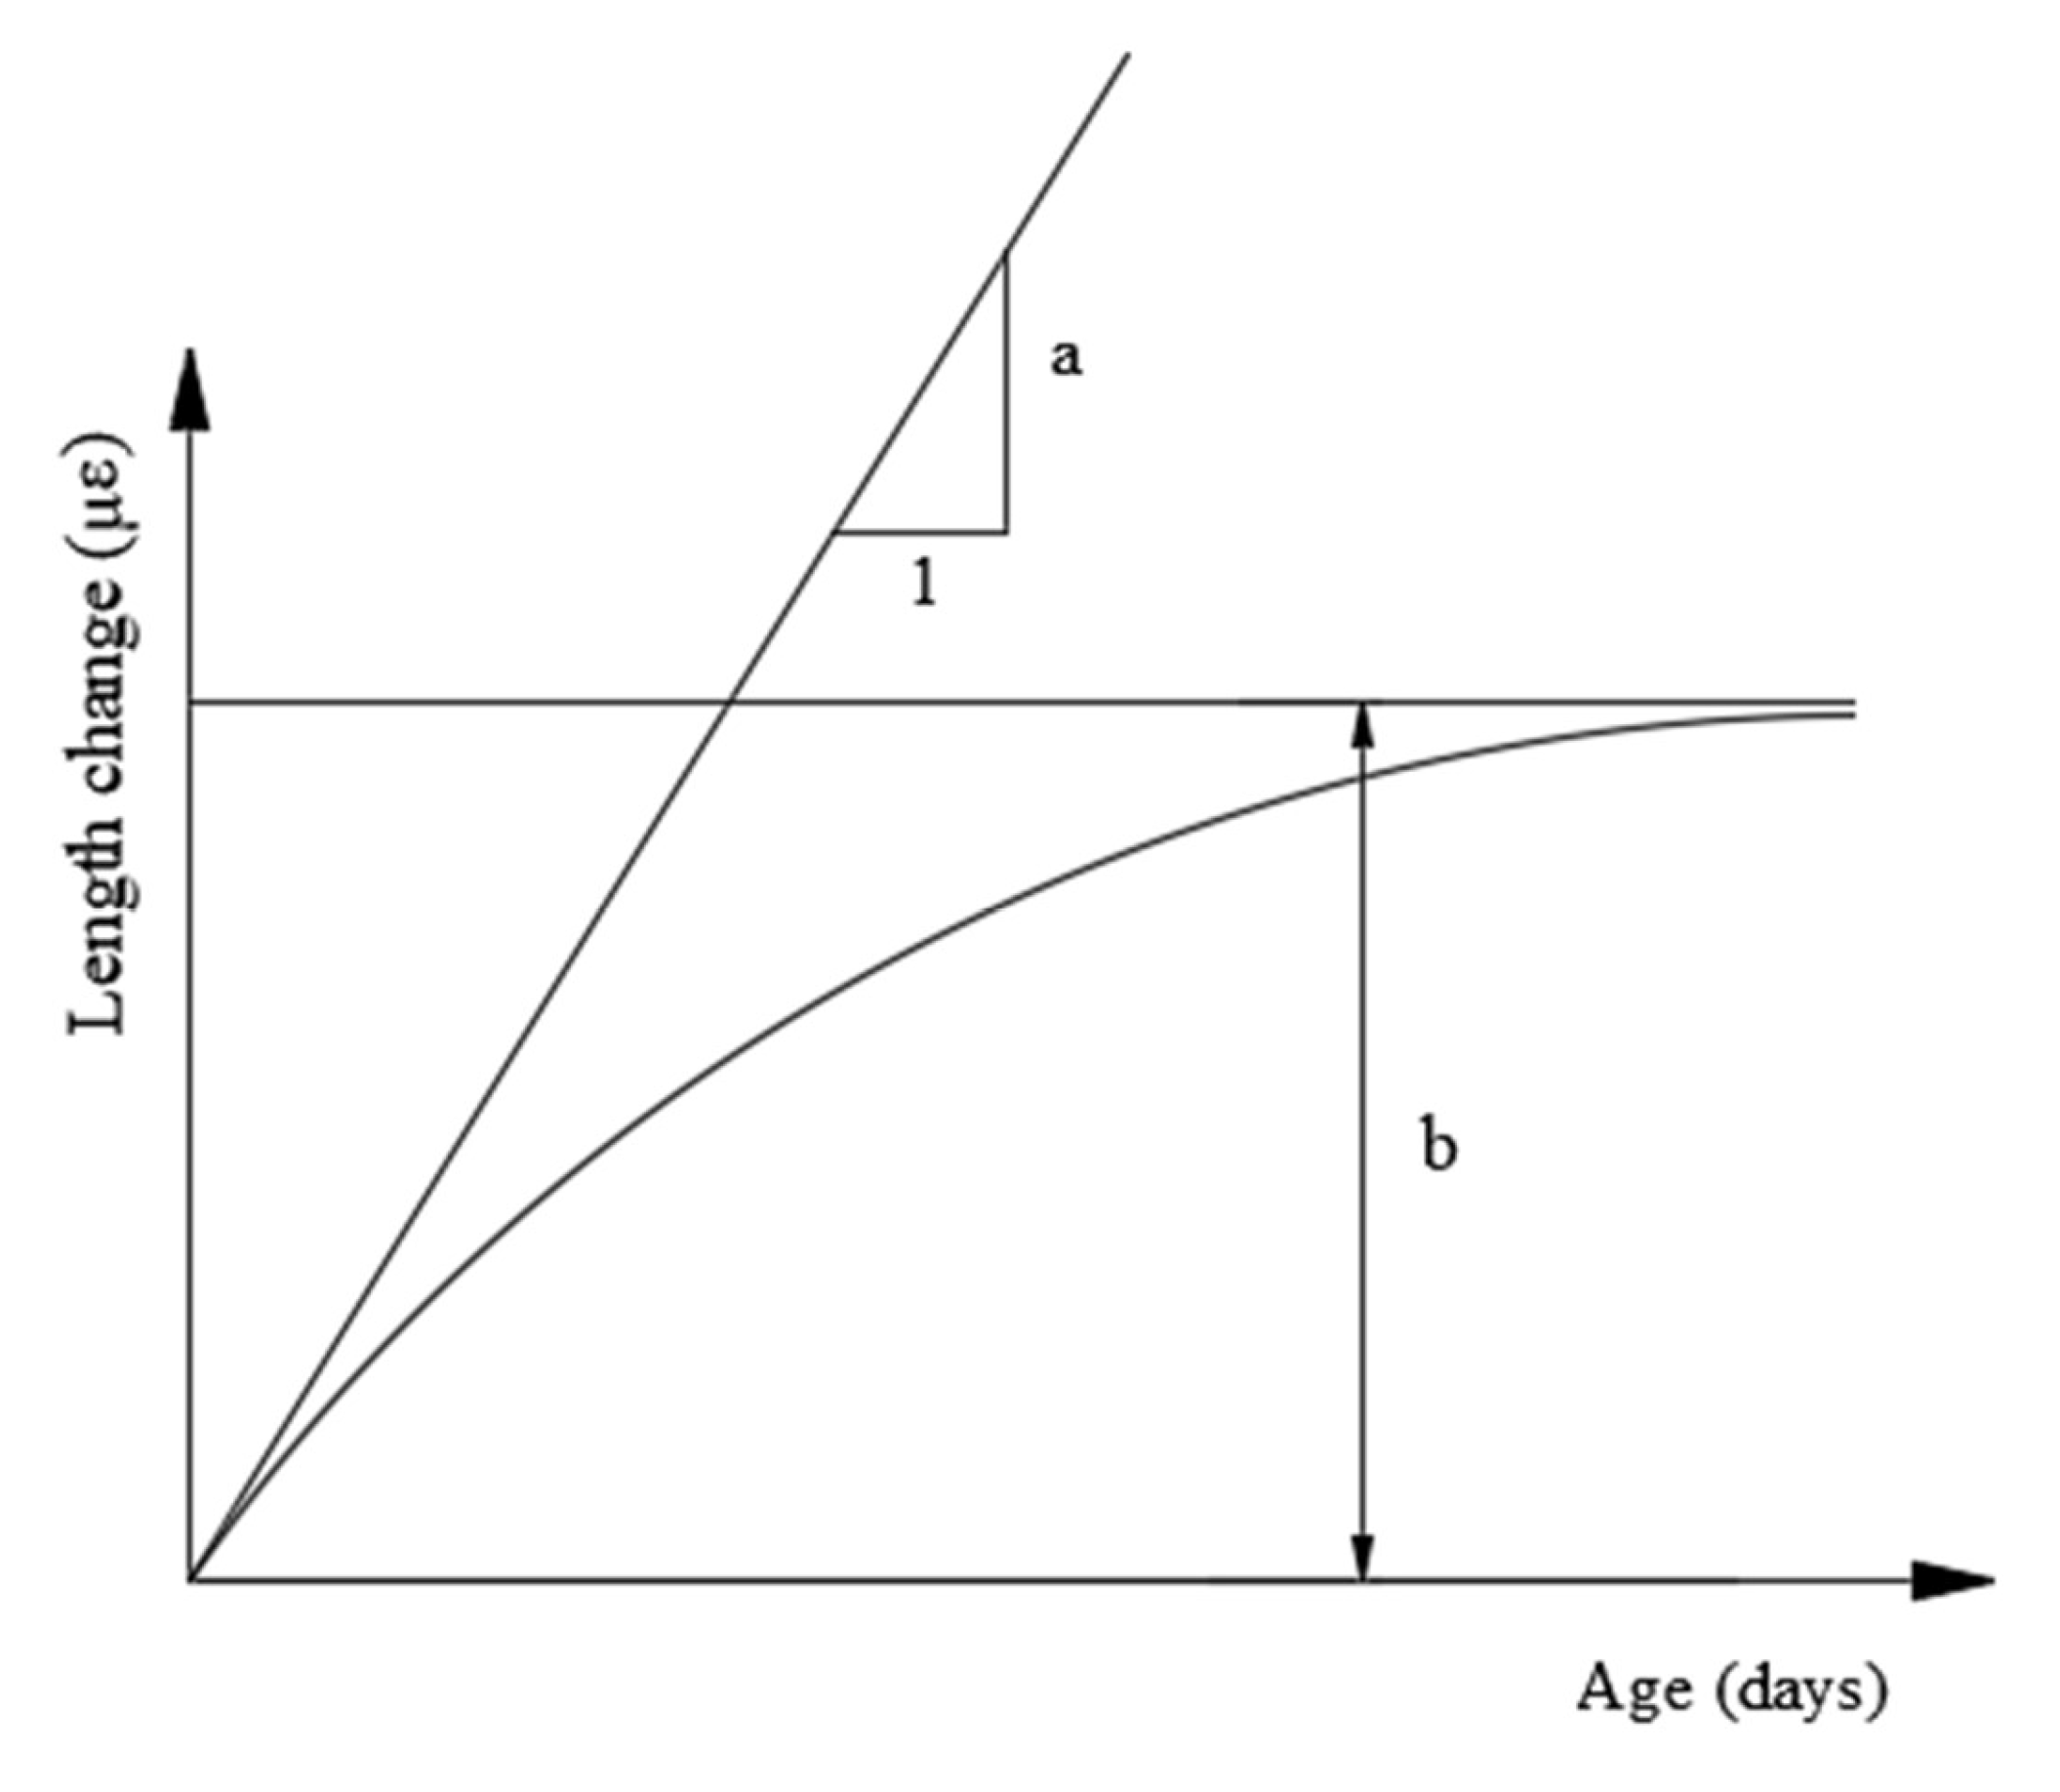
2.3. Estimation of Length Change

In this study, an extensive analysis was conducted to differentiate between various mixtures based on chemical, autogenous, drying shrinkage, and expansion data. Two key parameters, namely the initial rate of the length change (IRL) and the ultimate length change (UL), were of particular interest to the engineers. The IRL represents the rate of shrinkage or expansion during the initial stages of drying or curing, reflecting the material’s early volume changes due to moisture loss or gain. Conversely, the UL characterizes the maximum magnitude of shrinkage or expansion, signifying the material’s long-term behavior after attaining a consistent moisture content. A hyperbolic model [44] was employed to encompass and analyze these critical parameters (Figure 4). The equation is as follow:
L = x 1 a + x b
where:
  • L = Predicted length change (i.e., chemical, autogenous, drying shrinkage, or expansion)
  • a = Initial rate of length change (IRL)
  • a = Initial rate of length change (IRL)
  • x = Age (days)
  • b = Ultimate length change (UL)
The above two parameters are determined using Microsoft excel software V2021.

3. Results and Discussion

3.1. Mechanical Properties

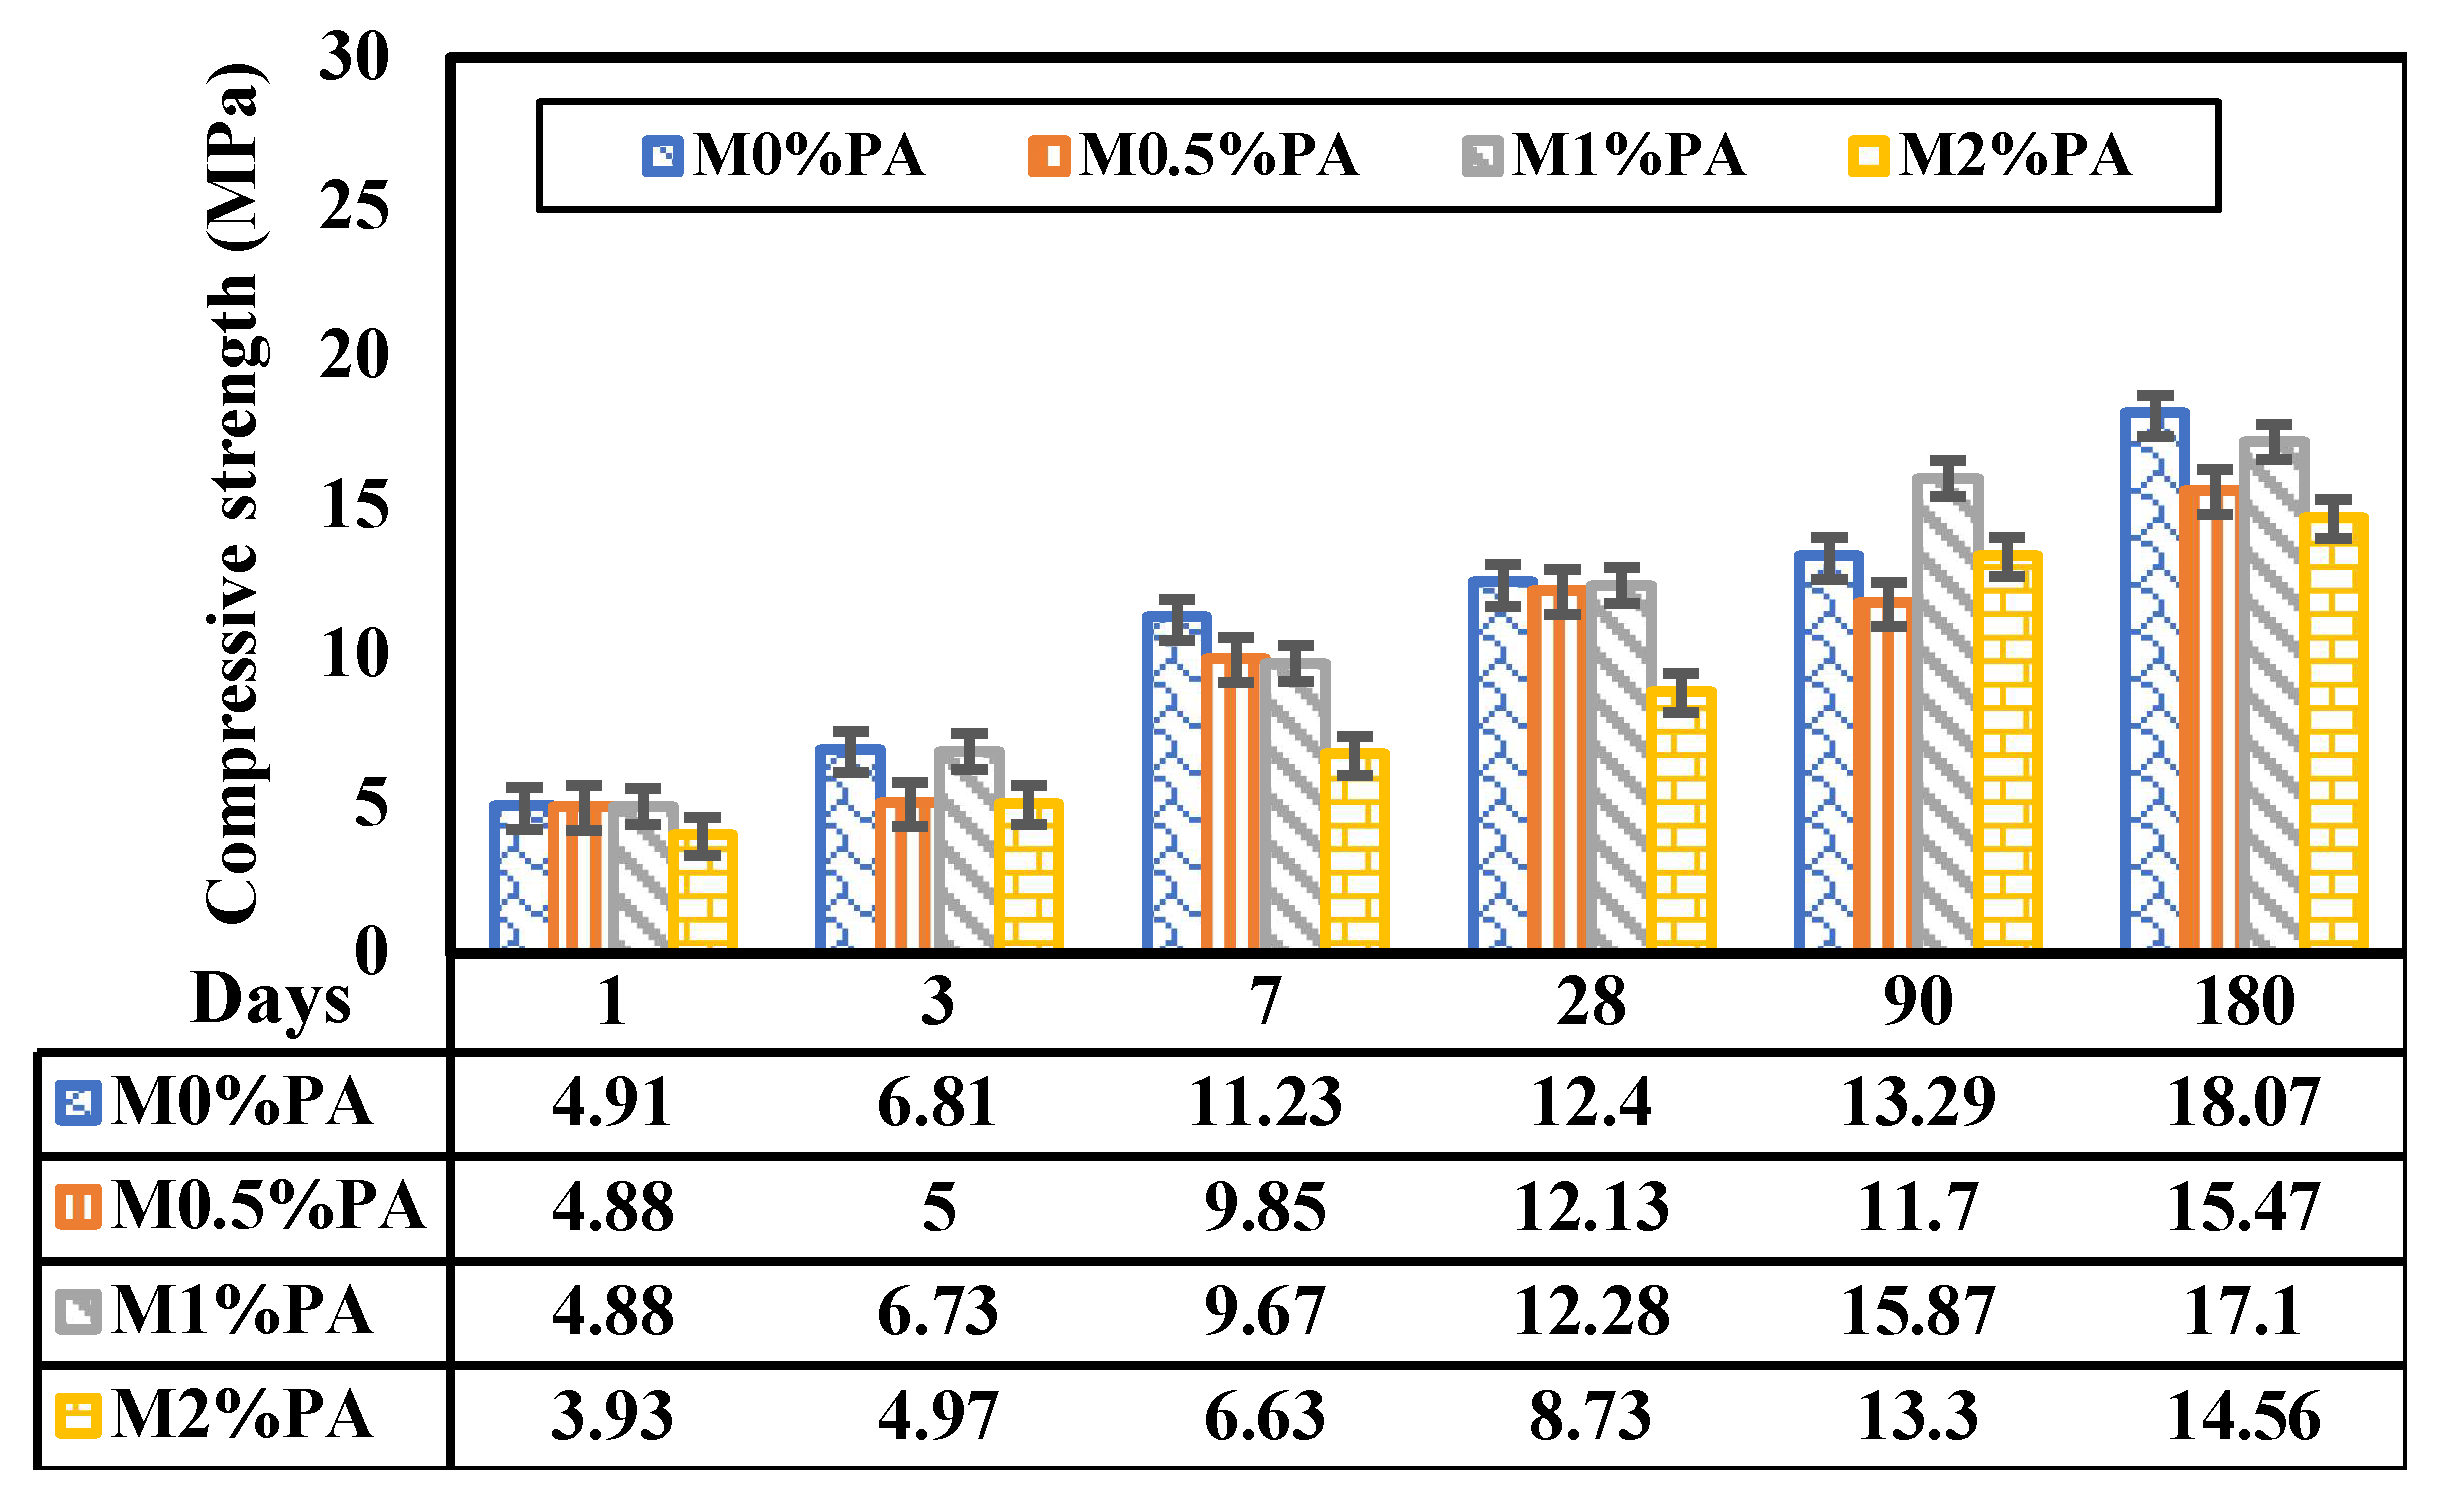
3.1.1. Compressive Strength

Figure 5 presents the compressive strength results of mortar samples. The results show that, at the 180 day curing age, the addition of 0.5%, 1%, and 2% PA fibers led to a reduction in compressive strength by 14.38%, 5.36%, and 19.4%, respectively. This decline is primarily attributed to the increase in entrapped air spaces resulting from the incorporation of PA fibers, making the compaction of mortar more challenging. Moreover, this decrease in compressive strength is consistent with previous studies [45,46,47,48].
Furthermore, the compressive strength results for the 1% PA fiber mix were comparably greater than those of mixes with other PA%. This phenomenon can be attributed to factors such as optimal fiber distribution, improved matrix-fiber bonding, and potentially less inter-fiber interaction [49,50]. At these fiber percentages (0.5% and 2%), the fibers are less likely to be evenly dispersed within the material, assisting in effective stress transfer and preventing crack propagation.
In comparison to the plain samples, the percentage of compressive strength increase from 1 day to 28 days was higher by approximately 0.14% to 5.4%. However, a different trend emerged in the strength rate between 28 and 180 days. For instance, the mortar samples with 1% PA fibers exhibited the fastest rate of compressive strength growth, increasing 71.8% during that period. This observation can be attributed to the delayed release of moisture from the pores of PA fibers, which accelerates the hydration process around these fibers [51,52]. Consequently, PA fibers show significant promise as internal curing agents for cement composites.

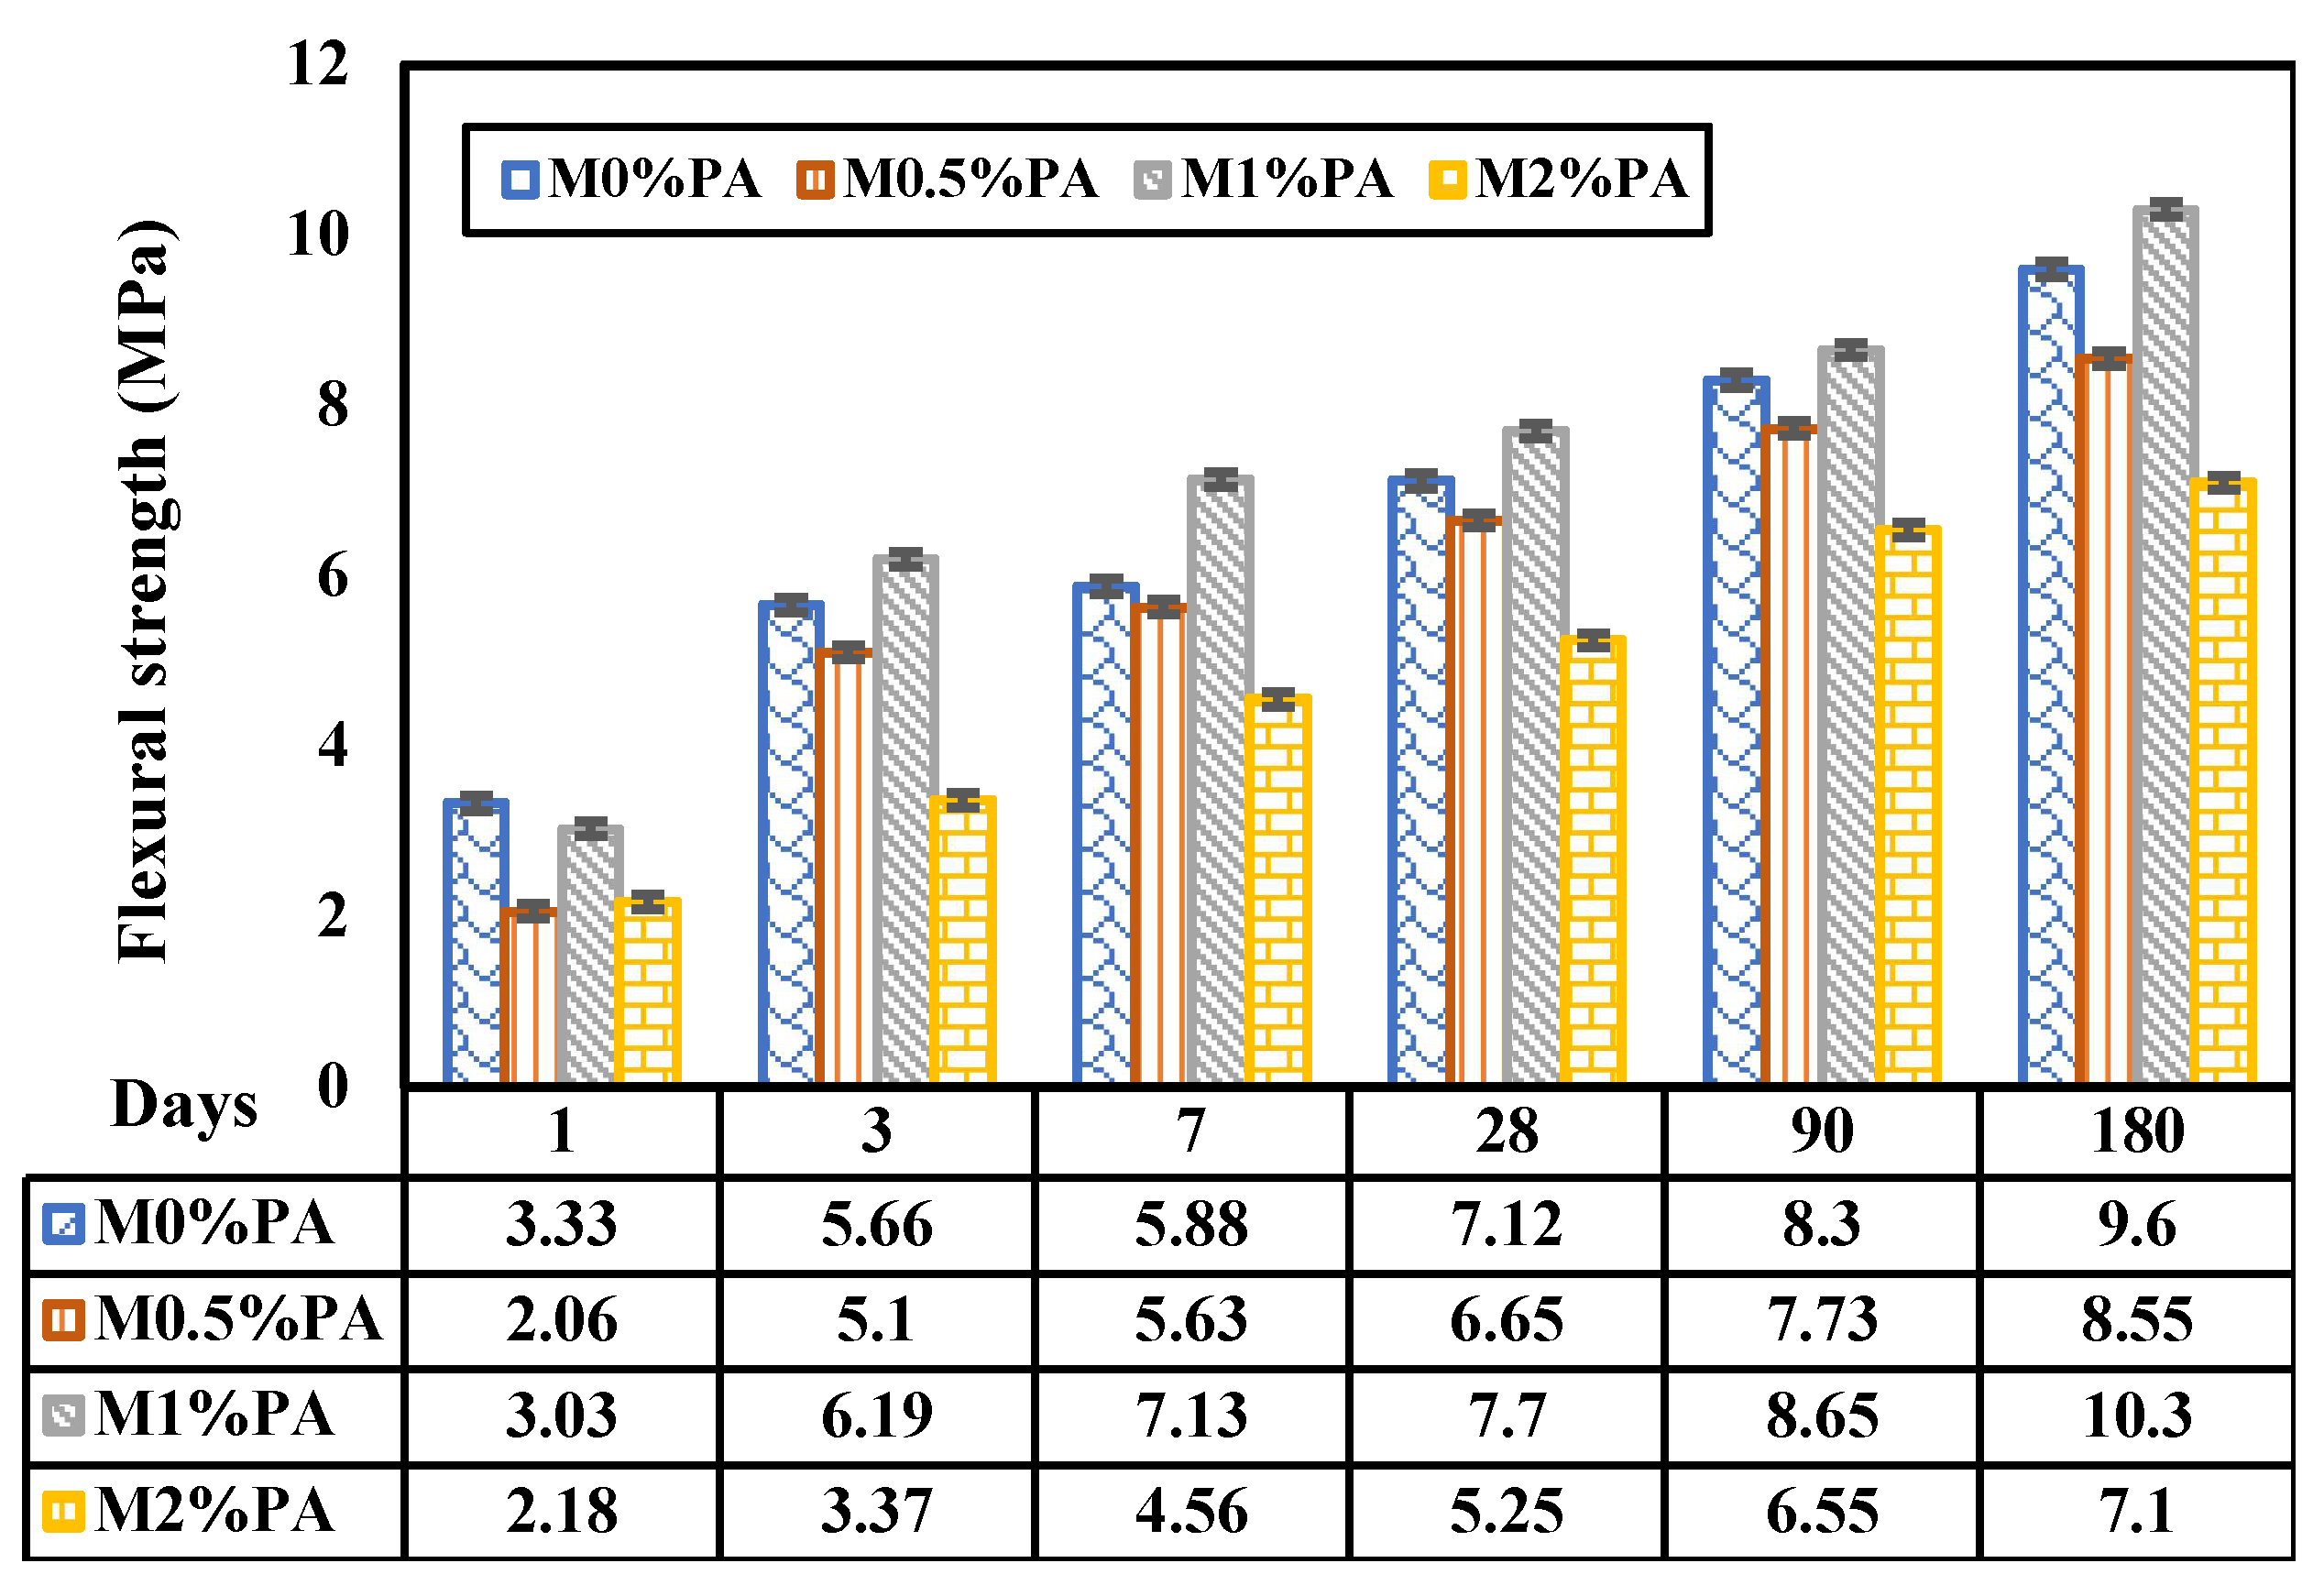
3.1.2. Flexural Strength

The test results presented in Figure 6 clearly indicate that the incorporation of PA fibers enhances the flexural strength of mortars. The flexural strength initially increases up to 1% of PA fiber content and then declines beyond this point. This reduction can be attributed to segregation issues arising from the poor compaction of larger fiber volume blends. It has been demonstrated that when fiber segregation is avoided, the strength of the composite typically improves in a more or less linear manner as the volume percentage of fibers increases [53,54]. Additionally, this decrease can be attributed to the bundling and curling of fibers during mixing, which reduces the effectiveness of the entire fiber length in transferring stresses. This phenomenon aligns with the observations of Ramirez [47], who asserted that the inclusion of fibers in the matrix increased the flexural strength up to 2% (by volume) of fibers, beyond which a decline in strength occurred due to the presence of unworkable and separated mixes at higher fiber contents.
As mentioned above, the use of 1% PA fibers results in a notable improvement in flexural strength, showing an increase of approximately 7.6% compared to the control mix at 180 days. In fact, the addition of 1% PA fibers in mortars increases the flexural strength due to several reinforcing mechanisms. These fibers act as effective crack bridges, spanning across micro-cracks in the mortar and preventing their propagation, resulting in improved load distribution and enhanced flexural strength [54,55]. Additionally, the high tensile strength of PA fibers enhances the mortar’s overall tensile properties, which are crucial for resisting bending and tension. Moreover, the fibers’ presence reduces micro-crack propagation by distributing stress concentration around the cracks. Proper fiber alignment achieved through careful mixing and compaction also plays a role in enhancing the mortar’s flexural strength [52,56].

3.2. Length Change

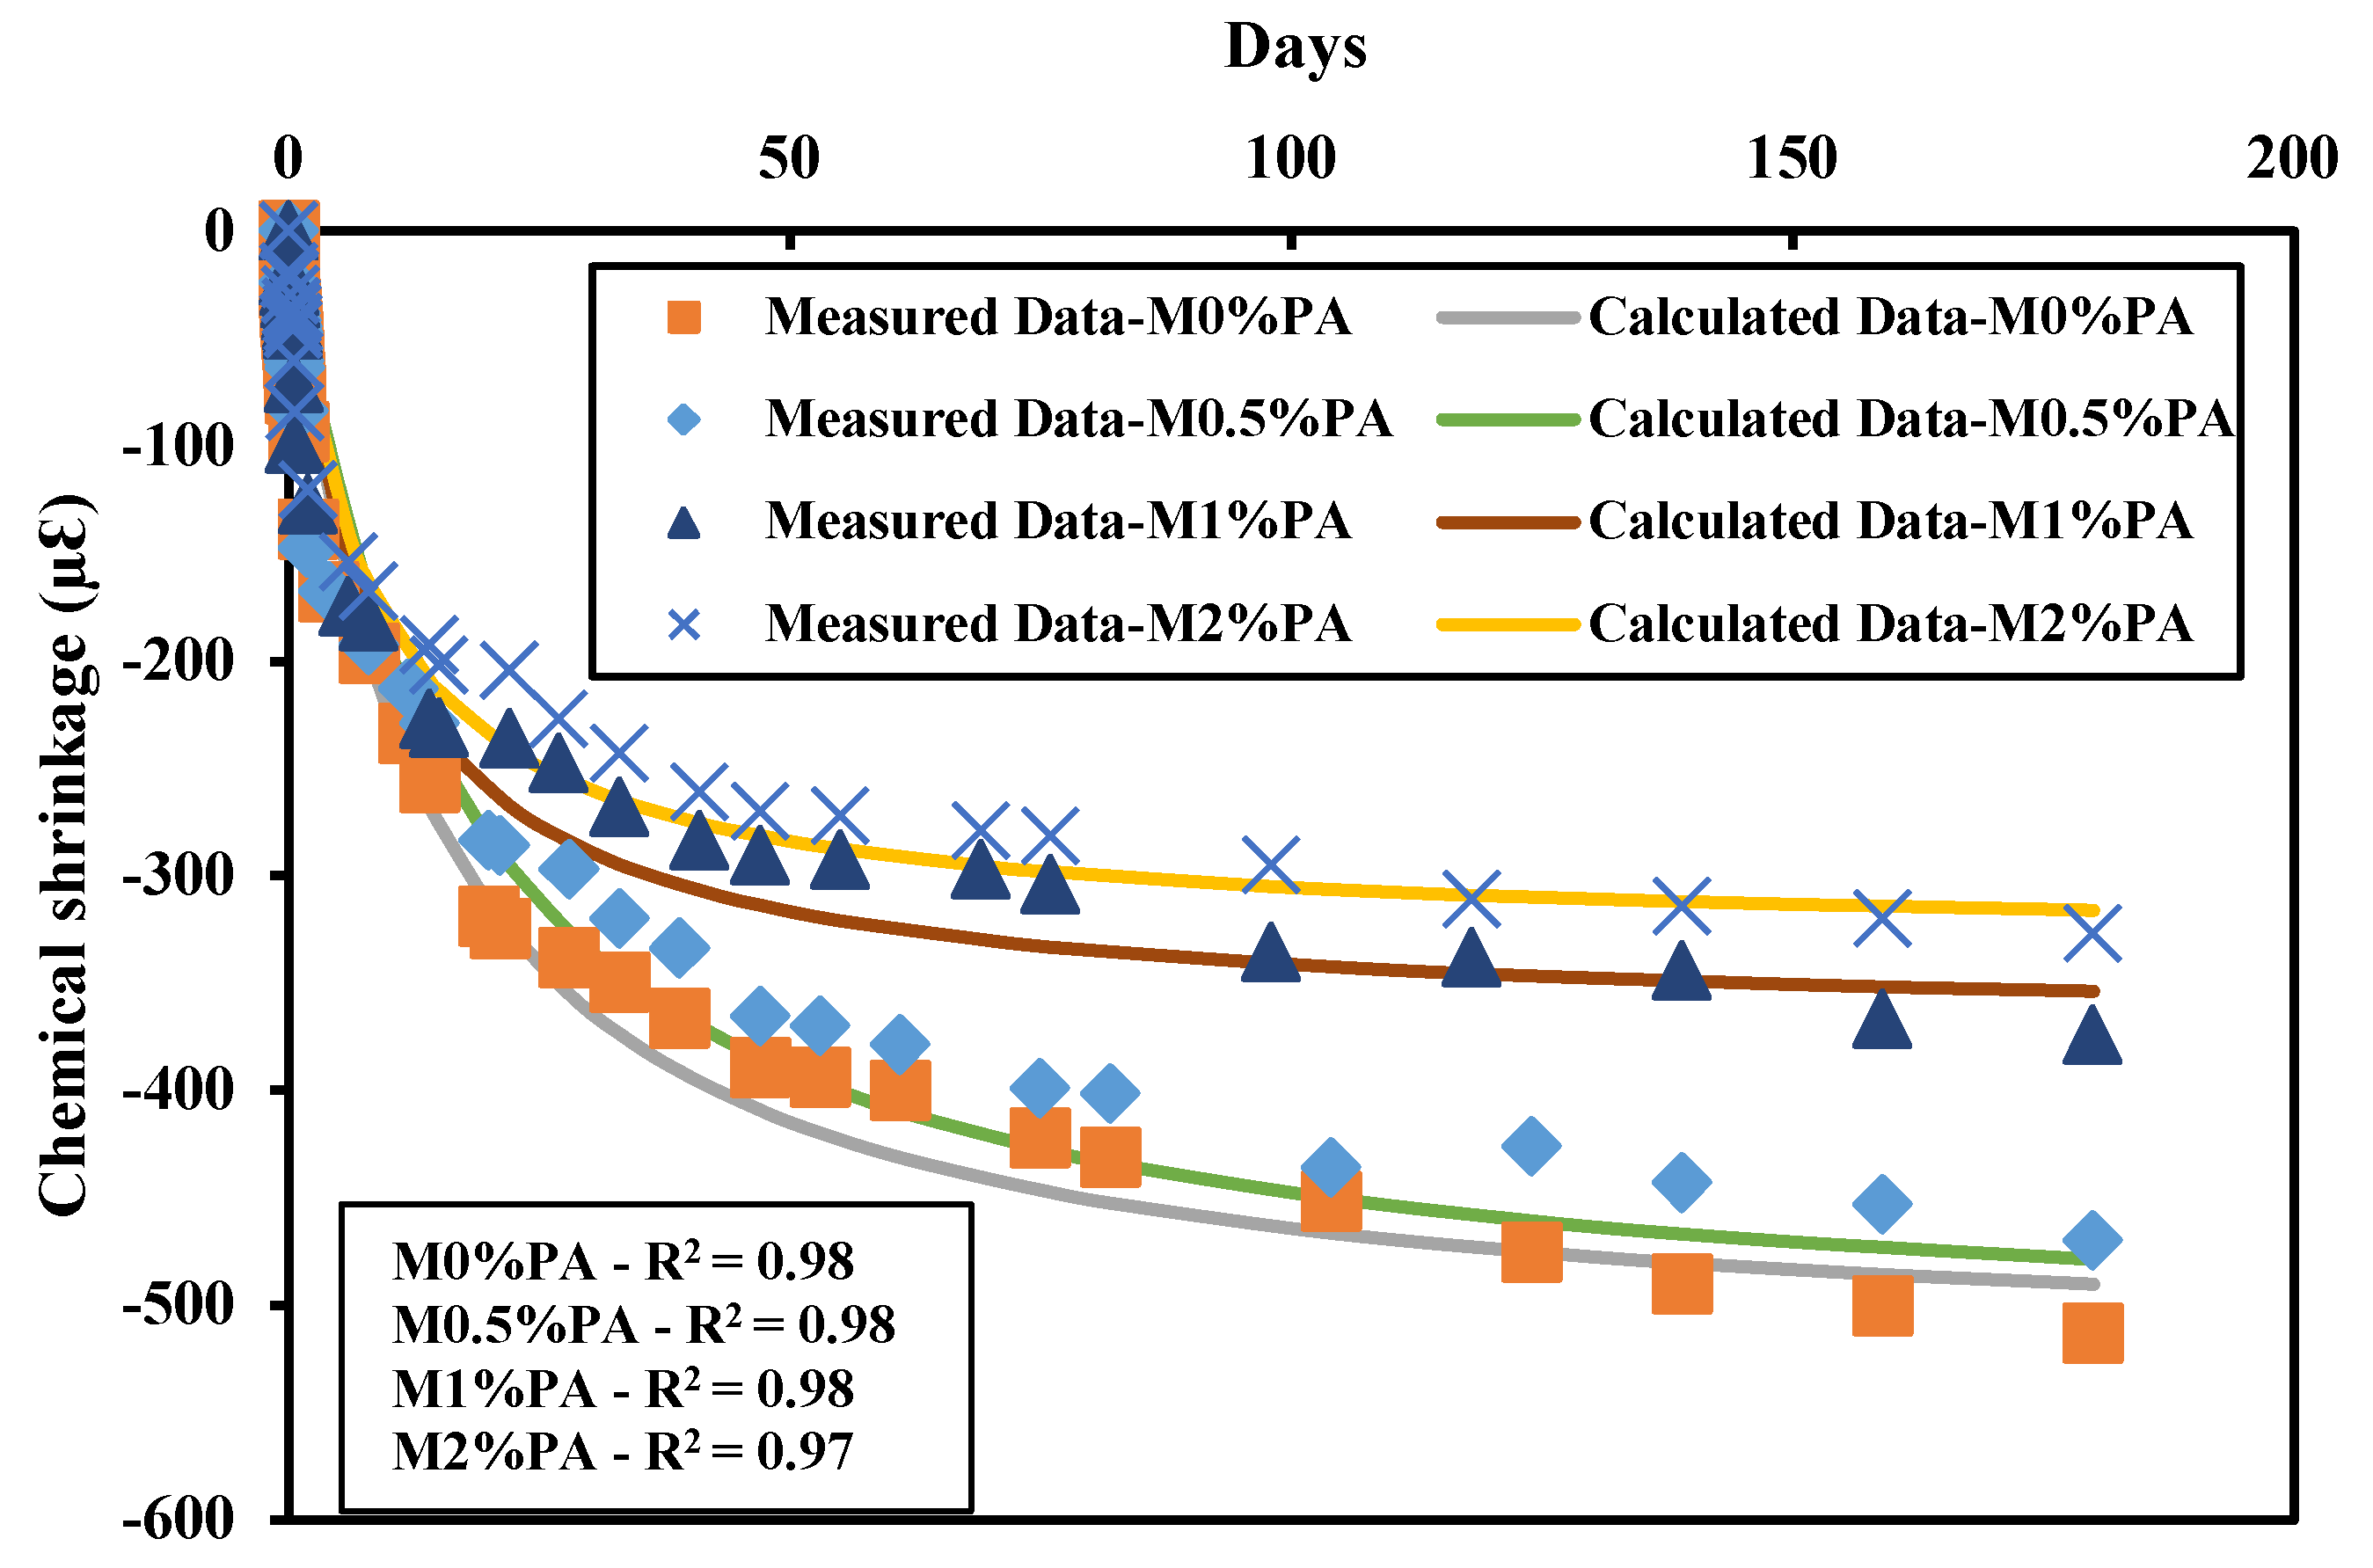
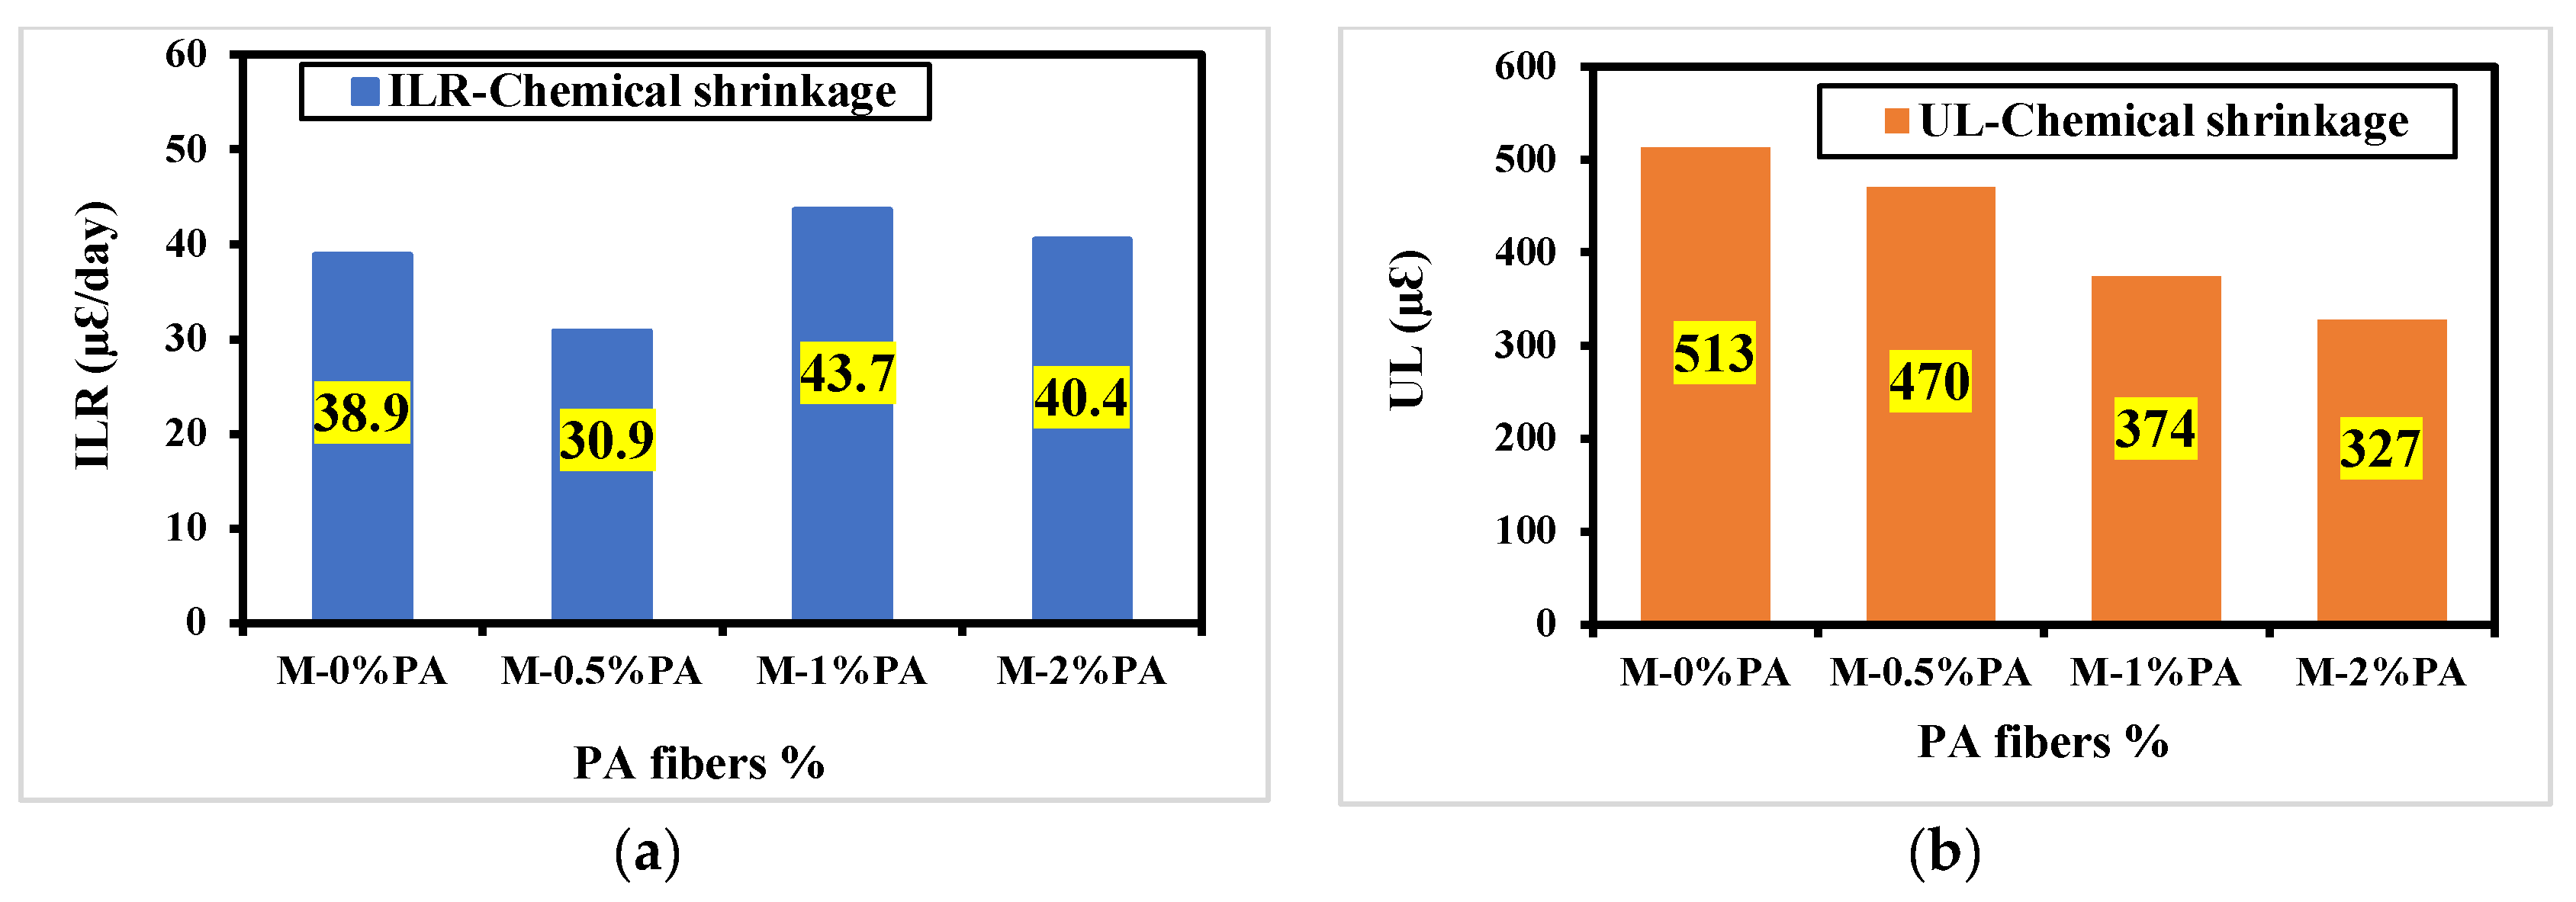
3.2.1. Chemical Shrinkage

The results of chemical shrinkage for mortar samples are plotted in Figure 7. As displayed, the development of chemical shrinkage decreases with the increase in PA fibers. For example, at 180 days, the chemical shrinkage attains a value of 470 µε, 374 µε and 327 µε for the addition of 0.5, 1, and 2%PA fibers. This represents an 8.4%, 27% and 37% decrease compared to the control mix.
The decrease in chemical shrinkage with the addition of PA fibers can be attributed to their ability to enhance matrix rigidity through bonding, thereby reducing the chemical process of cement. Alkali treatment of wood components, such as lignin and hemicellulose, leads to their dissolution, facilitating interfacial interaction between the fiber and matrix [57]. This in turn increases the effective surface area available for contact with the matrix and promotes load transfer between the matrix and reinforcing fibers. Bessadok et al. [49] reported a reduction in fiber radius following chemical treatment, supporting this observation. Additionally, the chemical components present in PA fibers delay the initial hydration of cement. These chemical reactions generate acids, which are subsequently neutralized by hydroxyl ions derived from the hydrated cement reaction [56,58].
To quantitatively compare the influence of PA fibers on mortar, chemical shrinkage characteristics were assessed using the hyperbolic model, proposed earlier. The calculated chemical shrinkage data were overlaid into the measured data, revealing a favorable fit of the model to the actual results. The experimental analysis of chemical shrinkage data yielded high R2 values ranging between 0.978 and 0.99, indicating a strong fit of the proposed model to the observed data.
In Figure 8, the ILR-chemical shrinkage and UL-chemical shrinkage plots reveal the influence of PA fibers on the material’s behavior. The rate of chemical shrinkage exhibits an ascending trend with increasing PA fiber content, reaching an optimum at approximately 1% fiber inclusion. For example, the ILR increases from 38.9 µε/day in the control mix to 43.66 µε/day in the mix containing 1% PA fibers. This initial increment can be attributed to the fibers ability to obstruct material movement during early drying stages. This will lead to an increase in the shrinkage rates due to internal stresses within the material. The UL reduces from 513 µε in the control mix to 327 µε with the addition of 2% PA fibers. This decrease is likely influenced by factors such as the increased fiber surface area, water absorption, swelling behavior, and potential alignment and restraining effects of the fibers. The greater fiber surface area contributes to accelerated chemical reactions, resulting in higher initial shrinkage rates, while water absorption and swelling behavior may also play a role in this trend [41,42].

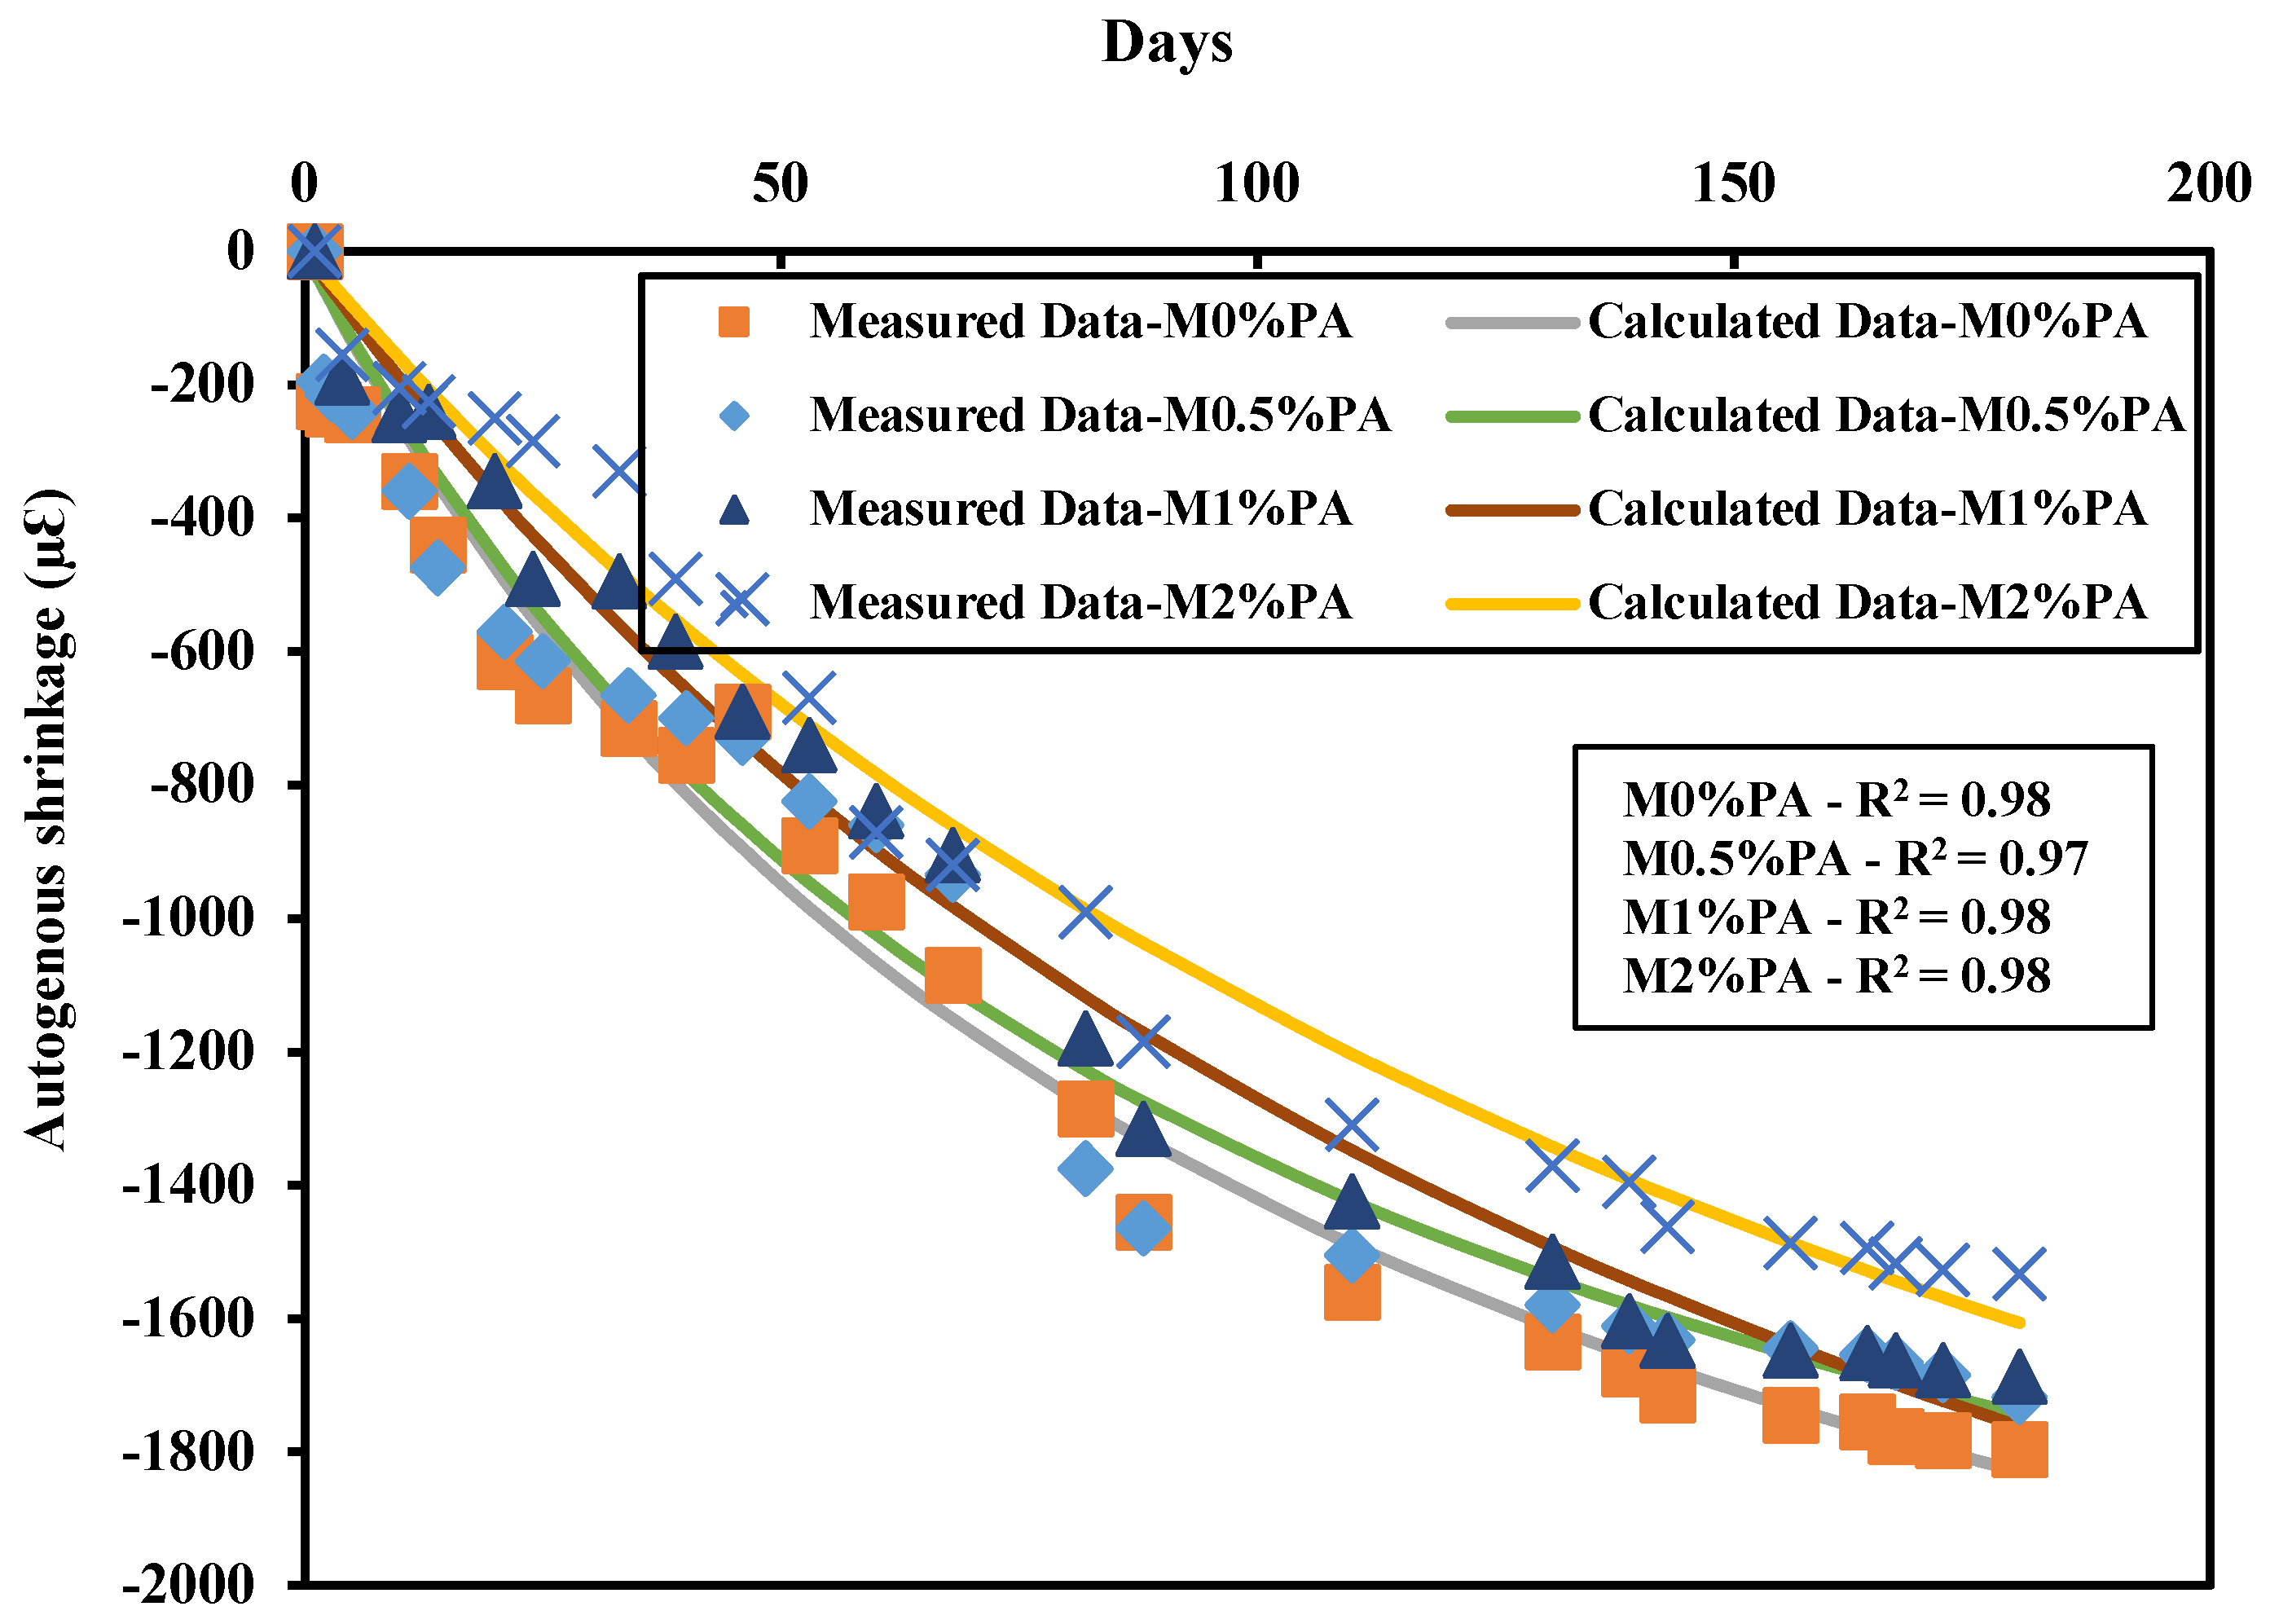
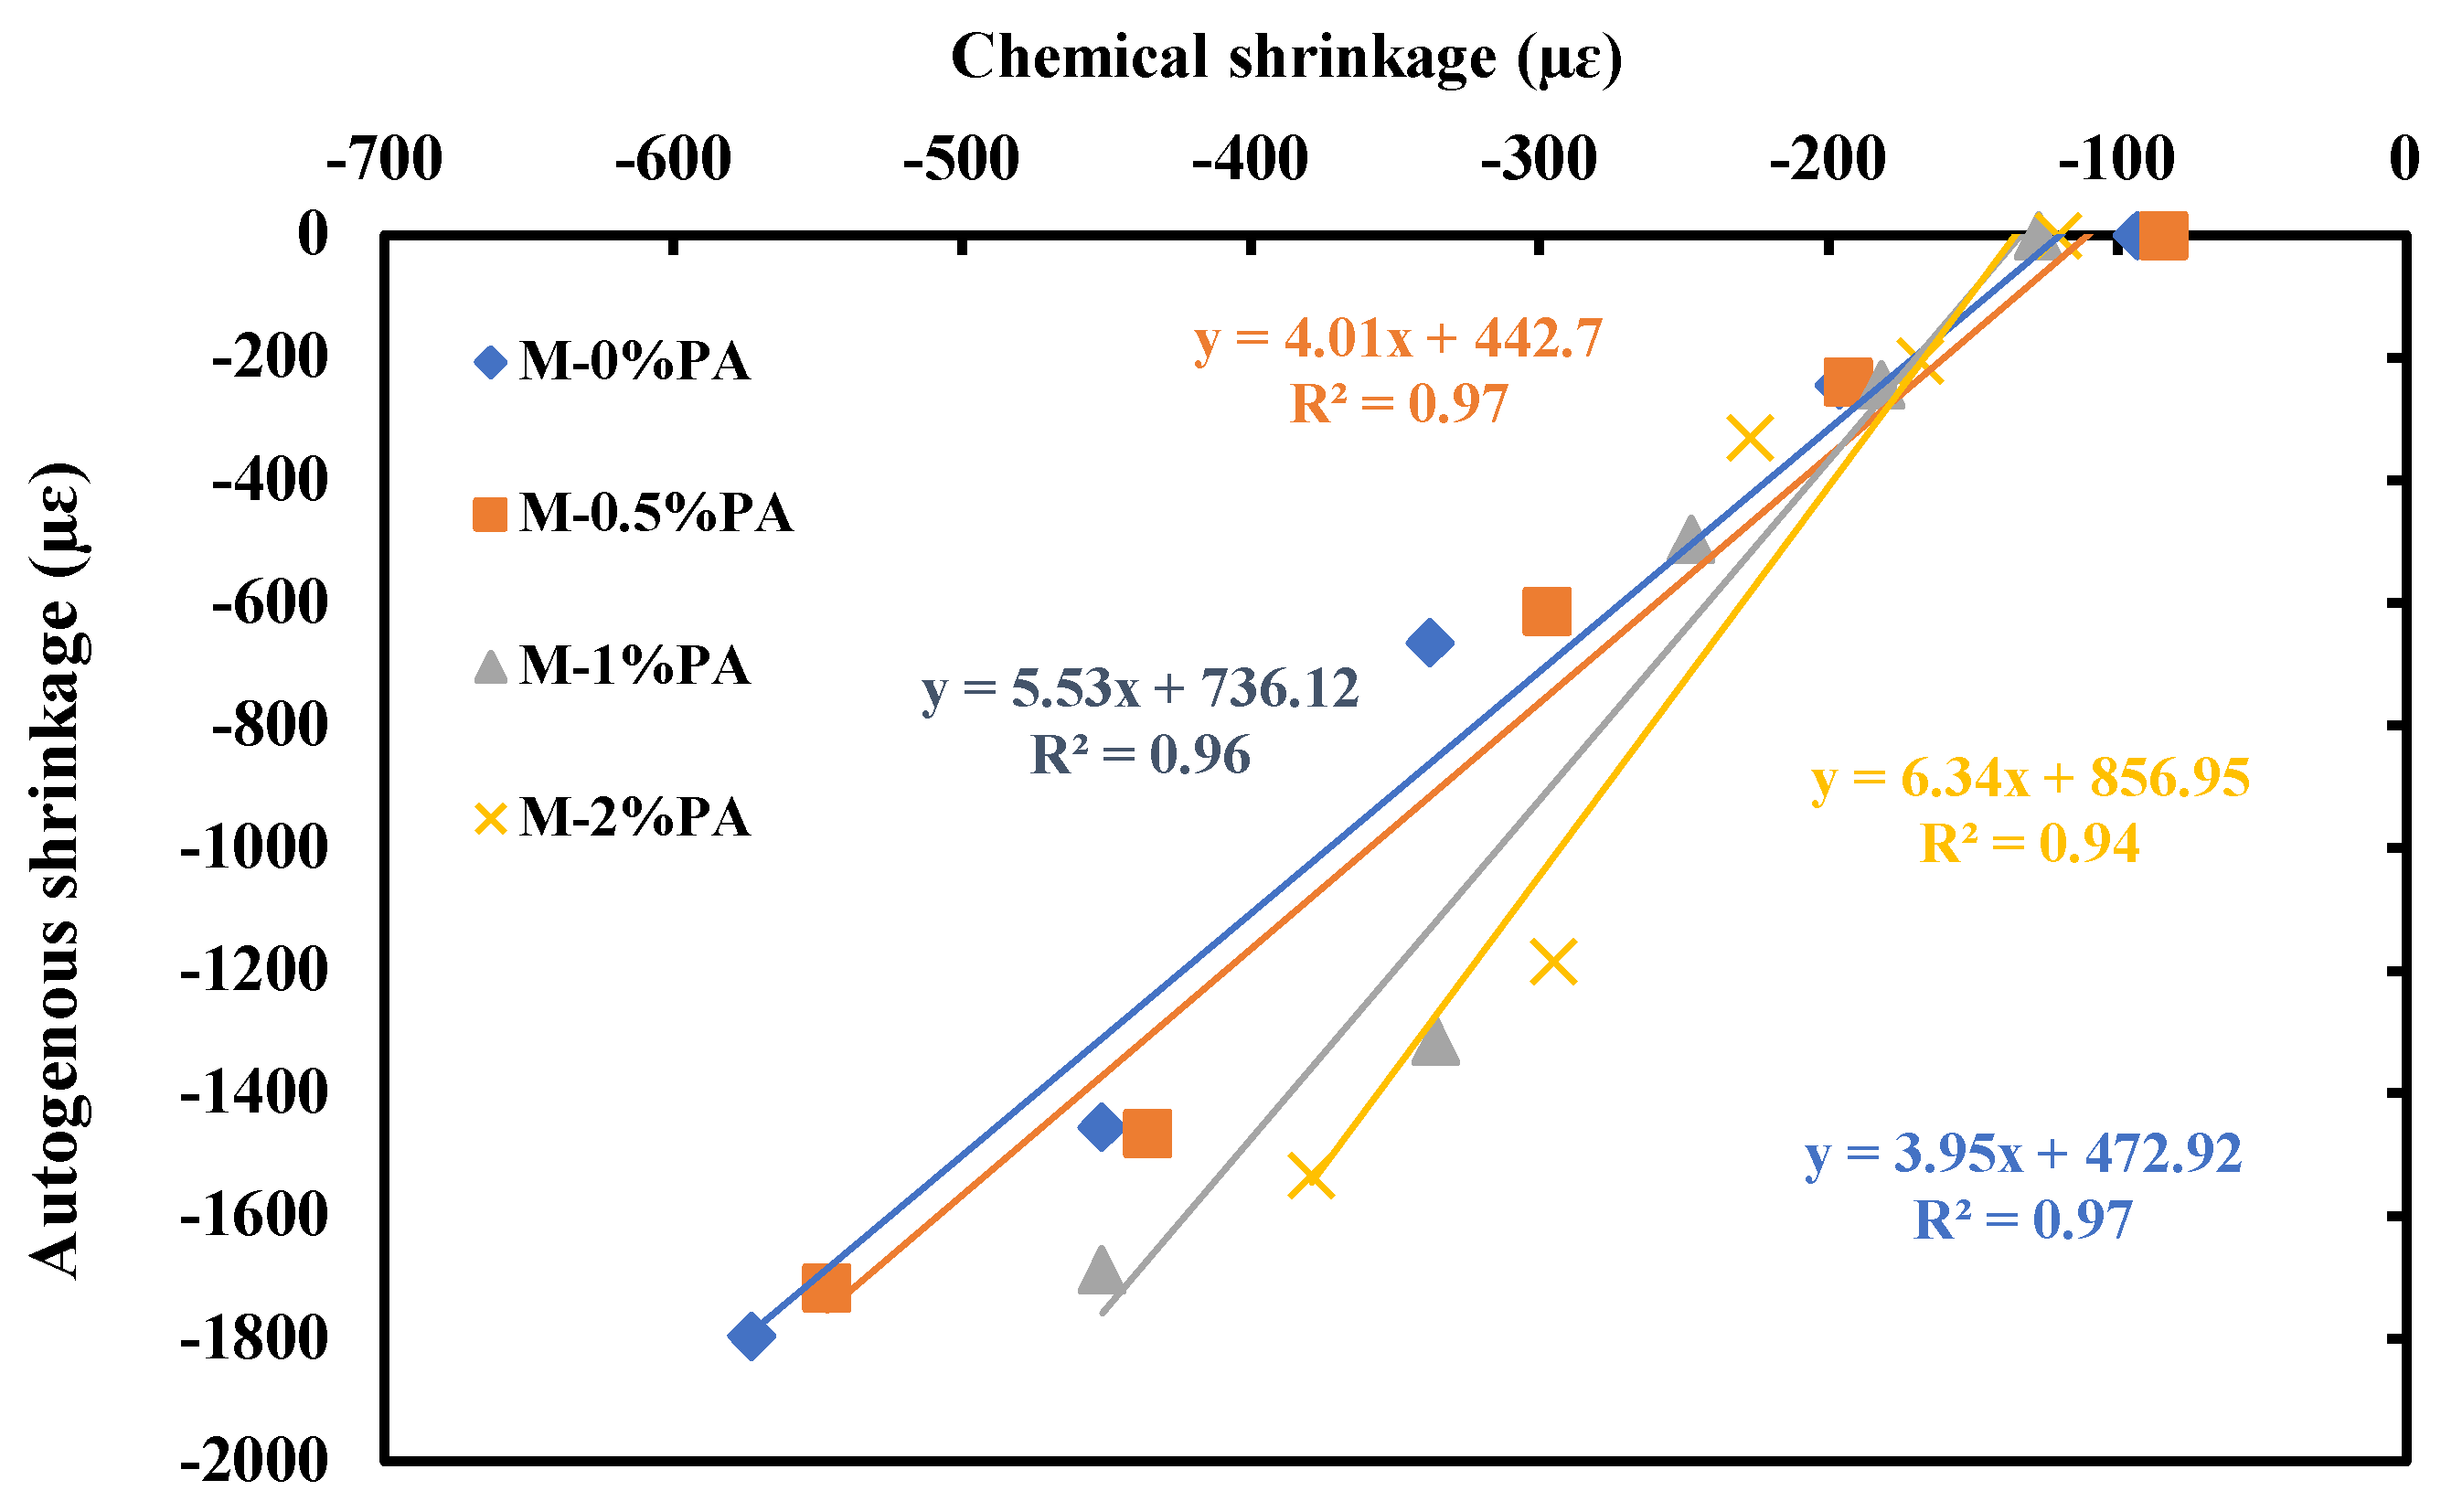
3.2.2. Autogenous Shrinkage

The analysis of autogenous shrinkage data is presented in Figure 9. As shown, the mortar including PA fibers undergone less autogenous shrinkage at all specimen ages. For example, at 180 days, the autogenous shrinkage values reach 1796, 1717, 1687, and 1534 µε for samples with 0%, 0.5%, 1%, and 2% PA fibers, respectively. The autogenous shrinkage percentage decrease in mortars is 15% compared to the control mix. The lower values observed in the samples containing PA fibers were attributed to the presence of excess water from these fibers during the early stages of hydration. This water compensated for the moisture loss caused by the cement hydration reaction [58], thereby reducing surface tension and van der Waals forces, and ultimately decreasing shrinkage [59]. Moreover, the natural fibers played a crucial role in bridging microcracks within the matrix, preventing their propagation and further reducing autogenous shrinkage [50].
It should be noted that natural fibers generally possess two types of pores: larger pores (lumens) and micropores (cell walls), which aid in moisture transportation. These pores enable moisture diffusion between nanopores and cell walls, as well as capillary flow along lumens [52]. The behavior of PA fiber in a chemical solution is more complex than in pure water, as cement-based materials’ pores contain an alkaline solution [49,50,51]. Consequently, the expansion or contraction of fiber cell walls is influenced by pore water ions, impacting fluid transport [52]. Moreover, the semi-permeable nature of fiber cell membranes results in osmotic pressure generated by the hydration reaction, affecting water movement from fibers to the binder and influencing the internal curing process.
To discern the autogenous shrinkage behavior, the measured data points were fitted using same model, and the resulting calculated autogenous shrinkage plots were compared to the actual data. The plots demonstrate a strong agreement between the model and the measured data, with high coefficient of determination (R2) values of 0.982, 0.972, 0.988, and 0.983 for mixtures containing 0%, 0.5%, 1%, and 2% PA fibers, respectively. This strong correspondence confirms the reliability of the employed model in accurately representing the relationship between the variables.
Observing the impact of PA fibers on the initial rate of length change (ILR) and ultimate length (UL) of autogenous shrinkage characteristics holds significant importance. As depicted in Figure 10, the ILR for the control mix at day 1 is 27.57 µε/day. However, upon introducing 2% PA fibers, this value significantly decreases to 16.974 µε/day. Similarly, the control mix demonstrates the highest UL value of 1829.93 µε/day, which diminishes to 1604.93 µε/day when 2% PA fibers are incorporated at 180 days. These findings indicate that the addition of PA fibers reduces the initial rate of length change (ILR) and restrains the ultimate length (UL) of autogenous shrinkage. As a result, the incorporation of PA fibers effectively mitigates early-age volume changes and contributes to the long-term control of shrinkage in the material [60].

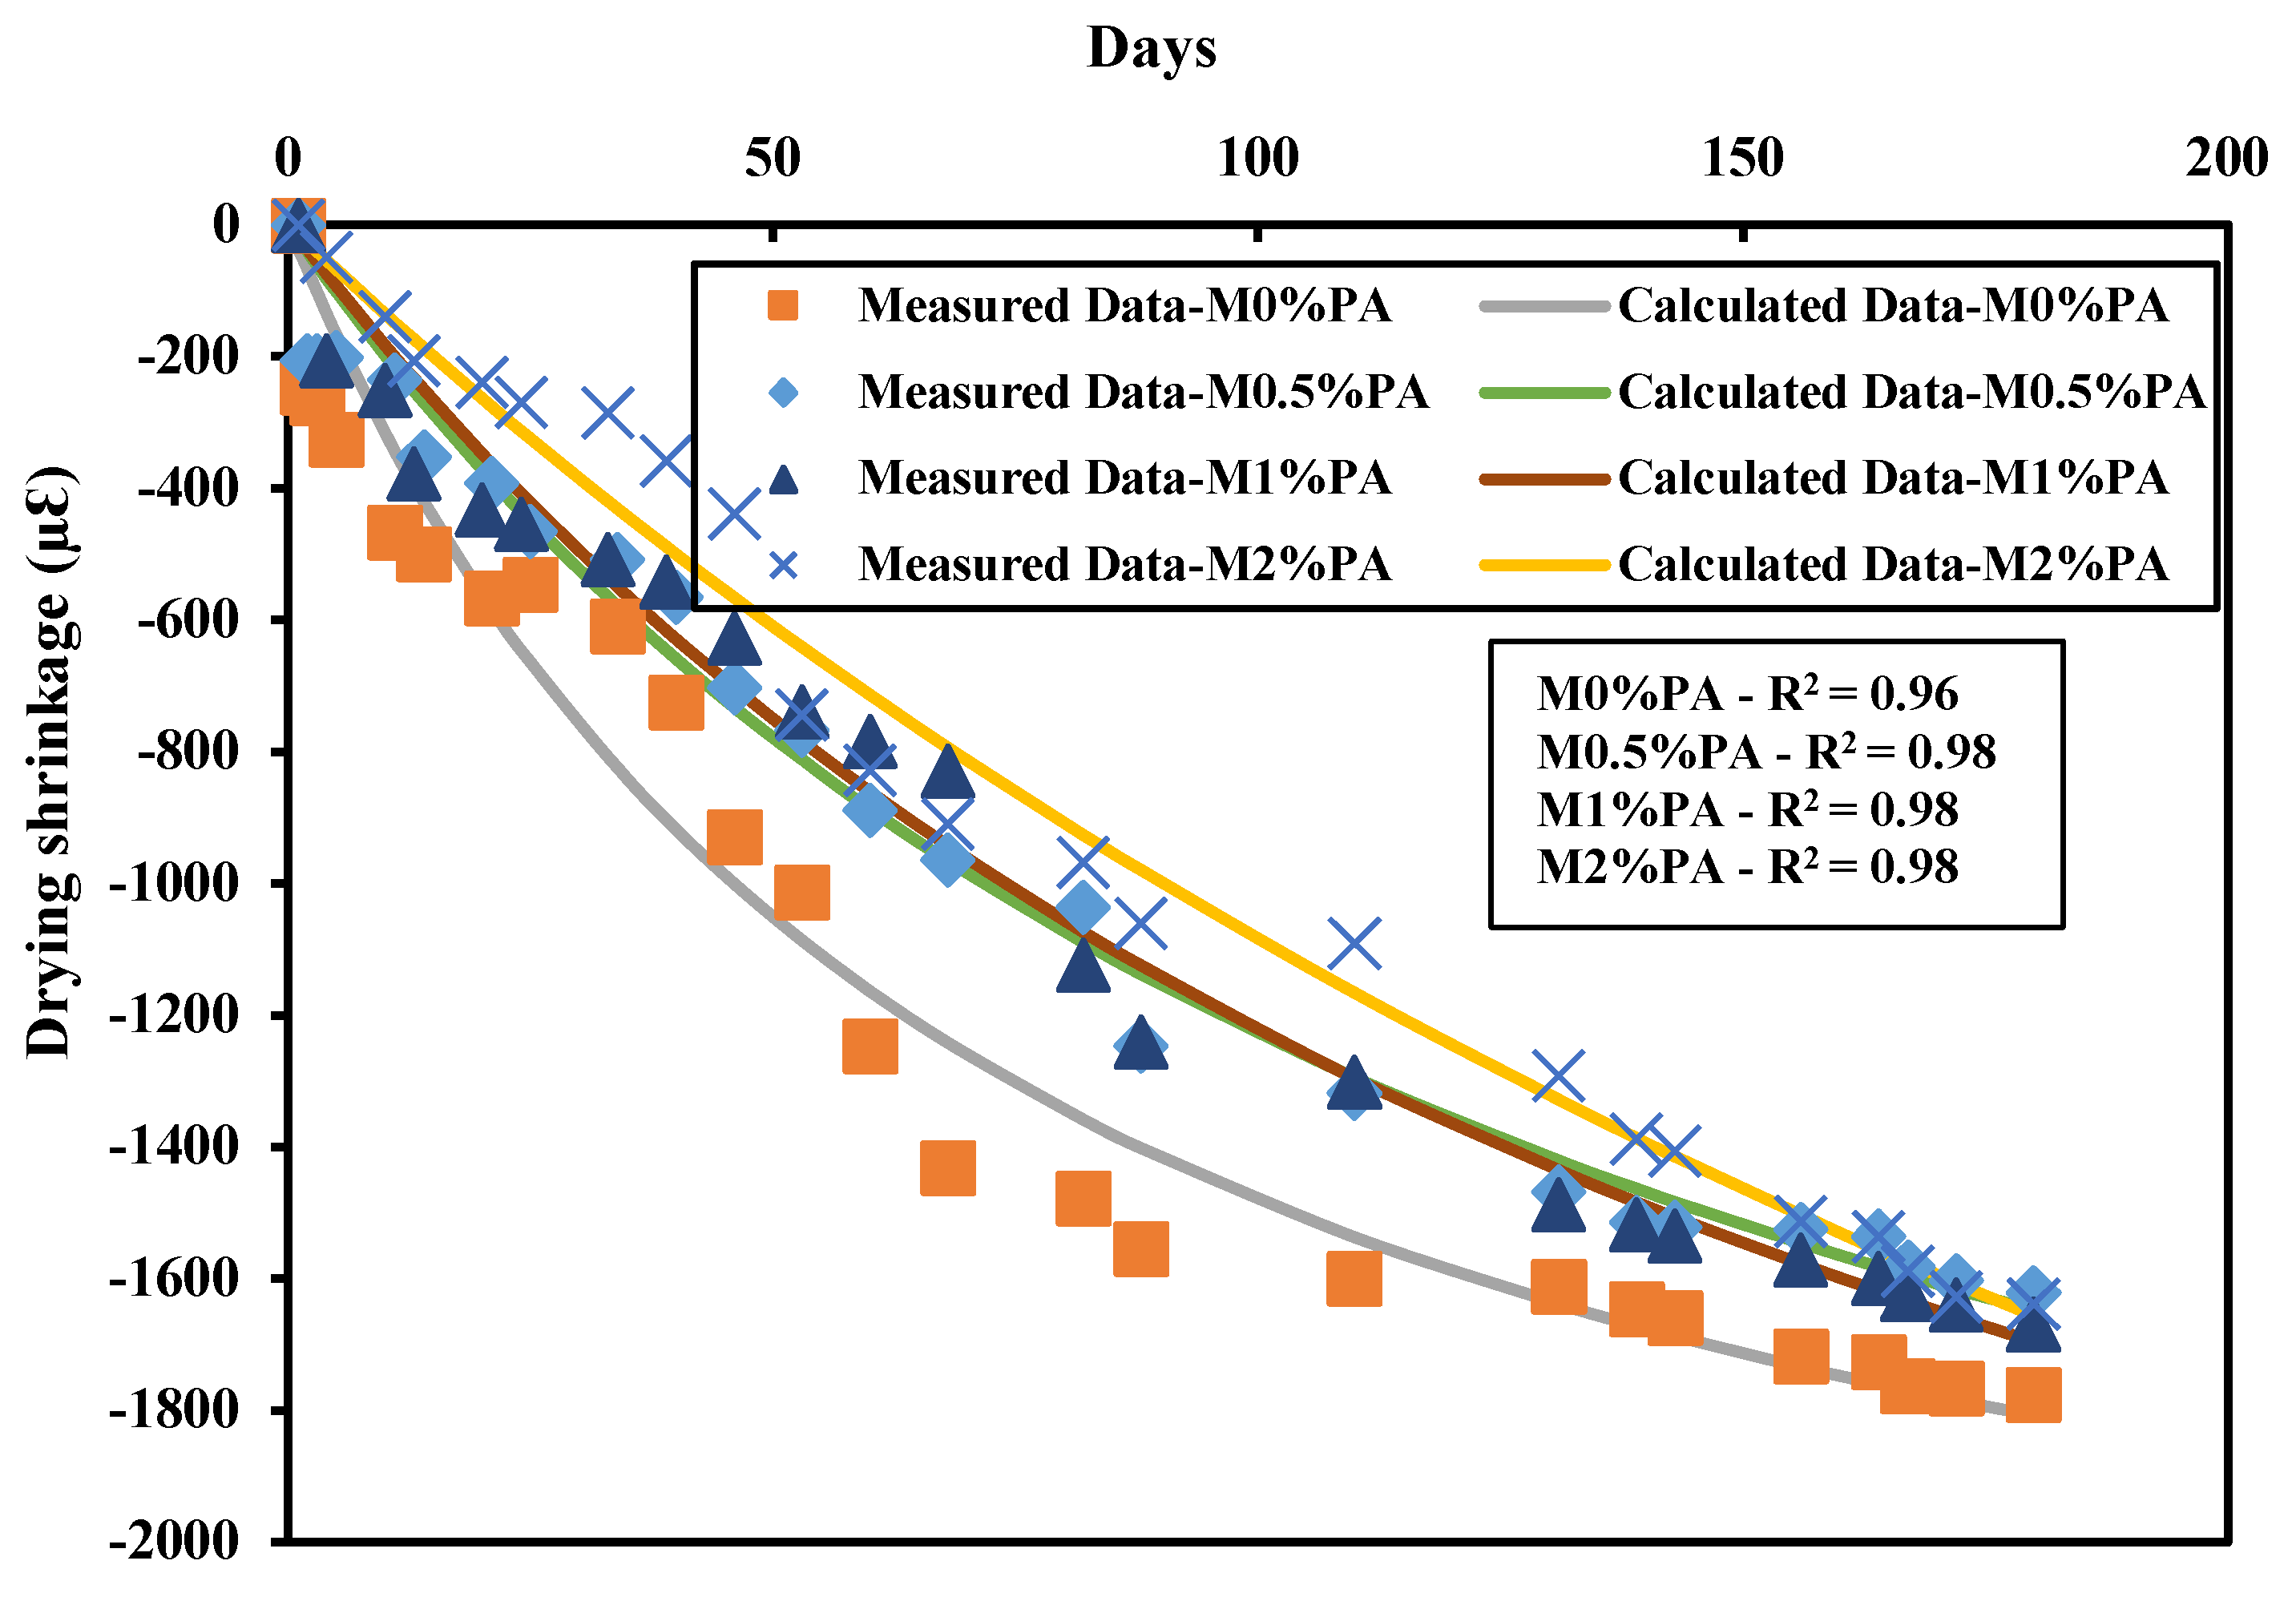
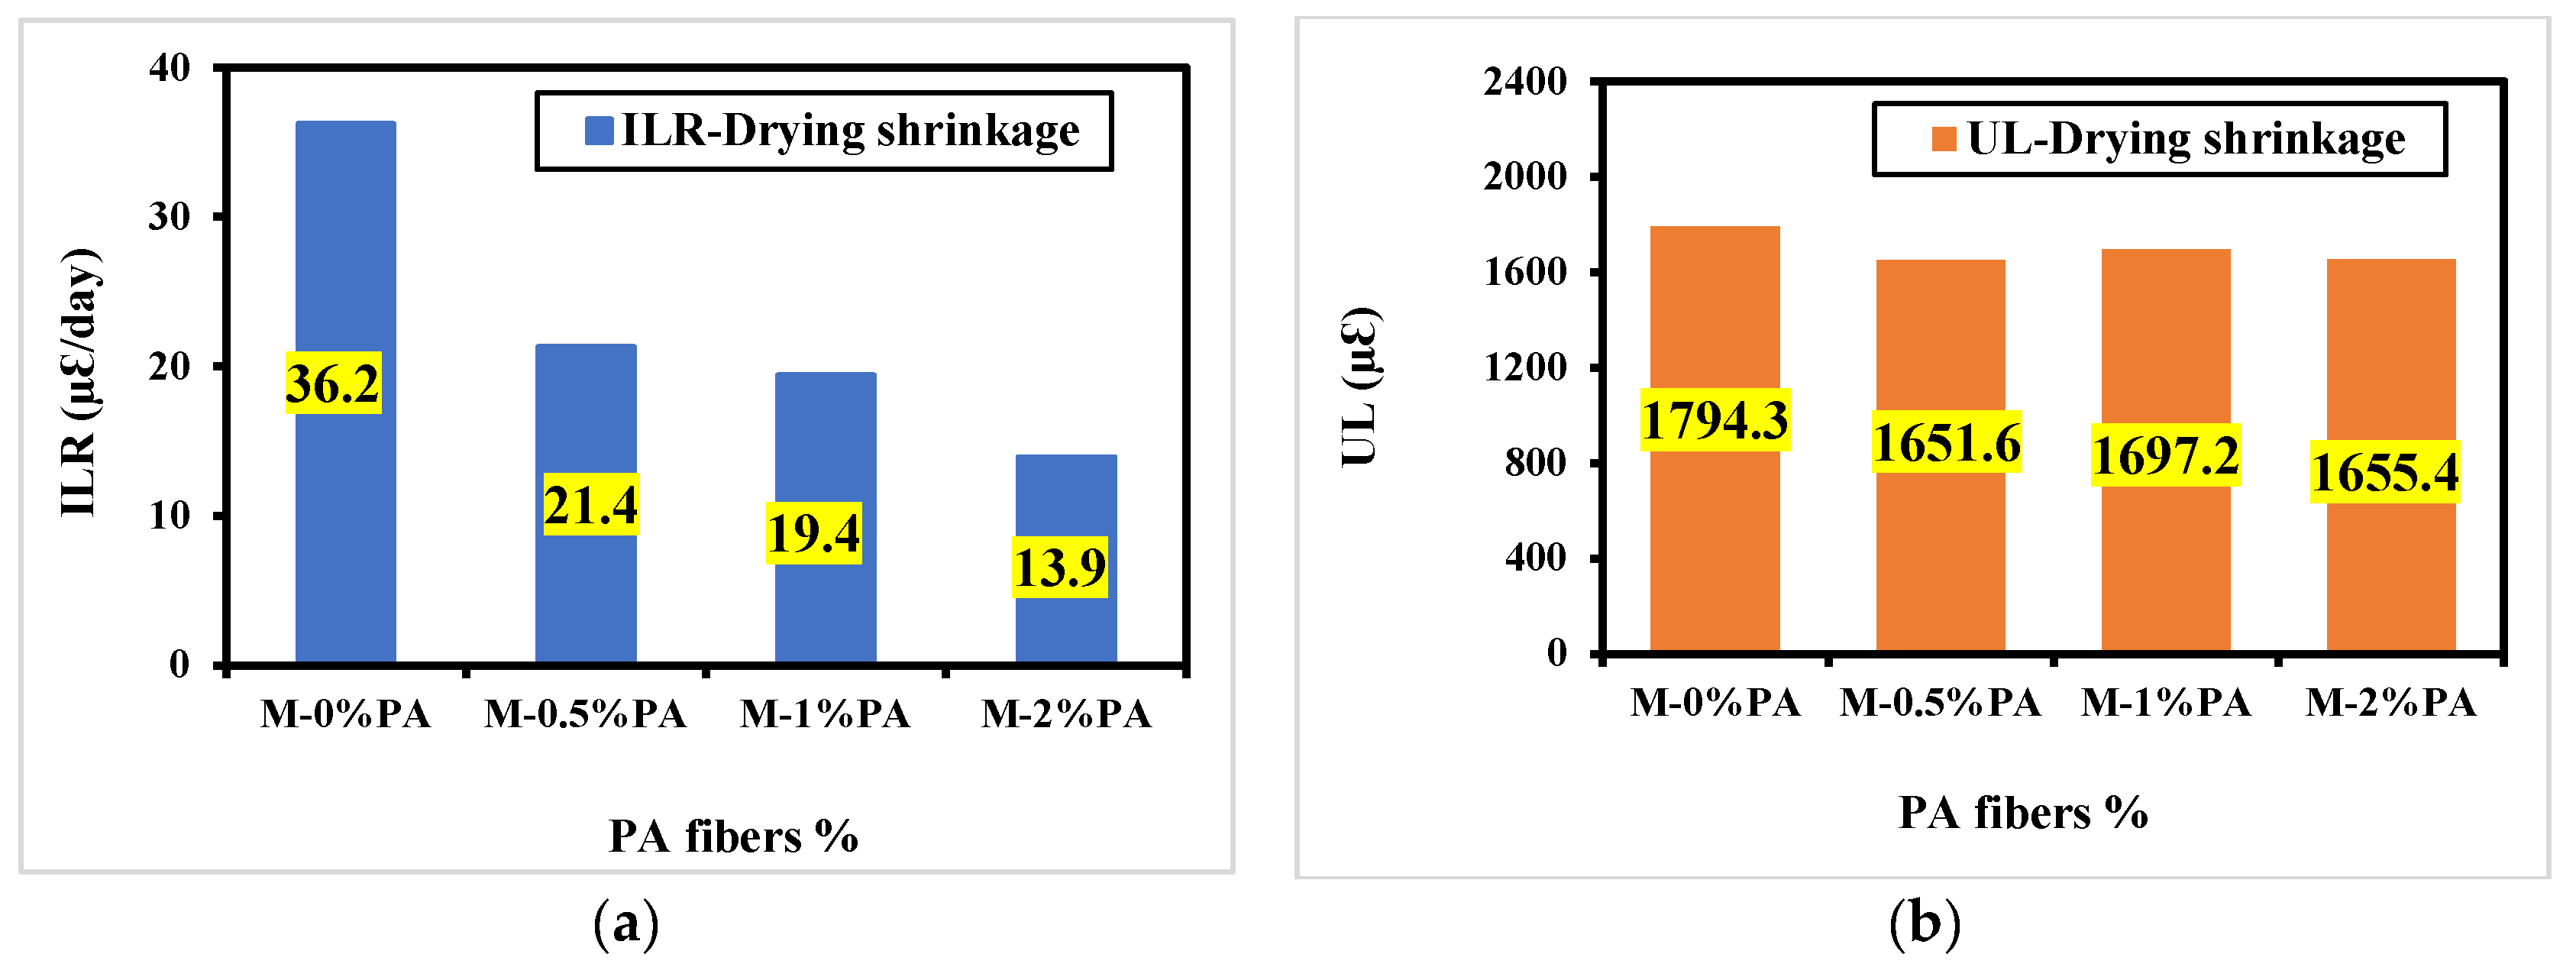
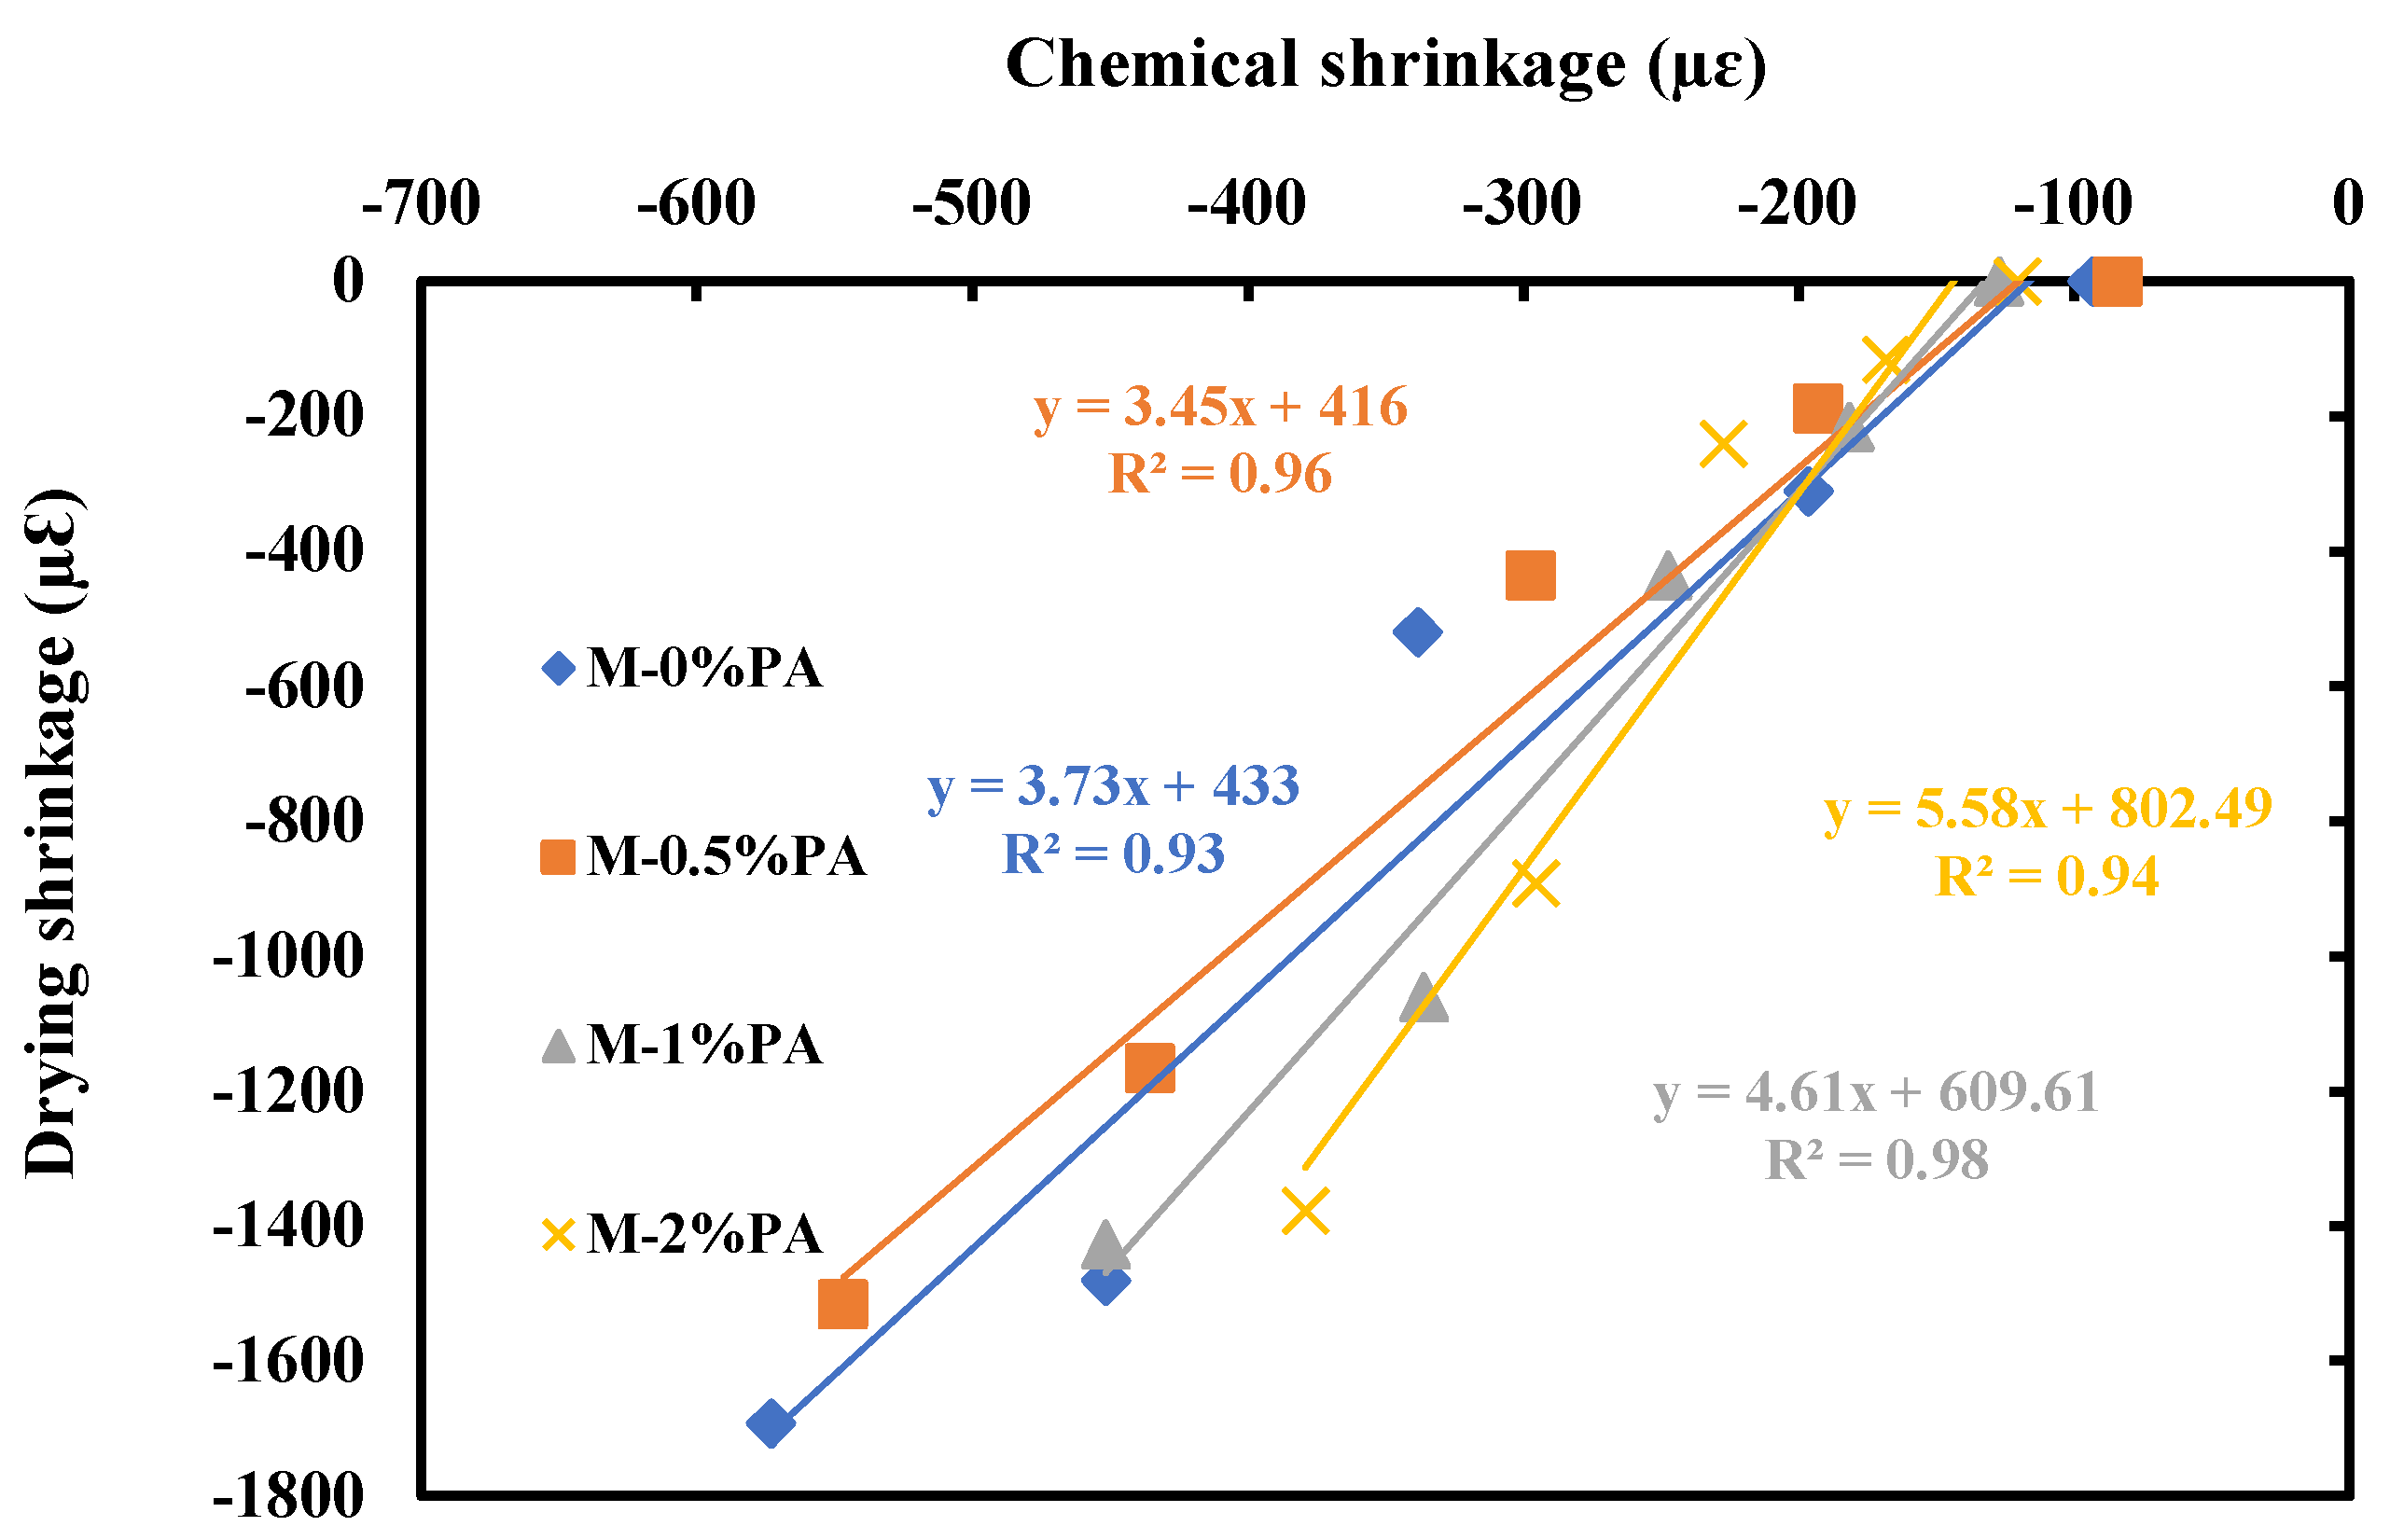
3.2.3. Drying Shrinkage
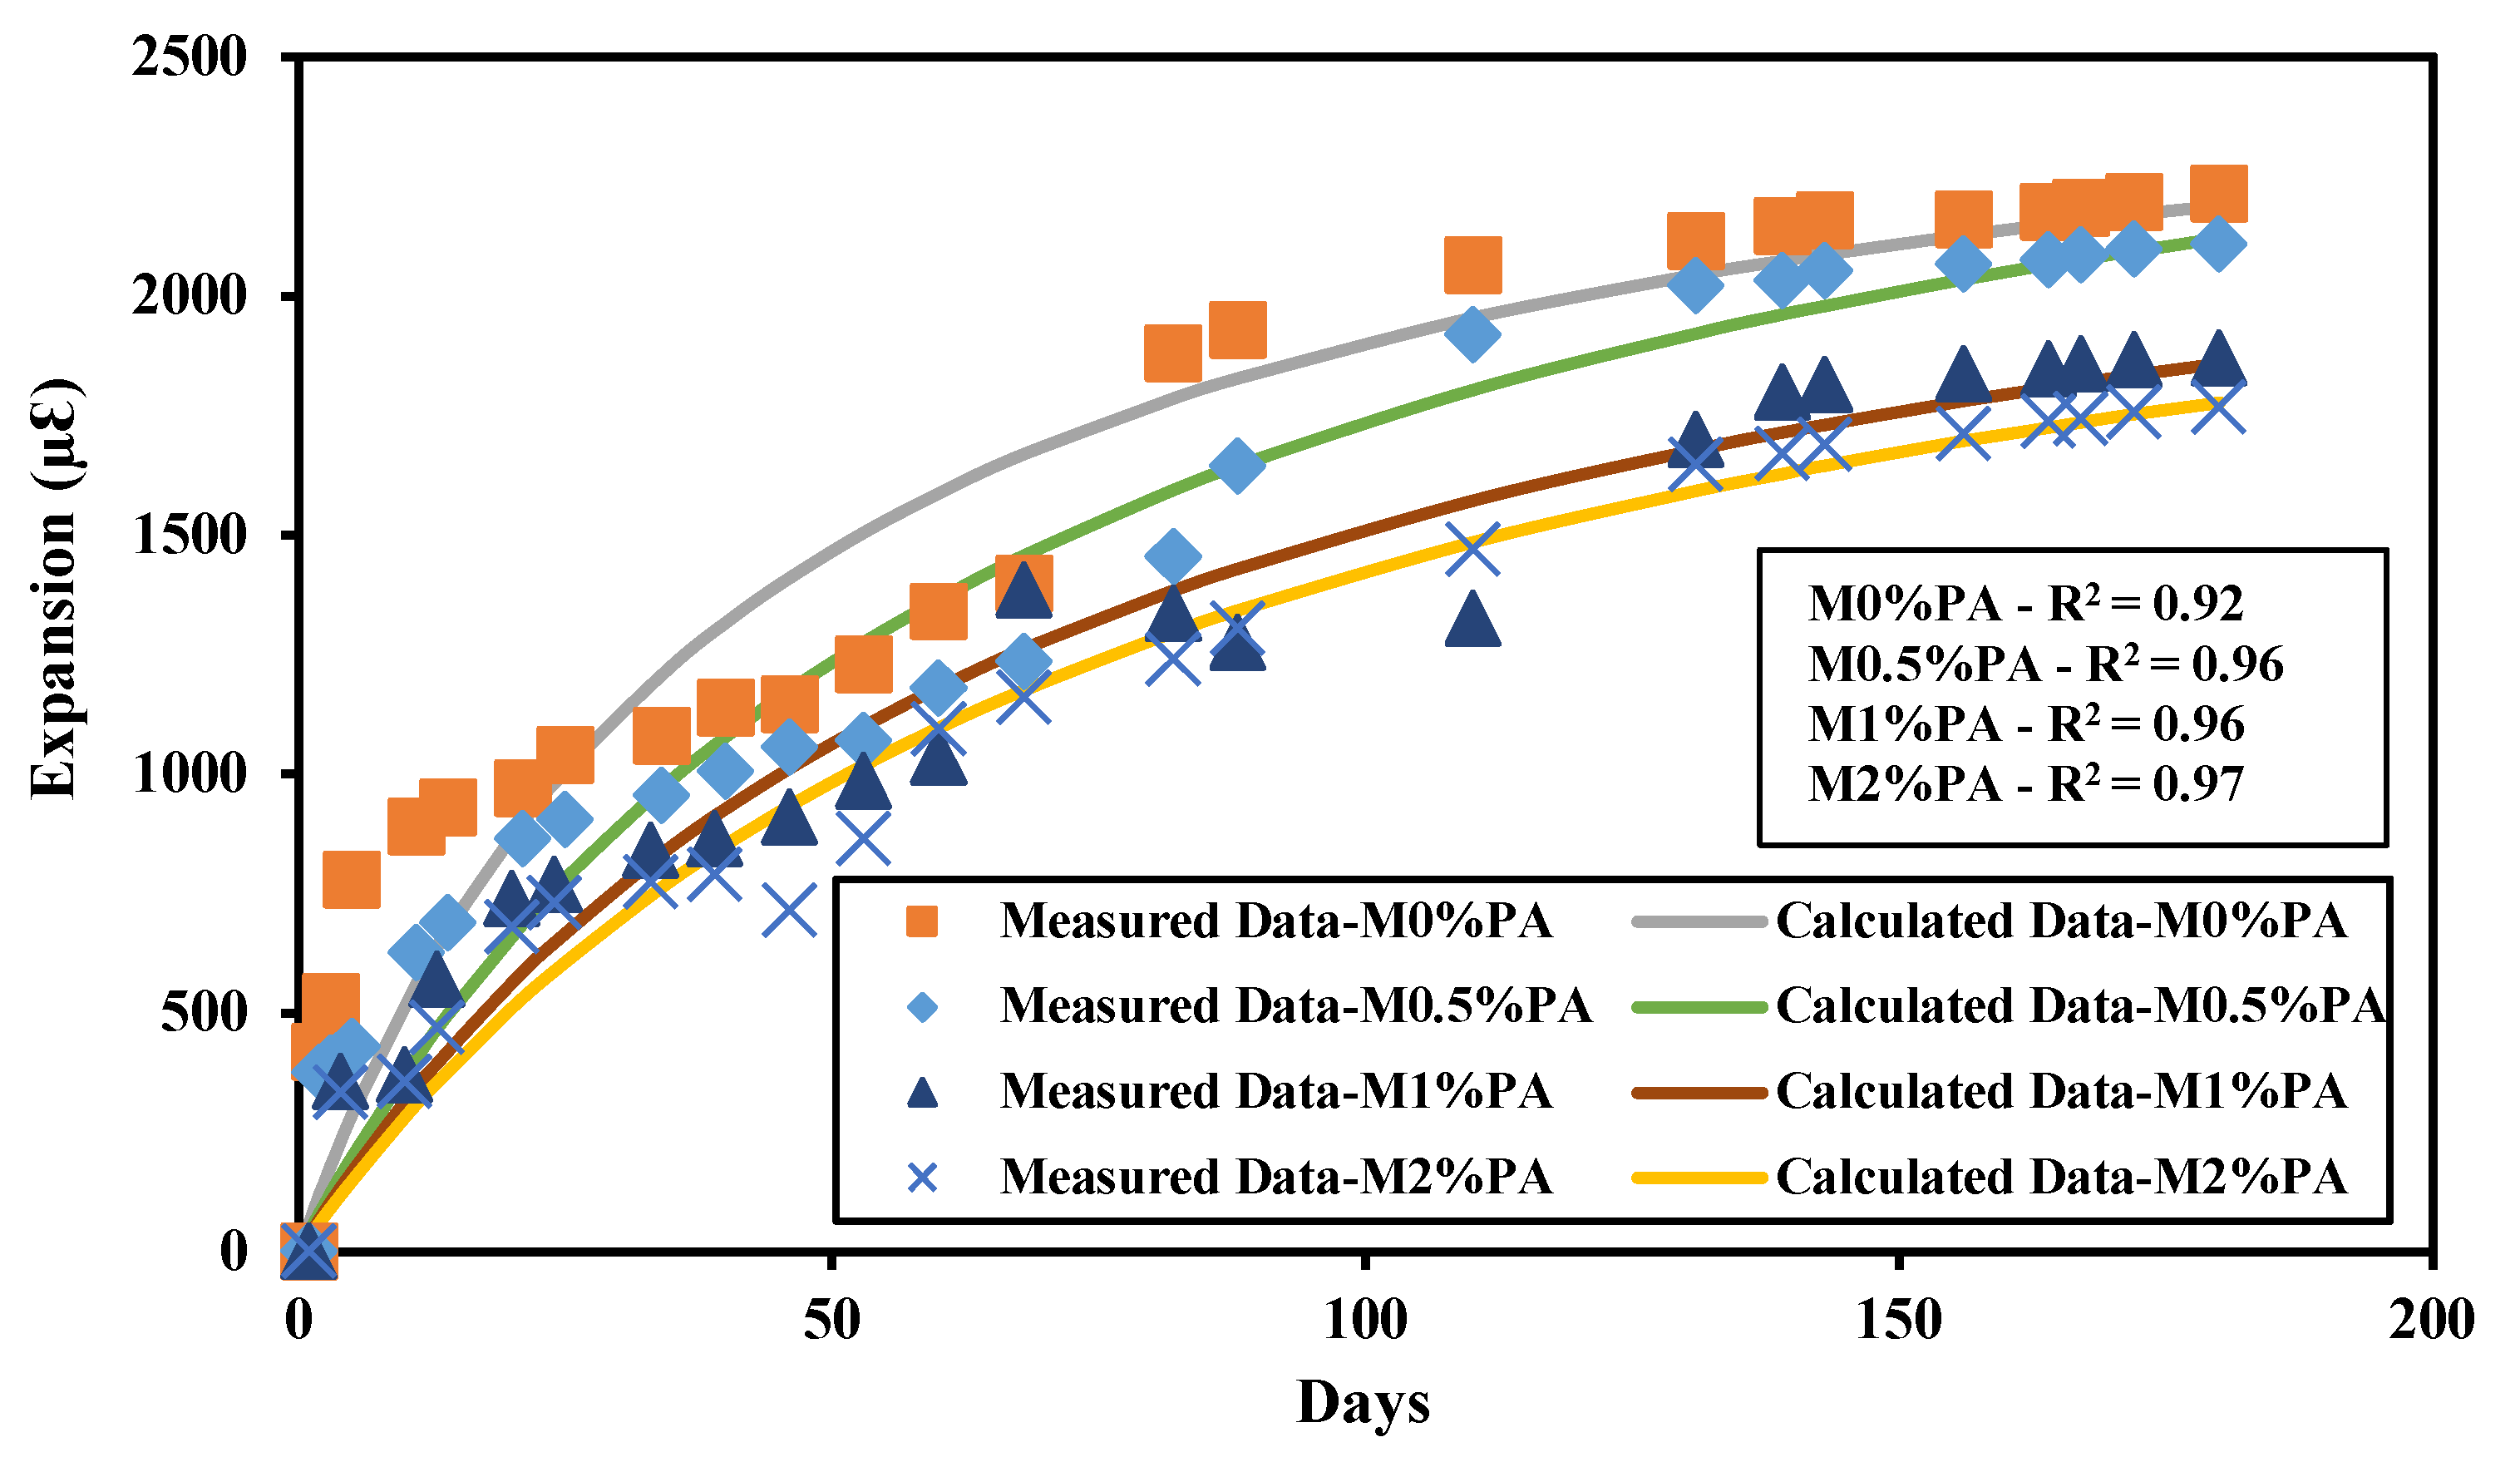
The drying shrinkage behavior of mortar samples with the addition of PA fibers is displayed in Figure 11. The results demonstrate a significant reduction in drying shrinkage with increasing volume fraction of PA fibers, and this decrease was found to be progressive with higher fiber content. For example, at 180 days, the drying shrinkage of mortars containing 0.5%, 1% and 2% decreased by 11%, 16%, and 19% compared to the control mix. This reduction can be attributed to the fibers’ ability to enhance the bond strength between the fibers and the matrix, effectively restraining the physical shrinkage [46,47] and preventing crack formation [52]. Although bio fibers have a hydrophilic nature leading to poor adhesion with the matrix, this issue can be addressed through chemical treatment of the fibers as previously reported [54]. The treatment results in a smoother fiber surface, and the alkalization process leads to clearer pores, possibly due to the removal of waxy substances and impurities from the fiber surface. Alkali treatment also induces fibrillation and cellular collapse of fiber bundles, resulting in better cellulose chain packing and increased effective surface area for interaction with the wet matrix [55,56].
Furthermore, the experimental data for drying shrinkage characteristics exhibit a high coefficient of determination (R2), indicating a strong fit of the data to the model. The R2 values ranging from 0.968 to 0.988 are observed for the addition of 0%, 0.5%, 1%, and 2% PA fibers, respectively. This high level of correlation between the experimental results and the model underscores the reliability and accuracy of the model predictions across different PA fiber content levels. This may provide valuable insights into mortar shrinkage behavior and the effectiveness of PA fibers in reducing drying shrinkage.
The effect of PA fibers on both the ILR and UL reveals a consistent trend as observed in Figure 12. The parallel decrease in ILR and UL with the incorporation of PA fibers suggests that these fibers play a vital role in mitigating drying shrinkage. For example, in the control mix, the initial rate of length change (ILR) was measured at 36.27 µε, while its value decreased to 13.94 µε upon incorporating 2% PA fibers. A similar pattern is observed for the UL characteristics, where the UL decreases from 1794.32 µε in the control mix to 1655.36 µε, with the addition of 2% PA fibers at 180 days. The reduction in ILR indicates that PA fibers effectively reduce early-age volume changes, while the diminishing UL demonstrates their ability to control overall drying shrinkage over time [40,41,42,43,52,60].

3.2.4. Expansion

Figure 13 presents the expansion behavior of mortar samples with the incorporation of PA fibers. The expansion decreases as the percentage of PA fibers increases. For instance, the control mix exhibits a value of 2215 µε after 180 days, which gradually decreases with the addition of 0.5% and 1% PA fibers, reaching its lowest value when 2% PA fibers are included (1767 µε). This reduction in expansion is primarily attributed to the presence of PA fibers, which hinder the hydration process of cement and limit its expansion. Additionally, alkali treatment has two significant effects on the surface of natural fibers [41,42]: firstly, it increases surface roughness, thereby improving interfacial adhesion between the fiber and matrix; secondly, it increases the amount of exposed cellulose on the fiber surface, promoting enhanced bonding between the polymer and fiber surface. Consequently, chemical treatment leads to favorable morphological and structural changes in the fibers, making them more robust and well structured, which, in turn, facilitates stronger bonds between PA fibers and the matrix. These strengthened bonds contribute to stiffer behavior in the presence of PA fibers, effectively restricting the expansion of mortars [40,41,42].
Through the process of fitting the expansion experimental data to the hyperbolic model, a strong alignment between the two curves is observed. The coefficient of determination (R2) yielded high values of 0.926, 0.962, 0.963 and 0.974 for mixes containing 0%, 0.5%, 1%, and 2% PA fibers, respectively. These notable R2 values indicate a strong correlation between the hyperbolic model and the observed expansion data for the various fiber mixtures. This alignment validates the suitability of the hyperbolic model in capturing the expansion characteristics of the studied materials.
The plots for the ILR and UL for the expansion characteristics are displayed in Figure 14. These plots provide valuable visual representations of the ILR and UL values across different fiber mixtures. The ILR graph reveals the highest value of 64.14 µε/day for the control mix, gradually decreasing to 31.77 µε/day at day 1 for mortar mix with 2% PA fibers. Similarly, the UL values show a consistent decrease as % of PA fibers increase in the mix. For example, at 180 days, the control mix has a value of 2191.6 µε. This value decreases up to 1789.96 µε with the inclusion of 2% PA. These graphical illustrations serve as essential supplements to our hyperbolic model analysis, providing a clear and concise overview of the expansion behavior of the studied materials. These findings indicate that PA fibers serve as crack arresters, distributing stresses more evenly and reducing crack propagation during drying and setting [48,51]. By mitigating shrinkage and providing a restraining effect, PA fibers contribute to a more controlled and gradual expansion. Their presence enhances cohesion and internal bond strength, resulting in a stronger structure capable of withstanding expansion forces. Moreover, PA fibers act as reinforcements within the mortar matrix, absorbing and redistributing stresses, leading to improved expansion behavior and enhanced durability [40,41,42].

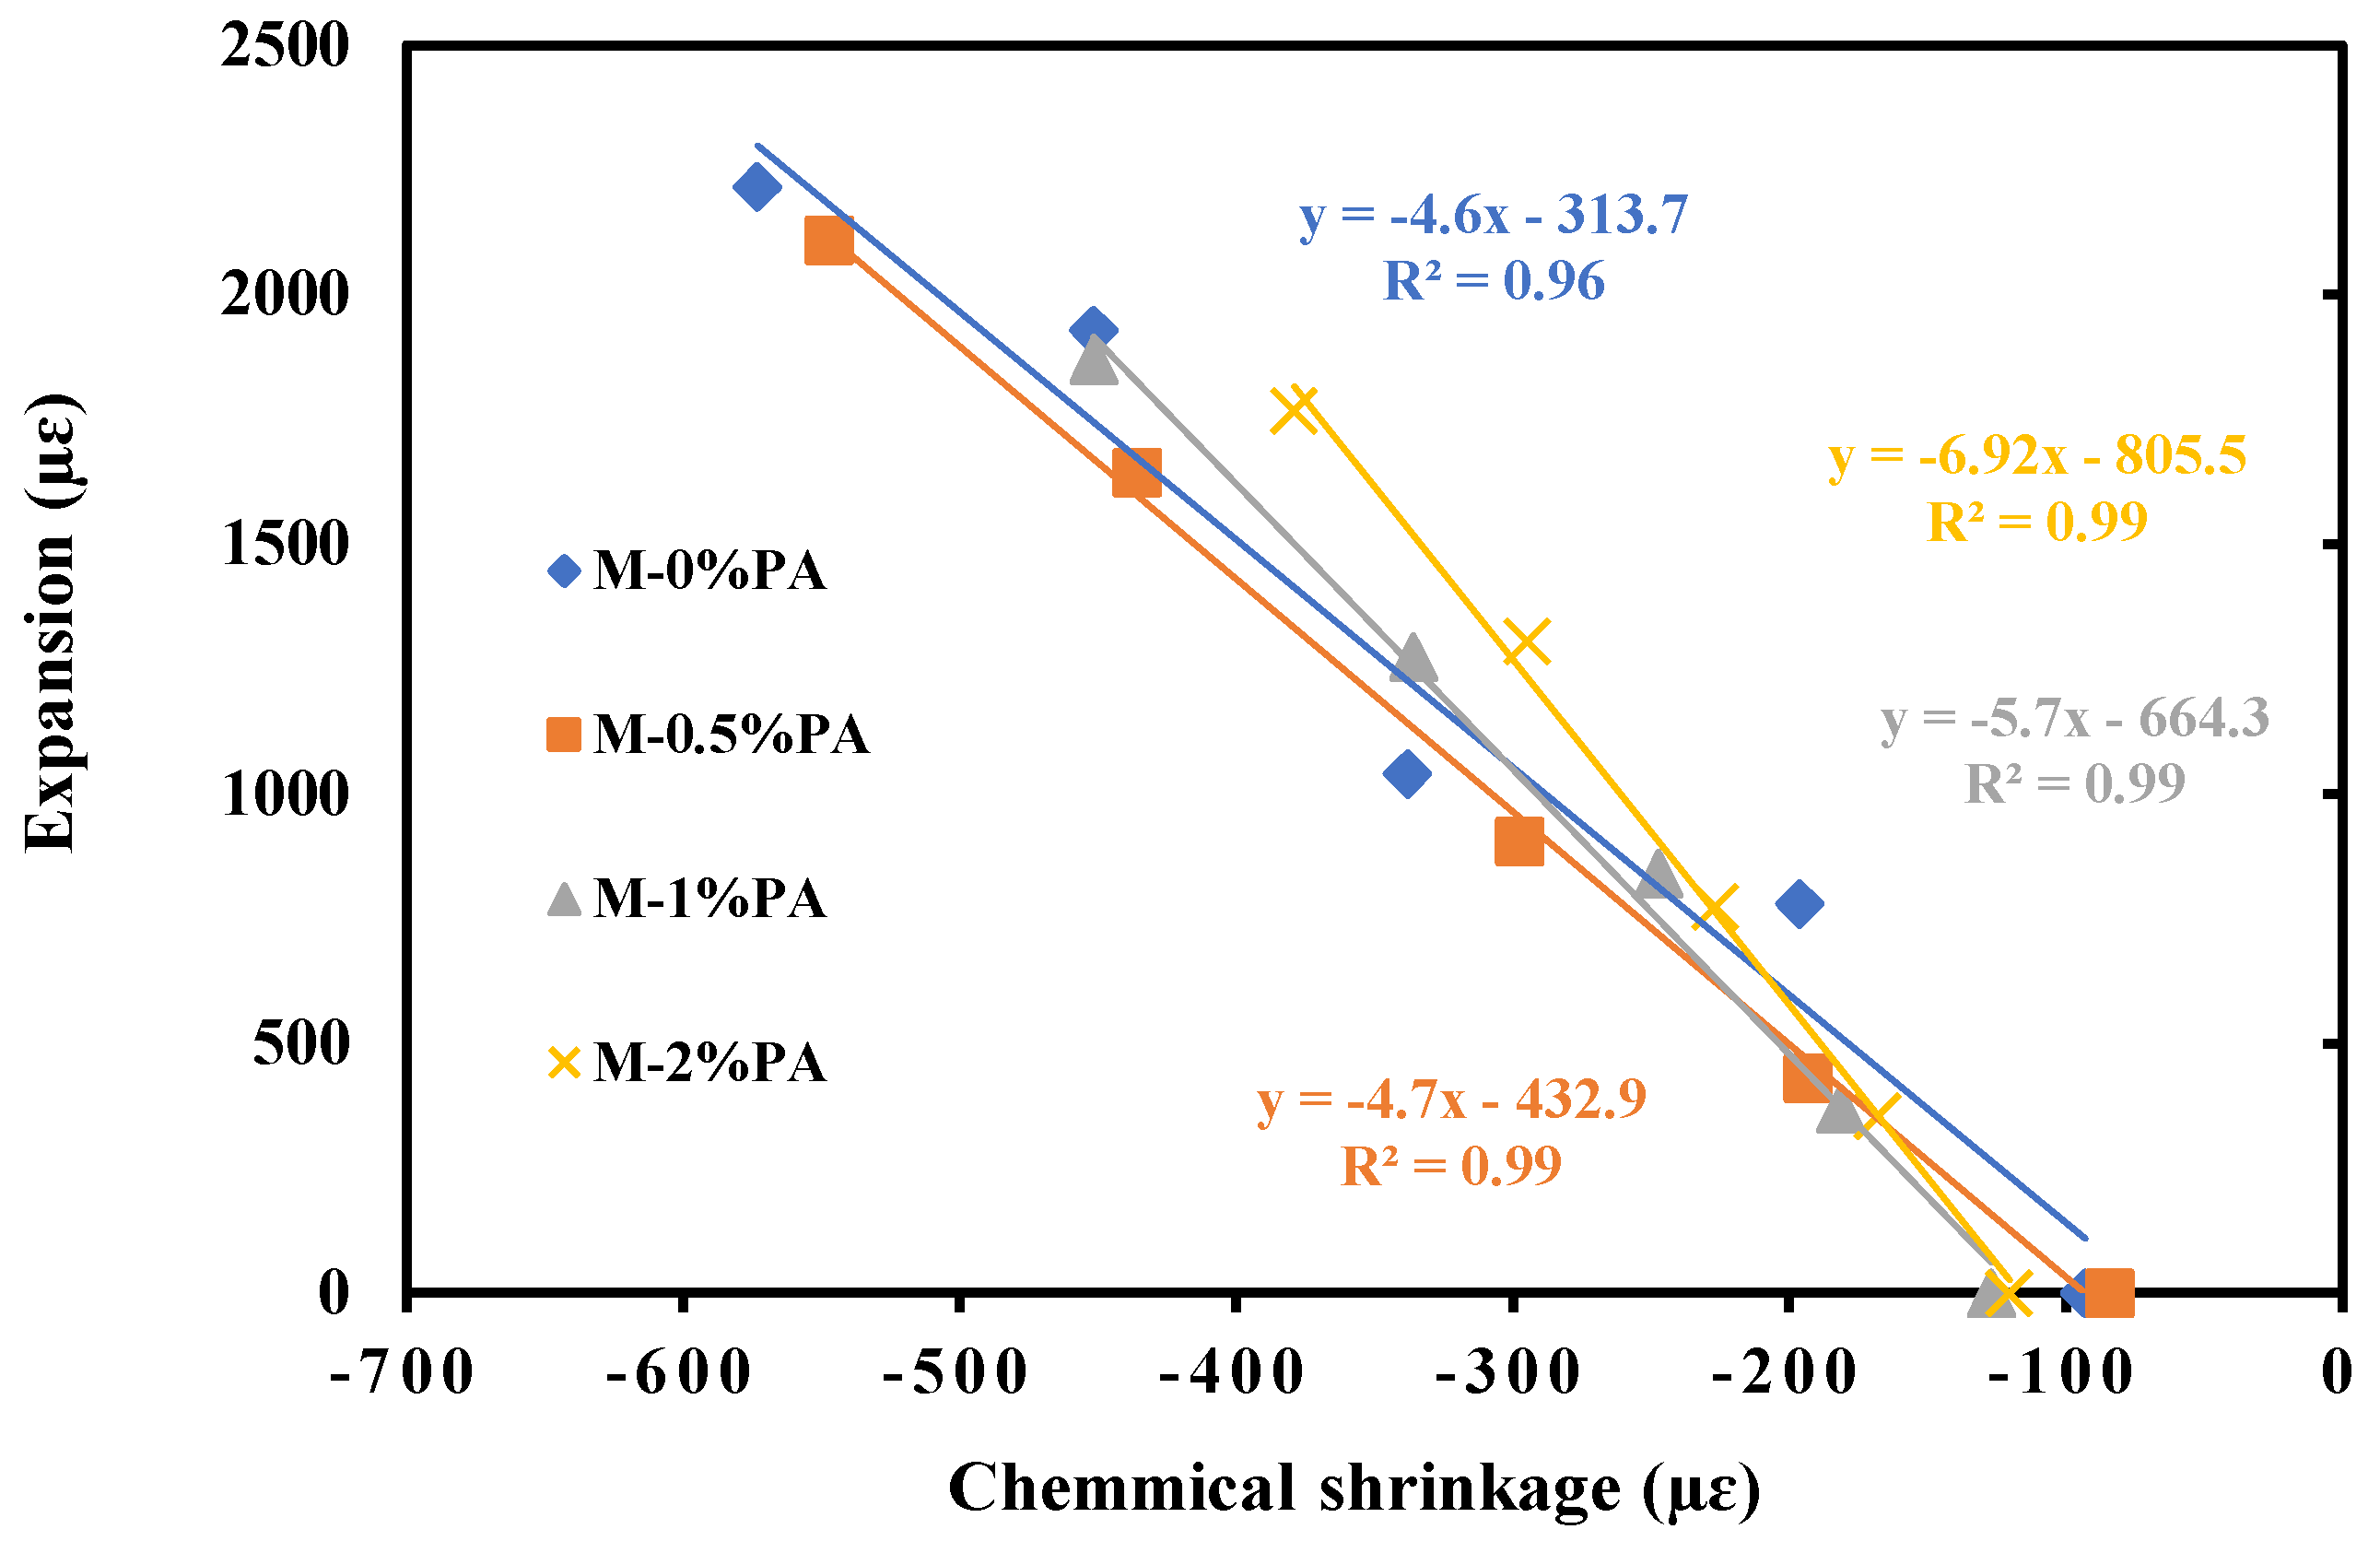
4. Correlations between Different Length Change

Figure 15, Figure 16 and Figure 17 display the correlations between volume changes of mortar samples. A strong positive correlation is observed between chemical shrinkage and autogenous shrinkage for all PA fiber inclusion levels (0%, 0.5%, 1%, and 2%), with high coefficients of determination (R2) ranging from 0.94 to 0.97 (Figure 15). This relationship is well understood in the context of hydration-induced volume changes. Before setting, the volume loss due to hydration leads to bulk deformation known as setting shrinkage, which is a significant component of autogenous shrinkage. As the matrix stiffens after setting, bulk deformation decreases, resulting in a reduction in chemical shrinkage transforming into autogenous shrinkage over time. For instance, at 2 days, only 2.56% of chemical shrinkage is converted into autogenous shrinkage through self-desiccation, with the remaining 97.44% appearing as empty cavities. Autogenous shrinkage, primarily caused by self-desiccation and the formation of ettringite, results in the appearance of empty cavities but constitutes a smaller proportion compared to chemical shrinkage [41].
Figure 16 also reveals a strong correlation between chemical shrinkage and drying shrinkage, with high coefficients of determination (R2) ranging from 0.93 to 0.98 for different PA fiber increments (0%, 0.5%, 1%, and 2%). This finding suggests that drying shrinkage is driven by chemical shrinkage, with chemical shrinkage occurring during the fresh stage after cement hydration, while drying shrinkage happens in the hardening stage [41,42,43].
However, Figure 17 indicates that there is a negative correlation between chemical shrinkage and expansion. The former representing the system’s total volume change (chemical shrinkage), is primarily caused by solid material dissolving in the pore water and precipitating as hydrate product, which has a higher density than the initial reactants. This leads to the creation of extra pore space filled with additional water drawn into the system by capillary action. On the other hand, expansion represents the swelling of a preexisting, “rigid” framework composed of an interconnected network of binder and hydrate product particles. As curing time increases, the expansion continuously grows, while the volume change decreases alongside chemical shrinkage. Extended curing time results in a significant increase in external expansion or a significant decrease in external shrinkage for the cured samples [41,42,43].

5. Conclusions

This research paper examines the impact of introducing PA fibers on the mechanical and length change properties (chemical, autogenous, drying and expansion) of mortar. Several key findings can be summarized as follows:
  • Generally, the presence of fibers shows a slight reduction in compressive strength, except at 90 days, where the 1% PA mix shows a higher value. However, the flexural strength shows a reduction in the presence of fibers except in the mortar mix containing 1% fiber where a noticeable increase was observed at curing ages beyond 3 days and up to 180 days.
  • The incorporation of PA fibers up to 2% significantly contributes to reducing length change of mortar. The chemical shrinkage, autogenous shrinkage, drying shrinkage and expansion are reduced, compared to the control, by 37%, 19%, 15%, and 20%, respectively, at 180 days.
  • The hyperbolic model demonstrates a good fit with the experimental data across all length change parameters with a high coefficient of correlation (R2 > 0.98). The predicted ultimate length change is systematically reduced with the increase in the % of PA fibers. However, the initial rate of length change has a maximum value at 1% PA fibers. Also, there is a strong linear correlation between chemical shrinkage and other length change parameters supported by a high coefficient of determination (R2 > 0.97).
  • Future research on PA fibers in cementitious systems may include other properties such as sorptivity, water absorption, permeability, sulfate attack, chloride ingress, and abrasion resistance. Mortar can also be used in masonry blocks and plastering. Including fibers in the mortar can improve the shrinkage characteristics of the bonded masonry blocks and plaster. Therefore, further research can include relevant testing on masonry and plaster. This should allow the development of guidelines for using PA fibers in construction applications.

Author Contributions

Conceptualization, H.G. and J.K.; methodology, R.R. and H.G.; formal analysis, R.R., J.K. and H.G.; writing—original draft preparation, R.R. and H.G.; writing—review and editing, J.K., H.G. and R.R.; supervision, J.K., A.E. and H.G. All authors have read and agreed to the published version of the manuscript.

Funding

This research received no external funding.

Data Availability Statement

Data are contained within the article.

Acknowledgments

The authors express their appreciation to the Department of Civil Engineering at Beirut Arab University for their collective contributions to this project.

Conflicts of Interest

The authors declare no conflicts of interest.

References

  1. Holden, E.; Linnerud, K.; Banister, D. Sustainable development: Our common future revisited. Glob. Environ. Chang. 2014, 26, 130–139. [Google Scholar] [CrossRef]
  2. Grybaite, V.; Tvaronavičiene, M. Estimation of sustainable development: Germination on institutional level. J. Bus. Econ. Manag. 2008, 9, 327–334. [Google Scholar] [CrossRef]
  3. Taleb, H.M.; Sharples, S. Developing sustainable residential buildings in Saudi Arabia: A case study. Appl. Energy 2011, 88, 383–391. [Google Scholar] [CrossRef]
  4. Thanu, H.P.; Kanya Kumari, H.G.; Rajasekaran, C. Sustainable building management by using alternative materials and techniques. In Sustainable Construction and Building Materials: Select Proceedings of ICSCBM; Springer: Singapore, 2018; pp. 583–593. [Google Scholar] [CrossRef]
  5. Alabi, B.; Fapohunda, J. Criteria to Be Considered in the Selection of Building Materials for Sustainable Housing Delivery. In The Construction Industry in the Fourth Industrial Revolution: Proceedings of 11th Construction Industry Development Board (CIDB) Postgraduate Research Conference; Springer International Publishing: Berlin/Heidelberg, Germany, 2020; Volume 11, pp. 412–418. [Google Scholar] [CrossRef]
  6. Nguyen, N.L. Comparison of autogenous shrinkage measurements by different methods in case of fast-hardening mortar. In Proceedings of the IOP Conference Series: Materials Science and Engineering, Chennai, India, 16–17 September 2020; IOP Publishing: Bristol, UK, 2020; Volume 869, p. 032041. [Google Scholar] [CrossRef]
  7. Zeng, H.; Li, Y.; Zhang, J.; Chong, P.; Zhang, K. Effect of limestone powder and fly ash on the pH evolution coefficient of concrete in a sulfate-freeze–thaw environment. J. Mater. Res. Technol. 2022, 16, 1889–1903. [Google Scholar] [CrossRef]
  8. Ahmad, S.; Al-Amoudi, O.S.B.; Khan, S.M.; Maslehuddin, M. Effect of silica fume inclusion on the strength, shrinkage and durability characteristics of natural pozzolan-based cement concrete. Case Stud. Constr. Mater. 2022, 17, e01255. [Google Scholar] [CrossRef]
  9. Wang, Y.; Lu, B.; Hu, X.; Liu, J.; Zhang, Z.; Pan, X.; Xie, Z.; Chang, J.; Zhang, T.; Nehdi, M.L.; et al. Effect of CO2 surface treatment on penetrability and microstructure of cement-fly ash–slag ternary concrete. Cem. Concr. Compos. 2021, 123, 104194. [Google Scholar] [CrossRef]
  10. Vilaplana, F.; Strömberg, E.; Karlsson, S. Environmental and resource aspects of sustainable biocomposites. Polym. Degrad. Stab. 2010, 95, 2147–2161. [Google Scholar] [CrossRef]
  11. Shah, D.U. Developing plant fibre composites for structural applications by optimising composite parameters: A critical review. J. Mater. Sci. 2013, 48, 6083–6107. [Google Scholar] [CrossRef]
  12. Ardanuy, M.; Claramunt, J.; Toledo Filho, R.D. Cellulosic fiber reinforced cement-based composites: A review of recent research. Constr. Build. Mater. 2015, 79, 115–128. [Google Scholar] [CrossRef]
  13. Santos, S.F.; Schmidt, R.; Almeida, A.E.; Tonoli, G.H.; Savastano, H., Jr. Supercritical carbonation treatment on extruded fibre–cement reinforced with vegetable fibres. Cem. Concr. Compos. 2015, 56, 84–94. [Google Scholar] [CrossRef]
  14. Plank, J.; Sakai, E.; Miao, C.W.; Yu, C.; Hong, J.X. Chemical admixtures—Chemistry, applications and their impact on concrete microstructure and durability. Cem. Concr. Res. 2015, 78, 81–99. [Google Scholar] [CrossRef]
  15. Onuaguluchi, O.; Banthia, N. Plant-based natural fibre reinforced cement composites: A review. Cem. Concr. Compos. 2016, 68, 96–108. [Google Scholar] [CrossRef]
  16. Coutts, R.S. A review of Australian research into natural fibre cement composites. Cem. Concr. Compos. 2005, 27, 518–526. [Google Scholar] [CrossRef]
  17. Zhang, L.; Hu, Y. Novel lignocellulosic hybrid particleboard composites made from rice straws and coir fibers. Mater. Des. 2014, 55, 19–26. [Google Scholar] [CrossRef]
  18. Ganiron, T.U., Jr. Influence of polymer fiber on strength of concrete. Int. J. Adv. Sci. Technol. 2013, 55, 53–66. [Google Scholar]
  19. El Messiry, M.; Fadel, N. Tailoring the mechanical properties of jute woven/cement composite for innovation in the architectural constructions. J. Nat. Fibers 2021, 18, 1181–1193. [Google Scholar] [CrossRef]
  20. Palanikumar, K.; Ramesh, M.; Hemachandra Reddy, K. Experimental investigation on the mechanical properties of green hybrid sisal and glass fiber reinforced polymer composites. J. Nat. Fibers 2016, 13, 321–331. [Google Scholar] [CrossRef]
  21. Palanisamy, E.; Ramasamy, M. Dependency of sisal and banana fiber on mechanical and durability properties of polypropylene hybrid fiber reinforced concrete. J. Nat. Fibers 2022, 19, 3147–3157. [Google Scholar] [CrossRef]
  22. Rajendran, M.; Nagarajan, C.K. Experimental investigation on bio-composite using jute and banana fiber as a potential substitute of solid wood based materials. J. Nat. Fibers 2022, 19, 4557–4566. [Google Scholar] [CrossRef]
  23. Jaballi, S.; Miraoui, I.; Hassis, H. Long-unidirectional palm and sisal fibers reinforced composite: An experimental investigation. J. Nat. Fibers 2017, 14, 368–378. [Google Scholar] [CrossRef]
  24. Prasanthi, P.P.; Babu, K.S.; Niranjan Kumar, M.S.R.; Kumar, A.E. Analysis of sisal fiber waviness effect on the elastic properties of natural composites using analytical and experimental methods. J. Nat. Fibers 2021, 18, 1675–1688. [Google Scholar] [CrossRef]
  25. Zakaria, M.; Ahmed, M.; Hoque, M.; Shaid, A. A comparative study of the mechanical properties of jute fiber and yarn reinforced concrete composites. J. Nat. Fibers 2018, 17, 676–687. [Google Scholar] [CrossRef]
  26. Ede, A.N.; Agbede, J.O. Use of coconut husk fiber for improved compressive and flexural strength of concrete. Int. J. Sci. Eng. Res. 2015, 6, 968–974. [Google Scholar]
  27. Okeola, A.A.; Abuodha, S.O.; Mwero, J. Experimental investigation of the physical and mechanical properties of sisal fiber-reinforced concrete. Fibers 2018, 6, 53. [Google Scholar] [CrossRef]
  28. Eller, F.; Skálová, H.; Caplan, J.S.; Bhattarai, G.P.; Burger, M.K.; Cronin, J.T.; Guo, W.Y.; Guo, X.; Hazelton, E.L.; Kettenring, K.M.; et al. Cosmopolitan species as models for ecophysiological responses to global change: The common reed Phragmites australis. Front. Plant Sci. 2017, 8, 1833. [Google Scholar] [CrossRef] [PubMed]
  29. Ramadan, R.; Khatib, J.; Ghorbel, E.; Elkordi, A. Effect of Adding Phragmites-Australis Plant on the Chemical Shrinkage and Mechanical Properties of Mortar. In International Conference on Bio-Based Building Materials; Springer Nature: Cham, Switzerland, 2023; pp. 573–584. [Google Scholar]
  30. Packer, J.G.; Meyerson, L.A.; Skálová, H.; Pyšek, P.; Kueffer, C. Biological flora of the British Isles: Phragmites australis. J. Ecol. 2017, 105, 1123–1162. [Google Scholar] [CrossRef]
  31. Mal, T.K.; Narine, L. The biology of Canadian weeds. 129. Phragmites australis (Cav.) Trin. ex Steud. Can. J. Plant Sci. 2004, 84, 365–396. [Google Scholar] [CrossRef]
  32. Machaka, M.; Khatib, J.; Baydoun, S.; Elkordi, A.; Assaad, J.J. The effect of adding phragmites australis fibers on the properties of concrete. Buildings 2022, 12, 278. [Google Scholar] [CrossRef]
  33. Ramadan, R.; Jahami, A.; Khatib, J.; El-Hassan, H.; Elkordi, A. Improving Structural Performance of Reinforced Concrete Beams with Phragmites Australis Fiber and Waste Glass Additives. Appl. Sci. 2023, 13, 4206. [Google Scholar] [CrossRef]
  34. Li, Z.; Wang, L.; Wang, X. Compressive and flexural properties of hemp fiber reinforced concrete. Fibers Polym. 2004, 5, 187–197. [Google Scholar] [CrossRef]
  35. Bentz, D.P. Influence of water-to-cement ratio on hydration kinetics: Simple models based on spatial considerations. Cem. Concr. Res. 2006, 36, 238–244. [Google Scholar] [CrossRef]
  36. Chand, N.; Fahim, M. Tribology of Natural Fiber Polymer Composites; Woodhead Publishing: Sawston, UK, 2020. [Google Scholar]
  37. EN 1015-11. Methods of Test for Mortar for Masonry—Part 11: Determination of Flexural and Compressive Strength of Hardened Mortar. British Standards Institution (BSI): London, UK, 2007.
  38. ASTM C 490-04; Standard Practice for Use of Apparatus for the Determination of Length Change of Hardened Cement Paste, Mortar, and Concrete. 2004 Annual Book of ASTM standards, Section 4. vol. 04.02 (Concrete and Aggregates). ASTM: Philadelphia, PA, USA, 2004; p. 5.
  39. ASTM C 1608. Standard Test Method for Chemical Shrinkage of Hydraulic Cement Paste. American Society for Testing and Materials: West Conshohocken, PA, USA, 2007.
  40. Khatib, J.; Ramadan, R.; Ghanem, H.; Elkordi, A. Volume stability of cement paste containing limestone fines. Buildings 2021, 11, 366. [Google Scholar] [CrossRef]
  41. Khatib, J.; Ramadan, R.; Ghanem, H.; ElKordi, A. Effect of using limestone fines on the chemical shrinkage of pastes and mortars. Environ. Sci. Pollut. Res. 2023, 30, 25287–25298. [Google Scholar] [CrossRef] [PubMed]
  42. Khatib, J.M.; Ramadan, R.; Ghanem, H.; Elkordi, A.; Baalbaki, O.; Kırgız, M. Chemical shrinkage of paste and mortar containing limestone fines. Mater. Today Proc. 2022, 61, 530–536. [Google Scholar] [CrossRef]
  43. Khatib, J.M.; Ramadan, R.; Ghanem, H.; Elkordi, A.; Sonebi, M. Effect of limestone fines as a partial replacement of cement on the chemical, autogenous, drying shrinkage and expansion of mortars. Mater. Today Proc. 2022, 58, 1199–1204. [Google Scholar] [CrossRef]
  44. Ghanem, H.; Ramadan, R.; Khatib, J.; Elkordi, A. A Review on Chemical and Autogenous Shrinkage of Cementitious Systems. Materials 2024, 17, 283. [Google Scholar] [CrossRef] [PubMed]
  45. Choi, J.I.; Jang, S.Y.; Kwon, S.J.; Lee, B.Y. Tensile behavior and cracking pattern of an ultra-high-performance mortar reinforced by polyethylene fiber. Adv. Mater. Sci. Eng. 2017, 2017, 5383982. [Google Scholar] [CrossRef]
  46. Suryawanshi, Y.R.; Dalvi, M.J.D. Study of Sisal Fibre as Concrete Reinforcement Material in Cement Based Composites. Int. J. Eng. Res. Technol. 2013, 2, 1–4. [Google Scholar]
  47. Ramirez, A. Physical-Mechanical Properties of Fiber Cement Elements made of Rice Straw, Sugercane, Bagass requis and Cocunt Husk Fibers. In Fibre Reinforced Cement and Concrete; CRC Press: Boca Raton, FL, USA, 1992; pp. 1203–1215. [Google Scholar]
  48. Rokbi, M.; Osmani, H.; Imad, A.; Benseddiq, N. Effect of chemical treatment on flexure properties of natural fiber-reinforced polyester composite. Procedia Eng. 2011, 10, 2092–2097. [Google Scholar] [CrossRef]
  49. Bessadok, A.; Roudesli, S.; Marais, S.; Follain, N.; Lebrun, L. Alfa fibres for unsaturated polyester composites reinforcement: Effects of chemical treatments on mechanical and permeation properties. Compos. Part A Appl. Sci. Manuf. 2009, 40, 184–195. [Google Scholar] [CrossRef]
  50. Guo, Y.; Wu, P. Investigation of the hydrogen-bond structure of cellulose diacetate by two-dimensional infrared correlation spectroscopy. Carbohydr. Polym. 2008, 74, 509–513. [Google Scholar] [CrossRef]
  51. De La Grée, G.D.; Yu, Q.L.; Brouwers, H.J.H. Assessing the effect of CaSO4 content on the hydration kinetics, microstructure and mechanical properties of cements containing sugars. Constr. Build. Mater. 2017, 143, 48–60. [Google Scholar] [CrossRef]
  52. Jongvisuttisun, P.; Leisen, J.; Kurtis, K.E. Key mechanisms controlling internal curing performance of natural fibers. Cem. Concr. Res. 2018, 107, 206–220. [Google Scholar] [CrossRef]
  53. Kouta, N.; Saliba, J.; Saiyouri, N. Effect of flax fibers on early age shrinkage and cracking of earth concrete. Constr. Build. Mater. 2020, 254, 119315. [Google Scholar] [CrossRef]
  54. Alzebdeh, K.I.; Nassar, M.M.; Arunachalam, R. Effect of fabrication parameters on strength of natural fiber polypropylene composites: Statistical assessment. Measurement 2019, 146, 195–207. [Google Scholar] [CrossRef]
  55. Lopattananon, N.; Panawarangkul, K.; Sahakaro, K.; Ellis, B. Performance of pineapple leaf fiber–natural rubber composites: The effect of fiber surface treatments. J. Appl. Polym. Sci. 2006, 102, 1974–1984. [Google Scholar] [CrossRef]
  56. Brahim, S.B.; Cheikh, R.B. Influence of fibre orientation and volume fraction on the tensile properties of unidirectional Alfa-polyester composite. Compos. Sci. Technol. 2007, 67, 140–147. [Google Scholar] [CrossRef]
  57. Mahjoub, R.; Yatim, J.M.; Sam, A.R.M.; Hashemi, S.H. Tensile properties of kenaf fiber due to various conditions of chemical fiber surface modifications. Constr. Build. Mater. 2014, 55, 103–113. [Google Scholar] [CrossRef]
  58. Manimaran, P.; Senthamaraikannan, P.; Murugananthan, K.; Sanjay, M.R. Physicochemical properties of new cellulosic fibers from Azadirachta indica plant. J. Nat. Fibers 2018, 15, 29–38. [Google Scholar] [CrossRef]
  59. Thyavihalli Girijappa, Y.G.; Mavinkere Rangappa, S.; Parameswaranpillai, J.; Siengchin, S. Natural fibers as sustainable and renewable resource for development of eco-friendly composites: A comprehensive review. Front. Mater. 2019, 6, 226. [Google Scholar] [CrossRef]
  60. Zuo, Y.; Wei, X. Relations among electrical resistivity, chemical and autogenous shrinkage of cement pastes. Adv. Cem. Res. 2015, 27, 175–183. [Google Scholar] [CrossRef]
Figure 1. Steps for obtaining PA fibers.
Fibers 12 00014 g001
Figure 2. Length change samples; (a) drying shrinkage, (b) autogenous shrinkage, (c) expansion.
Fibers 12 00014 g002
Figure 3. Chemical shrinkage process.
Fibers 12 00014 g003
Figure 4. Initial length change rate and ultimate length change parameters.
Fibers 12 00014 g004
Figure 5. Compressive strength of mortar samples with different PA fibers addition.
Fibers 12 00014 g005
Figure 6. Flexural strength of mortar samples with different PA fibers addition.
Fibers 12 00014 g006
Figure 7. Estimation of chemical shrinkage for mortar samples.
Fibers 12 00014 g007
Figure 8. Chemical shrinkage characteristics for mortars: (a) ILR; (b) UL.
Fibers 12 00014 g008
Figure 9. Estimation of autogenous shrinkage for mortar samples.
Fibers 12 00014 g009
Figure 10. Autogenous shrinkage characteristics for mortars: (a) ILR; (b) UL.
Fibers 12 00014 g010
Figure 11. Estimation of drying shrinkage for mortar samples.
Fibers 12 00014 g011
Figure 12. Drying shrinkage characteristics for mortars: (a) ILR; (b) UL.
Fibers 12 00014 g012
Figure 13. Estimation of expansion for mortar samples.
Fibers 12 00014 g013
Figure 14. Expansion characteristics for mortars: (a) ILR; (b) UL.
Fibers 12 00014 g014
Figure 15. Correlation between chemical shrinkage and autogenous shrinkage for mortar samples with PA fibers.
Fibers 12 00014 g015
Figure 16. Correlation between chemical shrinkage and drying shrinkage for mortar samples with PA fibers.
Fibers 12 00014 g016
Figure 17. Correlation between chemical shrinkage and expansion for mortar samples with PA fibers.
Fibers 12 00014 g017
Table 1. Mix proportions for mortar.
kg/m3
Mortar CodeCement (C)Sand (S)WaterPA FibersPA Fibers
(% by vol)
W/CS/C
M-0%PA 616.51233339.1000.552
M-0.5%PA 616.51233339.13.330.50.552
M-1%PA 616.51233339.16.6510.552
M-2%PA 616.51233339.113.320.552
Disclaimer/Publisher’s Note: The statements, opinions and data contained in all publications are solely those of the individual author(s) and contributor(s) and not of MDPI and/or the editor(s). MDPI and/or the editor(s) disclaim responsibility for any injury to people or property resulting from any ideas, methods, instructions or products referred to in the content.

