Article

Synthesis and Characterization of Nanostructured Polyaniline Thin Films with Superhydrophobic Properties

by
Zeinab Abdel Hamid
1,
Mona Hasan Gomaa
1,
Sayed S. Abdel Rehim
2,
Maamoun Abdel Hamid
1 and
Ahmed Ibrahim
3,*
1
Corrosion Control & Surface Protection Department, Central Metallurgical Research and Development Institute, Helwan 11421, Egypt
2
Chemical Department, Faculty of science, Ain shams university, Cairo 11566, Egypt
3
Mechanical Engineering Department, Farmingdale State College, Farmingdale, NY 11735, USA
*
Author to whom correspondence should be addressed.
Coatings 2019, 9(11), 748; https://doi.org/10.3390/coatings9110748
Submission received: 24 August 2019 / Revised: 14 October 2019 / Accepted: 6 November 2019 / Published: 11 November 2019
(This article belongs to the Special Issue Thin-Film Synthesis, Characterization and Properties)

Abstract

:
Polyaniline (PANI) thin films incorporated with TiO2 or ZnO nanoparticles were synthesized via an electrochemical polymerization technique. Cyclic voltammetry (CV) was used to synthesize PANI from a strongly acidic medium (0.5 M H2SO4). The effects of different deposition cycles on the morphology, thickness, color, and properties of electrodeposited PANI thin films nanocomposites were investigated. Furthermore, the effects of the nanoparticles concentration on the morphology and water contact angle (CA) of the produced coating were investigated. Field-emission scanning electron microscopy (FE-SEM) and high-resolution transmission electron microscopy (HR-TEM) were used to investigate the morphological structure. X-ray photoelectron spectroscopy (XPS) was used to study the surface composition of the formed film. The results reveal that the CA of the prepared coating reached 146°. A granular morphology of PANI with a moderate concentration of nanoparticles was obtained. In addition, XPS analysis confirmed the incorporation of the oxide nanoparticles in the matrix.

1. Introduction

Superhydrophobic surfaces have drawn great attention from both industrial and academic sectors, because of their potential and broad applications which range from self-cleaning surfaces to biomedical applications [1,2,3,4,5,6,7,8,9,10]. Surfaces having water contact angles (CAs) greater than 150° are generally designated as superhydrophobic. However, K-Y Law in a highly informative article demonstrated that a surface can be considered superhydrophobic when its CA is ≥145°, where it has practically no affinity with water [7]. He indicated that the changes in wetting and adhesion interactions are gradual and that there are no magic cutoff angles.
Superhydrophobic surfaces possess outstanding water repelling properties due to their low surface energy and specific roughness. In natural plants, the superhydrophobicity of leaves is a nature-inspired surface layout with an outstanding hierarchical arrangement, along with a slender wax layer which covers the surface [2,3,4]. The most famous example of superhydrophobic surfaces is lotus leaves (Nelumbo nucifera) [1]. Superhydrophobic properties have been also found in many insects appendages including wings, legs, and eyes [5]. It has been well established that the hierarchical surface structure and the chemical composition of the surface are the main factors in determining superhydrophobicity [4,5].
For the past two decades, superhydrophobic coatings have been used in many industrial applications including self-cleaning [6], anti-freeze surfaces [8], anti-bacterial surfaces and their medical applications [9,10,11], oil and water separation [12,13,14], and corrosion control [15]. Several techniques are utilized to prepare superhydrophobic surfaces such as lithography [16], template-based methods [17], plasma therapies [18], self-assembly [19], compound residue [20], and electrospinning [21,22,23,24,25,26,27,28]. Recently, ultrafast lasers have been used to fabricate microstructured surfaces on metals to create superhydrophobic properties [29]. However, many of these reported techniques involve multistep procedures, or require specialized reagents and equipment [30].
Conducting polymers are of great interest for the fabrication of superhydrophobic surfaces because of their flexibility and conductive properties [30,31,32,33,34,35,36]. Conducting polymers combine functionalities that offer simultaneous multifunctional and multidimensional beneficial effects. Among the conducting polymers, polypyrole (PPY), polyacetylene (PAC), polytiophene (PT), and polyaniline (PANI) are the most extensively studied due to their large potential applications. PANI is the most promising conducting polymer due to its distinctive features, including environmental stability, easy synthesis, and relatively high electrical conductivity [32,33,34]. All these features are related to its unique chemical structure that has different base and salt forms of PANI in its three redox forms. Accordingly, the conductivity of PANI can be tuned by using different doping agents [35]. PANI has a wide range of applications such as flexible supercapacitors [36], transparent and conductive thin films [37], electromagnetic shielding [38], optical sensing of pH [39], gas sensing devices [40], solar cells [41], electrochromic devices [42], and anticorrosion coatings [43,44,45,46].
The fabrication of superhydrophobic surfaces from conductive PANI nanowires has been successfully demonstrated [47,48]. The nanowires can be prepared by a number of methods based on chemical oxidative polymerization including electrochemical polymerization [47]. Qu et al. fabricated superhydrophobic PANI nanowires by the electropolymerization of aniline in sulfuric acid on titanium-coated silicon wafers with anodized aluminum, as shown in Figure 1. The resulting superhydrophobic PANI nanowires are clustered together and have a porous morphology.
PANI nanocomposites enriched with inorganic nanoscale particles such as TiO2 or ZnO have been successfully prepared [49]. These nanocomposites exhibit enhanced properties such as electrical, optical, catalytic, and mechanical properties. In addition, the hydrophobicity of PANI was further enhanced.
In the present study, the electrochemical polymerization technique was used to prepare PANI and the PANI/TiO2 and PANI/ZnO nanocomposites. X-ray photoelectron spectroscopy (XPS) was used to study the surface chemistry and the surface composition of PANI and the PANI nanocomposites. XPS was used to confirm the incorporation of the oxide nanoparticles into the matrix.
The aim of this study was to synthesize and characterize the PANI thin films enriched with nanoparticles as hydrophobic or superhydrophobic coatings using a simple cyclic voltammetry (CV) technique. In addition, these thin films were characterized by X-ray diffraction (XRD), field-emission scanning electron microscopy (FE-SEM), high-resolution transmission electron microscopy (HR-TEM), and XPS.

2. Materials and Methods

All chemicals were of analytical grade and used as received without any purification. Aniline monomer (C6H7N extrapure AR) of MW of 93.13 was purchased from SRL Co., New Mumbai, India. Sulphuric acid (98%; Fluka Chemical Corporation, Hauppauge, NY, USA, was used as a supporting electrolyte for an electropolymerization process. All the other chemicals were purchased from Sigma-Aldrich (Cairo, Egypt): indium-doped tin oxide (ITO)-coated glasses size of 25 mm × 25 mm × 1.1 mm and a resistance of approximately 10 ohm/square, and ethanol and acetone of analytical grade. Zinc nitrate Zn(NO3)2·6H2O was used as a precursor in preparing the semiconducting zinc oxide nanoparticles, and sodium hydroxide (NaOH) was used as a precipitating agent. Titanium isopropoxide (TTIP) (C12H28O4Ti; of purity, 99.99%) was used in the preparation of anatase TiO2 nanopowder, and deionized water was used for dilution.
ITO was used as a working electrode. Further treatment for the ITO glass substrate was performed to enhance the electrodepositing of the PANI film. Firstly, ITO glasses were immersed in deionized water ultrasonically for 15 min, then immersed in ethanol ultrasonically for 30 min and finally immersed in acetone ultrasonically for 30 min.

2.1. Synthesis of Nanoparticles (TiO2 and ZnO)

TiO2 powder was prepared from 5 mL TTIP and 80 mL deionized water at pH 5. After the solution was sonicated for 15 min, a clear white solution was observed. After that, the solution was transferred to a microwave oven (Haier, Qingdao, China) in a power mode of 80P for 35 min. The white precipitate was isolated by centrifugation and washed many times with deionized water, and then dried at 50 °C.
Zinc oxide nanopowder was prepared by a co-precipitation method [50]. Using deionized water, 0.1 M zinc nitrate hexahydrate Zn(NO3)2·6H2O and 0.2 M NaOH were dissolved separately in deionized water to form the liquid media. The NaOH solution was slowly added dropwise to the zinc nitrate solution under vigorous stirring at room temperature, which resulted in the formation of a white suspension that was left in the solution under stirring overnight. The precipitate obtained was filtered and washed thoroughly with distilled water. The product was dried in an oven at 80 °C and ground using an agate mortar. The resulting powder was calcined at a temperature of 500 °C for 2 h.

2.2. Electrochemical Polymerization

All electrochemical measurements were carried out in a three-electrode electrochemical cell connected to a computerized potentiostat/galvanostat (Iviumstat, Eindhoven, The Netherlands). The deposited cell was composed of an ITO (2 × 2 × 1.1 cm3) as a working electrode, Pt foil as a counter electrode, and (Hg/Hg2Cl2, SCE) as a reference electrode. Before the electrochemical deposition of PANI, ITO was pretreated in a free monomer (0.5 M H2SO4) solution by sweeping the potential between −0.5 and 1.5 V and SCE for different numbers of cycles at a scan rate of 0.1 mV/s using a CV technique. The electrochemical polymerization of aniline on an ITO electrode was performed using the CV technique in the electrolyte solution of 0.5 M H2SO4 containing 0.1 M aniline for different numbers of cycles. When the electropolymerization was taking place, the color of the ITO changed from transparent to green, revealing the formation of the PANI film.
To prepare PANI nanocomposites, 0.5 M H2SO4 and 0.1 M aniline monomer were stirred with deionized water, and different concentrations (0–0.5 g/L) of TiO2 or ZnO were added to the aniline–acid solution with a stirring rate of 300 rpm at room temperature. The depositions of the PANI nanocomposites were performed via the CV technique by sweeping the potential from −0.5 to 1.5 V with a scan rate of 0.1 mV/s. The oxidation of aniline on ITO was carried out by recording the linear scan voltammograms (LSVs) of aniline at a potential range between −0.5 and 1.5 V and a scan rate of 0.1 mV/s, to determine the onset potential which was further used for electro-synthesis.

2.3. Characterization

The XRD patterns of the powdered samples were obtained using an X’Pert Pro powder diffractometer within a diffraction angle range (2θ) of 4°–70°, operating with CuKα radiation working at 40 mA and 45 kV (λ = 1.5418 Å, rated as 1.6 kW) with a step size of 0.02° and a step time of 0.4 s. It was used to identify the crystalline phase and to estimate the crystalline sizes of the ZnO and TiO2 nanopowders.
HR-TEM images were obtained using an FEI (Tecnai G2 20S-Twin, Eindhoven, The Netherlands) microscope with an accelerating voltage of 200 kV. Morphologies of PANI nanocomposites on the ITO glass were observed by a field-emission scanning electron microscope (JEOL, JSM-5410, Tokyo, Japan). Prior to examination with the FE-SEM, samples were coated with a thin layer of gold using a sputtering machine.
The Thermo Scientific K-Alpha XPS system (Waltham, MA, USA) was used to evaluate the prepared samples. The sample was irradiated with a monochromatic Al Kα X-ray source, and the analyzer passed an energy of 200 eV with a step size of 1 eV for high-resolution spectra to obtain the chemical state information.
Water contact angles measurements were carried out using deionized water droplets via a CA measurement instrument Attension Theta Lite (Biolin Scientific, Sweden, Finland). The core of Attension solutions is a combination of easy-to-use, smart instrumentation with broad surface science capabilities. The Theta Lite’s camera captures the extremely fast wetting phenomena up to 2068 fps and performs exceptionally precise drop shape analyses with a 1280 × 1024 pixel resolution. Water droplets (T: 20 °C, droplet volume: 4 µL) were delivered to five different points of each specimen and from a height sufficiently close to the substrate, so that the needle remained in contact with the liquid droplet. All the angles were determined by averaging values measured at five points on different locations for each sample surface.

3. Results and Discussion

3.1. X-Ray Diffraction

The XRD patterns of ZnO and TiO2 nanoparticles are illustrated in Figure 2a,b. Both patterns show the characteristic peaks of ZnO and TiO2. The diffraction peaks of ZnO powders according to the standard pattern (JCPDS No. 04-008-4400) at 2θ values of 31.77°, 34.4°, 36.2°, 47.5°, 56.6°, 62.8°, 66.3°, 67.9°, and 69.1° were indexed to the crystal planes of (100), (002), (101), (102), (110), (103), (200), (112), and (201), respectively, as shown in Figure 2a. No characteristic peaks of any impurities were detected, confirming that the obtained ZnO nanoparticles have high quality, while the diffraction peaks of the TiO2 powder appeared at 25.3°, 37.8°, 48.0°, 54.0°, 55.1°, 62.7°, 68.8°, 70.3°, and 75.1°, which corresponded to the crystal planes of (101), (004), (200), (105), (211), (204), (116), (220), and (215), respectively, for TiO2 according to the standard pattern (JCPDS 01-75-2547), as shown in Figure 2b. The average crystallite sizes (d) of ZnO and TiO2 NPs were estimated by using the Debye-Scherrer equation:
D = Kλ/βcosθ,
where D is the diameter of the crystallite size (nm), K is the shape factor (the typical value is 0.9), λ is the wavelength of the incident beam, β is the broadening of the diffraction line measured in radians at the full width at the half maximum intensity (FWHM), and θ is the Bragg’s angle. From the XRD data, the average crystallite sizes were determined to be 42.0 nm for ZnO and 4 nm for TiO2.

3.2. HR-TEM Characterization

ZnO and TiO2 nanoparticles were characterized by HR-TEM (Figure 3a,b). These FE-SEM images revealed that the particle sizes of the prepared powder (ZnO and TiO2) were in a range of 13 nm for ZnO and less than 6.5 nm for TiO2 powder. It is clear that the as-prepared powders were completely crystalline and perfectly consisted of pure phases. EDX analyses of ZnO and TiO2 nanopowders are illustrated in Figure 3c,d. Figure 3c shows peaks corresponding to Zn and O matched with pure ZnO and Figure 3d shows peaks corresponding to Ti and O matched with pure TiO2.

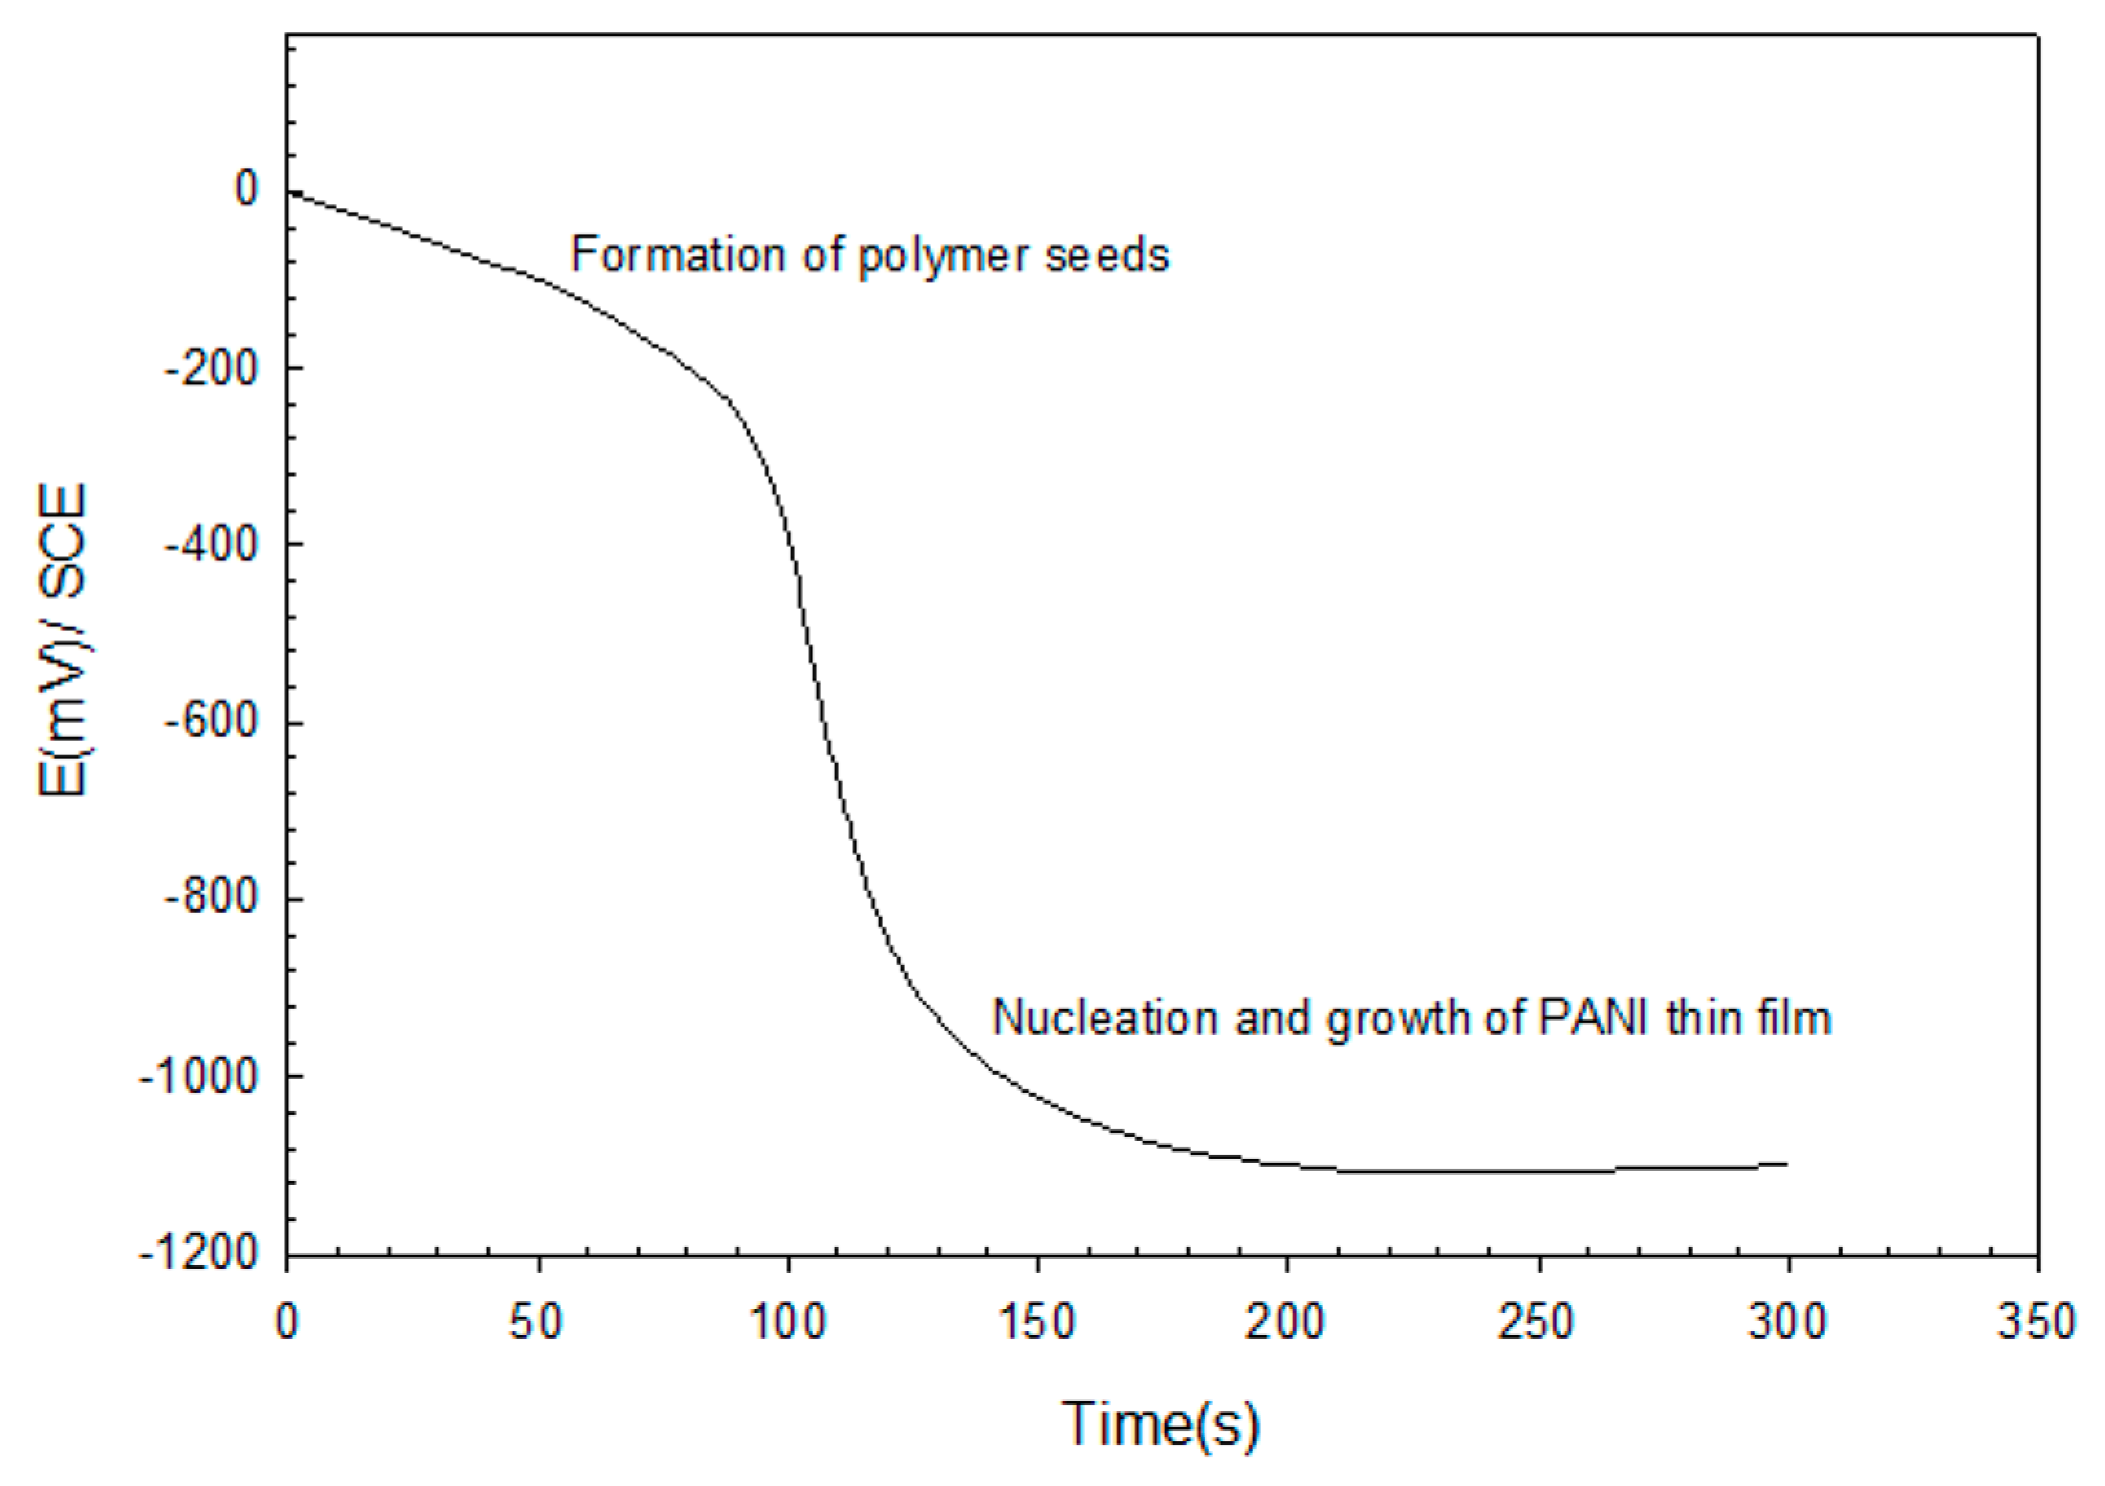
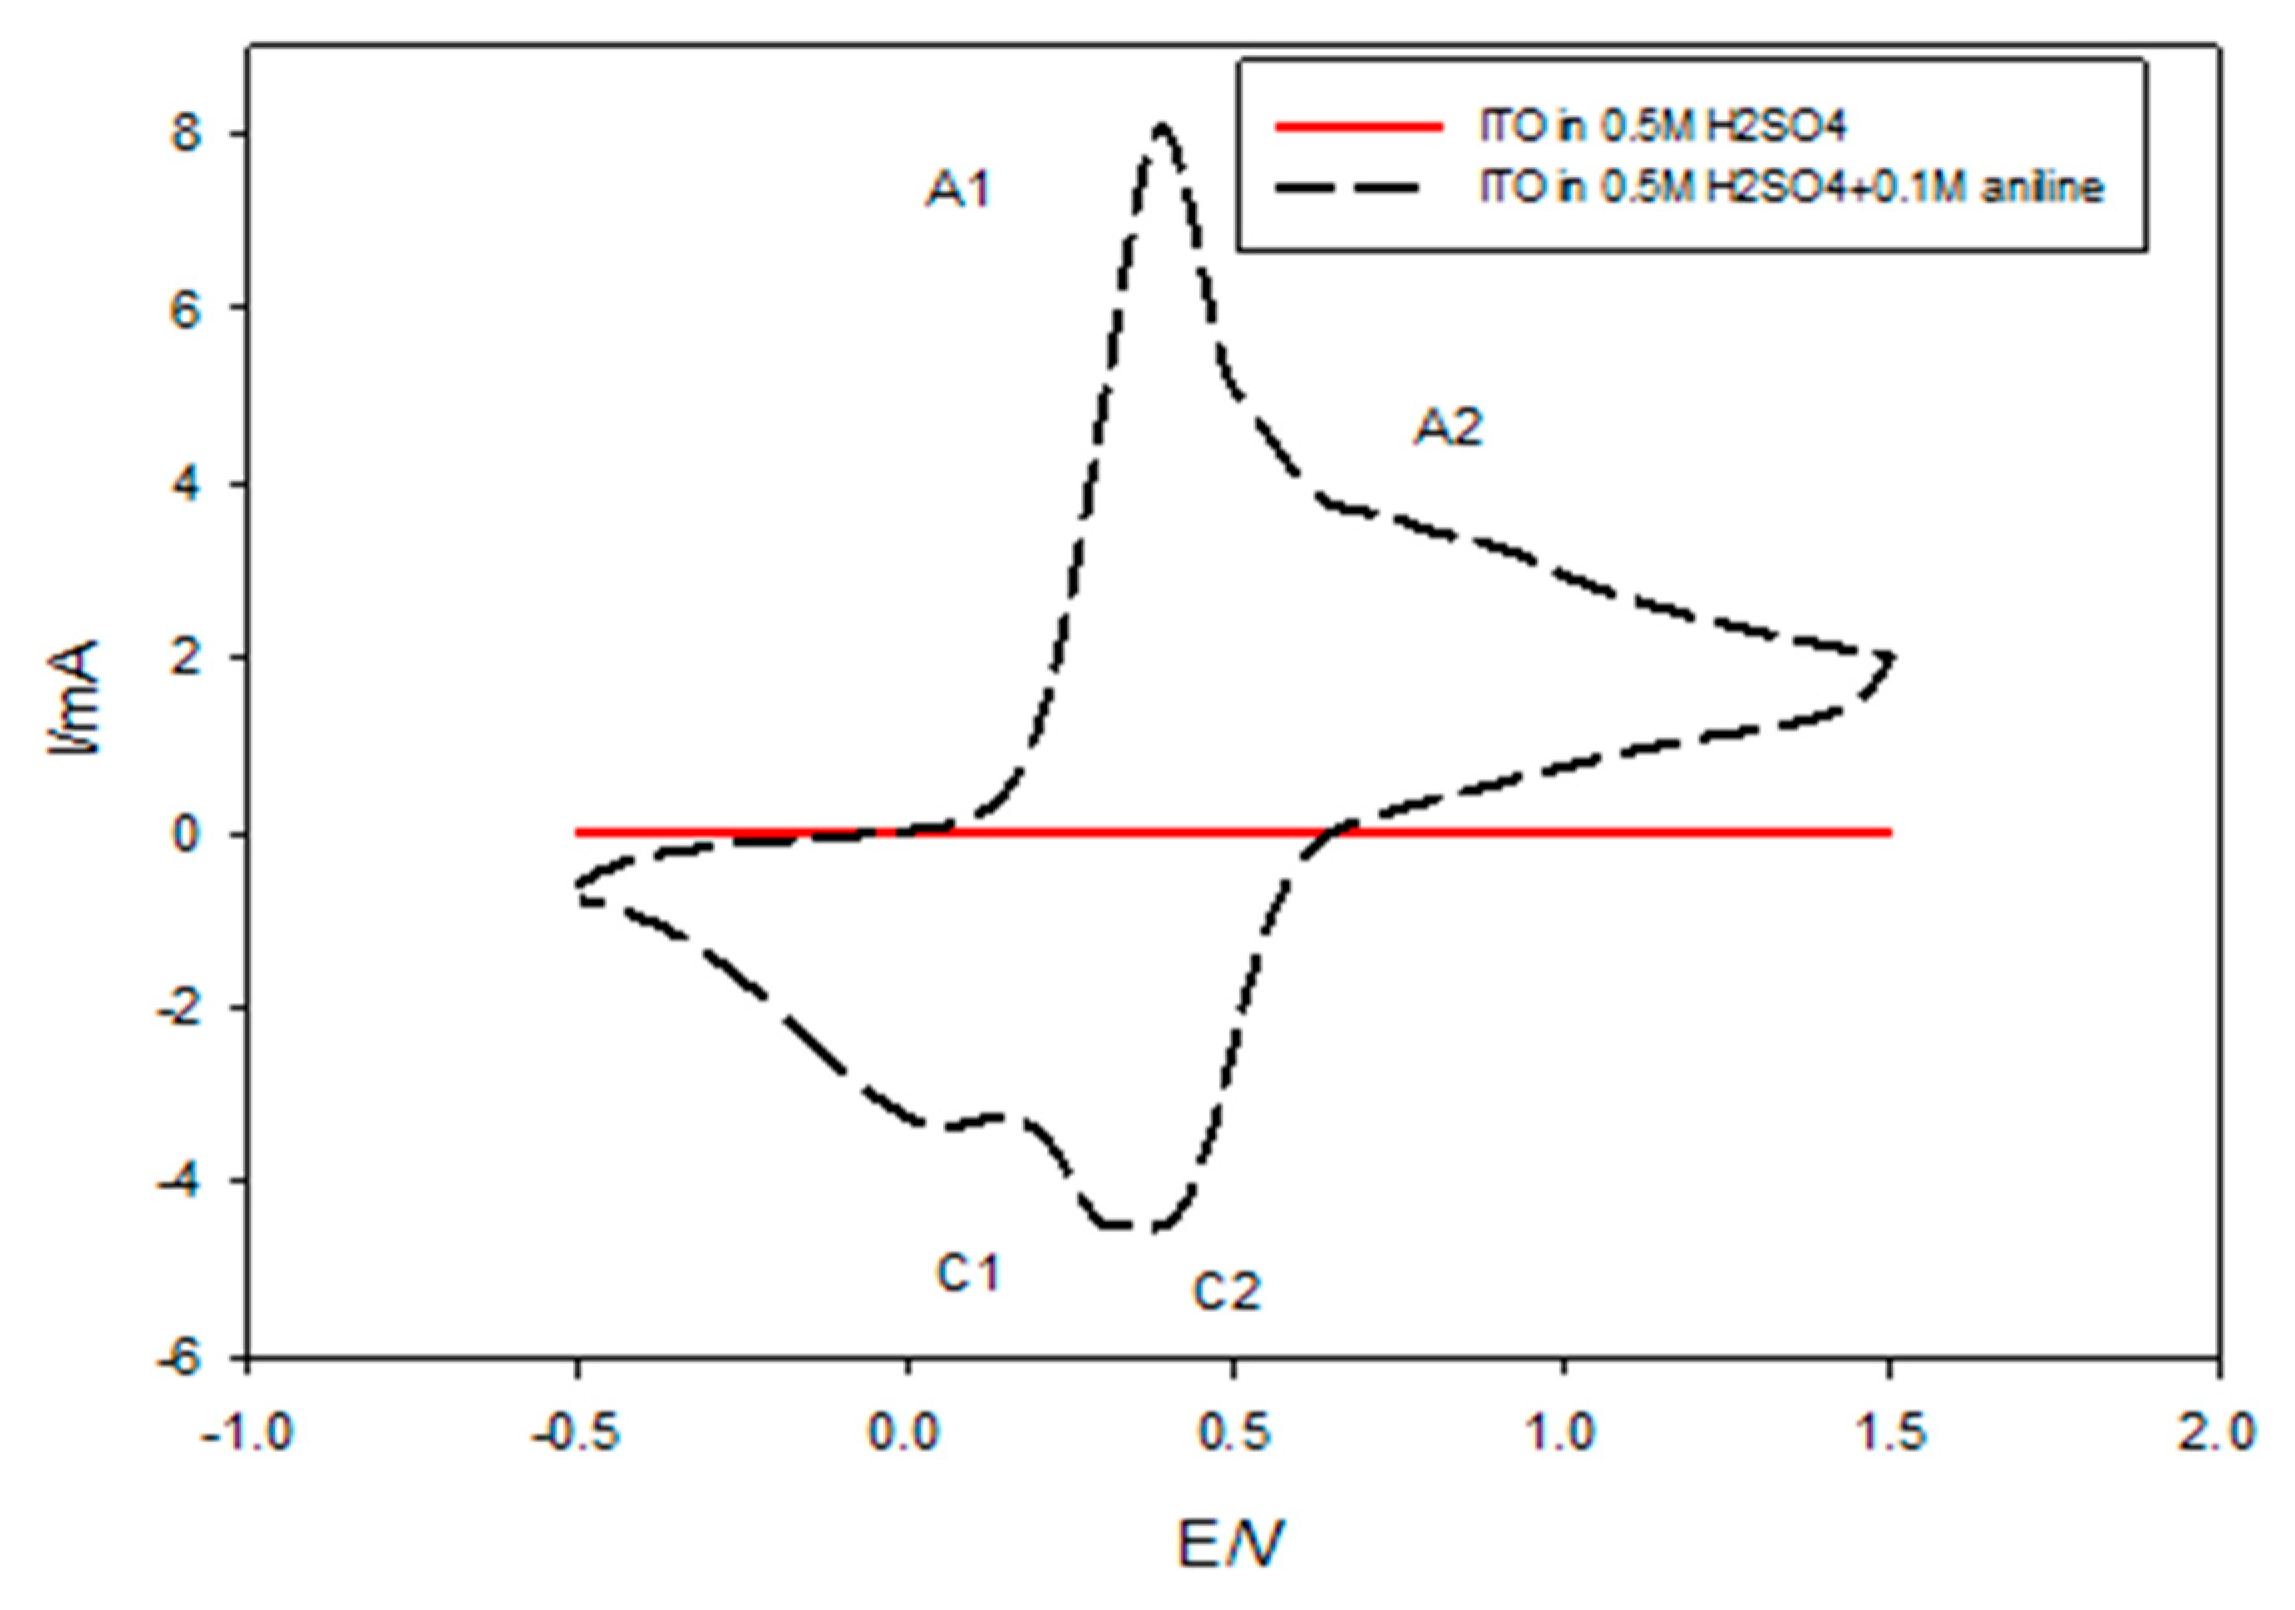
3.3. Electrochemical Polymerization and CV

The mode of the galvanostaic technique for PANI deposition is illustrated in Figure 4, which shows the variation of potential with deposition time at a constant current density (6 mA/cm2). It can be seen that the initial variation in the electropolymerization curve was due to the nucleation and growth phenomenon. Nucleation started with the formation of polymer seeds on the ITO surface. After about 25 s, a fait green-color layer of PANI was observed. At ~125 s, a dark green-color film was formed, indicating the formation of PANI on ITO.
A very common electrochemical technique for the deposition of PANI is CV. In this technique, a voltage potential employed through the electrode–solution interface is varied and the resulting current is measured. The endurance of CV elicits a mechanistic test of redox systems; this is quite valuable because of its ability to identify important peaks of conducting polymers [51].
The electrochemical polymerization of PANI nanocomposites films was investigated and compared with pure PANI thin films using the CV technique. From the preliminary experiment, Figure 5 illustrates the cyclic voltammogram of PANI from an acidic solution of 0.5 M H2SO4 containing 0.1 M aniline recorded for 10 successive cycles at a scan rate of 0.1 mV/s for a potential range from −0.5 to +1.50 V/SCE to illustrate the exact position of the oxidation and the reduction of peaks. PANI exhibited two oxidative peaks A1 and A2 appearing at 358 and 826 mV, respectively, coupled with two reductive peaks C1 and C2, which appeared at 41 and 358 mV, respectively. In the positive direction, the observed current density at 0.4 V was increased due to the initial stage of oxidation of the monomer. The current peak in the negative direction at 0.0548 V was due to the initial stage of the nucleation of the polymer film, while the cathodic peak observed at 0.4 V corresponded to the reduction of the polymer film obtained in a direct sweep [52].
The effect of cycle numbers on the deposition of PANI using the CV technique at a scan rate of 0.1 mV/s with a potential range of −0.5 to 1.5 V/SCE has been investigated, as shown in Figure 6. The cyclic voltammogram curve obtained during the first cycle (inset in Figure 6) revealed that, in the positive direction, the increase in the current density at (0.38 V) was due to the oxidation of the monomer, while the current increase in the negative direction at (−0.4024 V) was due to the initial stage of the nucleation of the polymer film. The cyclic voltammogram of ITO in the acidic solution containing aniline monomer was recorded for 5, 10, 20, and 30 successive cycles. It can be seen that, the redox charge of PANI film continued to grow by the repetition of potential cycling. The cathodic charge increased linearly with the number of potential cycling. This indicated that the building of PANI film was proportional to the number of potential cycles.
The photographs of the PANI films electrodeposited at different numbers of deposition cycles (5, 10, 20, and 30) on the ITO glass are shown in Figure 7. It can be seen that the PANI thin layer (emeraldine base) was deposited on the glass. Further increase in the number of cycles showed that the thickness of the PANI layer had a remarkable increase, and the color of PANI film became darker and darker. The PANI film electrodeposited at 30 cycles was in dark green (Figure 7d).
Figure 8 shows the surface morphology of PANI films obtained on ITO with different cyclic numbers at a constant applied potential. Figure 8a exhibits the surface morphology of the PANI-coated film deposited after 5 cycles; it is obvious that the film was very thin and the coating was non-uniform which means that some segments on the surface of the ITO were not fully coated. On the other hand, the coating thickness increased with increasing cycles (Figure 8b–d), and at a large number of cycles (30 cycles), the film became more compact and dense.

3.4. FE-SEM Analysis

Figure 8b–d demonstrate that the number of cycles have a great effect on the morphology of the coatings. The morphology of the coating produced at 10 cycles was characterized by fine nanofibers with an average diameter of 80 nm. At 20 cycles, the coating morphology showed a mix of granular and fibrous structures. A clear growth of the fibrous diameter (170 nm) was found when compared to one developed at 10 cycles. At the largest number of cycles (30 cycles), the coating morphology mainly transformed into a granular morphology. The granular structure is the most common form of morphology of the PANI [53]. This is a typical growth of polymer chains in heterogeneous conditions from random aggregates of nucleates. It has been reported that the type of the template greatly affects the structure and morphology of the deposited PANI films. In general, films grown on hydrophilic surfaces have a granular structure and a rough profile. On the other hand, a more uniform films are produced on hydrophobic surfaces [54,55]. CA measurements showed that, for the smallest number of deposition cycles (5 cycles), the CA was determined to be approximately 91° (as shown in the inset of Figure 8a), and for the largest number of deposition cycles (30 cycles), the CA was approximately 97° (as shown in the inset of Figure 8d), confirming that the formed film was hydrophobic but it is still too low to be considered superhydrophobic.

3.5. XPS Analysis

XPS analysis was used to determine the chemical composition of PANI thin films polymerized at different cycling potentials (–0.5 to 1.5 V) for 30 cycles (optimum condition). The full survey of XPS for PANI thin films is displayed in Figure 9a. The XPS survey scan shows the presence of oxygen (O1s at ~532 eV, nitrogen (N1s at ~399 eV), carbon (C1s at ~285.03 eV), as well as sulfur (Sl2p at ~168.34 eV). Oxygen in an emeraldine-base PANI can emerge from the partial oxidation of the film surface or from weakly complexed oxygen atoms [56]. Carbon and nitrogen were assigned to the spine of PANI, whereas the sulfur was a counter ion in the case of protonated PANI samples or originated from the supporting electrolyte (H2SO4) that was utilized for the deposition process. From Figure 9b (analysis of C peaks), three peaks were observed at 284.84, 285.92, and 287.54 eV, and can be attributed to C–C, C–O, and C=O, respectively. The spectrum survey contains a high-intensity peak centered at 285.92 eV, which has an insignificant asymmetric broadening towards high binding energies due to an incorporation of the protonation of imine and amine sites. Small, high binding energy tails (BE = 287.54 eV) are due to the π–π* bonding band, which has a long-range order with a polymer chain. The most nitrogen atoms are in the amine state with a 399.5 eV binding energy in the benzenoid amine group.
To enhance the hydrophobicity property of PANI thin film, TiO2 or ZnO nanoparticles can be incorporated with the PANI film during the polymerization process [57].
Figure 10 shows the CV plots of PANI/TiO2 and PANI/ZnO thin film composites coating deposited at a scan rate of 0.1 mV/s in the potential range of –0.5 to 1.5 V/SCE for 30 cycles and with different nanoparticles contents. The results revealed that the redox currents increased with increasing the particle contents in the electrolyte. From the cyclic voltammogram curves (Figure 10a,b), it can be seen that the cathodic current increased regularly with an increasing the content of TiO2 in the solution. However, suddenly, the redox current decreased at certain contents of TiO2 (0.5g/L), which indicated that the optimum concentration of TiO2 was 0.4g/L (inset in Figure 10a). Additionally, in the case of the PANI/ZnO nanocomposite, the cathodic current increased gradually with an increasing the content of ZnO.
Figure 11 shows the FE-SEM images of PANI/TiO2 nanocomposite with different TiO2 contents. These FE-SEM images clearly reveal that the TiO2 NPs during the polymerization of PANI has a strong effect on the morphological evolution of the formed PANI nanocomposite. It was found that in the case of a higher concentration of TiO2 nanoparticle (0.4 g/L) in the solution, the composites showed a transformation in morphology from typical particles to fibers with a much denser coat in comparison to the thin composite layer obtained in the case of a lower content of TiO2 (0.03 and 0.125 g/L).
Figure 11b shows that the morphology of the coating was mainly a granular structure. Increasing the content of TiO2 to 0.225 g changed the morphology to rough fibers with an average diameter of 275 nm. At the highest concentration of TiO2, a finer and more organized, nanofibrous morphology developed.
When measuring the CA for the as-prepared surface, it was determined to be 100°, 125°, 144°, and 146° for 0.03, 0.125, 0.225, and 0.4 g/L TiO2, respectively, as shown in Figure 10a–d. This result indicated that the PANI coating is intrinsically hydrophobic (CA = 100) even at the lowest concentration of TiO2. Moreover, at the highest concentration of TiO2 (0.4g/L), the CA reached 146°, which is practically considered superhydrophobic as previously mentioned [7]. Figure 11d (higher magnification of Figure 11c) shows a nanoscale hair-like feature on the top of the fibers. This type of hierarchical structure plays a major role in enhancing the hydrophobicity. It has been suggested that the polymerization of PANI on heterogeneous micro- and nanostructured surfaces gives rise to non-uniform coatings [53].
This result confirmed that the surface with a higher content of TiO2 exhibited superhydrophobicity. Accordingly, the concentration of the functionalized TiO2 nanoparticles in the nanofluid has an important role in controlling the hierarchical structure and the chemical composition of the surface.
The CA increased with the concentration of the nanofluid for the same droplet volume, reached a peak, and then decreased. It has been recognized that the nanoparticles have more efficiency in increasing the CA for the same droplet volume. The experiments above indicated that nanoparticles can be effective in engineering the wettability of the surface and possibly the surface tension [58]. FE-SEM illustrated that there was no agglomeration of TiO2 nanoparticles in the PANI matrix, and there is a uniform distribution of particles in the PANI matrix. Accordingly, it was considered that the TiO2 particles were embedded within the structure built by the PANI chains and generated the porous PANI/TiO2 composites.
Figure 12 shows the FE-SEM images of the PANI/ZnO nanocomposite with different ZnO contents. These FE-SEM images clearly revealed that the ZnO NPs have a strong effect on the morphological evolution of the PANI nanocomposites. It was observed that adding nanoparticles during the polymerization leads to changing the morphology of PANI, passing from spherical particles to nanofibers. In the case of adding ZnO with a high concentration (0.5 g/L, Figure 12d), the composites showed a transformation in morphology from granular (free ZnO, Figure 12a) to fibrous, more compact, highly aggregated, and rapid sedimentation compared to the composite layer obtained with a lower content of ZnO (0.2 g/L, Figure 12b). By measuring the CA for the as- prepared surface, it was determined to be 97°, 125°, and 136° for 0, 0.2, and 0.5g/L ZnO, respectively, as shown in the insets of Figure 12a,b,d. Further, it was determined that the largest CA (136°) was assigned to the highest concentration of ZnO (0.5g/L). This result confirmed that the surface with a higher content of ZnO exhibited a higher degree of hydrophobicity. Thus, there was a clear enhancement of hydrophobicity as a result of the addition of ZnO nanoparticles. FE-SEM images illustrated that there was no agglomeration of ZnO nanoparticles in the PANI matrix, and there was a uniform distribution of particles in the PANI matrix. Accordingly, it was considered that the ZnO particles were embedded within the structure built by the PANI chains and generated the porous PANI/ZnO composites. Moreover, Figure 12d shows a nanoscale hair-like feature on the top of fibers. Again, this type of hierarchical structure plays a major role in enhancing the hydrophobicity.
The formation of PANI/TiO2 nanocomposite formed at cycling potentials (–0.5 to 1.5 V) for 30 cycles with different TiO2 concentrations was further confirmed utilizing XPS analysis, as shown in Figure 13. It is clear that there was a peak for Ti, confirming the presence of Ti species in the composite. The XPS spectra of Ti2p (Figure 13e) show two peaks at 458.97 and 464.59 eV, corresponding to Ti2p3/2 and Ti2p1/2 spin orbital splitting in the Ti 4+ chemical state. This result is in strong agreement with the result by Li et al. [59]. The Ti2p1/2 peak is broader than the Ti2p3/2 peak at the moment, and this phenomenon, the Coster–Kronig effect, has appeared often in the literature [60]. Red shifts toward a high binding energy were far from the pure TiO2 (452.92 and 464.89 eV). This binding energy shifts could be due to a change in the chemical state or electronic interaction between the PANI surface and the TiO2 nanoparticles [61]. From Figure 13b and Figure 14b, three peaks located at 284.31, 284.9 and 286.94 eV were observed and can be attributed to C–C, C–O, and C=O, respectively.
The compositional information of the as-prepared samples of PANI/ZnO nanocomposites has been investigated by the XPS technique (Figure 14). The spectra detected that there is a peak exhibited at 1021.95 eV, which is attributed to the Zn2p3 demonstrating the presence of ZnO in the composite. Moreover, the XPS survey shows the presence of oxygen (O1s, ~634.64 eV), nitrogen (N1s, ~399.28 eV), carbon (C1s at ~288.27 eV), calcium (Ca2p at ~351.01 eV), phosphorus (P2p at ~136.85 eV), zirconium (Zr3d3 at ~185.91 eV), and silicon (Si2p at ~106.04 eV).

4. Conclusions

The following conclusions can be drawn from this investigation.
  • The electrochemical polymerization using the CV method was employed to prepare PANI and the PANI/TiO2 and ZnO nanocomposites. Comprehensive characterization and analysis were presented.
  • HR-TEM images revealed that the particle sizes of the prepared powders (ZnO and TiO2) were in the ranges of 13 and 6.5 nm, respectively.
  • FE-SEM images of the PANI/TiO2 and PANI/ZnO nanocomposites showed the formation and morphological evolution of the PANI thin films. The mechanism of morphological growth of the PANI nanocomposites was discussed.
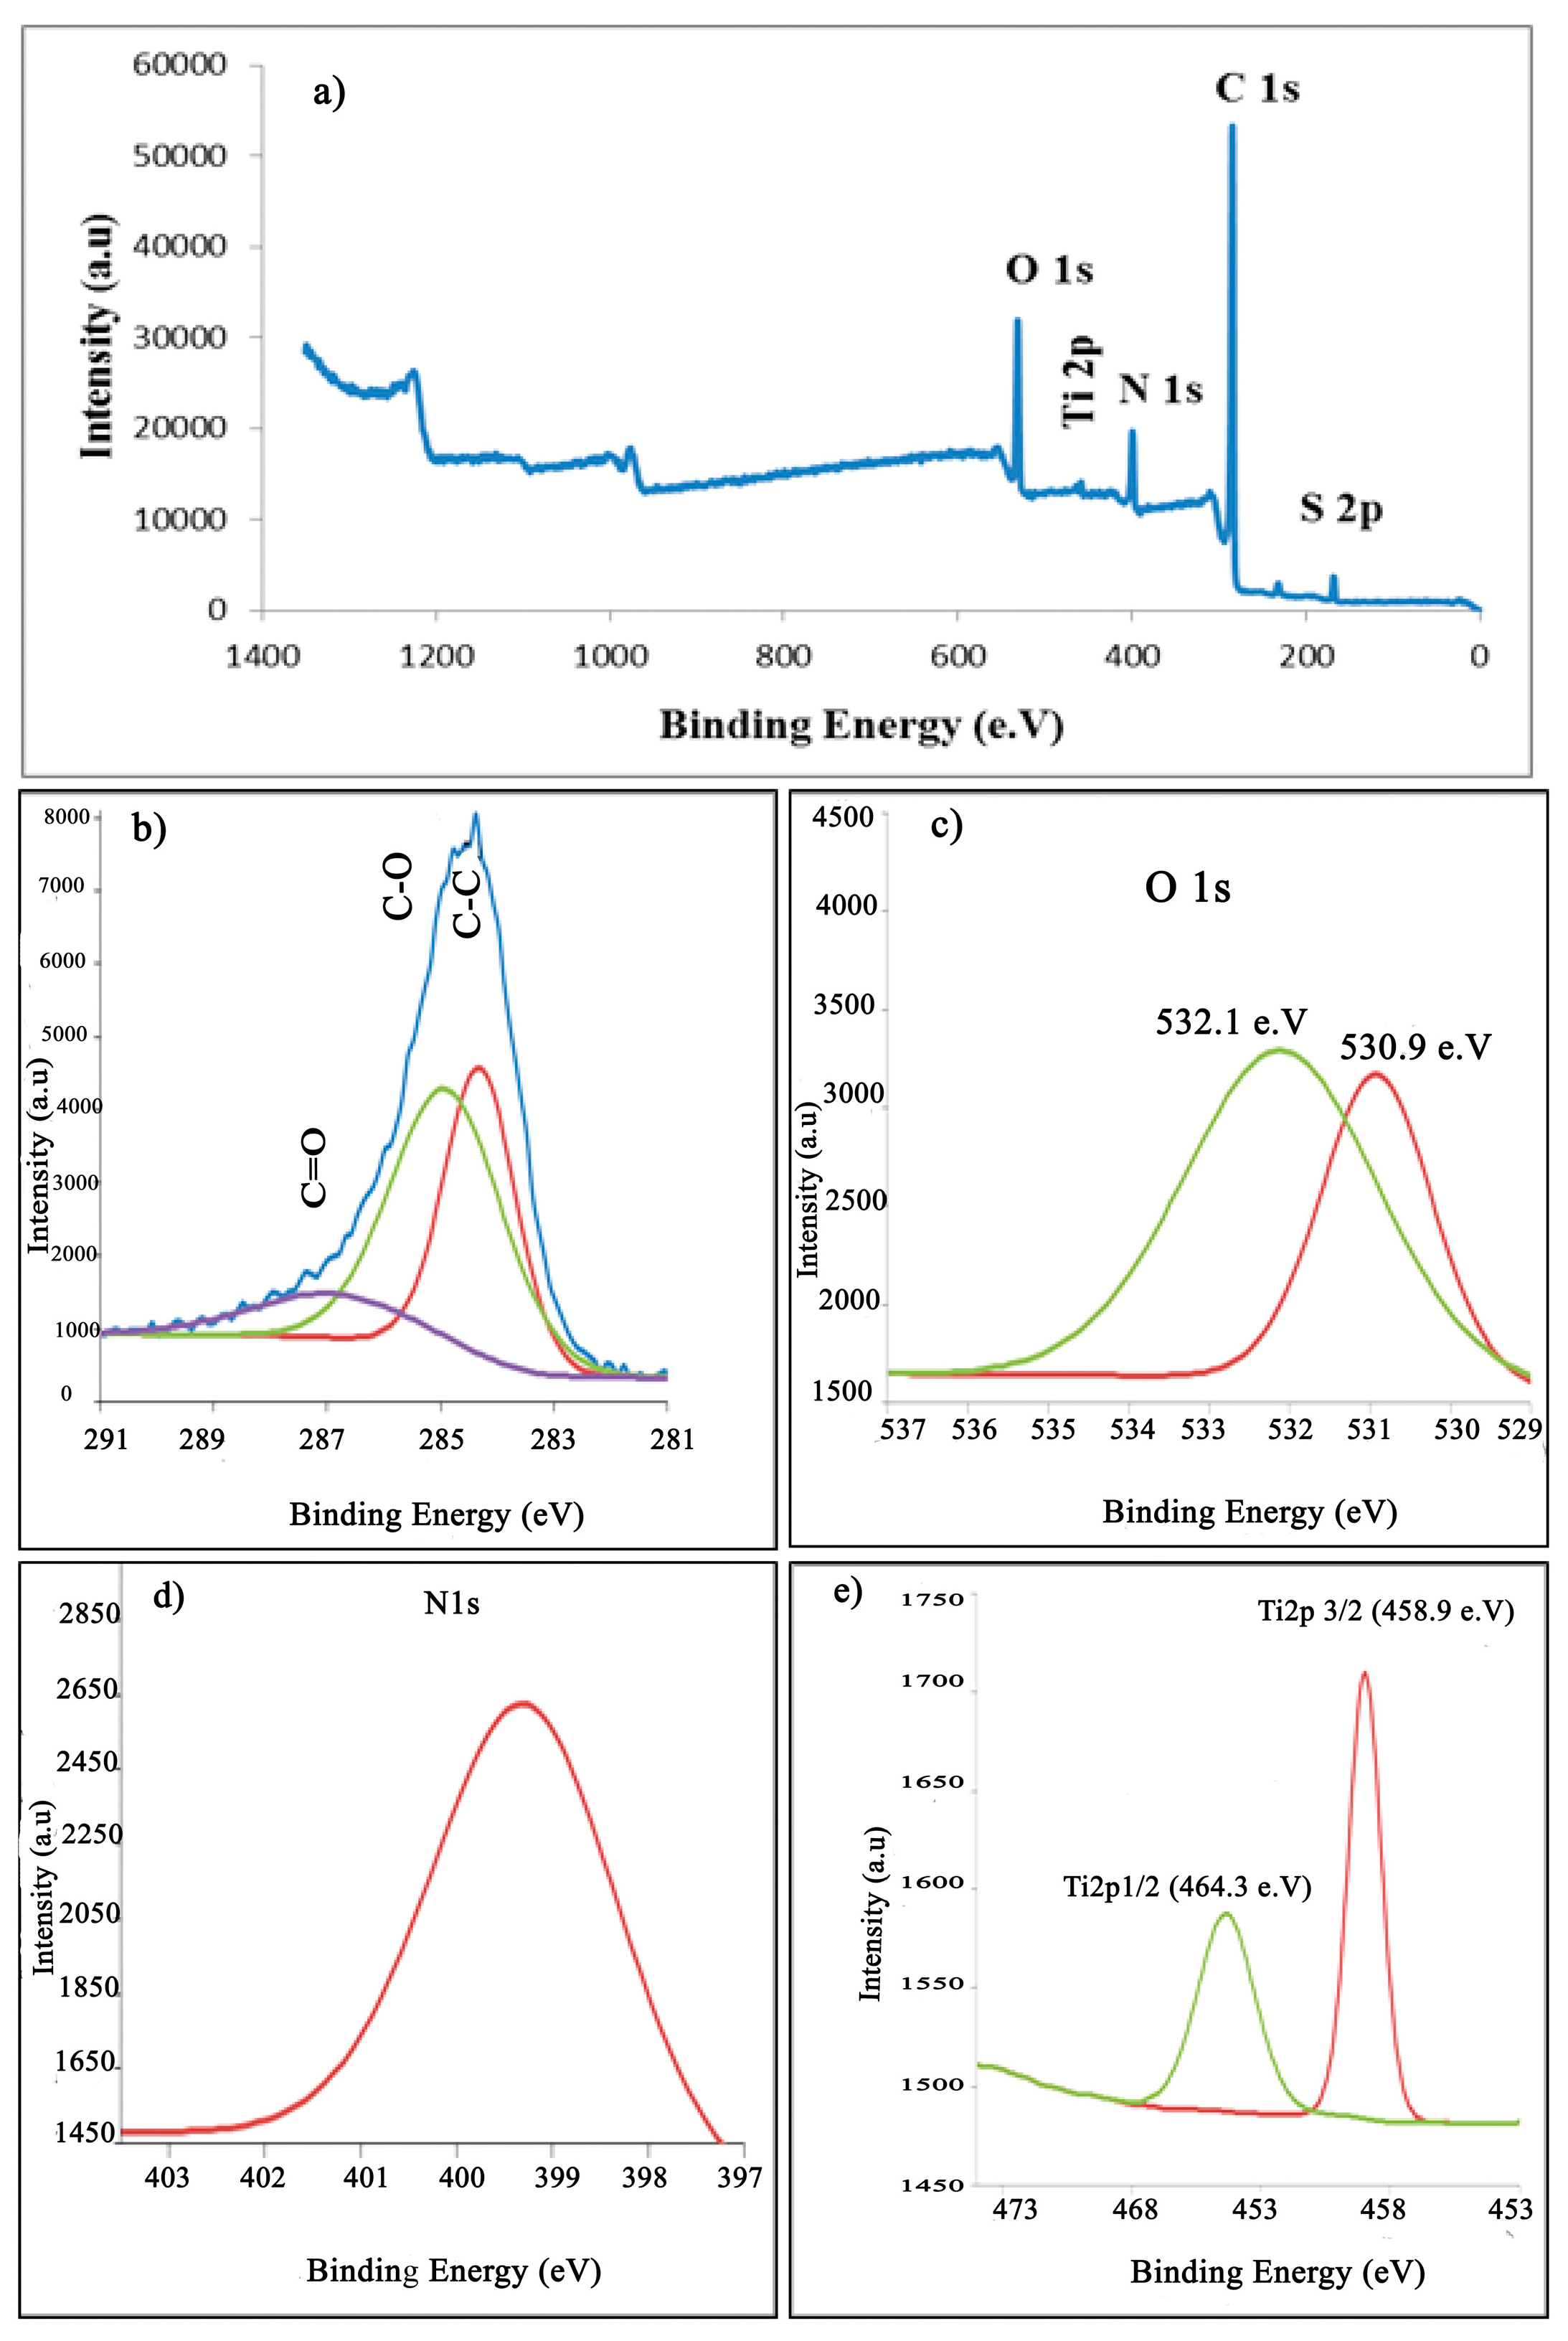
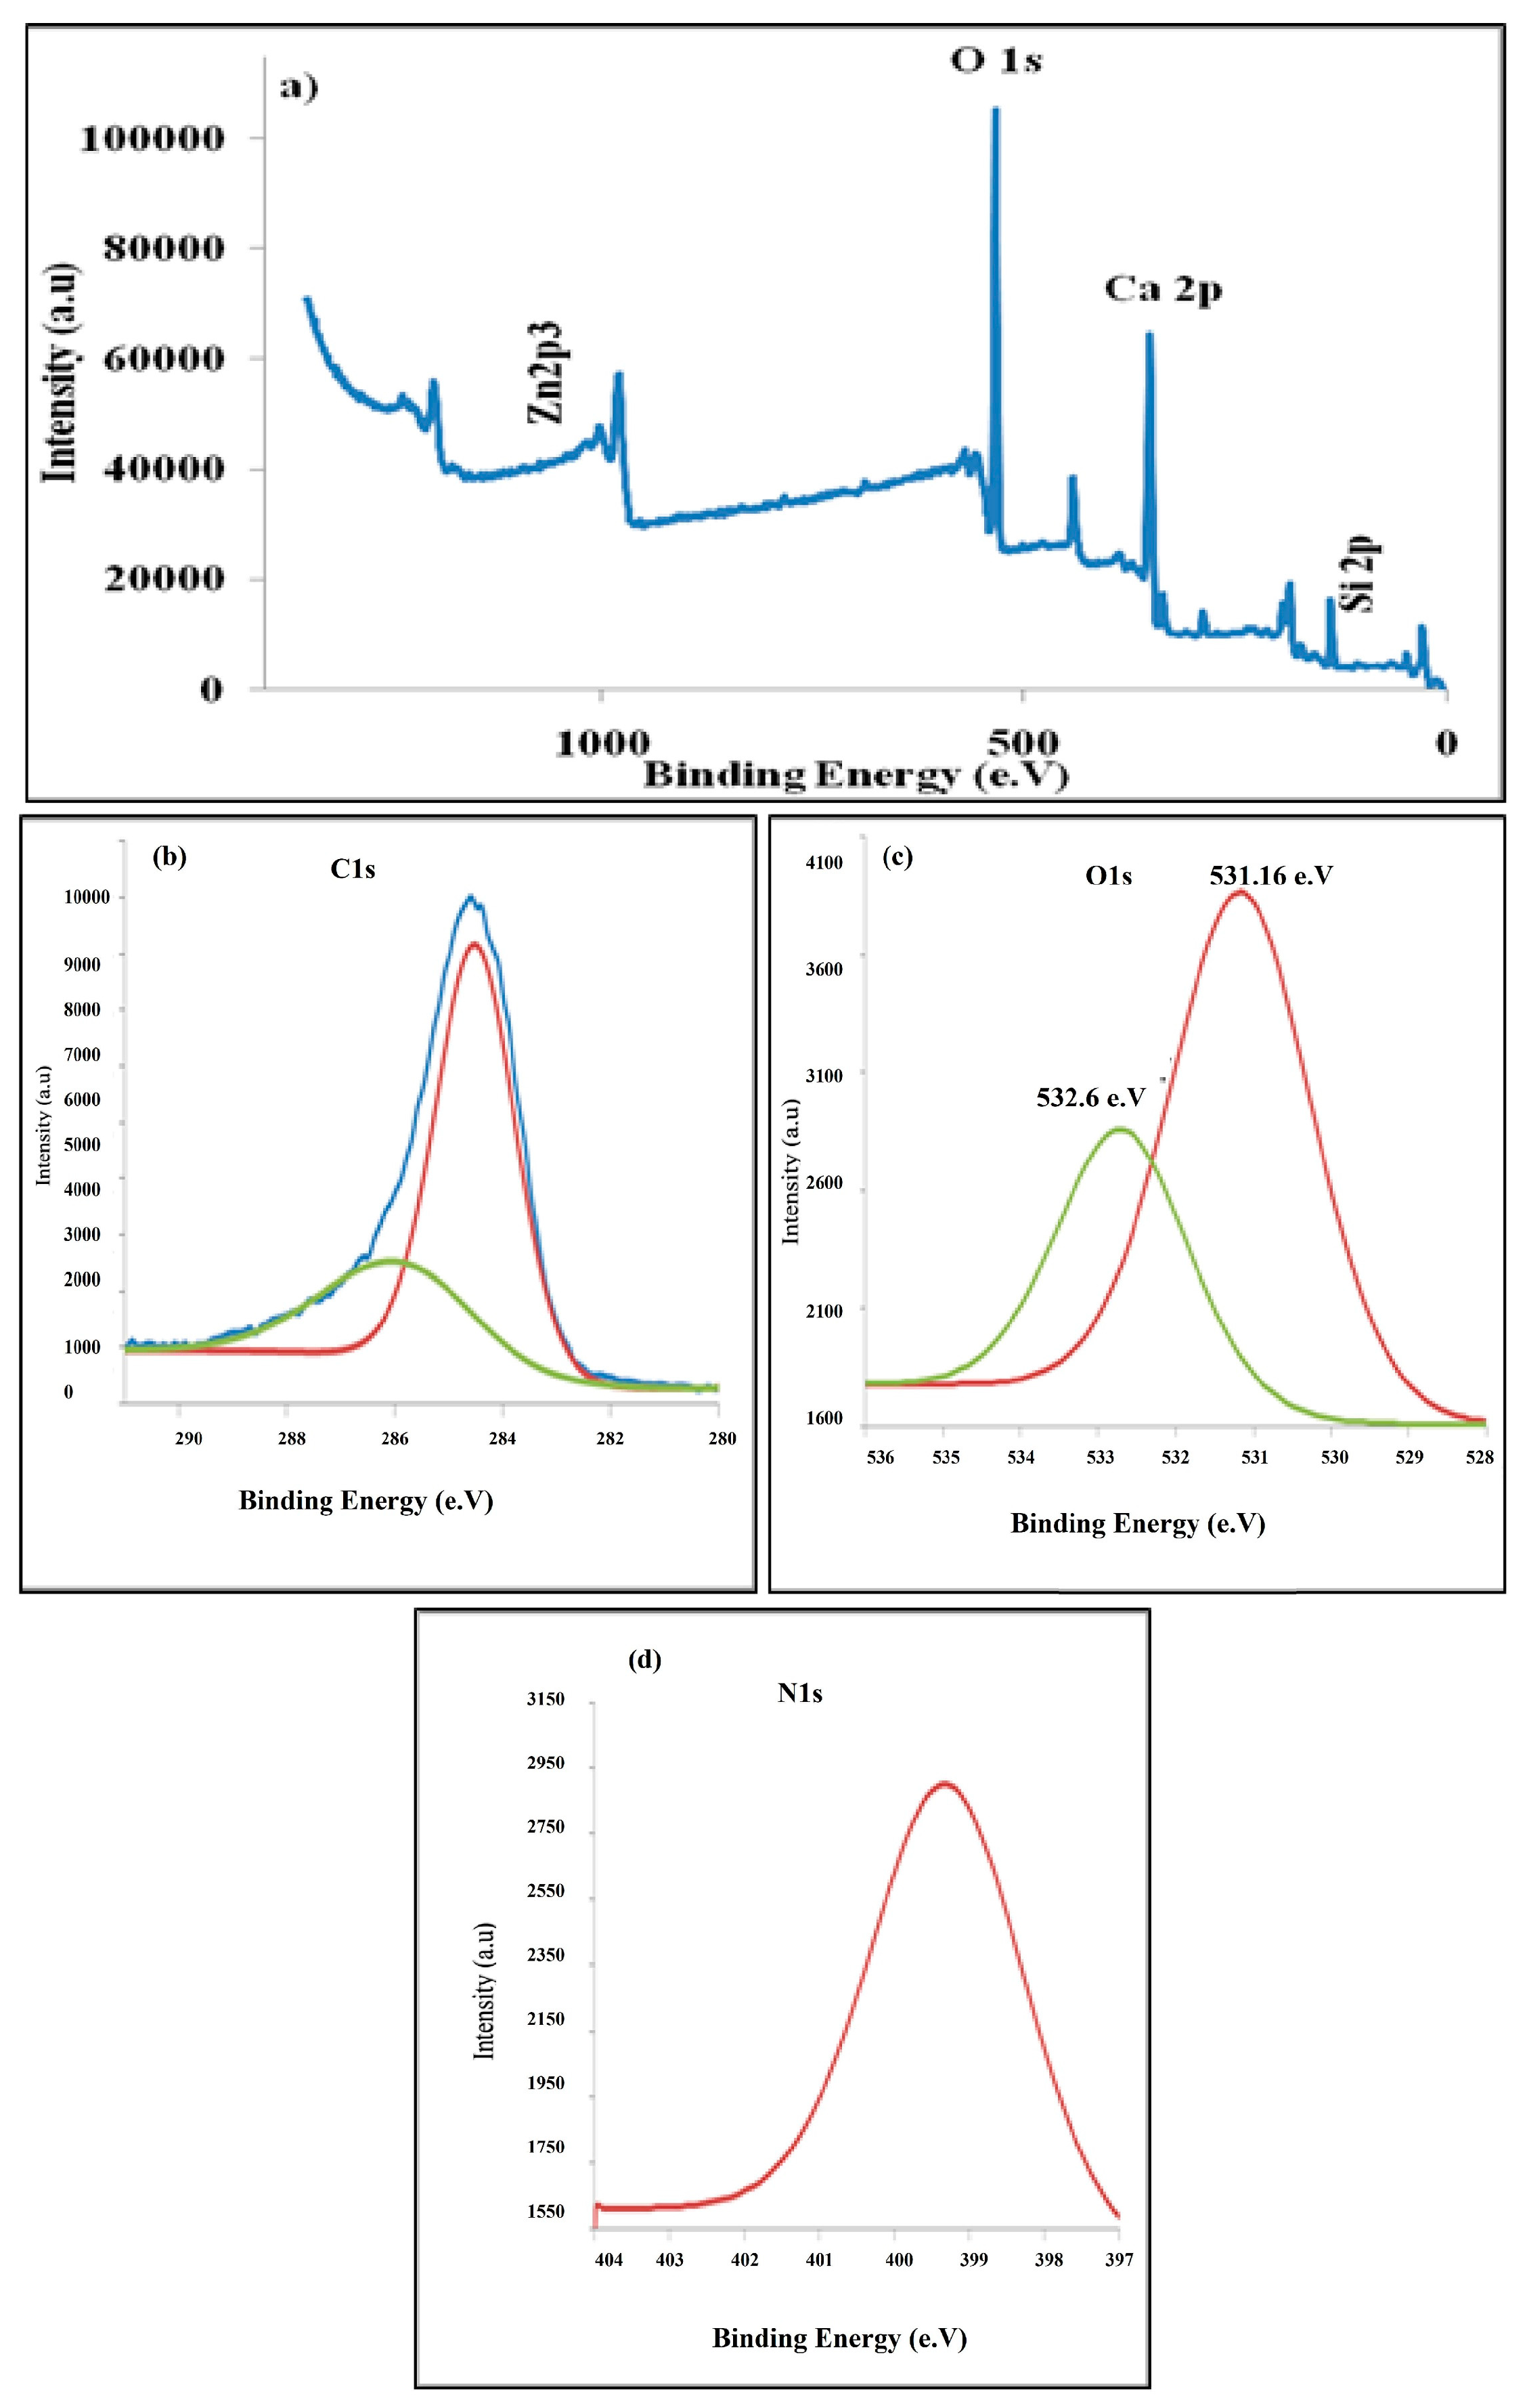
  • The XPS chemical and surface analysis was used to study the surface chemistry and the surface composition of PANI and the PANI nanocomposites. Detailed information from the scan spectrum was presented for all elements in the thin film. The analysis confirmed that the incorporation of the oxide nanoparticles in the matrix.
  • The results clearly indicated that a superhydrophobic PANI coating can be produced by a simple and inexpensive electrochemical polymerization technique.
  • The maximum water CA of the prepared coating layer with TiO2 reached 146° without any optimization for the produced coatings.

Author Contributions

Investigation and Data Analysis: M.H.G., S.S.A.R., and M.A.H.; Writing of the Original Draft and Preparation: Z.A.H.; Critical Analysis, Submission and Revision: A.I.

Funding

This research received no external funding.

Conflicts of Interest

The authors declare no conflicts of interest.

References

  1. Barthlott, W.; Neinhuis, C. Purity of the sacred lotus, or escape from contamination in biological surfaces. Planta 1997, 202, 1–8. [Google Scholar] [CrossRef]
  2. Feng, L.; Li, S.; Li, Y.; Li, H.; Zhang, L.; Zhai, J.; Song, Y.; Liu, B.; Jiang, L.; Zhu, D. Super-hydrophobic surfaces: From natural to artificial. Adv. Mater. 2002, 14, 1857–1860. [Google Scholar] [CrossRef]
  3. Koch, K.; Barthlott, W. Superhydrophobic and superhydrophilic plant surfaces: An inspiration for biomimetic materials. Philos. Trans. R. Soc. A 2009, 367, 1487–1509. [Google Scholar] [CrossRef] [PubMed]
  4. Ensikat, H.J.; Ditsche-Kuru, P.; Neinhuis, C.; Barthlott, W. Superhydrophobicity in perfection: The outstanding properties of the lotus leaf. Beilstein J. Nanotechnol. 2011, 2, 152–161. [Google Scholar] [CrossRef] [PubMed]
  5. Barthlott, W.; Mail, M.; Neinhuis, C. Superhydrophobic hierarchically structured surfaces in biology: Evolution, structural principles and biomimetic applications. Philos. Trans. R. Soc. A 2016, 374, 20160191. [Google Scholar] [CrossRef] [PubMed]
  6. Lu, Y.; Sathasivam, S.; Song, J.; Crick, C.R.; Carmalt, C.J.; Parkin, I.P. Robust self-cleaning surfaces that function when exposed to either air or oil. Science 2015, 347, 1132–1135. [Google Scholar] [CrossRef] [PubMed]
  7. Law, K.Y. Definitions for hydrophilicity, hydrophobicity, and superhydrophobicity: Getting the basics right. J. Phys. Chem. Lett. 2014, 5, 686–688. [Google Scholar] [CrossRef] [PubMed]
  8. Tang, Y.; Zhang, Q.; Zhan, X.; Chen, F. Superhydrophobic and anti-icing properties under overcooled temperature of fluorinated hybrid surface prepared via sol-gel process. Soft Matter 2015, 11, 4540–4550. [Google Scholar] [CrossRef] [PubMed]
  9. Banerjee, I.; Ravindra, C.; Pangule, S.; Ravi, K. Antifouling coatings: Recent developments in the design of surfaces that prevent fouling by proteins, bacteria and marine organisms. Adv. Mater. 2011, 23, 690–718. [Google Scholar] [CrossRef] [PubMed]
  10. Young, B.; Pitt, W.; Cooper, S. Protein adsorption on polymeric biomaterials: II. Adsorption kinetics. J. Colloid Interface Sci. 1988, 124, 28–43. [Google Scholar] [CrossRef]
  11. Horbett, T. Protein adsorption on biomaterials, Biomater. Interfacial Phenom. Appl. 1982, 199, 233–244. [Google Scholar]
  12. Zhu, Y.; Wang, D.; Jiang, L.; Jin, J. Recent Progress in Developing Advanced Membranes for Emulsified Oil/Water Separation. Npg Asia Mater. 2014, 6, e101. [Google Scholar] [CrossRef]
  13. Chen, P.C.; Xu, Z.K. Mineral-Coated Polymer Membranes with Superhydrophilicity and Underwater Superoleophobicity for Effective Oil/Water Separation. Sci. Rep. 2013, 3, 2776. [Google Scholar] [CrossRef] [PubMed]
  14. Huang, X.; Lim, T.T. Performance and Mechanism of a Hydrophobic—Oleophilic Kapok Filter for Oil/Water Separation. Desalination 2006, 190, 295–307. [Google Scholar] [CrossRef]
  15. Zhang, D.; Wang, L.; Qian, H. Superhydrophobic surfaces for corrosion protection: A review of recent progresses and future directions. J. Coat. Technol. Res. 2016, 13, 11. [Google Scholar] [CrossRef]
  16. Bhushan, B.; Koch, K.; Jung, Y. Fabrication and characterization of the hierarchical structure for superhydrophobicity and self-cleaning. Ultramicroscopy 2009, 109, 1029–1034. [Google Scholar] [CrossRef] [PubMed]
  17. Peng, P.; Ke, Q.; Zhou, G.; Tang, T. Fabrication of microcavity-array superhydrophobic surfaces using an improved template method. J. Colloid Interface Sci. 2013, 395, 326–328. [Google Scholar] [CrossRef] [PubMed]
  18. Vandencasteele, N.; Merche, D.; Reniers, F. XPS and contact angle study of N2 sand O2 plasma-modified PTFE, PVDF and PVF surfaces. Surf. Interface Anal. 2006, 38, 526–530. [Google Scholar] [CrossRef]
  19. Zhai, F.; Cebeci, F.; Cohen, R.; Rubner, R. Stable Superhydrophobic Coatings from Polyelectrolyte Multilayers. Nano Lett. 2004, 4, 1349. [Google Scholar] [CrossRef]
  20. Zhang, L.; Sun, J. Layer-by-layer codeposition of polyelectrolyte complexes and free polyelectrolytes for the fabrication of polymeric coatings. Macromolecules 2010, 43, 2413–2420. [Google Scholar] [CrossRef]
  21. Michielsen, S.; Lee, H.J. Design of a superhydrophobic surface using woven structures. Langmuir 2007, 23, 6004–6010. [Google Scholar] [CrossRef] [PubMed]
  22. Ogawa, T.; Ding, B.; Sone, Y.; Shiratori, S. Super-hydrophobic surfaces of layer-by-layer structured film-coated electrospun nanofibrous membranes. Nanotechnology 2007, 18, 165607. [Google Scholar] [CrossRef]
  23. Ma, M.; Mao, Y.; Gupta, M.; Gleason, K.K.; Rutledge, G.C. Superhydrophobic fabrics produced by electrospinning and chemical vapor deposition. Macromolecules 2005, 38, 9742–9748. [Google Scholar] [CrossRef]
  24. Wang, X.; Ding, B.; Yu, J.; Wang, M. Engineering biomimetic superhydrophobic surfaces of electrospun nanomaterials. Nano Today 2011, 6, 510–530. [Google Scholar] [CrossRef]
  25. Ganesh, V.A.; Raut, H.K.; Nair, A.S.; Ramakrishna, S. A review on self-cleaning coatings. J. Mater. Chem. 2011, 21, 16304–16322. [Google Scholar] [CrossRef]
  26. Han, D.; Steckl, A.J. Superhydrophobic and oleophobic fibers by coaxial electrospinning. Langmuir 2009, 25, 9454–9462. [Google Scholar] [CrossRef] [PubMed]
  27. Allcock, H.R.; Steely, L.B.; Singh, A. Hydrophobic and superhydrophobic surfaces from polyphosphazenes. Polym. Int. 2006, 55, 621–625. [Google Scholar] [CrossRef]
  28. Ding, B.; Ogawa, T.; Kim, J.; Fujimoto, K.; Shiratori, S. Fabrication of a super-hydrophobic nanofibrous zinc oxide film surface by electrospinning. Thin Solid Film. 2008, 516, 2495–2501. [Google Scholar] [CrossRef]
  29. Aguilar-Morales, A.I.; Alamri, S.; Lasagni, A.F. Micro-fabrication of high aspect ratio periodic structures on stainless steel by picosecond direct laser interference patterning. J. Mater. Proc. Technol. 2018, 252, 313–321. [Google Scholar] [CrossRef]
  30. Levkin, P.A.; Svec, F.; Fréchet, J.M. Porous polymer coatings: A versatile approach to superhydrophobic surfaces. Adv. Funct. Mater. 2009, 19, 1993–1998. [Google Scholar] [CrossRef] [PubMed]
  31. Ates, M.; Topkaya, E. Nanocomposite film formations of polyaniline via TiO2, Ag, and Zn, and their corrosion protection properties. Prog. Org. Coat. 2015, 82, 33–40. [Google Scholar]
  32. MacDiarmid, A. Synthetic Metals: A Novel Role for Organic Polymers. Angew. Chem. Int. Ed. 2001, 40, 2581–2590. [Google Scholar] [CrossRef]
  33. Li, D.; Huang, J.; Kaner, R. Polyaniline nanofibers: A unique polymer nanostructure for versatile applications. Acc. Chem. Res. 2009, 42, 135–145. [Google Scholar] [CrossRef] [PubMed]
  34. Obaid, A.Y.; El-Mossalamy, E.H.; Al-Thabaiti, S.A.; El-Hallag, I.S.; Hermab, A.A.; Asiri, A.M. Electrodeposition and Characterization of Polyaniline on Stainless Steel Surface via Cyclic, Convolutive Voltammetry and SEM in Aqueous Acidic Solutions. International Journal of electrochemical science. Int. J. Electrochem. Sci. 2014, 9, 1003–1015. [Google Scholar]
  35. Dhand, C.; Dwivedi, N.; Mishra, S.; Solanki, P.R.; Mayandi, V.; Beuerman, R.W.; Ramakrishna, S.; Lakshminarayanan, R.; Malhotra, B.D. Polyaniline-based biosensors. Nanobiosens. Dis. Diagn. 2015, 4, 25–46. [Google Scholar]
  36. Ge, J.; Cheng, G.; Chen, L. Transparent and flexible electrodes and supercapacitors using polyaniline/single-walled carbon nanotube composite thin films. Nanoscale 2011, 3, 3084–3088. [Google Scholar] [CrossRef] [PubMed]
  37. Domingues, S.H.; Salvatierra, R.V.; Oliveira, M.M.; Zarbin, A.J. Transparent and conductive thin films of graphene/polyaniline nanocomposites prepared through interfacial polymerization. Chem. Commun. 2011, 47, 2592–2594. [Google Scholar] [CrossRef] [PubMed]
  38. Bandgar, D.K.; Khuspe, G.D.; Pawar, R.C.; Lee, C.S.; Patil, V.B. Facile and novel route for preparation of nanostructured polyaniline (PANi) thin films. Appl. Nanosci. 2014, 4, 27–36. [Google Scholar] [CrossRef] [Green Version]
  39. Pringsheim, E.; Terpetschnig, E.; Wolfbeis, O.S. Optical sensing of pH using thin films of substituted polyanilines. Anal. Chim. Acta 1997, 357, 247–252. [Google Scholar] [CrossRef]
  40. Tai, H.; Jiang, Y.; Xie, G.; Yu, J.; Chen, X. Fabrication and gas sensitivity of polyaniline–titanium dioxide nanocomposite thin film. Sens. Actuators B 2007, 125, 644–650. [Google Scholar] [CrossRef]
  41. Sun, H.; Luo, Y.; Zhang, Y.; Li, D.; Yu, Z.; Li, K.; Meng, Q. In situ preparation of a flexible polyaniline/carbon composite counter electrode and its application in dye-sensitized solar cells. J. Phys. Chem. C 2010, 114, 11673–11679. [Google Scholar] [CrossRef]
  42. Akhtar, M.; Weakliem, H.A.; Paiste, R.M.; Gaughan, K. Polyaniline thin film electrochromic devices. Synth. Met. 1988, 26, 203–208. [Google Scholar] [CrossRef]
  43. Chang, C.H.; Huang, T.C.; Peng, C.W.; Yeh, T.C.; Lu, H.I.; Hung, W.I.; Weng, C.J.; Yang, T.I.; Yeh, J.M. Novel anticorrosion coatings prepared from polyaniline/graphene composites. Carbon 2012, 50, 5044–5051. [Google Scholar] [CrossRef]
  44. Talo, A.; Passiniemi, P.; Forsen, O.; Yläsaari, S. Polyaniline/epoxy coatings with good anti-corrosion properties. Synth. Met. 1997, 85, 1333–1334. [Google Scholar] [CrossRef]
  45. Kalendová, A.; Sapurina, I.; Stejskal, J.; Veselý, D. Anticorrosion properties of polyaniline-coated pigments in organic coatings. Corros. Sci. 2008, 50, 3549–3560. [Google Scholar] [CrossRef]
  46. Olad, A.; Barati, M.; Shirmohammadi, H. Conductivity and anticorrosion performance of polyaniline/zinc composites: Investigation of zinc particle size and distribution effect. Prog. Org. Coat. 2011, 72, 599–604. [Google Scholar] [CrossRef]
  47. Qu, M.; Zhao, G.; Cao, X.; Zhang, J. Biomimetic fabrication of lotus-leaf-like structured polyaniline film with stable superhydrophobic and conductive properties. Langmuir 2008, 24, 4185–4189. [Google Scholar] [CrossRef] [PubMed]
  48. Zhu, Y.; Hu, D.; Wan, M.X.; Jiang, L.; Wei, Y. Conducting and superhydrophobic rambutan-like hollow spheres of polyaniline. Adv. Mater. 2007, 19, 2092–2096. [Google Scholar] [CrossRef]
  49. Mostafaei, A.; Zolriasatein, A. Synthesis and characterization of conducting polyaniline nanocomposites containing ZnO nanorods. Prog. Nat. Sci. 2012, 22, 273–280. [Google Scholar] [CrossRef] [Green Version]
  50. Wessling, B. Passivation of Metals by Coating with Polyaniline: Corrosion Potential Shift and Morphological Changes. Adv. Mater. 1994, 6, 226–228. [Google Scholar] [CrossRef]
  51. Kilmartin, P.A.; Trie, L.; Wright, G.A. Corrosion Inhibition of Polyaniline and Poly(o-methoxyaniline) on stainless steel. Synth. Met. 2002, 131, 99–109. [Google Scholar] [CrossRef]
  52. Frau, A.; Pernites, R.B.; Advincula, R.C. A Conjugated Polymer Network Approach to Anticorrosion Coatings: Poly(vinylcarbazole) Electrodeposition. Ind. Eng. Chem. Res. 2010, 49, 9789–9797. [Google Scholar] [CrossRef]
  53. Sapurina, I.; Stejskal, J. The mechanism of the oxidative polymerization of aniline and the formation of supramolecular polyaniline structures. Polym. Int. 2008, 57, 1295–1325. [Google Scholar] [CrossRef]
  54. Stejskal, J.; Sapurina, I.; Trchová, M. Polyaniline nanostructures and the role of aniline oligomers in their formation. Prog. Polym. Sci. 2010, 35, 1420–1481. [Google Scholar] [CrossRef]
  55. Sapurina, I.Y.; Stejskal, J. Oxidation of aniline with strong and weak oxidants. Russ. J. Gen. Chem. 2012, 82, 256–275. [Google Scholar] [CrossRef]
  56. Song, E.; Choi, J.W. Conducting polyaniline nanowire and its applications in chemiresistive sensing. Nanomaterials 2013, 3, 498–523. [Google Scholar] [CrossRef] [PubMed]
  57. Gilja, V.; Vrban, I.; Mandić, V.; Žic, M.; Hrnjak-Murgić, Z. Preparation of a PANI/ZnO Composite for Efficient Photocatalytic Degradation of Acid Blue. Polymers 2018, 10, 940. [Google Scholar] [CrossRef] [PubMed] [Green Version]
  58. Grieshaber, D.; MacKenzie, R.; Vörös, J.; Reimhult, E. Electrochemical Biosensors—Sensor Principles and Architectures. Sensors 2008, 8, 1400–1458. [Google Scholar] [CrossRef] [PubMed]
  59. Belgherbi, O.; Chouder, D.; Lakhdari, D.; Manesri, A. Electropolymerization and Characterization of Electro Active Polyaniline Thin Films. In Proceedings of the 24th Research World International Conference, Istanbul, Turkey, 26–27 December 2016. [Google Scholar]
  60. Kang, E.T.; Neoh, K.G.; Tan, K.L. Polyaniline: A polymer with many Intrinsic Redox States. Polym. Sci. 1998, 23, 277. [Google Scholar] [CrossRef]
  61. Khalila, M.W.; Salah Eldin, T.; Hassan, H.B.; El-Sayed, K.; Abdel Hamid, Z. Electrodeposition of Ni–GNS–TiO2 nanocomposite coatings as anticorrosion film for mild steel in neutral environment. Surf. Coat. Technol. 2015, 275, 98–111. [Google Scholar] [CrossRef]
Figure 1. Field-emission scanning electron microscopy (FE-SEM) images at different magnifications of the as-prepared polyaniline (PANI) nanowire superhydrophobic surface: (a) 5000×, (b) 20,000× and (c) 80,000× [47]. Reprinted with permission from [47]; 2008 ACS Publications.
Coatings 09 00748 g001
Figure 2. XRD patterns: (a) ZnO and (b) TiO2 nanopowders.
Coatings 09 00748 g002
Figure 3. High-resolution transmission electron microscopy (HR-TEM) images of ZnO (a) and TiO2 (b) nanoparticles, (c) EDX analysis of ZnO and (d) EDX analysis of TiO2.
Coatings 09 00748 g003
Figure 4. Galvanostatic deposition of PANI thin film.
Coatings 09 00748 g004
Figure 5. Cyclic voltammogram of PANI from an acidic solution of 0.5 M H2SO4 containing 0.1 M aniline on an indium-doped tin oxide (ITO) electrode for 10 cycles of deposition.
Coatings 09 00748 g005
Figure 6. Cyclic voltammograms of PANI deposition on ITO in the presence of (0.5 M H2SO4, 0.1 M aniline) at different cycle numbers.
Coatings 09 00748 g006
Figure 7. Different color states of PANI films at different numbers of deposition cycles: (a) 5, (b) 10, (c) 20, and (d) 30 cycles.
Coatings 09 00748 g007
Figure 8. FE-SEM images of PANI films deposited on ITO in the presence of 0.5 M H2SO4 and 0.1 M aniline with a constant potential range (–0.5 to +1.5 V) and at different cycles numbers: (a) 5, (b) 10, (c) 20, and (d) 30 cycles. FE-SEM images show the water drop contact angles (CAs) imbedded on the respective surfaces.
Coatings 09 00748 g008
Figure 9. (a) XPS survey of PANI thin film on ITO, (b) C1s spectra, (c) N1s spectrum, and (d) O1s spectra.
Coatings 09 00748 g009
Figure 10. Cyclic voltammograms of PANI/TiO2 nanocomposite (a) and PANI/ZnO nanocomposite (b) at 30 cycles in 0.5 M H2SO4.
Coatings 09 00748 g010
Figure 11. FE-SEM images of PANI/TiO2 composites with different TiO2 concentrations: (a) 0.03 g/L, (b) 0.125 g/L, (c) 0.225 g/L, and (d) 0.4 g/L at 30 cycles. (e) Higher magnification of (c). FE-SEM images show the water drop CAs imbedded on the respective surfaces (100°, 125°, 144°, and 146° for (a), (b), (c) and (d), respectively).
Coatings 09 00748 g011
Figure 12. FE-SEM images of the PANI/ZnO nanocomposite with different ZnO contents: (a) 0, (b) 0.2 g/L, and (c) 0.5 g/L ZnO deposited at 30 cycles. (d) Higher magnification of (c). FE-SEM images show the water drop CAs imbedded on the respective surfaces.
Coatings 09 00748 g012
Figure 13. (a) XPS survey of the PANI/TiO2 (0.4g/L) nanocomposite thin film on ITO, (b) C1s spectra, (c) O1s spectra, (d) N1s spectrum, and (e) Ti2p spectra.
Coatings 09 00748 g013
Figure 14. XPS spectra of the PANI/ZnO nanocomposite: (a) full survey, (b) C1s, (c) O1s and (d) N1s.
Coatings 09 00748 g014

