1. Introduction
In recent decades, the interest of industry in emerging suspension plasma spray (SPS) technology has increased. Nowadays, thermal barrier coatings (TBCs) in the aerospace industry are one of the main applications of SPS coatings. TBCs are used to protect and insulate metallic components from high operating temperatures in gas turbines for aerospace and energy-generation applications [
1,
2,
3].
The microstructure of an SPS coating is desirable for TBC production because of its inter-columnar gaps and its micron-sized intra-columnar pores. These characteristics help to significantly decrease the thermal conductivity of the coating and reduce the thermal stresses during thermal cycling [
4]. The thermal protection provided by the YSZ layer makes it possible to increase the combustion temperature and consequently, the turbine efficiency. Moreover, the metallic bond coat helps to limit the oxidation and to increase the component lifetime [
2,
3].
SPS offers the possibility of producing coatings with different microstructures—columnar, vertical cracks, dense or porous—as shown in a work by Ganvir et al. (
Figure 1) [
5].
In this process, two phenomena play an important role to form those unique SPS structures:
(a) Impinging jet system: In the impact phase, very fine particles with low inertia tend to follow the plasma gas flow, following trajectories parallel to the surface of the substrate, not impacting on it. Unlike those fine particles, the ones with higher inertia will continue their initial trajectory and will impinge on the substrate, but at a shallow angle [
6,
7].
As illustrated in
Figure 2, in the stagnation region, the gas flow turns and moves laterally parallel to the surface of the substrate. This is because the gas axial velocity decreases and the static pressure on the substrate increases as the plasma gas gets closer to the substrate [
6]. Moreover, depending on the shape of the substrate, the plasma gases flow might follow different trajectories, also affecting the particle trajectories [
8].
(b) Shadow effect: Particles follow trajectories to impinge on substrate asperities, shadowing the surroundings areas, as suggested in
Figure 3. This behavior is called a shadowing effect [
9].
Furthermore, substrate surface roughness (Ra) is expected to determine the early growth stage of the columns. A study performed by Bernard et al. [
10] showed that the substrate surface topography is a key parameter to control the coating microstructure. Different topographies, in this study characterized by different Ra, produced coatings with different column size (diameter) and number of columns, as shown in
Figure 4.
The SPS process is still the subject of active research due to the complexity of the phenomena related to the suspension atomization, heating of the ceramic particles and particle trajectories in the vicinity of the substrate. Additionally, important information on in-flight particles size, temperature and velocity are still difficult to measure in SPS. These elements make it harder to understand how the coating microstructure is affected by changes in the parameters involved in the process [
11,
12].
As the SPS process requires the control of many parameters, extensive research has been dedicated to understanding the relationship between them and the resulting coating microstructure. Several studies have been carried out on plasma spray operating parameters in recent decades. The research done on spray parameters have tested different plasma guns, plasma power levels, plasma gases and flow rates, spraying velocities and stand-off distances [
6,
13,
14]. The findings include porosity as related to torch power and stand-off distance, coating microstructure with cracks related to plasma jet instability and substrate temperature during spraying [
6,
11,
13,
14].
Studies have also been carried out analyzing the effects of the suspension parameters and its injection on the coating microstructure and properties. The suspension parameters that have been studied are, for example, the suspension composition including the powder that has been used, the particle size of the powder, the solvent, and the solid load in the suspension [
15,
16]. The injection of the suspension has also been an object of study [
17]. Some of those conclusions showed that coating microstructure and performance are related to the suspension characteristics [
18]. Ganvir et al. [
19] studied the evolution of the coating microstructure during spray. This work showed the importance of suspension characteristics, such as surface tension, density and viscosity, on the resulting coating microstructure.
Furthermore, some studies have shown that substrate surface topography influences the microstructure of the coating and the substrate shape interferes with the trajectory and velocity of the particles close to it [
20,
21,
22]. Numerical modeling has significantly aided the understanding of the phenomena involved in SPS [
14,
17,
23]. The size of the particles and the influence of the plasma radiation make the measurement of in-flight particles velocity, temperature and diameter more difficult than Atmospheric Plasma Spray (APS) and are still under development [
24,
25]. Modeling results validated by the experimental ones have given a better understanding of what is happening.
Real parts to be coated usually have a more complex geometry than flat samples, such as an airfoil for example (
Figure 5). Therefore, it is very important to understand how the geometry of the substrate influences the coating characteristics. With this objective in mind, this work investigated the effect of the substrate curvature and roughness on the microstructure of SPS coatings.
The approach used was to spray one straight line in the center of the substrates to build only one bead of coating. This approach makes it possible to investigate the elements (beads) that form the coating. Also, it makes it easier to compare with simulation studies that can create a prediction of the coating build-up by bead overlapping. The present work was performed with ceramic sub-micron particles (i.e., YSZ), typically used to produce TBCs. This material was chosen due to its wide use in the aerospace industry. However, the work focused on the process of SPS itself, and not on a specific application. The scope of this investigation is limited to the effects of the substrate characteristics.
2. Materials and Methods
2.1. Substrate Preparation
The substrate material of the samples used in this work was stainless steel 304. Three different shapes were chosen in order to analyze how the substrate curvature affects the coating microstructure. A flat, square sample (dimensions 2.54 × 2.54 × 0.3 cm
3), a cylindrical sample (dimensions 2.54 cm length, 2.54 cm external diameter and 0.3 cm wall thickness) and a rod sample (dimensions 15 cm length and 0.8 cm external diameter) were sprayed (
Figure 6).
The substrates were prepared using three different surface treatments. The substrates denominated “
as-machined” were machined in order to have a roughness close to Ra = 0.1 µm. The two other series of substrates were grit-blasted with two aluminum oxide (Al
2O
3) grit sizes (around 100 µm and 200 µm) producing two different surface roughness conditions: Ra ≈ 2 µm, denominated as “
fine”; and Ra ≈ 5 µm, and as “
coarse”, respectively. Roughness was measured with a profilometer (Mitutoyo, Japan) in the center of the samples, in the same orientation of the scanning of the plasma torch. The samples were fixed to the sample holders, as shown in
Figure 7.
2.2. Suspension Preparation
The suspension used in this work was synthesised with the characteristics shown in
Table 1. The powder was YSZ (Zhonglong Chemical, Changsha, Hunan, China) with ethanol as the solvent, to get a better deposition efficiency. The particle size distribution used had a mean diameter (d50) of 400 nm and the solid concentration of powder was 20 wt.%.
The suspension was introduced in the reservoir of the injection system. The injection system consists of two sealed pressurized reservoirs. One contains the suspension to be sprayed with a mechanical stirrer, and the other contains water. A compressed gas (Ar at 50 psi) pressurizes the tanks and mechanically injects the suspension through the injector into the plasma jet. The system contains a Coriolis flow meter to measure the suspension flow rate and density during spraying. In this work, the injector was made of stainless steel with an internal diameter of 150 µm, resulting an injection feed rate of around 21 mL/min.
Prior to spraying, the suspension particle size distribution was measured with a Spraytec device (Malvern Panalytical, Malvern, UK). The particle measurement results were D10 = 0.204 µm, D50 = 0.414 µm and D90 = 0.814 µm.
2.3. Spray Process
The process parameters used to spray the samples in this work are described in
Table 2. Those parameters were chosen based on the work of Rezania [
27], where it was observed that those same parameters produced coatings with a columnar structure.
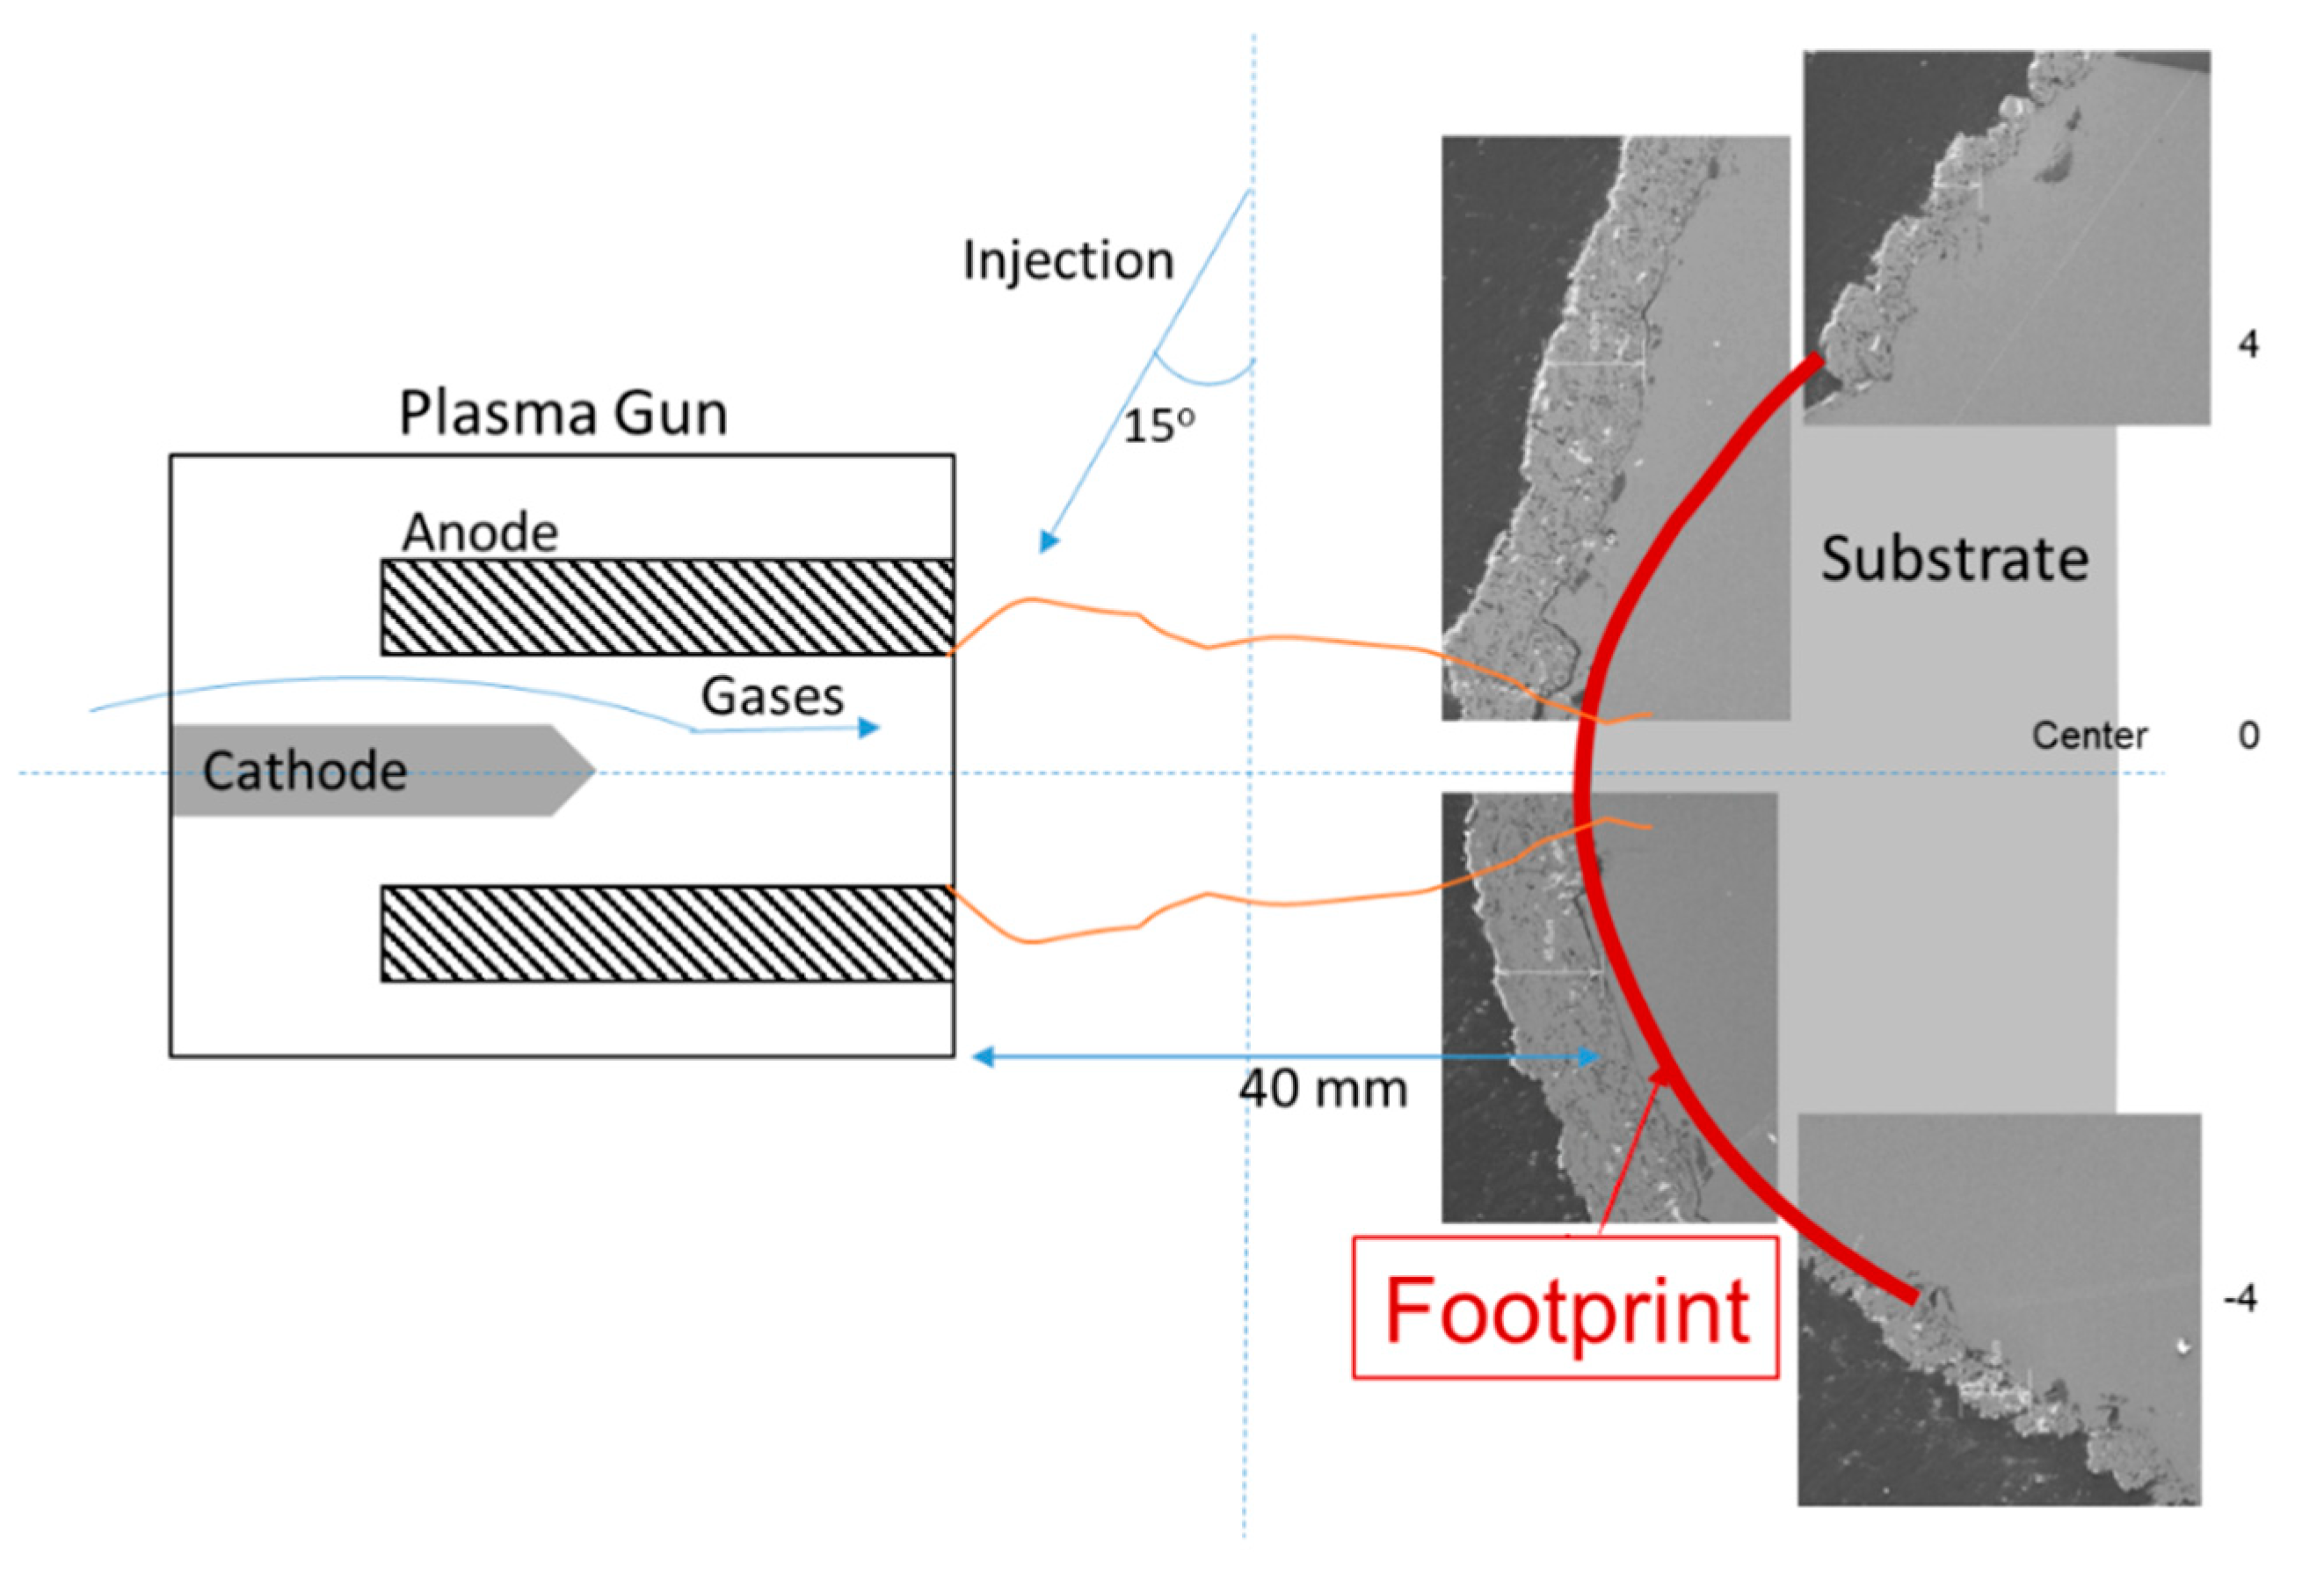
The suspension injection was radial, external to the plasma gun with the injector oriented 15° backward so that the suspension is directed towards the center of the plasma nozzle exit, as shown in
Figure 8a. The standoff distance between the plasma torch exit and the front surface of substrates was maintained constant at 40 mm for all substrate shapes (flat, cylindrical and rod).
This work was carried out in two parts. First, a preliminary study was performed by spraying using three standoff distances (30, 40 and 50 mm) and two shapes (flat and cylindrical). The width of the coating footprint measured in this preliminary study was about 1 cm. After the preliminary study, no significant difference in the coatings characteristics was observed within the standoff distances. Although at a distance of 30 mm, the coating produced was slightly thicker, it was decided to keep the distance at 40 mm only. Furthermore, a rod shape was added to yield a curved substrate with a diameter smaller than the footprint of the coatings.
The spraying strategy used in this work was to spray along one straight horizontal line in front of the substrate. The torch exit was positioned in a way that the center of the particle jet scanned over a horizontal line on the axis of the substrate (
Figure 8b). The alignment was done before spraying each set of samples, using the AccuraSpray device (Tecnar, Saint-Bruno-de-Montarville, Canada). The torch was moved horizontally a certain number of times for spraying a single bead on the substrate surface. A bead is defined as the line of coating produced with multiple scans overlapped in the same horizontal line. This strategy was chosen in order to make it simple to see the effect of the shape in one single bead. Moreover, spraying one straight line would be useful to compare our results with the numerical results from Pourang et al. [
23] and also, for further numerical modeling comparison.
For this study, two series of samples were sprayed.
1. In the first batch, nine samples (three shapes and three roughness) were sprayed separately with fifty scans in front of the substrates. After analyzing the results, a second batch of samples was sprayed with twice the number of scans (100), in order to build thicker coatings and observe the further development of the coating microstructures.
2. In the second batch, samples with the three different roughnesses were fixed side by side in the sample holder for each shape, and consequently, sprayed at the same time, under identical conditions (
Figure 7). These samples were pre-heated to a temperature close to 100 °C and monitored by an Infrared Camera (FLIR Systems, Wilsonville, OR, USA) before the suspension started to be injected. The samples were sprayed with one hundred scans of the torch in front of them.
1. Therefore, a total of 18 types of samples were sprayed, combining the shapes, surface topographies and number of scans. The samples were labeled with three alphanumeric characters:
2. The first character stands for the batch: “4” means the first series of samples with 50 scans and 4 cm of standoff distance, and “T” stands for thicker coatings, the ones sprayed with 100 scans at 4 cm of standoff distance.
3. The second character is for surface roughness: “M” is for as-machined substrates, “F” means fine grit blasting and “C” is for coarse grit blasting.
The third letter: “F” means flat samples, “C” is for cylindrical and “R” for rod samples.
Table 3 shows all samples and the corresponding controlled spray parameters:
2.4. Coating Characterization
After spraying, the samples were characterized and observed under an SEM. The cutting, mounting and polishing instruments and consumables were from Struers (Ballerup, Denmark). Once metallographic preparation was done, the samples were observed under the SEM S-3400N (Hitachi, Tokyo, Japan). The mapping of the samples cross-sections was done with a secondary electron (SE) detector.
SEM images were recorded and analyzed with software ImageJ (1.8) in a detailed manner. Measurements of the thickness of the coatings and width of columns were performed. For each point of interest in the coating, the thickness was measured in a systematic way: one measurement was recorded every 30 µm. The thickness presented for the coatings in this work is the mean of seven measurements.
The measurement of column width was done only where columns were observed. Therefore, the number of measurements varies according to the number of columns found in each location. A column was considered as such if its width is smaller than the coating thickness in that location and its length is at least one half of the coating thickness (
Figure 9a). Shadow effect is also present in most of the coatings. Shadow effect is described by the author as a local thickness variation, where it is possible to see a bump along with a depression immediately after, as shown in
Figure 9b, without the presence of a fully developed column.
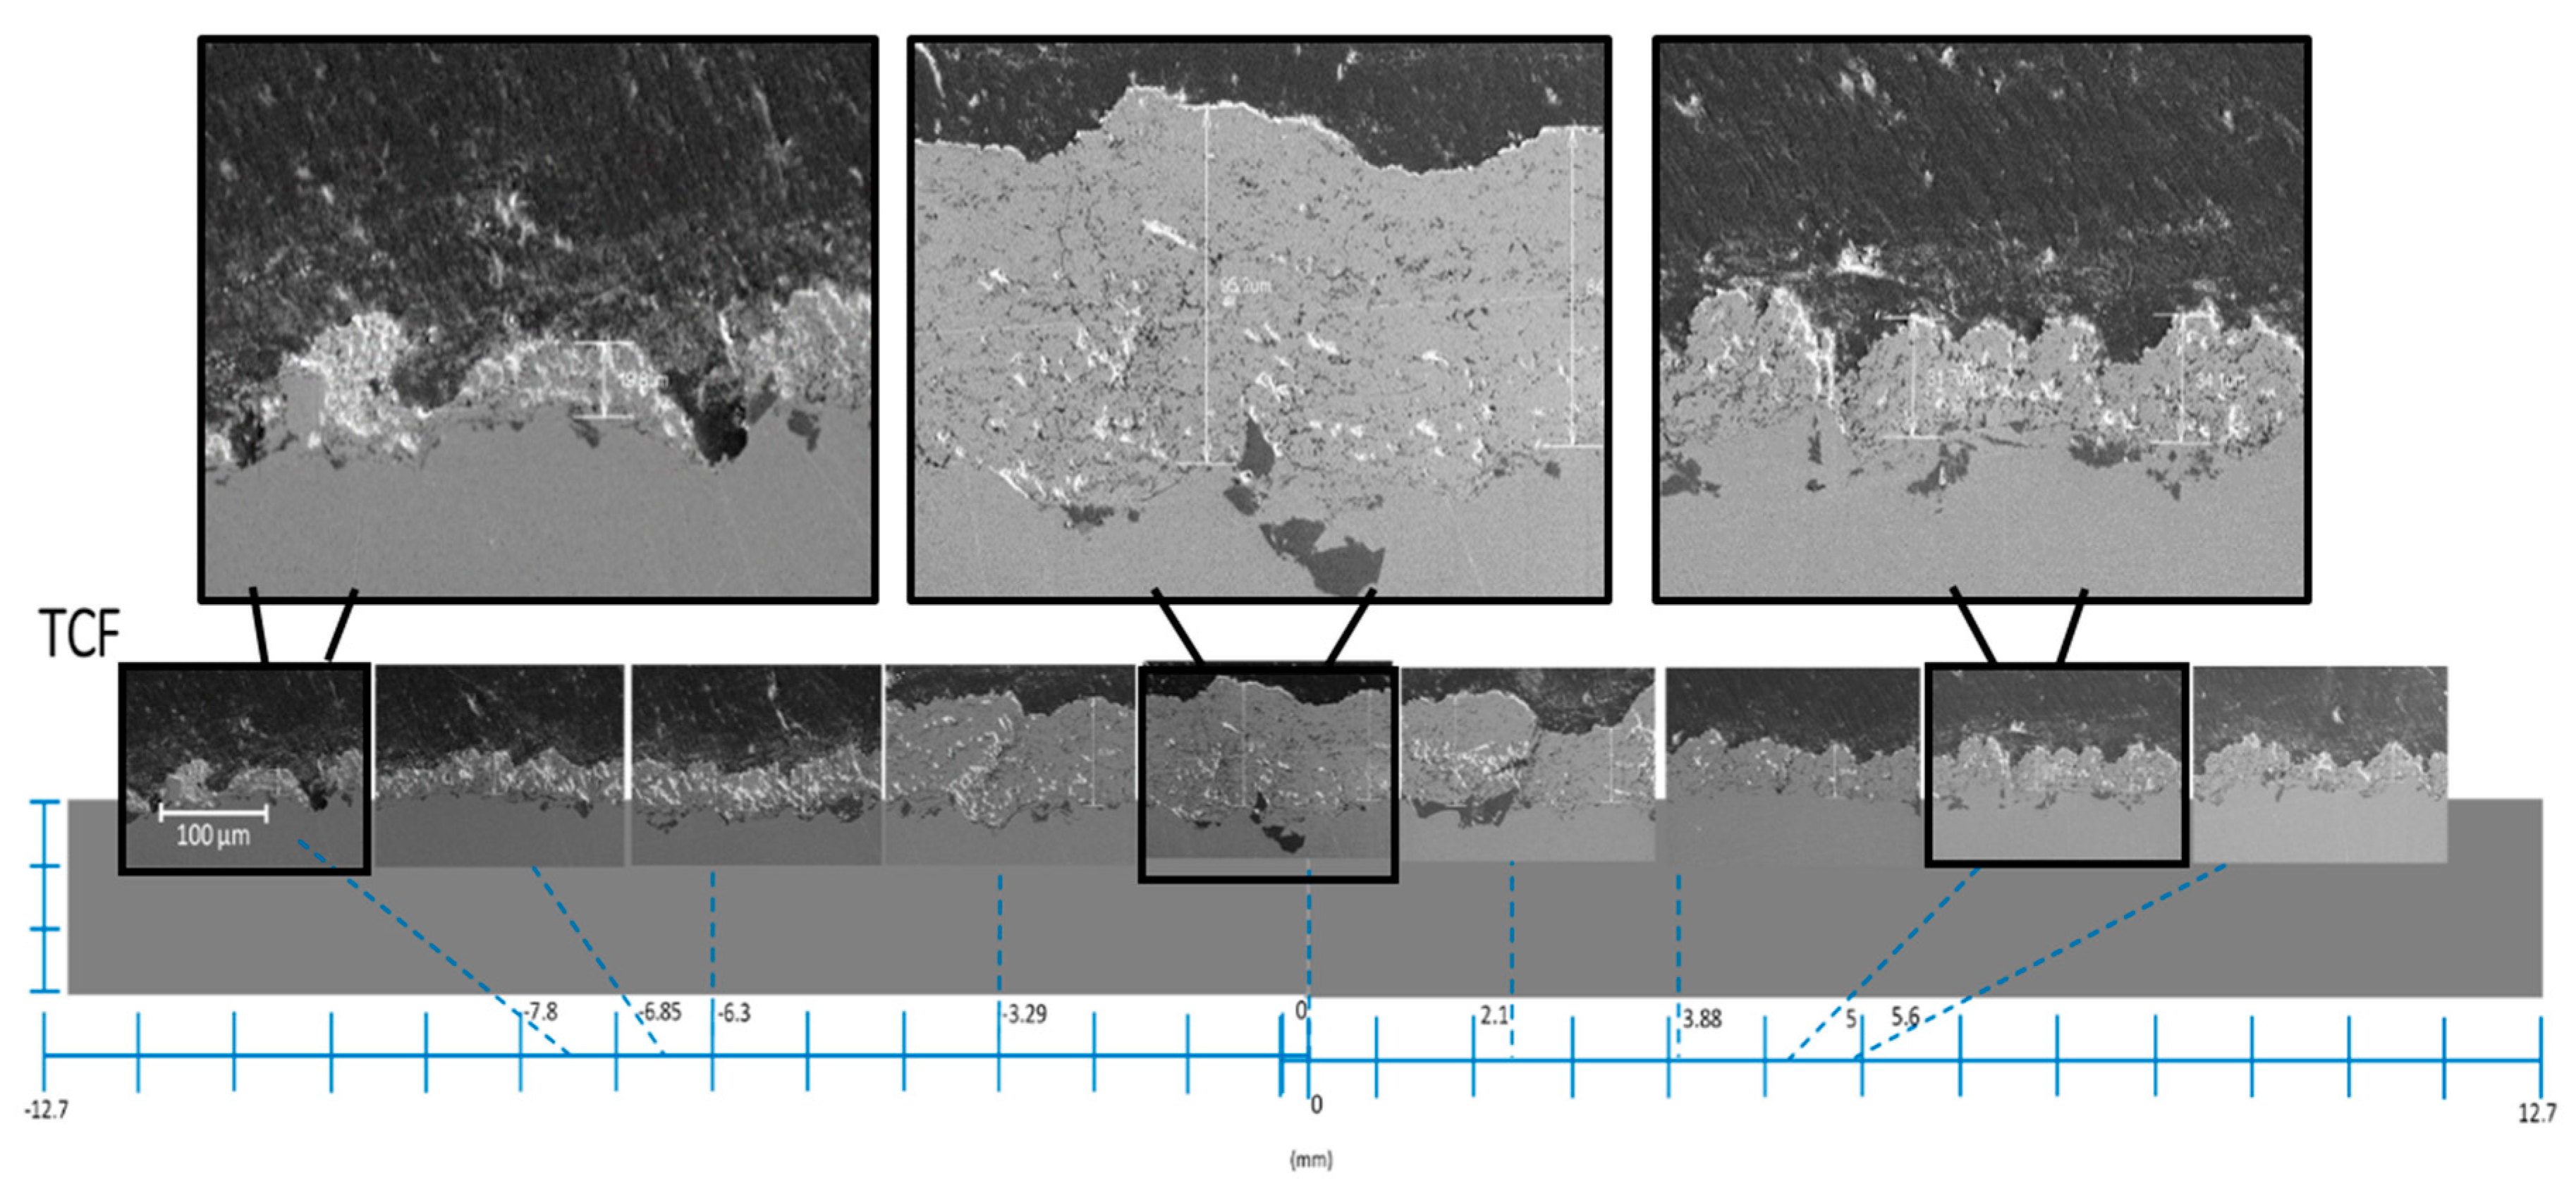
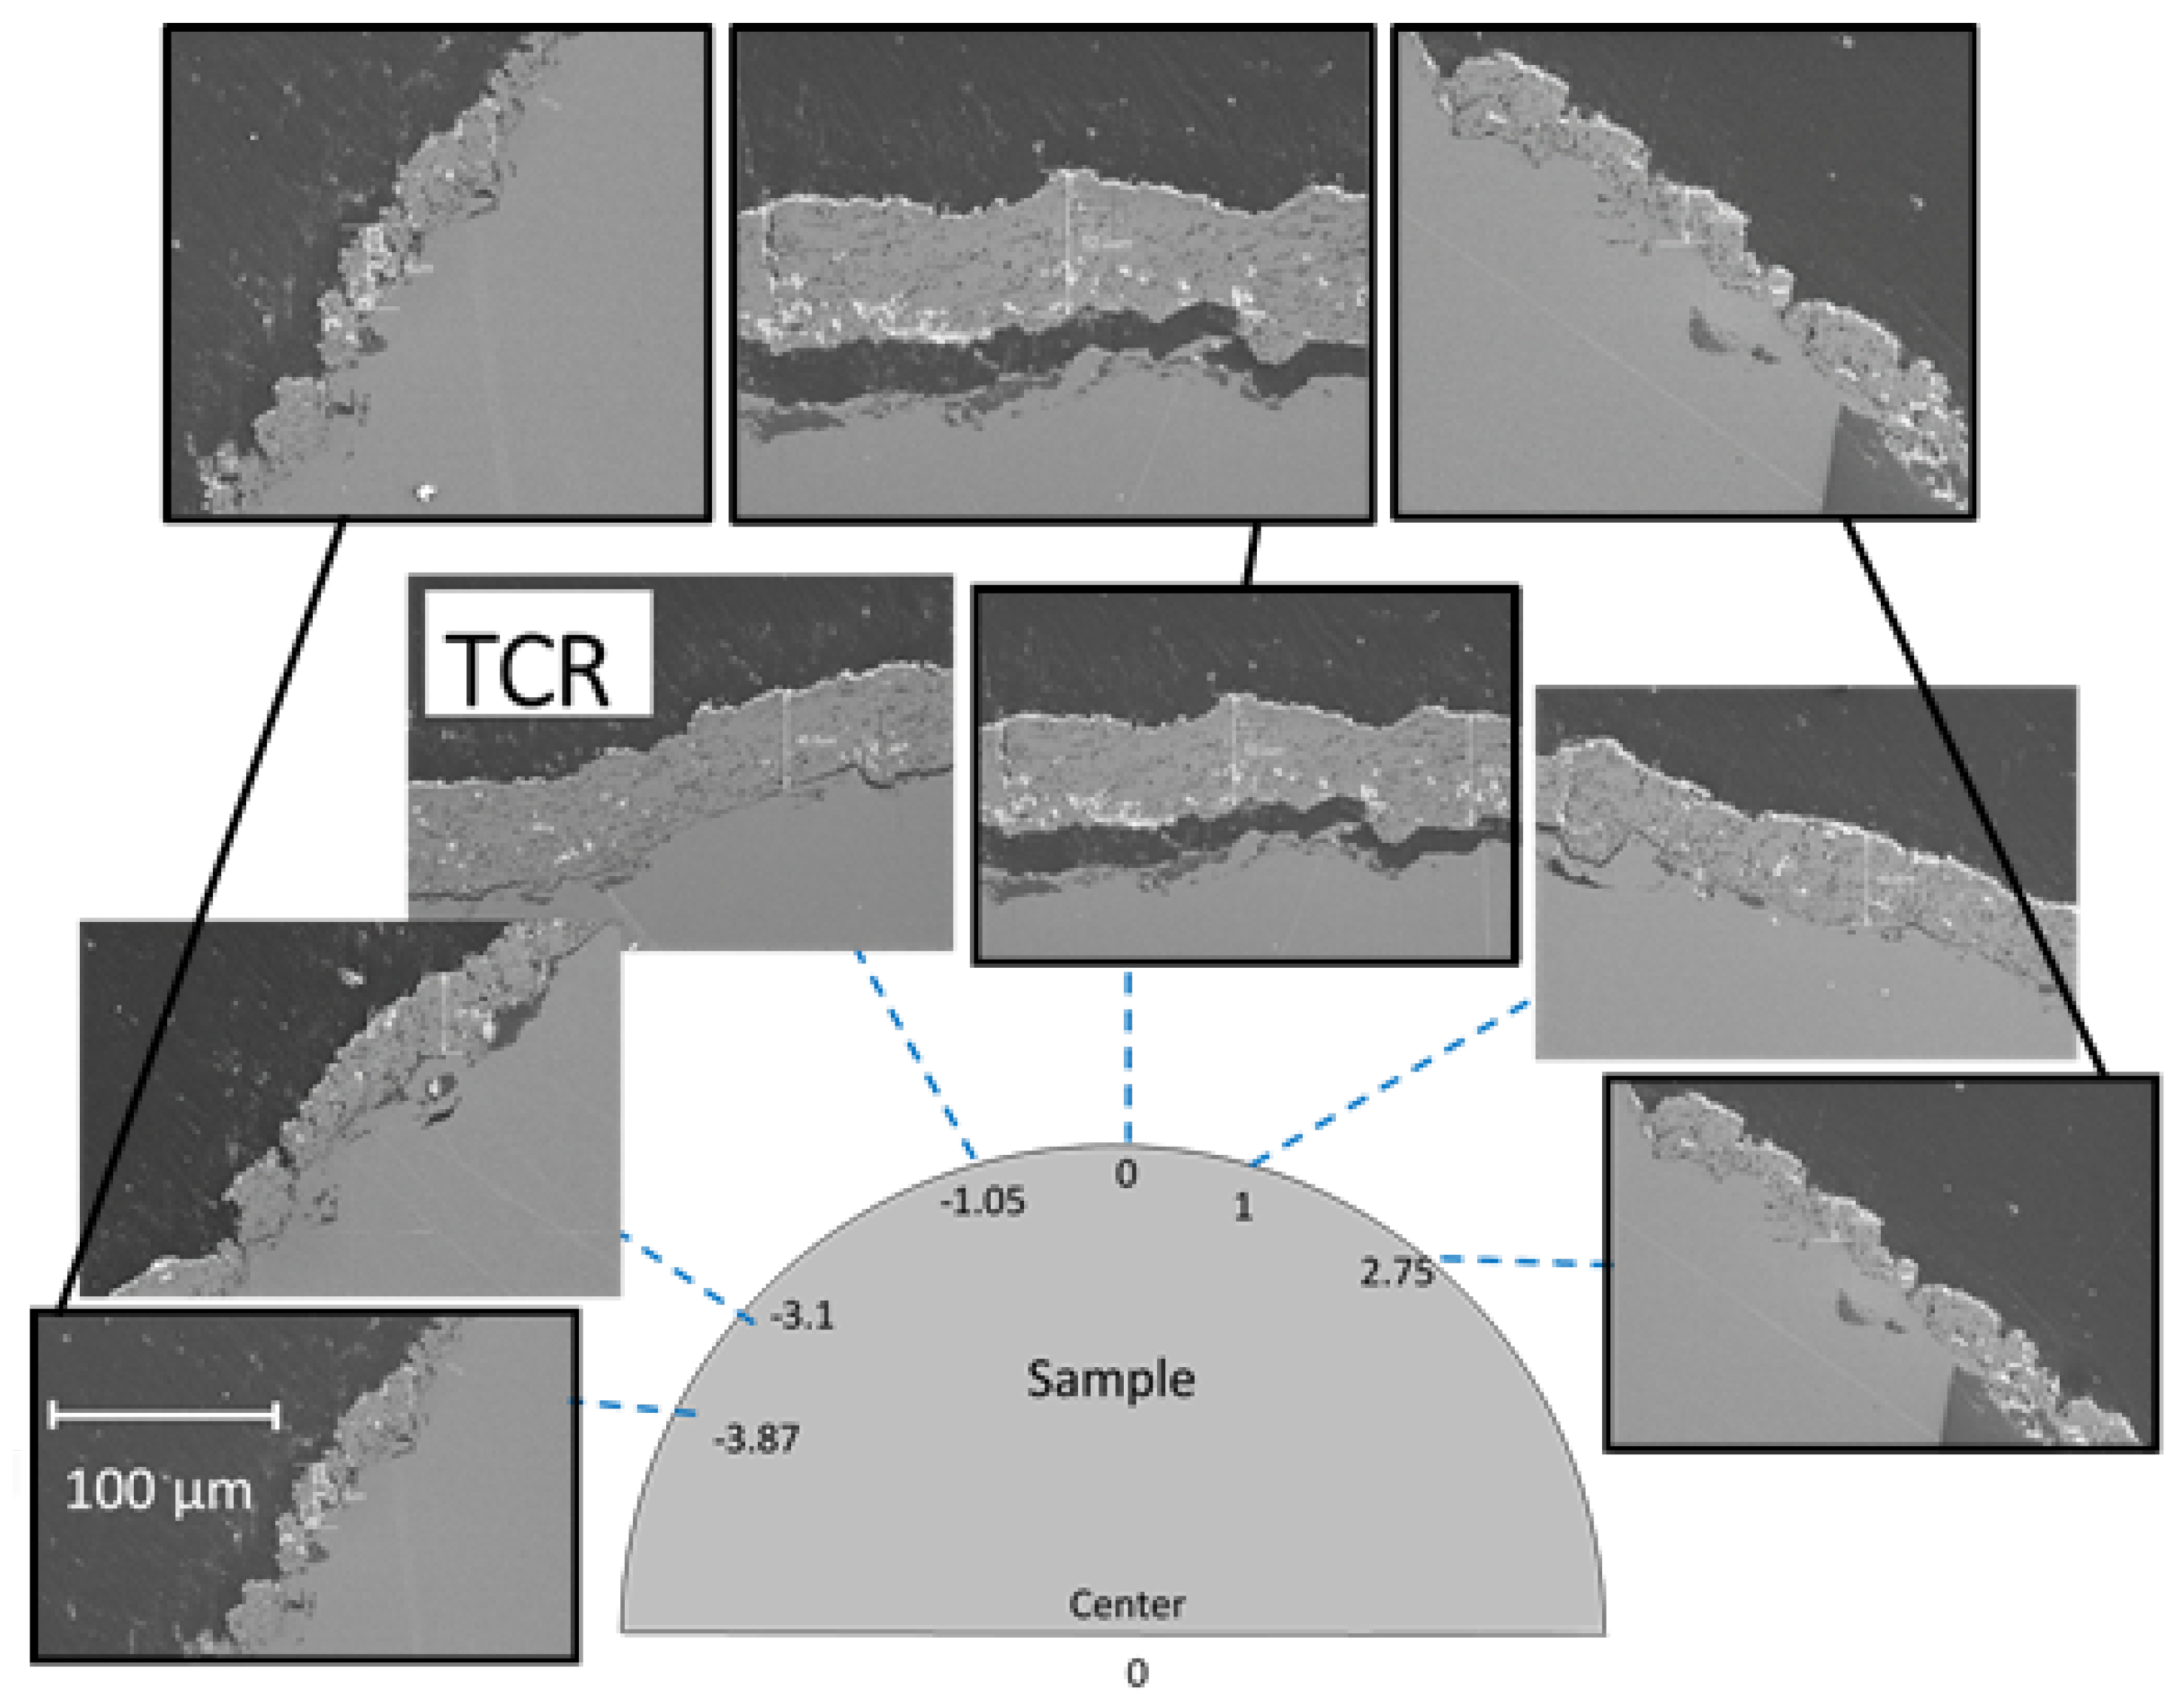
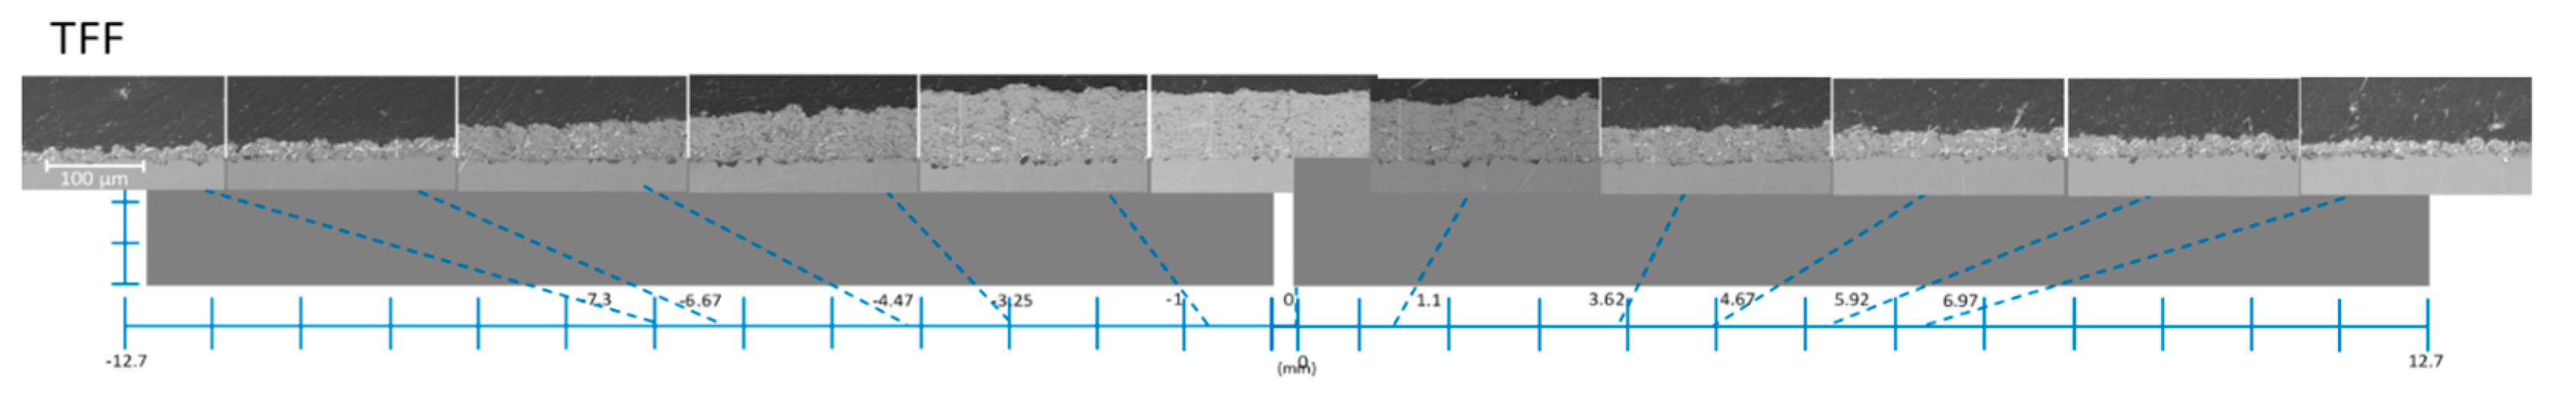
All images are presented in their locations along the axis of the samples. The position 0 is the center of the sample, it is the location where the torch (and the particle jet) was aligned to scan the samples horizontally. The negative side of the samples means the bottom side of the sample during spray, in other words, below the torch axis. Finally, the positive side of the samples is the top side of the sample during spray, above the torch, and is the same side as the radial suspension injection. Each position is represented by its distance (mm) along the surface of the sample measured from its center, as illustrated in
Figure 10 for a rod sample. Representative coating cross-sections are shown is the next section. Images of all samples can be found elsewhere [
11].
3. Results
Figure 11,
Figure 12 and
Figure 13 show the metallographic images deposited on the coarse grit-blasted substrates of different shapes: flat, cylindrical and rod. The position (in mm) of the metallographic images along the sample surface is indicated at the bottom of the figures. A shadow effect can be easily identified in all the coarse grit-blasted samples.
Alumina grit inclusions can be observed in all figures above. These inclusions can affect the surface roughness and, consequently, the microstructure and durability of the coating [
28]. However, in this work, the alumina inclusions do not appear to have a such an influence on the coating microstructures.
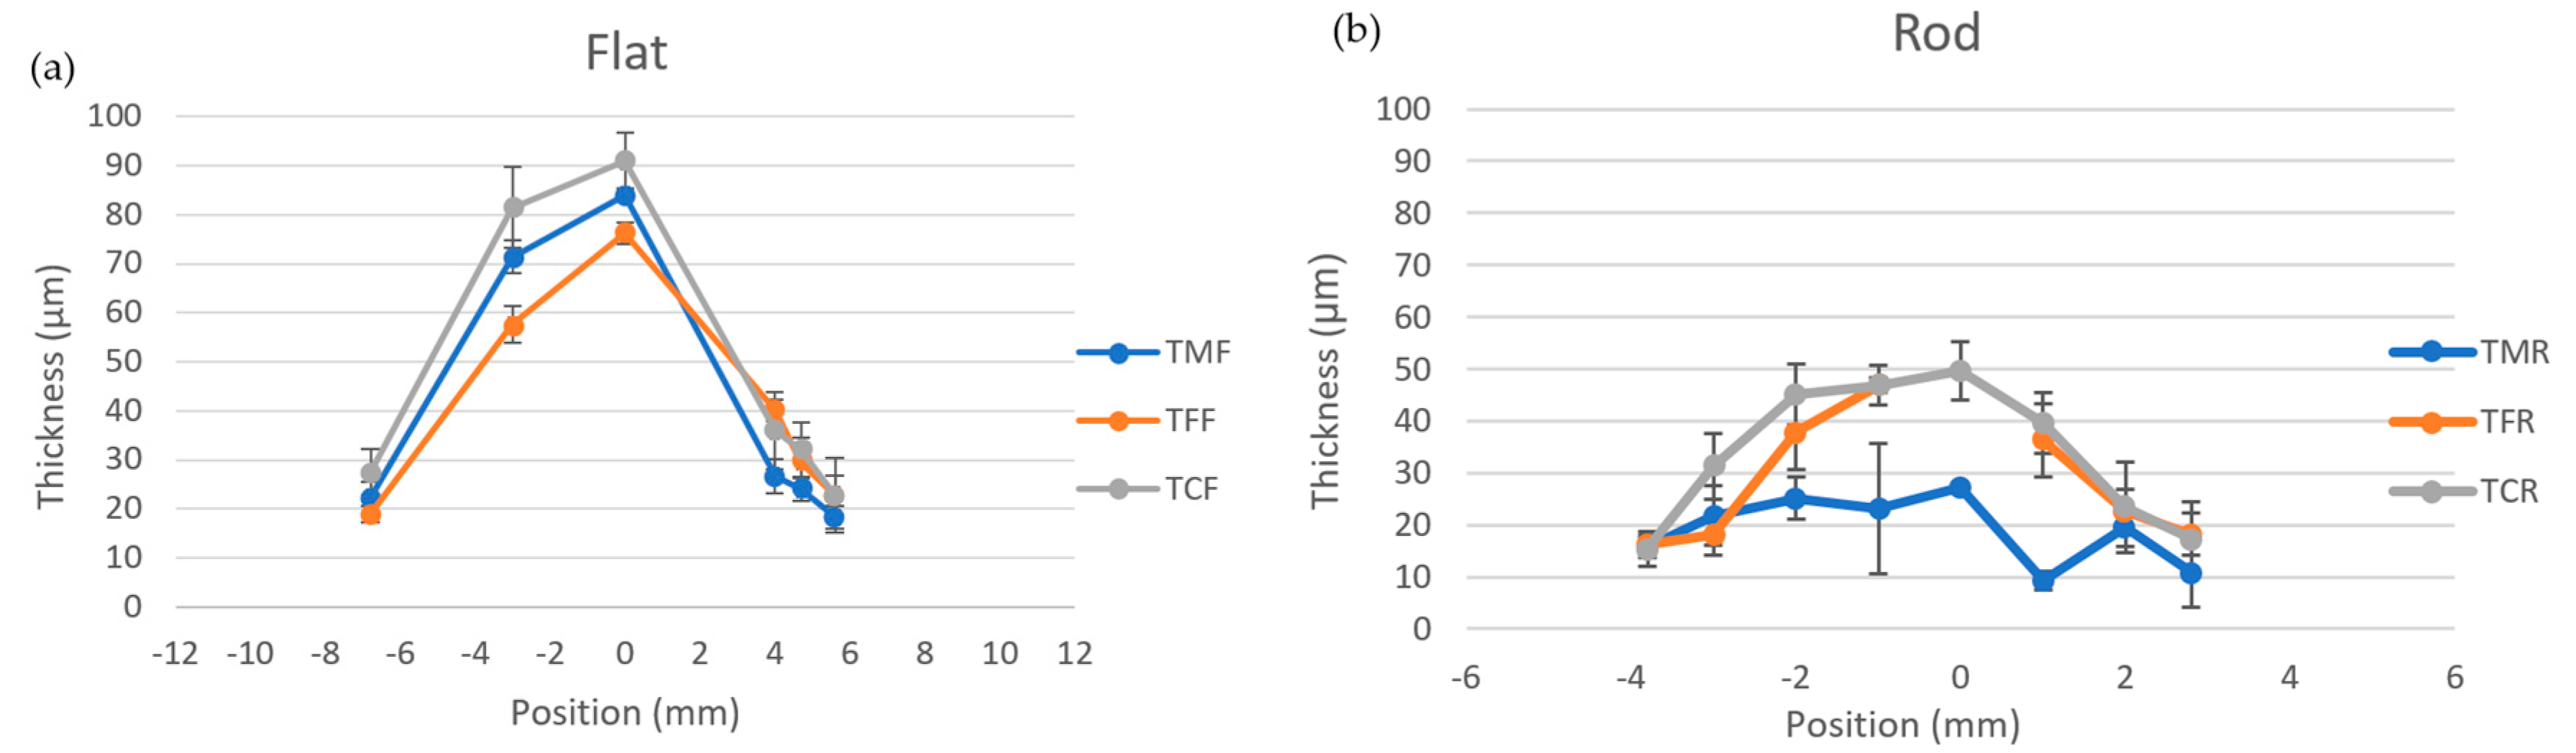
3.1. Coating Thickness Profiles
In the previous images, it is possible to see various types of microstructures such as columns, dense regions, and some surface delamination. The coating microstructure significantly varies with the different substrate shapes and locations. All samples were analyzed under the SEM and had measurements taken. To facilitate the comparison between the different substrate shapes,
Figure 14 shows the coating thickness as a function of location along the sample surface for the three investigated surface preparations (as-machined, fine and coarse grit-blasted). It was noticed that the coatings are thicker at the center and bottom locations (negative positions) of the substrates. Missing points are locations where the coating delaminated during or after spraying.
In terms of the influence of the substrate shape on the coatings, it was noticed that the flat samples did not present coating delamination and produced thicker coatings than the other two shapes. Furthermore, even if delamination occurred in the center of the coatings for cylindrical and rod samples, it is possible to see that cylindrical samples had a larger amount of material deposited than the rod samples. For as-machined cylindrical and rod substrates, delamination occurred very early during the deposition. Thus, a fine layer of coating was added during the same deposition, just after the delamination.
3.2. Columnar Structure
Columns were only present close to the end of the coating footprints, indicating that they are formed by fine particles that follow the plasma flow. Furthermore, for the samples that presented columns, in general, the columns have grown in an orientation parallel to the torch axis (as opposed to perpendicular to the substrate surface).
It is possible to observe that the substrate shape influences column growth. The highest number of well-defined columns is seen on the rod sample, then on the cylindrical, and lastly, fewer columns are present on the flat substrate, as shown in
Figure 15,
Figure 16 and
Figure 17.
3.3. Substrate Roughness
The substrate roughness with different Ra presents structures with different peak sizes. In the early coating growth stage, those structures will be the base of different column sizes and amounts.
Figure 18,
Figure 19 and
Figure 20 show the cross-section of the coatings on the flat substrates with three different surface roughness (coarse, fine and as-machined).
It is possible to see that at the ends of the coating footprint, the early growth stage presents different structures for each surface topography. In further development of the columns, it is expected that the columns be wider and fewer in number for the coarse substrate. As the roughness decreases, the development of a larger number of narrower columns is expected.
4. Discussion
After the image analyses, the following observations were made:
1. It was observed that the center and bottom of the substrate had a higher deposition, since the coatings were thicker at those locations. The center of the deposition also presented denser coatings, which is in accordance with the work carried out by Ganvir et al. [
19].
2. Coatings deposited on flat samples were thicker than those on the other two shapes indicating that, for the rod and cylindrical geometries, part of the spray particles might have followed the gas flow and did not impinge on the substrate.
3. Columns are only present closer to the end of the coating footprints, indicating that they are formed by fine particles that follow the plasma flow. The angles at which the particles impinged on the substrate also play a role in building the columnar structure. Indeed, for samples that presented columns, the columns have grown in an orientation parallel to the torch axis.
4. Substrate shape influences column growth, as seen in
Figure 15,
Figure 16 and
Figure 17, for example. The largest number of well-defined columns is seen on the rod sample, then on the cylindrical one, and lastly, fewer columns are present on the flat substrate.
5. In the first series of samples, delamination occurred only on as-polished samples. For the second series of samples, due to greater thickness causing more stress in the center of deposition, delamination was present in all curved samples.
4.1. Catch Rate
A previous numerical study on the influence of substrate shape in SPS has shown the behavior of the particles close to the substrate for flat and cylindrical substrates. Pourang et al. [
23] studied the effect of the substrate curvature on in-flight particle temperature, velocity and trajectory through a three-dimensional numerical analysis. After a quantitative analysis, they have observed that the particles impinge on the flat substrate about 2.2 times more often than on the curved, for a fixed time interval. With this observation, the parameter “Catch Rate” was defined by Equation (1):
This study showed that the substrate and its shape have an important influence on the trajectory and the velocity of the particles close to the substrate, as shown in
Figure 21. The catch rate for the flat substrate was found to be much higher than of the curved one, which also resulted in a lower amount of coating deposited on the curved substrate. It was also observed that most of the particles reach the curved substrate at angles of between 10° and 20°, and above this value, the particles will pass over the surface without impinging on it [
23].
In our study, thicker coatings were obtained on flat samples than on the other two shapes. In curved samples, part of the particles might have followed the gases flow and did not impinge on the substrates, as illustrated in
Figure 21. Additionally, as previously observed, the coating footprint width on flat and cylindrical samples was larger than the rod diameter itself.
Based on the thickness profiles shown in
Figure 14, the amount of coating material deposited on the different substrates was estimated from the actual coating cross-section area. The curves were interpolated to estimate the coating thickness in regions where delamination occurred during spraying. The results are summarized in
Figure 22, showing that the amounts of deposited material on the cylindrical substrate and rod substrate were reduced by a factor of 1.3 and 2.9, respectively, as compared to the flat substrate.
Considering that these coatings were sprayed with the exact same conditions, it can be observed that the shape of the substrate has a strong influence on the amount of coating material being deposited. For the rod and cylindrical samples, a higher number of particles have followed the plasma gas flow around the substrate and did not impinge on it.
These observations can be compared with the modeling results of Pourang et al. [
23]. Their findings showed that a higher amount of coating material is deposited on flat samples than on the curved ones. In their case, in a fixed time interval, particles hit the flat substrate (2.5 cm × 2.5 cm surface 2.2 times more than the cylindrical surface (2.5 cm diameter × 2.5 cm long). In our case, this factor is only 1.3. The lower fraction of material deposited on a cylindrical in Pourang’s case is certainly influenced by the position of the particle plume relative to the substrate. In their case, the center of the deposition was not centered on the substrate, as shown in
Figure 21. It is possible to see that most of the particles were traveling above the torch axis. On the other hand, in our work, the center of deposition was located at the center of the substrate, with more particles impinging on it both above and below the torch axis.
4.2. Column Orientation and Width
As noted above, the orientation of columns tends to be aligned parallel to the spray direction, as shown in
Figure 15 for the rod sample. We would expect that the impact angle of the fine SPS particles be shallower than the angle defined between the spray direction and the substrate surface, as illustrated in
Figure 23. In this example, for a position on the substrate surface located at 30° relative to the spray direction, the impact angle of the spray particles relative to the substrate surface would be less than the angle between the spray direction and the substrate surface, which is 60° in this example. As the columns grow almost parallel to the spray direction, they grow with an angle larger than the particle impact angle.
A similar observation has already been reported in a study performed by Kanouff et al. [
29] who analyzed deposits sprayed with an off-normal angle. In this study, it was observed that, when particles impinge on the substrate, a fraction of it splashes off the substrate and is redeposited a few millimeters downstream. By using a coating build-up model, the impact angle of the “overspray” was found to be less than 8°. This “overspray” tends to form columns, as illustrated in
Figure 24, that grow at an angle much larger than the overspray impact angle.
Figure 25 shows the measured column width along the substrate surface for the three different substrates and three substrate surface preparations. As already mentioned, columns are visible only in the ends of the material footprint on the different substrates. One can also see that the column width becomes smaller as the distance from the center of the deposits increases, that is to say, as the particle impact angles get shallower. Clearly, more work is necessary to better understand how the substrate shape influences the width of the columns, as well as their orientation, by using a coating build-up model adapted for the SPS process. Indeed, these unique structures resulting from the shadow effect have a strong influence of the actual properties and performance of the SPS coatings in different industrial applications.
5. Conclusions
Experimental research was performed to investigate the influence of the substrate shape (flat, cylindrical or rod) and surface roughness on the microstructures of SPS coatings. A series of samples with three different shapes and three roughness levels were sprayed using the same spray conditions. In all cases, a single bead was deposited by scanning the plasma torch horizontally on a straight line in the center of the substrate with a suspension of YSZ 20 wt.% in ethanol with radial injection.
The image analyses of the SPS coatings showed columns in the periphery of the coatings and denser structures in the center of the substrates. The thickness of the coatings was found to depend strongly on the substrate shape even if all the other spray parameters were identical. With these observations, it is possible to conclude that, for this work, the substrate shape influences the amount of coating deposited, and, as the radius of the curvature decreases, the amount of coating material deposited also decreases.
The shape of the substrate also influences the column formation. The curved substrates had a more rapid column growth, with better defined columns. As the radius of curvature decreased, more columns were formed. The surface roughness also plays a role in forming the columnar structure. The shadow effect is said to be actively affecting the column formation, therefore, the increase in the roughness will also increase the shadow effect, affecting the size of the columns. Finally, this current work is expected to be useful for validating coating build-up models by comparing the microstructure of spray beads with the microstructure predicted from models.


