Article

Effect of Pulse Current Mode on Microstructure, Composition and Corrosion Performance of the Coatings Produced by Plasma Electrolytic Oxidation on AZ31 Mg Alloy

by
Maryam Rahmati
1,
Keyvan Raeissi
1,*,
Mohammad Reza Toroghinejad
1,
Amin Hakimizad
2 and
Monica Santamaria
3
1
Department of Materials Engineering, Isfahan University of Technology, Isfahan 84156-83111, Iran
2
Yekta Mobaddel Pars Co., Science and Technology Campus, Yazd University, Yazd 89158-18411, Iran
3
Electrochemical Materials Science Laboratory, Dipartimento di Ingegneria, Università di Palermo, Viale delle Scienze, Ed. 6, 90128 Palermo, Italy
*
Author to whom correspondence should be addressed.
Coatings 2019, 9(10), 688; https://doi.org/10.3390/coatings9100688
Submission received: 14 September 2019 / Revised: 16 October 2019 / Accepted: 18 October 2019 / Published: 22 October 2019

Abstract

:
Plasma electrolytic oxidation (PEO) coatings were grown on AZ31 Mg alloy in a silicate-based electrolyte containing KF using unipolar and bipolar (usual and soft-sparking) waveforms. The coatings were dual-layered consisting of MgO, MgF2 and Mg2SiO4 phases. Surface morphology of the coatings was a net-like (scaffold) containing a micro-pores network, micro-cracks and granules of oxide compounds. Deep pores were observed in the coating produced by unipolar and usual bipolar waveforms. The soft-sparking eliminated the deep pores and produced the lowest porosity in the coatings. It was found that the corrosion performance of the coatings evaluated using EIS in 3.5 wt. % NaCl solution is mostly determined by the inner layer resistance, because of its higher compactness. After 4 days of immersion, the inner layer resistances were almost the same for all coatings. However, the coatings produced by unipolar and usual bipolar waveforms showed sharp decays in inner layer resistances after 1 week and even the barrier effect of outer layer was lost for the unipolar-produced coating after 3 weeks. The low-frequency inductive loops appeared after a 3-week immersion for all coatings indicated that the substrate was under local corrosion attack. However, both coatings produced by soft-sparking waveforms provided the highest corrosion performance.

Graphical Abstract

1. Introduction

Plasma electrolytic oxidation (PEO) is an electrochemical surface treatment based on conventional anodizing performed at very high anodic potentials up to the passive oxide breakdown, resulting micro-discharges which develop a two-layered morphology consisting of an outer porous layer and an inner compact one [1]. This process is basically an oxidation treatment to protect valve metals and their alloys, such as magnesium, aluminum and titanium from wear and corrosion attack [2]. Magnesium and its alloys are becoming of interest in different industries such as automotive and aerospace, where they can reduce vehicle weight because of their high strength-to-weight ratio. This improves fuel economy and environmental friendliness, but they suffer from wear and corrosion attacks which obliges them to use a proper coating [3].
PEO processing prepares a condition for growing a durable, thick, uniform and very adherent coating withstanding wear and corrosion attack for a range of metallic components of complex shape [4]. However, quality of the PEO coatings is not good enough for many industrial applications which need compact and homogeneous layers with good corrosion and mechanical properties [5]. This is because of the relatively thick porous outer layer forms during the PEO process. Thus, researchers have focused on limiting and reducing the growth of this layer [5]. The growth rate of outer and inner layers is depending on process parameters. For instance, changing the current mode leads to changing the PEO discharge events and, consequently, the inner/outer layer ratio [6]. Therefore, especial current regimes such as bipolar pulse currents have been used recently to achieve better coating quality in comparison with a unipolar one. In bipolar waveforms, both cathodic and anodic pulses are applied where each cycle is defined by a current amplitude and width [7]. It is reported [8,9,10,11] that the bipolar current waveform grows a more compact coating with fewer defects and more uniform thickness for Mg alloys. During the PEO process, the value of cathodic to anodic current ratios and their timings (Ton+, Toff+, Ton and Toff) are important parameters for reducing the strong discharges and the high temperature spikes that usually cause detrimental defects in the oxide layer [5]. By a suitable adjustment of current parameters, a “soft-sparking” regime can be achieved in contrast to the conventional regime. The soft sparking denotes an abrupt transition in the micro-arcs state of common PEO. It is manifested through a decrease in light and acoustic emission intensities, when the specimen is subjected to higher cathodic cycles [2,5]. As widely reported in the literature [1,12,13], the PEO using soft-sparking mode is very convenient for achieving a compact coating on Al alloys with good corrosion performance. However, using the soft-sparking for Mg alloys has been limitedly investigated. Arrabal et al. [8] have produced PEO coatings by soft-sparking transitions on some Mg alloys at 50 Hz, AC current of square waveform and Rpn = 0.83 in an electrolytic solution consisting of Na2SiO3 and Na2P2O7. It was found that the cathodic cycle causes densification of the inner layer to some extent [8]. Hussain et al. [14] have featured the inner layer of the PEO coating grown on AJ62 Mg alloy in an electrolytic solution of sodium aluminate. They emphasized the plasma softening effects on eliminating the strong B-type discharges [14]. Also, it is reported [15] that the NaAlO2 has reduced the number and size of micro-pores and increased the MgAl2O4 content of the PEO coating grown on AM50B alloy. On the other hand, if the electrolyte contains no aluminate component, the influence of the cathodic current seems ineffective. Other research groups [16,17] believe that in the solutions free of aluminate, the bipolar waveforms produce lower pores in the coating than DC and unipolar current waveform. Therefore, the soft-sparking is suitable for Mg-based alloy treatment.
In this paper, an attempt was made to understand the effect of waveform on response of cell current density, and thus, on the morphology and corrosion resistance of PEO coatings on AZ31 Mg alloy. The PEO process was operated using different waveforms including unipolar, usual bipolar and soft-sparking with two various cathodic duty cycles, in order to produce oxide coatings on AZ31 Mg alloy from a silicate-based electrolyte in the presence of potassium fluoride. The phase composition of the obtained coatings was studied using X-ray diffraction (XRD), while scanning electron microscopy (SEM) was employed to study surface morphology and cross section of the coatings. Electrochemical measurements were performed to evaluate the corrosion performance of the coatings at long-term exposure in 3.5 wt. % NaCl solution. All the results were rationalized trying to assess the effect of waveform on corrosion performance of the coatings.

2. Materials and Methods

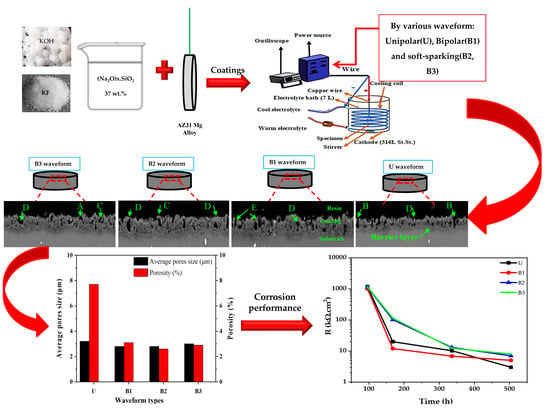
2.1. Sample Preparation

Disc-shaped specimens of AZ31 alloy with chemical composition (wt. %) of 4.77 Al, 0.809 Zn, 0.758 Mn, <0.005 Cu, <0.02 Si and balance Mg with diameter of 16 mm and height of 3 mm were prepared and used as substrate. Both flat surfaces of the disc samples were ground and polished using silicon carbide (SiC) from 600 to 2400 grit until obtaining a surface roughness of Ra = 0.08 ± 0.01 μm, and then, they were washed in deionized water and ethanol and finally dried in cold air flow. Each specimen connected to a copper wire used as working electrode in the PEO treatment.

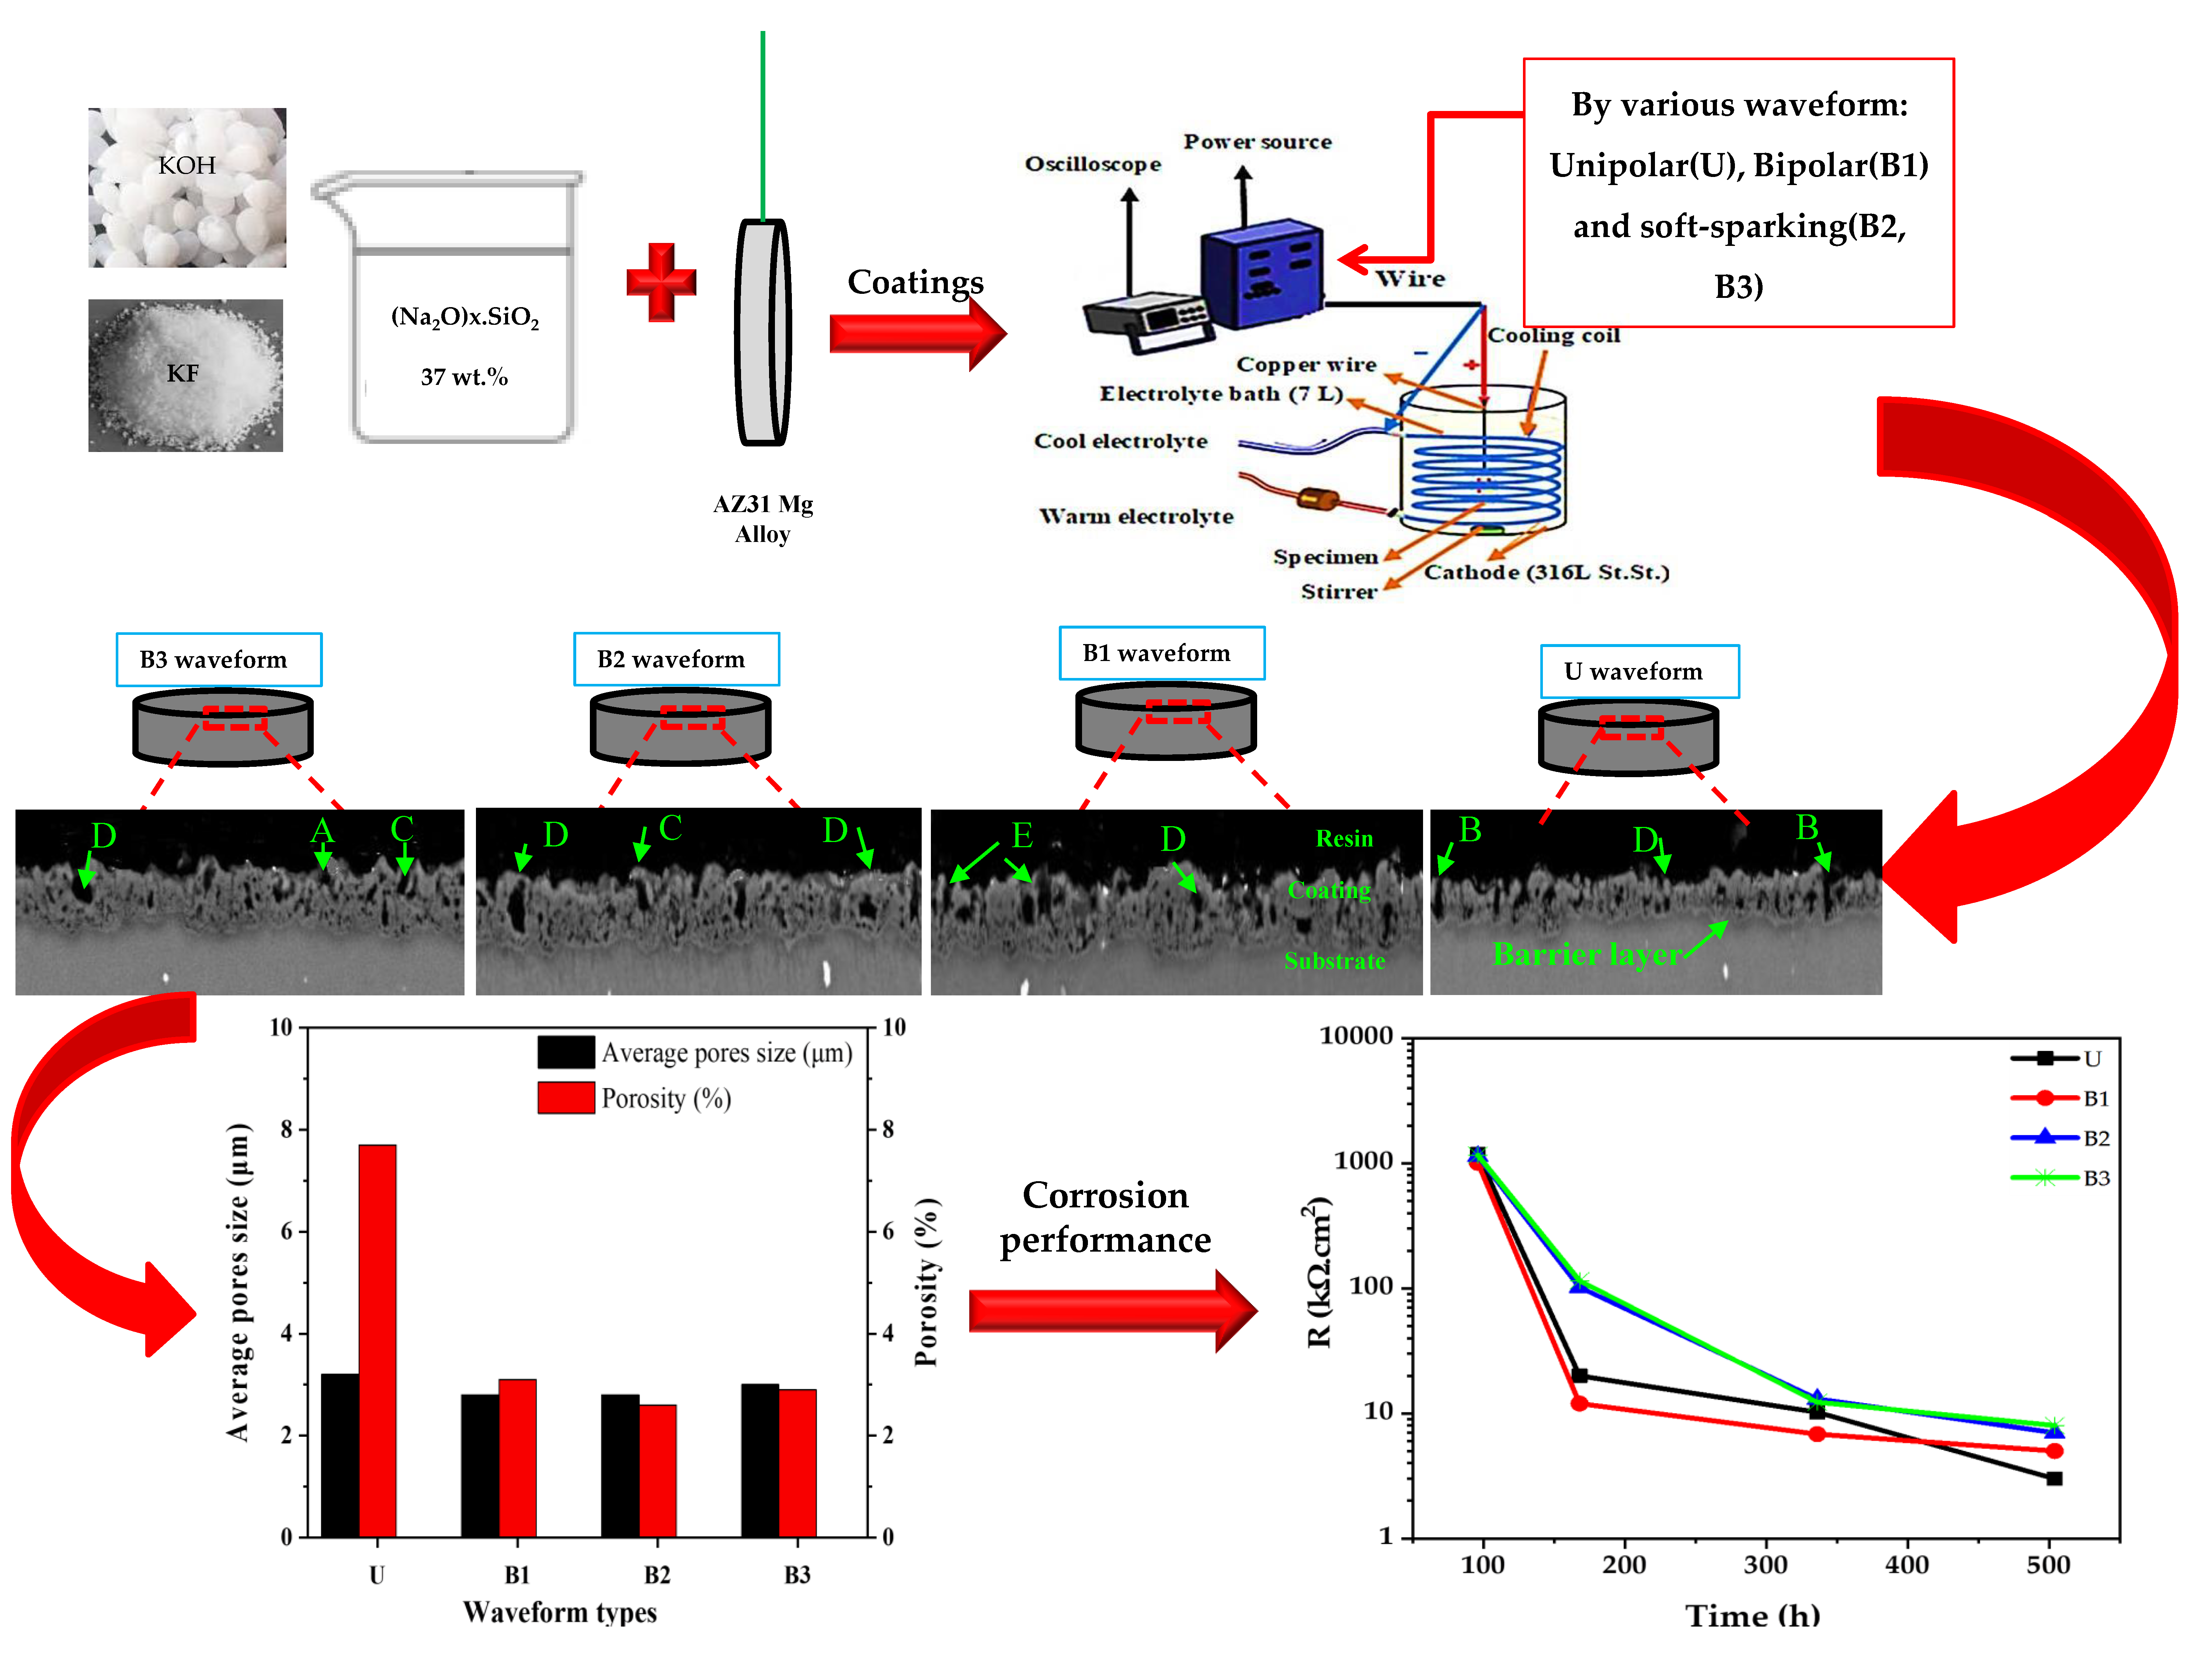
2.2. Plasma Electrolytic Oxidation Treatment

PEO coatings were performed in an alkaline electrolyte containing 6 g·l−1 sodium silicates as liquid glass ((Na2O)x.SiO2, 37 wt. %), 2 g·l−1 potassium fluoride (KF) and 8 g·l−1 potassium hydroxide (KOH) at a pH over 12. The electrolyte cell was a container made from 316 L stainless steel as cathode with 7 L volume equipped by an electrical pump for stirring, cooling and maintaining electrolyte temperature at 30 ± 5 °C. A power source 750 V/30 A equipped with an IGBT-based pulser was employed for applying the pulsed current waveforms. A schematic of PEO system along with the waveforms and electrical parameters applied are displayed in Figure 1 and Table 1, respectively. The codes of the coatings produced using different waveforms were defined as U for unipolar, B1 for the usual bipolar with 10% positive and 10% negative duty cycles, B2 for the soft-sparking waveform with 10% positive and 20% negative duty cycles and B3 for the soft-sparking waveform with 10% positive and 30% negative duty cycles. All the waveforms were applied for 10 min at 1 kHz. The anodic (positive) peak potential and the cathodic (negative) ones were 440 and 24 V, respectively. During the PEO process, cell current density versus time responses was recorded using a GPS 2024 digital oscilloscope. For B2 and B3 waveforms, the acoustic emission was very low, which confirmed that they were the real soft-sparking waveforms [1].

2.3. Coatings Characterization

Surface and cross-section morphology of the coatings were examined by a scanning electron microscope (SEM, model Philips XL30) (Amsterdam, Netherland) equipped with an energy dispersive spectrometer (EDS) for determining the chemical composition and elemental maps of the coatings. The cross-sections were prepared by grinding using silicon carbide (SiC) paper (up to 2400 grit), and then the specimens were polished using alumina particles (0.5 micron) followed by washing in deionized water and ethanol using ultrasonic cleaner and finally dried in cold air flow. The average thickness and porosity percent/pore size of the coating were measured on cross-section and surface of SEM micrographs using Image J 1.44p software (version 1.6), respectively. In order to identify the phase composition of the coatings, X-ray diffractometer (XRD, model Philips X’pert) (Amsterdam, Netherland) was applied and the XRD patterns recorded over 2θ range of 10–80° with step size of 0.05° per 1 sec using Cu Kα radiation (40 kV, 30 mA and λ = 0.15406 nm) filtered by Ni. X’Pert High Score software (version 3.0.0) with PDF2 (Powder Diffraction File for inorganic materials) database was employed to analyze the XRD patterns.

2.4. Evaluation of Corrosion Behavior of the Coatings

Corrosion behavior of the PEO-coated samples was evaluated using electrochemical impedance spectroscopy (EIS) at long-term immersions in 3.5 wt. % NaCl at pH 6.5 ± 0.1 using an AMETEK potentiostat/galvanostat (model PARSTAT 2273) (Tennessee, USA). Corrosion tests were carried out in a three-electrode cell, where one face of the coated samples with 1.33 cm2 (working electrode) was exposed to the aggressive electrolyte; a platinum plate was applied as counter electrode and a saturated Ag/AgCl as reference electrode. The Power Suite software was used to deal with the data of corrosion tests. EIS measurements were carried out at a frequency range from 100 kHz to 100 mHz, and ±10 mV peak-to-peak voltage amplitude versus open circuit potential (OCP). For evaluating the stability of the coatings, the EIS measurements were continued for long immersion times using duplicate samples, and then, the changes in the impedance responses were evaluated over exposure time. The EIS and fitting data were determined using Zview software (version 3.1).

3. Results and Discussion

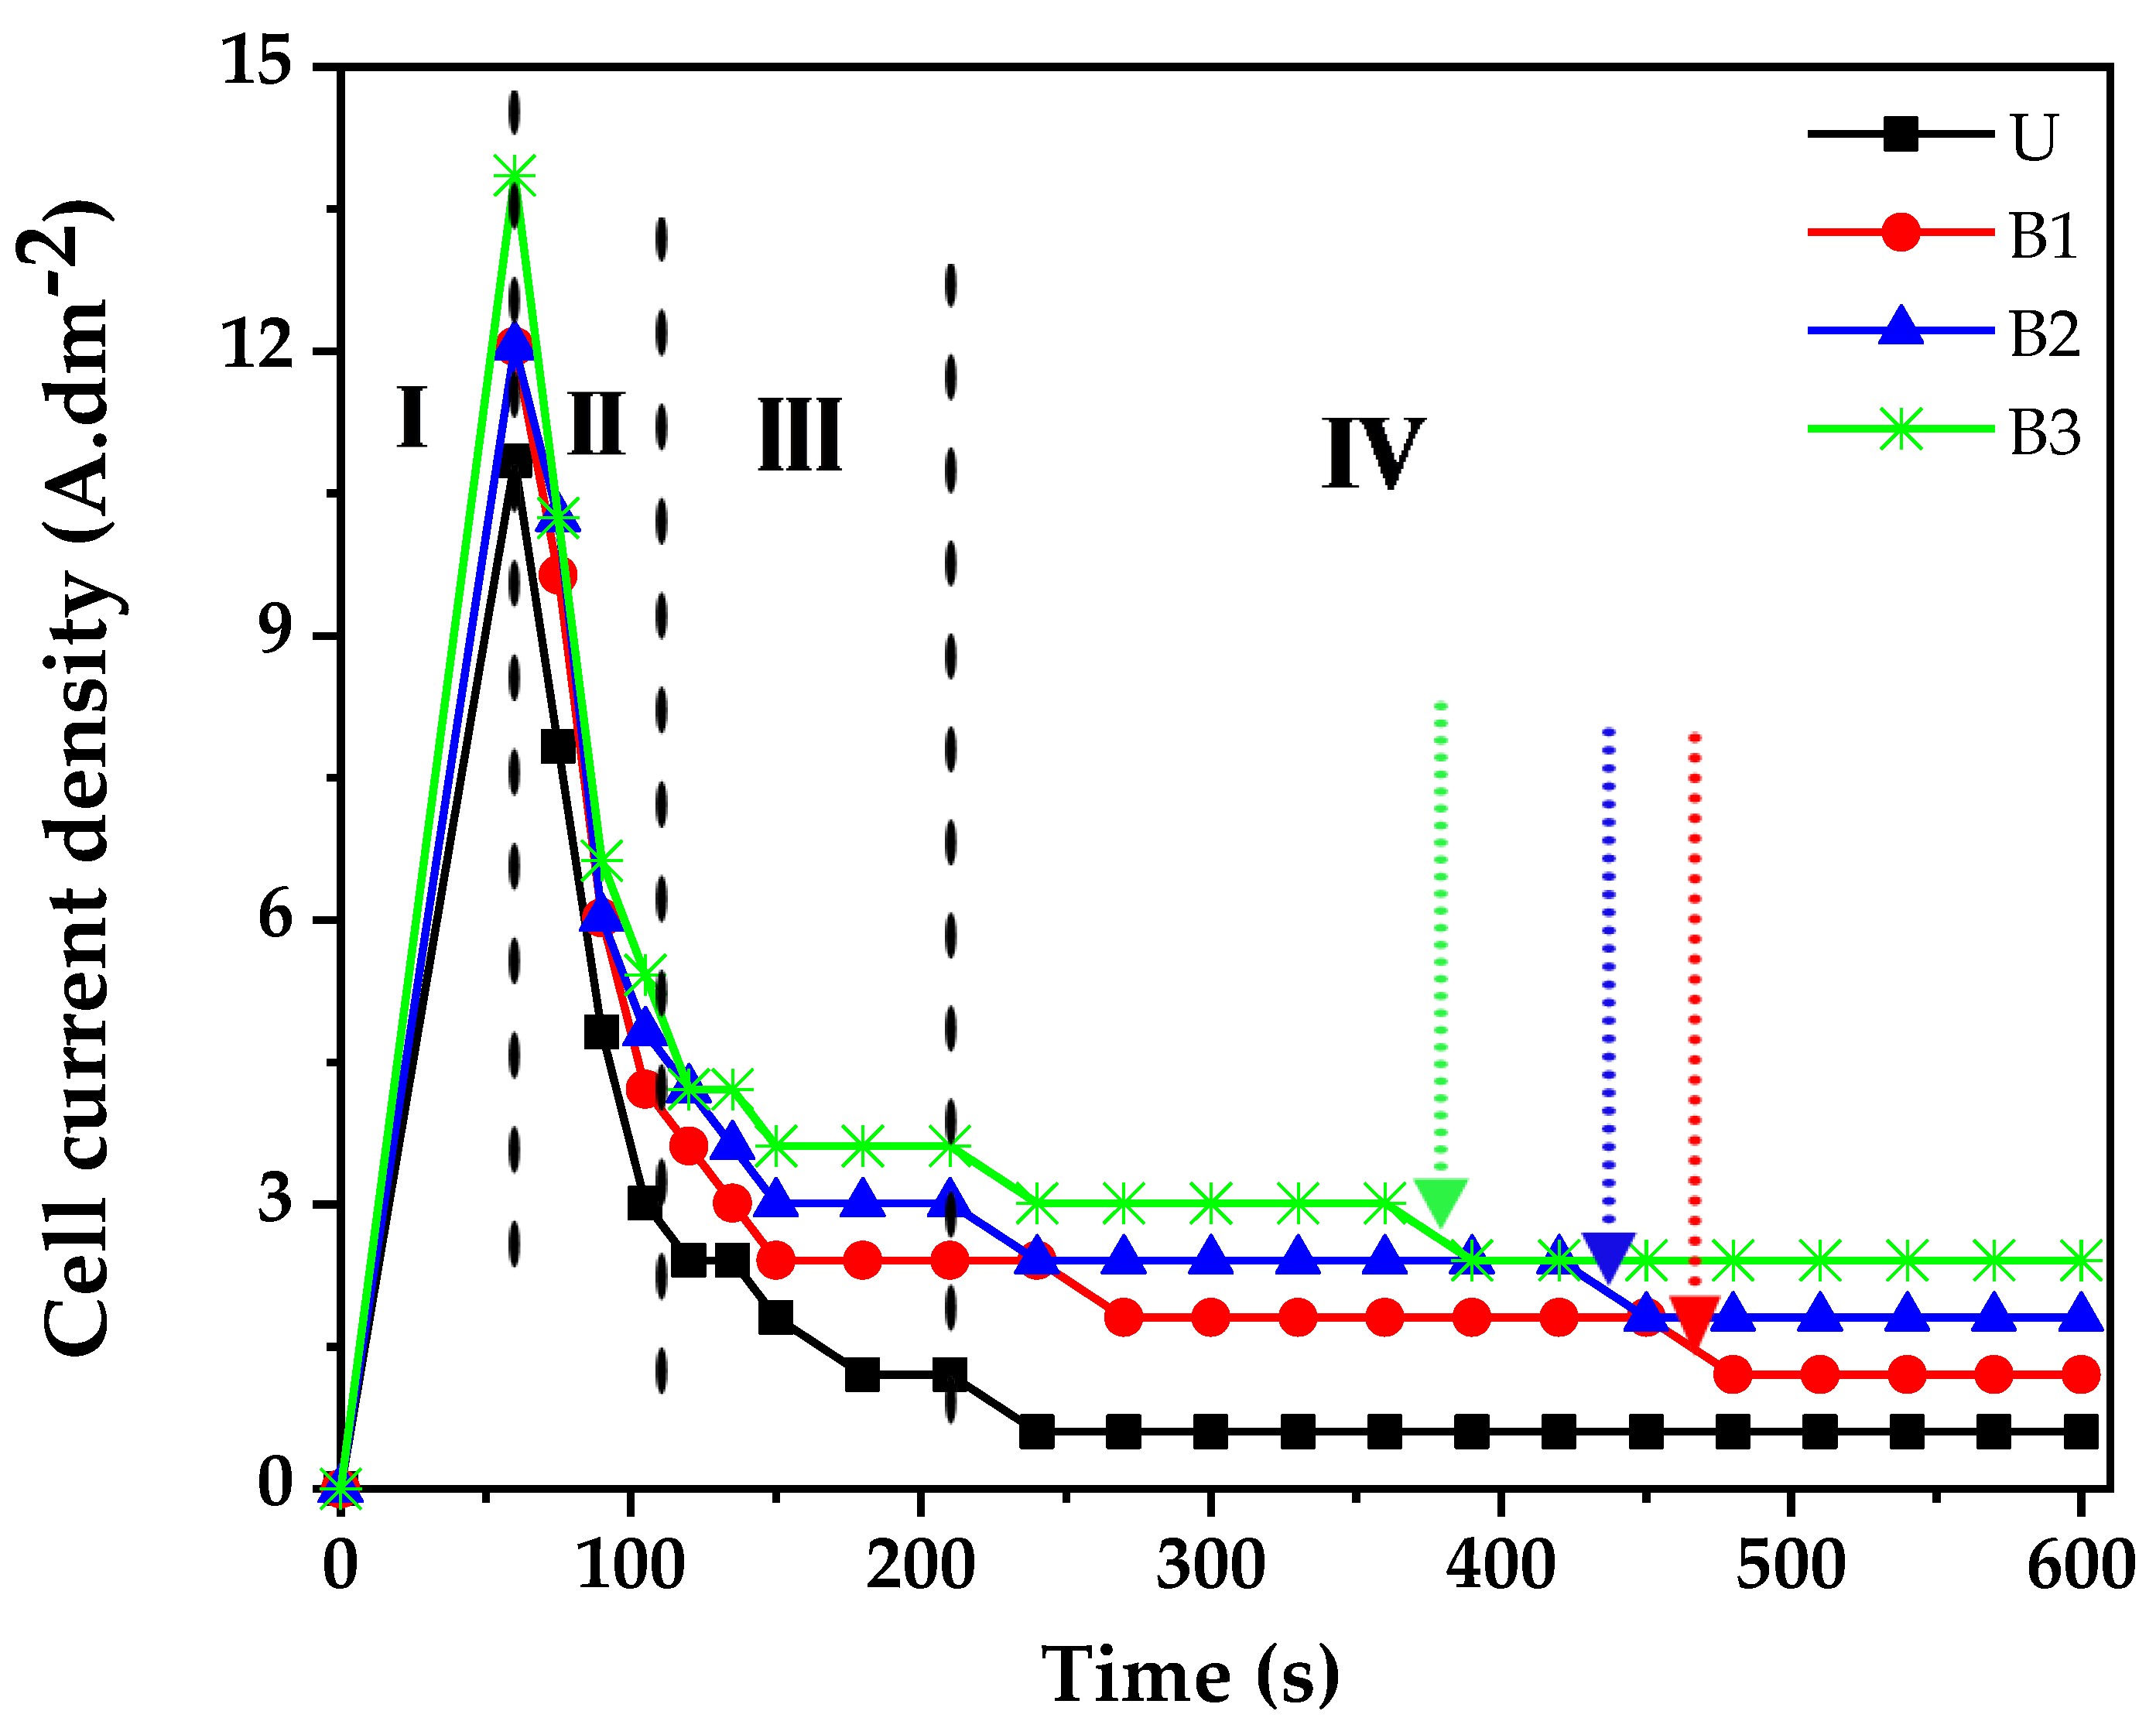
3.1. Cell Current Density-Time Responses during PEO Treatment

Figure 2 shows cell current density versus time curves (CTC) recorded during PEO treatment using unipolar (U), usual bipolar (B1) and soft-sparking (B2 and B3) waveforms (see Table 1). The cell current density (sum of absolute magnitudes of anodic and cathodic current densities) reaches its maximum value when the voltage arrives at 440 V. The corresponding cell current densities at the end of linear potential ramping (60 s) are 10.84 A.dm−2 for U, 12.05 A.dm−2 for B1 and B2, and 13.86 A.dm−2 for B3 waveform. Due to the higher cathodic current density consumed by more cathodic duty cycle, the overall current density increases with increasing the cathodic duty cycle.
In Figure 2, different stages can be identified from variation of curve slope in CTC diagram. In the first stage (~0–60 s), the current density increases linearly with a very steep slope (stage I). This stage corresponds to general and sparking anodization process which develops a thin passive film via oxidation of metal surface by hydroxyl anions and applied electrical field [18]. At the second stage (~60–120 s), after reaching to 440 V, micro-arcing is started thanks to the high applied electrical field. In this stage, the current density decreases almost linearly with time, with a very steep slope which is due to formation of a more dense and thick oxide layer. The formation of a uniform oxide layer increases the electrical resistance at substrate/electrolyte interface, and hence, decreases the current density according to the ohm’s law. At stage III (~120–210 s), the current density decreases slowly, reaching a roughly constant value. Notably, when stage III starts, a large number of fine sparks appears as white glows which randomly scan the entire sample surface very fast, leading to the formation of a non-uniform and porous oxide layer [19,20]. Therefore, oxide growth is slower due to the competition between growth and breakdown of the oxide layer [21]. In stage IV (~210–600 s), for unipolar waveform (U), the current density decreases by a step and then remains constant resulting in a steady-state discharging regime. Conversely, for the bipolar waveforms during this stage, the current density does not remain constant and other steps occur during the process, as highlighted in Figure 2 by arrows. Here, the discharge distribution is not uniform for B1, B2 and B3 waveforms. The second step appears sooner for the bipolar waveform with the higher cathodic width. By increasing the cathodic duty cycle, the higher cell current densities are achieved in stages II and III (Figure 2). A similar behavior is described in [6].

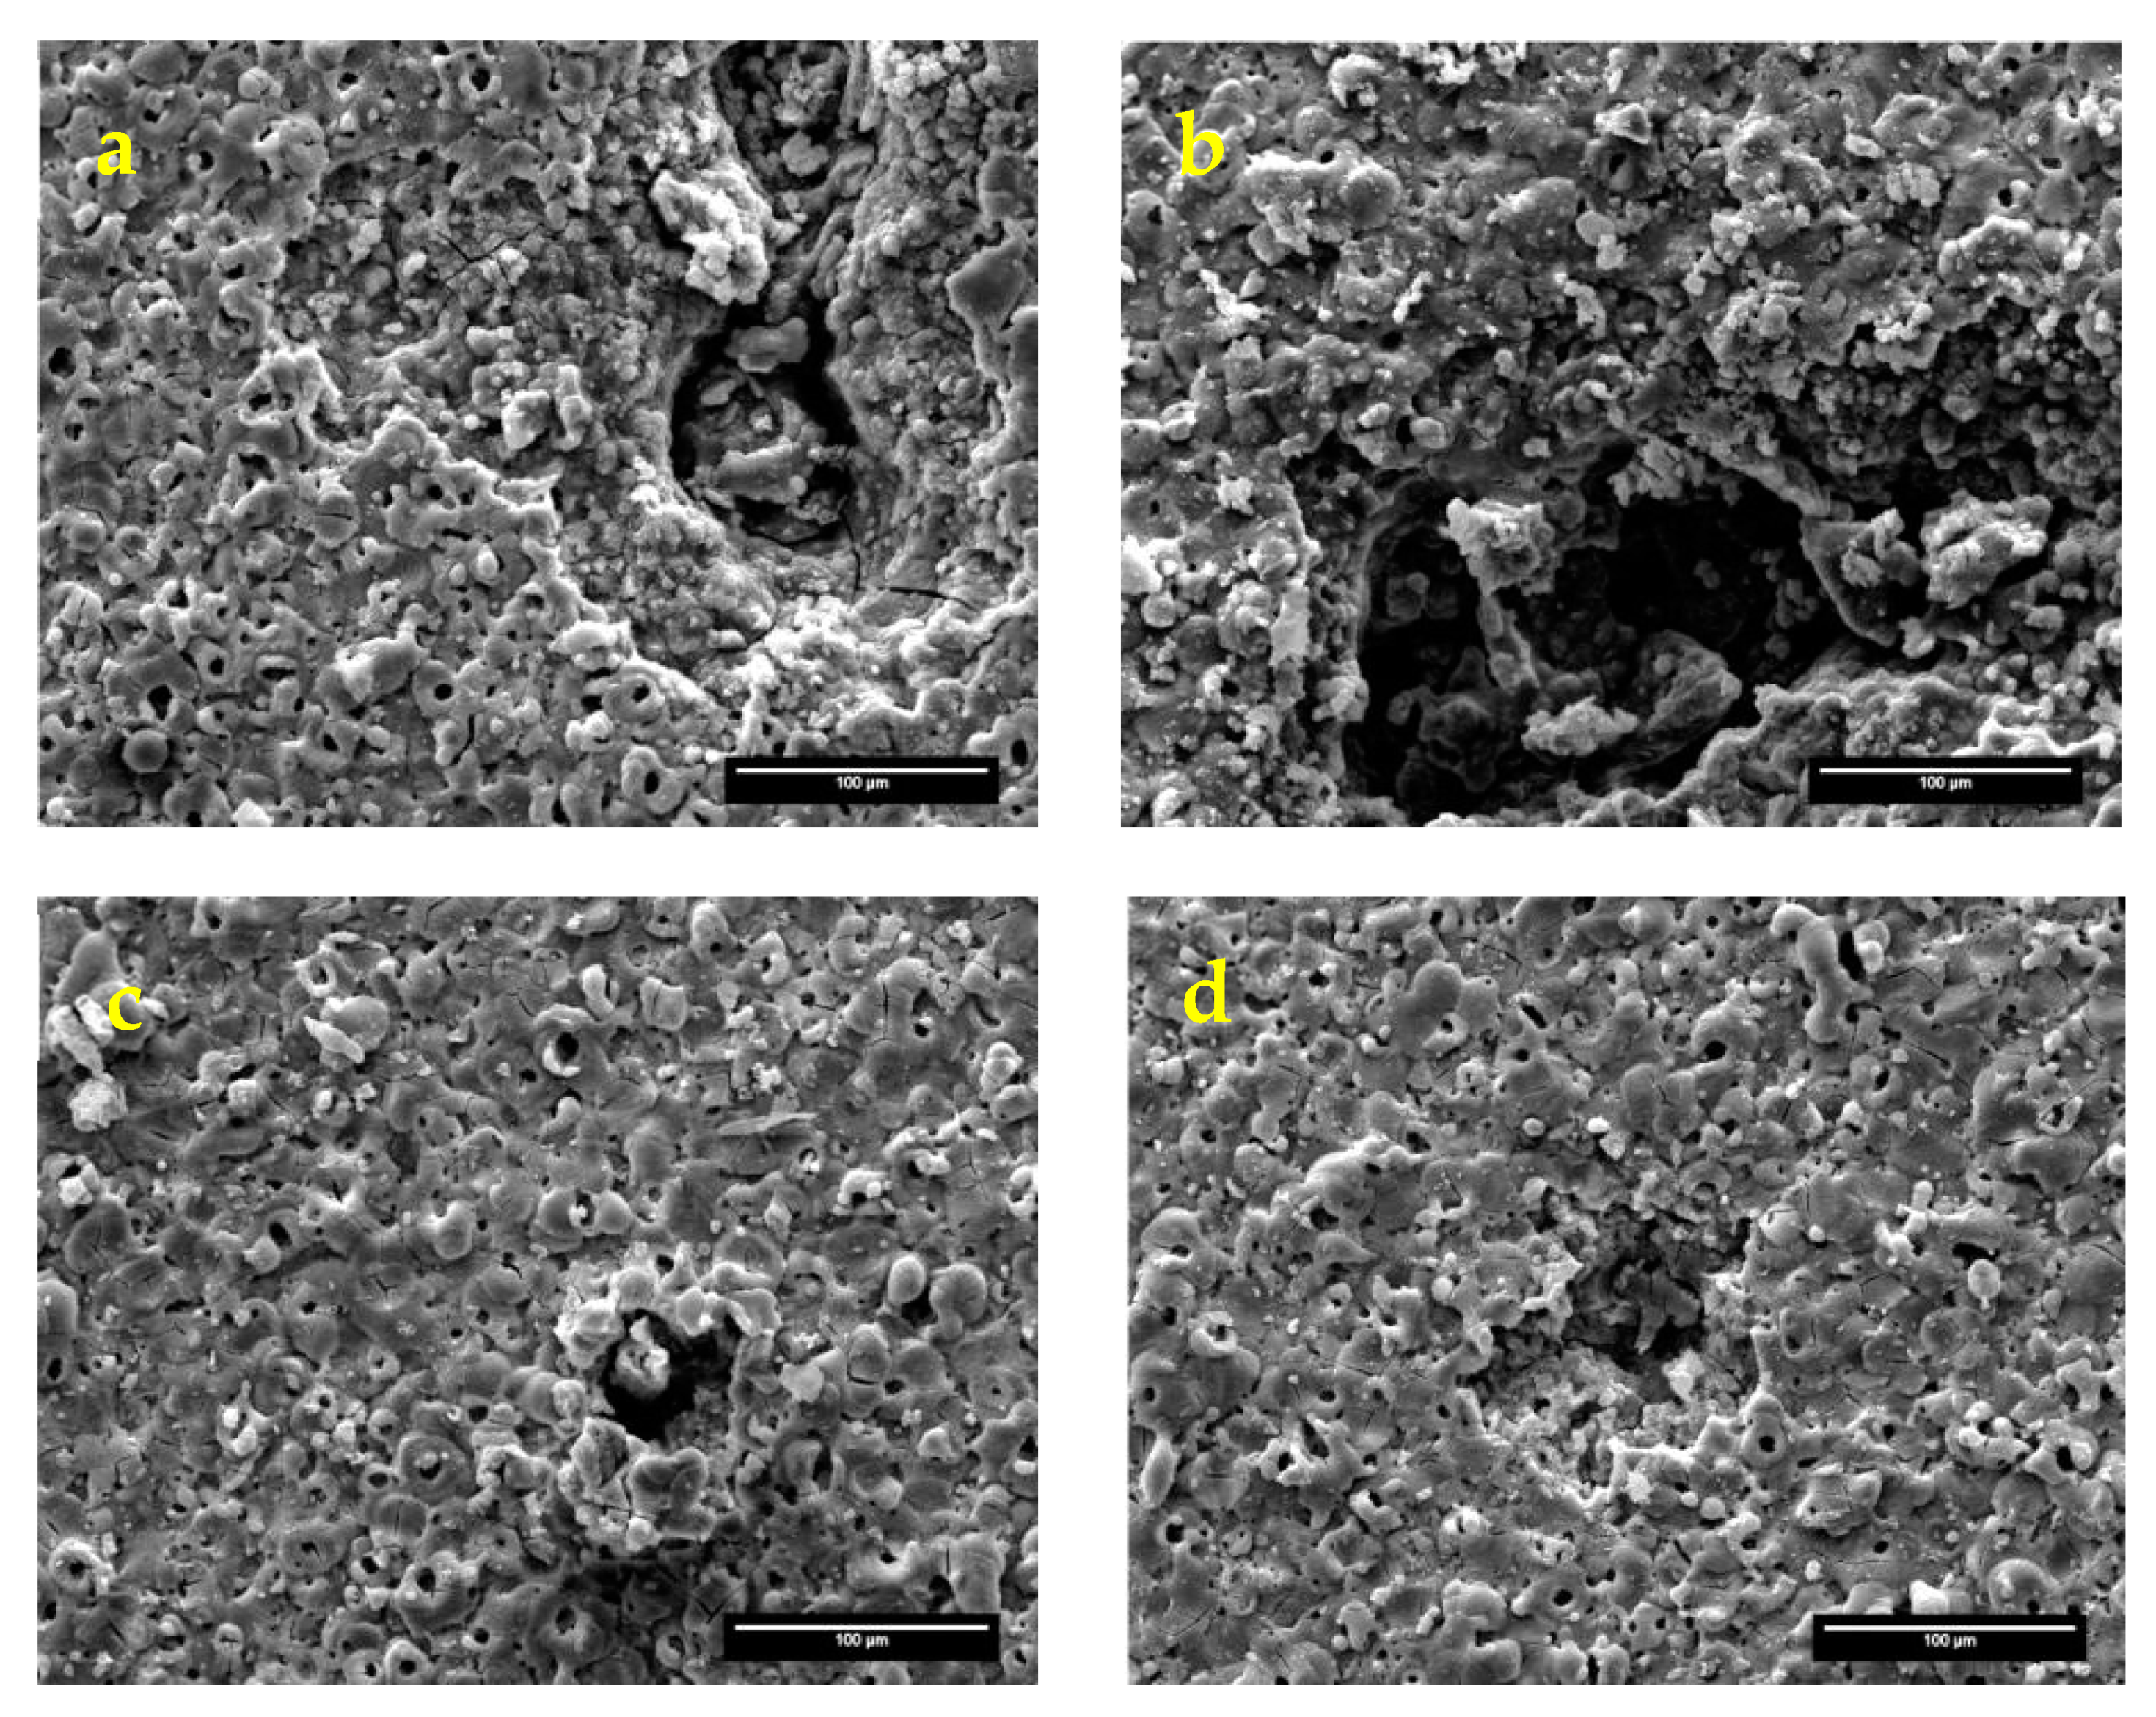
3.2. Surface Morphology of the Coatings

Surface morphology of the coatings produced using different waveforms is shown in Figure 3. In general, formation of PEO coating starts with sparks passing through an oxide layer generating discharge channels, gas trapping and oxidation reaction of substrate elements. Hence, micro-pores naturally develop on the coating surface [22]. The micro-cracks are usually formed by thermal stresses generated during rapid solidification of molten oxide and the difference between thermal coefficients of the coating and substrate [6,9]. Although the waveform plays a major role on development of morphology in PEO treatment of Al alloys [23,24], the experimental evidences of this work suggest that no noticeable effect on coating morphology of AZ31 Mg alloy occurs by changing the employed waveform. As shown in Figure 3, a uniform surface morphology containing a network of micro-pores, micro-cracks and granules of oxide compounds are evidenced. The net-like and/or scaffold morphology is commonly reported for the PEO coatings produced on Mg alloys from a silicate electrolyte [25,26]. The coating surface exhibits uniformly distributed pores, which mainly show regular circular holes with different sizes. Surface porosity percent and average pore size of the PEO coatings grown at various waveforms are estimated from SEM images and shown in Table 2. The average pore size is almost independent on the waveform (~3 µm). The highest surface porosity percent is 7.7% obtained for the coating produced using U waveform, while the lowest is 2.6% obtained for the B2 produced coating. The reduction of the porosity percentage for the bipolar (B1) regime can be explained by the reduction of the strong B-type discharges [5]. When cathodic voltage is applied to an oxide (barrier) layer, it causes incorporation of cations, and thereby, the coating conductivity increases. This assists hydrogen evolution, and consequently, alkalization of adjacent electrolyte regions, which increases local pH in vicinity of specimen surface [1,27]. The isoelectric point (IEP) for magnesium oxide lies at pH of ~10.5. When the surface is polarized negatively, this pH becomes higher than 10.5, which encourages the formation of Mg(OH)2. This phase has a higher equivalent volume than MgO and seals the pores effectively [28], and thus, the number of pores reduces with increasing the cathodic duty cycle and increases thickness. The cathodic pulse following anodic ones can also seal the micro-cracks and micro-discharge channels effectively [29,30]. Although increasing the cathodic to anodic current ratio reduces B-type discharging and also their detrimental effects, it also promotes A-type discharges. Accordingly, the process that employed the B3 waveform involves strong C- and A-type discharges which develop fine pores through gas evolution [6,31]. Therefore, B3 coating was found slightly more porous than B2 one (see Table 2). It should be noted that the feature of the pores created by B- and A-type discharges are essentially different.

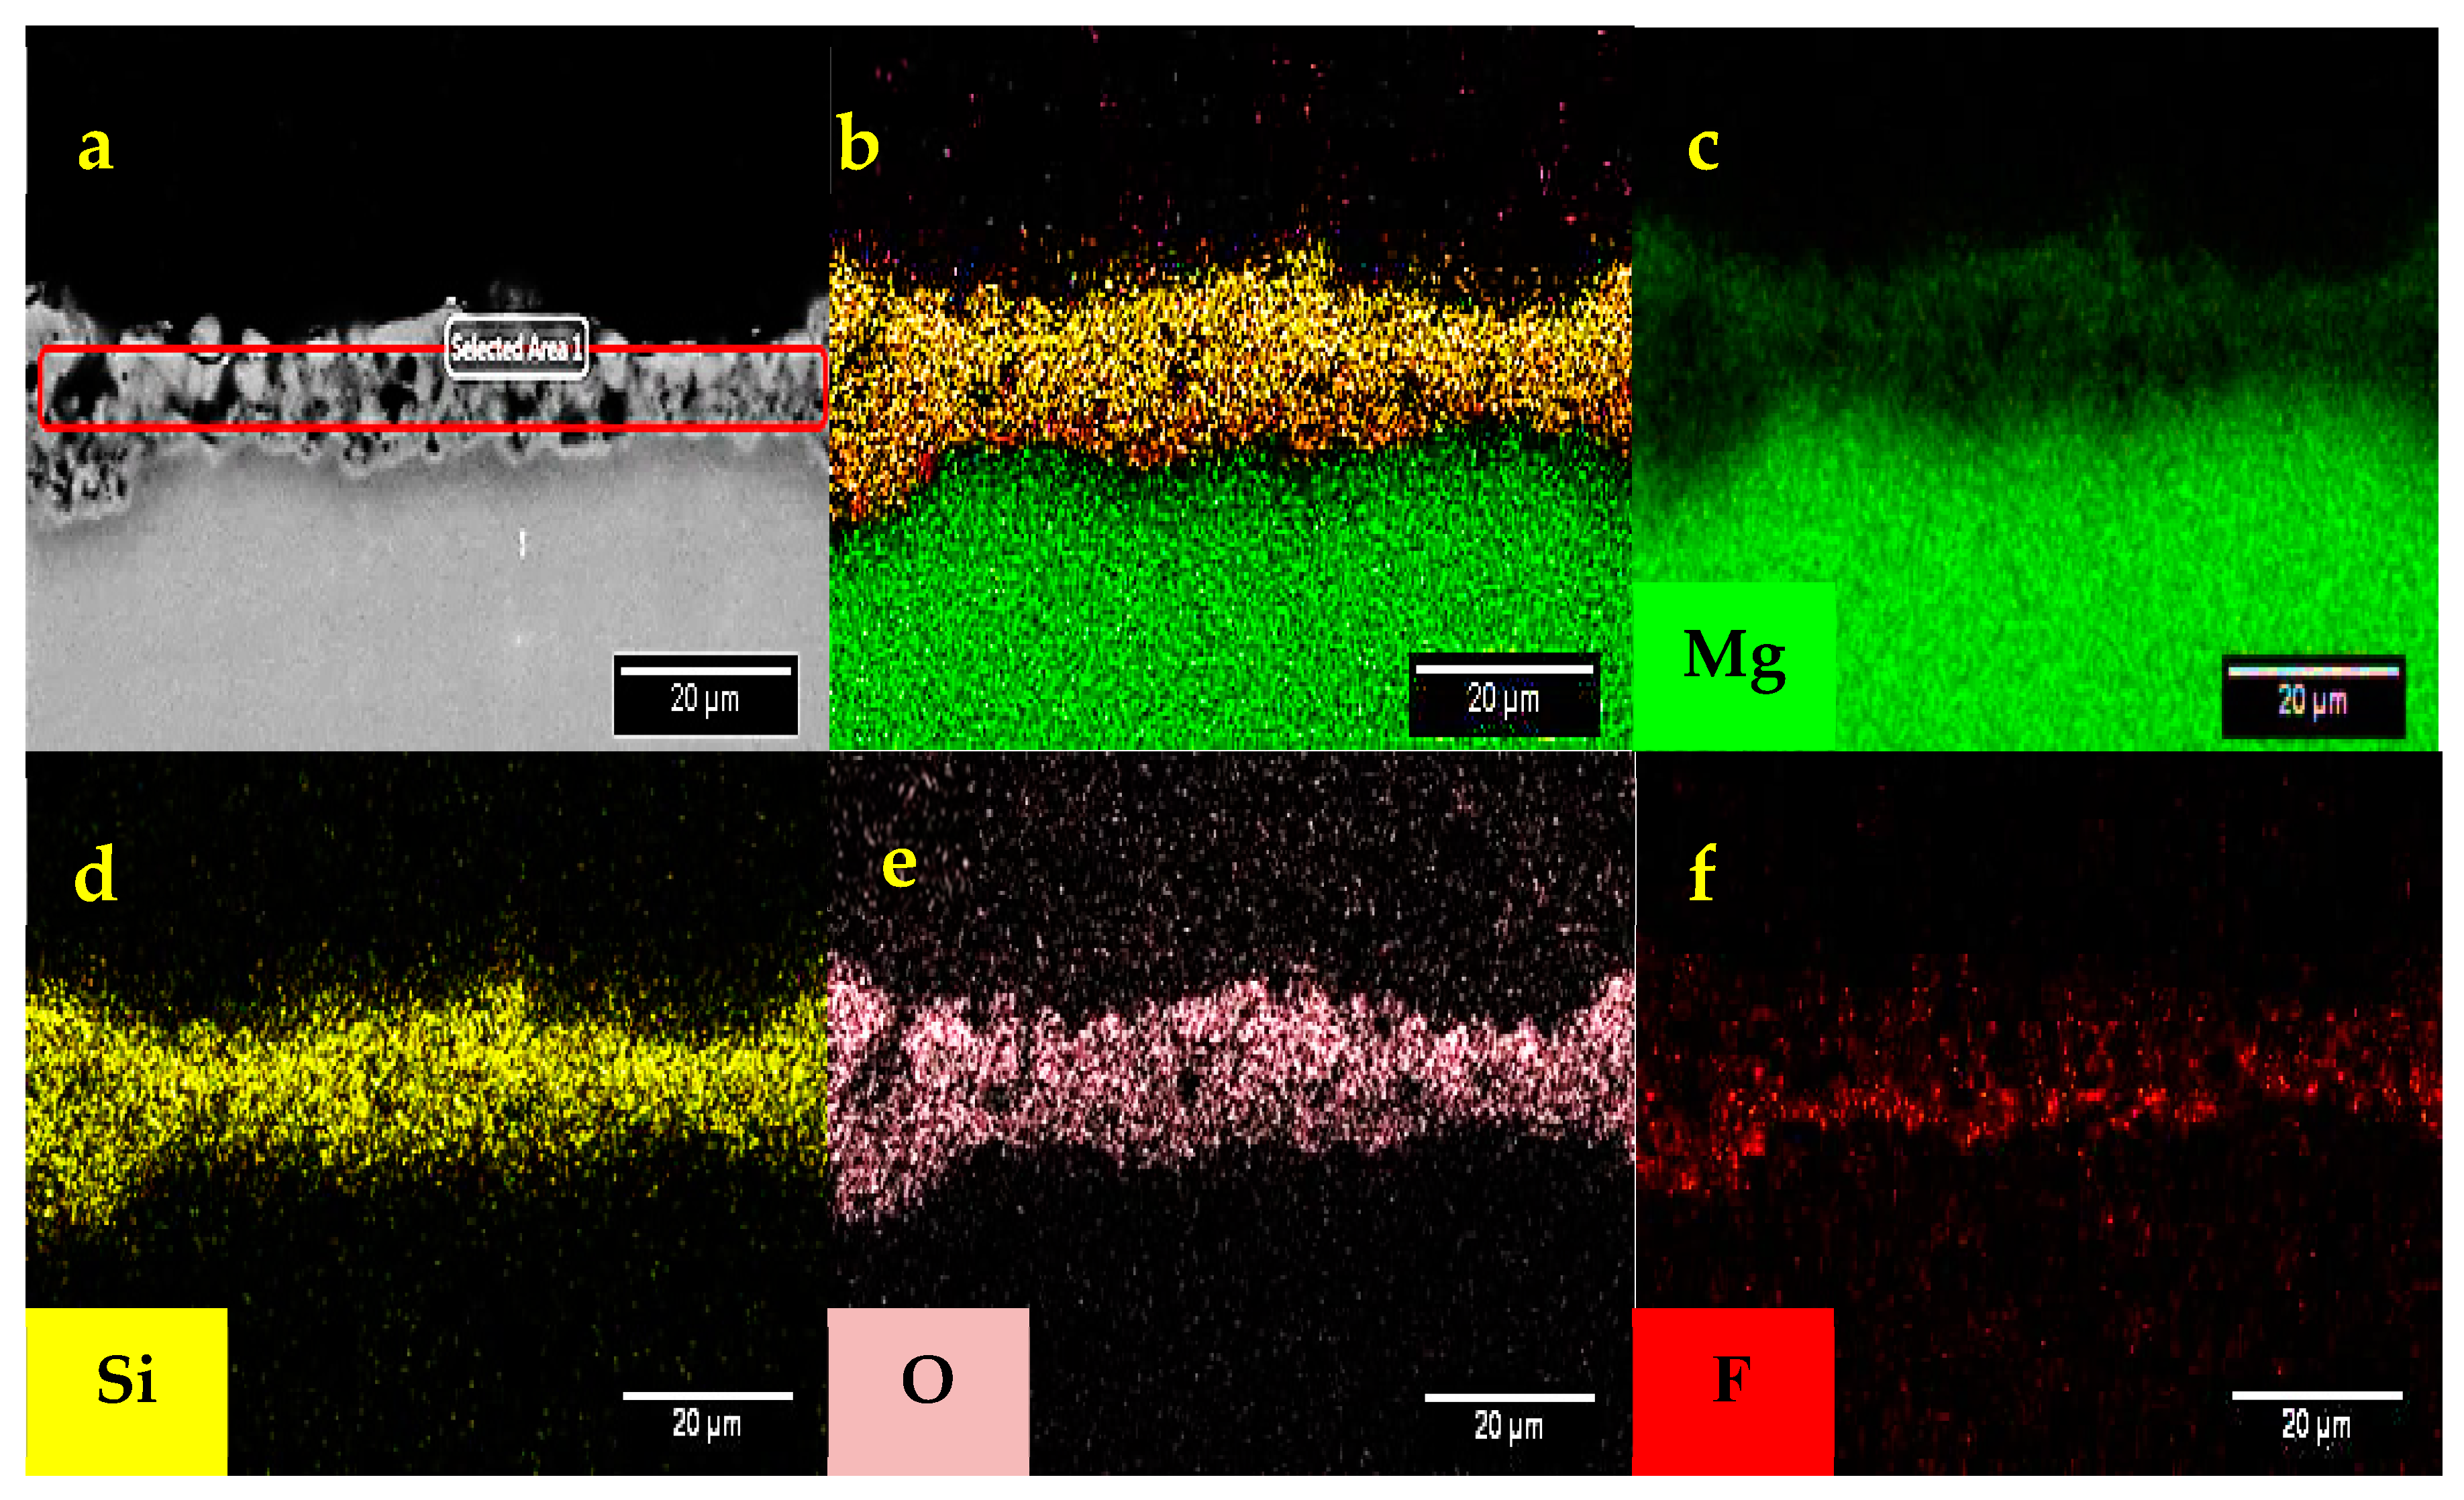
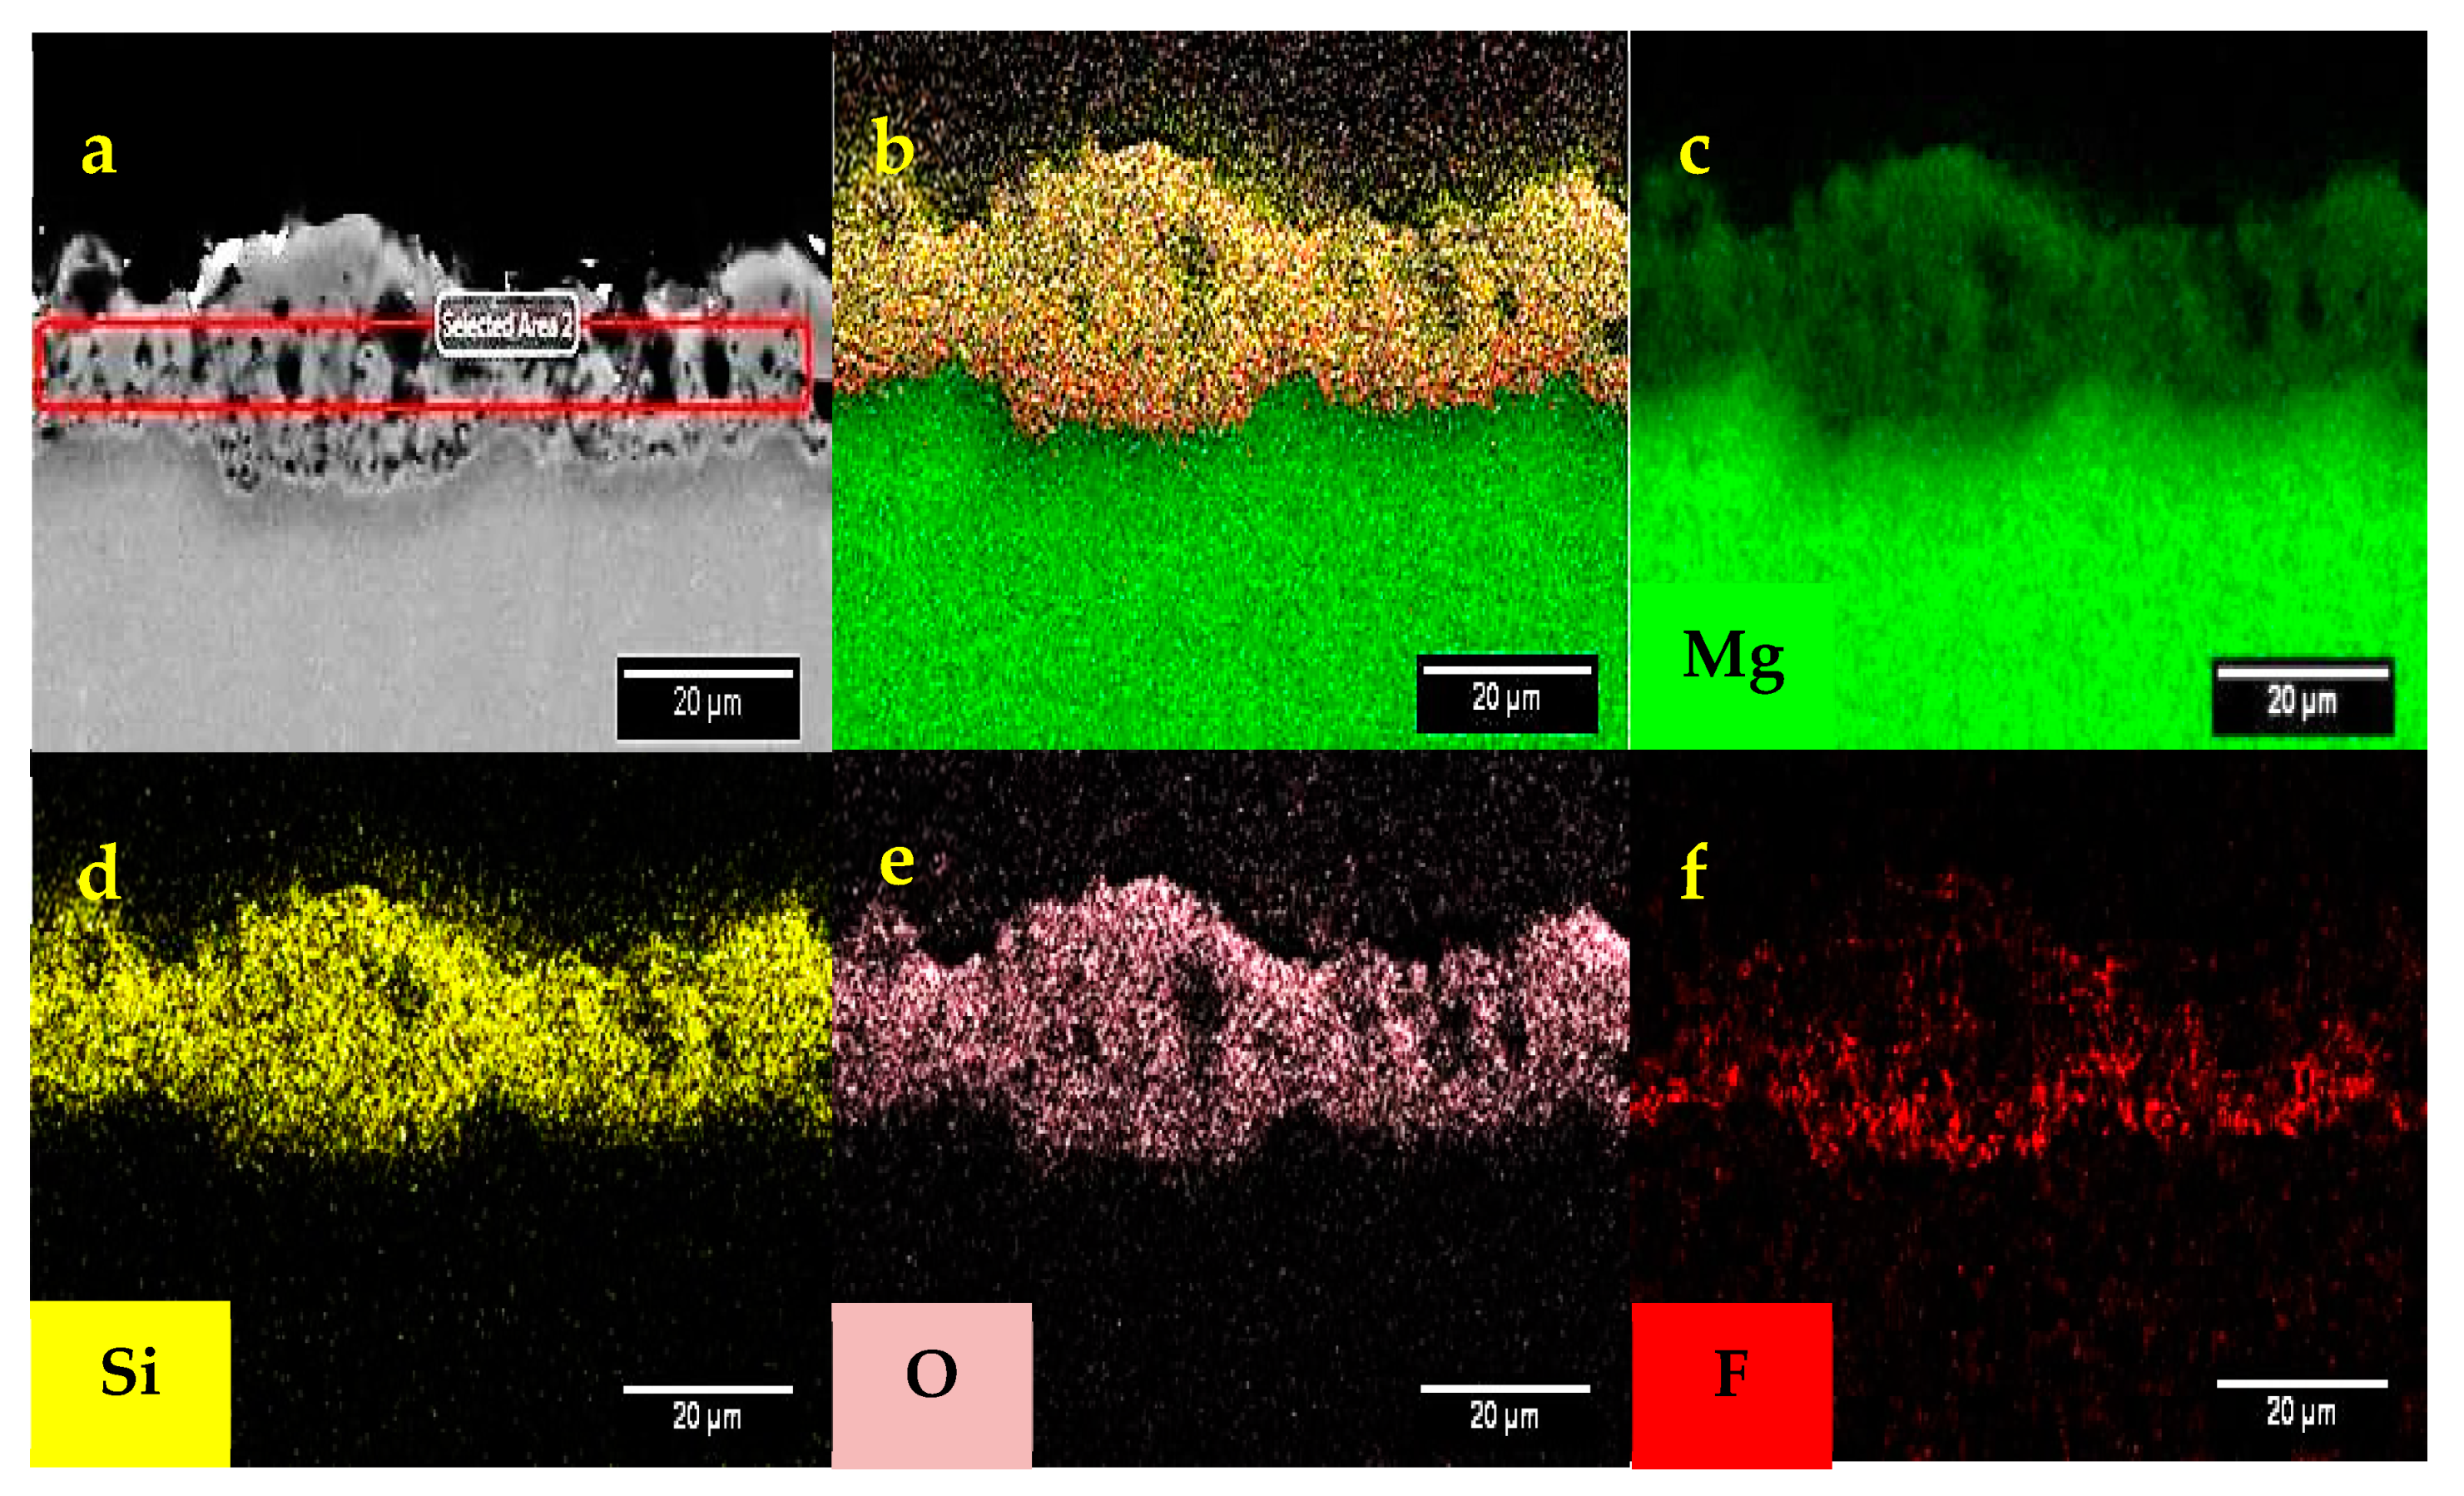
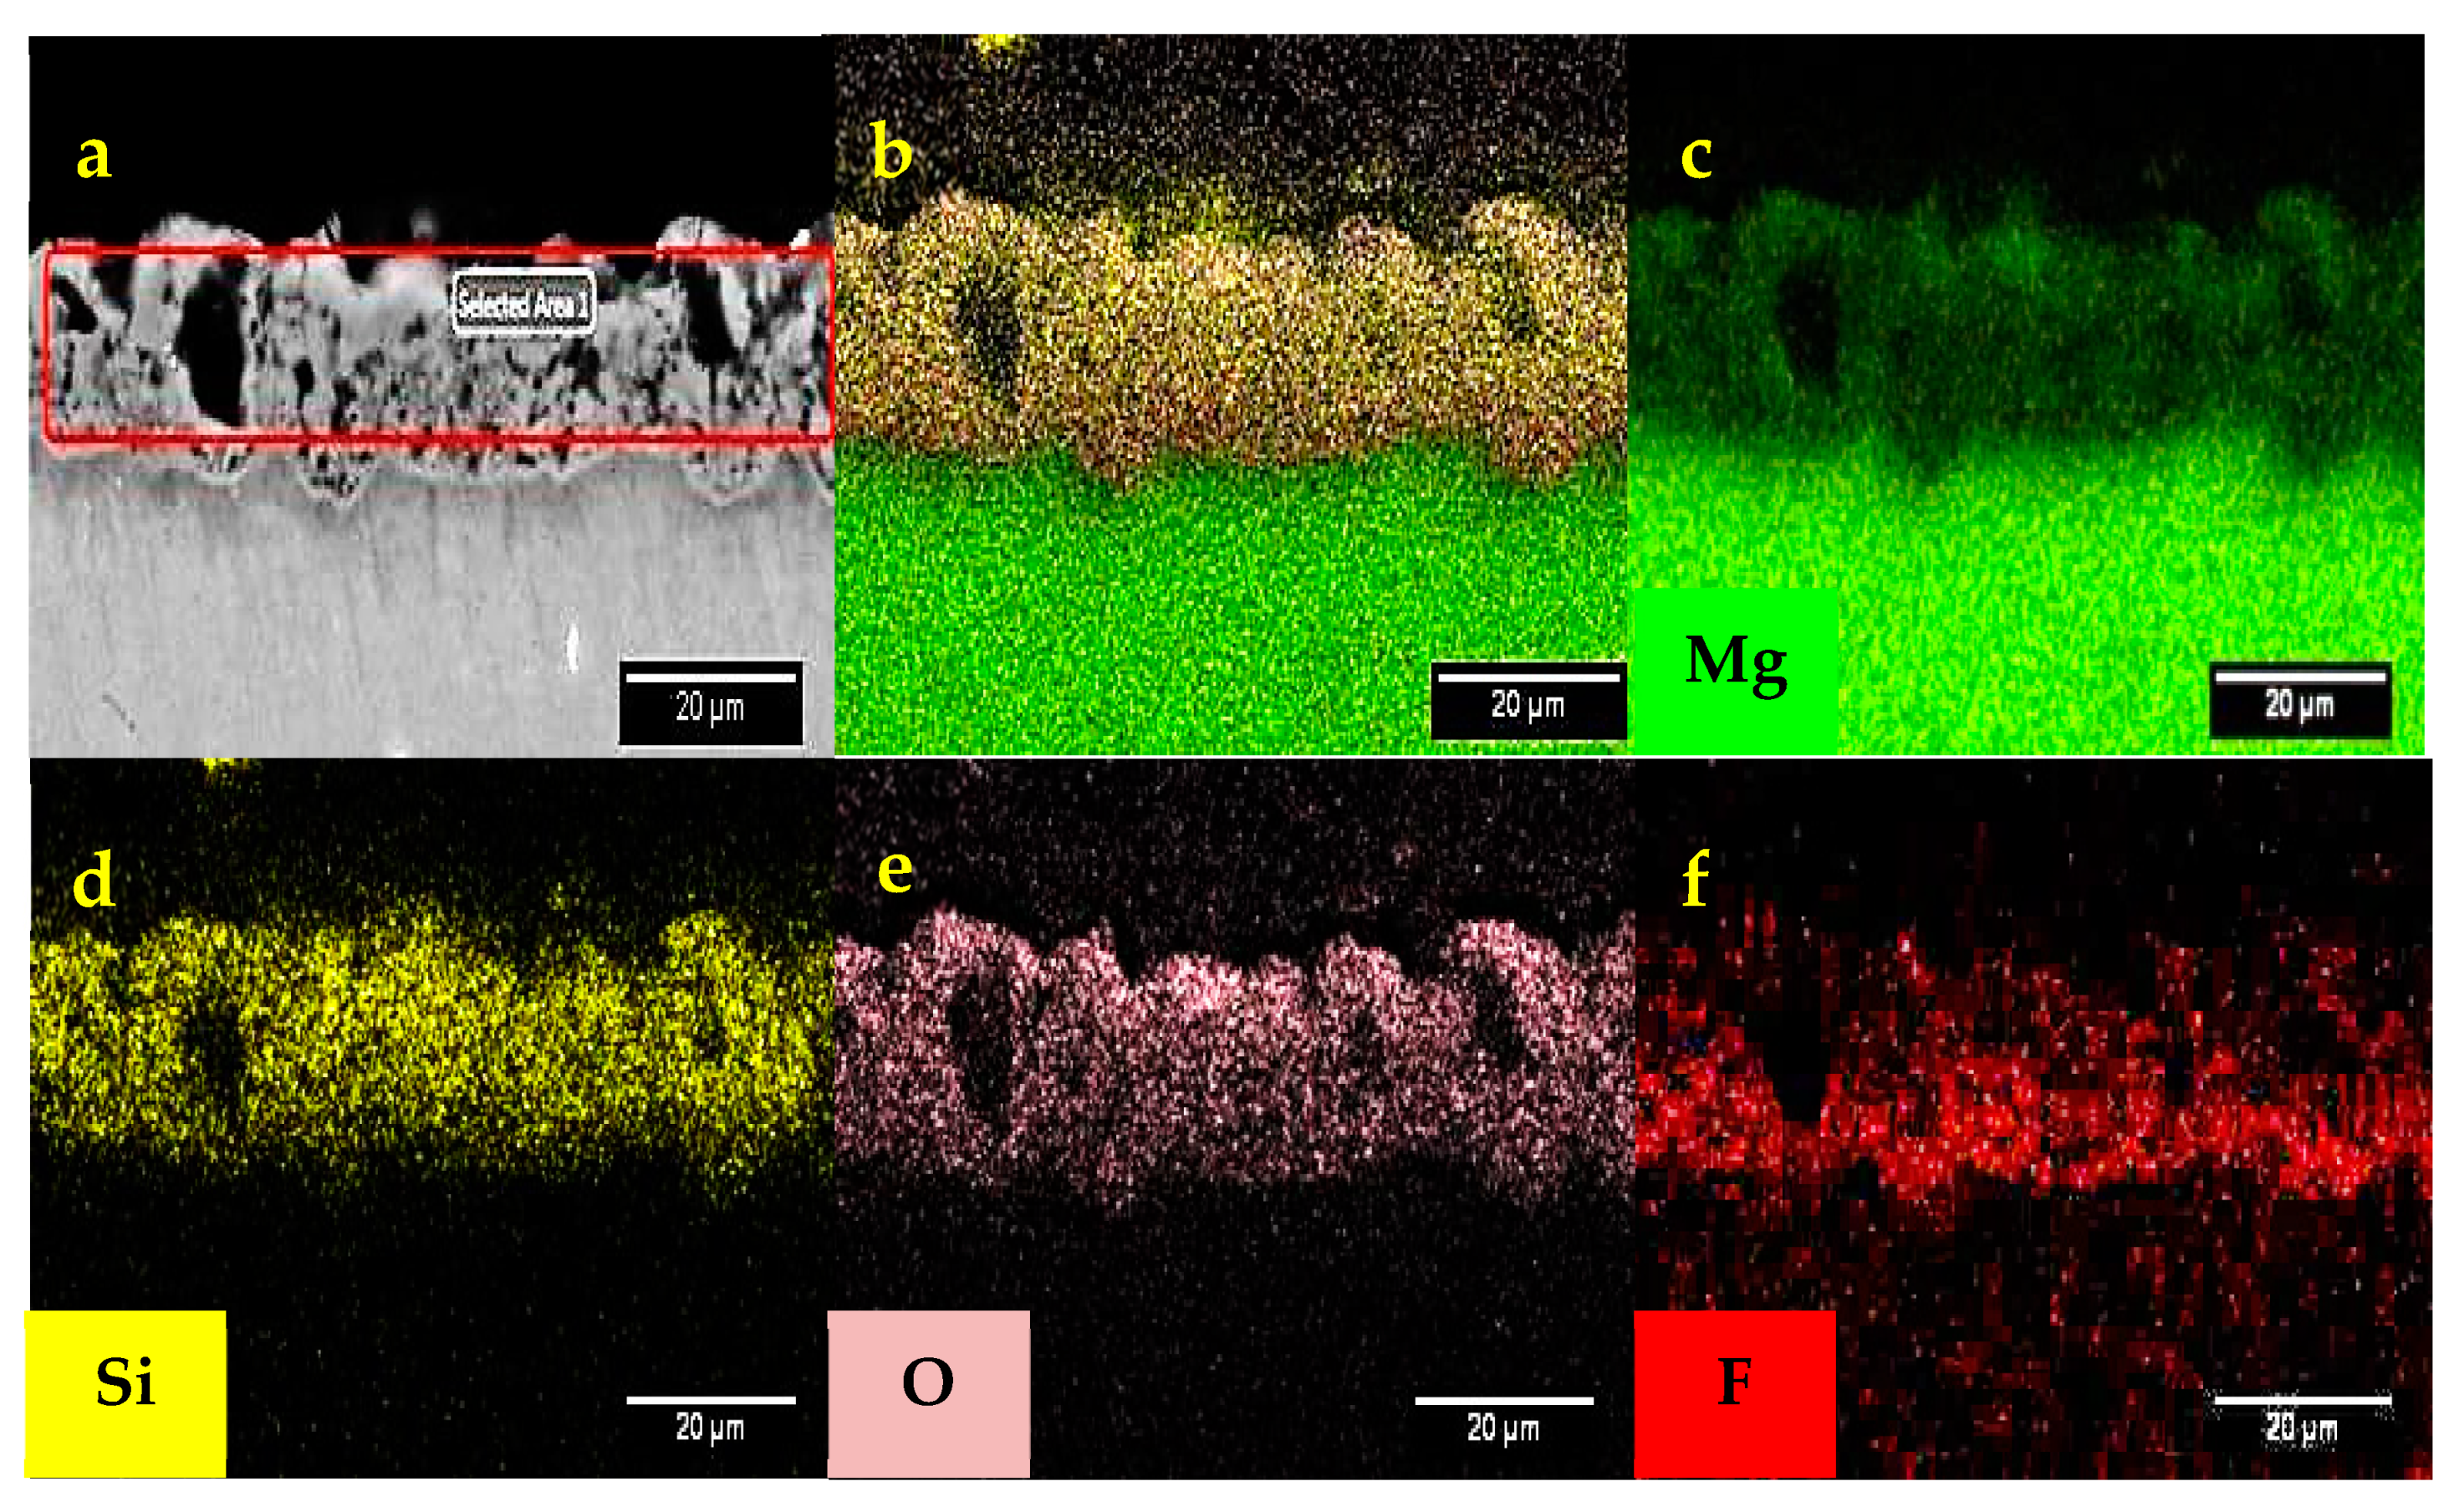
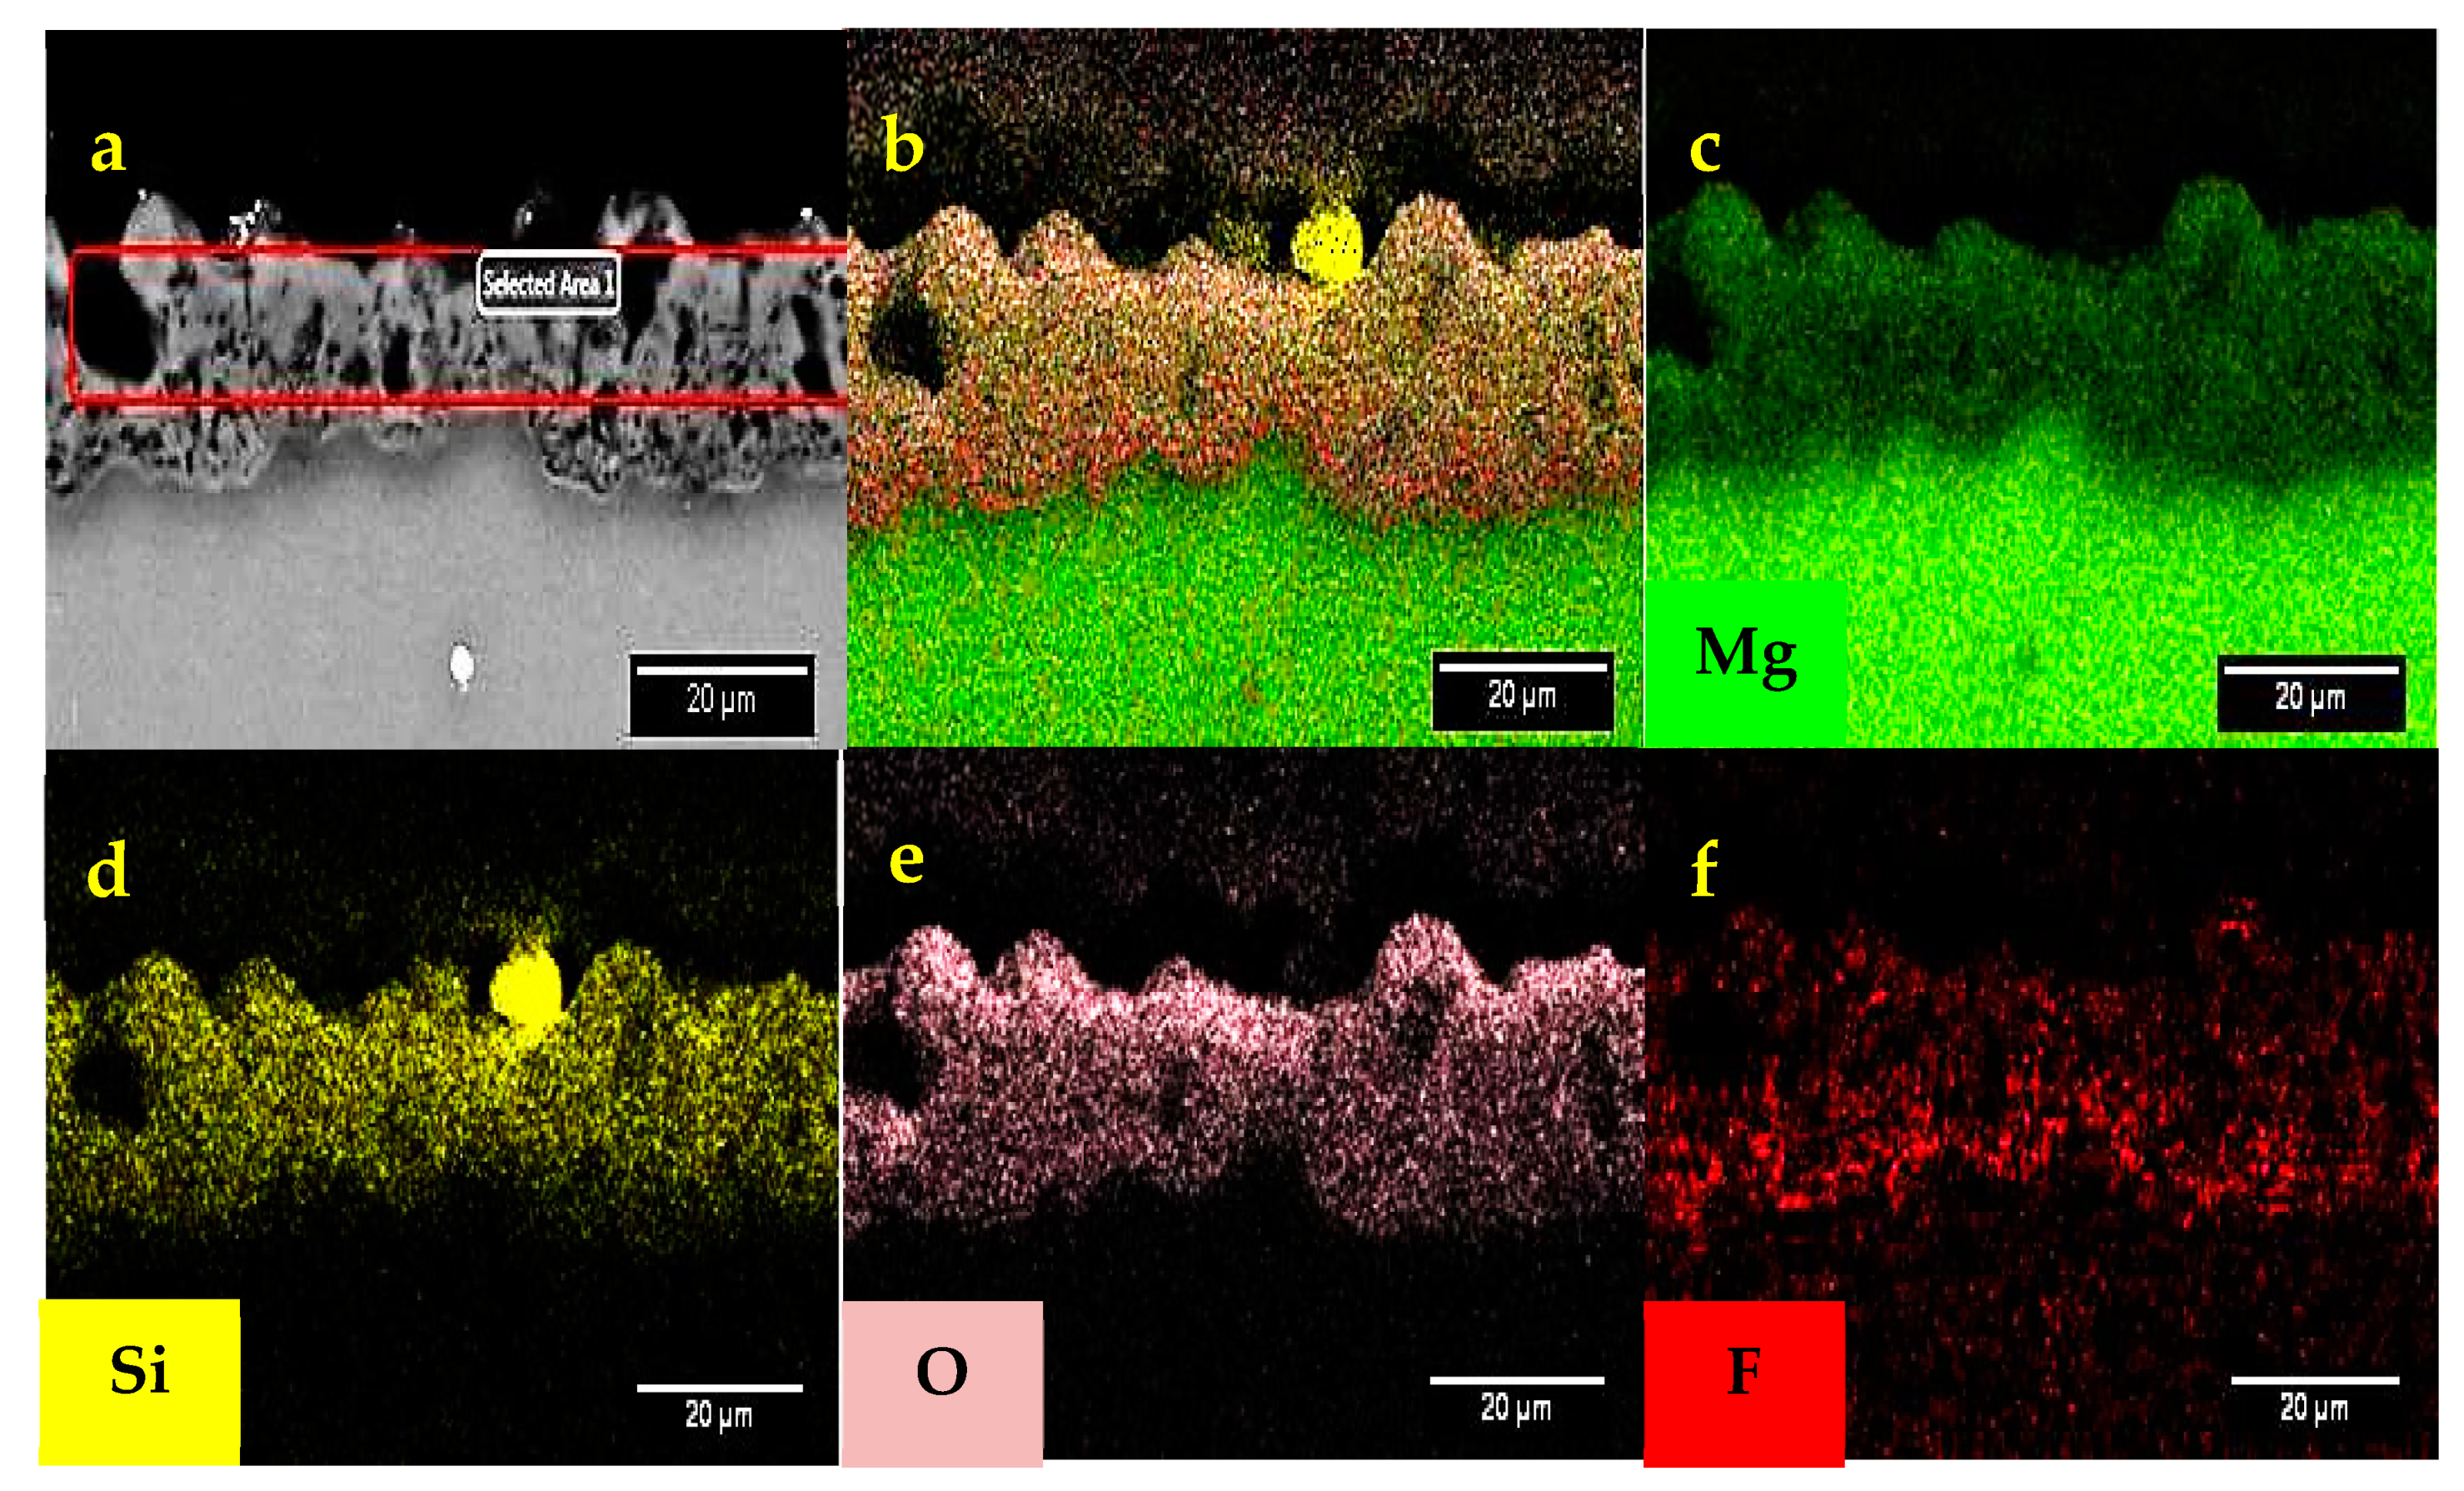
3.3. Cross-Sectional Observation, Structure and Composition of the Coatings

Figure 4 shows cross-sectional images of the coatings. As seen, the substrate/coating interface has a wavy-jagged appearance for all specimens. The distortion intensity increases with changing waveform from unipolar to bipolar, but the interface is being modified and becomes smoother by increasing the cathodic duty cycle. The wavy-jagged interface can be the result of substrate (α-Mg) dissolution during PEO process and appearance of intermetallic β-Mg17Al12 (eutectic phase) at grain boundaries [6]. As widely reported [21,32], PEO coatings usually contain two layers: a layer adjacent to the substrate (inner layer), which is more compact and acts as a barrier toward aggressive solution, and a porous outer layer. As shown in Figure 4, in all coated specimens these two defined layers are visible. Cheng et al. [31] proposed a modified growth model for PEO process of Al alloys that has been developed by Hussein et al. [6] for Mg alloys. In this modified growth model, the formation of discharge channels is described better than that for Al alloys. According to this model, five types of discharges can occur during the PEO process responsible for observing morphological features: B-type discharging which occurs at the substrate/coating interface and forms deep channels connected to substrate and appears pancake morphology on the top coating surface; A-type discharging originating in the upper side of coating at oxide/electrolyte interface or adhered gas bubbles attached to the coating surface which creates volcano-like surface morphology, discharge type C which happens at oxide/electrolyte interface within pores and cracks of the coating makes nodular features, discharge type D that occurs inside the large pores at the inner/outer oxide layer interface, and finally, E-type which form deep channels connected near to inner/outer oxide layer interface and makes also the pancake morphology [31]. It can be discerned from Figure 4a that there are deep pores in the coating produced by the U waveform elongated from coating surface to the substrate. These pores originate from B- and D-type of discharges and gas entrapping. Therefore, the coating produced by the U waveform shows pancakes along with a net of micro-pores and some micro-cracks. By using the bipolar waveforms, the strong discharges (type B) are reduced and E-type of discharges is substituted accordingly. As seen in Figure 4b, the big pores are shifted to outer layer of the coating. Here, there is a balance of discharge effect which prevents the strong discharging [33]. By increasing the cathodic width, the big pores produced by E-type of discharging are also eliminated (Figure 4c,d), while the discharge types of C, D and A are prevailing. The limiting of strong discharges with increasing the cathodic duty cycle of bipolar regimes has been reported before [23,24]. For the coatings grown by soft-sparking (B2 and B3) waveforms, the surface morphology reveals a net of micro-pores as a scaffold, micro-cracks and some fine particles dispersed on the coating surface. These fine particles are originated from C- and A-types of discharging as previously reported [31].
The measured thickness values are 12.16 ± 1.82, 19.48 ± 2.80, 23.30 ± 2.04 and 24.17 ± 2.67 μm for the coatings produced by U, B1, B2 and B3 waveforms, respectively. According to the obtained results, thickness of the coatings formed using B1 waveform increased in comparison to those prepared using the U waveform. By applying soft-sparking B2 waveform, even thicker layer is achieved. However, the thickness shows no significant increase with further increasing the cathodic duty cycle (i.e., B3 waveform). According to the literature, the increase of duty cycle increases the coating thickness, but the rate of increasing decreases at higher cathodic duty cycles [7]. This was attributed to the lower incorporation of some electrolyte constituents (anions) into the coating [7]. It can be concluded that the waveform causes a change in discharging both in terms of type and density, which has a profound effect on coating microstructure, thickness and porosity of the coatings [6,10].
As widely reported in the literature [6,8,10,34], the PEO coatings produced by applying DC or unipolar pulsed regimes are porous, containing more defects with low thickness. The bipolar waveform produces a coating with fewer defects, and more uniform with higher thickness when compared to the coating formed using the unipolar waveform. Furthermore, the soft-sparking improves the characteristics of PEO coatings (for example: decreases roughness and porosity and increases coating thickness uniformly) [1,35].
The atomic percentage (at. %) of the elements taken from cross-sections of the coatings using EDS analysis is shown in Table 3. The main elements are Mg, Al, O, Si, and F indicating the contribution of elements from both substrate and electrolyte in coating’s outer layer. The silicon and fluoride contents are almost constant for all coatings. K and Na are also revealed in the coating that can be incorporated from the electrolyte during discharges. It has been reported that the pores forming during the PEO process can trap electrolyte solution [1,30].
XRD patterns of the oxide coatings formed by various waveforms are shown in Figure 5. The major phases are Mg (JCPDS Card #00-001-1141), MgO (JCPDS Card #01-087-0653), MgF2 (JCPDS Card #00-016-0160), and Mg2SiO4 (JCPDS Card #00-021-1260). The diffraction peaks of Mg phase are due to the substrate and become less intense on going from unipolar to bipolar and to soft-sparking prepared coatings, due to formation of thicker and less porous layers. Therefore, the peak intensities for Mg2SiO4 and MgF2 phases increase.
In positive half cycles, fluoride ions migrate towards the metal/oxide interface allowing for the formation of a more compact barrier [36]. Thus, a high amount of fluoride ions reaches the metal/coating interface and creates MgF2 film as a sharp evident layer. The melting point of Mg2SiO4 is about 2183 K, thus, its presence indicates that the temperature of plasma discharge channels is very high.
Distribution of the constituent elements of the coatings across their thickness is shown by EDS maps in Figure 6, Figure 7, Figure 8 and Figure 9. As seen, Mg from substrate and Si from electrolyte are distributed almost uniformly across the coatings. However, a sharp layer of fluoride element can be detected at substrate/coating interface for all coatings (Figure 6f, Figure 7f, Figure 8f and Figure 9f). It is worth mentioning that fluoride is present in the inner part of the coating (see maps), suggesting that its incorporation mainly occurs due to its migration during the anodic pulses under the strong imposed electric field [1,31]. Indeed, F ions is reported to migrate faster than O2− ions thus fluoride ions are accumulated at the metal/oxide interface [37,38]. Moreover, since the melting point of MgF2 is the lower if compared to other coating constituents, the plasma in the discharge channels is more capable to form this phase. Thus, MgF2 phase is highly encouraged to be formed in an inner layer of the coatings [36,39].

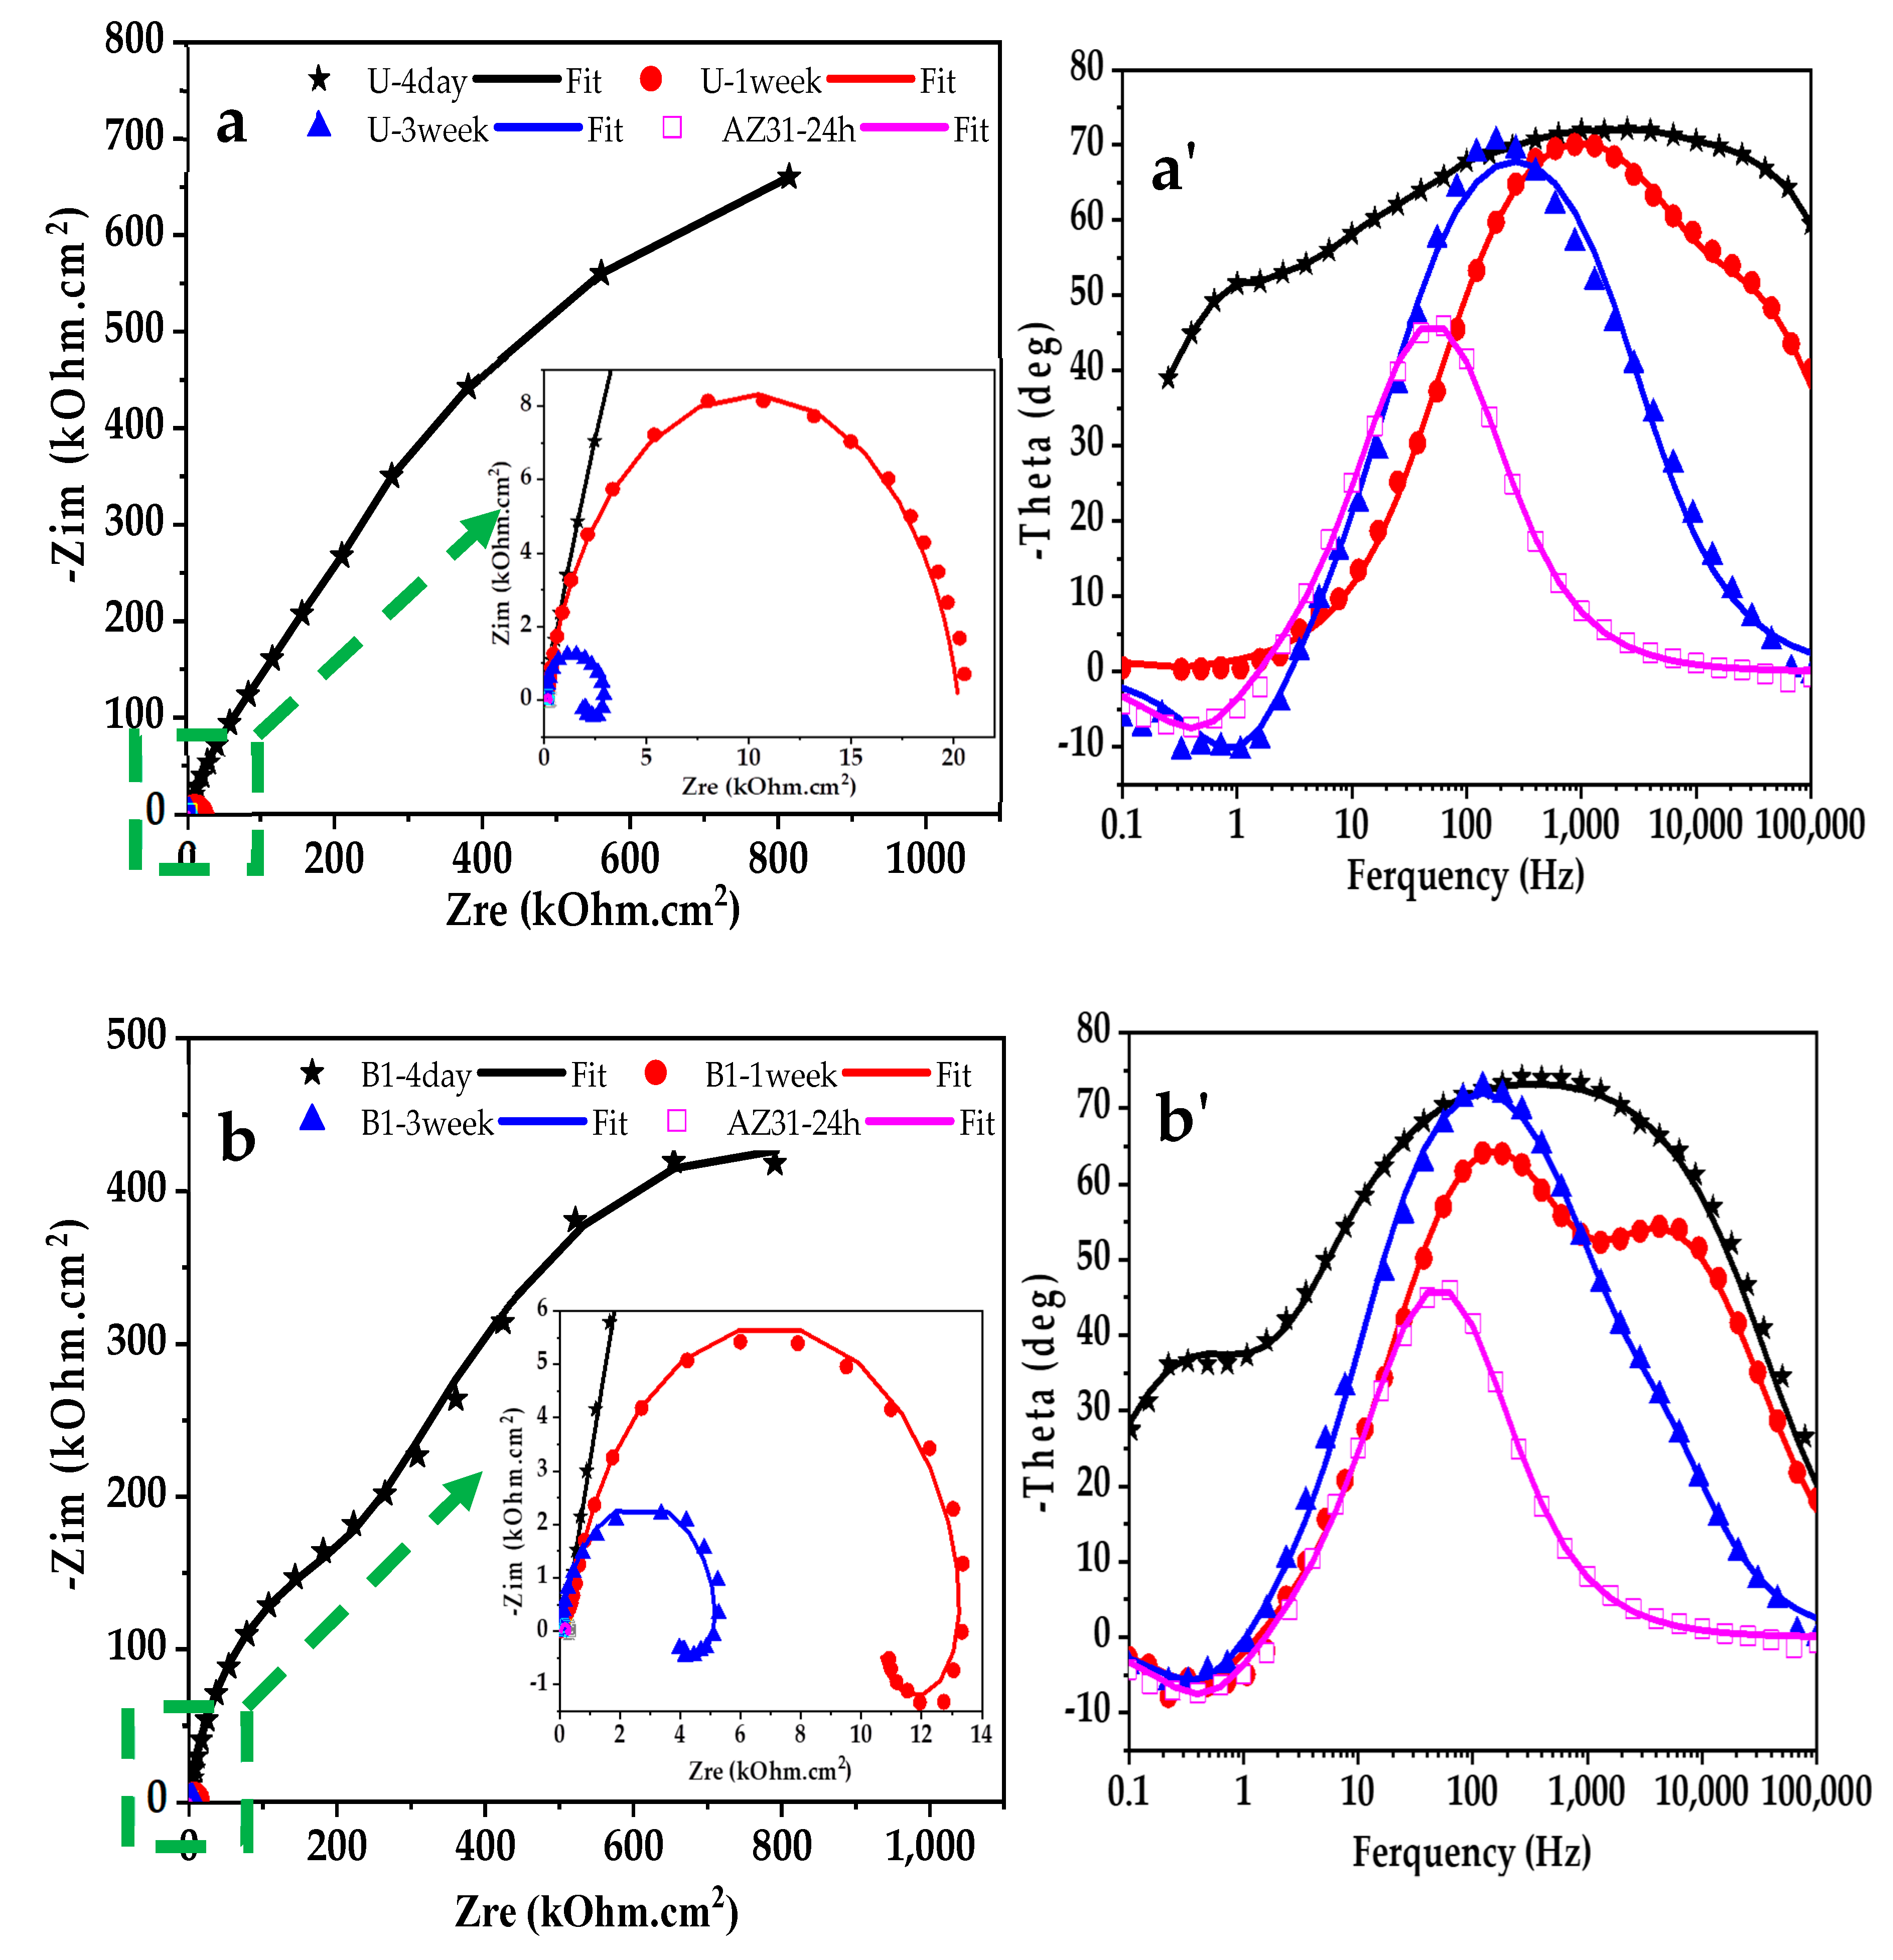
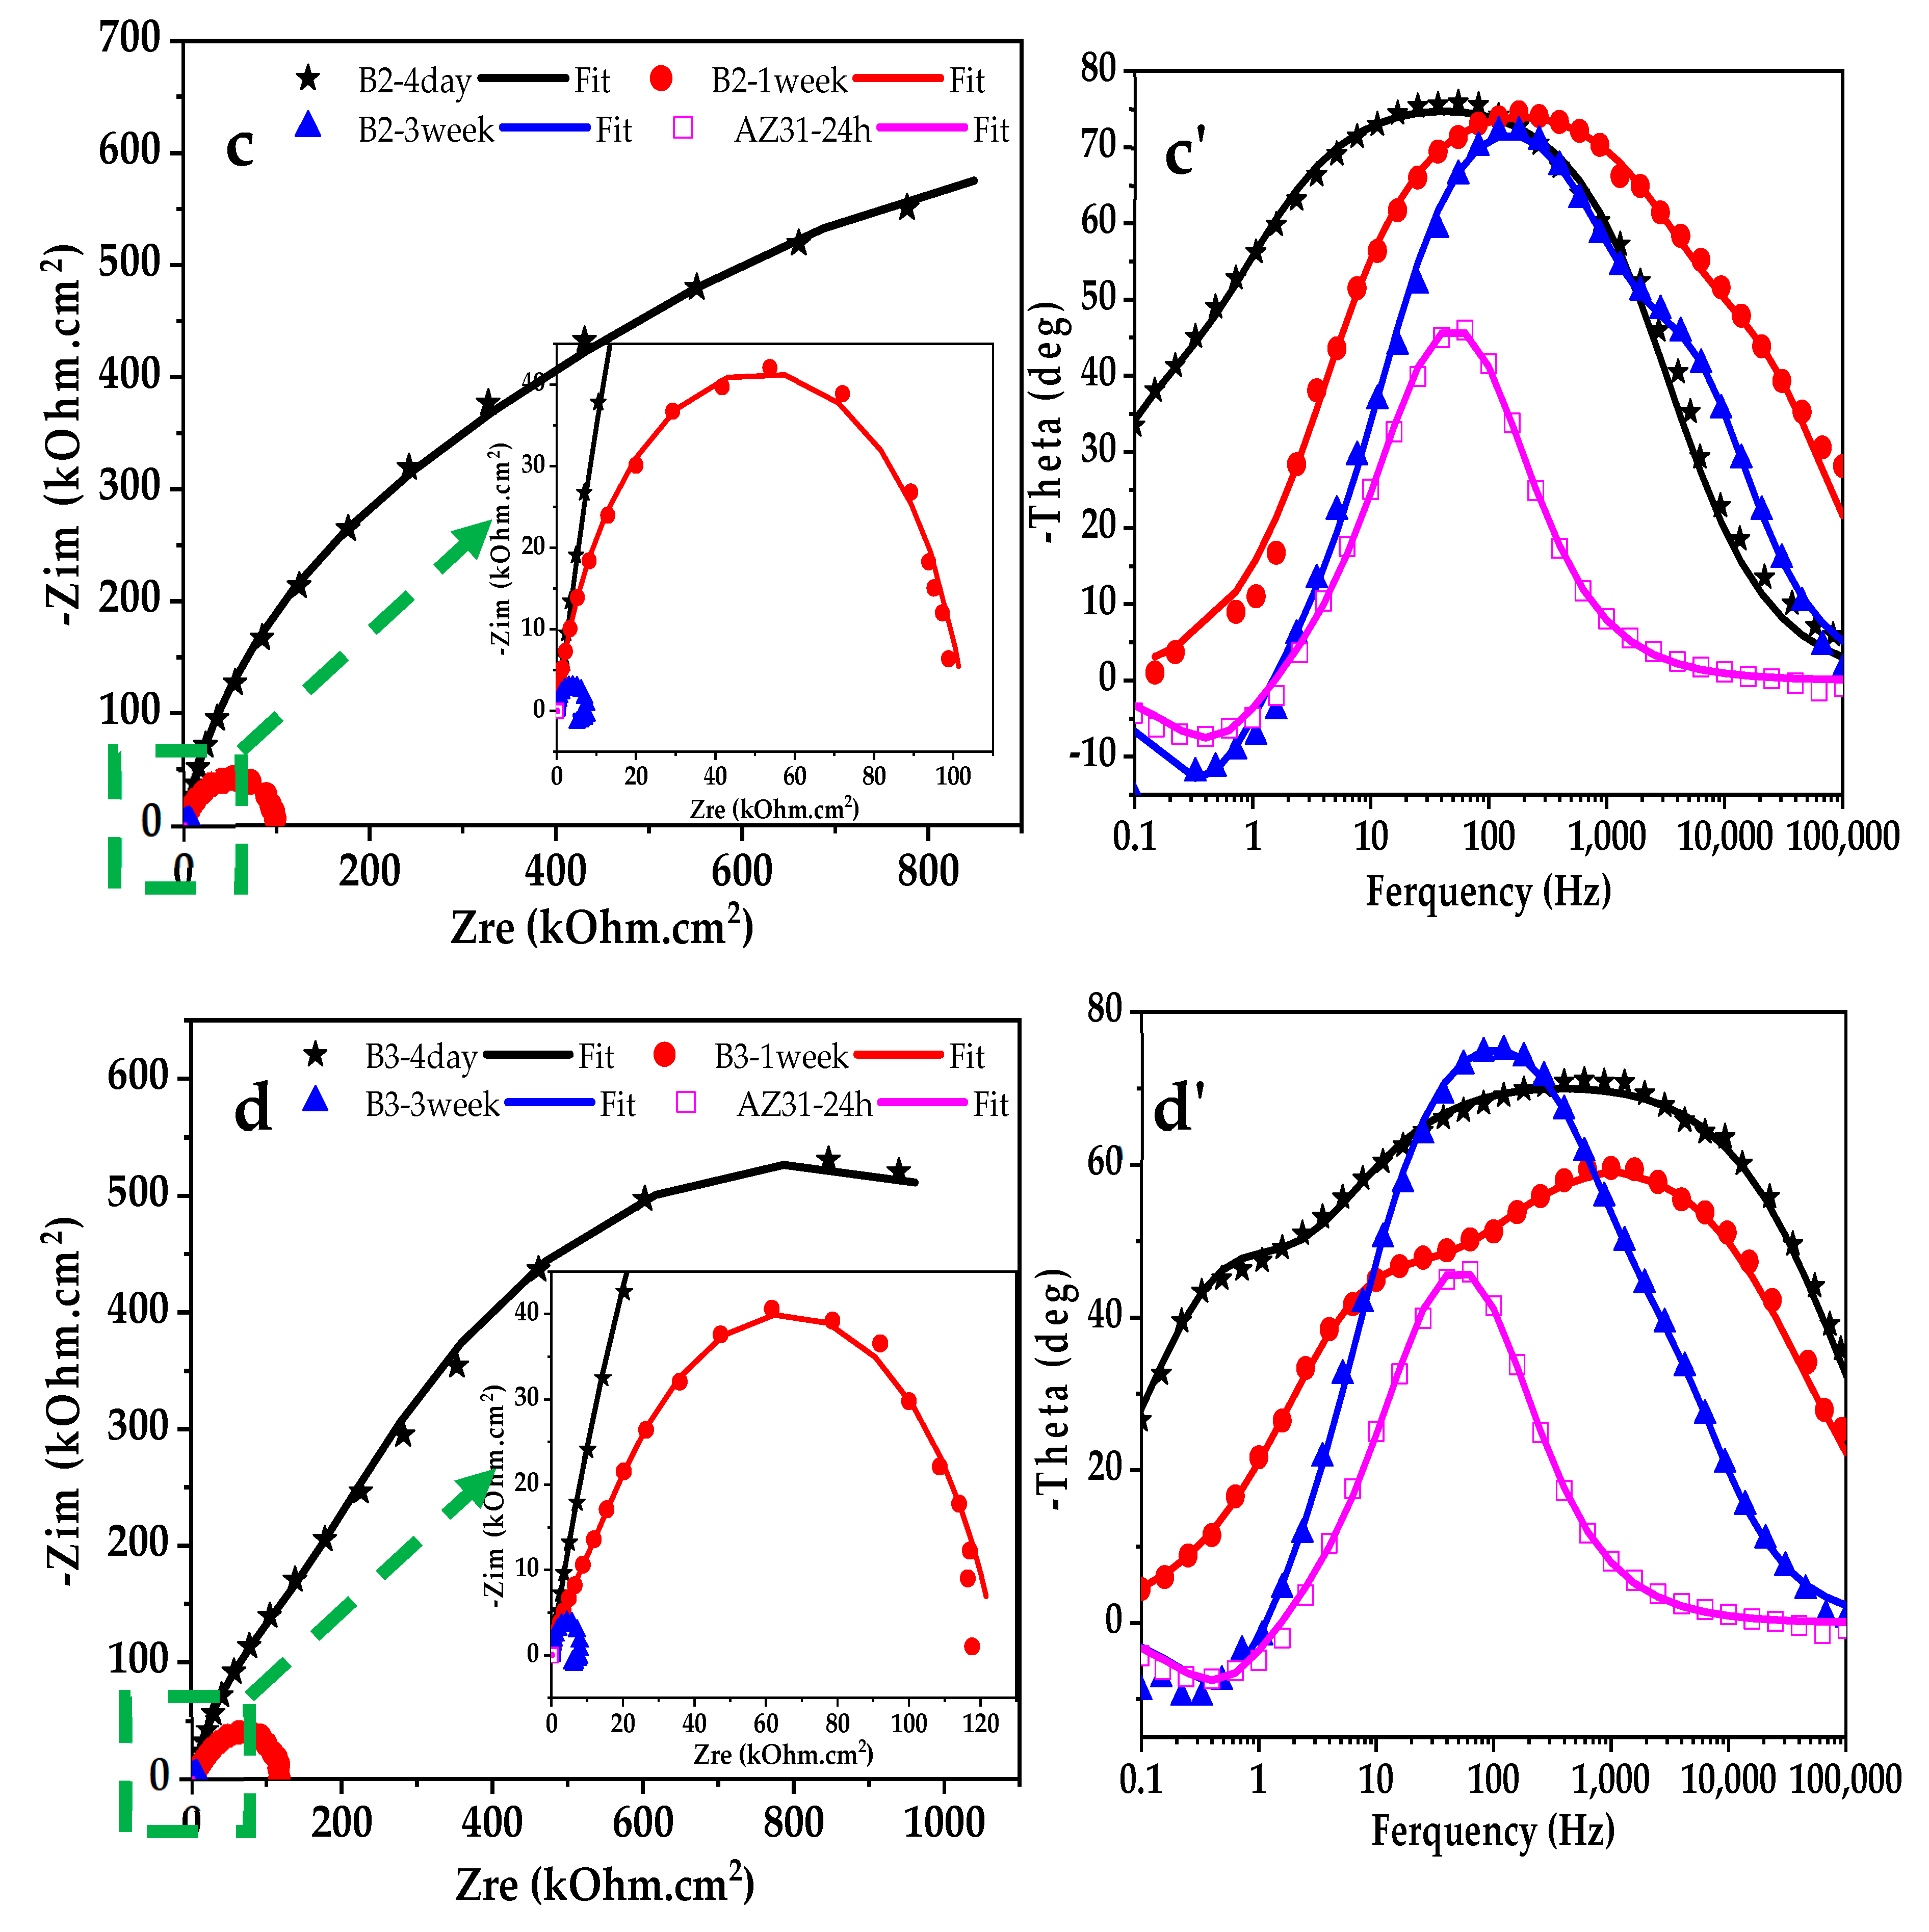
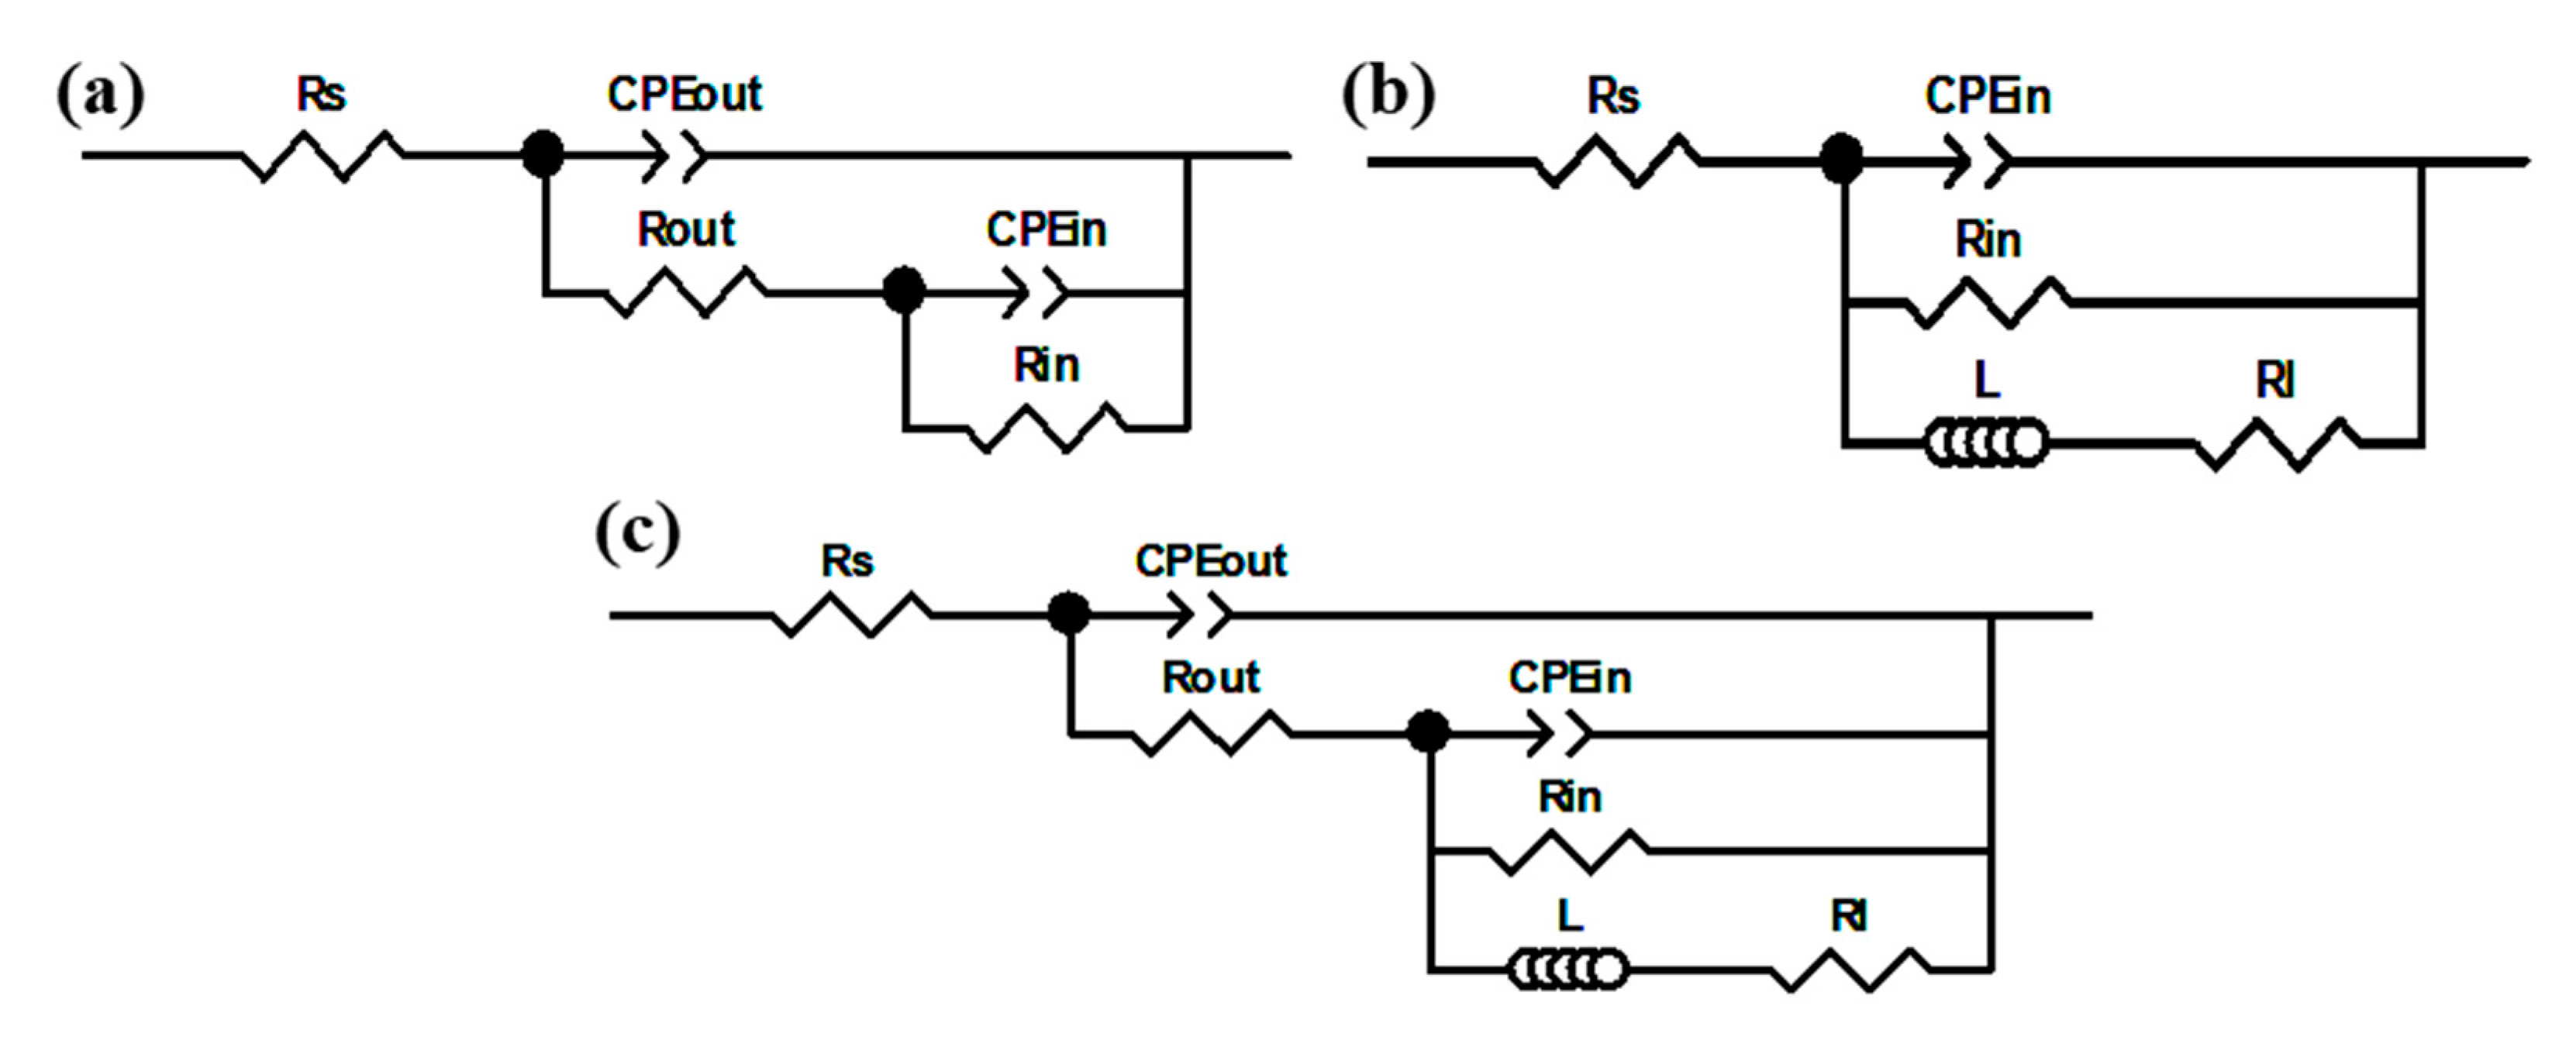
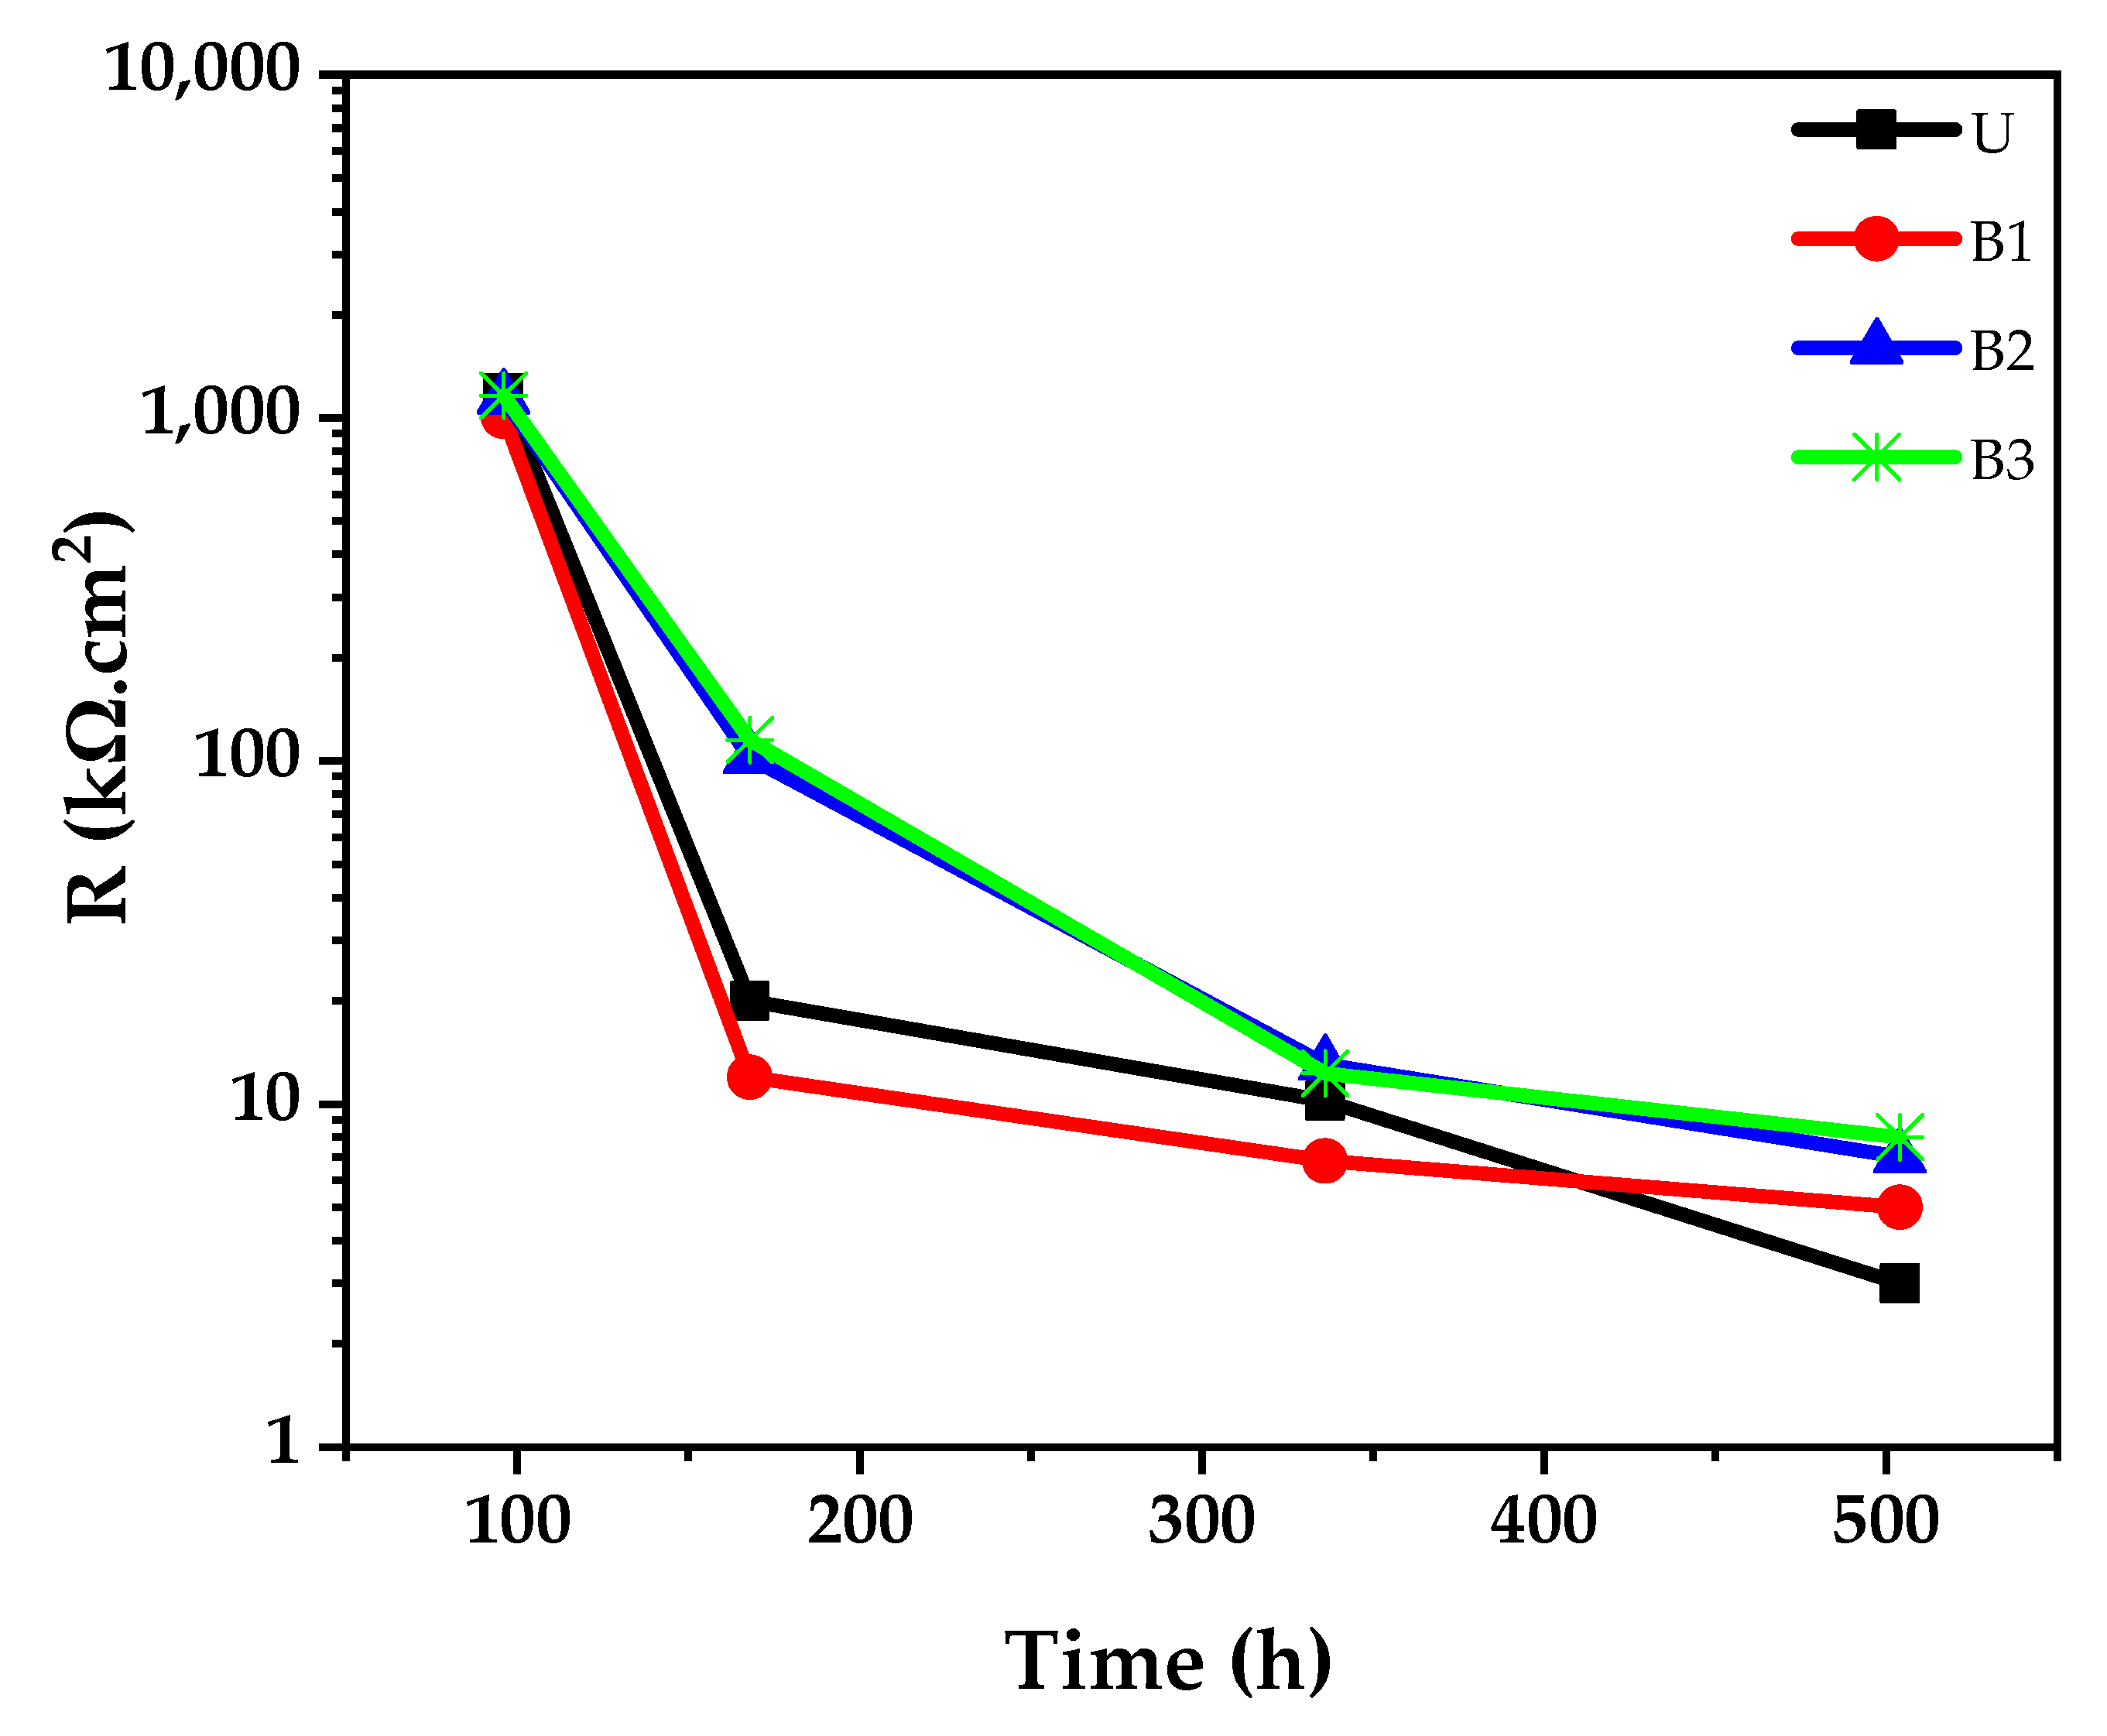
3.4. Long-Term EIS Measurements

For evaluating corrosion behavior of the coatings, EIS tests were carried out after 4 days, 1 week and 3 weeks of exposure in 3.5 wt. % NaCl at pH 6.5 ± 0.1. Nyquist and Bode-Phase diagrams of the coatings along with the bare substrate after 24 h exposure are shown in Figure 10. After 4 days of immersion, the Bode-phase curves (Figure 10a’–d’) show two humps for each coating indicating two time constants. This confirms that the coatings structure is dual-layer [6,28]. The Nyquist plots (Figure 10a–d) correspondingly reveal large capacitive loops at low frequencies associating with the more compact inner layer and very small capacitive loops at high frequencies relating to the porous outer layer.
After 3 weeks, the Bode-phase plots show only one hump for the coating produced by the U waveform indicating that its outer porous layer is not responding anymore. However, other coatings still show two humps, which are more pronounced for the coating produced by B2 waveform than B1 and B3. Moreover, inductive loops appear after 3 weeks at the lowest frequencies for all coatings, which indicate that some uncoated areas caused by local attack of the substrate are in direct contact with the electrolyte [40].
The equivalent electrical circuits (ECs) used for fitting the impedance data are illustrated in Figure 11. Rs is uncompensated solution resistance, Rout and CPEout are resistance and constant phase element of the outer porous layer, respectively, Rin and CPEin are resistance and constant phase element relating to the inner barrier layer, respectively. Inductor L and RL are also added to the ECs to describe the inductive behavior [28,40]. The fitting results are represented by the solid lines in Figure 10. The best fitting parameters (χ2 < 0.003) are shown in Table 4.
The fitting parameters of EIS spectra show that after 4 days, Rin values of the coatings produced using U, B1, B2 and B3 waveforms are very close to each other (1184, 1010, 1142 and 1162 kΩ·cm2, respectively), while Rout values for U, B1, B2 and B3 coatings are different (i.e., 250.01, 342.77, 749.00 and 394.40 kΩ·cm2, respectively). By changing the waveform from U to B1 and B2, the Rout value increases, but for B3 waveform decreases. As mentioned before, the porosity percent increases slightly in B3 produced coating (Table 2), which accordingly reduces the outer layer resistance.
Thickness, phase composition, surface morphology and micro-structure are the important factors influencing the corrosion performance of PEO coatings in corrosive environments. In this way, the phase composition plays a crucial role at short times, while the porosity and thickness are influencing factors at long times [41,42]. MgF2 is responsible to form a more compact barrier layer with less porosity on the surface of Mg alloy substrate [28]. It is more stable than MgO, because it has lower solubility and can play a key role in sealing surface micro-pores inside the inner layer of PEO coatings [36]. It is reported [28,36] that the presence of MgF2 is beneficial for corrosion performance of PEO coating grown on Mg alloys.
The diameter of capacitive loops in the Nyquist plot (Figure 10a–d) decreases significantly after 1 week of immersion. The results show that the Rin values are significantly higher than the Rout ones. Thus, the corrosion performance of the PEO coatings should be mostly determined by their inner layer resistances. The dependence of Rin versus immersion time is drawn for the coatings in Figure 12.
The Rin values obtained after 1 week of immersion for the coatings produced by the U and B1 waveforms have dropped to 20 and 12 kΩ·cm2, respectively, showing sharp decays in corrosion performance for these coatings. For the B1 waveform; even an inductive loop appears in the Nyquist plot (Figure 10b), which means the start of localized attack on Mg alloy substrate. For the coating formed by the U waveform, it is assumable that the Rin is strongly reduced after 1 week due to low thickness, high porosity and presence of deep channels created by strong B-type discharging. The presence of E-type discharging also causes a sharp decay in Rin value of the coating produced by B1 waveform. However, a lower reduction in Rin value was observed for the coatings produced by soft-sparking (B2 and B3) waveforms after 1 week of immersion, which means that they have more successfully protects the substrate from corrosion attack at this time. This may be due to very small micro-pores size and their shallow depths in these coatings, which permits the less solution penetration. Moreover, the variations of Rin versus time are almost similar for the coatings formed by B2 and B3 waveforms as seen in Figure 12. At higher immersion times, the inner layer resistances decrease more and become close to each other for all coatings. However, both coatings produced by soft-sparking waveforms (B2 and B3) provide the highest Rin values.
After 3 weeks, the barrier role of outer layer is eliminated completely for the U produced coating (Figure 10b), while it is preserved for the bipolar produced coatings. The presence of inductive loop for all coatings indicating that the substrate is subjected to local corrosion attack [16,29]. The localized attack, which generates a mixed condition of passivity and activity, leads to instability of the system [43]. The inductive behavior is believed to be caused by H2 evolution on uncoated Mg surface [40].
Figure 13 shows surface morphologies of the coatings after 3 weeks of immersion. As seen, all coatings show big holes on their surfaces. These holes are originated at weak parts of the coatings, which most probably led to the following reaction [28]:
MgO + H2O = Mg(OH)2
Formation of Mg(OH)2 generates stress in the coatings due to higher equivalent volume of Mg(OH)2 than MgO, which may cause strong inflection leading to hole extension. Subsequently, Mg alloy substrate beneath this area is also possible to be subjected to the local corrosion attack. For the coatings produced by the U and B1 waveforms, these holes seem deeper than those of B2 and B3 waveforms, indicating higher corrosion attack.

4. Conclusions

PEO coatings were grown on AZ31 Mg alloy in silicate-based electrolyte containing potassium fluoride using unipolar, usual bipolar (10% cathodic duty cycle) and soft-sparking (20% and 30% cathodic duty cycles) waveforms. The coatings consisted of MgO, MgF2 and Mg2SiO4 phases. The following results were obtained:
  • The cell current densities were dependent on the waveform. Two reduction steps for stage III in current density response were observed during the PEO treatment of Mg alloy using the bipolar and soft-sparking waveforms. By the second step, a non-uniform distribution of discharges was happened. The time that the second step appeared was depending on the waveform as it happened sooner at higher cathodic duty cycle.
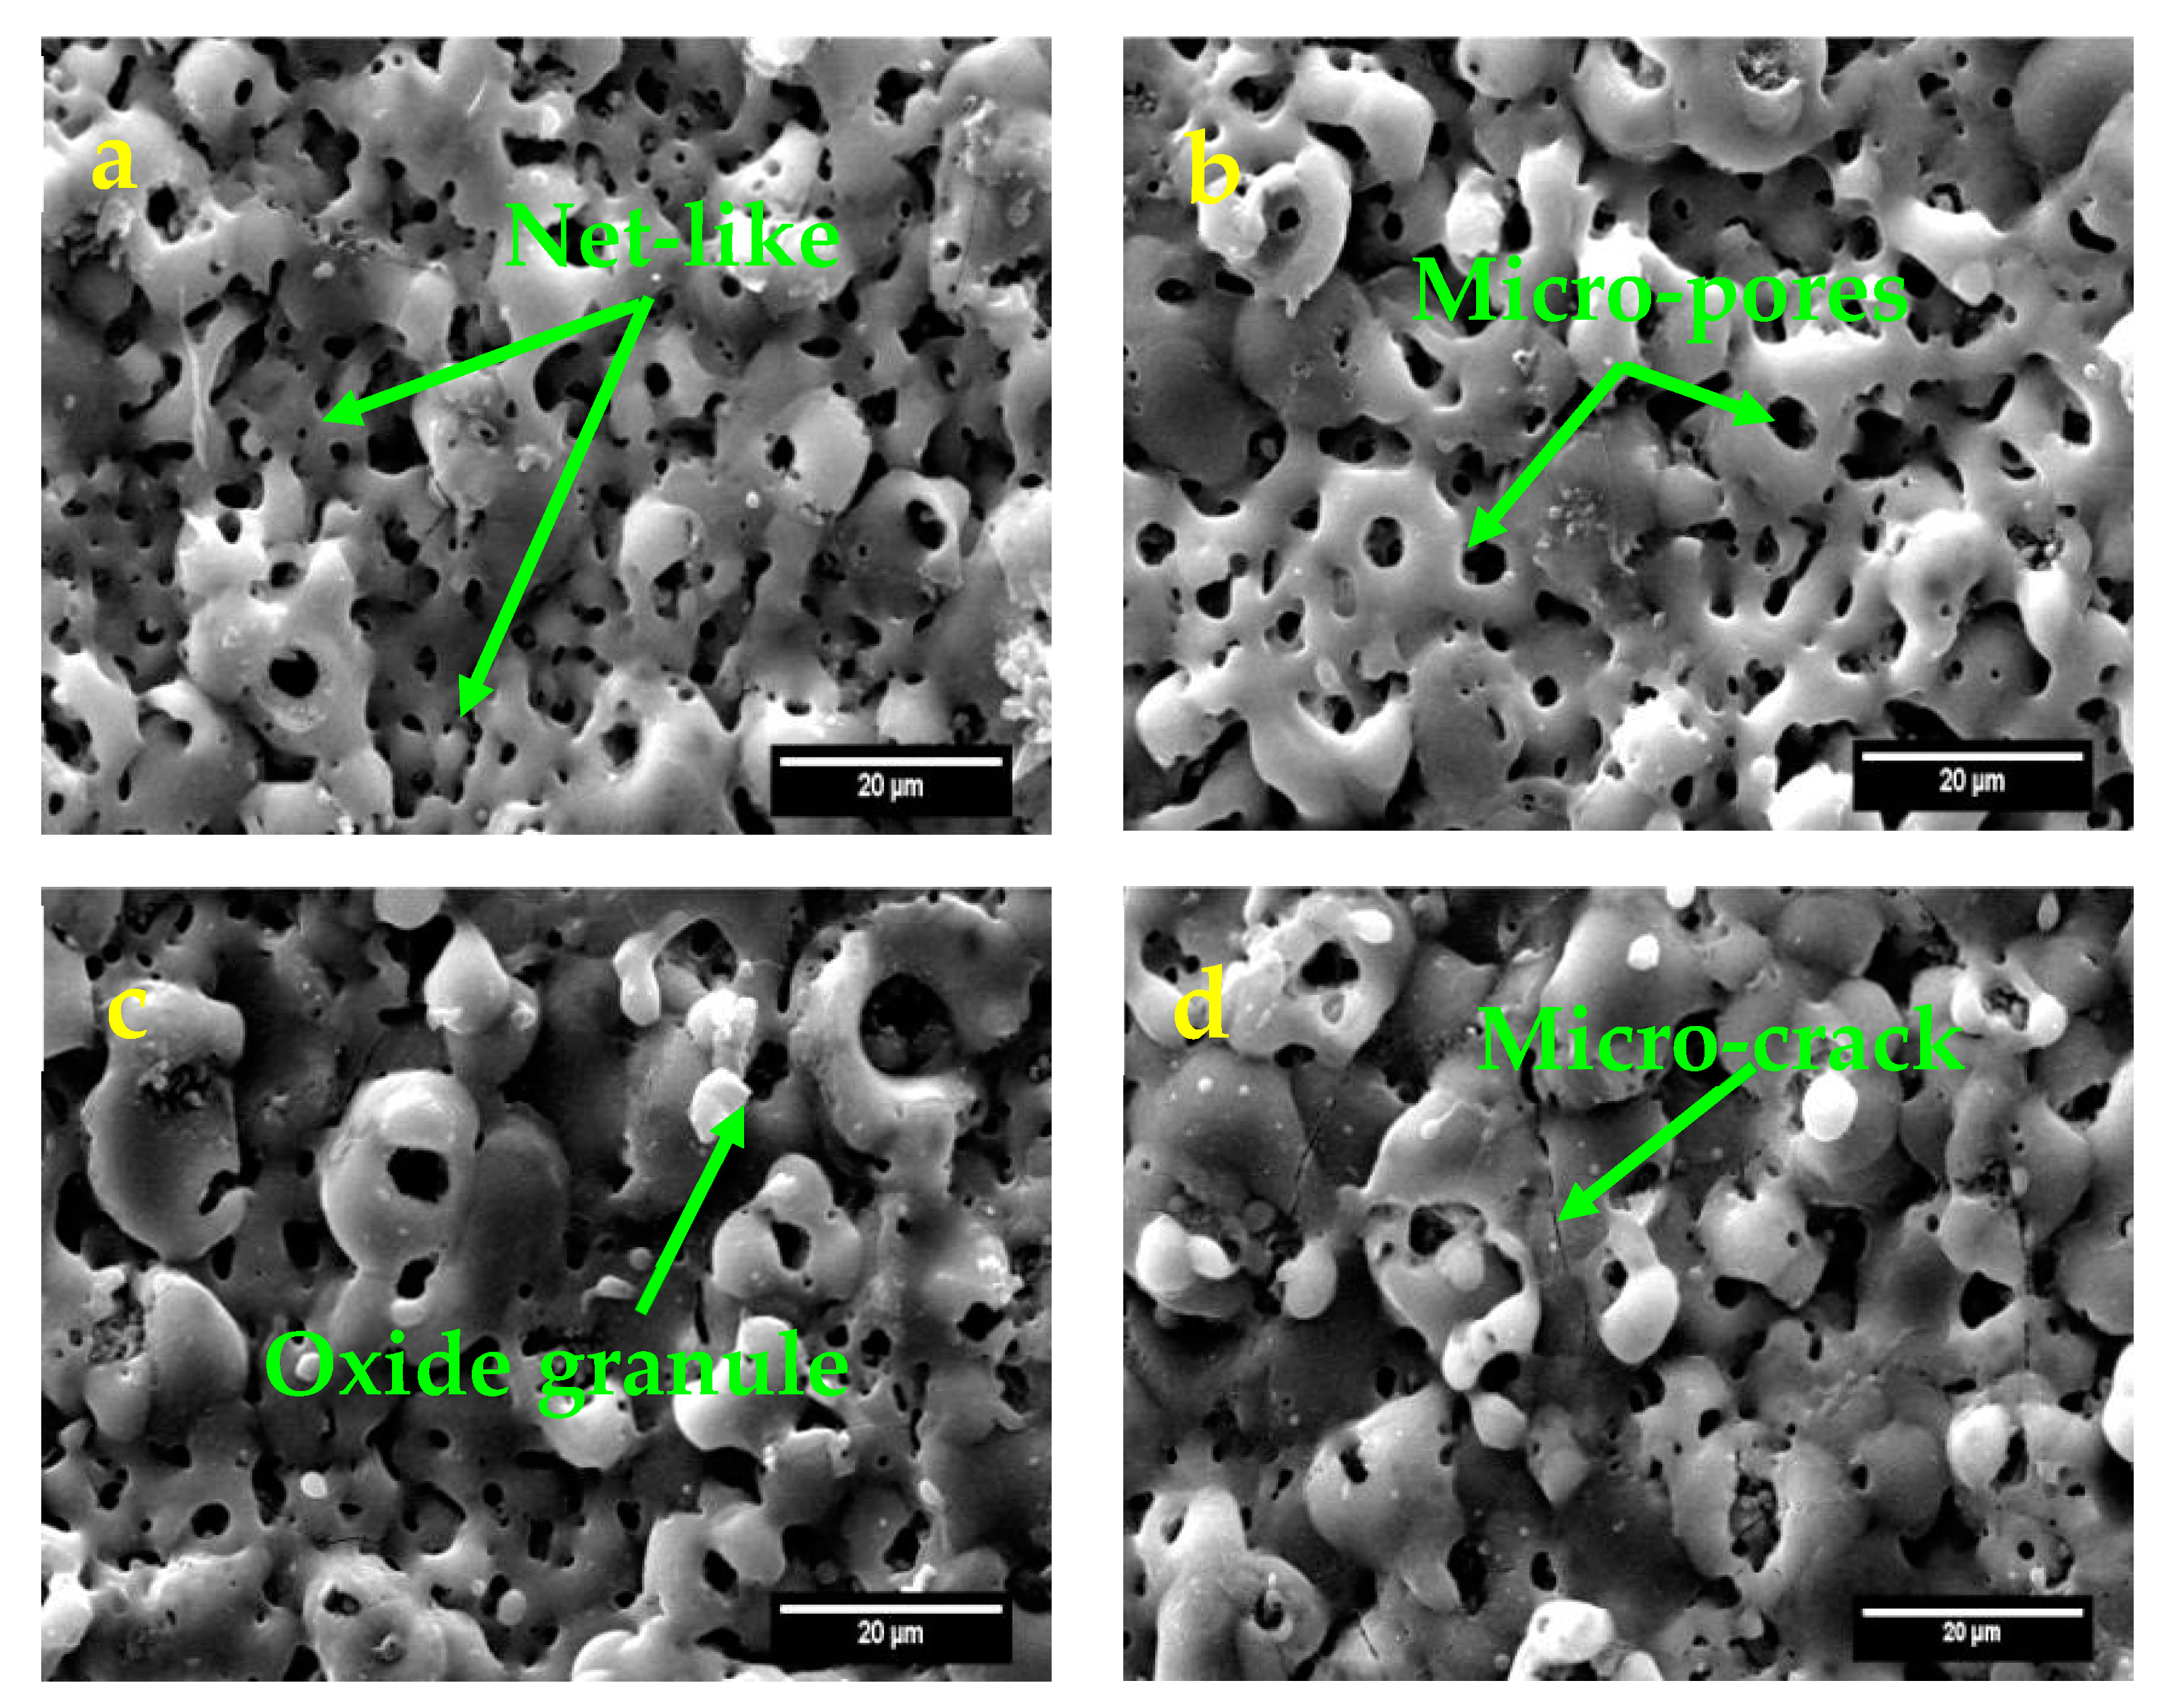
  • Surface morphology of the coatings was net-like and/or scaffold containing a micro-pores network, micro-cracks and granule of oxide compounds. Applying the various waveforms had no noticeable effect on the surface morphology.
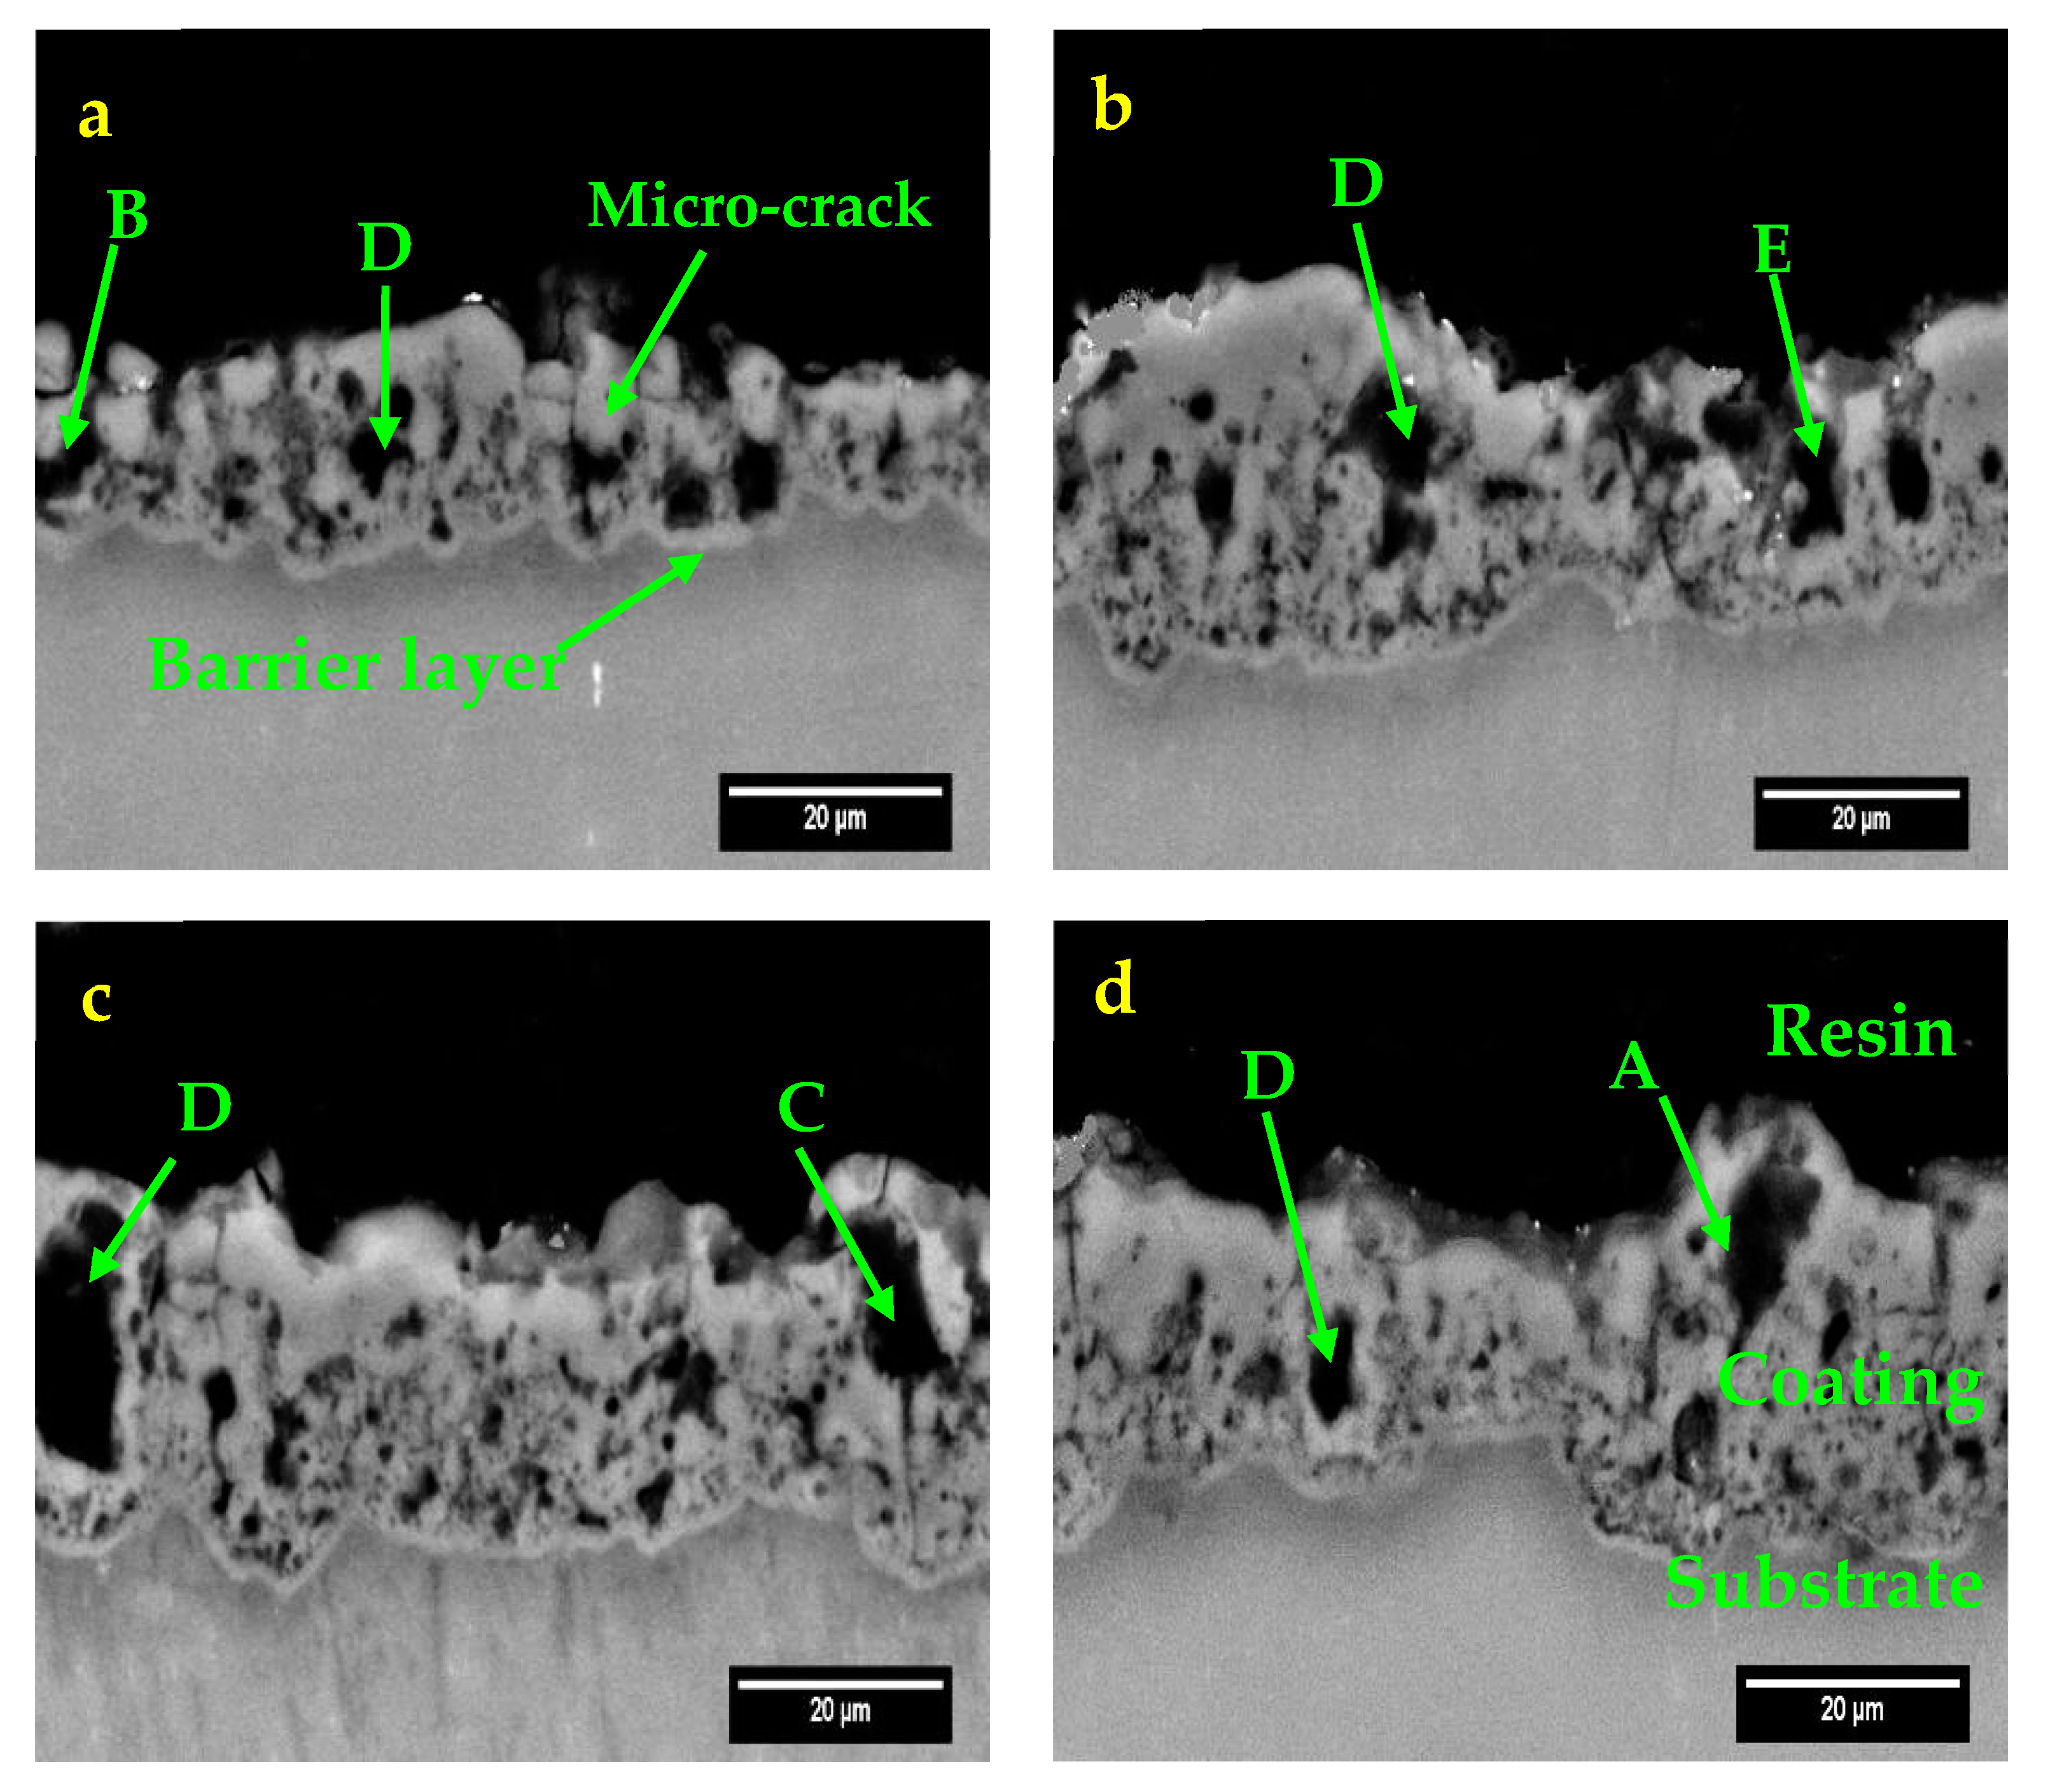
  • Deep pores were originated by B- and D-type of discharges in the coating produced by unipolar waveform. By using the bipolar ones, D- and E-types of discharges were promoted which shifted the pores toward the outer layer of coatings. Increasing the cathodic duty cycle (soft-sparking waveforms), eliminated even the pores produced by E-type, providing the lowest porosity in the coatings.
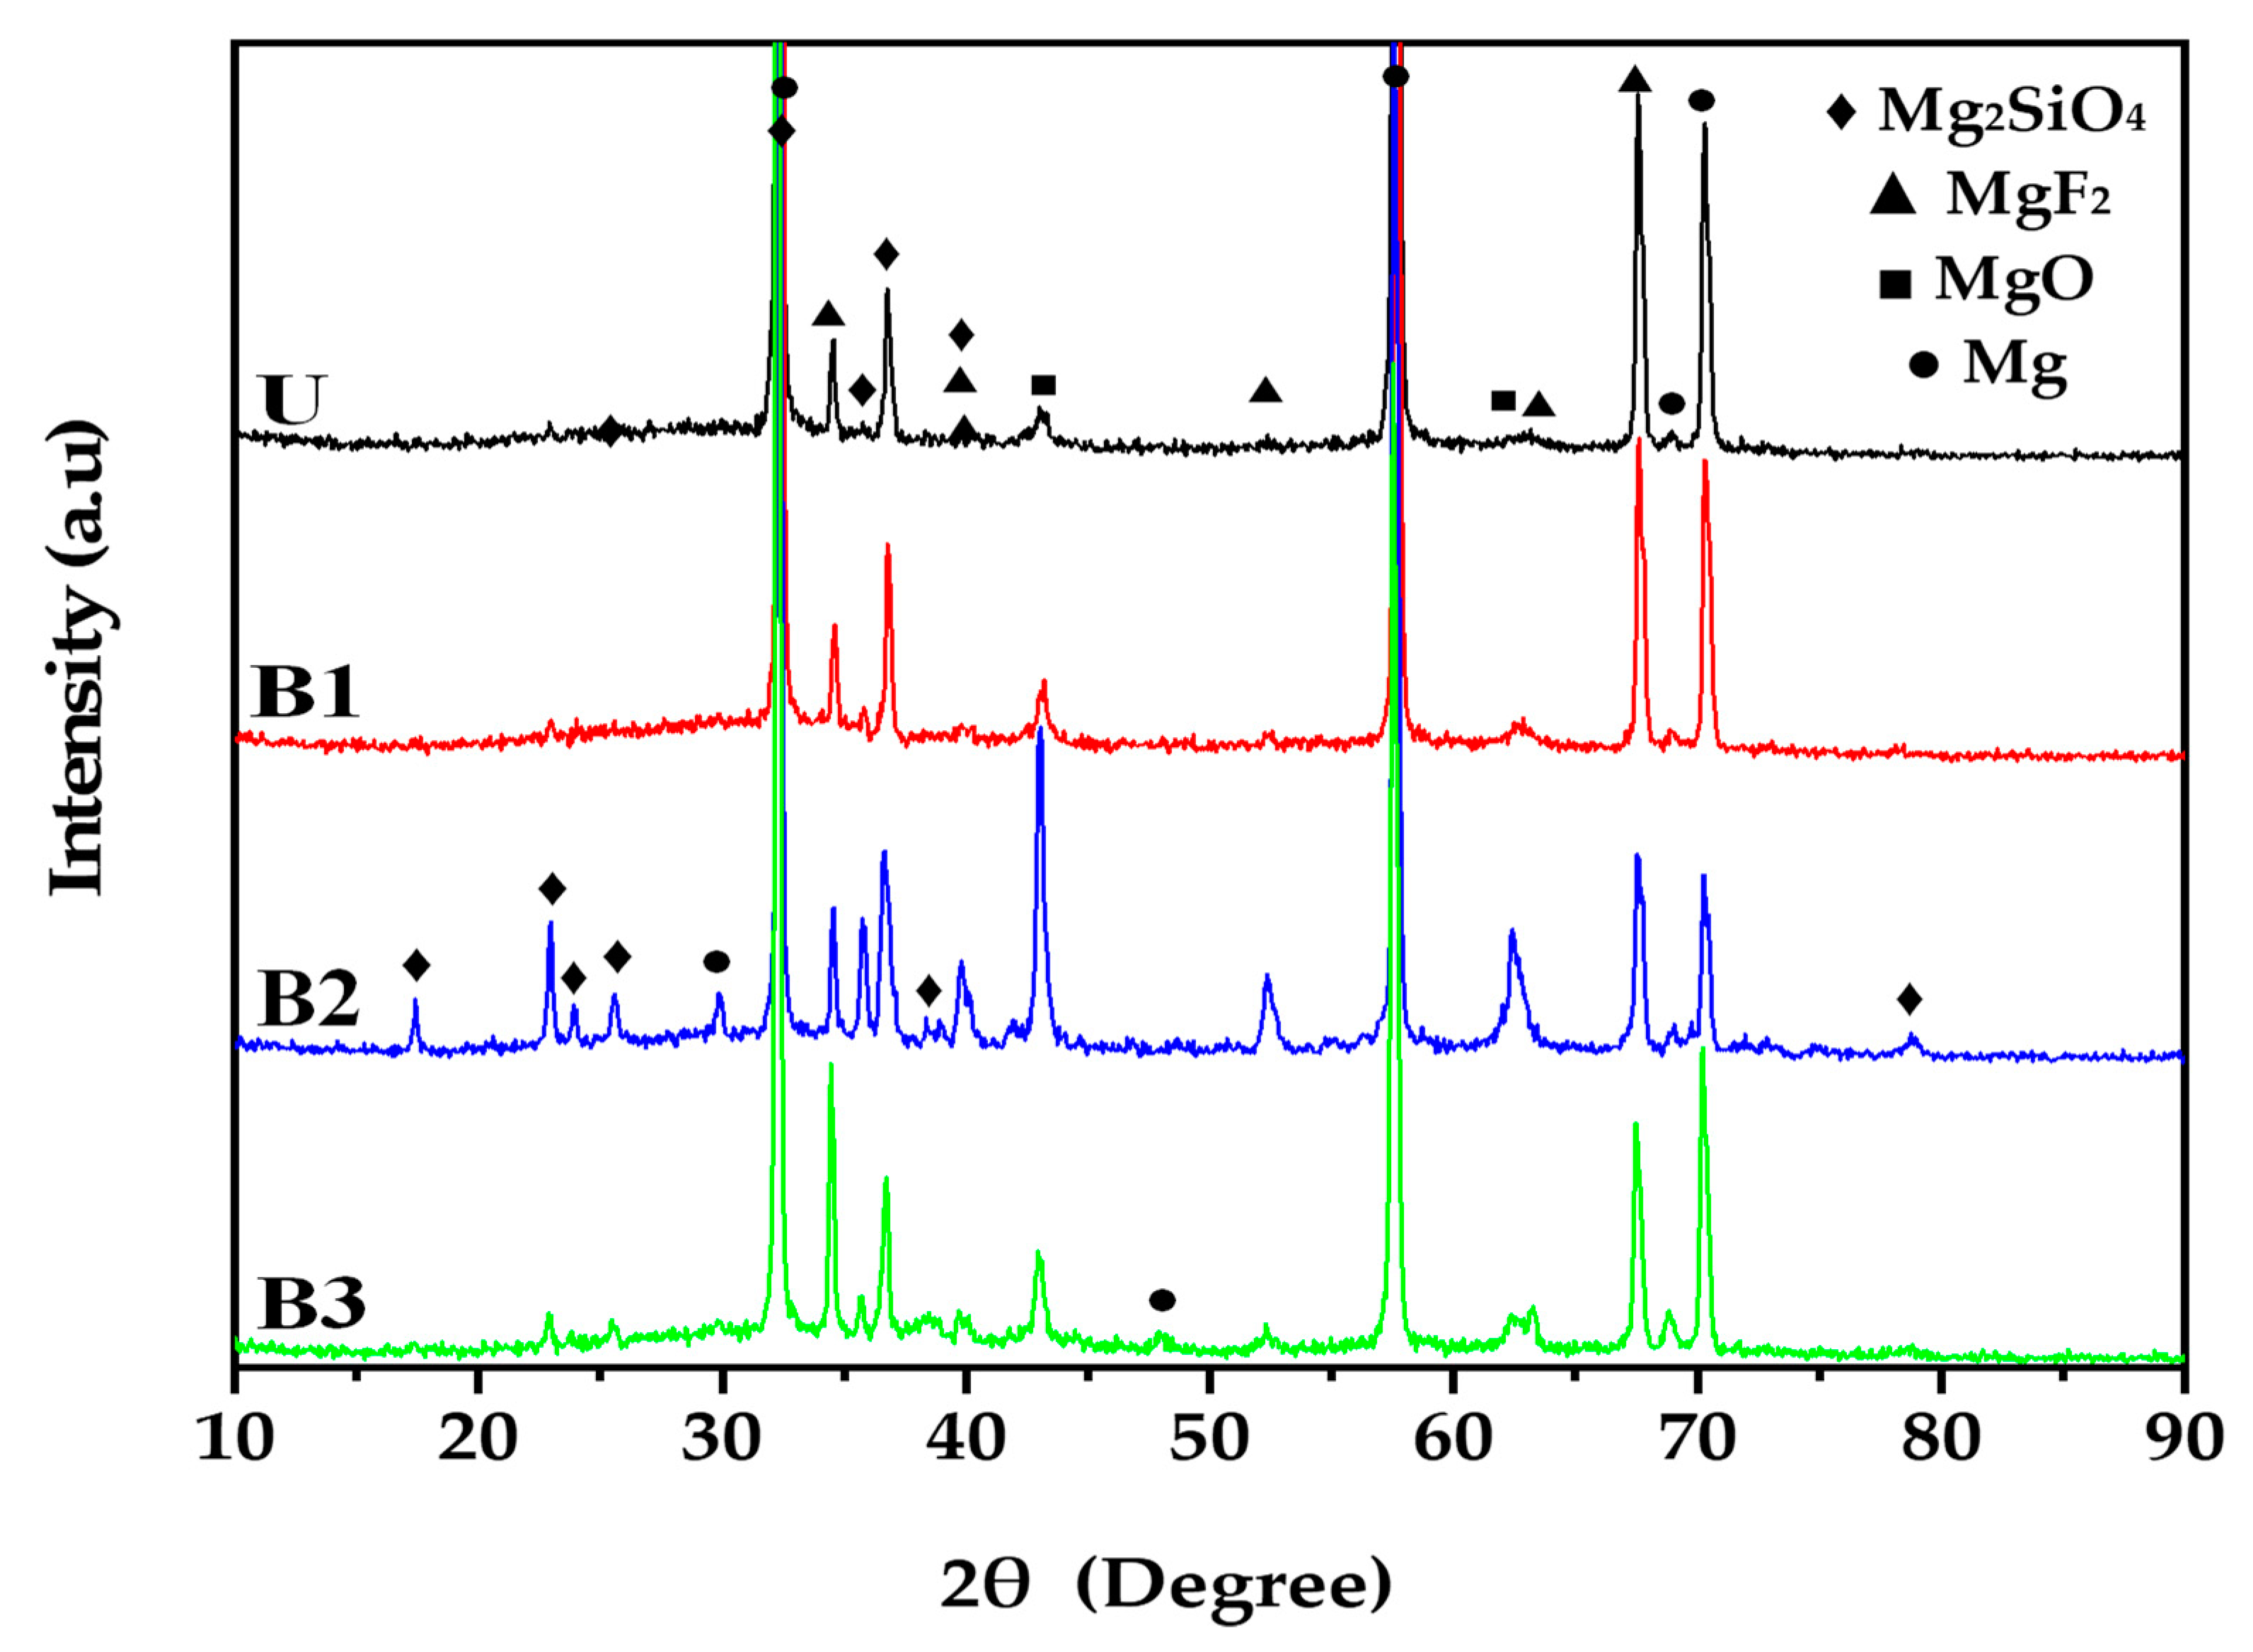
  • Corrosion performance of the PEO coatings was mostly determined by their inner layer resistances. This is because of the higher compactness achieved for this layer because of the formation of MgF2 phase.
  • After 4 days of immersion in 3.5 wt. % NaCl solution, the inner layer resistances were almost the same for all coatings. However, the coatings produced by unipolar and usual bipolar waveforms showed sharp decays in inner layer resistances after 1 week of exposure, while a minor reduction was observed for the coatings produced by soft-sparking waveforms, which means that they are more protective due to their lower porosity. After 3 weeks, the barrier effect of outer layer was lost for the unipolar-produced coating, while it is preserved for others. The presence of an inductive loop for all coatings indicated that the substrate is under local corrosion attack at this time. However, both coatings produced using the soft-sparking waveforms provided the highest inner layer resistances (i.e., the highest corrosion performance).

Author Contributions

Conceptualization, M.R., K.R., M.R.T. and M.S.; methodology, M.R., K.R. and A.H.; software, M.R.; validation, M.R., K.R., A.H. and M.S.; formal analysis, M.R.; investigation, M.R.; resources, M.R.; data curation, M.R.; writing—original draft preparation, M.R.; writing—review and editing, K.R., M.S. and M.R.T.; visualization, M.R. and K.R.; supervision, K.R. and M.R.T.; project administration, K.R.

Funding

This research received no external funding.

Conflicts of Interest

There is no conflict of interest.

References

  1. Rogov, A.B.; Yerokhin, A.; Matthews, A. The role of cathodic current in plasma electrolytic oxidation of aluminum: Phenomenological concepts of the “soft sparking” mode. Langmuir 2017, 33, 11059–11069. [Google Scholar] [CrossRef] [PubMed]
  2. Tsai, D.S.; Chou, C.C. Review of the Soft Sparking Issues in Plasma Electrolytic Oxidation. Metals 2018, 8, 105. [Google Scholar] [CrossRef]
  3. Hussein, R.O.; Northwood, D.O. Improving the performance of magnesium alloys for automotive applications. WIT Trans. Built. Environ. 2014, 137, 531–544. [Google Scholar]
  4. Clyne, T.W.; Troughton, S.C. A review of recent work on discharge characteristics during plasma electrolytic oxidation of various metals. Int. Mater. Rev. 2019, 64, 127–162. [Google Scholar] [CrossRef]
  5. Tjiang, F.; Ye, L.W.; Huang, Y.J.; Chou, C.C.; Tsai, D.S. Effect of processing parameters on soft regime behavior of plasma electrolytic oxidation of Magnesium. Ceram. Int. 2017, 43, 567–572. [Google Scholar] [CrossRef]
  6. Hussein, R.O.; Northwood, D.O.; Nie, X. Processing Microstructure Relationships in the Plasma Electrolytic Oxidation (PEO) Coating of a Magnesium Alloy. Mater. Sci. Appl. 2014, 5, 124–139. [Google Scholar] [CrossRef]
  7. Yao, Z.; Xu, Y.; Jiang, Z.; Wang, F. Effects of cathode pulse at low frequency on the structure and composition of plasma electrolytic oxidation ceramic coatings. J. Alloys Compd. 2009, 488, 273–278. [Google Scholar] [CrossRef]
  8. Arrabal, R.; Matykina, E.; Hashimoto, T.; Skeldon, P.; Thompson, G.E. Characterization of AC PEO coatings on magnesium alloys. Surf. Coat. Technol. 2009, 203, 2207–2220. [Google Scholar] [CrossRef]
  9. Hussein, R.O.; Northwood, D.O.; Su, J.F.; Nie, X. A study of the interactive effects of hybrid current modes on the tribological properties of a PEO ( plasma electrolytic oxidation ) coated AM60B Mg-alloy. Surf. Coat. Technol. 2013, 215, 421–430. [Google Scholar] [CrossRef]
  10. Hussein, R.O.; Northwood, D.O.; Nie, X. The influence of pulse timing and current mode on the microstructure and corrosion behaviour of a plasma electrolytic oxidation (PEO) coated AM60B magnesium alloy. J. Alloys Compd. 2012, 541, 41–48. [Google Scholar] [CrossRef]
  11. Hussein, R.O.; Nie, X.; Northwood, D.O.; Yerokhin, A.; Matthews, A. Spectroscopic study of electrolytic plasma and discharging behaviour during the plasma electrolytic oxidation (PEO) process. J. Phys. D Appl. Phys. 2010, 48, 105–203. [Google Scholar] [CrossRef]
  12. Martin, J.; Melhem, A.; Shchedrina, I.; Duchanoy, T.; Nominé, A.; Henrion, G.; Czerwiec, T.; Belmonte, T. Effects of electrical parameters on plasma electrolytic oxidation of aluminium. Surf. Coat. Technol. 2013, 221, 70–76. [Google Scholar] [CrossRef]
  13. Gebarowski, W.; Pietrzyk, S. Influence of the Cathodic Pulse on the Formation and Morphology of Oxide Coating on Aluminium Produced by Plasma Electrolytic Oxidation. Arch. Metall Mater. 2013, 58, 241–245. [Google Scholar] [CrossRef]
  14. Hussein, R.O.; Zhang, P.; Nie, X.; Xia, Y.; Northwood, D.O. The effect of current mode and discharge type on the corrosion resistance of plasma electrolytic oxidation (PEO) coated magnesium alloy AJ62. Surf. Coat. Technol. 2011, 206, 1990–1997. [Google Scholar] [CrossRef] [Green Version]
  15. Liang, J.; Guo, B.; Tian, J.; Liu, H.; Zhou, J.; Liu, W.; Xu, T. Effects of NaAlO2 on structure and corrosion resistance of microarc oxidation coatings formed on AM60B magnesium alloy in phosphate-KOH electrolyte. Surf. Coat. Technol. 2005, 199, 121–126. [Google Scholar] [CrossRef]
  16. Gao, Y.; Yerokhin, A.; Matthews, A. Effect of current mode on PEO treatment of magnesium in Ca- and P-containing electrolyte and resulting coatings. Appl. Sur. Sci. 2014, 316, 558–568. [Google Scholar] [CrossRef]
  17. Pan, Y.K.; Chen, C.Z.; Wang, D.G.; Zhao, T.G. Improvement of corrosion and biological properties of micro arc oxidized coatings on Mg-Zn-Zr alloy by optimizing negative power density parameters. Colloids Surf. B Biointerfaces 2014, 113, 421–428. [Google Scholar] [CrossRef] [PubMed]
  18. Chang, L. Growth regularity of ceramic coating on magnesium alloy by plasma electrolytic oxidation. J. Alloys Compd. 2009, 468, 462–465. [Google Scholar] [CrossRef]
  19. Han, B.; Yang, Y.; Deng, H.; Chen, Y.; Yang, C. Plasma-electrolytic-oxidation coating containing Y2O3 nanoparticles on AZ91 magnesium alloy. Int. J. Electrochem. Sci. 2018, 13, 5681–5697. [Google Scholar] [CrossRef]
  20. Han, B.; Yang, Y.; Li, J.; Deng, H.; Yang, C. Effects of the graphene additive on the corrosion resistance of the plasma electrolytic oxidation (PEO) coating on the AZ91 magnesium alloy. Int. J. Electrochem. Sci. 2018, 13, 9166–9182. [Google Scholar] [CrossRef]
  21. Dong, H.; Blawert, C.; Srinivasan, P.B. Plasma electrolytic oxidation treatment of magnesium alloys. In Surface Engineering of Light Alloys; Woodhead, P.: New York, NY, USA, 2010; pp. 155–183. [Google Scholar]
  22. Kumar, M.A.; Kwon, S.H.; Jung, H.C.; Shin, K.S. Corrosion protection performance of single and dual Plasma Electrolytic Oxidation (PEO) coating for aerospace applications. Mater. Chem. Phys. 2015, 149, 480–486. [Google Scholar] [CrossRef]
  23. Hakimizad, A.; Raeissi, K.; Santamaria, M.; Asghari, M. Effects of pulse current mode on plasma electrolytic oxidation of 7075 Al in Na2WO4 containing solution: From unipolar to soft-sparking regime. Electrochim. Acta 2018, 284, 618–629. [Google Scholar] [CrossRef]
  24. Hakimizad, A.; Raeissi, K.; Golozar, M.A.; Lu, X.; Blawert, C.; Zheludkevich, M.L. The effect of pulse waveforms on surface morphology, composition and corrosion behavior of Al2O3 and Al2O3/TiO2 nano-composite PEO coatings on 7075 aluminum alloy. Surf. Coat. Technol. 2017, 324, 208–221. [Google Scholar] [CrossRef]
  25. Gao, H.; Zhang, M.; Yang, X.; Huang, P.; Xu, K. Effect of Na2SiO3 solution concentration of micro-arc oxidation process on lap-shear strength of adhesive-bonded magnesium alloys. Appl. Surf. Sci. 2014, 314, 447–452. [Google Scholar] [CrossRef]
  26. Duan, H.; Yan, C.; Wang, F. Growth process of plasma electrolytic oxidation films formed on magnesium alloy AZ91D in silicate solution. Electrochim. Acta 2007, 52, 5002–5009. [Google Scholar] [CrossRef]
  27. Timoshenko, A.V.; Magurova, Y.V. Application of oxide coatings to metals in electrolyte solutions by microplasma methods. Rev. Met. Madrid. 2000, 36, 323–330. [Google Scholar] [CrossRef] [Green Version]
  28. Zhang, W.; Tian, B.; Du, K.; Zhang, H.; Wang, F. Preparation and Corrosion Performance of PEO Coating With Low Porosity on Magnesium Alloy AZ91D In Acidic KF System. Int. J. Electrochem. Sci. 2011, 6, 5228–5248. [Google Scholar]
  29. Mann, R.; Hansal, W.E.G.; Hansal, S. Effects of pulsed current on plasma electrolytic oxidation. Trans. IMF 2014, 92, 297–304. [Google Scholar] [CrossRef]
  30. Aliramezani, R.; Raeissi, K.; Santamaria, M.; Hakimizad, A. Effects of Pulse Current Mode on Plasma Electrolytic Oxidation of 7075 Al in KMnO4 Containing Solution. J. Electrochem. Soc. 2017, 164, 690–698. [Google Scholar] [CrossRef]
  31. Cheng, Y.L.; Xue, Z.G.; Wang, Q.; Wu, X.Q.; Matykina, E.; Skeldon, P.; Thompson, G.E. New findings on properties of plasma electrolytic oxidation Coatings from study of an Al-Cu-Li alloy. Electrochim. Acta 2013, 107, 358–378. [Google Scholar] [CrossRef]
  32. Darband, G.B.; Aliofkhazraei, M.; Hamghalam, P.; Valizade, N. Plasma electrolytic oxidation of magnesium and its alloys: Mechanism, properties and applications. J. Magnes. Alloy. 2017, 5, 74–132. [Google Scholar] [CrossRef]
  33. Hussein, R.O.; Nie, X.; Northwood, D.O. Influence of process parameters on electrolytic plasma discharging behaviour and aluminum oxide coating microstructure. Surf. Coat. Technol. 2010, 205, 1659–1667. [Google Scholar] [CrossRef]
  34. Jin, F.; Chu, P.K.; Xu, G.; Zhao, J.; Tang, D.; Tong, H. Structure and mechanical properties of magnesium alloy treated by micro-arc discharge oxidation using direct current and high-frequency bipolar pulsing modes. Mater. Sci. Eng. A 2006, 436, 123–126. [Google Scholar] [CrossRef]
  35. Jaspard-mécuson, F.; Czerwiec, T.; Henrion, G.; Belmonte, T. Tailored aluminium oxide layers by bipolar current adjustment in the Plasma Electrolytic Oxidation (PEO) process. Surf. Coat. Technol. 2007, 201, 8677–8682. [Google Scholar] [CrossRef]
  36. Liu, F.; Yu, J.; Song, Y.; Shan, D.; Han, E.H. Effect of potassium fluoride on the in-situ sealing pores of plasma electrolytic oxidation film on AM50 Mg alloy. Mater. Chem. Phys. 2015, 162, 452–460. [Google Scholar] [CrossRef]
  37. Santamaria, M.; Di Quarto, F.; Zanna, S.; Marcus, P. The influence of surface treatment on the anodizing of magnesium in alkaline solution. Electrochim. Acta 2011, 56, 10533–10542. [Google Scholar] [CrossRef]
  38. Habazaki, H.; Fushimi, K.; Shimizu, K.; Skeldon, P.; Thompson, G.E. Fast migration of fluoride ions in growing anodic titanium oxide. Electrochem. Commun. 2007, 9, 1222–1227. [Google Scholar] [CrossRef] [Green Version]
  39. Kazanski, B.; Kossenko, A.; Zinigrad, M.; Lugovskoy, A. Applied Surface Science Fluoride ions as modifiers of the oxide layer produced by plasma electrolytic oxidation on AZ91D magnesium alloy. Appl. Sur. Sci. 2013, 287, 461–466. [Google Scholar] [CrossRef]
  40. Curioni, M.; Salamone, L.; Scenini, F.; Santamaria, M.; Di Natale, M. A mathematical description accounting for the superfluous hydrogen evolution and the inductive behaviour observed during electrochemical measurements on magnesium. Electrochim. Acta 2018, 274, 343–352. [Google Scholar] [CrossRef]
  41. Rehman, Z.U.; Shin, S.H.; Hussain, I.; Koo, B.H. Investigation of Hybrid PEO Coatings on AZ31B Magnesium Alloy in Alkaline K2ZrF6–Na2SiO3 Electrolyte Solution. Prot. Met. Phys. Chem. 2017, 53, 495–502. [Google Scholar] [CrossRef]
  42. Dehnavi, V.; Luan, B.L.; Liu, X.Y.; Shoesmith, D.W.; Rohani, S. Correlation between plasma electrolytic oxidation treatment stages and coating microstructure on aluminum under unipolar pulsed DC mode. Surf. Coat. Technol. 2014, 269, 91–99. [Google Scholar] [CrossRef]
  43. Shkirskiy, V.; King, A.D.; Gharbi, O.; Volovitch, P.; Scully, J.R.; Ogle, K.; Birbilis, N. Revisiting the electrochemical impedance spectroscopy of magnesium with online inductively coupled plasma atomic emission spectroscopy. Chem. Phys. Chem. 2015, 16, 536–539. [Google Scholar] [CrossRef] [PubMed]
Figure 1. Schematic representation of the plasma electrolytic oxidation (PEO) system and cell components applied for coating.
Coatings 09 00688 g001
Figure 2. Cell current density versus time responses during plasma electrolytic oxidation (PEO) treatments using the waveforms described in Table 1.
Coatings 09 00688 g002
Figure 3. Surface morphology of the coatings produced using (a) U, (b) B1, (c) B2 and (d) B3 waveforms.
Coatings 09 00688 g003
Figure 4. Cross section morphology of the coatings produced using unipolar and bipolar waveforms: (a) U, (b) B1, (c) B2 and (d) B3.
Coatings 09 00688 g004
Figure 5. XRD patterns of obtained coatings formed at various waveform of plasma electrolytic oxidation (PEO) process.
Coatings 09 00688 g005
Figure 6. (a) Cross-section and elemental maps of U produced coating; (b) overall colors map, (c) map of magnesium, (d) map of silicon, (e) map of oxygen and (f) map of fluoride.
Coatings 09 00688 g006
Figure 7. (a) Cross-section and elemental maps of B1 produced coating; (b) overall colors map, (c) map of magnesium, (d) map of silicon, (e) map of oxygen and (f) map of fluoride.
Coatings 09 00688 g007
Figure 8. (a) Cross-section and elemental maps of B2 produced coating; (b) overall colors map, (c) map of magnesium, (d) map of silicon, (e) map of oxygen and (f) map of fluoride.
Coatings 09 00688 g008
Figure 9. (a) Cross-section and elemental maps of B3 produced coating; (b) overall colors map, (c) map of magnesium, (d) map of silicon, (e) map of oxygen and (f) map of fluoride.
Coatings 09 00688 g009
Figure 10. Nyquist plots and Bode-phase plots of the coated samples after long-term exposure to 3.5 wt. % NaCl solution for: (a,a’) U, (b,b’) B1, (c,c’) B2 and (d,d’) B3.
Coatings 09 00688 g010aCoatings 09 00688 g010b
Figure 11. The electrical equivalent circuits used for fitting the EIS data; (a) after 4 days and 1-week exposure, (b) after 3 weeks of exposure for U and (c) after 3 weeks of exposure for B1, B2 and B3 waveforms.
Coatings 09 00688 g011
Figure 12. The variation of Rin versus immersion time for the plasma electrolytic oxidation (PEO) coatings.
Coatings 09 00688 g012
Figure 13. Surface morphology of plasma electrolytic oxidation (PEO) coating after 3 weeks of immersion in 3.5 wt. % NaCl solution for: (a) U, (b) B1, (c) B2 and (d) B3 waveforms.
Coatings 09 00688 g013
Table 1. Sample codes, waveform shapes and electrical parameters applied for plasma electrolytic oxidation (PEO) process.
Specimen CodesElectrical ParametersWaveform Shapes
UFrequency (kHz) = 1 Coatings 09 00688 i001
Anodic Duty Cycle = 10%
Cathodic Duty Cycle = −
B1Frequency (kHz) = 1 Coatings 09 00688 i002
Anodic Duty Cycle = 10%
Cathodic Duty Cycle = 10%
B2Frequency (kHz) = 1 Coatings 09 00688 i003
Anodic Duty Cycle = 10%
Cathodic Duty Cycle = 20%
B3Frequency (kHz) = 1 Coatings 09 00688 i004
Anodic Duty Cycle = 10%
Cathodic Duty Cycle = 30%
Table 2. Surface porosity percent and average pore size of the plasma electrolytic oxidation(PEO) coatings produced using U, B1, B2 and B3 waveforms.
SpecimenSurface Porosity (%)Average Pores Size (μm)
U7.73.2
B13.12.8
B22.62.8
B32.93
Table 3. Elemental composition of the coatings obtained using EDS analysis.
Waveform TypesElement (at. %)
Mg Al O F Si Na K
U30.72.043.58.113.51.90.3
B131.12.942.47.613.52.10.4
B231.92.941.57.313.72.30.4
B330.92.841.78.113.72.40.4
Table 4. Electrical elements values extracted for EIS diagrams using Zview software for U, B1, B2 and B3.
SpecimensImmersion TimeOuter LayerInner layer
CPE
(μF·cm−2·Sn−1)
nR
(kΩ·cm2)
CPE
(μF·cm−2·Sn−1)
nR
(kΩ·cm2)
Rl
(kΩ·cm2)
L
(kH·cm2)
U4-day0.24 ± 0.020.81 ± 0.01250.01 ± 0.530.36 ± 0.030.72 ± 0.011184 ± 0.14
1-week0.19 ± 0.010.86 ± 0.020.56 ± 0.020.09 ± 0.020.90 ± 0.0720 ± 0.05
3-week3.91 ± 0.030.89 ± 0.073 ± 0.015.211 ± 54.000.98 ± 0.03
B14-day0.23 ± 0.030.84 ± 0.09342.80 ± 0.581.21 ± 0.260.81 ± 0.071010 ± 0.11
1-week0.74 ± 0.030.84 ± 0.021.17 ± 0.070.30 ± 0.120.98 ± 0.0512 ± 0.34
3-week1.04 ± 0.040.99 ± 0.030.09 ± 0.042.57 ± 0.030.90 ± 0.075 ± 0.0015.98 ± 1.446.41 ± 0.06
B24-day0.49 ± 0.040.85 ± 0.03749.00 ± 0.081.51 ± 0.030.76 ± 0.071142 ± 0.13
1-week0.27 ± 0.030.89 ± 0.020.39 ± 0.070.31 ± 0.120.85 ± 0.05102 ± 0.12
3-week0.60 ± 0.040.99 ± 0.030.15 ± 0.481.72 ± 0.030.90 ± 0.077 ± 0.110.44 ± 1.445.62 ± 0.06
B34-day0.35 ± 0.090.80 ± 0.06394.40 ± 0.080.59 ± 0.030.85 ± 0.081119 ± 0.02
1-week0.57 ± 0.030.79 ± 0.021.12 ± 0.070.04 ± 0.120.97 ± 0.05115 ± 0.01
3-week1.10 ± 0.040.99 ± 0.030.12 ± 0.481.96 ± 0.030.91 ± 0.078 ± 0.0117.39 ± 1.446.04 ± 0.04

