Article

Microstructural and Corrosion Characteristics of Al-Fe Alloys Produced by High-Frequency Induction-Sintering Process

1
Centre of Excellence for Research in Engineering Materials, King Saud University, P.O. Box-800, Riyadh 11421, Saudi Arabia
2
Engineering Management Department, College of Engineering, Prince Sultan University, P.O. Box No. 66833 Rafha Street, Riyadh 11586, Saudi Arabia
3
Innovative Durable Building and Infrastructure Research Center, Department of Architectural Engineering, Hanyang University, 1271 Sa3-dong, Sangrok-gu, Ansan 15588, Korea
4
Mechanical Engineering Department, College of Engineering, King Saud University, P.O. Box-800, Riyadh 11421, Saudi Arabia
5
Mechanical Design and Materials Department, Faculty of Energy Engineering, Aswan University, Aswan 81521, Egypt
*
Authors to whom correspondence should be addressed.
Coatings 2019, 9(10), 686; https://doi.org/10.3390/coatings9100686
Submission received: 14 August 2019 / Revised: 11 September 2019 / Accepted: 18 September 2019 / Published: 21 October 2019
(This article belongs to the Special Issue Metal Surfaces)

Abstract

:
Al-x wt.% Fe bulk alloys were fabricated from a powder mixture of pure Al and x wt.% of Fe, where x = 2 wt.%, 5 wt.% and 10 wt.%. Initially, as-mixed mixtures were processed using a mechanical-alloying (MA) technique in an attritor for 4 h. The milling was performed in an argon atmosphere at room temperature followed by the sintering of the milled powders in a high-frequency induction furnace to produce bulk samples. Scanning electron microscopy (SEM) was used to study the morphology of the produced alloys, and X-ray diffraction (XRD) to determine the phases formed after the sintering process and their crystallite size. The corrosion behavior of the fabricated samples was studied by immerging them in a 3.5% sodium chloride (NaCl) solution at room temperature using cyclic-polarization (CP) and electrochemical-impedance-spectroscopy (EIS) techniques. The SEM results showed that Fe was uniformly distributed in the Al matrix, and XRD revealed the formation of Al and intermetallic, i.e., Al6Fe and Al13Fe4, phases in the Al-Fe alloys after sintering. The hardness of the Al-Fe alloys was increased with the addition of Fe due to the formation of intermetallic compounds. Electrochemical results showed that there was a proportional relationship between the percentage of Fe additives and corrosion potential (Ecorr) where it shifted toward a nobler direction, while corrosion current density (icorr) and corrosion rate decreased with an increasing Fe%. This observation indicates that the addition of Fe into an Al matrix leads to an improvement in the corrosion resistance of the alloys.

1. Introduction

The mechanical-alloying (MA) technique is used to fabricate bulk metallic alloys from elemental powders that demonstrate better physical and mechanical properties when compared with similar alloys produced using a conventional manufacturing process [1,2,3]. MA can be defined as a solid-state powder-processing technique. It includes the fabrication of bulk metallic alloys from powder-mixture processes, such as consolidation and sintering, in order to produce a homogeneous structure. It has been reported in the literature that the MA technique leads to the production of stable microstructures in terms of the uniform dispersion of oxides, and produces alloys with fine-grain structures [4]. In the MA process, a high-energy ball mill is usually used due to its simplicity and effectiveness to attain a fine grain size and homogeneous dispersion of the elemental powders in the mixture [5]. However, the process variables in MA are time, types of milling, environment or atmosphere, and ball-to-powder weight ratio. These process variables were reported to have an effect on the powder properties and the structure of the processed powders [6].
Aluminum and its alloys have recently been used in the automotive industry, aerospace and military fields owing to good mechanical properties such as improved strength, hardness, and a high-specificity elastic modulus [7,8]. The addition of 5 wt.% Fe in an Al matrix could lead to improvement in the mechanical properties of the alloys owing to grain refinement and the formation of intermetallic compounds such as Al6Fe andAl13Fe4 [9]. It was reported that transition metals are not freely miscible in Al, for example, the solubility of Fe in Al can reach the maximum level of 0.03%, which delays the age-hardening process [10,11]. Nonequilibrium processes, such as mechanical-alloying and rapid-solidification techniques, are used to increase the solubility of Fe in an α-Al matrix [12,13,14,15,16]. Alloys with a higher amount of Fe and improved microstructures show a better physical and mechanical properties compared to an alloy of Al with less Fe content [17,18,19,20].
The addition of Fe in an Al matrix through the MA process leads to the production of nanocrystalline and amorphous Al-Fe alloys due to the formation of a supersaturated solution [21,22]. Niu et al. produced Al-Fe alloys with MA processing where they reported that by adding 5 wt.% to 12 wt.% Fe can produce excellent tensile strength and stiffness at room and elevated temperatures due to the strengthening of Al by intermetallics as well as to the stabilization of the structure [23]. However, there is limitation to the Fe content that can be dissolved in an Al matrix using the MA process. Nayak et al. reported that, once the amount of Fe content increased by more than 10 wt.% Fe, the alloys suffered from the formation of nonequilibrium intermetallic Al5Fe2, which hinders the formation of a supersaturated solution [24]. Once the amount of Fe was increased more than 10 wt.%, the dissolution of Fe decreased and ultimate tensile strength decreased [23]. Thus, it was suggested from the above literature that more than 10 wt.% Fe cannot be used to obtain a supersaturated solution of Al-Fe alloys for application.
Al and their alloys are known to exhibit good corrosion resistance due to the development of an oxide layer on the surface [1,2,8,9,10,11,12,13,25,26,27,28,29,30]. However, coarse-grained Al exhibits uniform and pitting corrosion when immersed in acidic or harsh atmospheric conditions [12,13,14,27,30]. The corrosion resistance of nanocrystalline materials differs from their coarse-grain counterpart due to their smaller crystallite sizes. Additionally, it is known that nanocrystalline materials increase corrosion resistance in passivating environments [31]. A similar study on the nanocrystalline Al-Cr alloy suggested that the Al-Cr alloy showed improvement in its corrosion resistance when compared with the values obtained from pure aluminum [32]. Another study on the addition of nanocrystalline Cu and Ti elements into Al showed improved corrosion resistance [33]. However, the corrosion resistance of nanocrystalline and coarse-grained Al was affected, as it was reported that the formation of pits on the alloy surface resulted in higher corrosion than the values obtained from the coarse-grained material. This could be due to the presence of less grain-boundary volume in coarse-grained materials than nanocrystalline materials [34,35]. Based on several earlier investigations, it was observed that the corrosion behavior of nanocrystalline materials is dependent on several factors, such as alloying element [25], manufacturing process [36,37], microstructure type [38,39] and environmental conditions [40,41].
From the above literature, it was found that there is a lack of information on the effect of Fe addition in an Al matrix using a mechanical-alloying and sintering process in terms of morphological and corrosion characteristics. In the present study, we fabricated Al and Al-Fe alloys with the incorporation of 2 wt.%, 5 wt.%, and 10 wt.% Fe using an MA technique followed by the sintering process. The morphological and corrosion characteristics of fabricated alloys were carried out by immerging them in a 3.5% NaCl solution for 1 h via cyclic-polarization (CP) and electrochemical-impedance-spectroscopy (EIS) techniques.

2. Materials and Methods

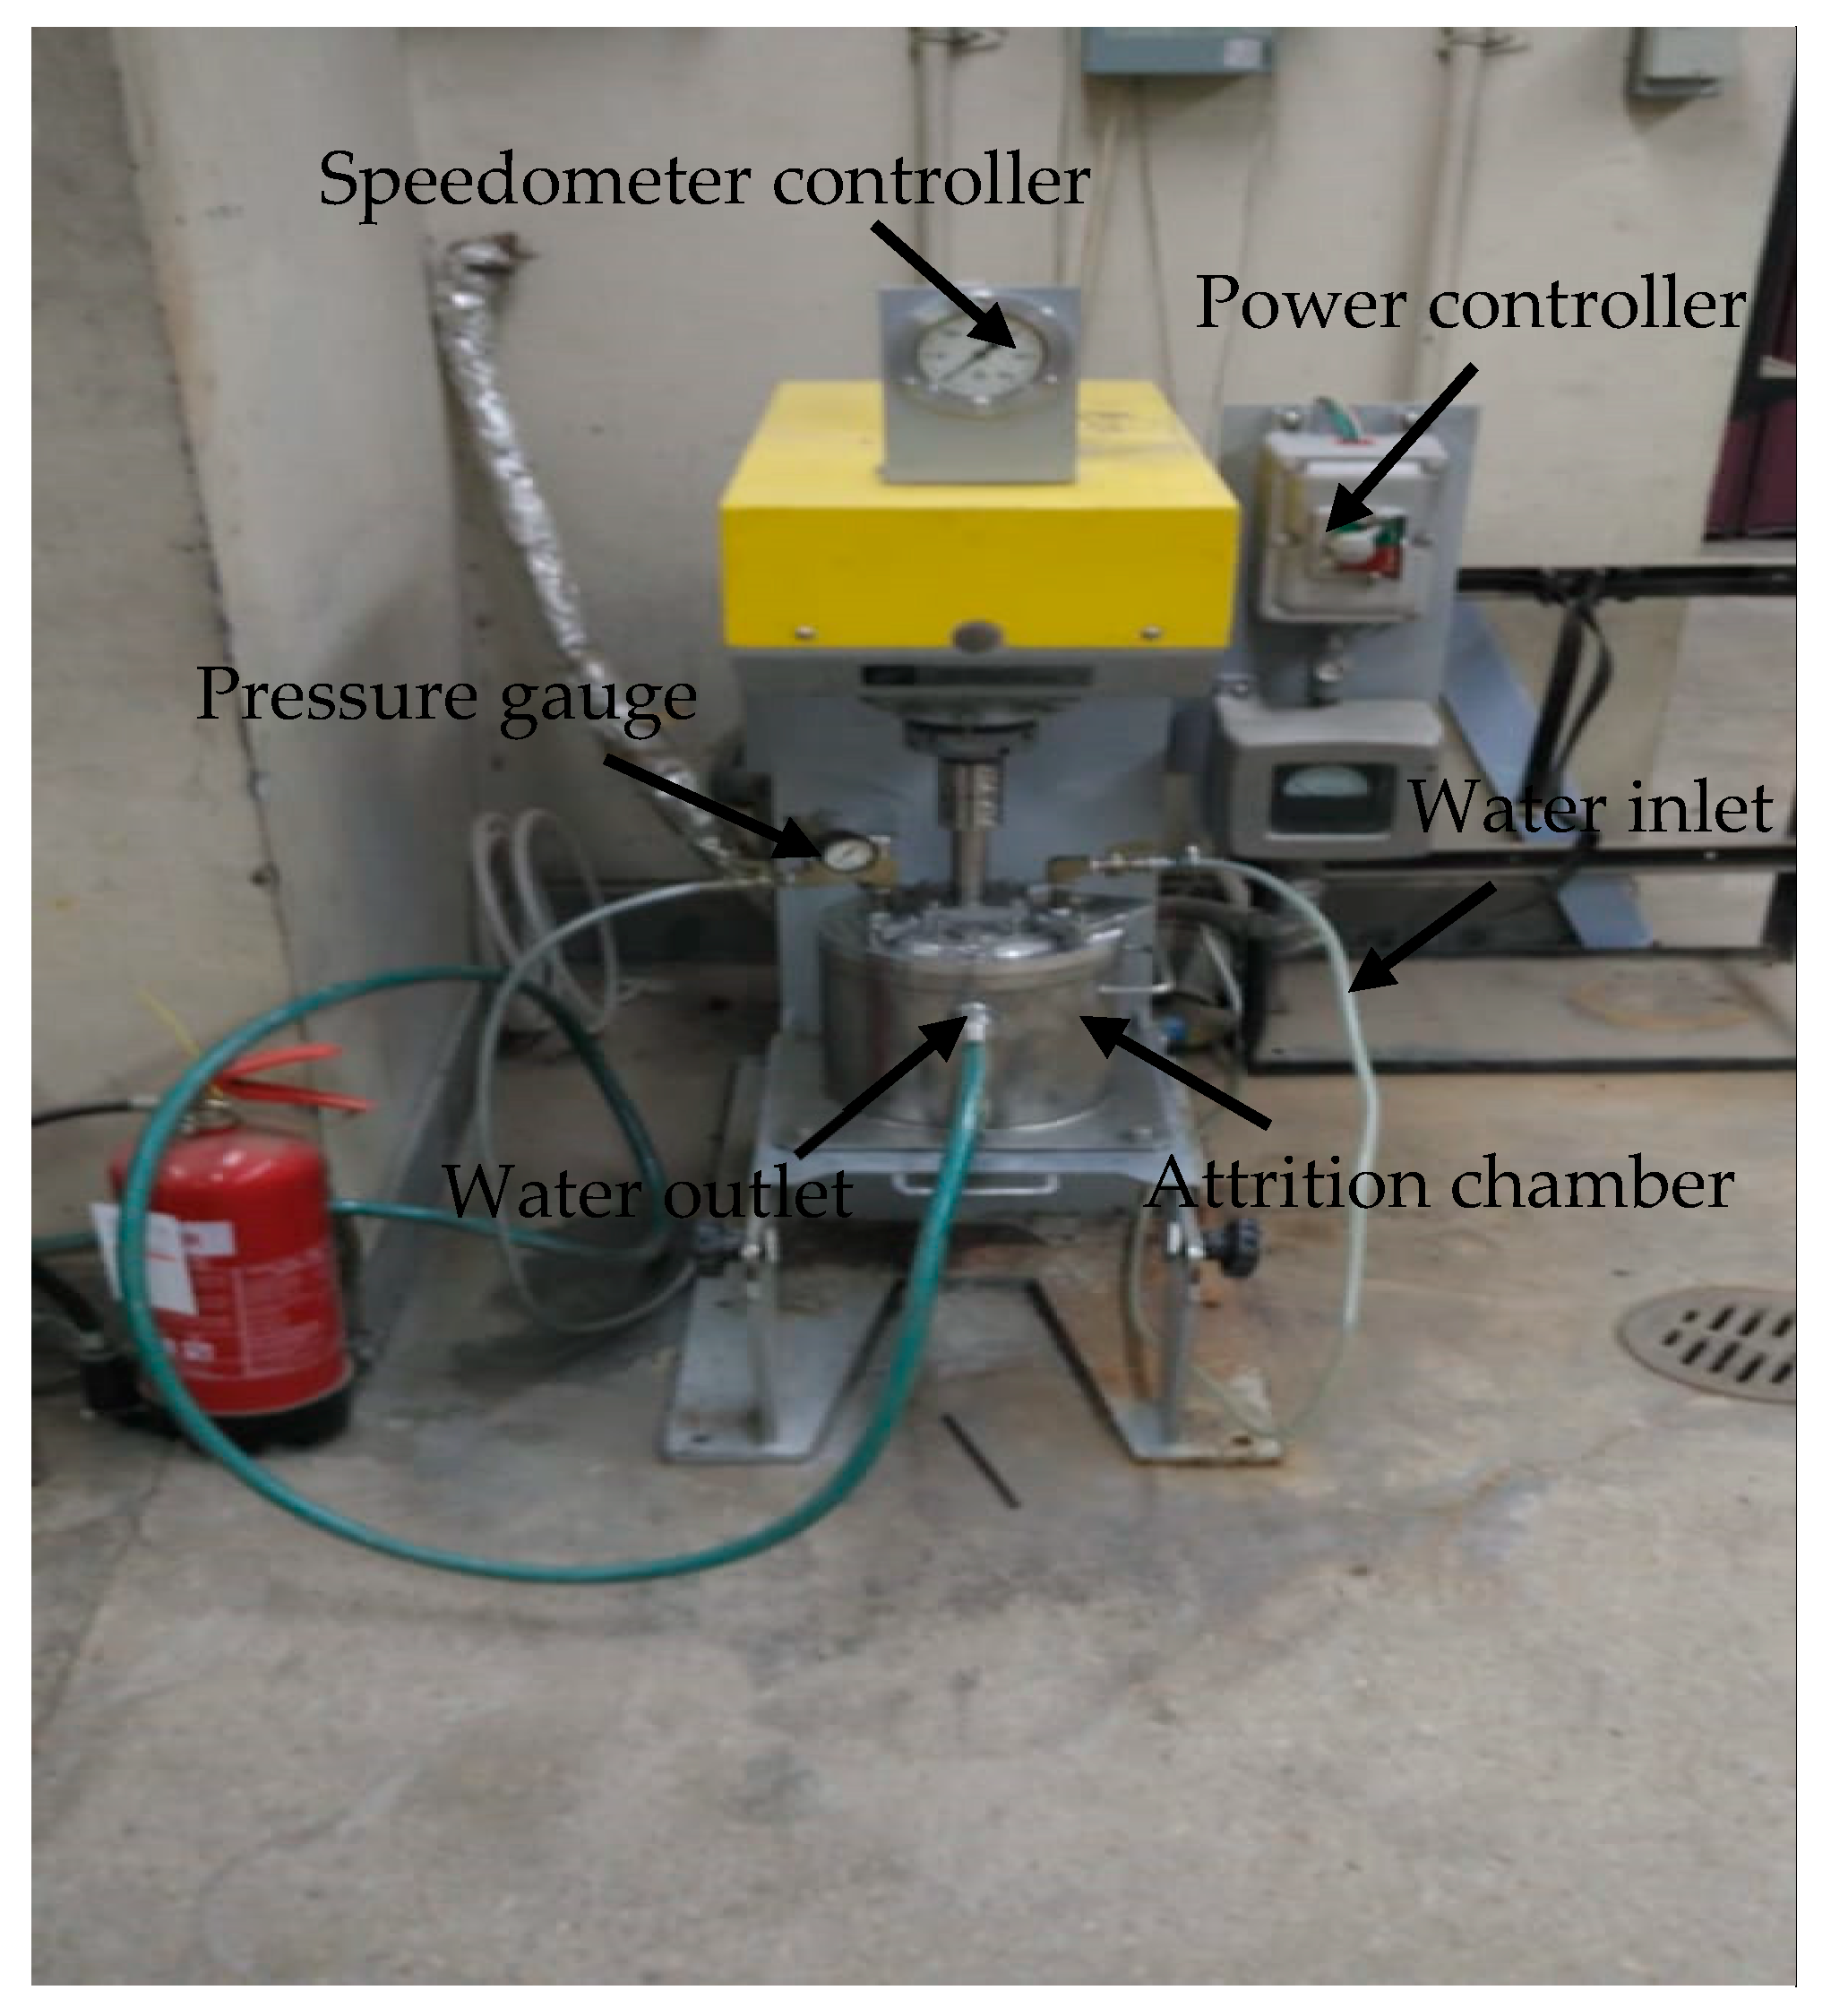
2.1. Fabrication of Pure Al and Al-Fe Alloys

Raw powders of Al (99.95% purity) and Fe (99.95% purity) were used to fabricate the alloys. The average particle size of Al was 5 µm, while the Fe (initial size = 45 µm) was premilled to achieve an average particle size of 13 µm. Before milling, pure Al and a proportionate mixture of premilled Fe (2 wt.%, 5 wt.%, and 10 wt.%) were degassed at 453 K for 24 h under vacuum. The mechanical alloying was carried out in an attritor (Figure 1) with a 5 mm stainless steel ball. The ball-to-powder weight ratio was 30:1 along with 1% of stearic acid powder (process-control agent). The balls and degassed-powder mixtures with the stearic acid were charged into the steel canister (container) of the attritor at 100 rpm, and the speed of the attritor was gradually increased to 250 rpm. Mechanical alloying (Al-2 wt.%, Al-5 wt.%, and Al-10 wt.% Fe) was performed in an inert atmosphere for 4 h. In order to maintain a constant temperature inside the attritor canister (container), we gave a 15 min pause for every 30 min of milling that was followed by a continuous supply of cold water in the outer chamber of the canister.
Finally, bulk samples were obtained by the consolidation and sintering of the milled powders. The milled powders were transferred into a graphite die in a vacuum glove box and pressed using a hydraulic jack to produce a green body. After pressing for 15 min, the graphite die was transferred to a high-frequency induction-sintering (HFIS, ELTek, Seoul, Korea) machine. The machine chamber was set to vacuum, the powder was further pressed in the HFIS machine to 100 MPa, and the sintering temperature was set to 823 K. The pressing was continued for 6 min at 823 K. After 6 min of loading, the graphite die was allowed to cool in the HFIS chamber. Later, the sample was removed from the die to obtain the bulk alloys.

2.2. Characterization Using X-ray Diffraction (XRD)

XRD (Bruker, Hamburg, Germany) analysis of the fabricated alloys and corrosion products was performed using Cu-Kα (λ = 0.154 nm) radiation. For the XRD peak profile, the data were captured within 2θ = 20°–90°. Peak-profile data were used to determine the crystallite size and microstrain of the sintered bulk samples using the Williamson–Hall method [42,43].

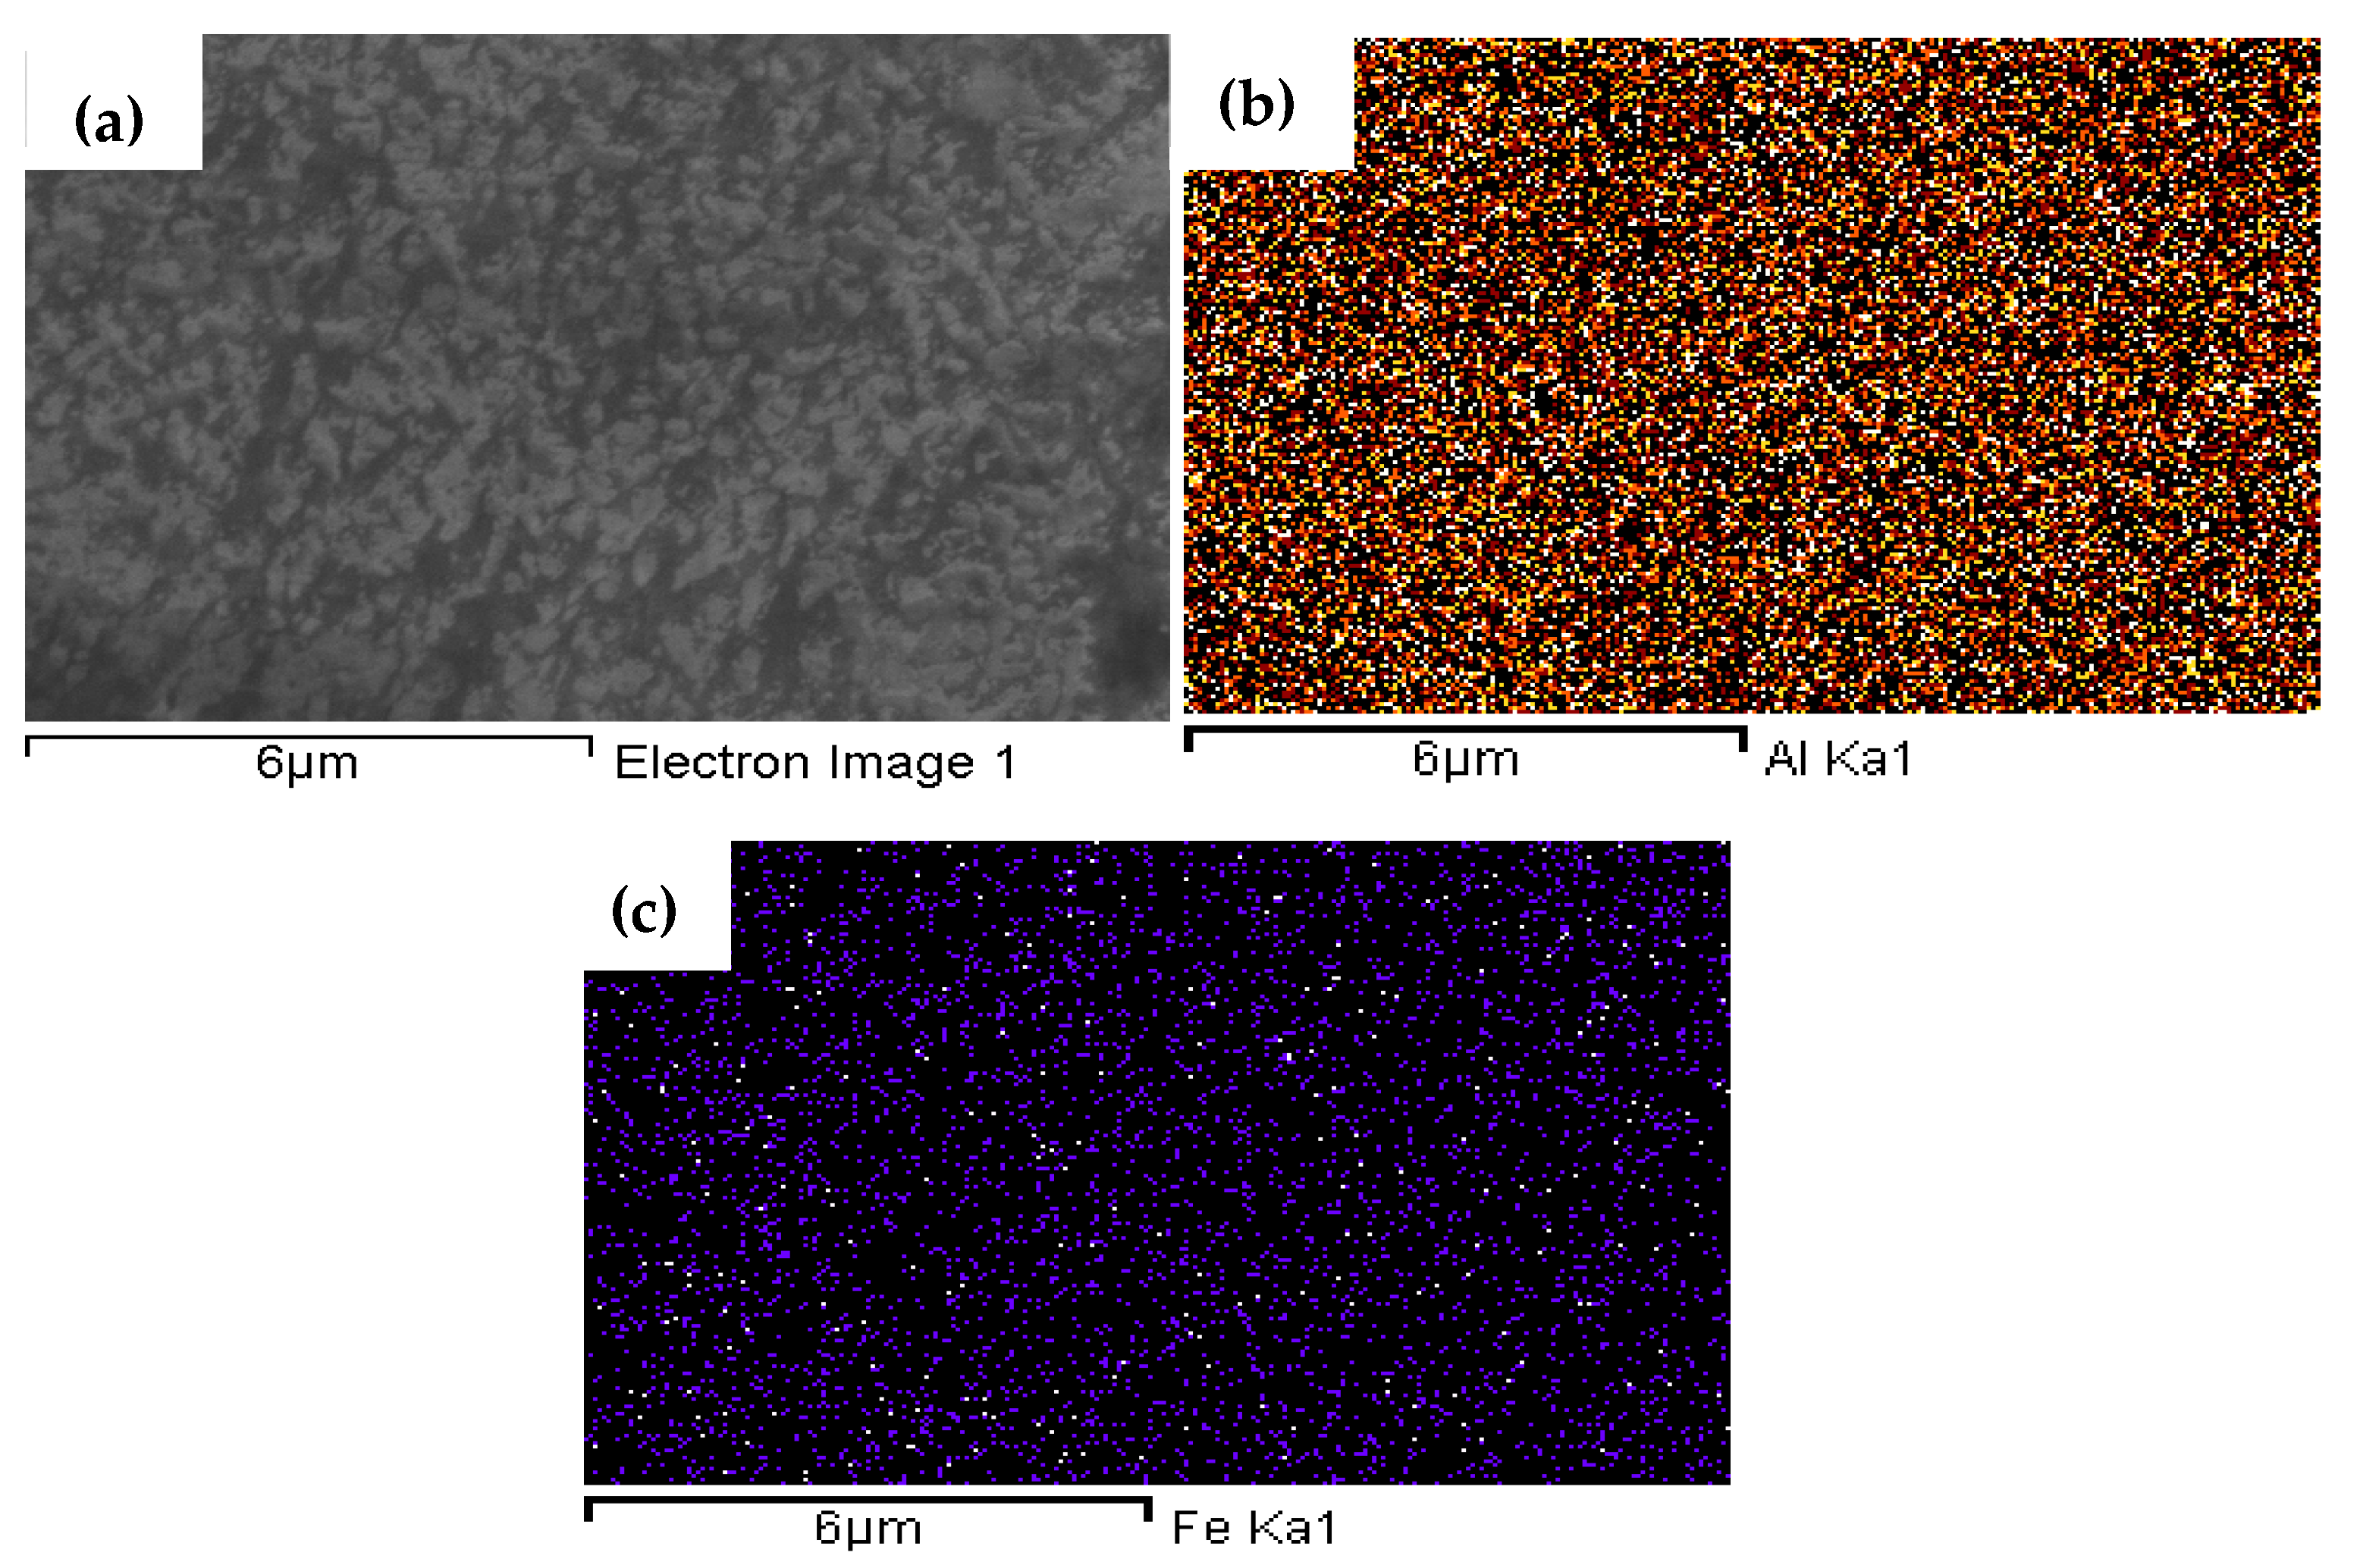
2.3. Microstructure Characterization of Sintered Alloys

Microstructural characterization of the polished-sintered-alloy surface (pure Al, Al-2 wt.%, Al-5 wt.%, and Al-10 wt.% Fe) and the corroded samples was carried out using a field emission scanning electron microscope (FESEM, JOEL, Tokyo, Japan). Elemental analysis of the alloys was obtained using an energy-dispersive spectrometry (EDS) analyzer attached to the FESEM device. Grain-size analysis of the alloys was carried out with ImageJ software (version 1.52n).

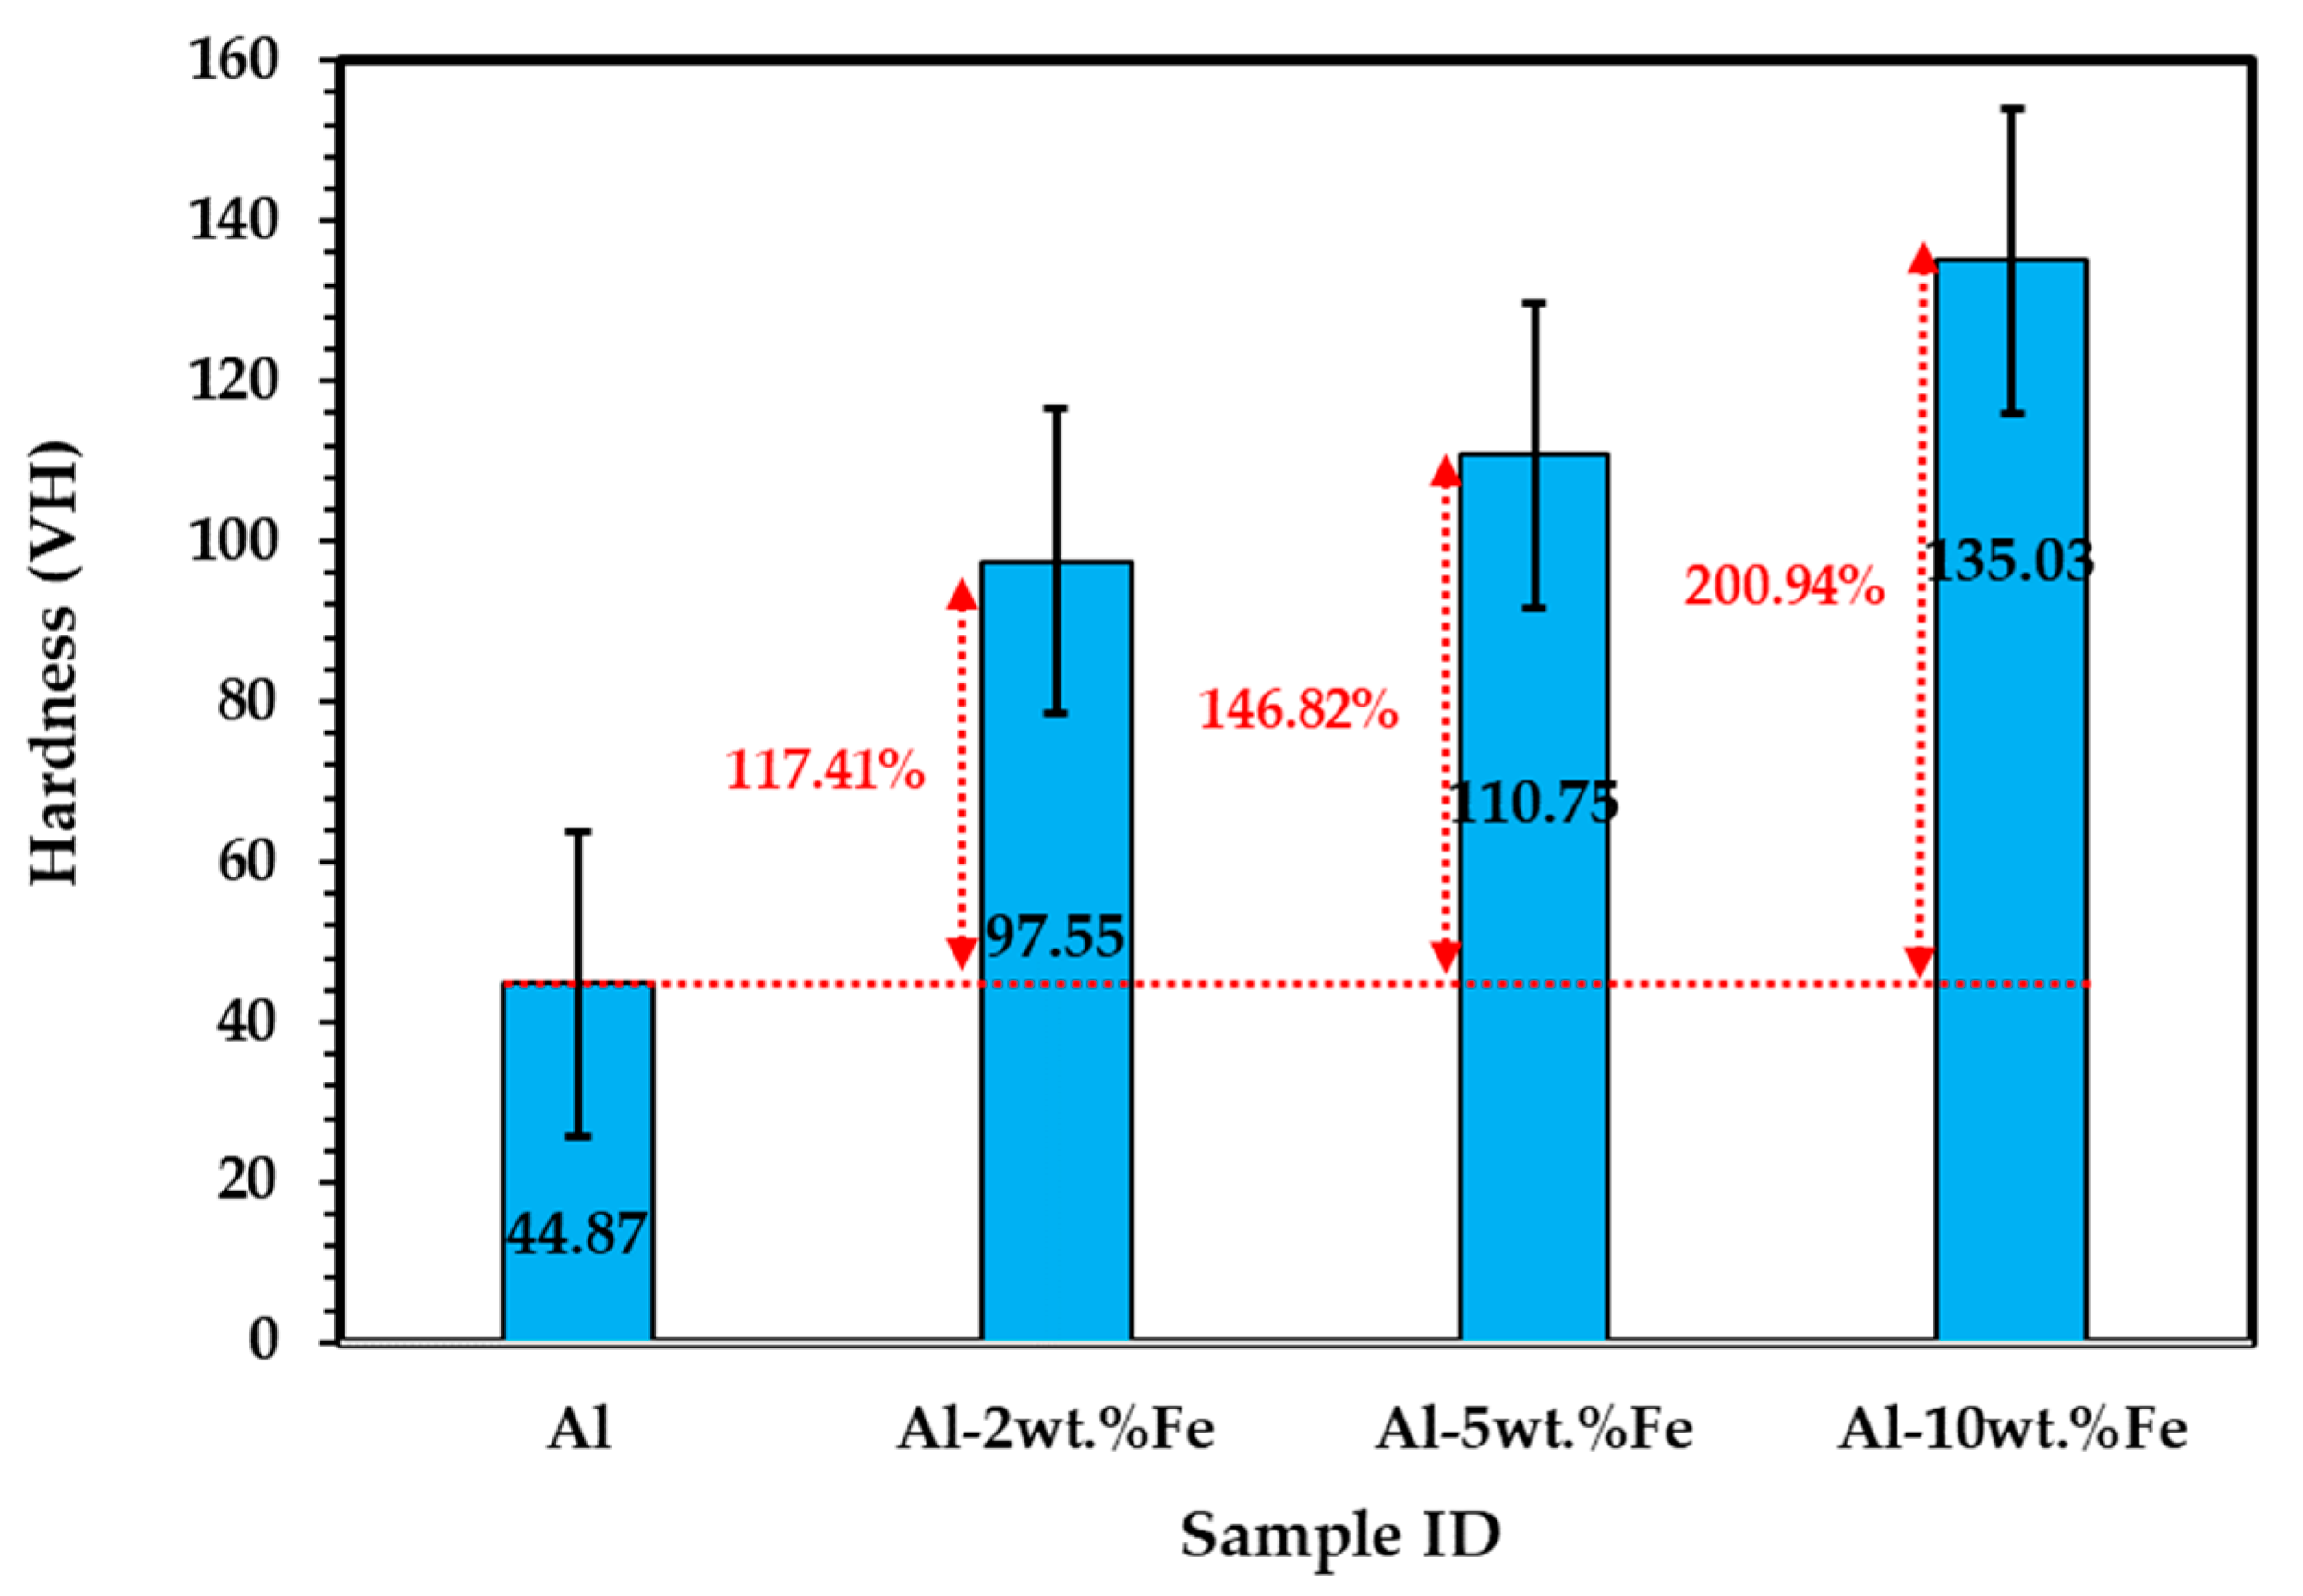
2.4. Hardness Measurement

To evaluate the Vickers hardness of the fabricated materials, a WOLPERT UH930 Universal Hardness Testing Machine (Lieca VMHT Auto, Tokyo, Japan) was employed. The load was 10 kgf and dwell time was 10 s. Hardness measurement was repeated for 5 readings, and the average was taken to represent the hardness value.

2.5. Electrochemical Cell

Electrochemical experiments were performed using three electrode systems consisting of a platinum foil as the counter electrode (CE), Ag/AgCl as the reference electrode (RE), and the fabricated sintered alloys were selected as the working electrode (WE). A solution of 3.5% NaCl (analytical-grade reagents) was prepared in distilled water for the electrochemical experiments. WE preparation and mounting was performed using a standard procedure and can be found elsewhere [44]. WE was fabricated by making a 0.5 mm hole in depth, and the same diameter was drilled into one surface. A copper wire of the same diameter was placed and soldered. This assembly was mounted in an epoxy resin and kept for 24 h to cure at room temperature. After drying, the sample was polished with 1200 µm emery paper, then alumina (0.5 µm particle size) slurry to obtain a smooth surface using an automatic polishing machine (Buehler MetaServ 250, Shanghai, China).

2.6. Electrochemical Experiments

Electrochemical experiments of pure Al, Al-2 wt.%, Al-5 wt.%, and Al-10 wt.% Fe alloys were performed with an Autolab system (PGSTAT20, Metrohm, Barendrecht, The Netherlands) by immerging them in 3.5% NaCl solution. For every new experiment, a new polished surface was prepared for each electrode, and fresh 3.5% NaCl solution was used. The CP experiment was performed by changing the potential from −1200 to +0.00 mV at a scan rate of 1 mV/s, alongside the RE from open-circuit potential (OCP). EIS was measured within a frequency variation from 0.0001 to 100 kHz with 10 steps per decade by applying 5 mV sinusoidal perturbation at the OCP.

3. Results and Discussion

The SEM micrographs with the corresponding EDS analysis (arrow mark in respective figures) of pure Al and Al-10 wt.% Fe alloys after the sintering process are shown in Figure 2a,b, respectively. No porosity is shown in the SEM micrographs of pure Al (Figure 2a) or the Al-10 wt.% Fe alloys (Figure 2b), which indicates the perfect fabrication process with HFIS, as confirmed by the high relative-density values (>98%) of the sintered samples. Pure Al showed 100% Al in the EDS result (Figure 2a) which confirm that there no oxidation occurred during the HFIS process. Due to mixing 10 wt.% Fe in the alloy, dispersion of fine Fe particles in Al matrix was shown with uniform intermetallic distribution [23], as shown in Figure 2b. From this figure, it can be observed that the Fe was completely mixed and uniformly distributed in the Al matrix; thus, there was no segregation found [45]. On the basis of the Al-10 wt.% Fe alloy microstructure, it is possible to say that it formed a homogeneous and uniform mixture without porosity, which may improve the microstructural stability of fabricated alloys.
On the basis of EDS analysis (respective particle analysis shown by arrow marks in Figure 2b), the white contrast contained 64 wt.% Al and 34 wt.% Fe, and their probable stoichiometric formula would be very close to Al13Fe4. The gray contrast contained 73.27 wt.% Al and 26.73 wt.% Fe, and its probable stoichiometric formula would be close to Al6Fe. On the other hand, the black contrast was almost Al, where it contained 99.30% Al, which was the α-Al reported by Sasaki et al. [9]. This result suggests that Fe was completely mixed into the Al matrix after the attrition and sintering process. Overall EDS analysis showed 90 wt.% Al and 10 wt.% Fe, which is a parent material composition (90 wt.% Al and 10 wt.% Fe). Phase verification by XRD analysis is described in the subsequent paragraph to corroborate the EDS results. The grain size of Al, Al13Fe4, and Al6Fe was found to be around 430 ± 27, 490 ± 15, and 604 ± 32 nm, respectively, in the Al-10 wt.% Fe alloys.
The X-ray diffraction patterns for the pure Al and Al-10 wt.% Fe alloys are shown in Figure 3. For the pure Al sample, the observed diffraction peaks corresponded to (111), (200), (220), and (222) planes of α-Al (JCPS = 85-1327). Peak broadening (after milling and sintering) along with a peak-intensity (height) decrease was observed in the Al-10 wt.% Fe alloys. This might be due to enhanced crystal-size refinement, it being amorphous, and the formation of new intermetallic compounds during MA process with addition of Fe [24]. In Al-10 wt.% Fe alloy-diffraction peaks, Al6Fe (JCPS = 47-1433) and Al13Fe4 (JCPS = 29-0042), along with the main α-Al peaks, were identified as intermetallic compounds. The formation of intermetallic compounds corroborates the EDS analysis results. These new intermetallic compounds were obtained because, during the milling process, the added Fe was completely mixed with Al and formed a uniform mixture of Al-Fe alloys. During the sintering process, Fe from the mixture was expelled as part of the new intermetallic compounds due to high temperature and pressure. The formation of these new Al6Fe and Al13Fe4 intermetallic compounds occurred during the sintering process at the relatively high temperature of 823 K. Moreover, the presence of Al6Fe and Al13Fe4 intermetallic compounds in the fabricated alloys enhanced the mechanical properties and improved the microstructural stability of the sintered alloys.
Based on the X-ray diffraction pattern shown in Figure 3, crystallite size and microstrain were calculated from peak width using the linear Williamson–Hall method [42]. Average crystallite size, microstrain, and error were determined for all Al peaks [43]. Table 1 shows crystallite sizes for all alloys used in this investigation. The crystallite sizes of the Al phase in pure Al, Al-2 wt.% Fe, Al-5 wt.% Fe, and Al-10 wt.% Fe were found to be 53.67 ± 1.78, 39.16 ± 4.23, 39.13 ± 2.70, and 37.33 ± 3.56 nm, respectively (Table 1). It was observed that the crystallite size of the Al phase was decreased and the microstrain gradually increased as Fe content was increased in the Al-Fe alloys. In the case of the addition of Fe of more than 10 wt.% to the Al matrix, the microstrain was increased and resulted in the formation of a brittle surface due to the extreme refinement of the crystallite [24]. Thus, this study did not allow Fe content to increase by more than 10 wt.% Fe. This observation may also be explained on the basis of intermetallic-compound formation that hinders grain growth during the sintering process, thereby leading to a uniform and stable microstructure in the fabricated alloys.
The volume fraction (Vf) of Al and the intermetallic compounds present in Al and Al-10 wt.% Fe alloys was calculated based on the integrated-surface-area method [46,47,48,49]:
V f ( A l ) = A A l A A l +   A A l 13 F e 4 +   A A l 6 F e
V f ( A l 13 F e 4 ) = A A l 13 F e 4 A A l +   A A l 13 F e 4 +   A A l 6 F e
V f ( A l 6 F e ) = A A l 6 F e A A l +   A A l 13 F e 4 +   A A l 6 F e
where Vf(Al), Vf(Al₁₃Fe₄), and Vf(Al₆Fe) were volume fractions, and AAl, AAl₁₃Fe₄, and AAl₆Fe were the total integrated surface area of Al, Al13Fe4, and A6Fe, respectively. Based on the above calculation, Vf(Al) in pure Al was found to be 100% due to the presence of only one phase, while in Al-10 wt.% Fe alloys, Vf(Al), Vf(Al₁₃Fe₄), and Vf(Al₆Fe) showed 81.78%, 2.32%, and 15.90%, respectively.
Figure 4 shows the compressive stress–strain response of all fabricated alloys. The experiment was performed at a strain rate of 0.0001/sec at room temperature. From the results, it was evident that the strength of the alloys was increased with an increase in the amount of alloying element (Fe). However, elongation to failure was decreased. This result was expected because, as the strength of an alloy increases, then its elongation to failure decreases.
Alloy hardness with error is shown in Figure 5. As the amount of Fe increased, the hardness of the Al-Fe alloys also significantly increased owing to the formation of nanocrystalline Al-Fe alloys with crystallite/grain refinement [50]. The hardness of Al, Al-2 wt.% Fe, Al-5 wt.% Fe, and Al-10 wt.% Fe was found to be 44.87, 97.55, 110.75, and 135.03 HV, respectively. Once the 10 wt.% Fe was added in Al, hardness was increased by more than 200%. This phenomenon occurred due to the influence of grain-size refinement, where crystallite size is decreased after the addition of Fe in Al [51]. It is well known that the hardness of intermetallic compounds, especially Al6Fe, is greater than that of pure metals or alloys [52,53]. Alloy hardness can be correlated with intermetallic volume fraction calculated with XRD, where Al-10 wt.% Fe alloys contain 2.32% Al13Fe4 and 15.90% Al6Fe, which play an important role in hardness enhancement.
To confirm the uniform dispersion of Fe particles in the Al matrix, EDS elemental mapping was performed using FESEM on the surface of the Al-10 wt.% Fe sintered sample, as shown in Figure 6. EDS mapping of the Al-10 wt.% Fe alloys (Figure 6a) clearly indicated homogeneous dispersion in gray and black contrast due to the presence of Al and Fe/intermetallic compounds [54]. The black contrast represents Al distribution, since it was represented in the SEM image (Figure 2b), while the gray contrast surrounded the Al matrix by the formation of Fe/intermetallic compounds [9]. The bright-yellow contrast in Figure 6b represents Al, and the dark contrast indicates Fe/intermetallic presence. Similarly, in Figure 6c, it can be seen that the blue contrast represents the presence of Fe particles, while the black and white particles show intermetallic presence. From EDS mapping, it was clear that Fe particles were homogeneously distributed in the Al matrix of Al-10 wt.% Fe alloys.

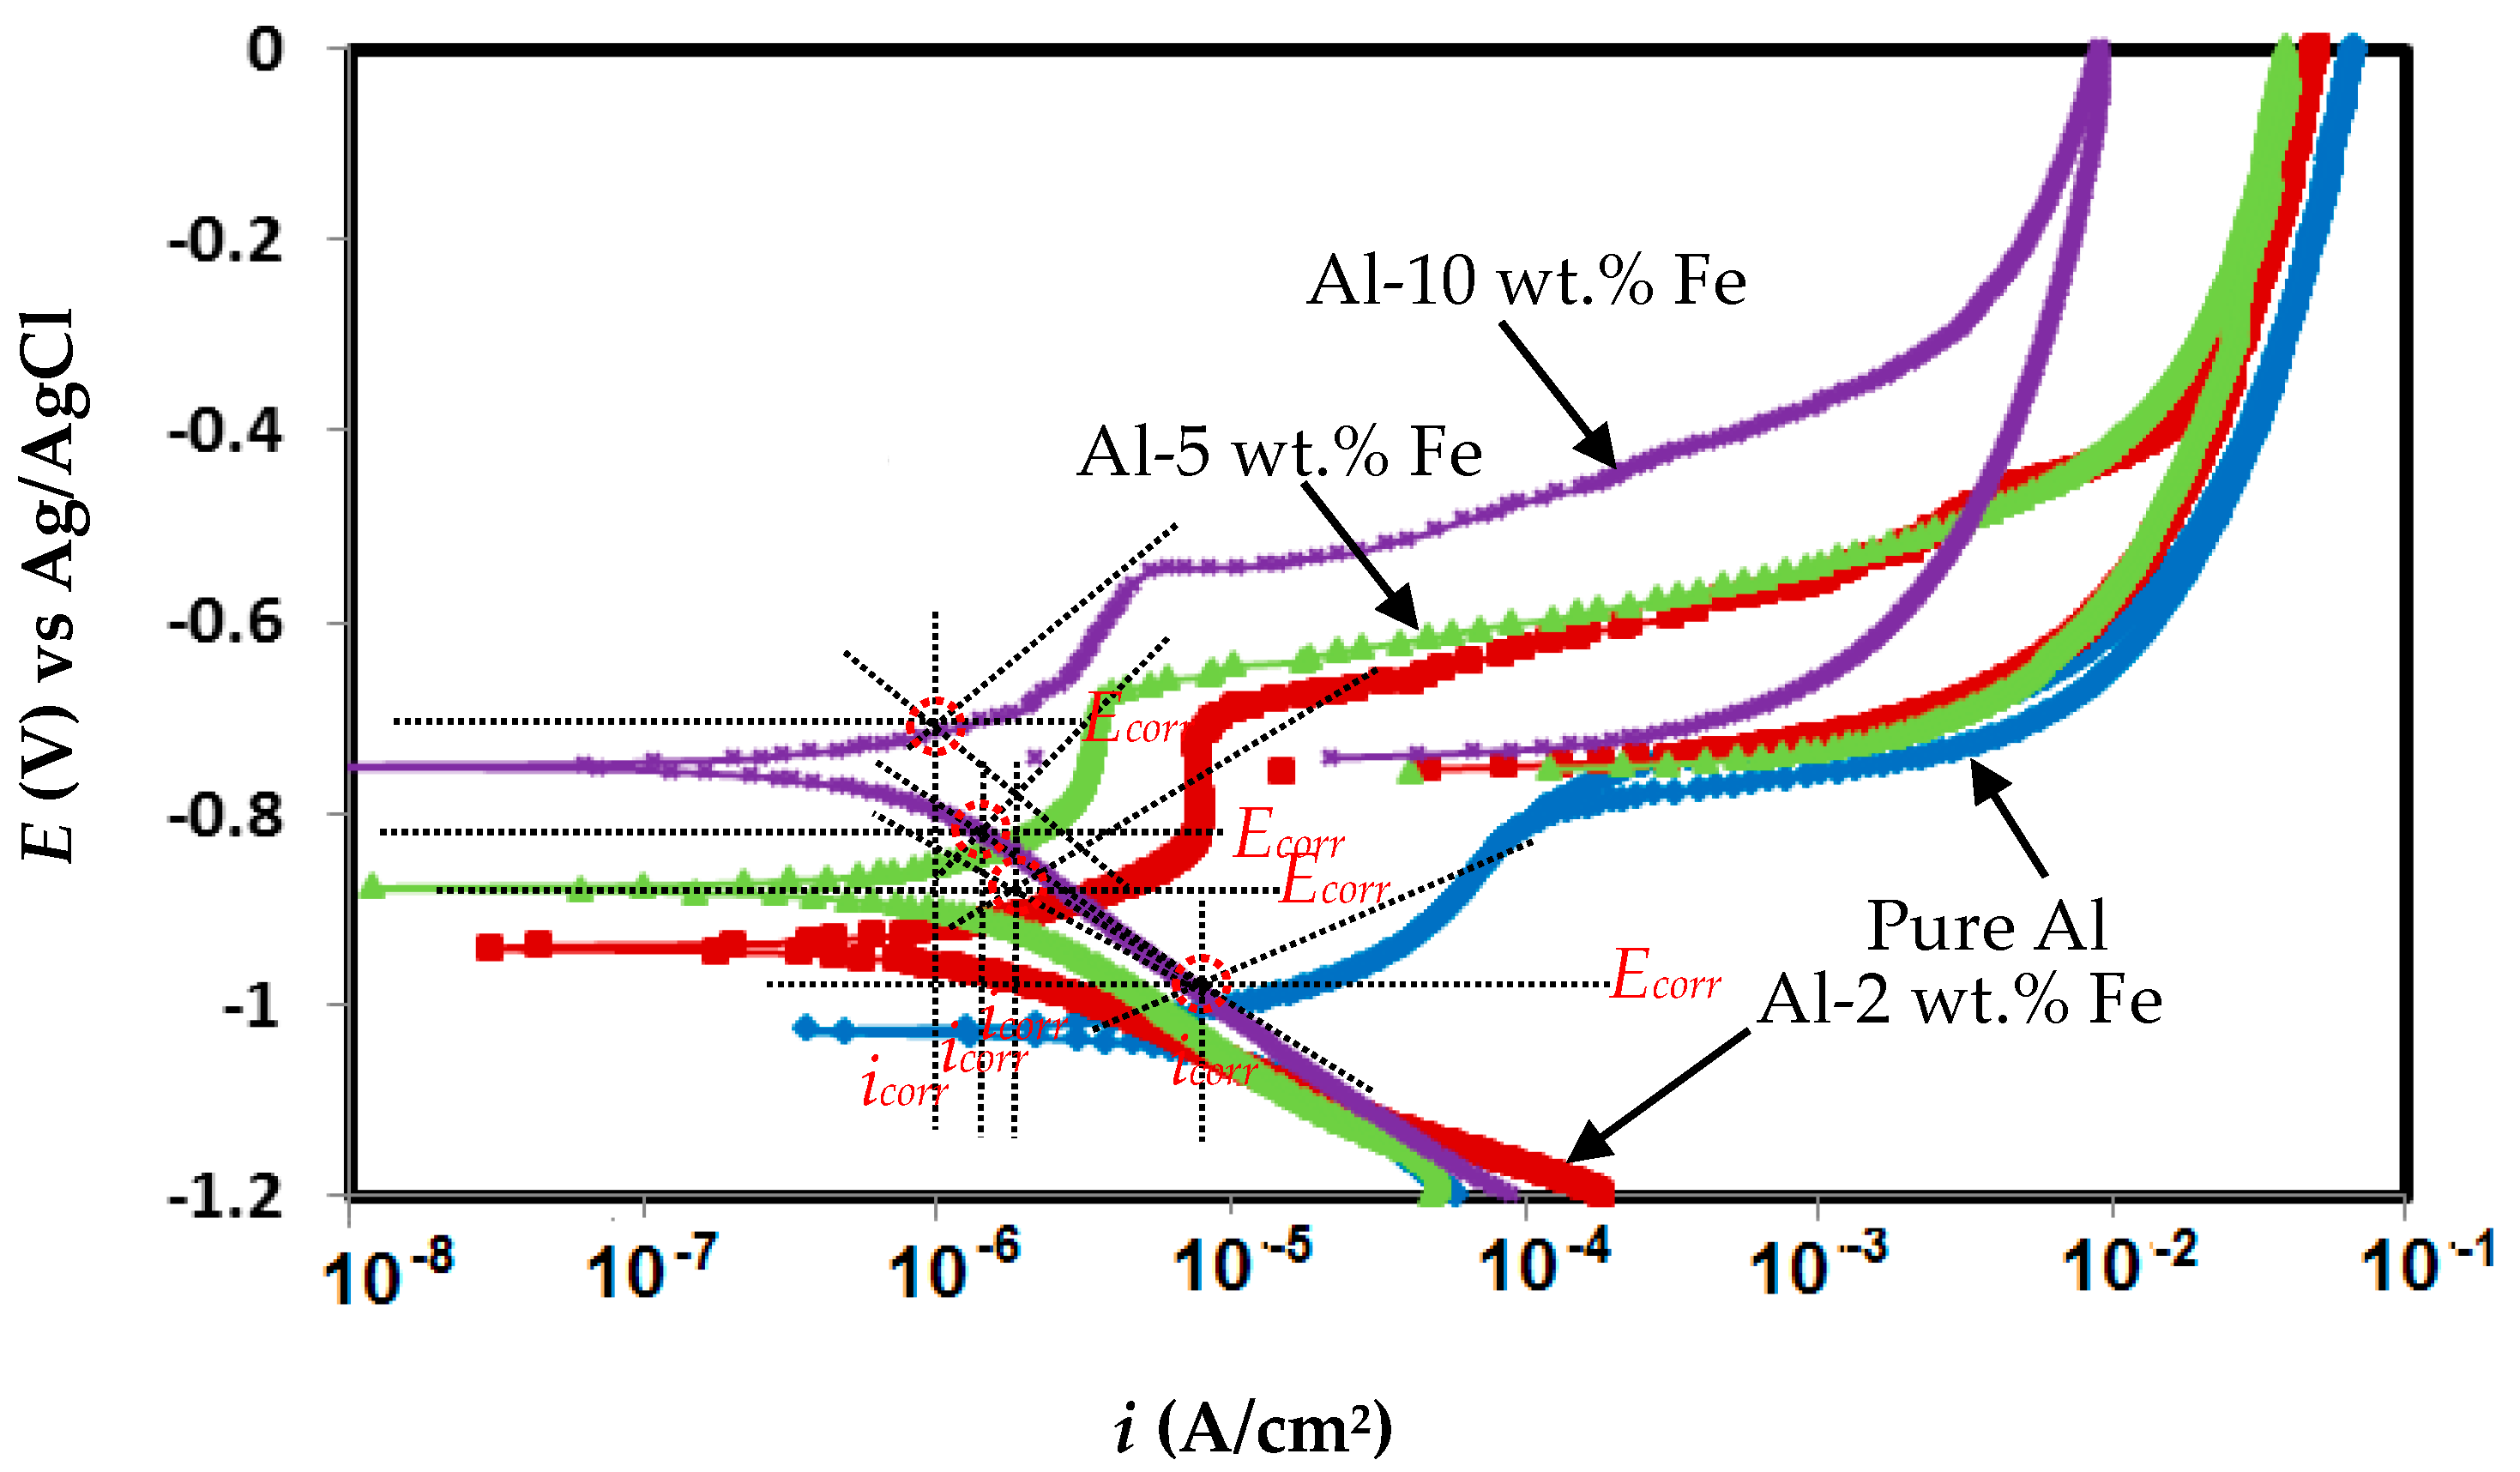
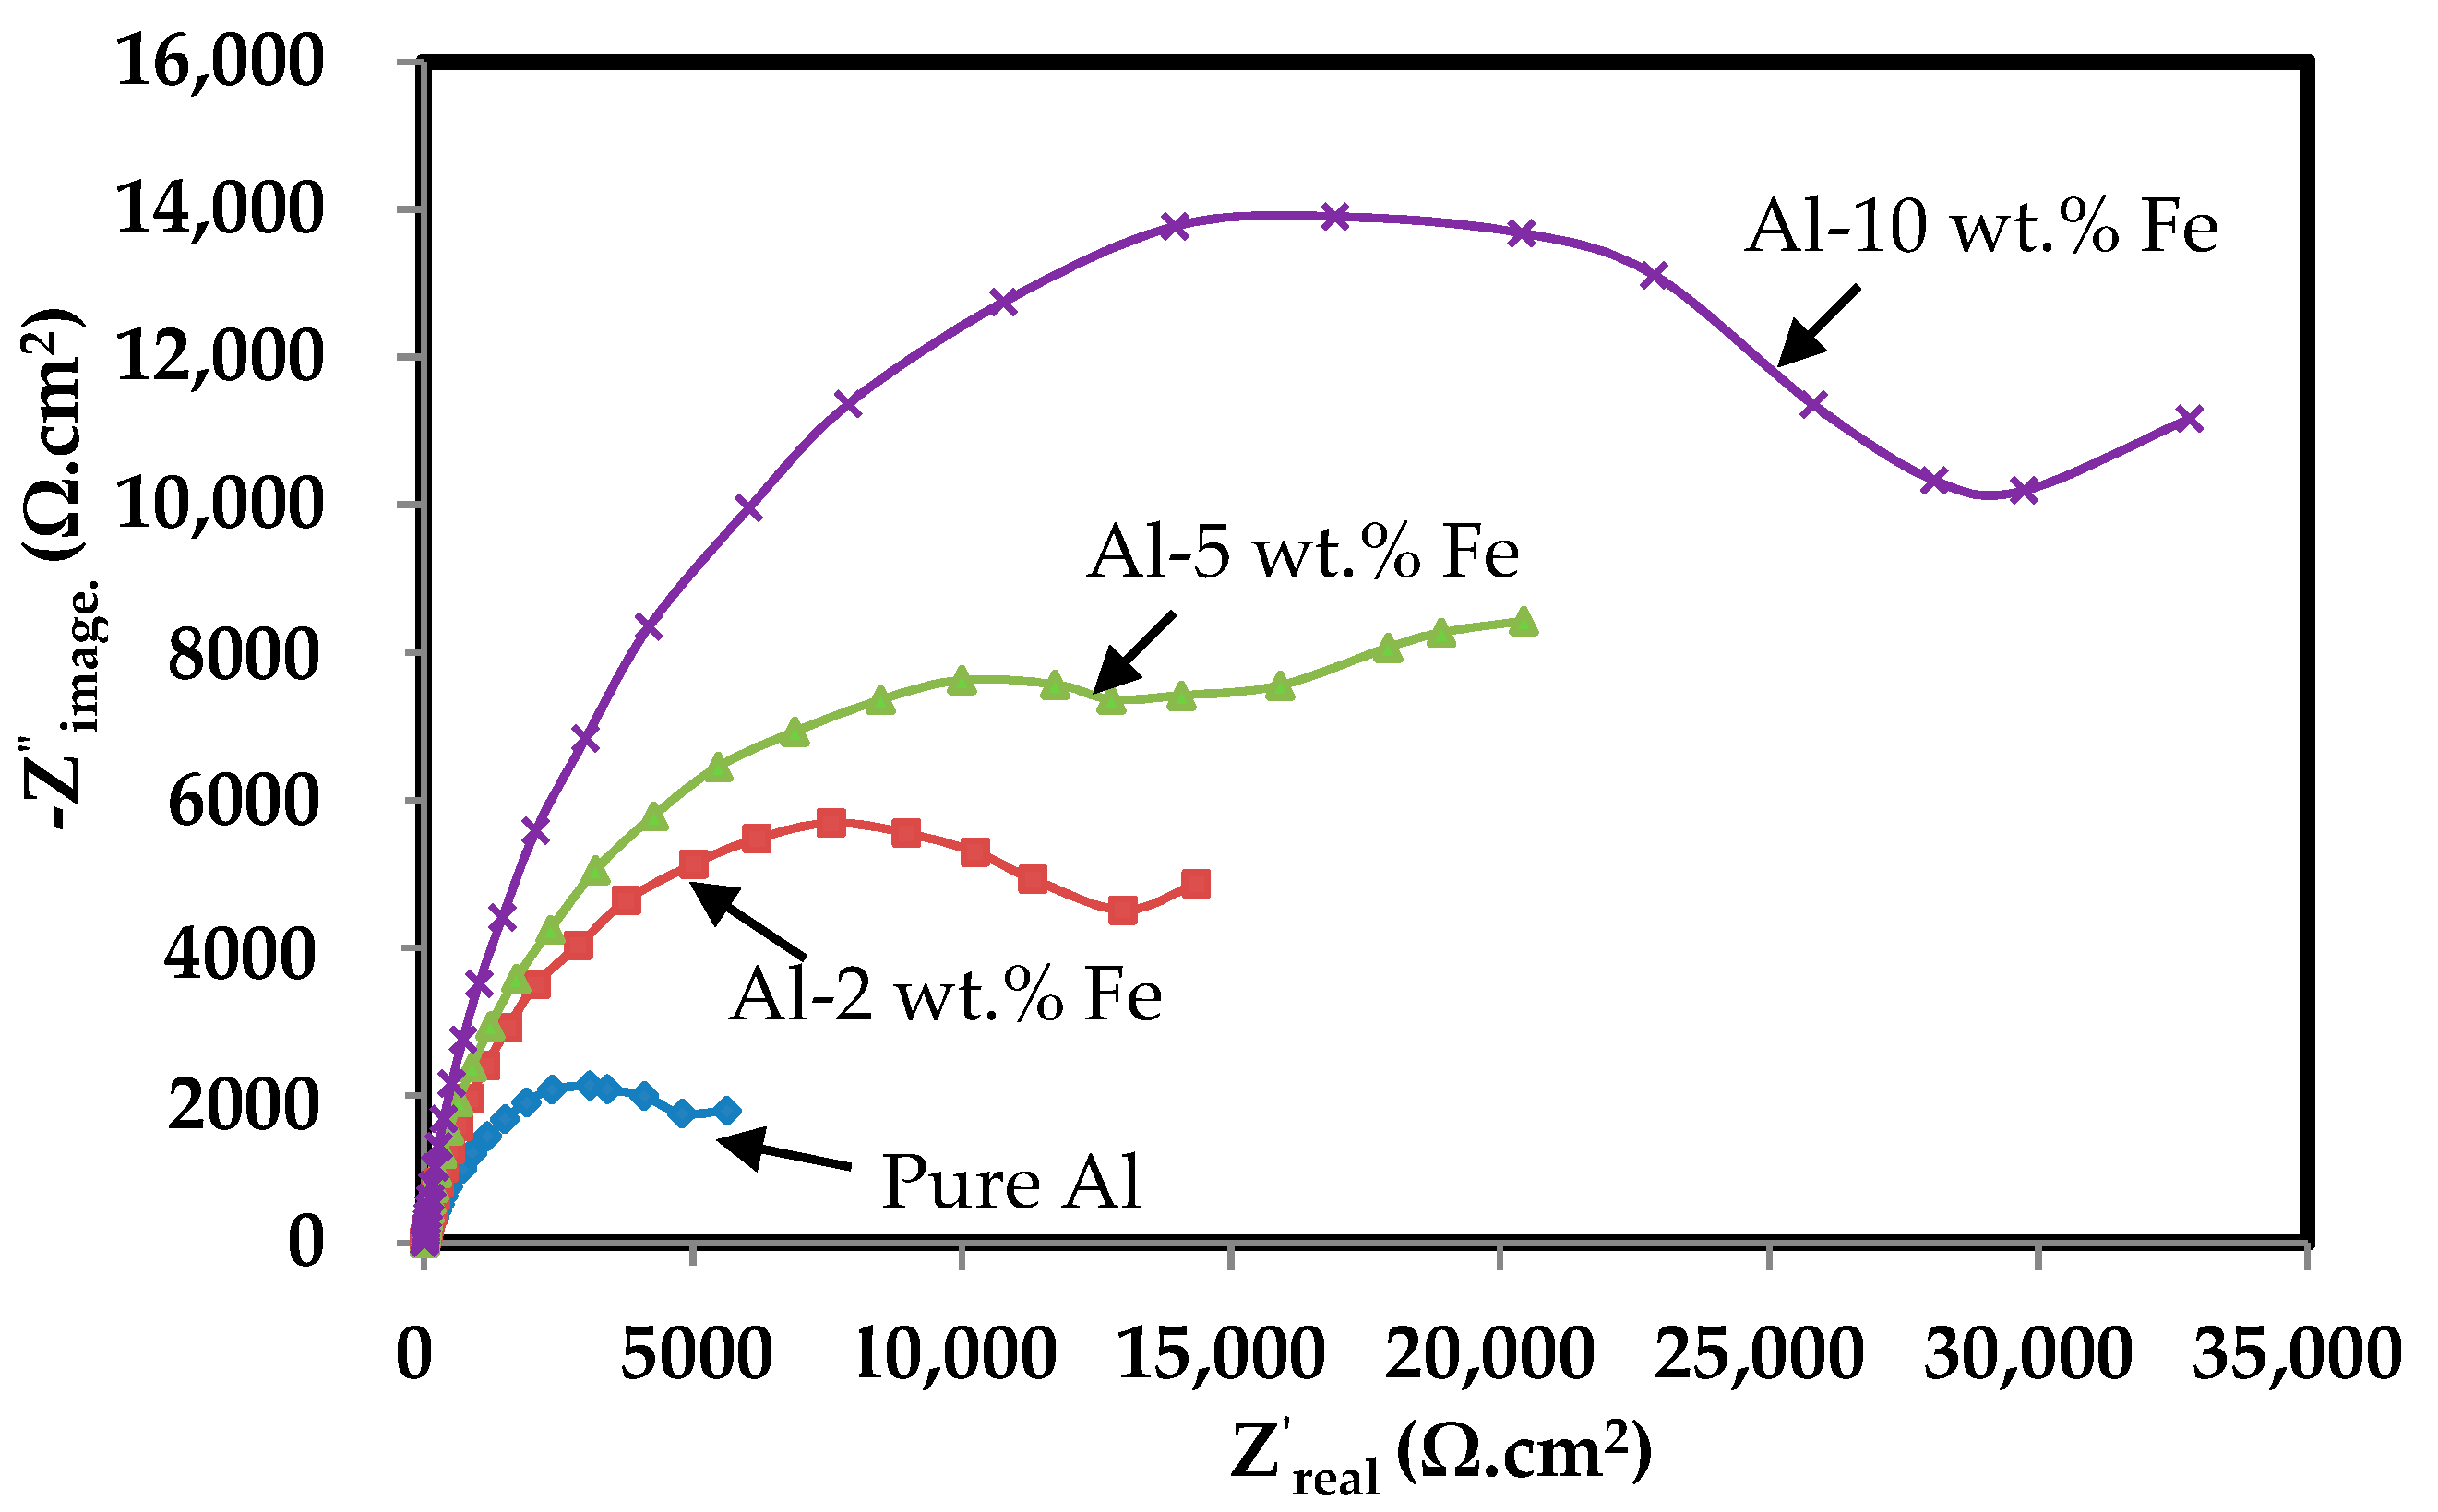
3.1. Electrochemical Measurements

CP was used to examine the corrosion resistance of Al and Al-Fe sintered alloys by immerging them in 3.5% NaCl solution for one hour. The CP results of the fabricated alloys are shown in Figure 7. Electrochemical parameters such as corrosion current density (icorr), corrosion potential (Ecorr), pitting potential (Epit), pitting current (ipit), and polarization resistance (Rp) were extracted after fitting the polarization curves in Tafel’s regions; results are shown in Table 2. All samples showed positive (clockwise) loop formation during the back scanning, which revealed alloy deterioration.
The CP curve showed the active–passive behavior of the pure Al as well as the binary Al-Fe alloys. It was observed that the addition of Fe resulted in an increase in cathodic current density owing to the presence of greater intermetallic compounds that worked as cathode sites where hydrogen-evolution reaction occurred [55,56]. Moreover, cathodic current density was increased once Fe content was increased in the Al-Fe alloys. Pure Al showed a sudden increment in current density after Ecorr, which showed pitting, whereas, once the Fe was added in the Al-Fe alloys, it formed a passive film after Ecorr. The formation of a passive film in the Al-Fe alloys at lower current density revealed protection against corrosion in the NaCl solution. Passivation was observed once Fe was incorporated in the Al-Fe alloys during anodic scanning at a different current density due to the formation of intermetallic compounds in alloys such as Al13Fe4 and Al (Fe), which is correlated with the results of Flores-Chan et al., where they found that Al-Fe (20 wt.%) alloys facilitate forming a passive film [57]. It was observed by other researchers that the corrosion protection of Al–Fe alloys is due to the formation of stable passive films (ferrous and aluminum hydroxide/aluminum ions) exposed to NaCl solution owing to the preferential dissolution of FeAl3 [54,58].
The corrosion rate of Al and Al-Fe alloys was calculated using the following equation [59]:
Corrosion   rate   ( µ m / year ) = 3.27 × i c o r r × E . W .   d
The corrosion rate in Equation (4) is expressed in µm/year, while icorr is in units of µA·cm−2. The value of icorr was obtained by dividing the total surface area of the working electrode in the corrosion current. E.W. represents the equivalent weight (g/mole), and d is the density (g/cm3) of the alloys.
The potential, such as Ecorr and Epit values, shifted toward a more positive direction once Fe was added in the Al-Fe alloys, which shows it to be nobler in nature (Table 2). It was also reported that anodic currents, icorr and ipit values decreased and Rp values increased with the increase of the amount of Fe in an Al alloy. The positive influence of Fe addition in regards to the corrosion resistance of Al-Fe alloys is due to the presence of intermetallic compounds. The increase in Rp value and decrease in icorr of the fabricated alloys could be accredited to three facts: first, the presence of secondary intermetallic phases, i.e., Al6Fe and Al13Fe4, in the alloy, as observed in the XRD of the sintered sample. Second, the formation of a homogeneous mixture due to alloying is known to improve the microstructural stability of an alloy and improve its corrosion resistance. Third, the increase in Rp value might also be due to the formation of passive layers of Al2O3 and Fe2O3 on the alloy surface of the exposed samples [60]. Additionally, Al dissociation decreased structural stability; thus, it impeded complex aluminum chloride formation, which initiates pitting corrosion [61].
The corrosion characteristics of pure Al and Al-Fe alloys were studied using the EIS technique to determine their kinetics and mechanism. The corrosion behavior of pure Al and Al-Fe alloy samples was examined in a 3.5% NaCl solution at room temperature after one hour of exposure. The Nyquist plots obtained at OCP are shown in Figure 8.
Two types of semicircle loops are shown in the Nyquist plot (Figure 8), a half semicircle loop in a low-frequency range and a capacitive loop at a high-frequency range, which could be due to the charge–transfer reaction (corrosion-product activity as a passive layer) between electrolyte and alloy interface via the electrochemical twin layer. However, the low-frequency loop could be related to the corrosion characteristics of alloys.
The suitable equivalent circuit model (ECM) is shown in Figure 9 to fit EIS plots and extract the kinetics parameters. This ECM contained two circuits, where the first circuit contained charge transfer resistance (Rct) at the electrode/solution interface and the double-layer capacitance (Cdl), which were parallel with each other. Another circuit contained the layer resistance that was inter-related with the resistance of the corrosion film (Rf) and the capacitance of the film (Cf), which were parallel with each other. Rct with Rf and Cdl with Cf were connected in series with each other. The first circuit represented the corrosion characteristics of the alloys, whereas the second was for film formation at the alloy/solution interface. From the ECM (Figure 8), calculation of electrochemical impedance parameters such as solution resistance (Rs), Rct, Cdl, Rf, and Cf was obtained [62]. Table 3 shows the value of these calculated parameters. In order to give a more accurate fitting, constant phase elements (CPE) were replaced for the capacitive elements of the corrosion film (CPEf or Cf), pseudocapacitance and double-layer capacitance (CPEdl or Cdl). For various corrosion parameters, it is well known that Rct is the factor that expresses the corrosion behavior of alloys, and its value is inversely proportional to icorr.
It was noted from the Nyquist plot that increasing the Fe amount in the alloy led to a proportional increase in the diameter of the arc/loop at both axes (Z′real and −Z″image), which indicated that, by increasing the amount of Fe, corrosion resistance of an Al-Fe alloy was increased. From Table 3, it can be concluded that, by increasing the amount of Fe in the alloy, there is a proportional increase in the values of both Rct and Rf and a decrease in Cdl and Cf. Higher values of Rct mean a substantial rise in the corrosion-resistance values of the alloy, and they are attributed to the development of an oxide layer on the surface of the fabricated Al-Fe alloys.
The expression that defines the impedance of the CPE is: ZCPE = 1/Y (jω), where j2 = −1 represents an imaginary number and n is referred to as the CPE exponent, which varies, −1 < n < 1; angular frequency (in rad s−1) is represented by ω; and Y is the CPE constant. It was reported earlier that CPEs can be assumed to be resistance, capacitance, or inductance, depending on the value of n [63]. In the current study, CPEdl specifies the twin-layer capacitors as values of n varying between 0.78 and 0.98. When the n was lower than 0.78, then it indicated that the passive layer developed on the surface was porous and nonuniform [64]. Additionally, when n was lower than 0.51–0.61, then CPEf represents Warburg impedance (W). The corrosion resistance of Al alloys in 3.5% NaCl is attributed to the formation of oxide film and/or corrosion products on the surface [65]. It was noted that Rct was lower than the value of Rf, which signified that the inner layer worked as barrier that caused resistance for corrosion protection [66]. In this investigation, EIS measurements were consistent with the trend obtained from the CP data. Both of these techniques confirm that the Al-10 wt.% Fe alloy had the highest corrosion resistance from all alloys in the 3.5% NaCl solution due to the formation of compact, adherent, and protective passive films on its surface.
The Bode-phase diagram was obtained during the EIS experiments of the pure Al and Al-Fe alloys after one hour of immersion in 3.5% NaCl solution, and the results are shown in Figure 10. It is clearly observed from this figure that total impedance values were gradually increased once the amount of Fe was increased from 2 wt.% to 10 wt.% at 0.1 Hz. As the Fe amount was increased up to 10 wt.%, corrosion resistance, i.e., total obtained impedance, was the highest due to the presence of the highest intermetallic amount in the Al-10 wt.% Fe alloys, which facilitated the formation of a passive film. It was concluded that the Al-10 wt.% Fe alloy had the highest impedance value; therefore, it gave the best resistance against corrosion. This trend implies that there was a proportional relation between increasing the percentage of iron content in the Al matrix and the corrosion resistance of the Al-Fe alloys.
Capacitive behavior due to the presence of two time constants, typically as in passive materials, can be clearly noticed from the Bode plot (Figure 10). The phase angle was shifted from −60° for pure Al to −80° for Al-10 wt.% Fe at a middle studied frequency, which revealed the capacitive properties of the film. Shifting in phase-angle maxima in a broad range of middle frequency at −80° revealed that, after exposure to the NaCl solution, the surface became homogeneous and resistive due to the formation of a passive film. This result indicates that there formed a thin, stable layer at the alloy/solution interface that covered the surface of the Al-Fe alloys. Pure Al showed phase-angle maxima at −60°, suggesting that the surface became nonhomogeneous and defective; thus, corrosion resistance was the lowest among all samples.

3.2. Characterization of Corroded Alloys

SEM micrographs of the corroded pure Al sample surface after one hour of immersion in 3.5% NaCl solution are shown in Figure 11a. This figure indicates that the Al sample surface was mostly corroded with pit formation as well as flakes and crackers due to the localized attack of chloride ion on the Al matrix [67]. Pit formation on the surface was correlated with the CP results where anodic current density increased dramatically after Ecorr. EDS analysis (arrow mark from Figure 11a) showed 76.74% Al, 10.21% O, 5.38% Na, and 7.67% Cl on the corroded surface. The reduction in the amount of Al from 100% to 76.74% was due to the deterioration of the pure Al sample. The most possibly corrosive product was the development of an aluminum oxide/hydroxide layer with NaCl deposition on the surface. Aluminum oxide/hydroxide layer acts like a protection film that protects the surface from corrosion.
SEM images and EDS analysis of the Al-10 wt.% Fe alloys after corrosion are shown in Figure 11b. Corrosion products are regularly deposited over the alloy surface. EDS analysis (arrow mark from Figure 11b) showed 68.93% Al, 7.56% Fe, 9.66% O, 5.67% Na, and 8.18% Cl in wt.% on the surface, which represent corrosion products, while analysis before the corrosion experiment showed it was 90% Al and 10% Fe. The reduction in the amount of Al and Fe after exposure in the NaCl solution suggested that Al and Fe deteriorated where their amount was reduced to around 23% and 24%, respectively, due to the formation of corrosion products on the surface. The presence of a high amount of oxygen in corrosion products proved that a thick corrosion layer was formed that covered the entire alloy surface. The white particles in corrosion products (Figure 11b) were mostly Na and Cl, which revealed the presence of NaCl (from the solution) deposited onto the surface of the Al-10 wt.% Fe alloys.
In the current study, due to the presence of many active centers and the large surface area in the pure Al sample, the reported corrosion-resistance value was lower than that of the Al-Fe alloys. Corrosion-resistance improvement in the Al-Fe alloys was attributed to the combined effect of alloying (Fe addition) and the usage of high-energy ball milling. The ball-milling process extended the mixing of Fe in Al and produced a homogeneous mixture of Al-Fe alloys that hindered pitting corrosion and its influencing abilities for passivation [68]. Corrosion resistance can be improved by mixing Fe in Al, which increases passivation kinetics, stabilizes the passive film, and decreases the difference between the intermetallic bonds and the electrochemical characteristics of the matrix [69].
Consequently, from the characterization information of the fabricated alloys, it was confirmed that the addition of Fe passivated the Al to a higher level by minimizing both pitting and uniform corrosion. By increasing Fe by up to 10 wt.% as an alloying element to Al, the corrosion behavior of the alloy was proportionally enhanced.
The XRD results of corrosion products formed on the pure Al and Al-10 wt.% Fe alloys, along with the respective diffraction patterns and JCPDS number, are shown in Figure 12, which clearly indicates the existence of multiple phases. Pure Al showed Al, α-Al(OH)3 (Bayerite, JCPDS: 83-2256) and NaCl (JCPDS: 88-2300). The Al-10 wt.% Fe alloys contained intermetallic compounds (Al13Fe4 and Al6Fe) along with Al, α-Al(OH)3, γ-Fe2O3 (maghemite, JCPDS: 39-1346), and NaCl. The formation of NaCl in the corrosion products of pure Al and Al-10 wt.% Fe came from the studied solution that was deposited onto the surface. From the XRD results of the corrosion products formed on the Al-10 wt.% Fe alloys, it can be found that the number of Al6Fe peaks are identical as those present after the attrition and sintering process (Figure 3), whereas some Al13Fe4 peaks disappeared in the corrosion products, which might be attributed to the transformation of Al13Fe4 into γ-Fe2O3 and α-Al(OH)3. Intermetallic Al6Fe is very stable and does not allow itself to be dissolved, whereas Al13Fe4 facilitates preferential dissolution [67] and is transformed into a stable form of oxide/hydroxide (γ-Fe2O3 and α-Al(OH)3) in NaCl solution. γ-Fe2O3 and α-Al(OH)3 are thermodynamically stable phases of iron oxides and aluminum hydroxide, respectively. It was also reported by other researchers that Al-Fe alloys provide protection against corrosion due to the formation of iron and aluminum hydroxide/oxide as a passive film exposed to NaCl solution [54,58]. Al-10 wt.% Fe alloys provide protection to corrosion due to the presence of γ-Fe2O3 as well as α-Al(OH)3 as corrosion products, which are protective, adherent, and stable in nature. A pure Al corrosion product, on the other hand, showed an absence of γ-Fe2O3. Thus, the corrosion resistance of Al-10 wt.% Fe was greater than that of pure Al in NaCl solution. XRD data of the corrosion products correlate with SEM and EDS results, which leads us to conclude that Al-10 wt.% Fe alloys show the presence of an oxide/hydroxide layer/film on the surface leading to an enhancement of corrosion resistance.

4. Conclusions

Using a powder-metallurgy scheme, Al with zero (pure), 2 wt.%, 5 wt.%, and 10 wt.% Fe in Al were successfully fabricated in two-step processes, the MA technique for mixing followed by HFIS for consolidation. The following conclusions can be drawn from the present study:
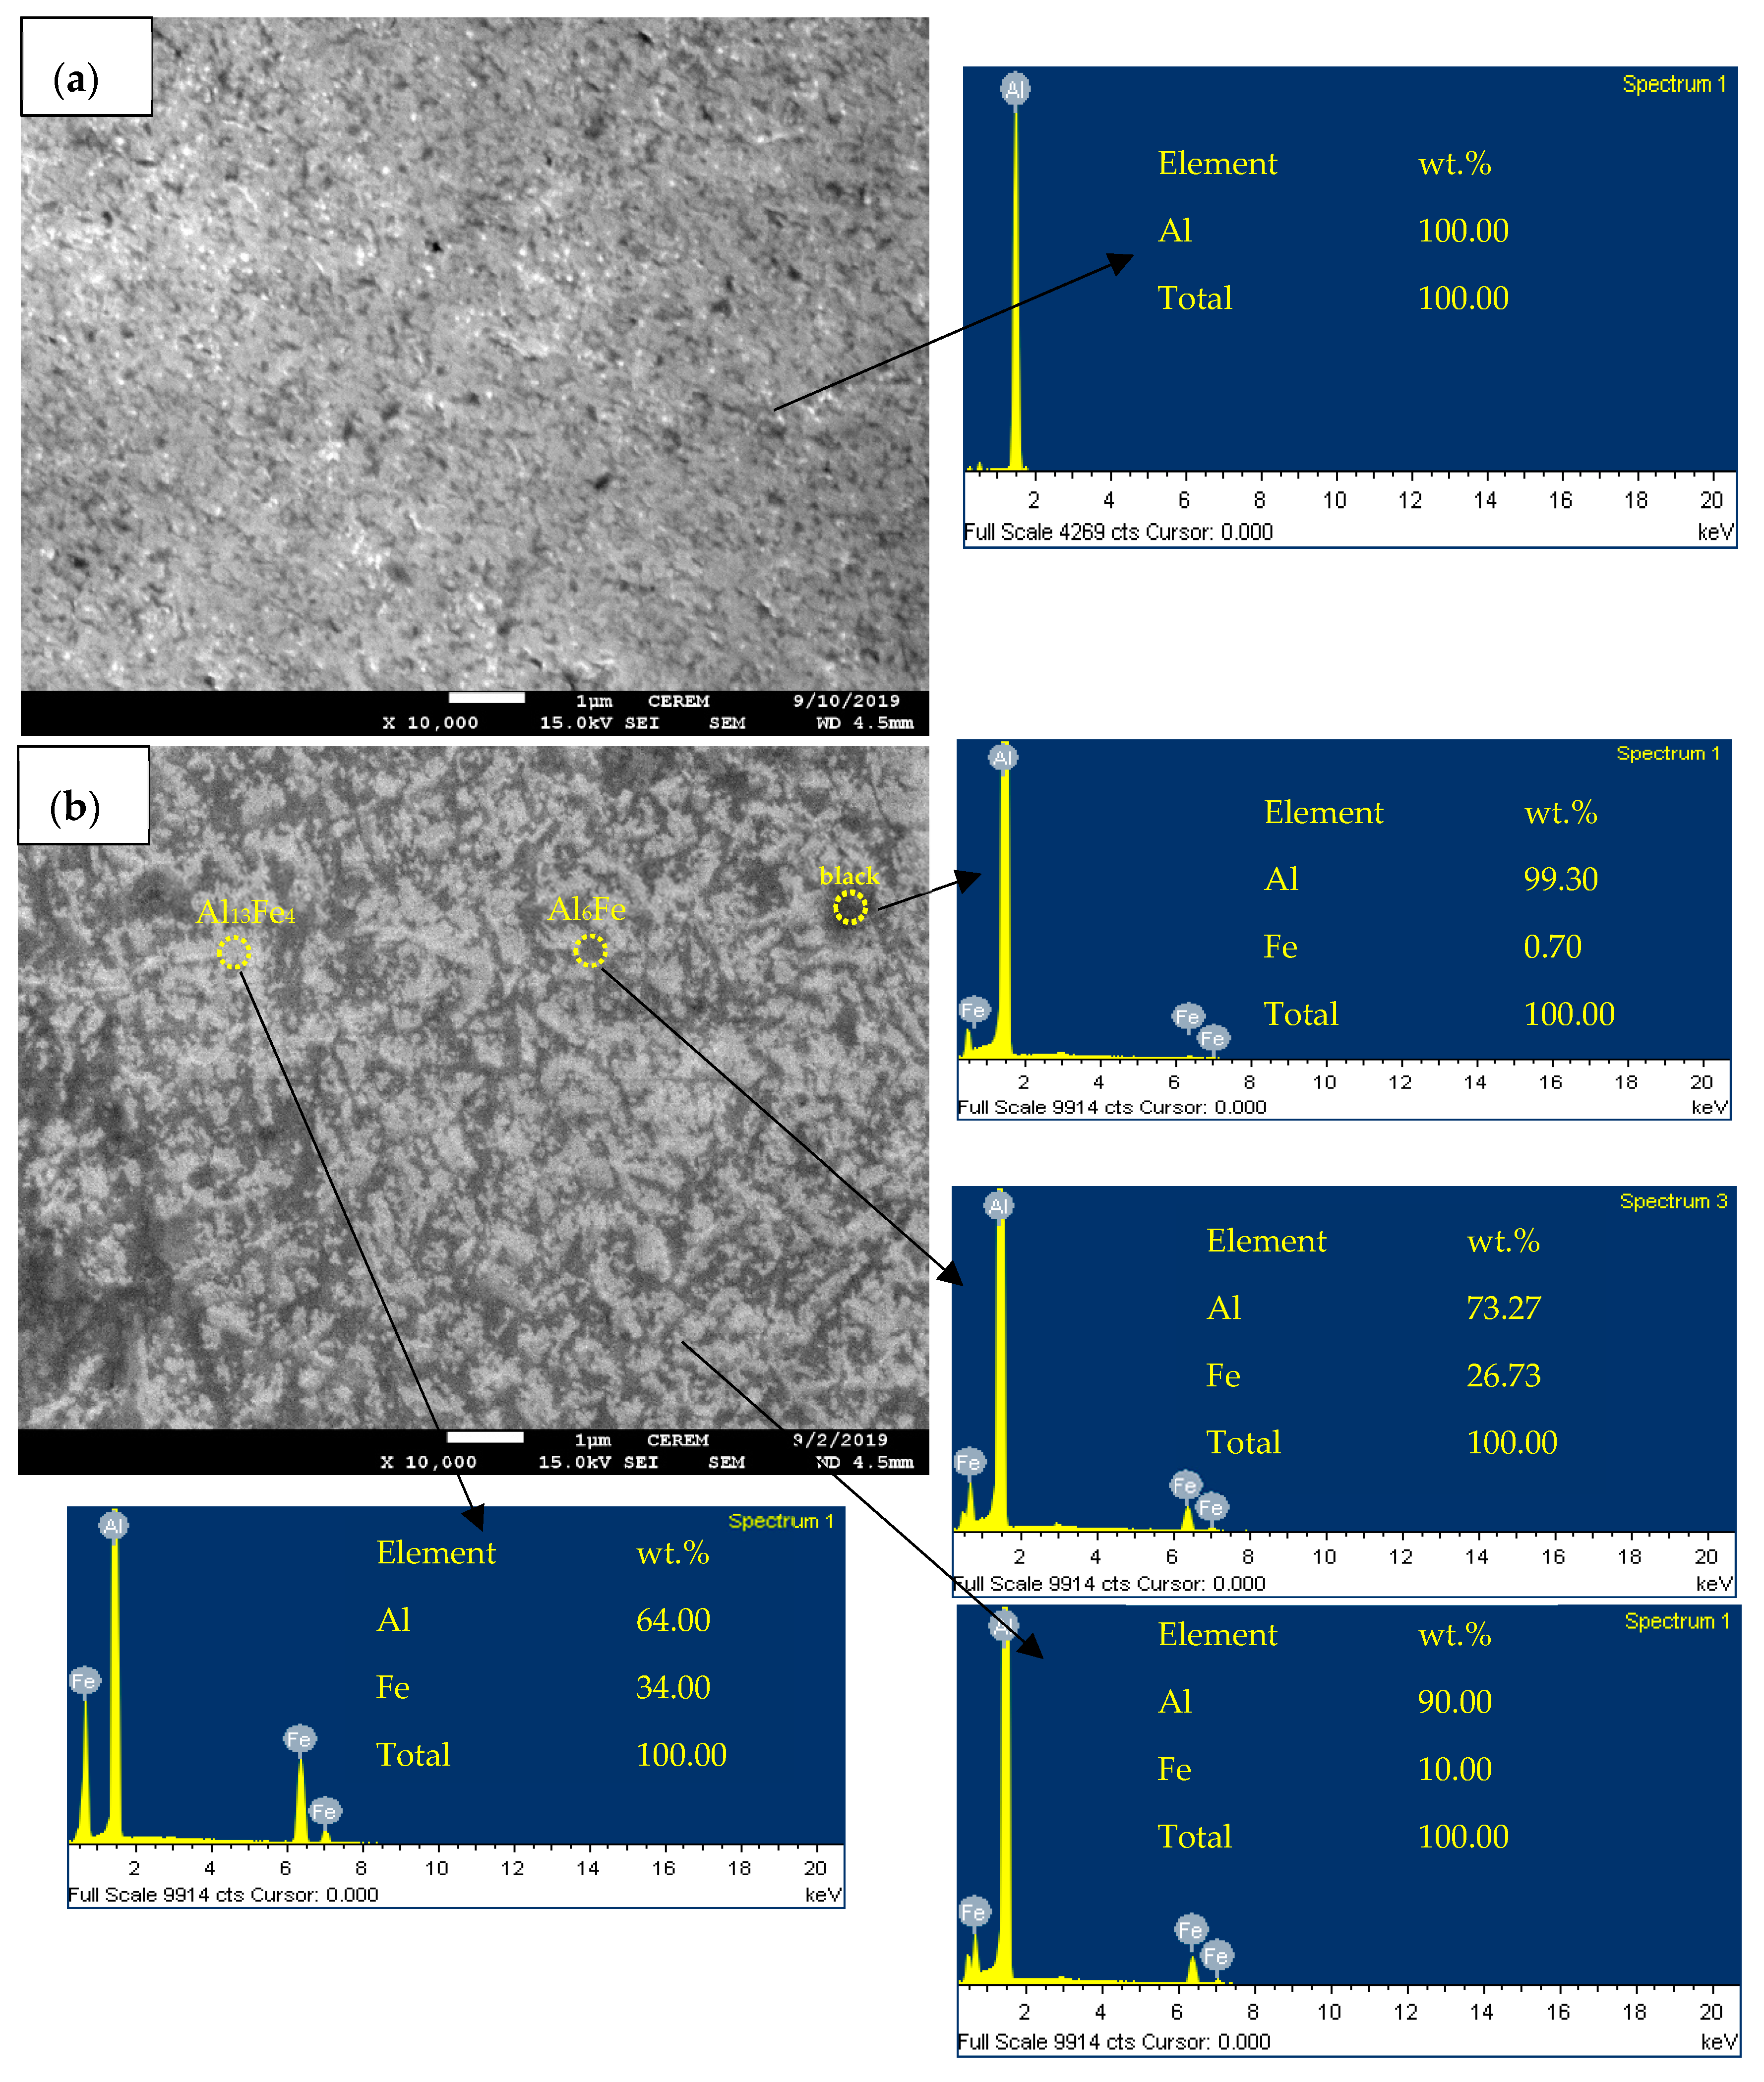
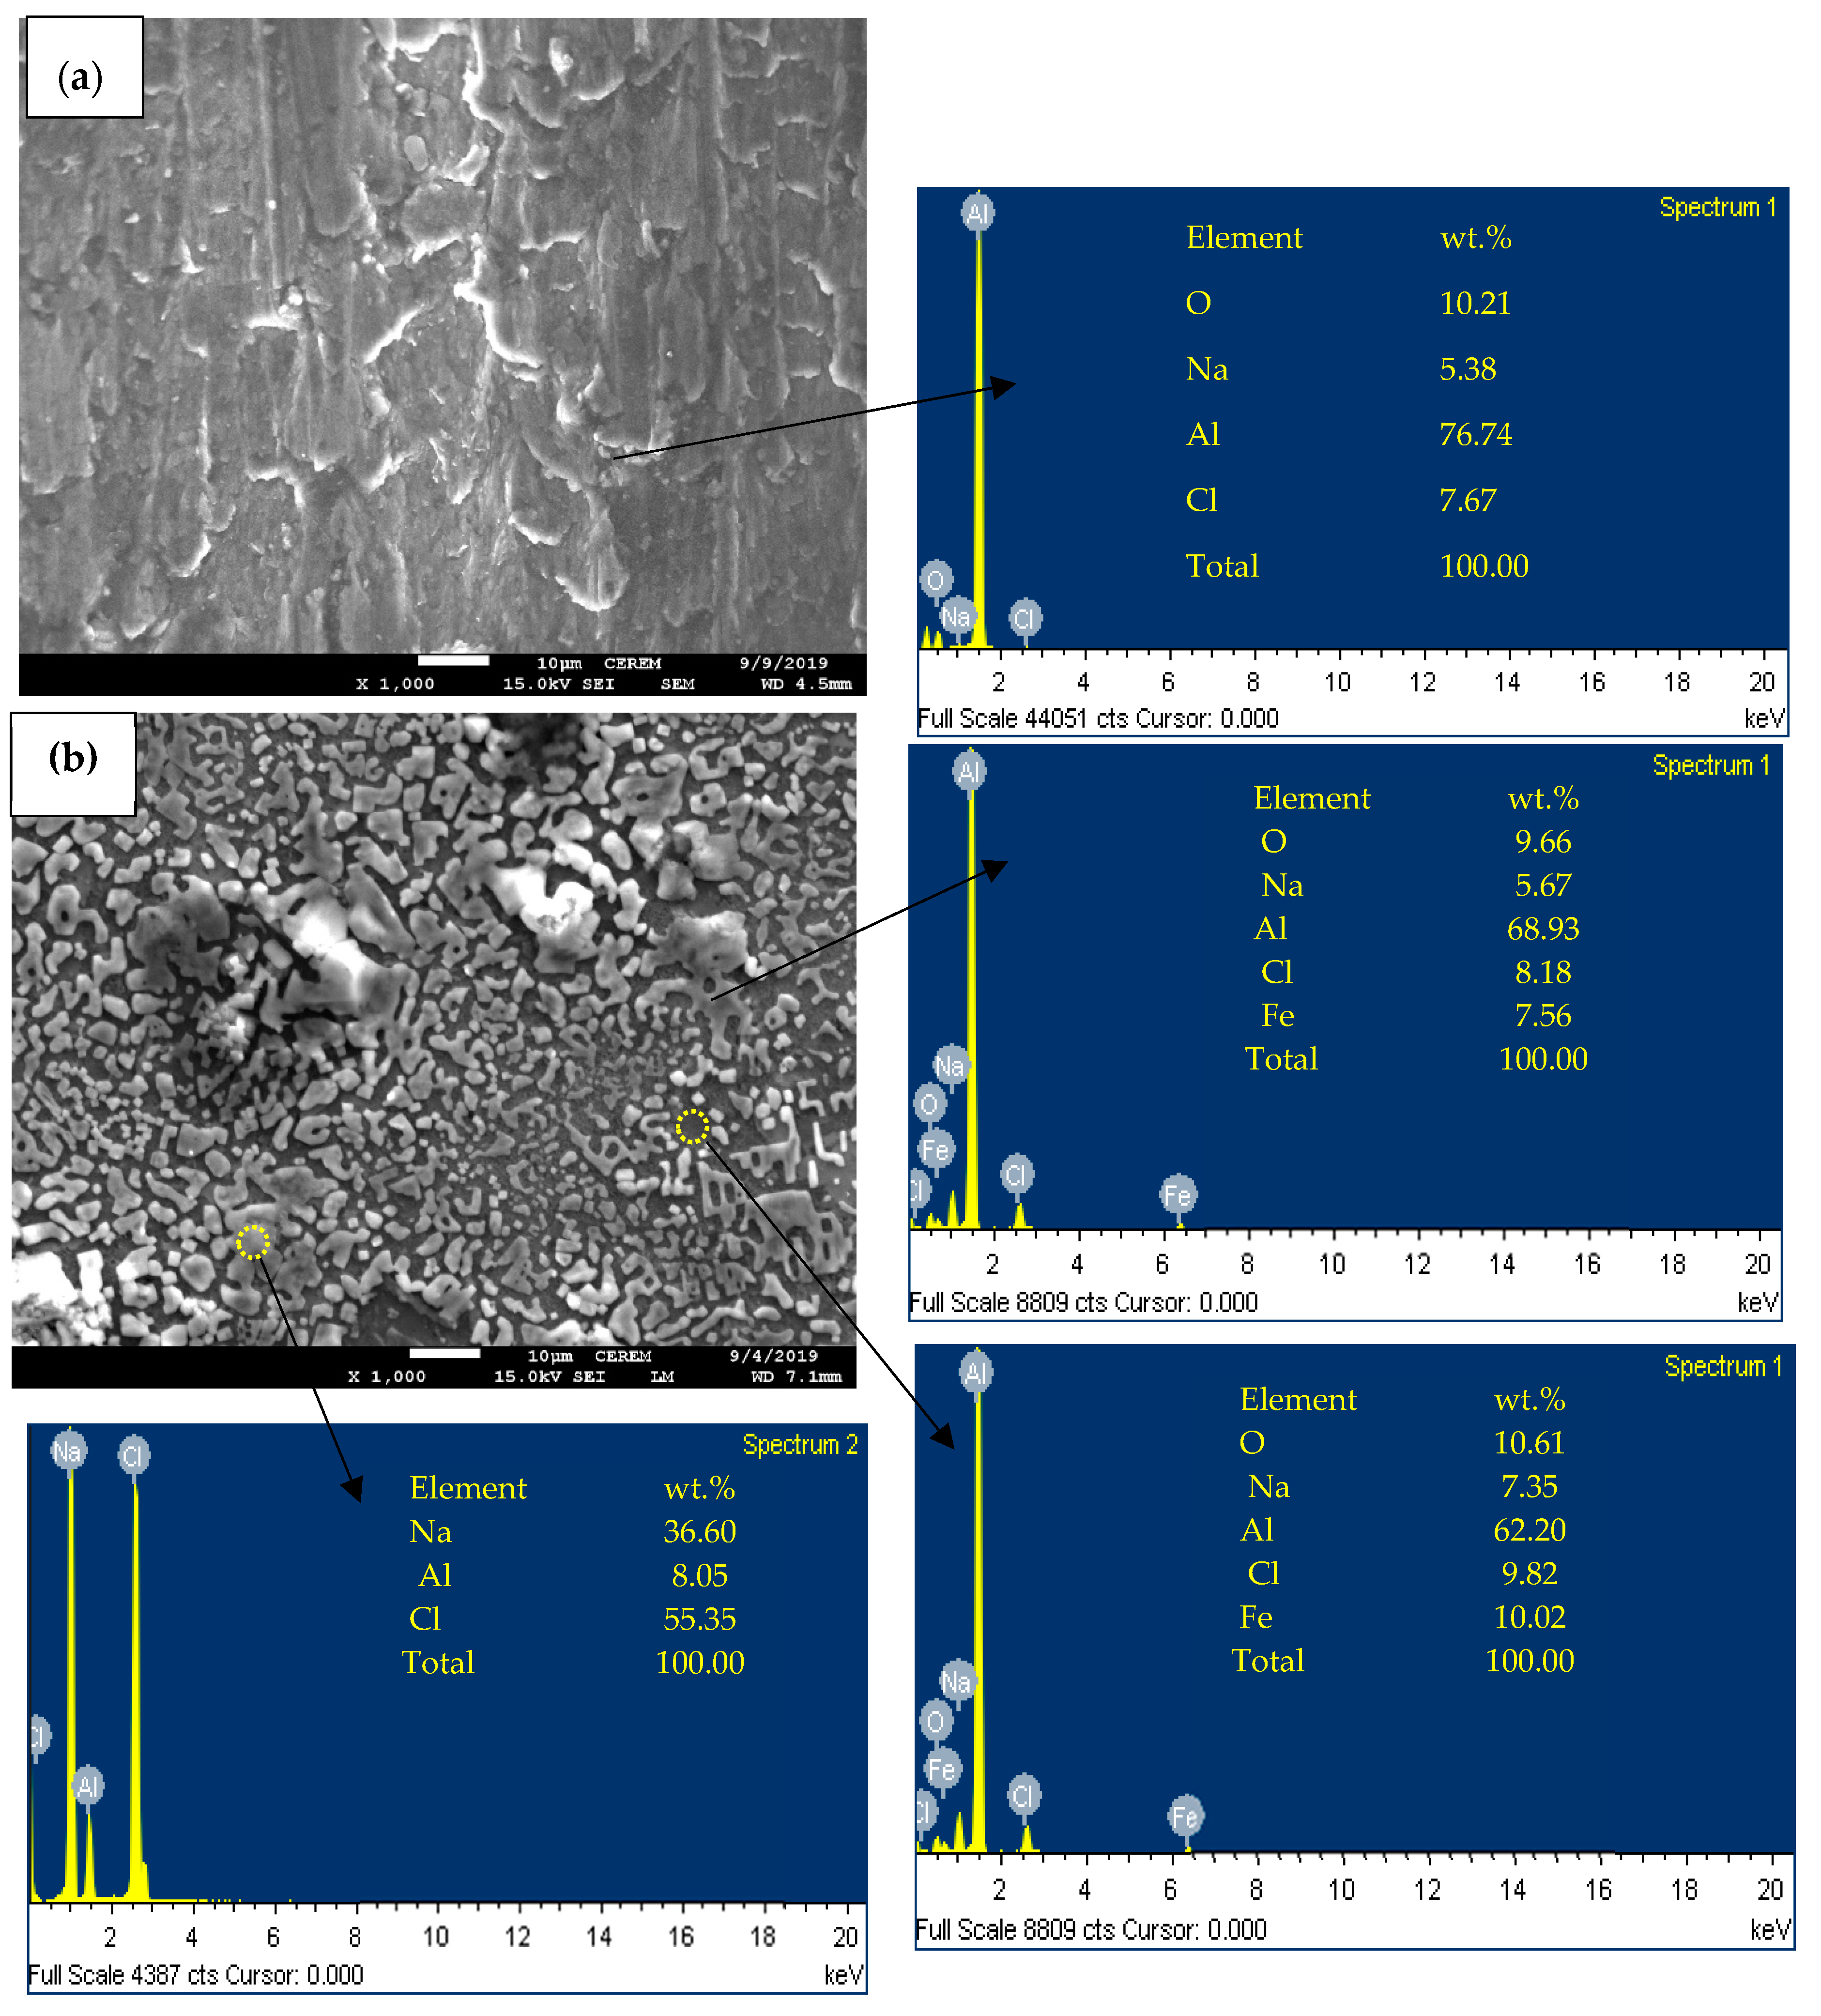
  • Uniform distribution of Fe in an Al matrix was revealed by FESEM and EDS mapping, achieved by the combined process of MA and HFIS.
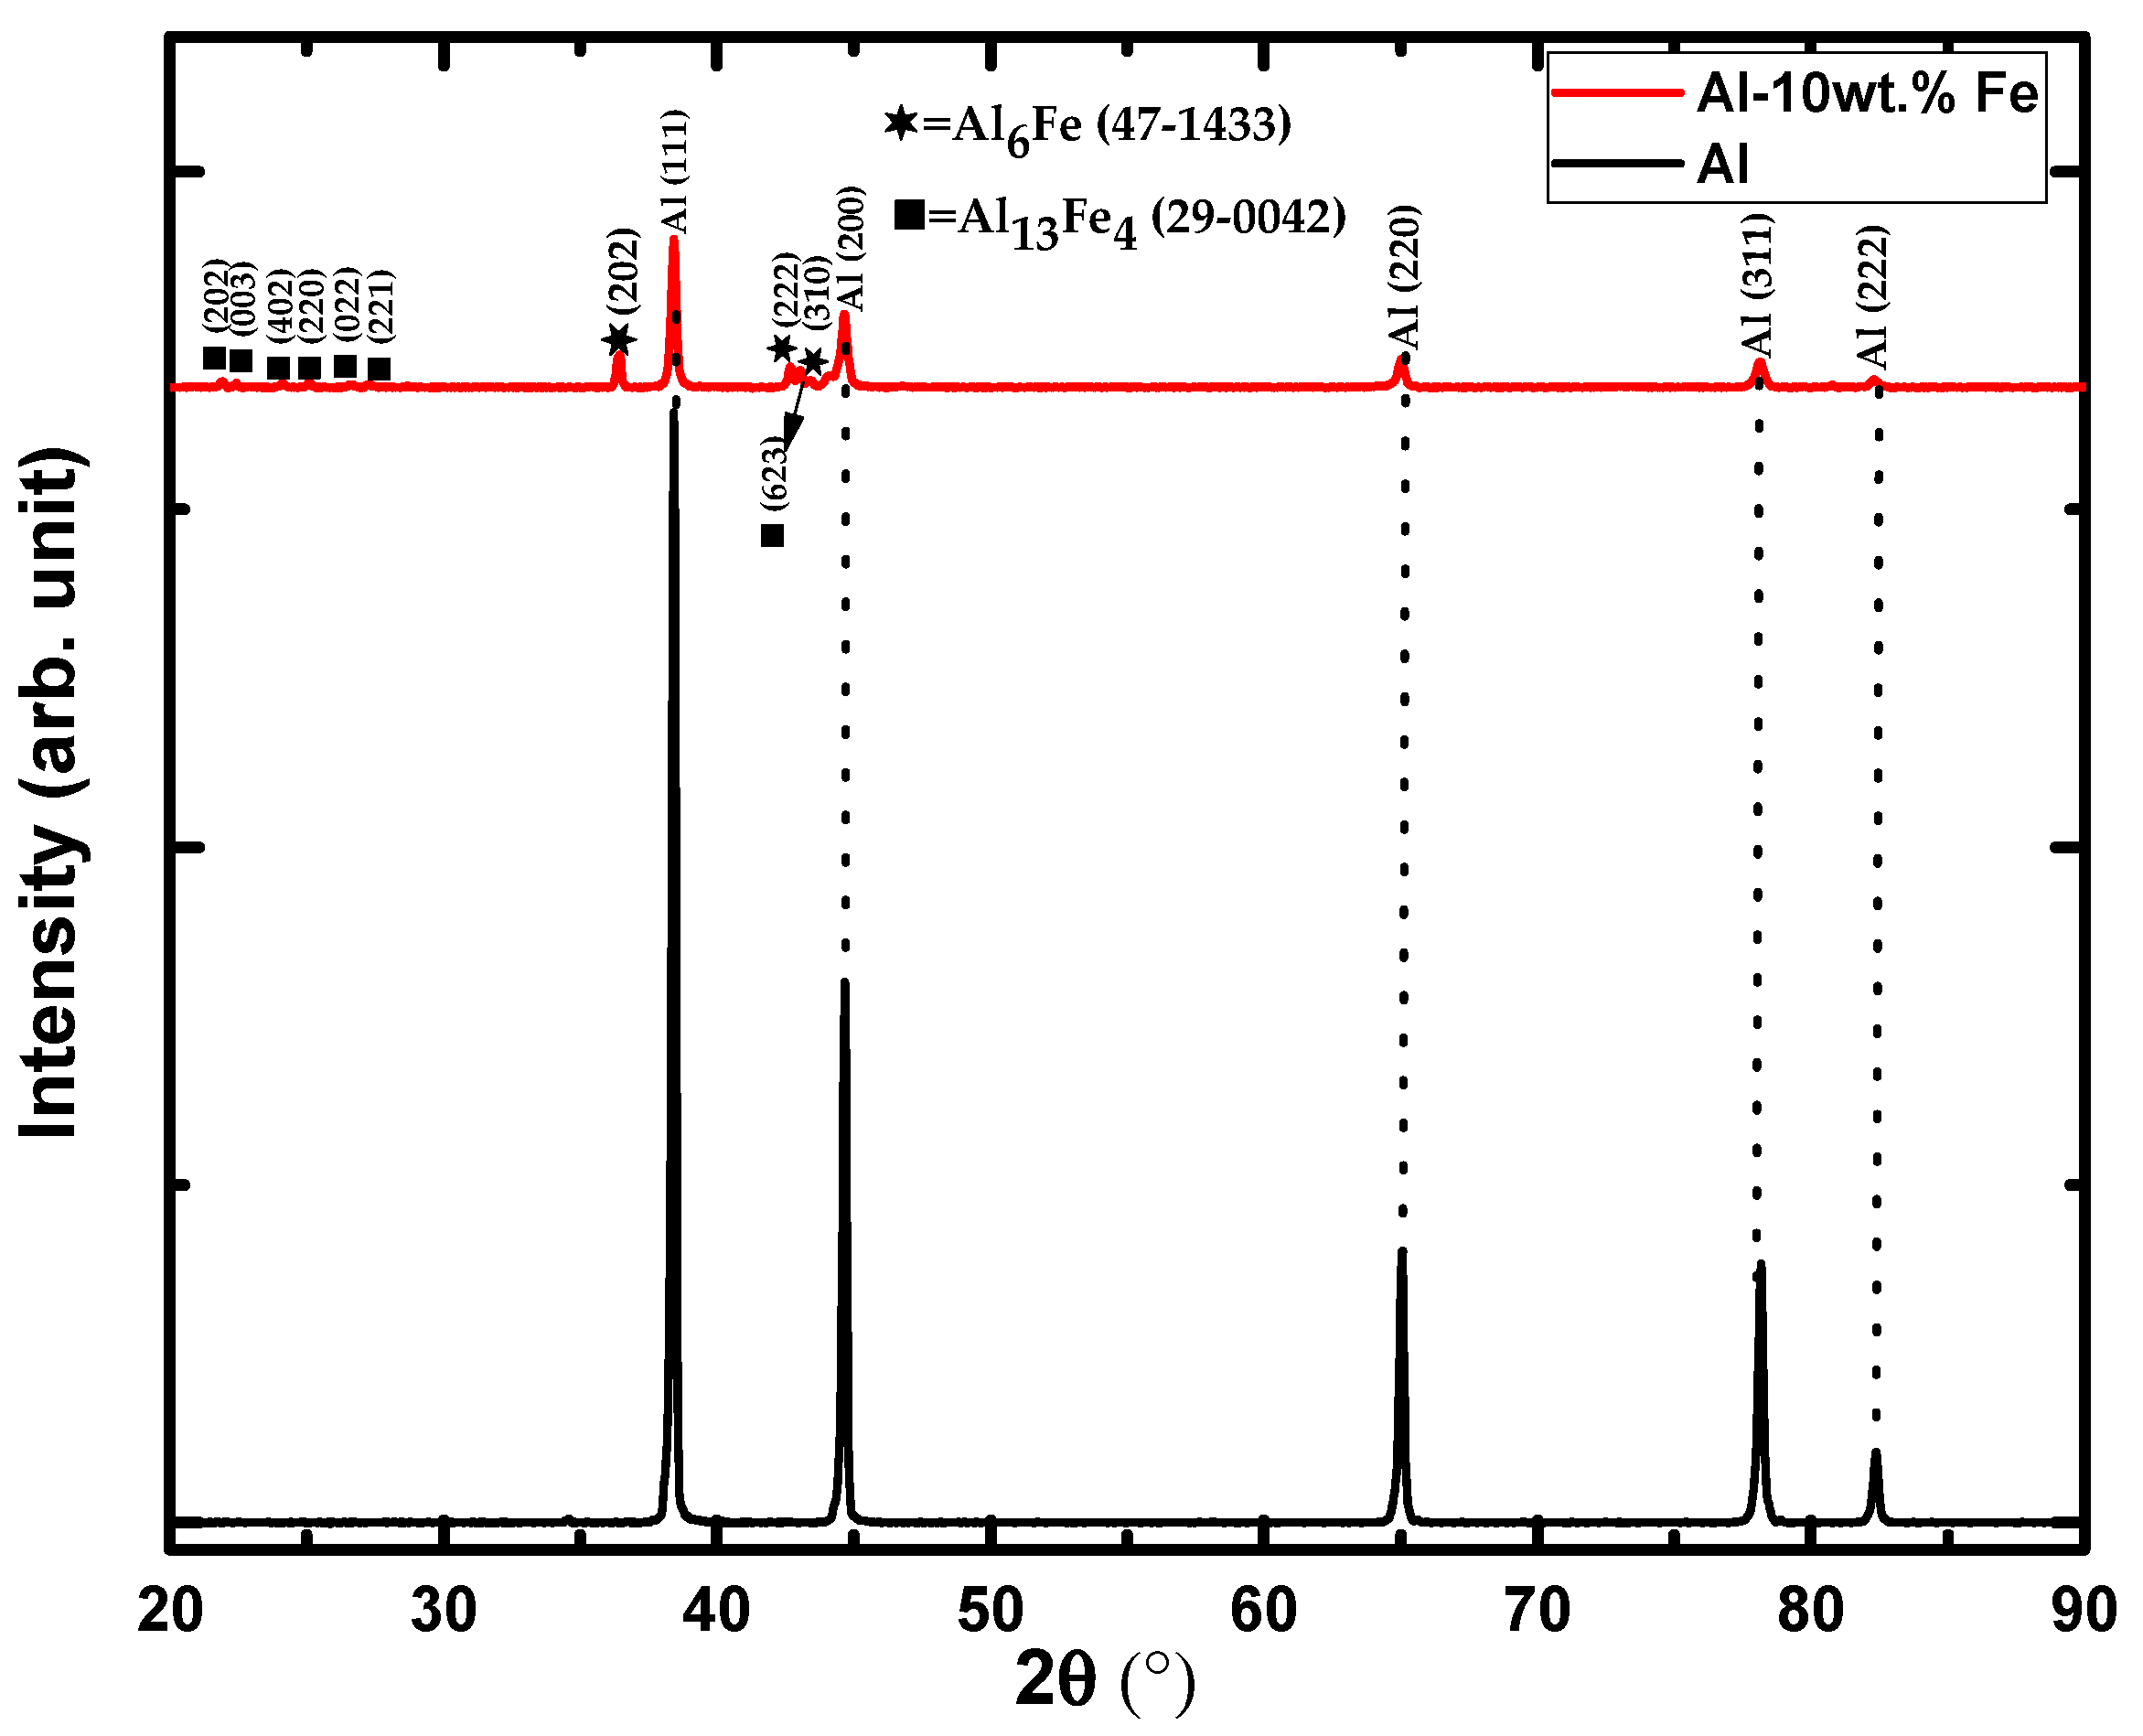
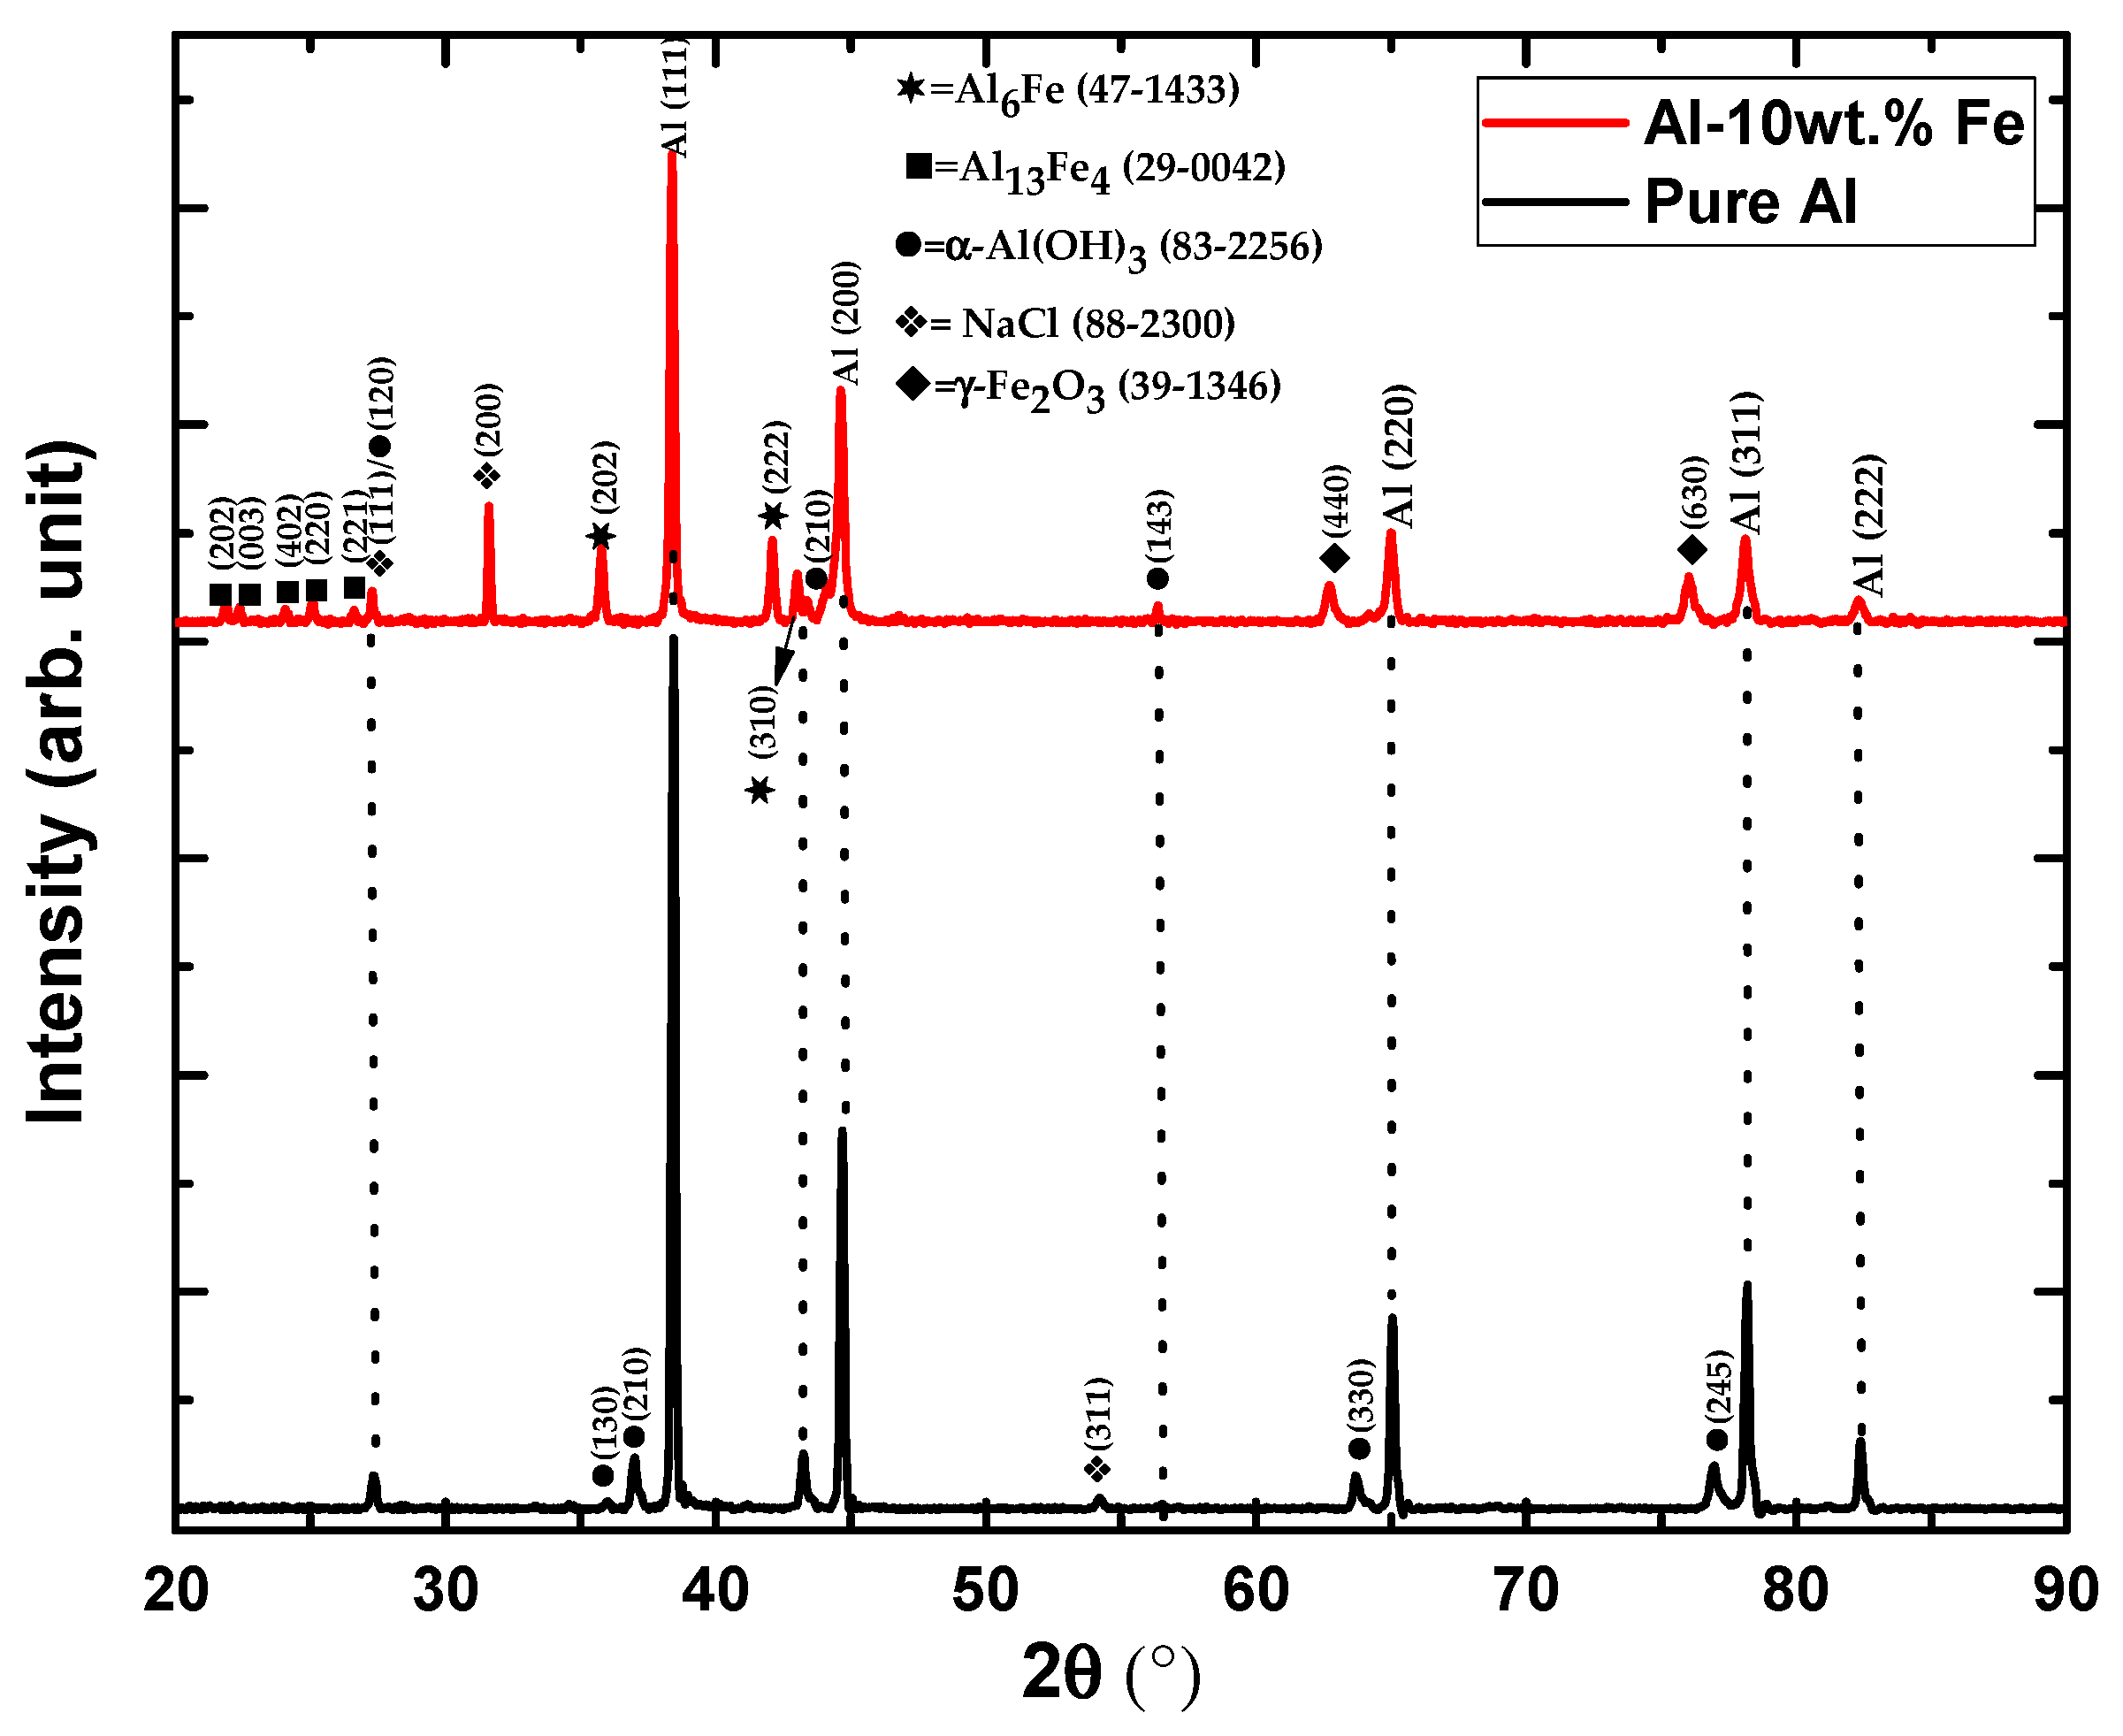
  • XRD results confirmed that as the Fe amount was increased in the Al-Fe alloys, intermetallic-compound, i.e., Al6Fe and Al13Fe4, formation was increased.
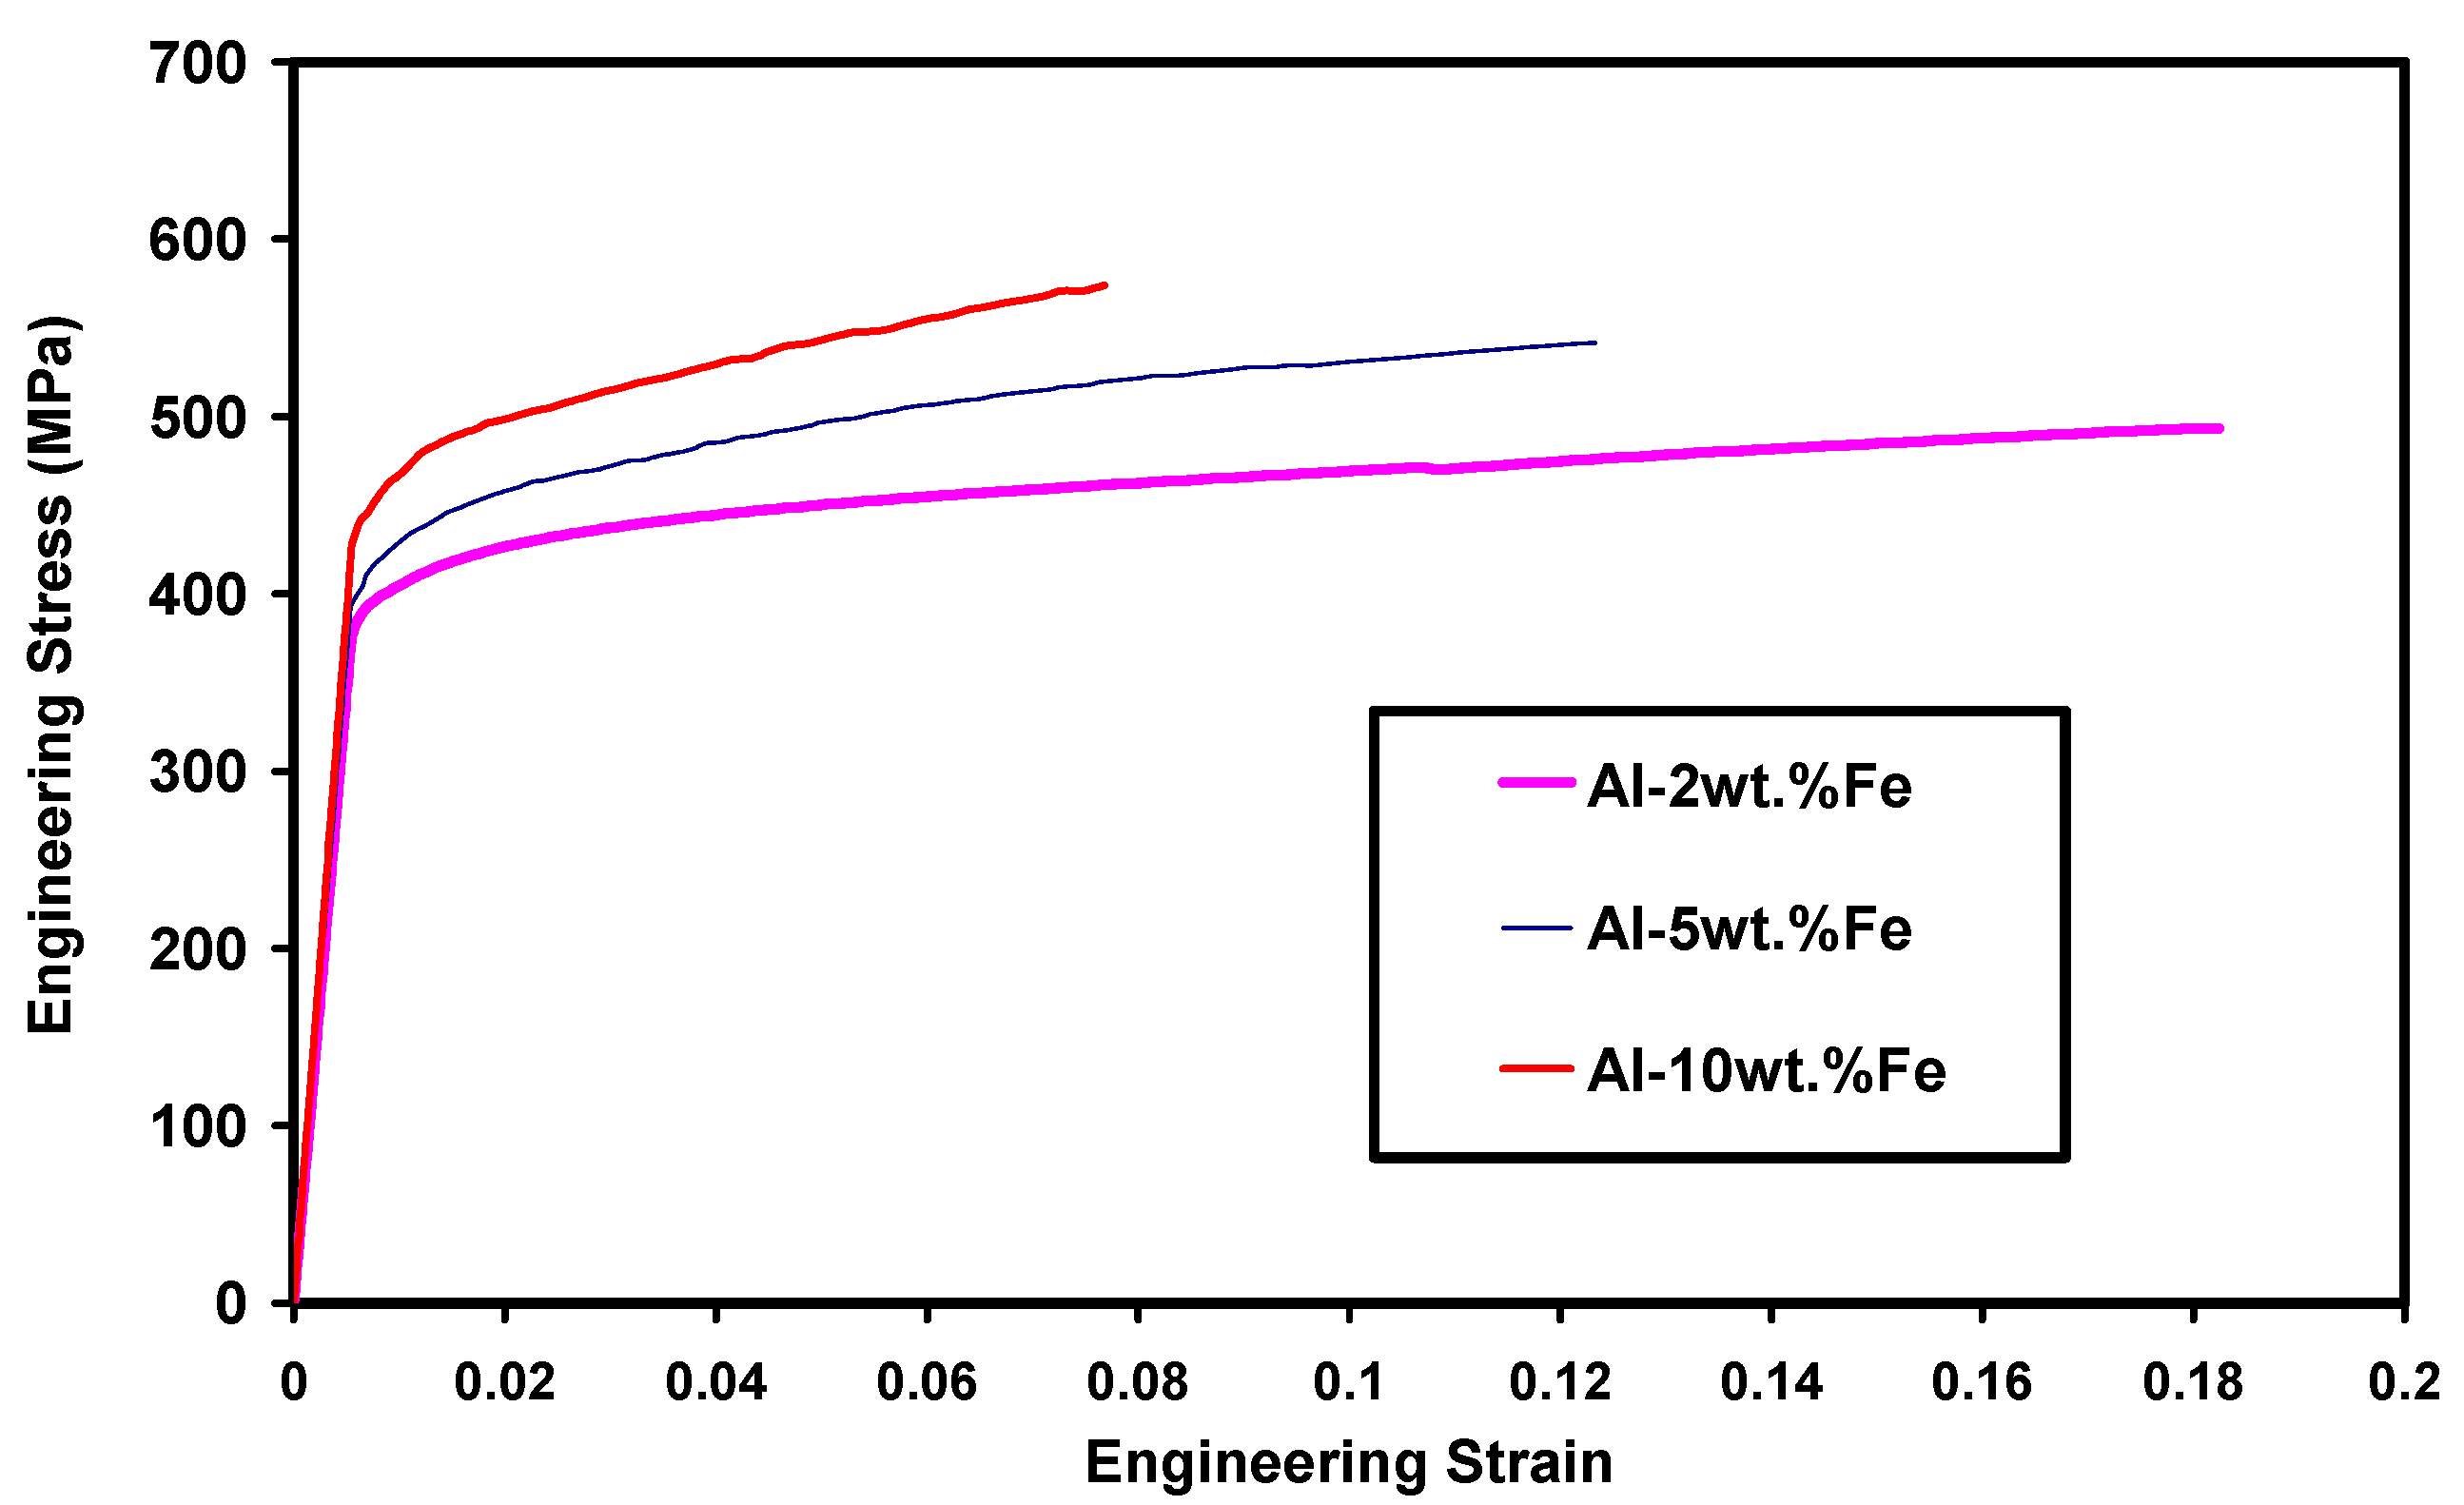
  • The presence of intermetallic compounds enhanced the hardness of the Al-Fe alloys due to the influence of grain-size refinement, where the crystallite size was decreased after the addition of Fe in Al.
  • Addition of Fe in the Al matrix facilitated the formation of a passive film in the NaCl solution as well as the dramatic decrease of the corrosion rate compared to pure Al.
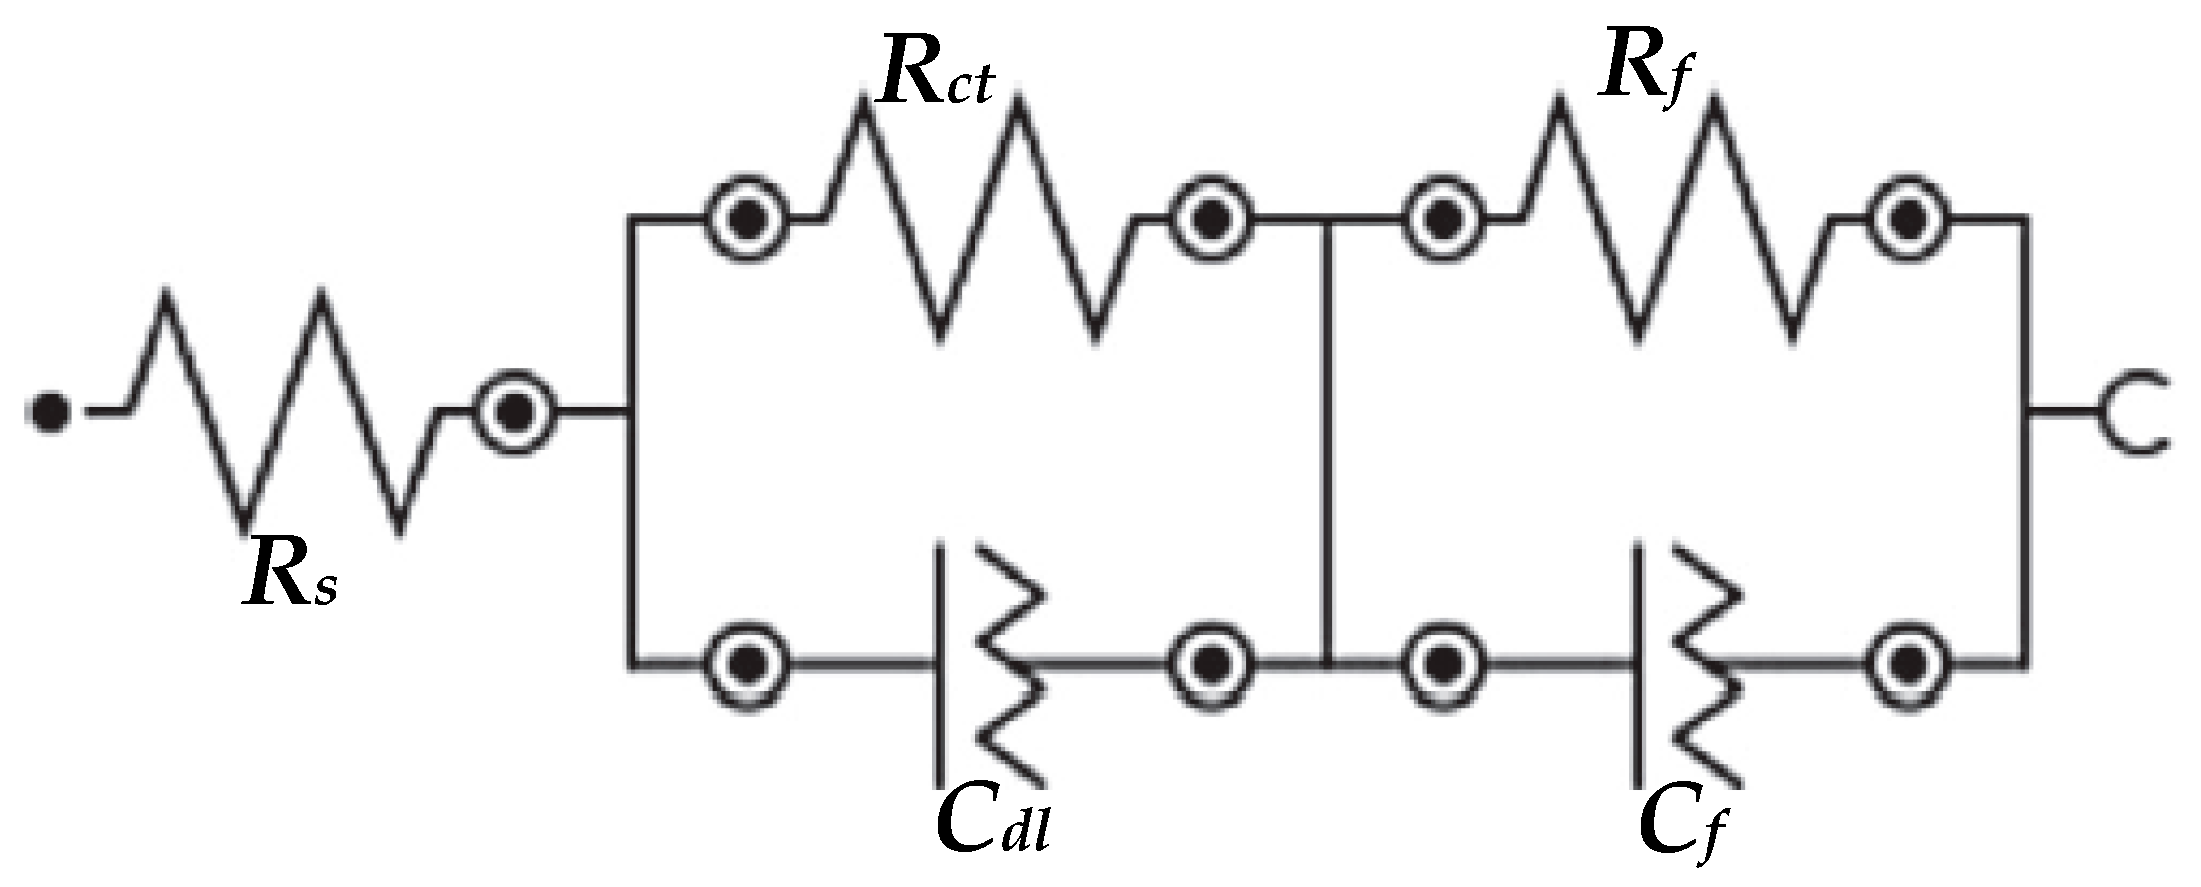
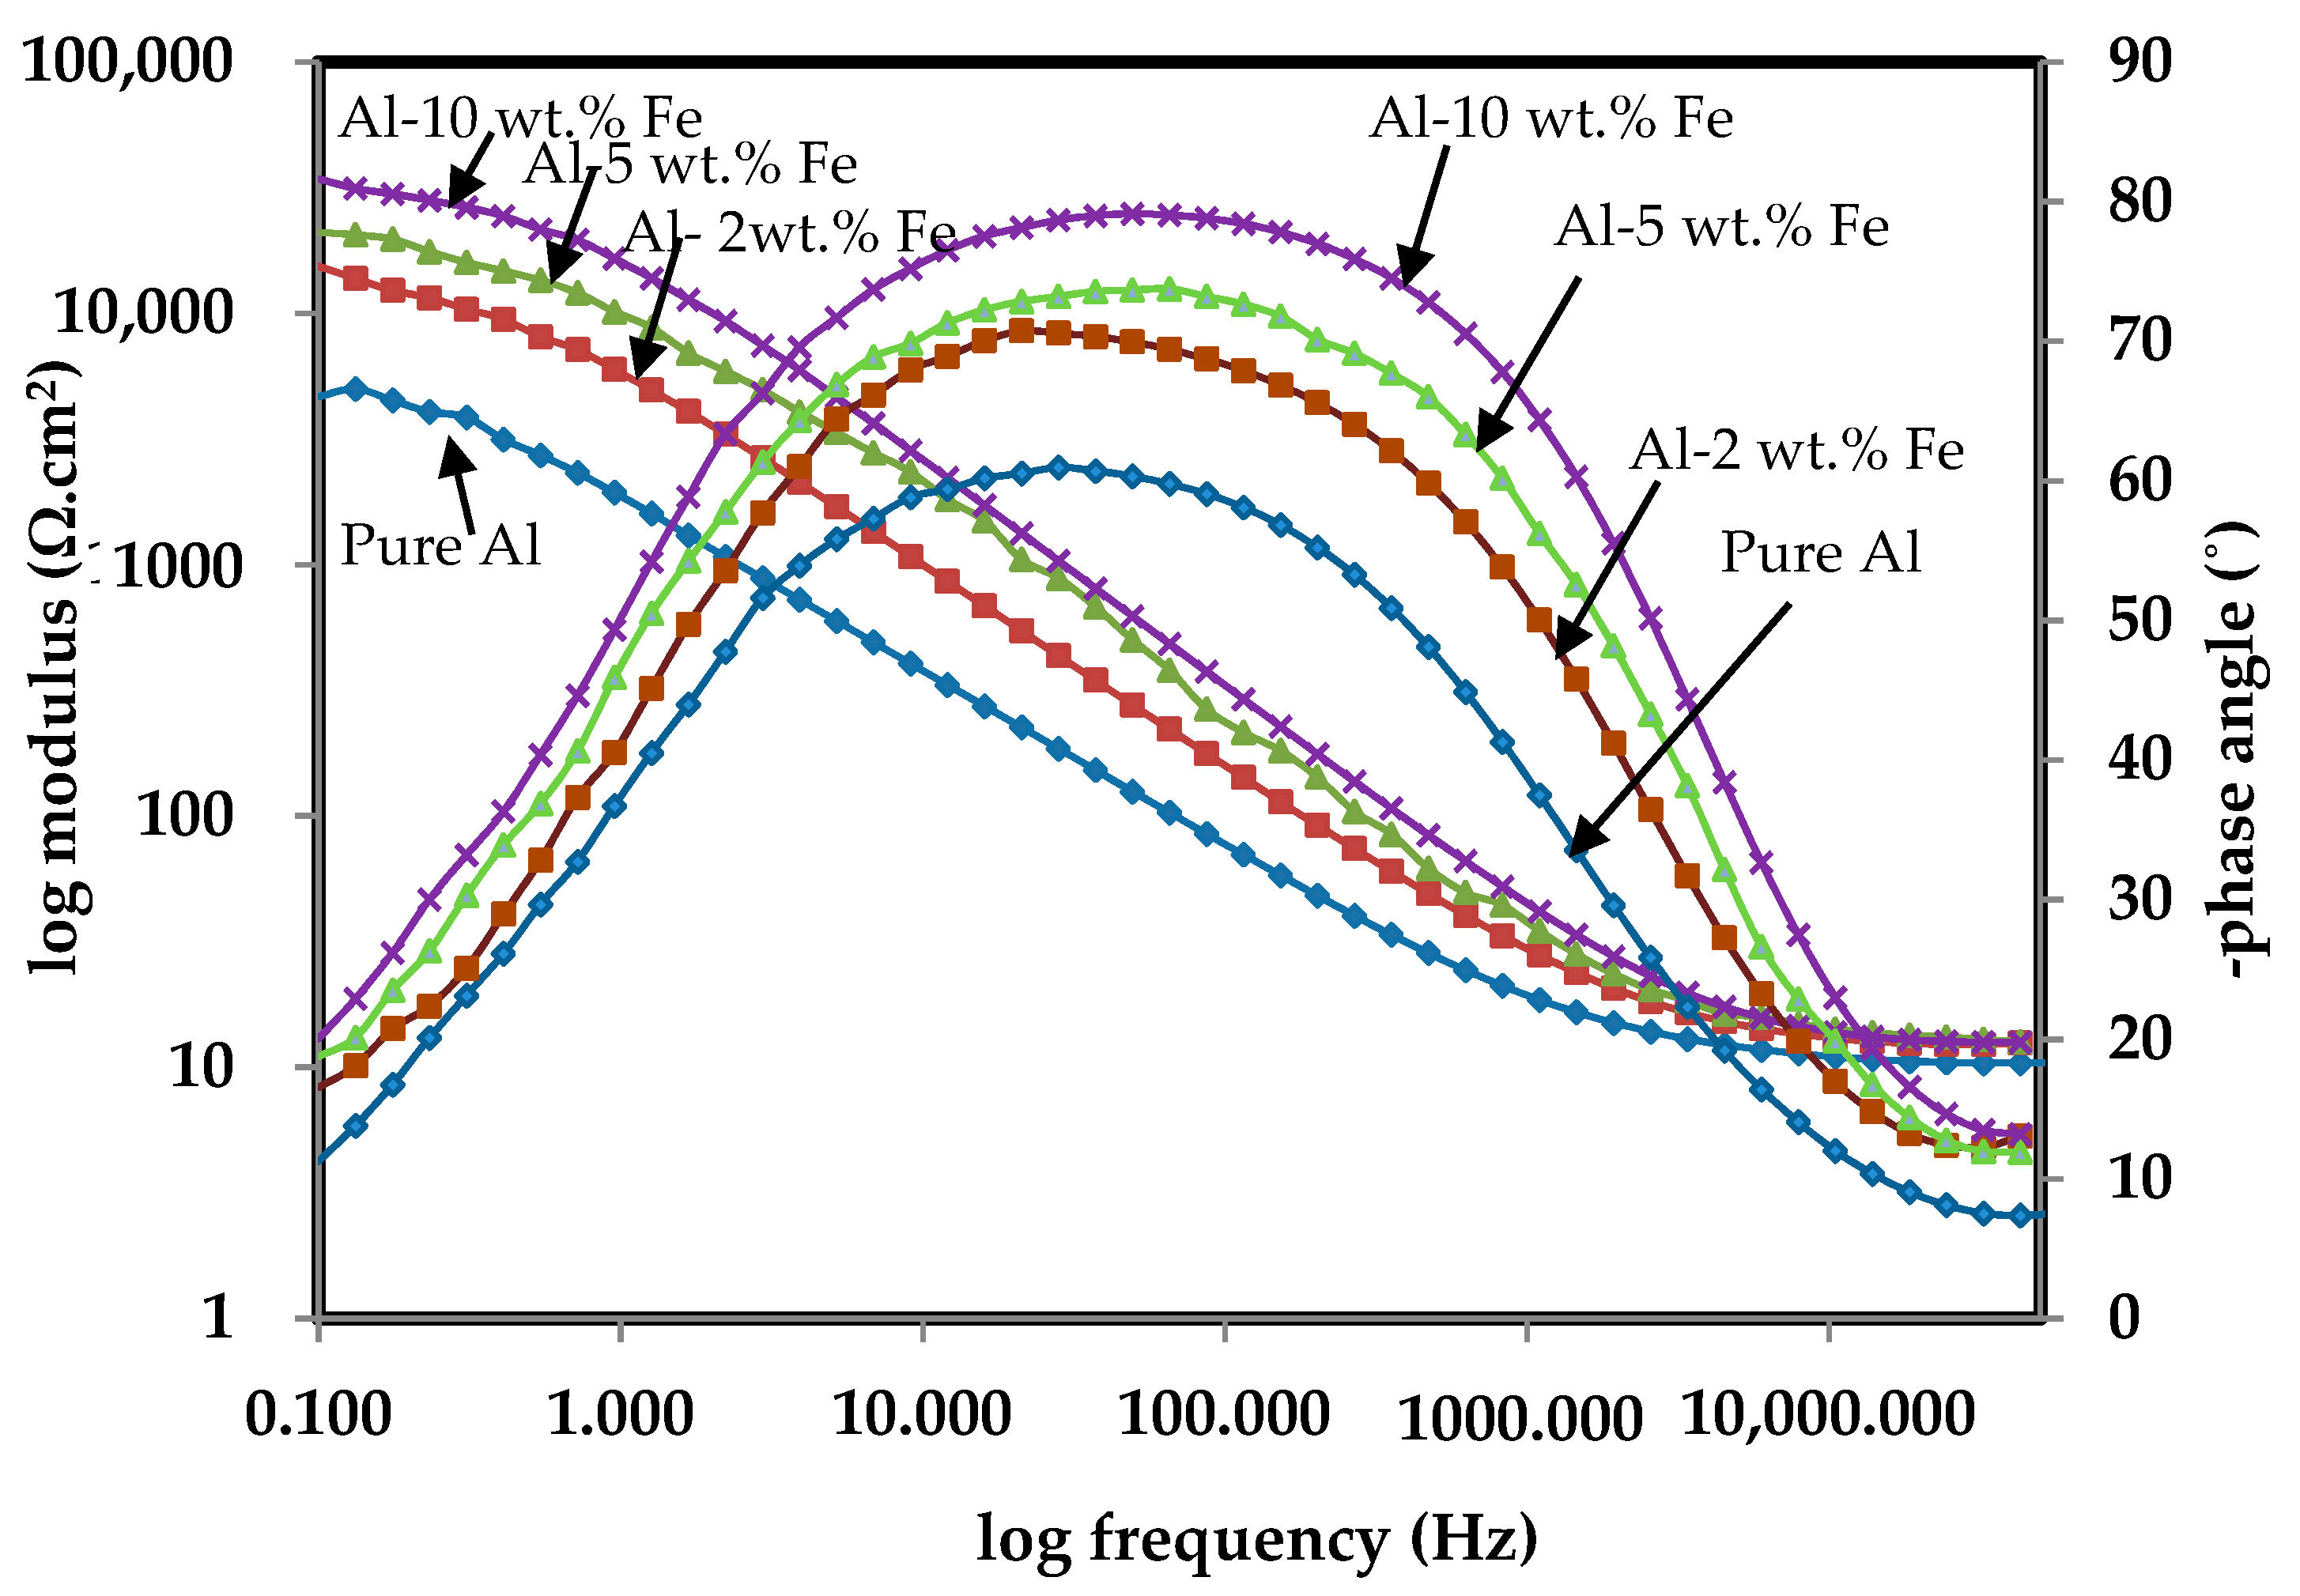
  • EIS studies confirmed that the improved Rct and Rf in Al-Fe alloys compared to pure Al was due to the formation of a protective film on the alloy surface.
  • SEM micrographs of the corrosion products formed on the Al-10 wt.% Fe alloys exhibited regular deposition, while pure Al showed pits, craters, and flakes due to the localized attack of chloride ions on the surface.
  • XRD results of the corrosion products confirmed the formation of γ-Fe2O3 and α-Al(OH)3 on the Al-10 wt.% Fe alloys, which are protective, adherent, and stable in nature, whereas pure Al corrosion products showed an absence of γ-Fe2O3.

Author Contributions

Conceptualization, A.H.S.; data curation, J.K.S., J.A.M. and H.S.A.; formal analysis, J.K.S., M.B., J.A.M. and H.S.A.; funding acquisition, A.H.S. and N.H.A.; investigation, A.H.S. and M.B.; methodology, J.A.M., M.L., A.R.K. and H.S.A.; resources, N.H.A.; supervision, A.H.S. and N.H.A.; writing—original draft, A.H.S., J.K.S., J.A.M., M.L., A.R.K., M.B., H.S.A. and N.H.A.; writing—review and editing, A.H.S., J.K.S., M.L., A.R.K., M.B., J.A.M., H.S.A. and N.H.A.

Funding

This research received no external funding.

Acknowledgments

The authors would like to extend their sincere appreciation to the Deanship of Scientific Research at King Saud University for its funding of this research through Research Group Project No. RG-1439-029.

Conflicts of Interest

The authors declare no conflict of interest.

References

  1. Froes, F.H.; Pickens, J.R. Powder metallurgy of light metal alloys for demanding applications. JOM J. Miner. Met. Mater. Soc. 1984, 36, 14–28. [Google Scholar] [CrossRef]
  2. Pickens, J.R. Aluminium powder metallurgy technology for high-strength applications. J. Mater. Sci. 1981, 16, 1437–1457. [Google Scholar] [CrossRef]
  3. Suryanarayana, C. Mechanical alloying and milling. Prog. Mater. Sci. 2001, 46, 1–184. [Google Scholar] [CrossRef]
  4. Lyle, J.P.; Cebulak, W.S. Powder metallurgy approach for control of microstructure and properties in high strength aluminum alloys. Metall. Trans. A 1975, 6, 685. [Google Scholar] [CrossRef]
  5. Prabhu, B.; Suryanarayana, C.; An, L.; Vaidyanathan, R. Synthesis and characterization of high volume fraction Al-Al2O3 nanocomposite powders by high-energy milling. Mater. Sci. Eng. A 2006, 425, 192–200. [Google Scholar] [CrossRef]
  6. Lu, L.; Zhang, Y.F. Influence of process control agent on interdiffusion between Al and Mg during mechanical alloying. J. Alloy. Compd. 1999, 290, 279–283. [Google Scholar] [CrossRef]
  7. Miracle, D.B. Metal matrix composites—From science to technological significance. Compos. Sci. Technol. 2005, 65, 2526–2540. [Google Scholar] [CrossRef]
  8. Torralba, J.M.; Da Costa, C.E.; Velasco, F. P/M aluminum matrix composites: An overview. Proc. J. Mater. Process. Technol. 2003, 133, 203–206. [Google Scholar] [CrossRef]
  9. Sasaki, T.T.; Mukai, T.; Hono, K. A high-strength bulk nanocrystalline Al-Fe alloy processed by mechanical alloying and spark plasma sintering. Scr. Mater. 2007, 57, 189–192. [Google Scholar] [CrossRef]
  10. Osório, W.R.; Freire, C.M.; Garcia, A. The effect of the dendritic microstructure on the corrosion resistance of Zn-Al alloys. J. Alloy. Compd. 2005, 397, 179–191. [Google Scholar] [CrossRef]
  11. Ralston, K.D.; Fabijanic, D.; Birbilis, N. Effect of grain size on corrosion of high purity aluminium. Electrochim. Acta 2011, 56, 1729–1736. [Google Scholar] [CrossRef]
  12. Osório, W.R.; Spinelli, J.E.; Ferreira, I.L.; Garcia, A. The roles of macrosegregation and of dendritic array spacings on the electrochemical behavior of an Al-4.5 wt.% Cu alloy. Electrochim. Acta 2007, 52, 3265–3273. [Google Scholar] [CrossRef]
  13. Song, D.; Ma, A.; Jiang, J.; Lin, P.; Yang, D.; Fan, J. Corrosion behavior of equal-channel-angular-pressed pure magnesium in NaCl aqueous solution. Corros. Sci. 2010, 52, 481–490. [Google Scholar] [CrossRef]
  14. Birbilis, N.; Ralston, K.D.; Virtanen, S.; Fraser, H.L.; Davies, C.H. Grain character influences on corrosion of ECAPed pure magnesium. Corros. Eng. Sci. Technol. 2010, 45, 224–230. [Google Scholar] [CrossRef]
  15. Osório, W.R.; Spinelli, J.E.; Afonso, C.R.M.; Peixoto, L.C.; Garcia, A. Microstructure, corrosion behaviour and microhardness of a directionally solidified Sn-Cu solder alloy. Electrochim. Acta 2011, 56, 8891–8899. [Google Scholar] [CrossRef]
  16. Son, I.J.; Nakano, H.; Oue, S.; Kobayashi, S.; Fukushima, H.; Horita, Z. Pitting corrosion resistance of ultrafine-grained aluminum processed by severe plastic deformation. Nippon Kinzoku Gakkaishi/J. Jpn. Inst. Met. 2006, 47, 1163–1169. [Google Scholar] [CrossRef]
  17. Kubaski, E.T.; Cintho, O.M.; Capocchi, J.D.T. Effect of milling variables on the synthesis of NiAl intermetallic compound by mechanical alloying. Powder Technol. 2011, 214, 77–82. [Google Scholar] [CrossRef]
  18. Mishra, R.; Balasubramaniam, R. Effect of nanocrystalline grain size on the electrochemical and corrosion behavior of nickel. Corros. Sci. 2004, 46, 3019–3029. [Google Scholar] [CrossRef]
  19. Luo, W.; Xu, Y.; Wang, Q.; Shi, P.; Yan, M. Effect of grain size on corrosion of nanocrystalline copper in NaOH solution. Corros. Sci. 2010, 52, 3509–3513. [Google Scholar] [CrossRef]
  20. Kim, S.H.; Aust, K.T.; Erb, U.; Gonzalez, F.; Palumbo, G. A comparison of the corrosion behaviour of polycrystalline and nanocrystalline cobalt. Scr. Mater. 2003, 48, 1379–1384. [Google Scholar] [CrossRef]
  21. Shingu, P.H.; Huang, B.; Nishitani, S.R.; Nasu, S. Nano-meter order crystalline structure of Al-Fe alloys produced by mechanical alloying. Suppl. Trans. JIM 1988, 29, 3–10. [Google Scholar]
  22. Dong, Y.D.; Wang, W.H.; Liu, L.; Xiao, K.Q.; Tong, S.H.; He, Y.Z. Structural investigation of a mechanically alloyed A1-Fe system. Mater. Sci. Eng. A 1991, 134, 867–871. [Google Scholar] [CrossRef]
  23. Niu, X.P.; Froyen, L.; Delaey, L.; Peytour, C. Effect of Fe content on the mechanical alloying and mechanical properties of AI-Fe alloys. J. Mater. Sci. 1994, 29, 3724–3732. [Google Scholar] [CrossRef]
  24. Nayak, S.S.; Murty, B.S.; Pabi, S.K. Structure of nanocomposites of Al-Fe alloys prepared by mechanical alloying and rapid solidification processing. Bull. Mater. Sci. 2008, 31, 449–454. [Google Scholar] [CrossRef] [Green Version]
  25. Braun, R. Stress corrosion cracking behaviour of Al-Li alloy 8090-T8171 plate exposed to various synthetic environments. Mater. Corros. 2004, 55, 241–248. [Google Scholar] [CrossRef]
  26. González-Rodríguez, J.G.; Salazar, M.; Luna-Ramírez; Porcayo-Calderon, J.; Rosas, G.; Villfane, A.M. Effect of Li, Ce and Ni on the corrosion resistance of Fe3Al in molten Na2SO4 and NaVO3. High Temp. Mater. Process. 2004, 23, 177–183. [Google Scholar]
  27. Cai, C.; Zhang, Z.; Cao, F.; Gao, Z.; Zhang, J.; Cao, C. Analysis of pitting corrosion behavior of pure Al in sodium chloride solution with the wavelet technique. J. Electroanal. Chem. 2005, 578, 143–150. [Google Scholar] [CrossRef]
  28. Gudić, S.; Smoljko, I.; Klikić, M. The effect of small addition of tin and indium on the corrosion behavior of aluminium in chloride solution. J. Alloy. Compd. 2010, 505, 54–63. [Google Scholar] [CrossRef]
  29. LI, S.; Zhang, H.; LIU, J. Corrosion behavior of aluminum alloy 2024-T3 by 8-hydroxy-quinoline and its derivative in 3.5% chloride solution. Trans. Nonferr. Met. Soc. China (Engl. Ed.) 2007, 17, 318–325. [Google Scholar] [CrossRef]
  30. Shen, D.; Li, G.; Guo, C.; Zou, J.; Cai, J.; He, D.; Ma, H.; Liu, F. Microstructure and corrosion behavior of micro-arc oxidation coatingon 6061 aluminum alloy pre-treated by high-temperature oxidation. Appl. Surf. Sci. 2013, 287, 451–456. [Google Scholar] [CrossRef]
  31. Ralston, K.D.; Birbilis, N. Effect of grain size on corrosion: A review. Corrosion 2010, 66, 075005-075005-13. [Google Scholar] [CrossRef]
  32. Gupta, R.K.; Fabijanic, D.; Zhang, R.; Birbilis, N. Corrosion behaviour and hardness of in situ consolidated nanostructured Al and Al-Cr alloys produced via high-energy ball milling. Corros. Sci. 2015, 98, 643–650. [Google Scholar] [CrossRef]
  33. Sherif, E.S.M.; Ammar, H.R.; Khalil, K.A. Effects of copper and titanium on the corrosion behavior of newly fabricated nanocrystalline aluminum in natural seawater. Appl. Surf. Sci. 2014, 301, 142–148. [Google Scholar] [CrossRef]
  34. Ghosh, S.K.; Dey, G.K.; Dusane, R.O.; Grover, A.K. Improved pitting corrosion behaviour of electrodeposited nanocrystalline Ni-Cu alloys in 3.0 wt.% NaCl solution. J. Alloy. Compd. 2006, 426, 235–243. [Google Scholar] [CrossRef]
  35. Liu, L.; Li, Y.; Wang, F. Electrochemical corrosion behavior of nanocrystalline materials-a review. J. Mater. Sci. Technol. 2010, 26, 1–14. [Google Scholar] [CrossRef]
  36. Raju, K.S.; Krishna, M.G.; Padmanabhan, K.A.; Muraleedharan, K.; Gurao, N.P.; Wilde, G. Grain size and grain boundary character distribution in ultra-fine grained (ECAP) nickel. Mater. Sci. Eng. A 2008, 491, 1–7. [Google Scholar] [CrossRef]
  37. Osório, W.R.; Freire, C.M.; Garcia, A. The role of macrostructural morphology and grain size on the corrosion resistance of Zn and Al castings. Mater. Sci. Eng. A 2005, 402, 22–32. [Google Scholar] [CrossRef]
  38. Cai, S.; Lei, T.; Li, N.; Feng, F. Effects of Zn on microstructure, mechanical properties and corrosion behavior of Mg-Zn alloys. Mater. Sci. Eng. C 2012, 32, 2570–2577. [Google Scholar] [CrossRef]
  39. Barbucci, A.; Farnè, G.; Matteazzi, P.; Riccieri, R.; Cerisola, G. Corrosion behaviour of nanocrystalline Cu90Ni10 alloy in neutral solution containing chlorides. Corros. Sci. 1998, 41, 463–475. [Google Scholar] [CrossRef]
  40. Chianpairot, A.; Lothongkum, G.; Schuh, C.A.; Boonyongmaneerat, Y. Corrosion of nanocrystalline Ni-W alloys in alkaline and acidic 3.5 wt.% NaCl solutions. Corros. Sci. 2011, 53, 1066–1071. [Google Scholar] [CrossRef]
  41. Lo, P.H.; Tsai, W.T.; Lee, J.T.; Hung, M.P. Role of phosphorus in the electrochemical behavior of electroless Ni-P alloys in 3.5 wt.% NaCl solutions. Surf. Coat. Technol. 1994, 67, 27–34. [Google Scholar] [CrossRef]
  42. Mote, V.D.; Purushotham, Y.; Dole, B.N. Williamson-Hall analysis in estimation of lattice strain in nanometer-sized ZnO particles. J. Theor. Appl. Phys. 2012, 6, 1–8. [Google Scholar] [CrossRef]
  43. Prabhu, Y.T.; Rao, K.V.; Kumar, V.S.S.; Kumari, B.S. X-ray analysis by Williamson-Hall and size-strain plot methods of ZnO nanoparticles with fuel variation. World J. Nano Sci. Eng. 2014, 4, 21–28. [Google Scholar] [CrossRef]
  44. Seikh, A.H.; Baig, M.; Ammar, H.R. Corrosion behavior of nanostructure Al-Fe alloy processed by mechanical alloying and high frequency induction heat sintering. Int. J. Electrochem. Sci. 2015, 10, 3054–3064. [Google Scholar]
  45. Lee, I.S.; Kao, P.W.; Ho, N.J. Microstructure and mechanical properties of Al-Fe in situ nanocomposite produced by friction stir processing. Intermetallics 2008, 16, 1104–1108. [Google Scholar] [CrossRef]
  46. Zhang, L.C.; Shen, Z.Q.; Xu, J. Glass formation in a (Ti, Zr, Hf)–(Cu, Ni, Ag)–Al high-order alloy system by mechanical alloying. J. Mater. Res. 2003, 18, 2141–2149. [Google Scholar] [CrossRef]
  47. Lu, P.-J.; Huang, S.-C.; Chen, Y.-P.; Chiueh, L.-C.; Shih, D.Y.-C. Analysis of titanium dioxide and zinc oxide nanoparticles in cosmetics. J. Food Drug Anal. 2015, 23, 587–594. [Google Scholar] [CrossRef] [Green Version]
  48. Yang, H.; Wen, J.; Quan, M.; Wang, J. Evaluation of the volume fraction of nanocrystalsdevitrified in Al-based amorphous alloys. J. Non-Cryst. Solids 2009, 355, 235–238. [Google Scholar] [CrossRef]
  49. Ehtemam-Haghighi, S.; Liu, Y.; Cao, G.; Zhang, L.-C. Influence of Nb on the β → α″ martensitic phase transformation and properties of the newly designed Ti-Fe-Nb alloys. Mater. Sci. Eng. C 2016, 60, 503–510. [Google Scholar] [CrossRef]
  50. Nayak, S.S.; Wollgarten, M.; Banhart, J.; Pabi, S.K.; Murty, B.S. Nanocomposites and an extremely hard nanocrystalline intermetallic of Al-Fe alloys prepared by mechanical alloying. Mater. Sci. Eng. A 2010, 527, 2370–2378. [Google Scholar] [CrossRef]
  51. Basariya, M.I.R.; Mukhopadhyay, N.K. Chapter 5, Structural and mechanical behaviour of Al-Fe intermetallics. In Intermetallics Compounds; IntechOpen: London, UK, 2018. [Google Scholar] [CrossRef]
  52. Keong, P.G.; Sames, J.A.; Adam, C.M.; Sharp, R.M. Influence of various elements on Al-Al6Fe eutectic system. In Proceedings of the International Conference on Solidification and Casting of Metals, London, UK, 18–21 July 1977; pp. 110–114. [Google Scholar]
  53. Campbell, J. Castings; Butterworth-Heinemann: Oxford, MS, UK, 2003. [Google Scholar]
  54. Seri, O.; Tagashira, K. The interpretation of polarization curves for A1-Fe alloys in de-aerated NaCl solution. Corros. Sci. 1990, 30, 87–94. [Google Scholar] [CrossRef]
  55. Liang, J.; Gao, L.J.; Miao, N.N.; Chai, Y.J.; Wang, N.; Song, X.Q. Hydrogen generation by reaction of Al-M(M = Fe, Co, Ni) with water. Energy 2016, 113, 282–287. [Google Scholar] [CrossRef]
  56. Grosjean, M.H.; Zidoune, M.; Roue, L. Hydrogen production from highly corroding Mg-based materials elaborated by ball milling. J. Alloy. Compd. 2005, 404, 712–715. [Google Scholar] [CrossRef]
  57. Flores-Chan, J.E.; Bedolla-Jacuinde, A.; Patiño-Carachure, C.; Rosas, G.; Espinosa-Medina, M.A. Corrosion study of Al-Fe (20 wt-%) alloy in artificial sea water with NaOH additions. Can. Metall. Q. 2018, 57, 201–209. [Google Scholar] [CrossRef]
  58. Seri, O.; Furumata, K. Effect of Al-Fe-Si intermetallic compound phases on initiation and propagation of pitting attacks for aluminum 1100. Mater. Corros. 2002, 53, 111–120. [Google Scholar] [CrossRef]
  59. Dean, S.W. Electrochemical methods of corrosion testing. In Electrochemical Techniques for Corrosion; Baboian, R., Ed.; NACE: Houston, TX, USA, 1977; p. 52. [Google Scholar]
  60. Pariona, M.; Micene, K.T.; Zara, J. Effect of microstructure on microhardness and electrochemical behavior in hypereutectic Al-Fe alloy processed by laser surface remelting. In Aerospace Engineering; IntechOpen: London, UK, 2019. [Google Scholar] [CrossRef]
  61. Sherif, E.M.; Park, S.M. Effects of 1,4-naphthoquinone on aluminum corrosion in 0.50 M sodium chloride solutions. Electrochim. Acta 2006, 51, 1313–1321. [Google Scholar] [CrossRef]
  62. Ma, H.; Chen, S.; Niu, L.; Zhao, S.; Li, S.; Li, D. Inhibition of copper corrosion by several Schiff bases in aerated halide solutions. J. Appl. Electrochem. 2002, 32, 65–72. [Google Scholar] [CrossRef]
  63. Singh, A.K.; Shukla, S.K.; Singh, M.; Quraishi, M.A. Inhibitive effect of ceftazidime on corrosion of mild steel in hydrochloric acid solution. Mater. Chem. Phys. 2011, 129, 68–76. [Google Scholar] [CrossRef]
  64. Sherif, E.M.; Park, S.M. Effects of 2-amino-5-ethylthio-1,3,4-thiadiazole on copper corrosion as a corrosion inhibitor in aerated acidic pickling solutions. Electrochim. Acta 2006, 51, 6556–6562. [Google Scholar] [CrossRef]
  65. Rehim, S.S.A.; Hassan, H.H.; Amin, M.A. Corrosion and corrosion inhibition of Al and some alloys in sulphate solutions containing halide ions investigated by an impedance technique. Appl. Surf. Sci. 2002, 187, 279–290. [Google Scholar] [CrossRef]
  66. Zhou, Y.L.; Niinomi, M.; Akahori, T.; Fukui, H.; Toda, H. Corrosion resistance and biocompatibility of Ti-Ta alloys for biomedical applications. Mater. Sci. Eng. A 2005, 398, 28–36. [Google Scholar] [CrossRef]
  67. Seri, O. The effect of NaCl concentration on the corrosion behavior of Aluminum containing iron. Corros. Sci. 1994, 36, 1789–1803. [Google Scholar] [CrossRef]
  68. Gupta, R.K.; Birbilis, N. The influence of nanocrystalline structure and processing route on corrosion of stainless steel: A review. Corros. Sci. 2015, 92, 1–15. [Google Scholar] [CrossRef]
  69. Frankel, G.S. On the pitting resistance of sputter-deposited aluminum alloys. J. Electrochem. Soc. 1993, 140, 2192–2197. [Google Scholar] [CrossRef]
Figure 1. Attritor.
Figure 1. Attritor.
Coatings 09 00686 g001
Figure 2. Scanning-electron-microscopy (SEM) micrograph and corresponding energy-dispersive-spectrometry (EDS) pattern of (a) pure Al and (b) Al-10 wt.% Fe alloys after sintering process.
Coatings 09 00686 g002
Figure 3. X-ray diffraction (XRD) pattern for pure Al and Al-10 wt.% Fe after sintering.
Coatings 09 00686 g003
Figure 4. Compressive stress–strain response of Al-Fe fabricated alloys.
Coatings 09 00686 g004
Figure 5. Hardness of Al and Al-Fe fabricated alloys.
Coatings 09 00686 g005
Figure 6. (a) EDS mapping of Al-10 wt.% Fe sintered sample, (b) elemental mapping showing location and presence of Al, and (c) elemental mapping showing location and presence of Fe.
Coatings 09 00686 g006
Figure 7. Cyclic-polarization (CP) curves for pure Al and Al-Fe alloys after one hour immersion in 3.5% NaCl solution.
Coatings 09 00686 g007
Figure 8. Nyquist plot for pure Al and Al-Fe alloys after one hour of immersion in 3.5% NaCl solution.
Coatings 09 00686 g008
Figure 9. Equivalent circuit model (ECM) for EIS.
Coatings 09 00686 g009
Figure 10. Bode plot for pure Al and Al-Fe alloys after one hour immersion in 3.5% NaCl at room temperature.
Coatings 09 00686 g010
Figure 11. Field emission scanning electron microscope (FESEM) micrographs and EDS profile analysis obtained for (a) pure Al and (b) Al-10 wt.% Fe alloys after one hour immersion in 3.5% NaCl at room temperature.
Coatings 09 00686 g011
Figure 12. XRD pattern of pure Al and Al-10 wt.% Fe alloys after 1 h of exposure in 3.5% NaCl solution.
Coatings 09 00686 g012
Table 1. Alloy crystallite size and microstrain.
MaterialsCrystallite Size (Error), nmMicrostrain (Error), %
Pure Al53.67 ± 1.780.17 ± 0.05
Al-2 wt.% Fe39.16 ± 4.230.22 ± 0.03
Al-5 wt.% Fe39.13 ± 2.700.23 ± 0.04
Al-10 wt.% Fe37.33 ± 3.560.24 ± 0.04
Table 2. Electrochemical parameters obtained after fitting CP graphs in Tafel regions for pure Al and Al-Fe alloys after one hour immersion in 3.5% NaCl solution.
MaterialsElectrochemical Parameters
Ecorr (mV) vs Ag/AgClicorr (µA·cm−2)Epit (mV) vs Ag/AgClipit (µA·cm−2)Rp (kΩ·cm2)Corrosion Rate (µm/year)
Pure Al–104714.48–82489.34.873157.83
Al-2 wt.% Fe–9401.35–7148.4321.5814.77
Al-5 wt.% Fe–8841.27–6984.6438.2314.38
Al-10 wt.% Fe–7521.05–5694.4853.0511.63
Table 3. Electrochemical-impedance-spectroscopy (EIS) parameters for pure Al and Al-Fe alloys after one hour of immersion in 3.5% NaCl solution.
MaterialsEIS Parameters
RS (Ω cm2)Q1Rct (kΩ·cm2)Q2Rf (kΩ·cm2)
Cdl (μF·cm−2)nCf (μF·cm−2)n
Pure Al3.84248.30.9771.116170.582.81
Al-2% Fe11.515.40.7787.1237.60.8849.6
Al-5% Fe13.812.80.88711.123.40.9213.6
Al-10% Fe22.110.10.84321.513.60.86235.0

