1. Introduction
Aluminum alloy 5754 is an important material in the industry due to its many excellent characteristics including its good corrosion resistance, proper mechanical properties (tensile strength
Rm ~190–200 MPa, modulus of elasticity
E ~70 GPa, modulus of transverse elasticity
G = 26.5 GPa), and low density (2.68 g/cm
2). The high corrosion resistance of the aluminum alloy is attributed to a thin but very tight and tightly adhering layer of aluminum oxide formed on the surface of the material. This oxide layer protects the material against further oxidation. Thanks to high corrosion resistance, it is commonly used in the marine, shipbuilding, food and chemical industries, in the production of household appliances, architecture, and the automotive industry [
1]. However, despite these attractive properties, in the presence of aggressive ions, like chloride and halide, the protective layer can be locally destroyed, and a corrosive attack takes place [
2].
Corrosion is a slow, progressive, or rapid deterioration of a metal’s properties under the influence of the surrounding environment [
3]. The main corrosion problem associated with aluminum and its alloys concerns the localized breakdown of the passive film, which leads to the initiation and growth of corrosion pits in a chloride medium [
4]. The fundamental reactions of the corrosion of aluminum in an aqueous medium have been the subject of many studies [
5,
6]. The corrosion resistance of Al alloys depends on many factors such as environmental, alloy composition, and microstructure factors. The fundamental reactions of the corrosion of aluminum is a result of oxidation at the anode:
and reduction at the cathode (outside the cavity of water:
or of H
+:
) [
7]. Aluminum corrosion results in the formation of alumina Al(OH)
3, which is insoluble in water and precipitates as a white gel. The overall reaction of pitting corrosion on aluminum is:
Past studies have shown that laser radiation can contribute to the improvement of corrosion resistance of aluminum alloy in the NaCl solution. The immersion tests, conducted by Chan et al. [
8], have shown that, after KrF excimer laser treatment (
λ = 248 nm,
τ = 25 ns), on the surface of the material, significantly fewer corrosion pits are observed when compared to the untreated specimen. Increased corrosion resistance was assigned both to the reduction of constituent particles in the laser re-melted layer and the creation of a continuous passivation layer. Additionally, the fatigue resistance in 3.5% NaCl was higher than for the reference sample. Embuka et al. [
9] evaluated corrosion resistance after KrF Laser Surface Melting LSM (
λ = 248 nm,
τ = 13 ns) using anodic polarization and immersion testing. LSM contributes to the decrease of corrosion current density and, thus, to increase the corrosion resistance of aluminum alloy when compared to the reference sample. The cross-sectional SEM analysis revealed the occurrence of pitting and intergranular corrosion on the reference sample. However, these changes were not observed on the laser-treated sample. Laser modification using a 2 kW CO
2 laser (
λ = 10.6 μm, CW) caused an increase of breakdown potential when compared to the untreated sample [
10]. It was also confirmed that the ruby (
λ = 694.3 nm,
τ = 15 ns) [
11], Nd:YVO
4 (
λ = 1064 nm, τ = 10 ps) [
12], and fiber laser (
λ = 1064 nm,
τ = 10 ns) improves the corrosion resistance of the aluminum alloy when compared to the untreated reference sample [
13]. The increase in corrosion resistance may result from the physicochemical changes in the surface layer—the MgAl
2O
4 as a result of the interaction of laser radiation transforms into a new, more protective oxide layer containing Al
2O
3 [
13].
In the vast majority of studies (excluding the CO
2 case), lasers with a short pulse duration (10 ps–25 ns) were used. In addition, only one work has been presented until now, in which a fiber laser source has been used, but, due to the main purpose of this work known as laser cleaning, research concerns a different range of process parameters [
13]. The main objective of this study was to examine the corrosion resistance of the aluminum alloy after surface treatment using the commonly-used Yb
3+: glass long pulse duration (230 ns) fiber laser. Aluminum exerts a different absorption for this wavelength. The use of a long pulse duration fiber laser results in quite different mechanisms acting on the material. In this case, the laser acts as a heat source, creating an oxide layer, which, in some range of process parameters, can improve the corrosion resistance.
3. Results and Discussion
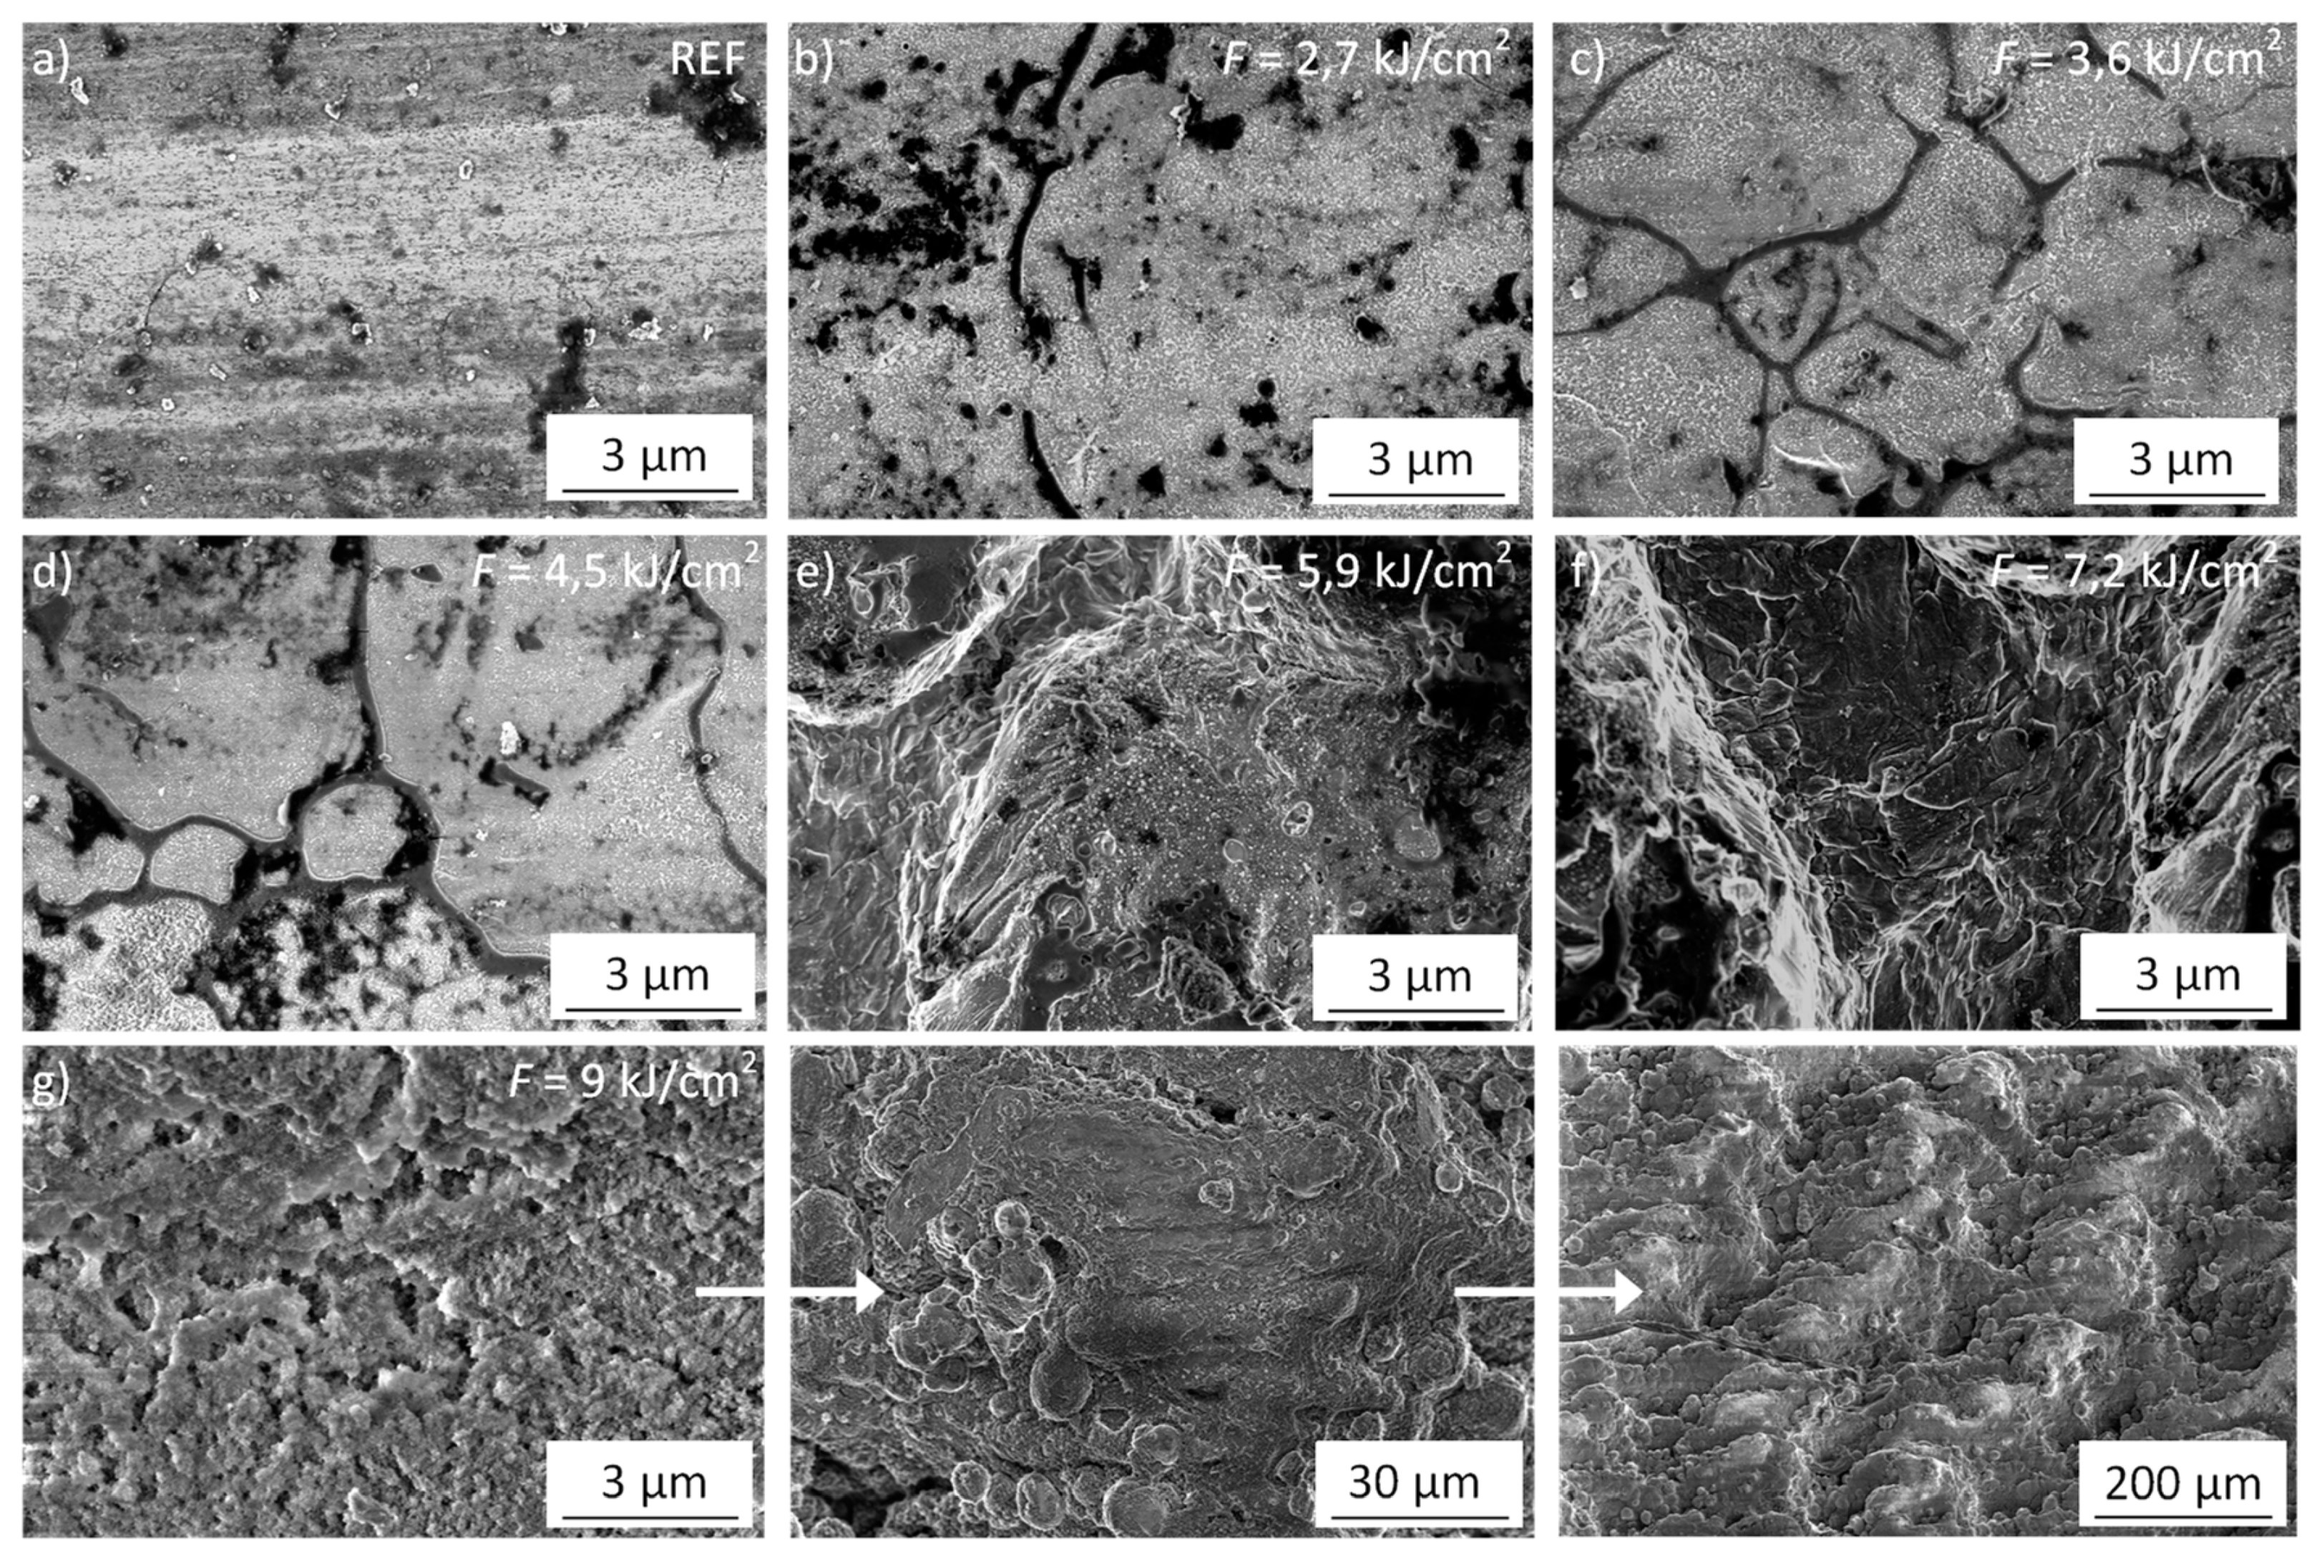
Selected microscope images of the 5754 aluminum alloy are shown in
Figure 1.
On the reference sample (
Figure 1a), surface heterogeneities (inclusions, defects) are visible. Laser modification contributed to a marked change in the surface morphology of all samples. Microscopic images suggest that, for low laser energy densities,
F < 4.5 kJ/cm
2. As a result of the annealing process, an oxide layer forms on the surface (
Figure 1b–d). On the other hand, high values of the laser fluence, as a result of high temperature gradients cause ablation and re-melting of the material. This occurs from
F ~5.9 kJ/cm
2 (
Figure 1e–g). In particular, the highest applied laser fluence
F = 9 kJ/cm
2, causes a significant modification in the geometric structure (surface roughness) (
Figure 1g). Heterogeneities and surface defects are conducive to the appearance of corrosion [
11].
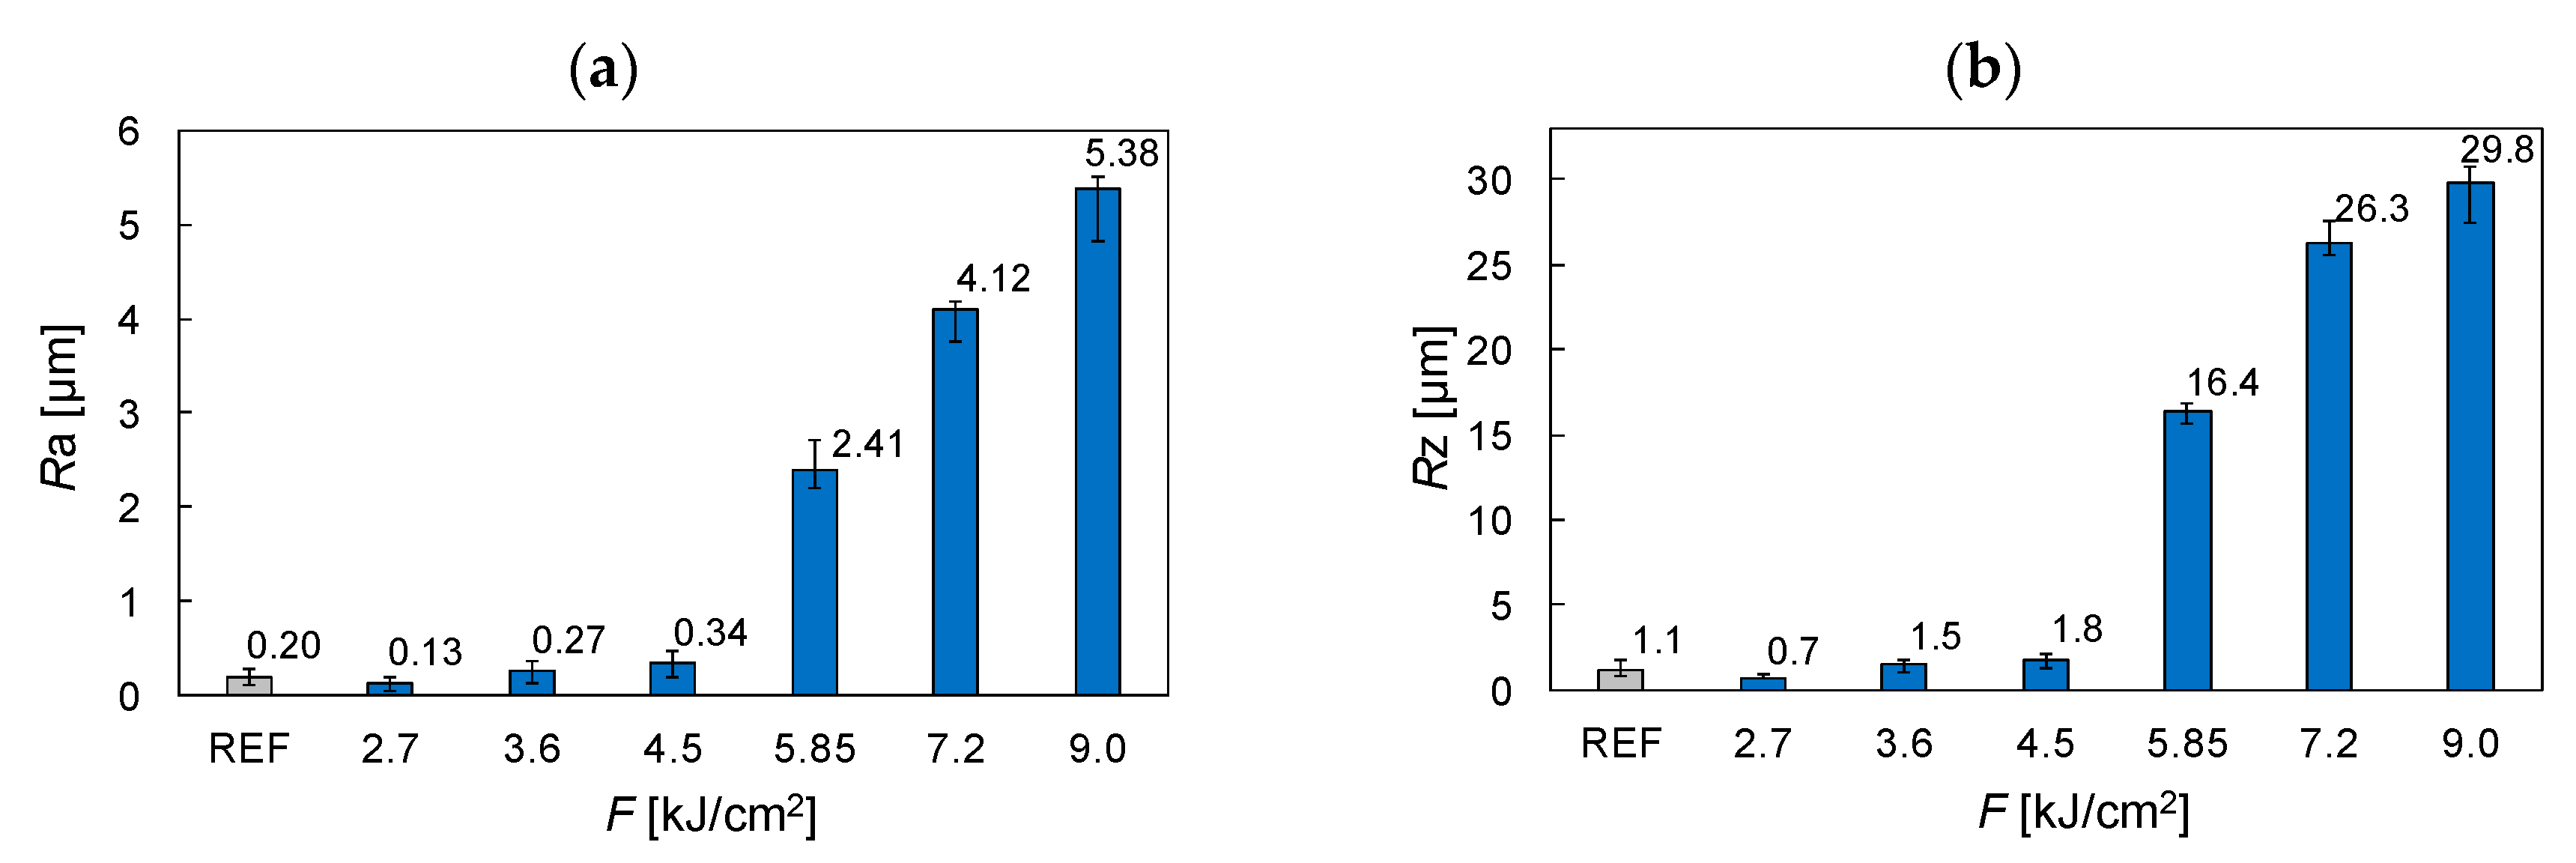
In order to accurately assess the surface of the sample, a roughness measurement was carried out (
Figure 2). Two parameters were used for this purpose:
Ra—the mean roughness profile and
Rz—the largest profile height (the sum of the highest rise of the profile and the depth of its lowest valley within the roughness sampling length). As a result of laser treatment with
F < 4.5 kJ/cm
2, compared to the reference sample, the smoothing of the surface is observed. Then, with increasing laser energy density, an increase in roughness is obtained. It is also in line with the research of Zhang et al. [
13]. The highest roughness was obtained for a sample irradiated with
F = 9 kJ/cm
2, which is in line with the microscopic observations (
Figure 1). It is mainly due to the point interaction of the laser beam with the material as well as rapid heating and cooling of its surface. A wavy-like topography was also observed after the KrF excimer [
8,
9] and fiber laser treatment [
13].
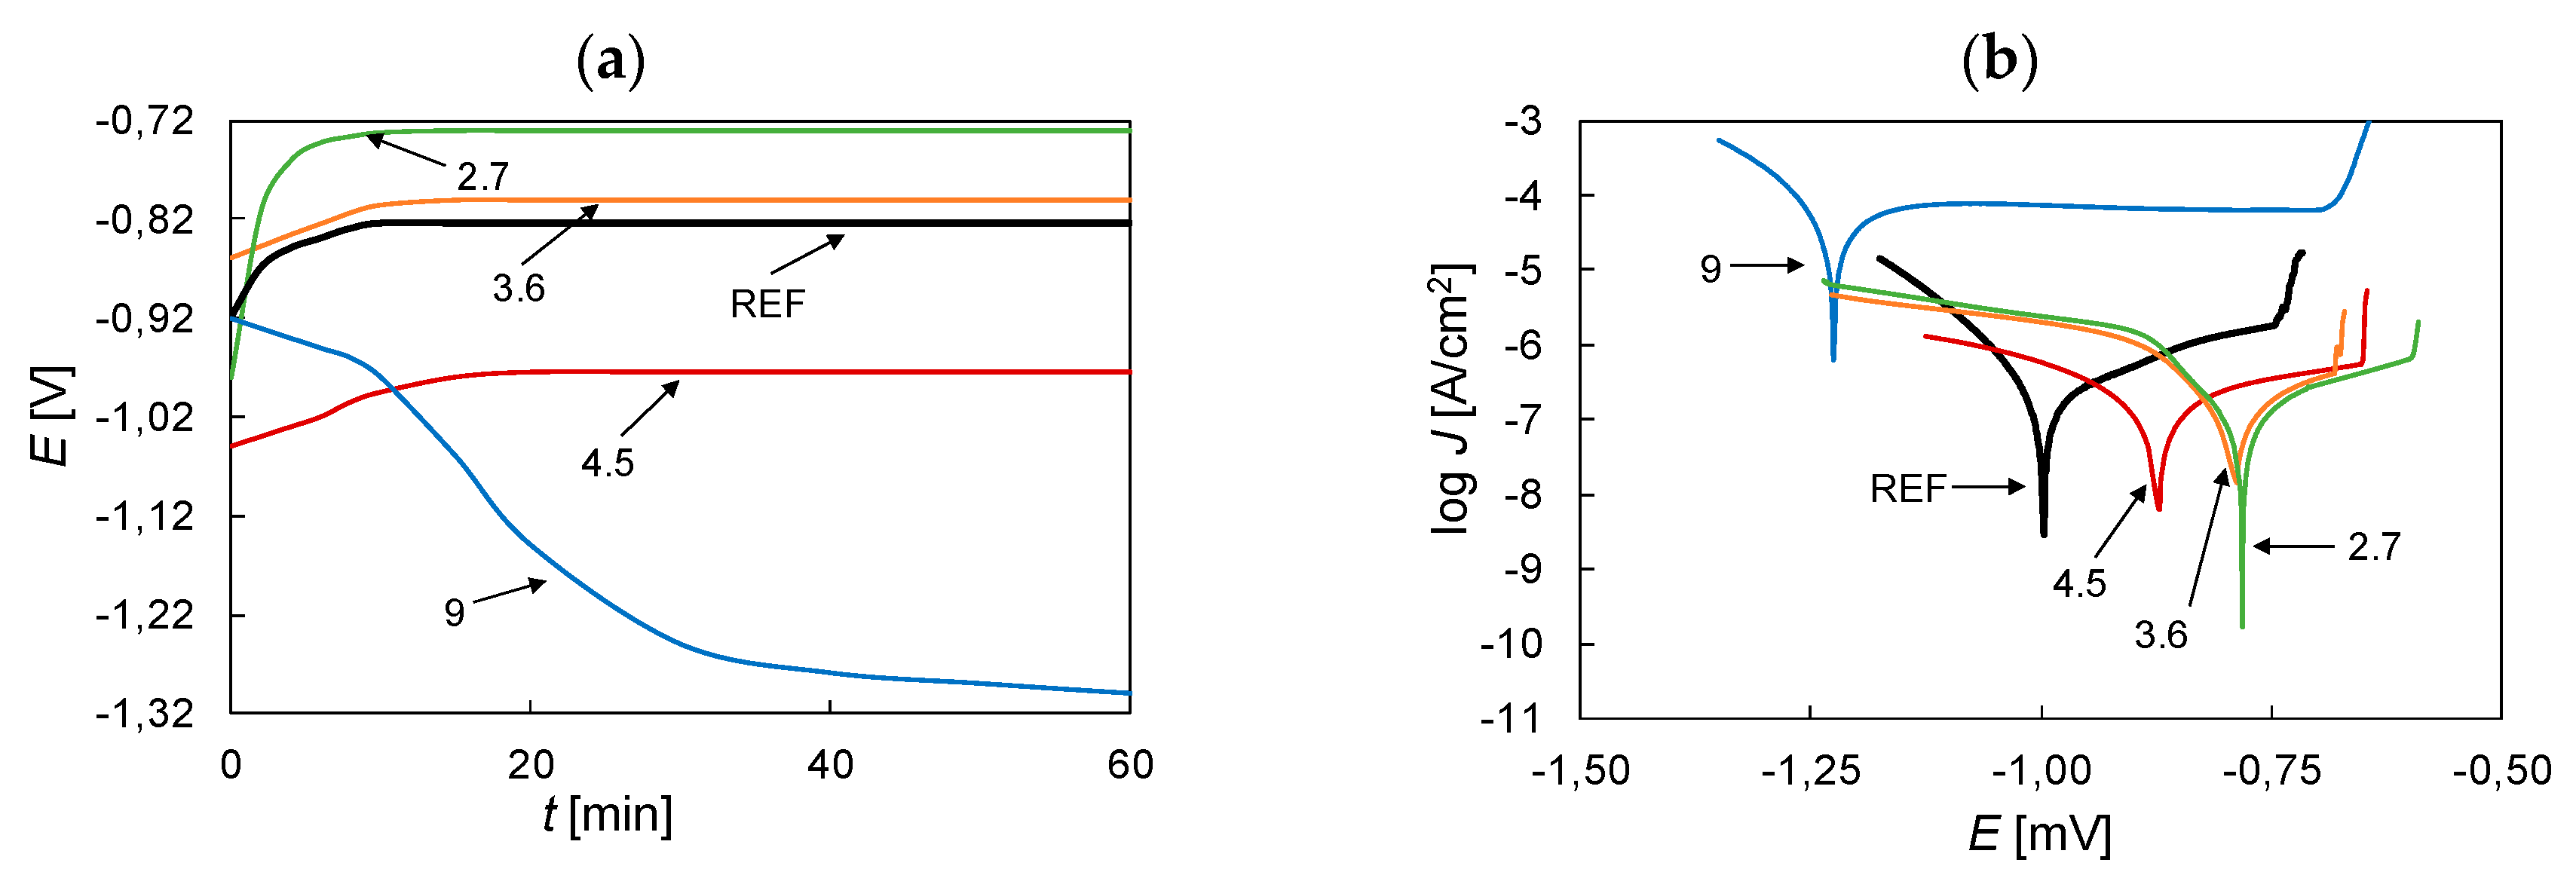
Selected potential-time curves of aluminum 5754 are shown in
Figure 3a. As can be seen, the potential becomes more and more noble, while the alloy becomes passivated. The exception is the sample irradiated with the laser fluence of
F = 9 kJ/cm
2, in which active dissolution seems to be observed.
Figure 3b presents the selected potentiodynamic curves of the 5754 aluminum alloy for different laser energy density. All the surfaces display different corrosion potentials. The electrochemical measurements have shown that, depending on the laser fluence, an improvement (
F ≤ 4.5 kJ/cm
2) or deterioration (
F > 4.5 kJ/cm
2) in corrosion resistance of the 5754 aluminum alloy can be obtained. The obtained results coincide with roughness tests (
Figure 2).
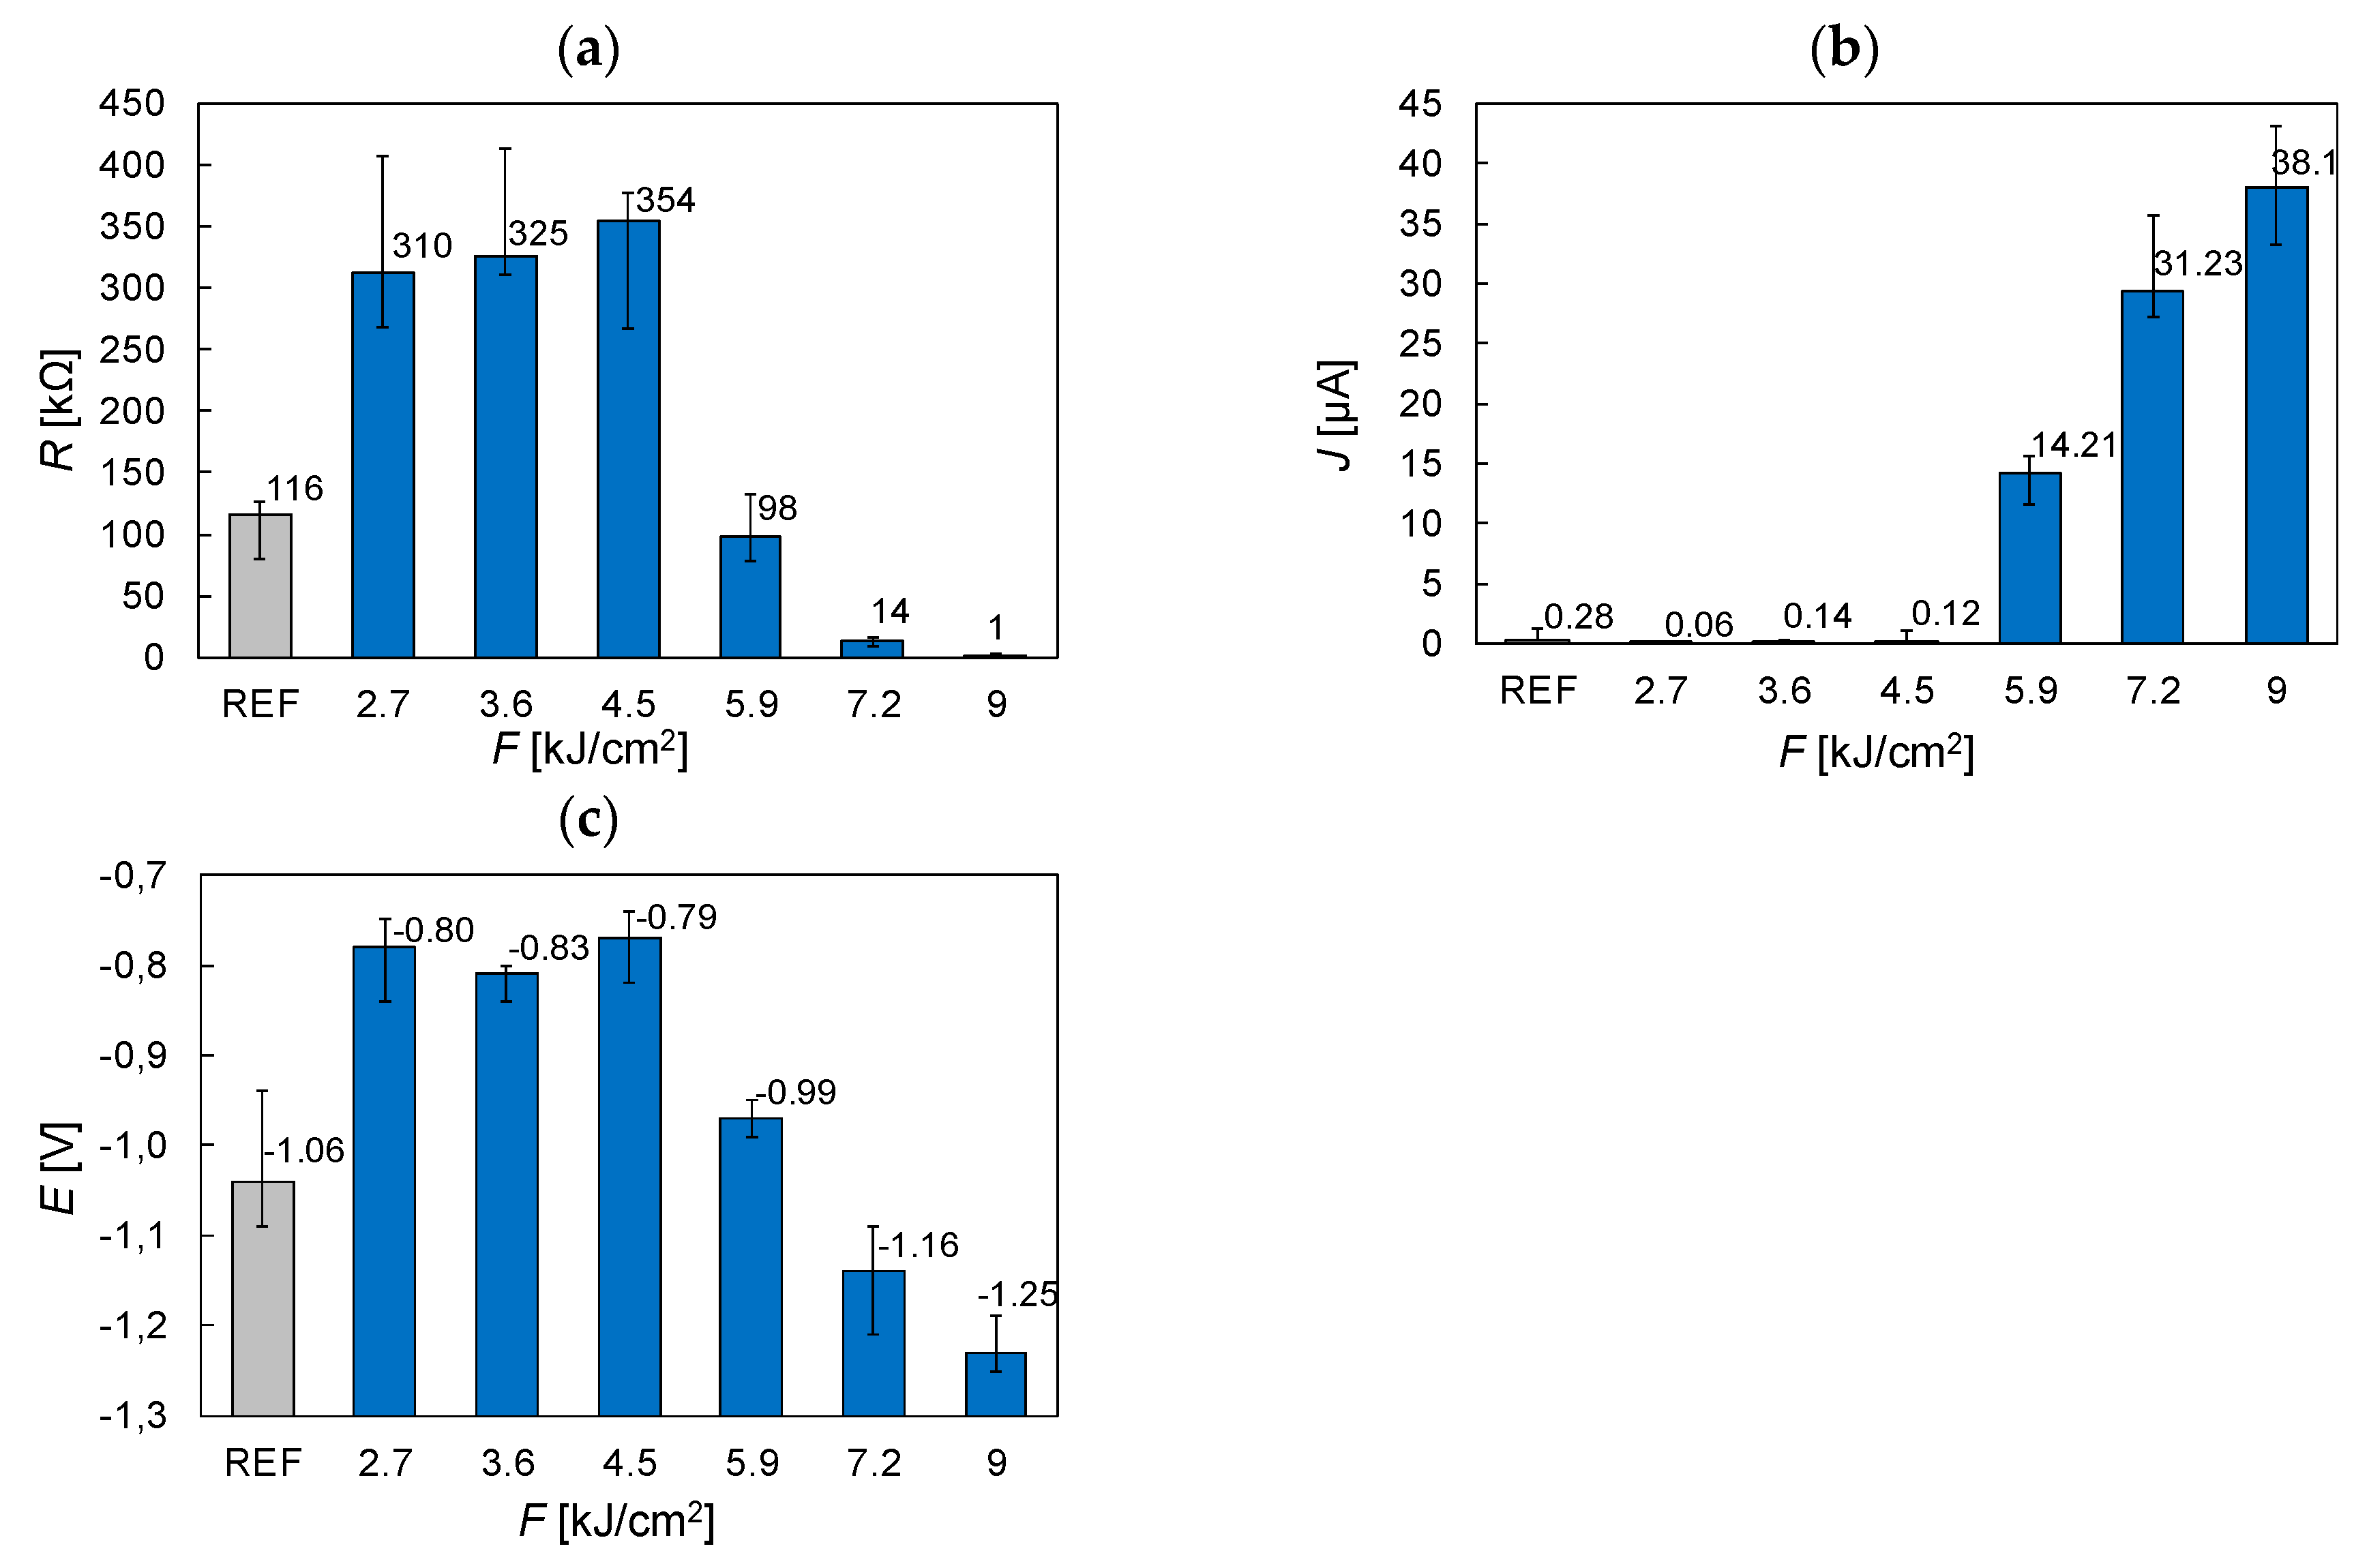
The polarization resistance
R, corrosion current density
J, and corrosion potential
E (
Figure 4), were determined using the Tafel method. Each sample was measured five times. In electrochemical measurements, the corrosion current density
J indicates the intensity of the process. The lower the value, the slower the corrosion process. In other words, the sample is more resistant. The corrosion potential
E indicates a susceptibility to corrosion. The higher (less negative) the corrosion, the better. The polarization resistance
R determines the corrosion resistance. The higher the value, the more corrosion resistant the sample is. For the sample irradiated with higher laser fluence (
F > 4.5 kJ/cm
2), a decrease in polarization resistance
R and corrosion potential
E, as well as a significant increase in the corrosion current density
J are observed, which suggests a significant decrease in the corrosion resistance (compared to the reference sample). It is mainly evident from the high temperature gradients and material ablation (the surface of the aluminum is modified with both its chemical and geometrical structure) during the laser process. High roughness and numerous heterogeneities (
Figure 1 and
Figure 2) result in a decrease in corrosion resistance. Completely different corrosion behavior is observed for the samples irradiated with lower laser energy density (
F ≤ 4.5 kJ/cm
2). This is an increase in corrosion resistance compared to the reference sample. For low values of the laser energy density, it seems that a thin passive layer is formed on the surface of the material. The decrease of corrosion current density after laser surface treatment was also observed in the research by Embuka et al. [
9] and Zhang et al. [
13], respectively.
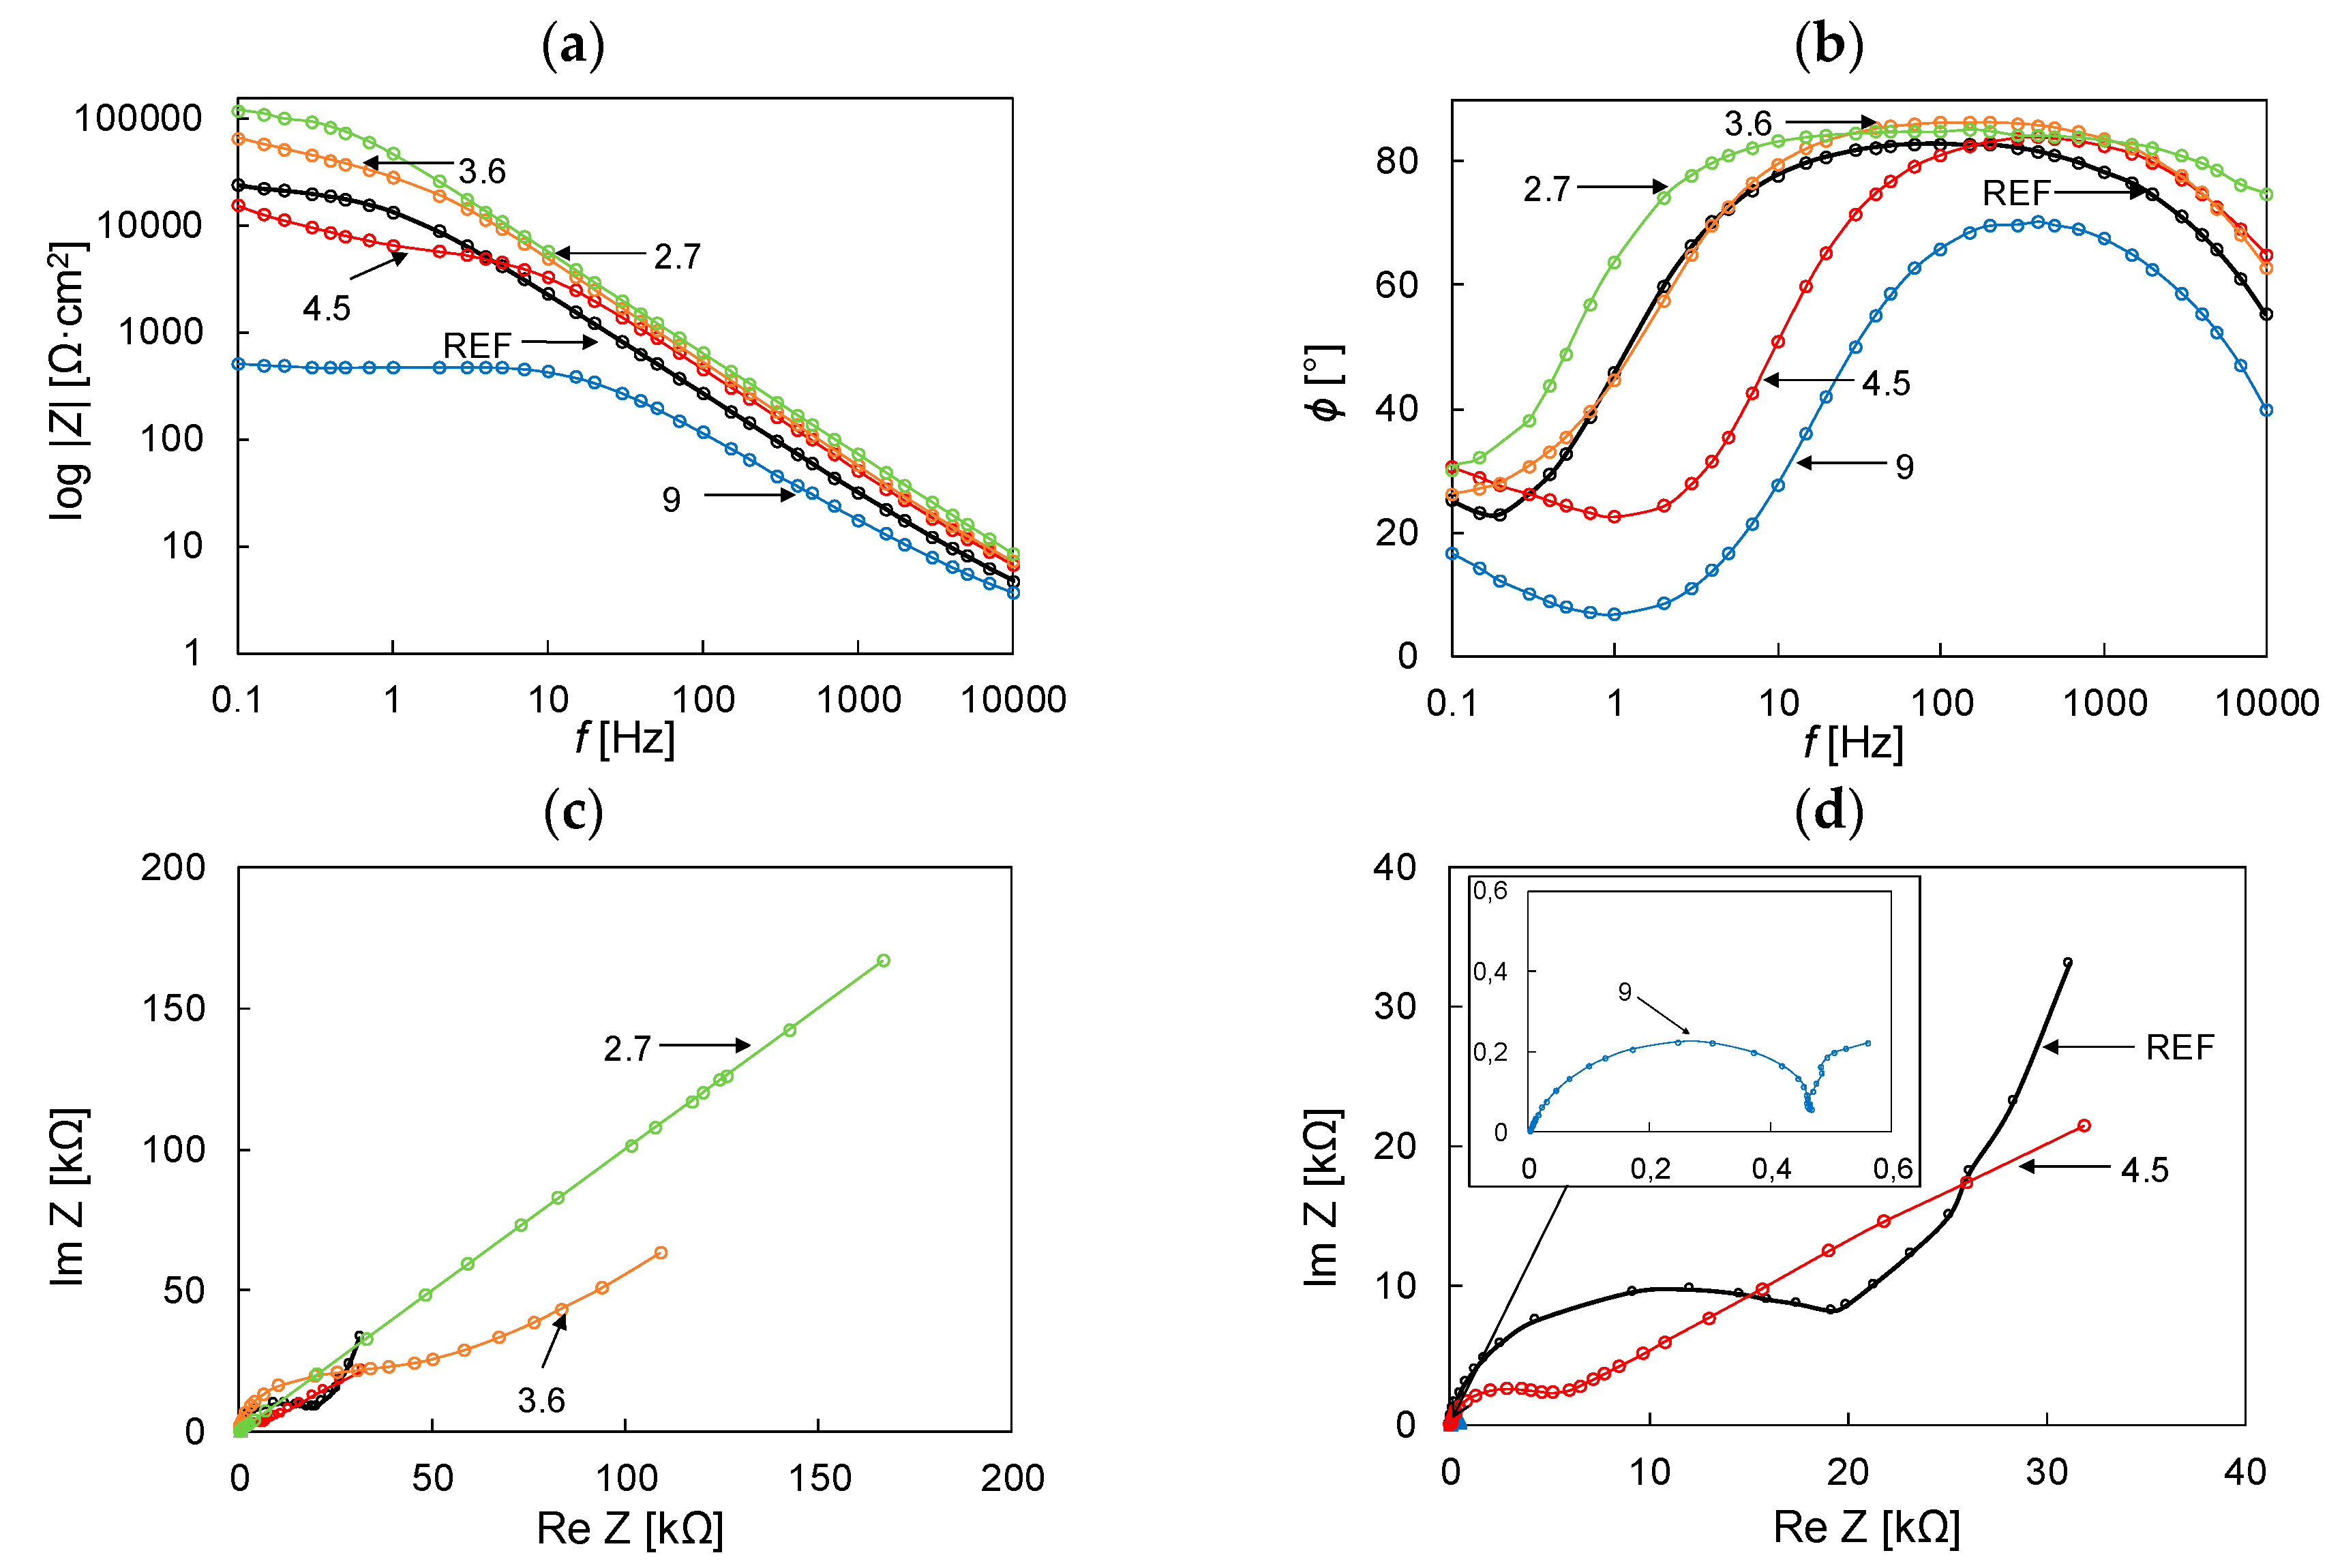
Electrochemical impedance spectroscopy confirmed the results of potentiodynamic tests (
Figure 4). Spectra of Bode and Nyquist are summarized in
Figure 5. The highest values of the impedance module |Z|, in the whole frequency range, were obtained for samples exposed to low fluence values of 2.7 and 3.6 kJ/cm
2, which suggests their highest corrosion resistance in the tested environment (
Figure 5a). For these samples, the phase angle
φ also reached its highest values and was close to 90° in a wide frequency range (
Figure 5b). As expected, the sample was irradiated with the highest energy density
F = 9 kJ/cm
2 showed the lowest corrosion resistance in a 3.5% NaCl solution. In the Nyquist spectra (
Figure 5c,d), the purely capacitive nature of the irradiated sample with the lowest fluence (2.7 kJ/cm
2) was observed. In this case, the process was mainly controlled by diffusion. Semi-circles appeared in the Nyquist spectra for higher fluences and the reference sample. The larger the semi-circle, the lower the corrosion rate is. The shape of induction loops (semi-circle) also suggests instability of the system during measurements due to the initiation of corrosion. The smallest diameter of the semi-circle was obtained for the sample exposed to the highest laser energy density (fluence), which confirms its weakest corrosion properties.
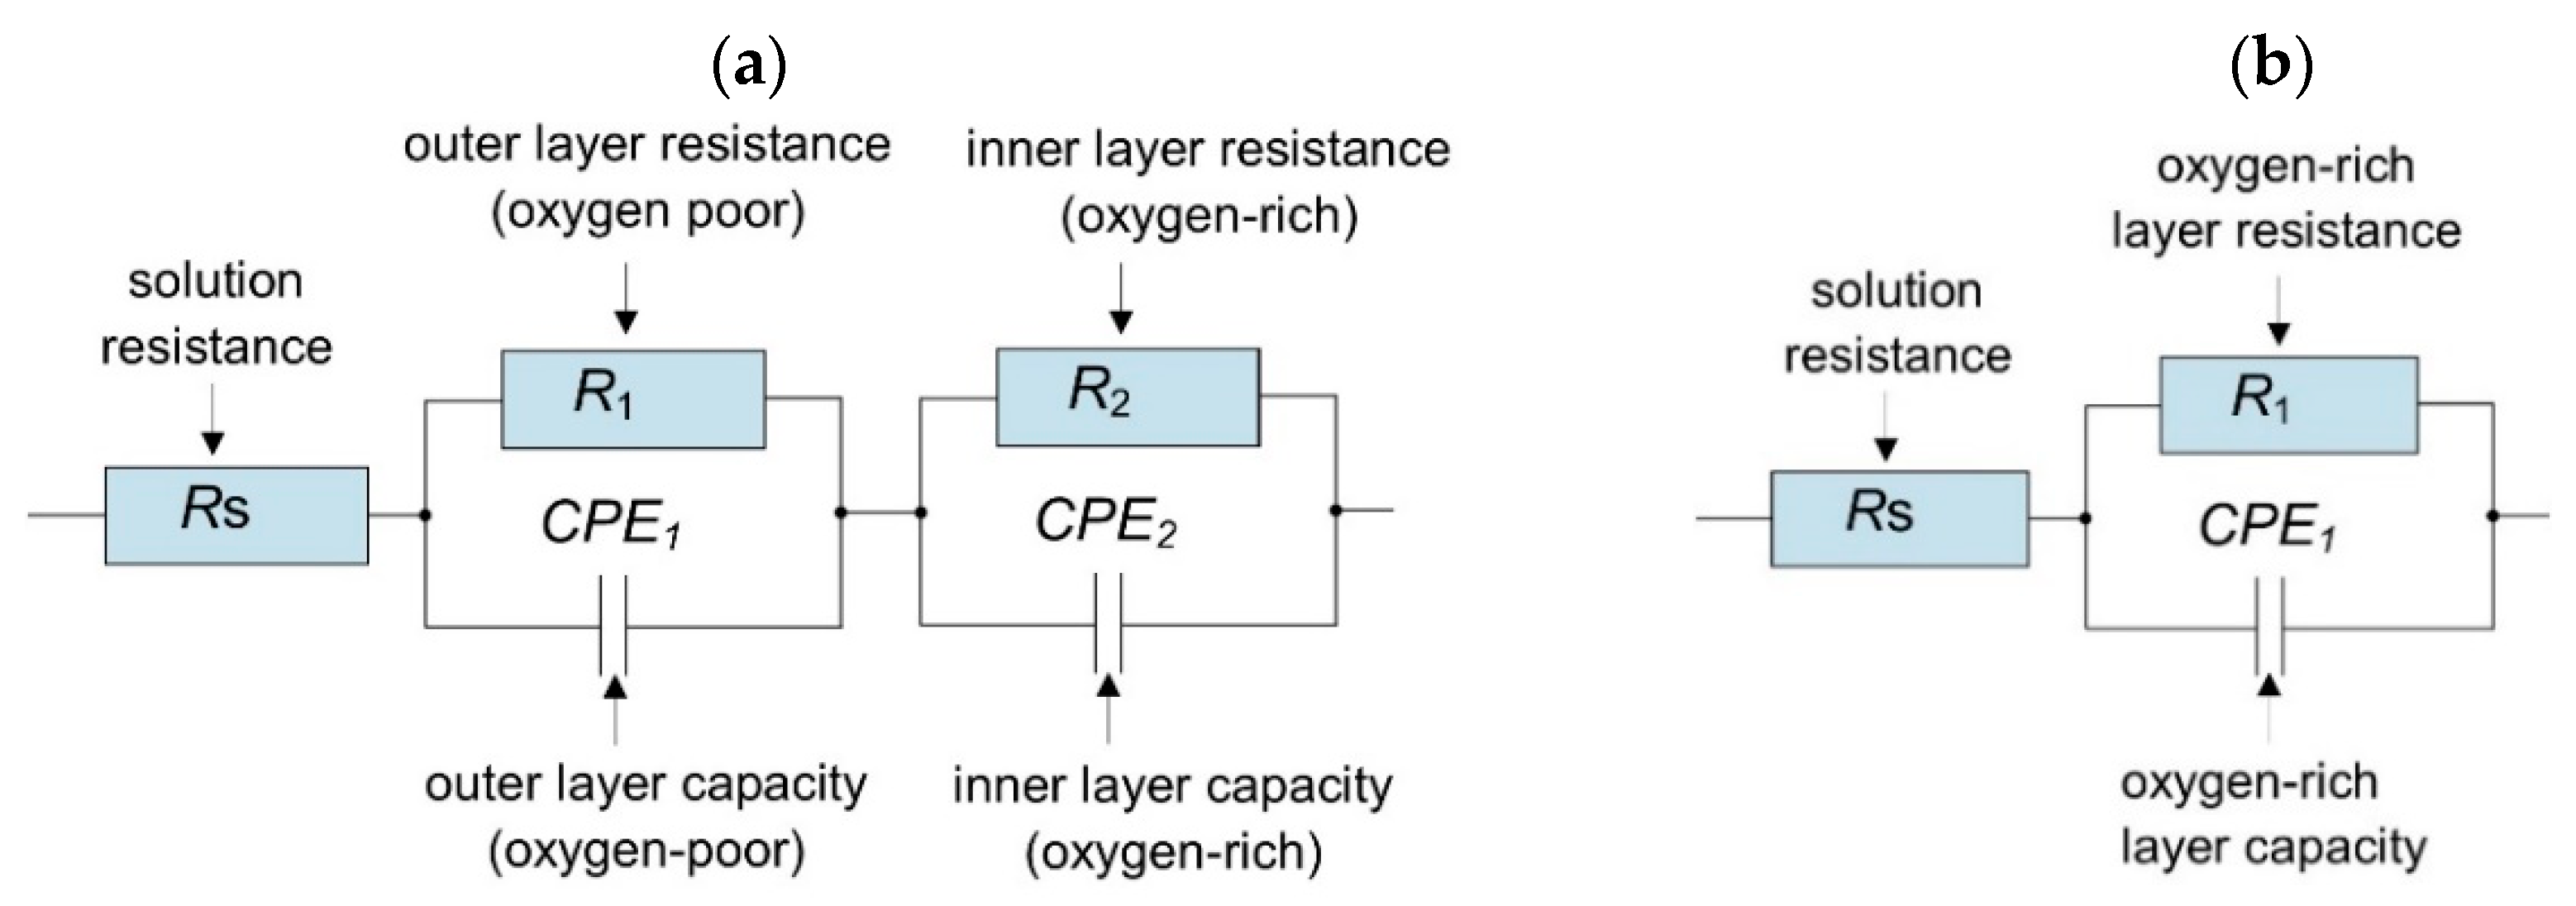
The obtained spectra (
Figure 5) were fitted to the equivalent circuit (
Figure 6a,b) using AtlasLab version 2.24 software, which is dedicated to electrochemical measurements. The electrical circuit was comprised of three resistors and two capacitors.
Rs is the solution resistance. The constant phase elements (
CPEs) for the representation of the capacitances of different layers were applied. The parameters
R1 and
CPE1 (
Figure 6a) are connected with the outer layer, which corresponds to the upper layer of the oxygen-rich region [
13]. The
R2 and
CPE2 relate to the oxide layer that corresponds to the lower part of the oxygen-poor region. In
Figure 6b,
R1 and
CPE1 correspond to the resistance and capacity of the passive (oxygen-rich) layer.
The resistance of the outer layer
R1 was lower than the resistance of the oxide layer
R2, which suggests that the outer layer was less protective. The highest value of the oxide protective layer was obtained for
F = 2.7 kJ/cm
2, which suggests the highest corrosion resistance among the tested samples and is in line with previous results. Moreover, for this sample, the appearance of a semicircle or inductive loop was not observed. It seems that the model has only one oxide layer. The fitting results of electrical components are summarized in
Table 3.
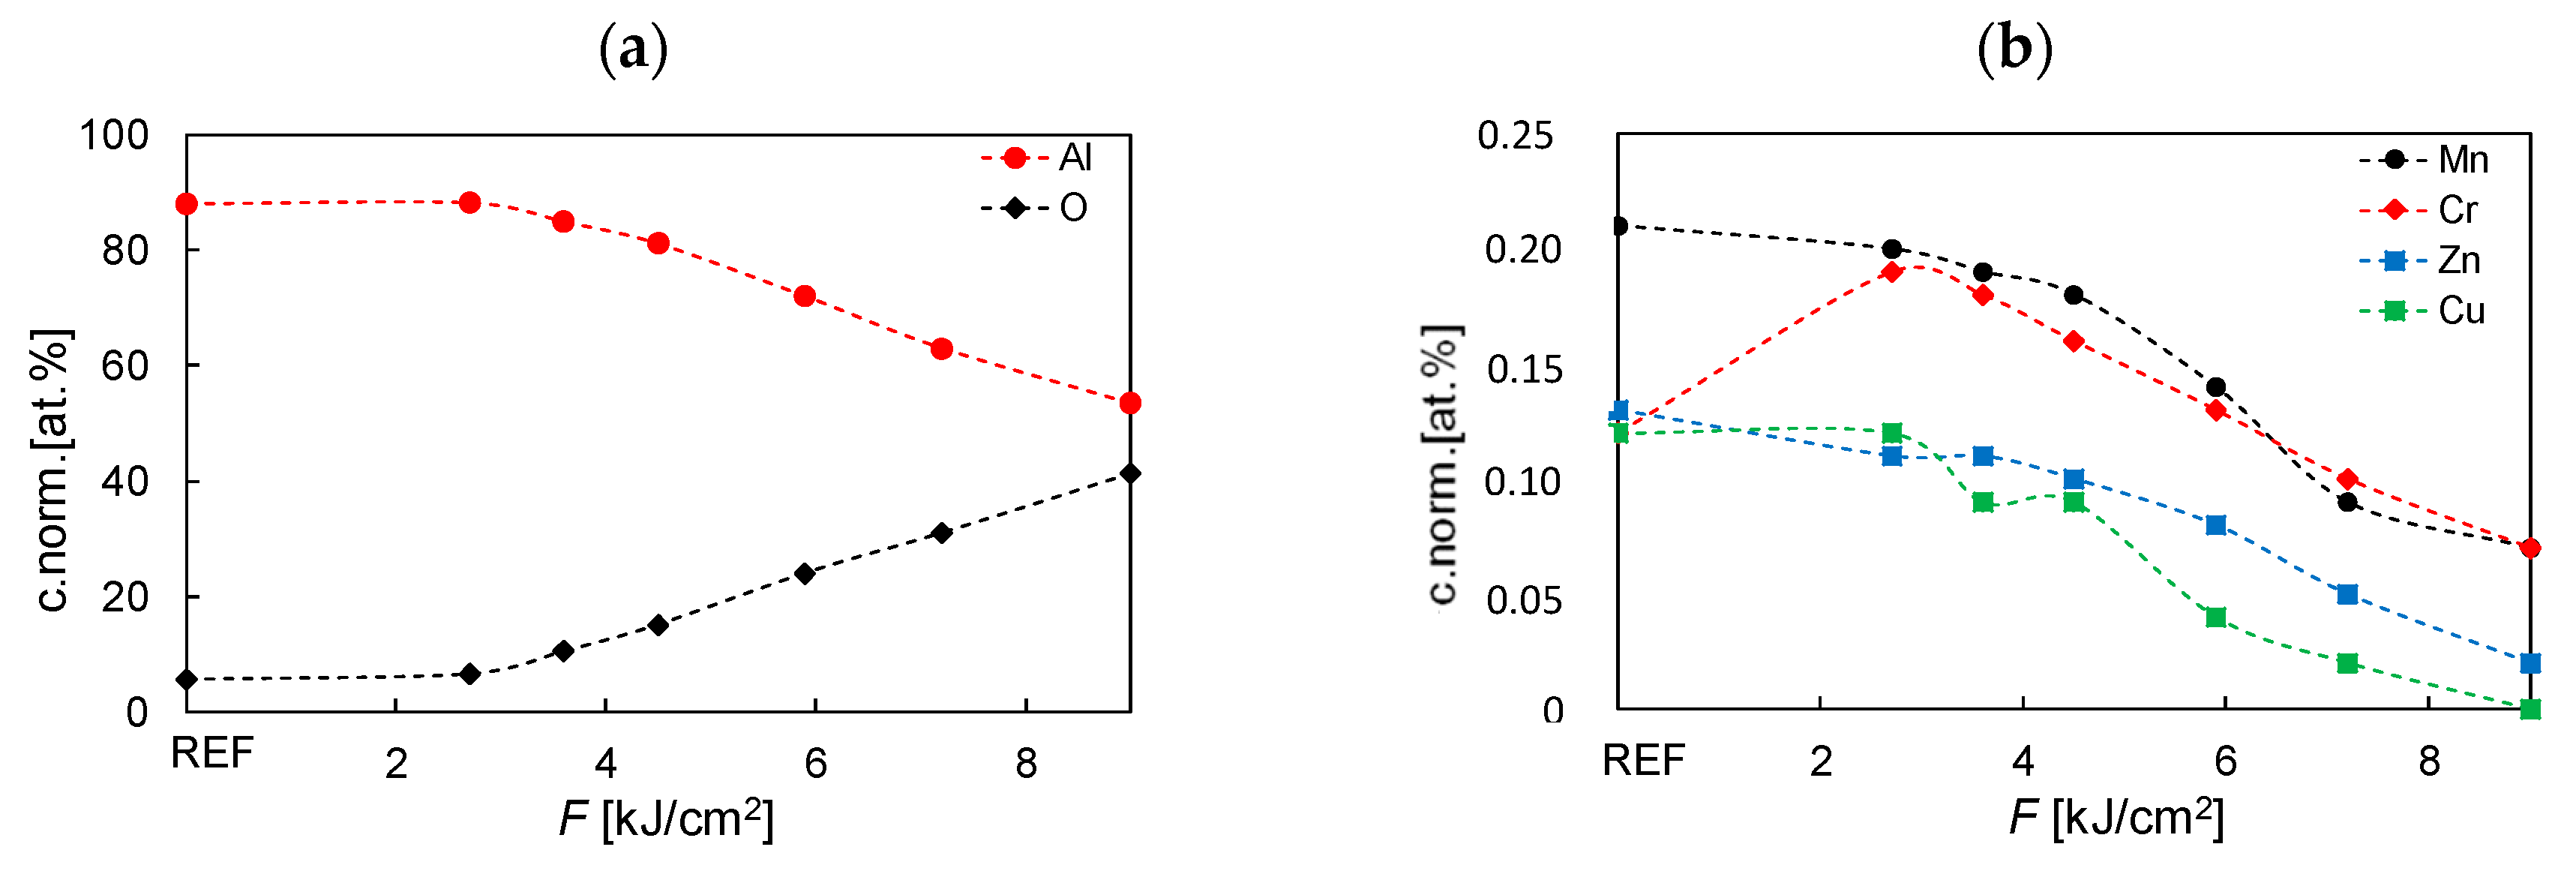
Figure 7 presents the results of chemical tests on EDX. As expected, an increase in the laser fluence caused an increase in the proportion of oxygen in the analyzed layer, mainly at the expense of aluminum (
Figure 7a). With the increase of the laser energy density (and, thus, with the increase of oxidation of the layer), the content of other elements also decreased (
Figure 7b). The decrease in Cu lowers the overall potential of the Cu-rich phases [
10]. Nevertheless, due to the significant depth of penetration during the analysis (~2–3 μm), the obtained result should be treated as the average value of the concentration of individual factors both in the oxide layer, as well as in the subsurface layer of the substrate itself.
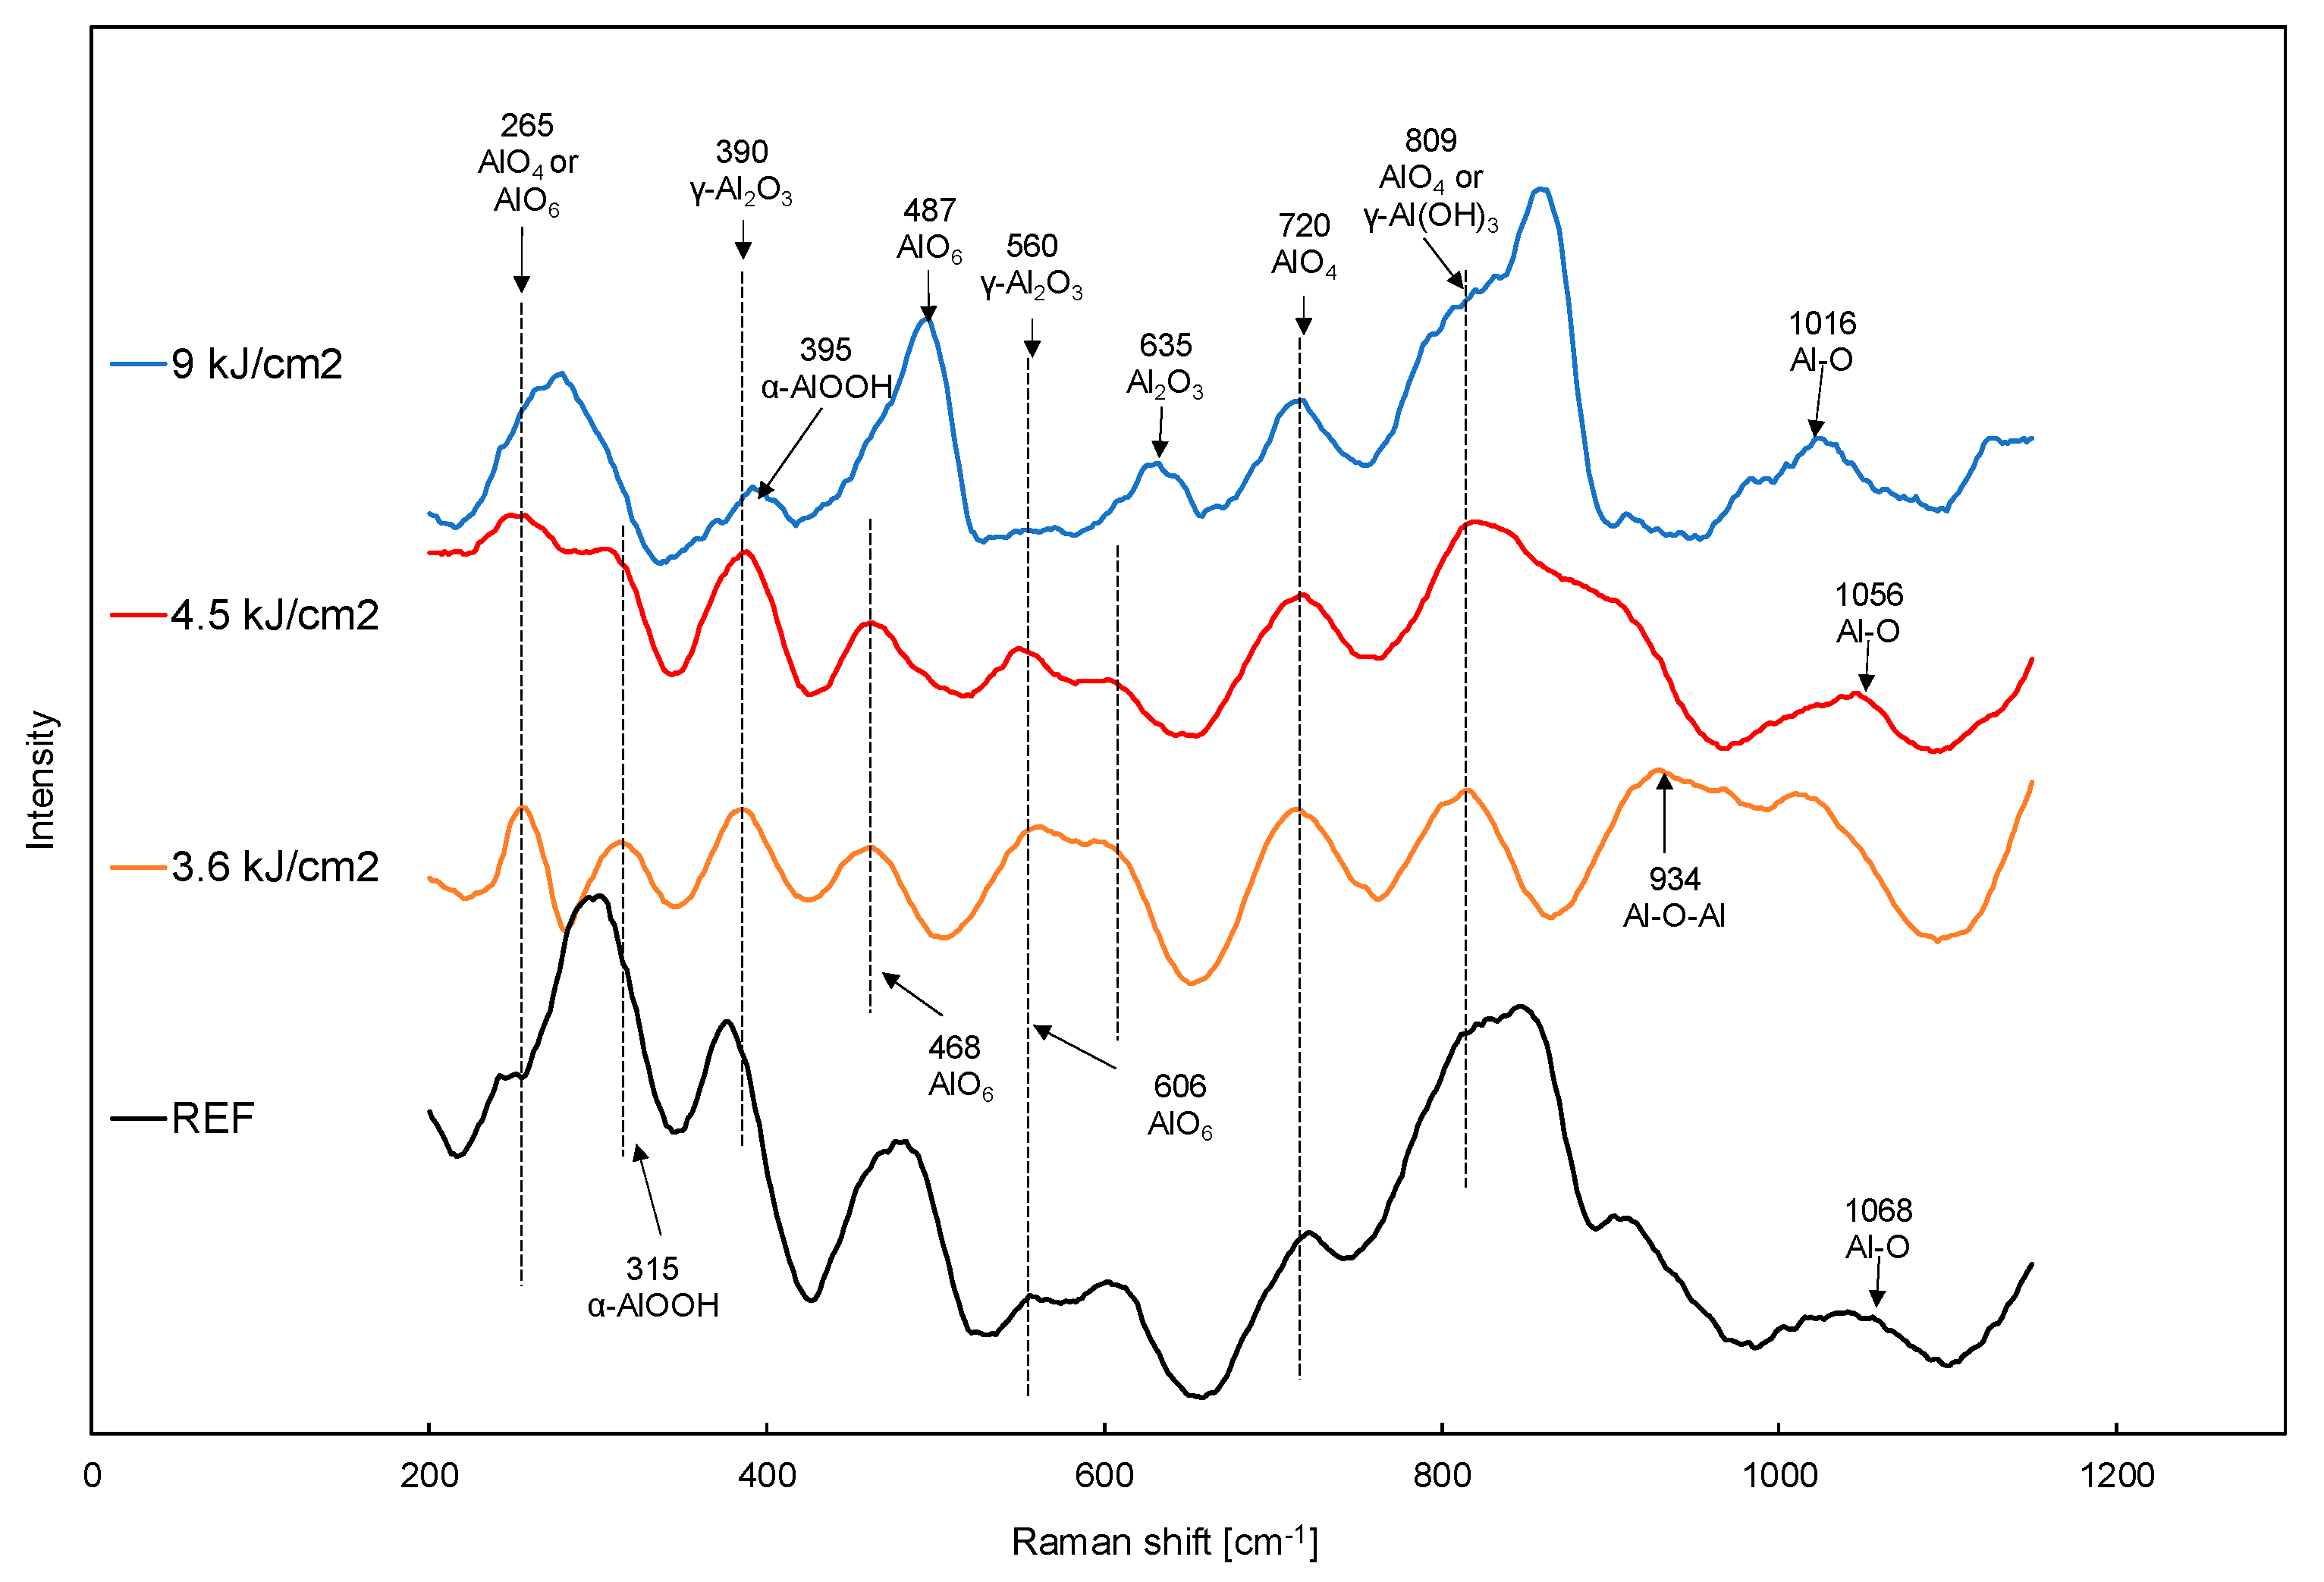
Laser-induced thin oxide layers have a complex physico-chemical structure that changes with the laser energy density. The layers formed by laser annealing are a gradient (they grow from the substrate). There is no clear boundary between the oxide produced and the substrate material. Therefore, chemical composition analysis is difficult. Raman spectra are complex and ambiguous (
Figure 8). However, it can be seen that the high-fluence sample has a spectrum more similar to the referential sample than the low-fluency samples (in which improvement of corrosion properties was noted). However, due to the fact that mainly non-stoichiometric compounds are formed, it is difficult to assign individual bands to individual compounds. Some bands are poorly separated due to the close proximity of different signals. Aluminum oxides in the Al
2O
3, AlO
4, and AlO
6 forms predominate in the spectra. Aluminum oxide forms testify to the presence of a passive layer on the surface of the substrate, which is characteristic of this type of substrate. The observed wide signals near 1016, 1056, and 1068 cm
−1 may come from an Al–O bending bode [
15]. For fluency of 3.6 kJ/cm
2, a peak appears at 934 cm
−1, which can be derived from symmetric stretch Al–O–Al. Broad signals were detected for all samples, near 809 cm
−1 from vibration groups γ-Al(OH)
3 or condensed AlO
4 [
16,
17]. Around 720 cm
−1, AlO
4 appears to occur. Nearly 640 cm
−1 (sample subjected to higher energy density
F ≥ 4.5 kJ/cm
2), there are characteristic signals from amorphous Al
2O
3 [
18]. A peak at 560 cm
−1 may be associated with γ-Al
2O
3 formation. Signals near 468, 487, and 606 cm
−1 may come from the AlO
6 insulated form of alumina [
18]. Vibration of α-AlOOH groups has characteristic signals near 315 and 295 cm
−1 [
16,
17]. In the case of samples irradiated with low laser fluence (
F < 4.5 kJ/cm
2), peaks around 265 cm
−1 were observed, which may be due to vibrations of the tetrahedral or octachedral form of alumina (AlO
4 or AlO
6) [
18].


