Article

Electrochemical Studies on CaP Electrodeposition on Three Dimensional Surfaces of Selective Laser Melted Titanium Scaffold

1
Center for Precision Engineering, Guangzhou Institutes of Advanced Technology Chinese Academy of Sciences, Guangzhou 511458, China
2
Center for Precision Engineering, Shenzhen Institutes of Advanced Technology Chinese Academy of Sciences, Shenzhen 518055, China
3
Guangdong Technical College of Water Resources and Electric Engineering, Guangzhou 510925, China
4
Guangzhou Janus Biotechnology Co., Ltd., Guangzhou 511458, China
*
Author to whom correspondence should be addressed.
Coatings 2019, 9(10), 667; https://doi.org/10.3390/coatings9100667
Submission received: 30 August 2019 / Revised: 8 October 2019 / Accepted: 9 October 2019 / Published: 14 October 2019
(This article belongs to the Section Bioactive Coatings and Biointerfaces)

Abstract

:
In this work, calcium phosphate (CaP) coating was electrodeposited on the three dimensional surface of SLM-Ti scaffolds. The in situ measurement showed that the potential variation within 5 mm thickness porous selective laser melting (SLM)-Ti samples was about 80 mV as a result of the low conductivity of CaP coatings. SEM observation results revealed that the coating morphology depended on the distance between the surface position of porous SLM-Ti electrode and the auxiliary electrode. Based on the compared electrochemical experiments, it was found that the top and the bottom surfaces of SLM-Ti scaffolds exhibited continuous nucleation and instantaneous nucleation behavior respectively. The Electrochemical impedance spectroscopy (EIS) results also revealed that the electrodeposition processes at different depth of SLM-Ti scaffolds were not synchronized. These differences were ultimately caused by the non-uniform distribution of the potential and the current inside porous SLM-Ti electrodes. The present work provides a basic research method for studying the mechanism of the electrochemical process on three dimensional surfaces of SLM-Ti scaffolds.

1. Introduction

Bone fusion has been one of the most important issues in bone engineering. Porous titanium possessing interconnecting pores and high porosity enables the host bone to grow into the scaffolds, suggesting a direct bone fusion between the host bone and artificial bone can be achieved [1,2]. Selective laser melting (SLM) based on the principle of incremental manufacturing of materials is compatible with titanium and can directly control configurations with dimensional accuracy up to several hundred micros [3,4,5]. Recently, numerous attempts have been made to manufacture novel biomorphic titanium alloy and Ti-based matrix composites by SLM [6,7]. Meanwhile, the innovative potential and application prospect of SLM-Ti scaffolds in orthopedic surgery are widely expected.
To further promote bone fusion, it is critical to develop biomimetic coatings with specific surface characteristics on titanium-based biomaterials. Calcium phosphate (CaP) layer is considered to be osteoconductive and potentially osteoinductive in the early stages after implantation [8,9]. However, the biomechanical strength of CaP ceramic is too poor to be used as a load-bearing artificial bone. Therefore, CaP coatings prepared on bioinert titanium substrate were widely investigated to obtain a composite material with higher mechanical strength, better bone conductivity, and potential bone induction [10,11,12].
Among the many proposed techniques for depositing CaP layers onto titanium substrate, electrochemical deposition has shown advantages of relative simplicity, economy, and speed and it may allow uniform CaP deposition covering complex scaffold structures [13,14,15]. CaP coatings were electrochemically deposited on different metals in several solutions at controlled temperature [16,17]. However, most of the reports so far were based on two-dimensional (2D) substrates, while those based on three-dimensional (3D) scaffolds are limited [18]. In fact, the translation of electrochemical modification from 2D to 3D complex structures has not made much progress in the recent years. The non-uniform potential distribution within porous electrodes is still the critical unsolved problem. Since the electrode potential and current change along with the degree of depth change inside the SLM-Ti scaffolds, the variation of electrochemical reactions on the internal surface are in accord with the change of polarization behavior under the local electrochemical conditions. Furthermore, the potential and current distribution will become more non-uniform with the increase of deposition time, when the 3D electrode surface is coated with a lower electrical conductivity layer.
This work aims at investigating and comparing the CaP electrochemical deposition process on 3D SLM-Ti scaffolds and on 2D SLM-Ti sheets, for better understanding of the nucleation and growth behaviors of CaP coating on the entire surface within porous SLM-Ti electrodes.

2. Materials and Methods

2.1. Materials

Rectangular porous SLM-Ti scaffolds (3 mm × 3 mm × 5 mm, 750 μm pore size, designed porosity: 86%, and surface area: 148.6 mm2), were fabricated using a SLM 125HL machine (SLM Solutions, Lübeck, Germany) as shown in Figure 1. The raw material of the SLM-Ti scaffolds was commercially spherical pure Ti powder (>99.5% purity) with particle size less than 30 μm. The SLM processes were performed as described in our previous study [19]. The samples obtained with the above process were sandblasted using Lepco peenmatic 620 s rig to eliminate the effect of surface roughness on the electrodeposition process. SiC sands of 320 mesh were chosen to impact the whole surface of SLM-Ti scaffolds. SiC sands were carried by compressed air (0–0.8 MPa) through a nozzle. The sample-nozzle distance was fixed at 10–50 mm.

2.2. Preparation of CaP Coating

Electrodeposition of CaP was carried out in a solution containing 0.61 × 10⁻³ M CaCl2 and 0.36 × 10⁻³ M NH4H2PO4 in a typical three-electrode cell using a CHI-660D electrochemical station (CHI, Shanghai, China). The SLM-Ti scaffold was used as the working electrode, and a platinum sheet (20 mm × 20 mm) and a Ag/AgCl micro-electrode were used as the auxiliary and reference electrode, respectively. The samples were then rinsed with deionized water several times, and dried under vacuum.

2.3. Characterization

The chronoamperometry, cyclic voltammetry (CV), and EIS measurements of the CaP electrodeposition on porous SLM-Ti scaffolds and dense SLM-Ti sheets were performed in the electrodeposition solution. In situ potential scanning measurement within the SLM-Ti scaffolds was carried out with the Unisense micro-reference electrode REF-10 with the outside tip diameter 10 μm. The REF-10 was fixed on the MM33 micromanipulator, which can control the movement accuracy of the REF-10 on the x-axis, y-axis, and z-axis to be 10, 10 and 100 microns respectively. The time monitoring potential at the top and bottom surface of the SLM-Ti scaffolds was set as 200 s and 20 s respectively. Each experiment was repeated at least five times, with a fresh specimen for each test. The surface morphology was examined by field emission scanning electron microscopy (Nova Nano SEM 430). The phase composition was identified by XRD analysis (X’ Pert Pro MRD).

3. Results and Discussion

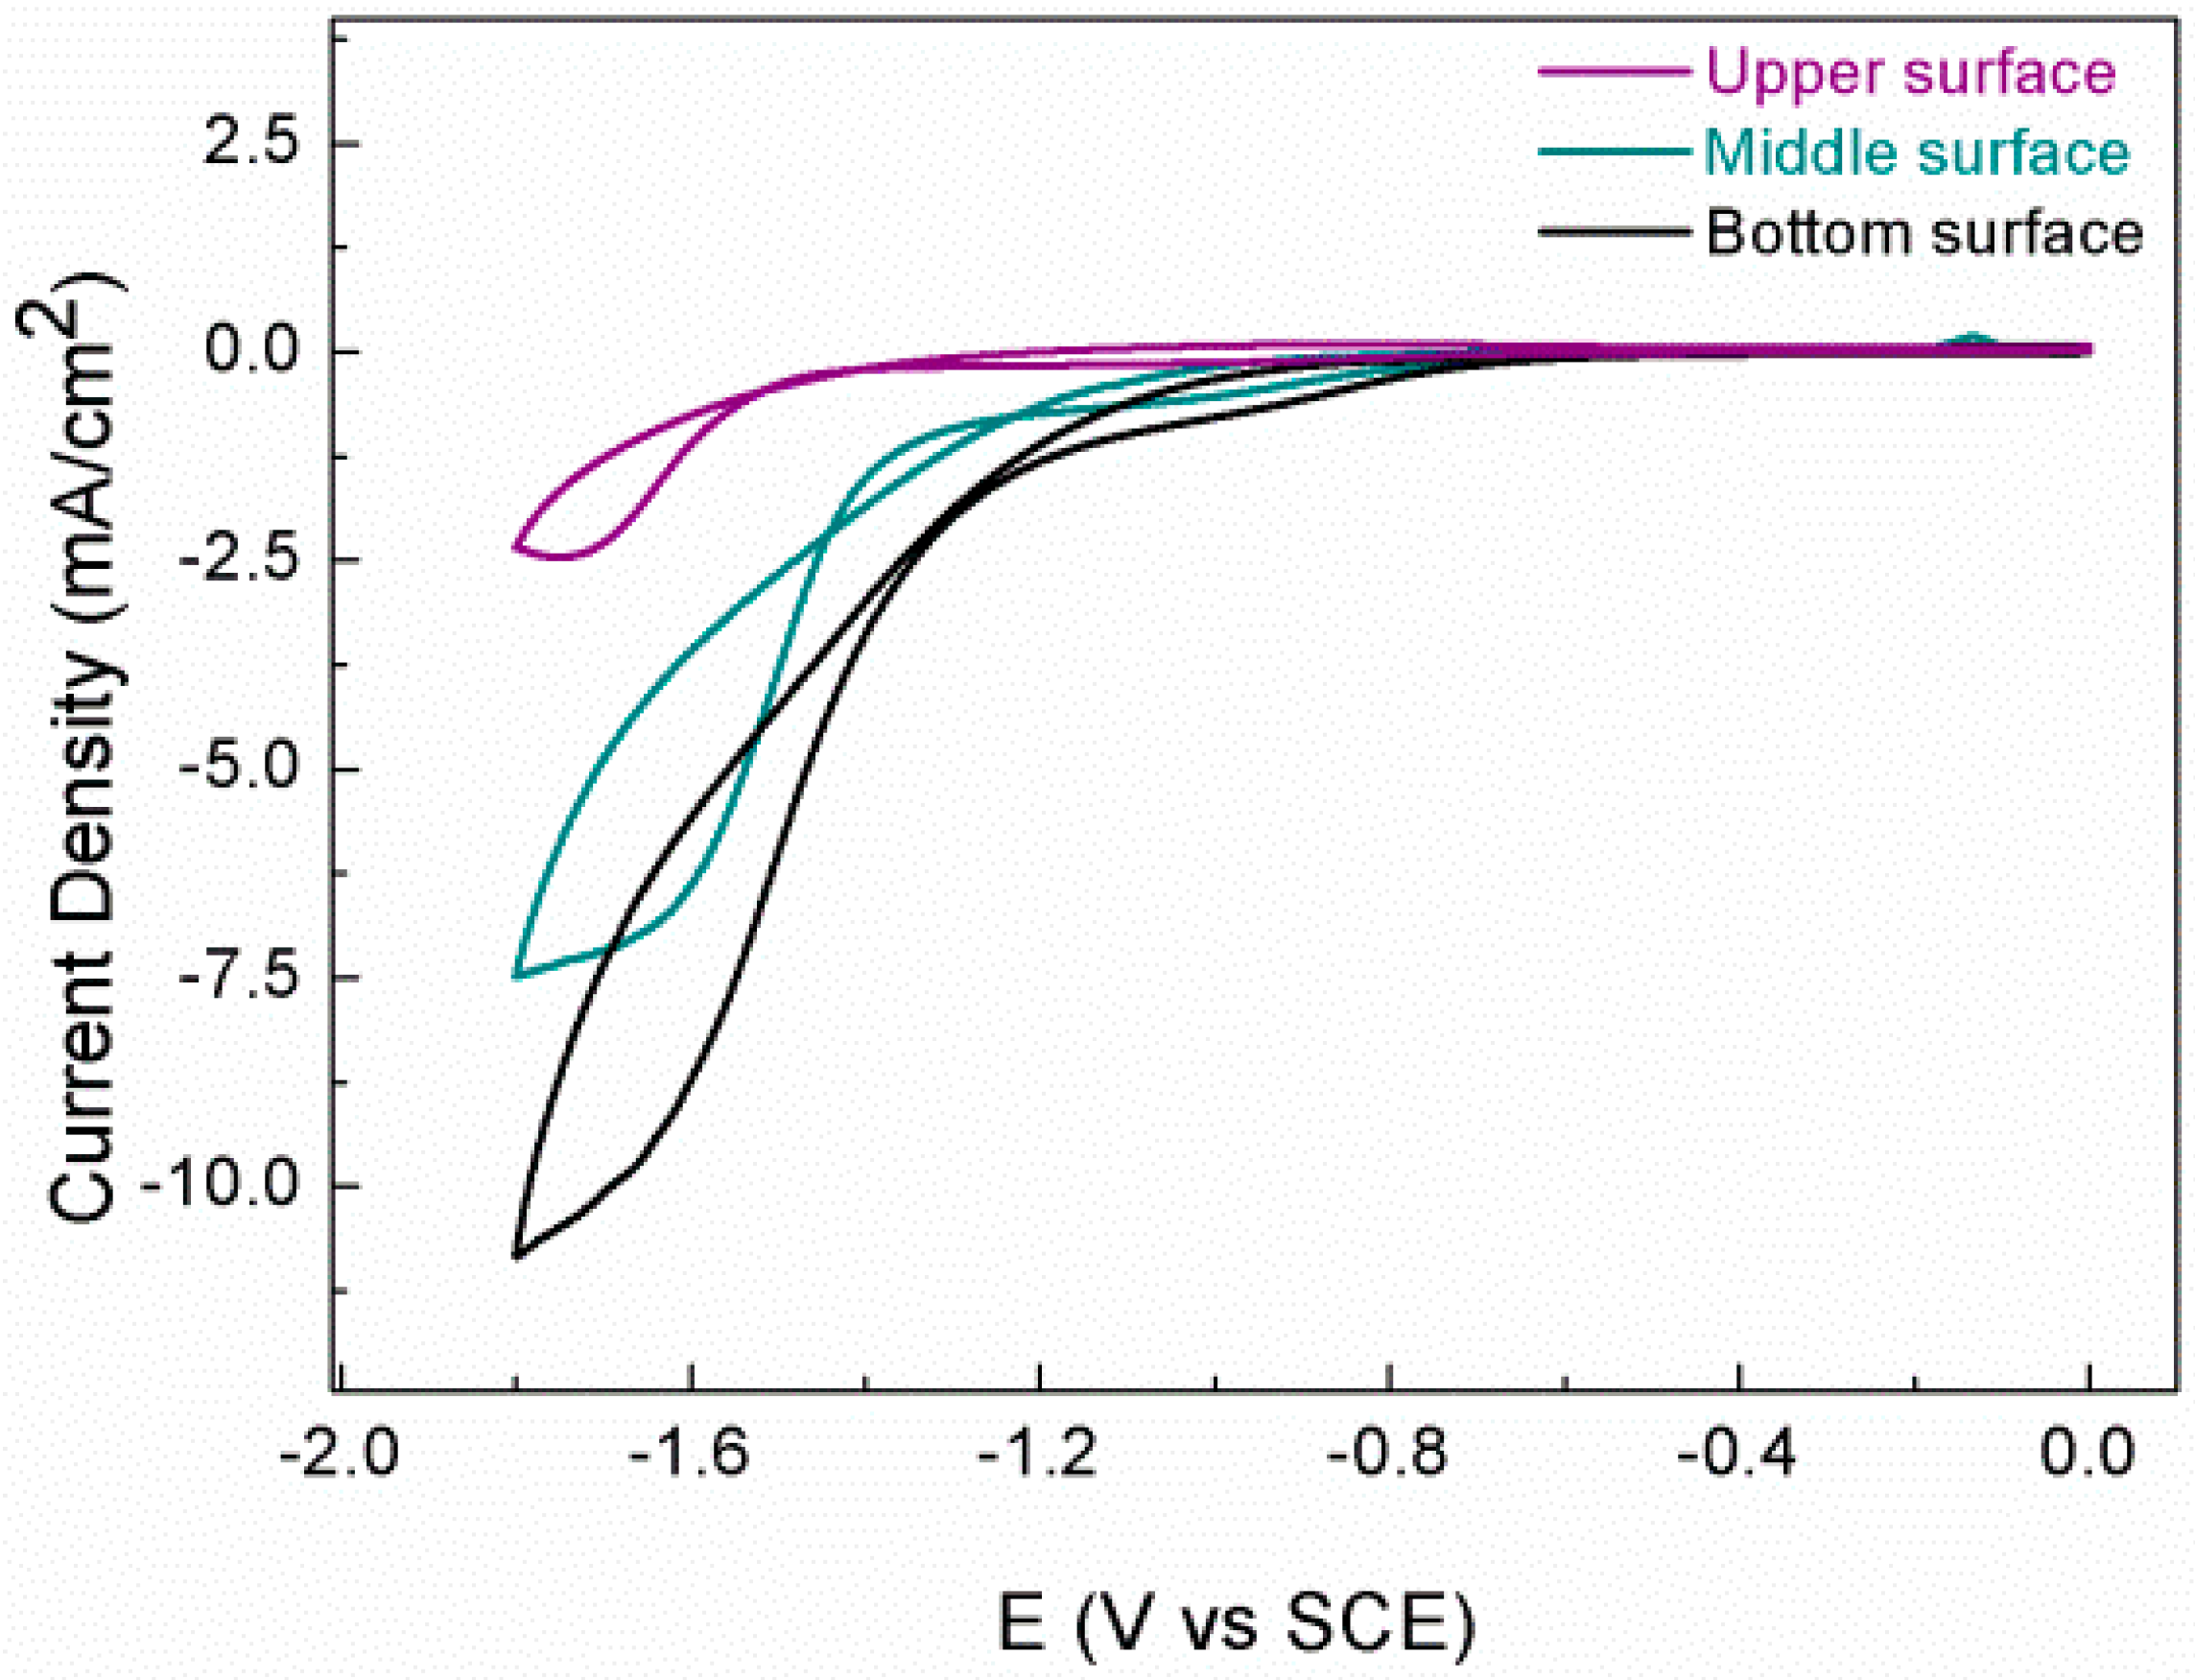
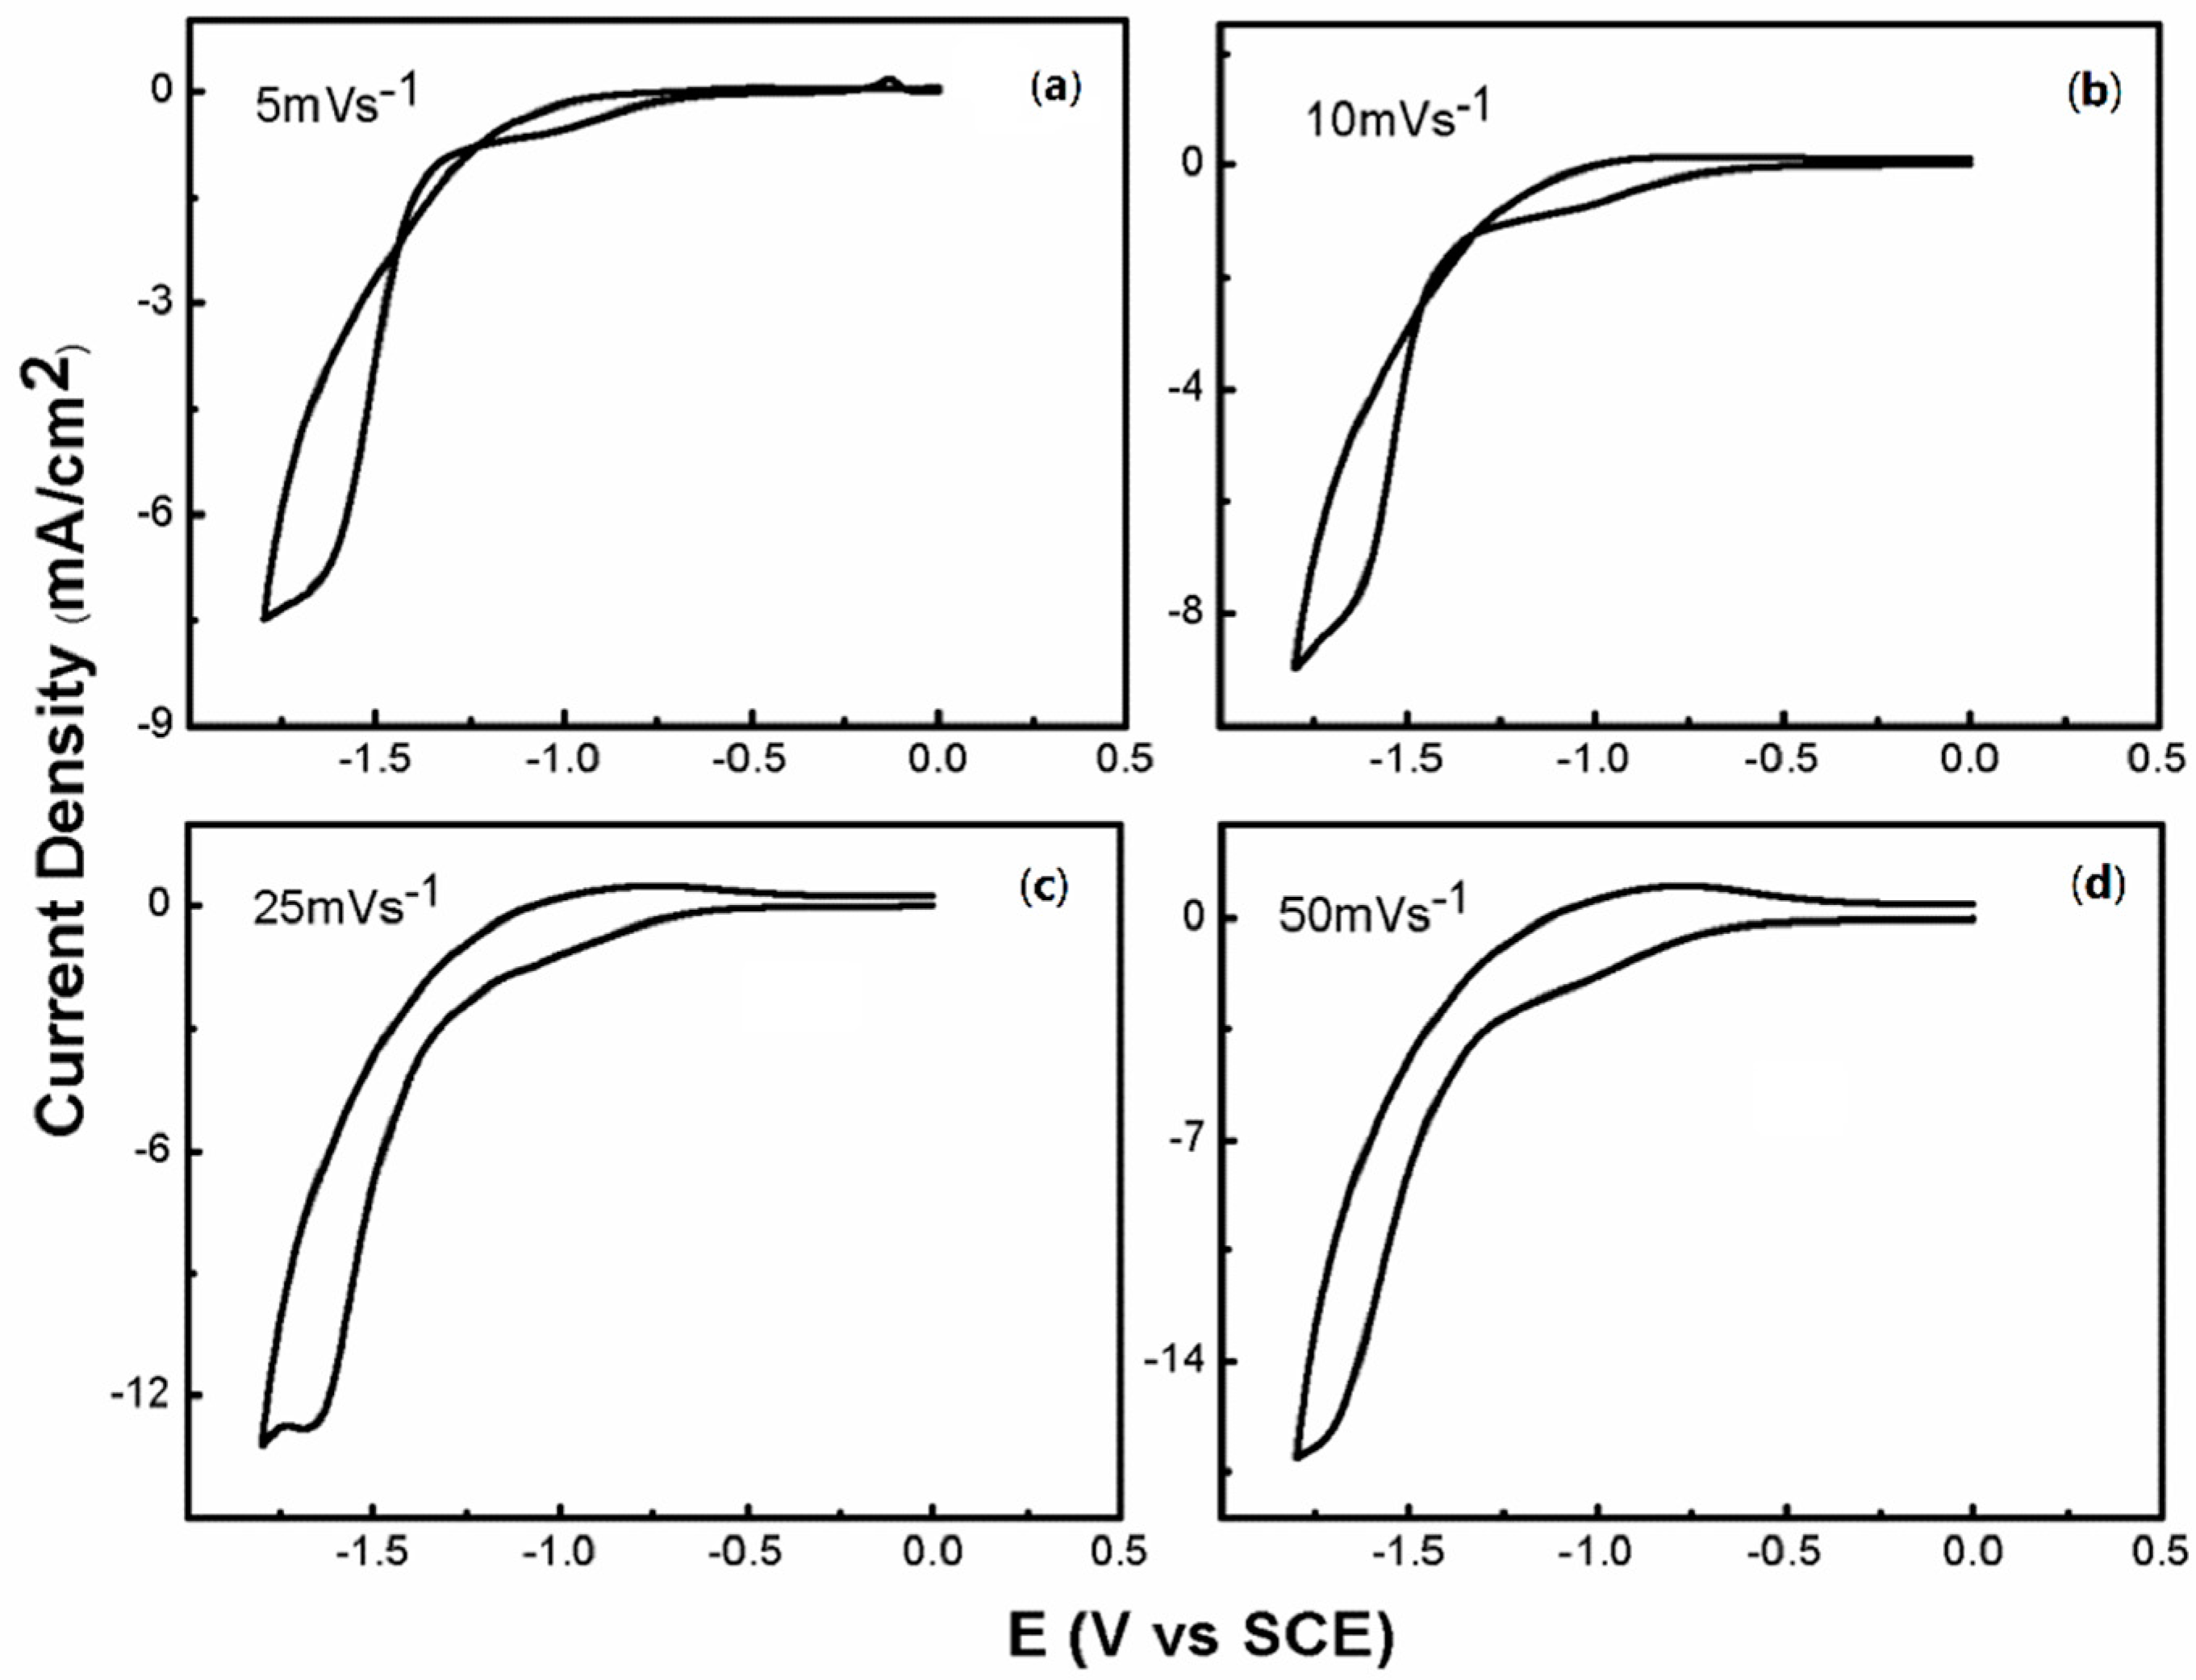
3.1. Potential Distribution within SLM-Ti Scaffolds

The potential distributions are influenced by factors of cell geometry, electrode shape, electrolyte conductivity, charge overpotential, and concentration overpotential. Here, the resistance within the cell was the main factor to be analyzed, because the potential distribution will become more uniform if the effects of concentration overpotential and charge overpotential are taken into consideration [20]. For the electrochemical process inside the porous electrode, the ohmic resistance inside the cell is related to the conductivity of the electrolyte and the coating according to Ohm’s law.
The potential variation within porous SLM-Ti samples during the CaP deposition is shown in Figure 2. It can be observed that the potential difference within the 5 mm thickness SLM-Ti scaffolds was approximately 50 mV at the beginning of the deposition and increased to 80 mV with the extension of deposition time since the 3D surface was gradually covered by the lower electrical conductivity layer.
SEM photographs (Figure 3) show that the CaP layer deposited on both the inner and outer surfaces of SLM-Ti scaffolds. XRD analysis confirmed that the deposited layers were calcium phosphate (Figure 4). At the lower magnification (Figure 3a,b), the complete and dense deposited layer is observed on the top surface of SLM-Ti scaffolds, while the non-complete and porous layer is observed on the bottom surface. At the higher magnification (Figure 3c,d), the SLM-Ti scaffolds show a plate-like structure on the top surface, while the bottom surface mainly exhibits the needle-like dendrite structure. These data confirm that the distribution of current and potential of SLM-Ti scaffolds was non-uniform, as was, correspondingly, the deposition rate.
XRD patterns of the coated SLM-Ti scaffolds (Figure 4) revealed the appearance of peaks for apatite CaP (at 2θ = 18.79°, 22.90°, 25.88°, 28.13°, 28.97° and 31.78°). These apatite peaks were not present on uncoated SLM-Ti scaffolds. This analysis suggested the deposited layer on SLM-Ti scaffolds under this experimental condition was hydroxyapatite (JCPDCS # 00-009-0432).

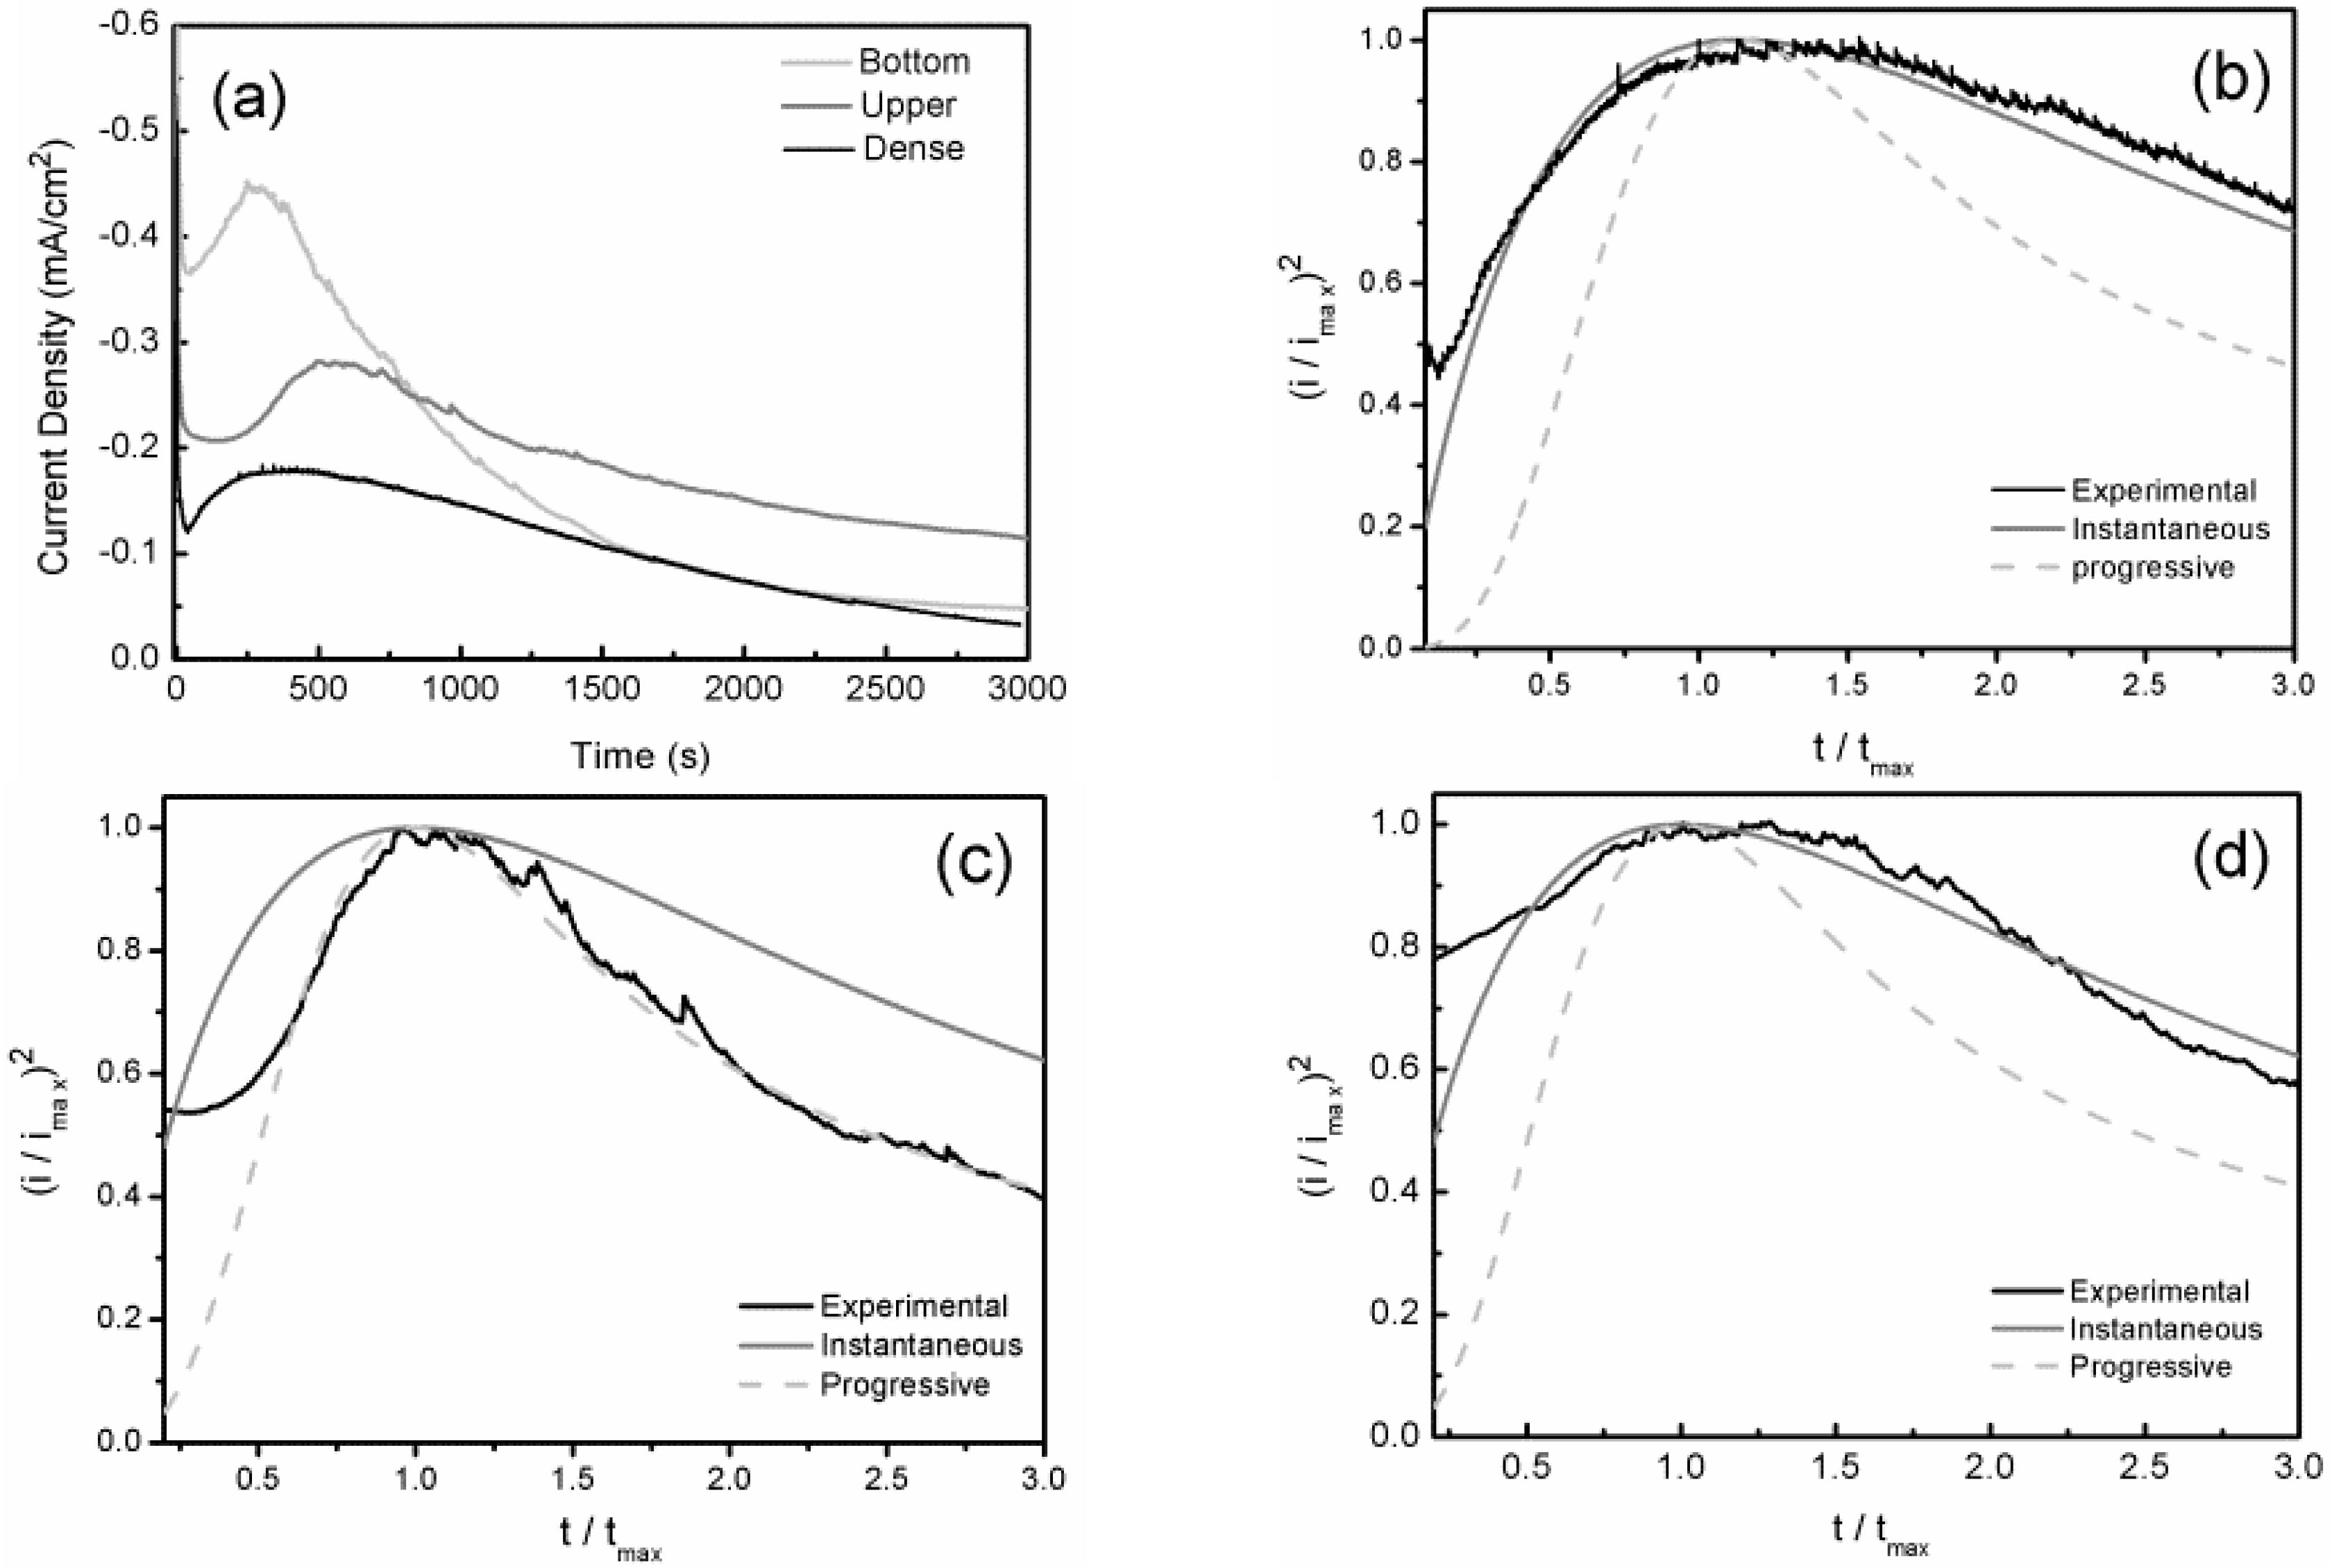
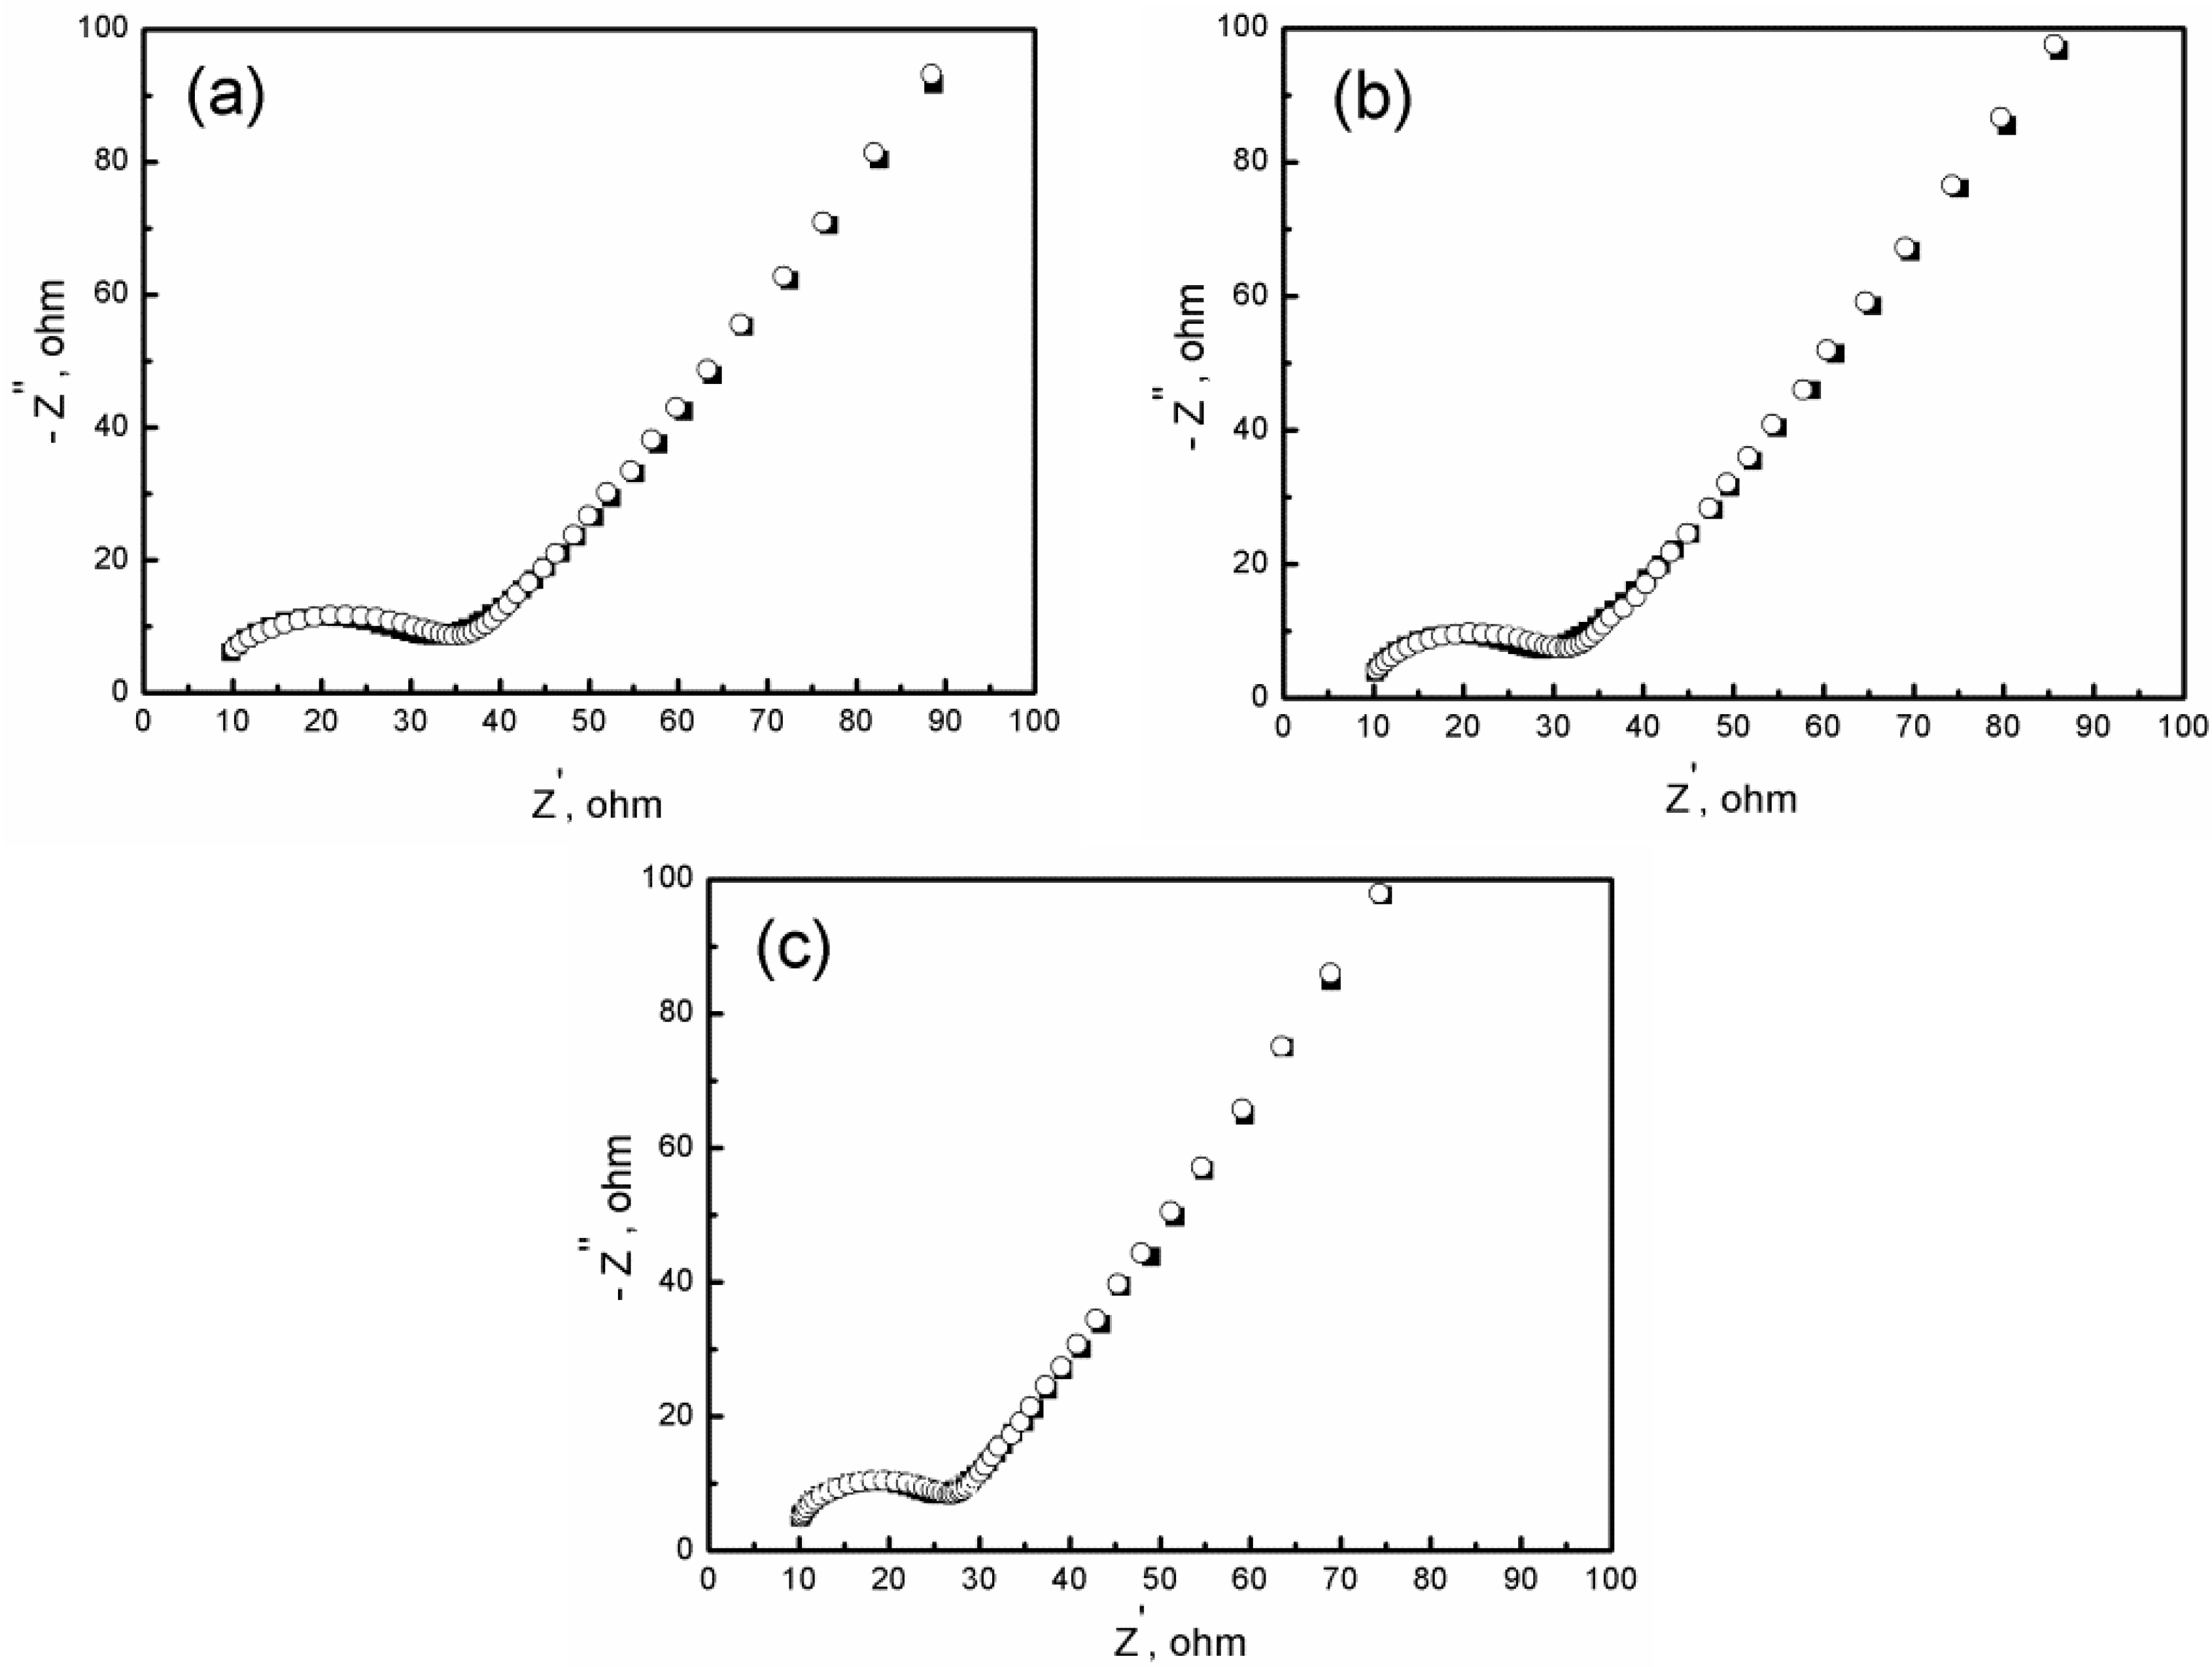
3.2. Nucleation and Growth of CaP Coatings

Figure 5 shows the cyclic voltammograms curves, plotted by measuring the dense and porous SLM-Ti samples immersed in the deposition electrolyte. It shows that the voltammograms are characterized with two cathodic peaks, which were associated with the reduction of water and the reduction of H2PO4− to HPO42−, respectively [21]. The CV diagrams of both dense and porous SLM-Ti samples show a characteristic hysteresis which appeared after potential sweep reversal. Based on the previous potentiostatic experiments [22,23], it can be confirmed that under the present experimental conditions, the electrodeposition on titanium substrate occurred predominantly in a 3D nucleation mode.
To analyze the local deposition process, the micro-reference electrode was placed at different depths of SLM-Ti scaffolds for CV experiments under the same setting from −1.8 to 0.2 V. When the micro-reference electrode was placed on the bottom surface of the SLM-Ti scaffolds, the actual applied potential was the largest to make up for the ohmic drop. For the same reason, the absolute value of the applied potential in order of magnitude should be En (bottom) > En (middle) > En (top) under the same potential setting.
Here, the term “crossover voltage” (Ec) is used to refer to the point in CV where the currents of the forward and the reverse cycles intersect. If the nucleation process is reversible and charge transfer limited throughout the entire voltage range of the CV, the potential Ec should not vary with variations in En.
On the other hand, if the nucleation process becomes diffusion-limited at large negative values of En, then Ec changes in the opposite direction of any changes of En [24]. The results in Figure 3 show a similar situation, suggesting the presence of diffusion-limited mass transfer. In Figure 3, Ec changes inversely with En, having the values of −1.52, −1.41, and −1.25 V for En obtained with the micro-reference electrode located at top, middle, and bottom surface, respectively.
Besides, whether the nucleation of CaP deposit on porous SLM-Ti electrode depends on the voltage scan speed v was tested in Figure 6. It was shown that the scan speed v set at 5 and 10 mV s−1 always yielded crossed voltammograms, indicating the presence of 3D nucleation in these scans. For v ≥ 25 mV s−1, the voltages changed too fast to support nucleation. Based on these results, and those in Figure 5, it can be concluded that under the present experimental conditions, the nucleation process of CaP coating at the different depth of SLM-Ti scaffold was mainly controlled by mass transfer.
Figure 7a shows the current-time transients recorded on porous and dense SLM-Ti samples in deposition electrolyte. The curves have the tendency to decrease first and then increase up to a current maximum value (tmax, imax). Obviously, it takes the longer time for the porous SLM-Ti scaffolds to reach the maximum current.
Based on the above discussion (Figure 5 and Figure 6), the nucleation process was diffusion controlled under the experimental condition analyzed here. Theoretical plots for progressive and instantaneous 3D nucleation processes under diffusion control are given by the following equations in terms of the current maximum value (tmax, imax) [25]:
i 2 i m 2   =   1.2254 t m t [ 1 e x p ( 2.3367 t 2 t m 2 ) ] 2
i 2 i m 2   =   1.9542 t m t [ 1 e x p ( 1.2564 t t m ) ] 2
Figure 7b–d shows the non-dimensional i2/i2m versus t/tm plot for the data from Figure 5. For instantaneous nucleation, the nuclei were formed at the beginning of polarization and the number of nuclei were constant. For progressive nucleation, the number of nuclei showed a linear relationship with the time. A convenient criterion is to compare the experimental data with the two limiting cases of the theoretical nucleation growth models. As shown in Figure 7b, the curve of CaP deposited on dense SLM-Ti samples is consistent with the theoretical curve based on the instantaneous 3D nucleation model. For SLM-Ti scaffolds, when the micro-RE was placed on its bottom surface, the curve is consistent with the instantaneous 3D nucleation model; however, when the micro-RE was placed on its top surface, it is more agreement with progressive 3D nucleation model. The difference can be attributed to the non-uniform distribution of the current and potential of SLM-Ti scaffolds. As discussed above, the absolute value of the applied potential in order of magnitude is En (bottom) > En (middle) > En (top) under the same potential setting. Thus, imax increases and tmax decreases with the actual applied potential.
There is a threshold voltage for electrodeposition and nucleation. When the applied potential at the top surface of porous SLM-Ti electrodes was set close to the threshold potential, the nucleation could occur first on the top surface and then on the inner surface, which is consistent with the progressive nucleation model. On the contrary, if the applied potential on the whole surface of porous SLM-Ti electrode could reach the threshold potential, just as in the case of placing the micro-RE on the bottom surface, the electrodeosition process followed the 3D instantaneous nucleation. Based on the reported potentiostatic methods [26,27,28], under the working conditions of this experiment, CaP deposition predominantly occurred in 3D instantaneous nucleation.
To detect the changes of the entire surface of porous SLM-Ti electrodes during CaP deposition, EIS data in Figure 8 were recorded at different deposition times using the conventional Ag/AgCl reference electrode. The plot included a semicircle at Zre axis in the high-frequency region and a straight line in the low-frequency region. The equivalent electrical circuit shown in Figure 9 was used to fit the EIS results [29]. In this circuit, the Re is attributed to the ohmic drop of electrolyte, Qc is the electrical capacitance of the deposition layer, Rp corresponds to the electrical resistance of the deposition layer, Rct is the charge transfer resistance, W represents Warburg impedance, and Qdl is the double layer capacitance.
During the deposition process, the bare electrode surface was gradually covered with the low electrical conductivity layer, and the semi-circle in the high frequency region is attributed to the parallel connection of the resistance and capacity characteristic of CaP coatings. This correspondence is consistent with the increase of the circle diameter when the coverage percentage increases, namely when the coating resistance Rp increases.
Figure 10 shows Nyquist plots obtained at different depths of SLM-Ti scaffolds. It can be found that the plots obtained from the local area of SLM-Ti scaffolds by using the micro-reference electrode are well fitted to the equivalent circuit (Figure 9) also. For the top surface of SLM-Ti scaffolds (Figure 10a), there is an obvious capacitive loop, so the charge transfer resistance cannot be ignored. However, for the bottom surface of SLM-Ti scaffolds (Figure 10b), the semi-circle in Nyquist plot is very small. In the case of a mixed system controlled by the kinetic and diffusion processes, the different plot shape of Nyquist diagram confirms that the electrochemical deposition reaction at different depth is not uniform. Inside the porous SLM-Ti electrode, the closer to the counter electrode, the faster the electrodeposition rate is. The bottom surface deep inside the SLM-Ti scaffold was relatively lower covered by CaP deposit, which is confirmed by Figure 3. Thus, for the bottom surface of the SLM-Ti scaffold, the charge transfer impedance in the equivalent circuit is not significant and the contribution of the diffusion impedance W becomes predominant. At this depth, the electrodeposition process is mainly controlled by the diffusion process associated with the concentration gradient localized in the porous electrode and the porous CaP layer.

4. Conclusions

The nucleation and growth behaviors of the electrodeposition of CaP coating on 3D surfaces of SLM-Ti scaffolds were studied in this work. The comparative analysis shows that the differences of CaP electrodeposition mechanism between 3D and 2D SLM-Ti substrates are mainly attributed to the non-uniform distribution of the potential and current inside SLM-Ti scaffolds. The results provide the necessary data for fine-tuning deposition parameters, such as decreasing potential variation or/and intensifying mass transport within SLM-Ti scaffolds, to obtain the CaP coating with uniform physicochemical properties. Thus, the biological properties of SLM-Ti scaffolds can be predicted.

Author Contributions

Conceptualization, methodology, and validation: X.S., H.L., and S.D.; investigation: X.S., H.L., and C.Z.; writing-original draft preparation: X.S., H.L., and S.D.; writing-review and editing: X.S., H.L., C.Z., J.J. and S.D.; supervision: X.S., H.L., and S.D.

Funding

This research was funded by the Science and Technology Planning Project of Guangdong province (2017B090901039); the Basic research project of Shenzhen (JCYJ 20170307165115731); and the Science and the Technology Program of Nansha (2016GJ009).

Conflicts of Interest

The authors declare no conflict of interest. The funders had no role in the design of the study; in the collection, analyses, or interpretation of data; in the writing of manuscript, or in the decision to publish the results.

References

  1. Hirota, M.; Shima, T.; Sato, I.; Ozawa, T.; Iwai, T. Development of a biointegrated mandibular reconstruction device consisting of bone compatible titanium fiber mesh scaffold. Biomaterials 2016, 75, 223–236. [Google Scholar] [CrossRef] [PubMed]
  2. Holtorf, H.L.; Jansen, J.A.; Mikos, A.G. Ectopic bone formation in rat marrow stromal cell/titanium fiber mesh scaffold constructs: Effect of initial cell phenotype. Biomaterials 2005, 26, 6208–6216. [Google Scholar] [CrossRef] [PubMed]
  3. Taniguchi, N.; Fujibayashi, S.; Takemoto, M.; Sasaki, K.; Otsuki, B. Effect of pore size on bone ingrowth into porous titanium implants fabricated by additive manufacturing: An in vivo experiment. Mater. Sci. Eng. C 2016, 59, 690–701. [Google Scholar] [CrossRef] [PubMed]
  4. De, W.M.; Schumacher, R.; Mayer, K.; Schkommodau, E.; Thoma, D. Bone regeneration by the osteoconductivity of porous titanium implants manufactured by selective laser melting: A histological and micro computed tomography study in the rabbit. Tissue Eng. Part A 2013, 19, 2645–2654. [Google Scholar]
  5. Vrancken, B.; Thijs, L.; Kruth, J.P.; Humbeeck, J.V. Microstructure and mechanical properties of a novel β titanium metallic composite by selective laser melting. Acta Mater. 2014, 68, 150–158. [Google Scholar] [CrossRef]
  6. Hooyar, A.; Matthias, B.; Mariana, C.; Lai, C.Z.; Sergio, S.; Jürgen, E. Selective laser melting of in situ titanium–titanium boride composites: Processing, microstructure and mechanical properties. Acta Mater. 2014, 76, 13–22. [Google Scholar]
  7. Attar, H.; Calin, M.; Zhang, L.C.; Scudino, S.; Eckert, J. Manufacture by selective laser melting and mechanical behavior of commercially pure titanium. Mater. Sci. Eng. A 2014, 21, 170–177. [Google Scholar] [CrossRef]
  8. Goldberg, M.A.; Smirnov, V.V.; Teterina, Y.A.; Barinov, S.M.; Komlev, V.S. Trends in Development of Bioresorbable Calcium Phosphate Ceramic Materials for Bone Tissue Engineering. Polym. Sci. Ser. D 2018, 11, 419–422. [Google Scholar] [CrossRef]
  9. Samavedi, S.; Whittington, A.R.; Goldstein, A.S. Calcium phosphate ceramics in bone tissue engineering: A review of properties and their influence on cell behavior. Acta Biomater. 2013, 9, 8037–8045. [Google Scholar] [CrossRef]
  10. Bose, S.; Banerjee, D.; Shivaram, A.; Tarafder, S.; Bandyopadhyay, A. Calcium phosphate coated 3D printed porous titanium with nanoscale surface modification for orthopedic and dental applications. Mater. Des. 2018, 151, 102–112. [Google Scholar] [CrossRef]
  11. Hamlet, S.; Ivanovski, S. Inflammatory cytokine response to titanium chemical composition and nanoscale calcium phosphate surface modification. Acta Biomater. 2011, 7, 2345–2353. [Google Scholar] [CrossRef] [PubMed]
  12. Abbasi, S.; Golestani-Fard, F.; Rezaie, H.R.; Mirhosseini, S.M.M. MAO-derived hydroxyapatite/TiO2 nanostructured multi-layer coatings on titanium substrate. Appl. Surf. Sci. 2012, 261, 37–42. [Google Scholar] [CrossRef]
  13. Metoki, N.; Sadman, K.; Shull, K.; Eliaz, N.; Mandle, D. Electro-Assisted Deposition of Calcium Phosphate on Self-Assembled Monolayers. Electrochim. Acta 2016, 206, 400–408. [Google Scholar] [CrossRef] [Green Version]
  14. Thomas, M.B.; Metoki, N.; Mandler, D.; Eliaz, N. In Situ Potentiostatic Deposition of Calcium Phosphate with Gentamicin-Loaded Chitosan Nanoparticles on Titanium Alloy Surfaces. Electrochim. Acta 2016, 222, 355–360. [Google Scholar] [CrossRef]
  15. Vidal, E.; Buxadera-Palomero, J.; Pierre, C.; Manero, J.M.; Maria-Pau, G.; Cazalbou, S.; Combes, C.; Rupérez, E.; Rodríguez, D. Single-step pulsed electrodeposition of calcium phosphate coatings on titanium for drug delivery. Surf. Coat. Technol. 2019, 358, 266–275. [Google Scholar] [CrossRef]
  16. Fathyunes, L.; Khalil-Allafi, J.; Moosavifar, M. Development of graphene oxide/calcium phosphate coating by pulse electrodeposition on anodized titanium: Biocorrosion and mechanical behavior. J. Mech. Behav. Biomed. Mater. 2019, 90, 575–586. [Google Scholar] [CrossRef] [PubMed]
  17. Fathyunes, L.; Khalil-Allafi, J. Effect of employing ultrasonic waves during pulse electrochemical deposition on the characteristics and biocompatibility of calcium phosphate coatings. Ultrason. Sonochem. 2018, 42, 293–302. [Google Scholar] [CrossRef]
  18. Chai, Y.C.; Truscello, S.; Bael, S.V.; Luyten, F.P.; Vleugels, J.; Schrooten, J. Perfusion electrodeposition of calcium phosphate on additive manufactured titanium scaffolds for bone engineering. Acta Biomater. 2011, 7, 2310–2319. [Google Scholar] [CrossRef]
  19. Sun, X.T.; Lin, H.S.; Chen, X.S.; Zhang, P. Comparative study on electrocrystallization of calcium phosphate ceramics on commercially pure titanium and selective laser melting titanium. Mater. Lett. 2017, 192, 92–95. [Google Scholar] [CrossRef]
  20. Pérez, T.; Nava, J.L. Numerical simulation of the primary, secondary and tertiary current distributions on the cathode of a rotating cylinder electrode cell. Influence of using plates and a concentric cylinder as counter electrodes. J. Electroanal. Chem. 2014, 719, 106–112. [Google Scholar] [CrossRef]
  21. Grubač, Z.; Metikoš-Huković, M.; Babić, R. Electrocrystallization, growth and characterization of calcium phosphate ceramics on magnesium alloys. Electrochim. Acta 2013, 109, 694–700. [Google Scholar] [CrossRef]
  22. Ballesteros, J.C.; Chaînet, E.; Ozil, P.; Trejo, G. Electrochemical studies of Zn underpotential/overpotential deposition on a nickel electrode from non-cyanide alkaline solution containing glycine. Electrochim. Acta 2011, 56, 5443–5451. [Google Scholar] [CrossRef]
  23. Zimmer, A.; Broch, L.; Boulanger, C.; Stein, N. Growth mechanism during the early stages of electrodeposition of bismuth telluride films. Electrochim. Acta 2015, 174, 376–383. [Google Scholar] [CrossRef]
  24. Emery, S.B.; Hubbley, J.L.; Roy, D. Voltammetric and amperometric analyses of electrochemical nucleation: Electrodeposition of copper on nickel and tantalum. J. Electroanal. Chem. 2004, 568, 121–133. [Google Scholar] [CrossRef]
  25. Fletcher, S.; Lwin, T. A general probabilistic model of electrochemical nucleation. Electrochim. Acta 1983, 28, 237–243. [Google Scholar] [CrossRef]
  26. Eliaz, N.; Eliyahu, M. Electrochemical processes of nucleation and growth of hydroxyapatite on titanium supported by real-time electrochemical atomic force microscopy. J. Biomed. Mater. Res. Part A 2007, 80, 621–634. [Google Scholar] [CrossRef] [PubMed]
  27. Mazaira, D.; Borrás, C.; Mostany, J.; Scharifker, B.R. Three-dimensional nucleation with diffusion-controlled growth: Simulation of hierarchical diffusion zones overlap. J. Electroanal. Chem. 2009, 631, 22–28. [Google Scholar] [CrossRef]
  28. Mentar, L.; Khelladi, M.R.; Azizi, A.; Kahoul, A. Effect of potential on the early stages of nucleation and growth during cobalt electrocrystallization in sulfate medium onto FTO surface. Mater. Lett. 2010, 64, 2403–2406. [Google Scholar] [CrossRef]
  29. Sima, M.; Enculescu, I.; Sima, M.; Vasileb, E.; Visanc, T. EIS studies of electrodeposition process of manganese and copper doped ZnO wires. Surf. Interface Anal. 2008, 40, 561–565. [Google Scholar] [CrossRef]
Figure 1. (a) Computer design model of rectangular a SLM-Ti scaffold and (b) a manufactured SLM-Ti scaffold.
Coatings 09 00667 g001
Figure 2. (a) Voltage against time curves measured with micro-reference electrode placed at bottom surface and top surface of SLM-Ti scaffolds and (b) description of potential measurement point.
Coatings 09 00667 g002
Figure 3. Scanning electron micrographs of coated SLM-Ti scaffolds: (a,c) the top surface and (b,d) the bottom surface.
Coatings 09 00667 g003
Figure 4. XRD analysis of the crystalline structure of deposited layers on SLM-Ti scaffolds.
Coatings 09 00667 g004
Figure 5. Cyclic voltammograms for CaP electrodeposition on SLM-Ti scaffolds with micro-reference electrode placed at different thickness.
Coatings 09 00667 g005
Figure 6. Effect of scan rate on the cyclic voltammograms of SLM-Ti scaffolds. (a) 5 mV·s−1, (b) 10 mV·s−1, (c) 25 mV·s−1, (d) 50 mV·s−1.
Coatings 09 00667 g006
Figure 7. (a) Current against time transient plots recorded on dense and porous SLM-Ti samples and the experimental data measured on (b) dense SLM-Ti samples, (c) top surfaces, and (d) bottom surfaces, respectively, of porous SLM-Ti samples are compared to the simulated data for 3D nucleation models.
Coatings 09 00667 g007
Figure 8. Nyquist diagrams for CaP coating on SLM-Ti scaffolds at deposition time of (a) 6000 s, (b) 3000 s, and (c) 1000 s. ■■■: experimental data and ○○○: fitting result.
Coatings 09 00667 g008
Figure 9. The equivalent circuit used to fit the impedance diagrams in Figure 6.
Coatings 09 00667 g009
Figure 10. Nyquist diagrams for CaP electrodeposition on (a) the top and (b) bottom surface of SLM-Ti scaffolds at deposition time of 3000 s. ■■■: experimental data and ○○○: fitting result.
Coatings 09 00667 g010

