Article

Low-Potential Zone at the Interface of Precipitate and Austenite Affecting Intergranular Corrosion Sensitivity in UNS N08028 Nickel–Iron–Chromium Alloy

1
School of Materials Science and Engineering, China University of Petroleum (East China), Qingdao 266580, China
2
China Petroleum Engineering Co., Ltd., Beijing 100176, China
3
Beijing Key Laboratory of Failure, Corrosion and Protection of Oil/Gas Facilities, China University of Petroleum-Beijing, Beijing 102249, China
*
Author to whom correspondence should be addressed.
Coatings 2023, 13(8), 1304; https://doi.org/10.3390/coatings13081304
Submission received: 25 May 2023 / Revised: 22 June 2023 / Accepted: 7 July 2023 / Published: 25 July 2023
(This article belongs to the Special Issue Investigation on Structure and Corrosion Resistance of Steels/Alloys)

Abstract

:
The precipitates and the intergranular corrosion behavior of a UNS N08028 nickel–iron–chromium alloy sensitized at different temperatures were studied by employing transmission electron microscopy, Kelvin probe force microscopy and other methods. It was found that sigma precipitates appeared at the grain boundaries of the alloy being sensitized. There was a Cr-depleted zone and a low-potential zone around these precipitates. The potential difference between the sigma precipitates and the low-potential zone was 102 mV, and this increased with the growth of the sigma precipitates. At this potential difference, the migration of the vacancies in the passive film accelerated significantly, and then the protectiveness of the passive film decreased. The intergranular corrosion mechanism of the steel has also be discussed.

1. Introduction

Due to their good resistance to general corrosion under aggressive environmental conditions, austenitic stainless steel and nickel–iron–chromium alloy are versatile and essential engineering materials. They are widely used in a variety of modern industries, such as nuclear power systems, sour gas fields, and aerospace for aircraft engines. Studying corrosion mechanisms and increasing the corrosion resistance of these steels has become a hot topic.
Intergranular corrosion (IGC) is one of the main corrosion failure forms of stainless steel and nickel–iron–chromium alloy during practical service. There has been a great deal of research on the IGC mechanism [1,2,3,4,5]. It is known that IGC in most stainless steels is usually associated with the presence of Cr-rich precipitates at the grain boundaries during sensitizing heat treatments, such as Cr-rich carbides (type Cr23C6) or the sigma phase [2,4,6,7]. Strauss [8] and Bain [9] suggested that the emergence of a Cr-rich phase leads to a Cr-depleted zone in the metallic matrix near the grain boundaries in stainless steel, the Cr concentration in this zone is not enough to form a stable passive film, and local corrosion would occur easily in this region. This mechanism is the so-called chromium depletion theory. After this theory was proposed, numerous studies have experimentally proved a Cr-depleted zone with a Cr content of less than 12~13% at grain boundaries when sensitization occurs [6,10].
The formation of Cr-rich precipitates can also induce a potential difference between the precipitates and the matrix. Stickler and Vinckier [11,12] suggested that the potential of Cr-rich precipitates is more noble than the matrix. Consequently, the matrix is corroded electrochemically, and the grain boundaries are attacked. This mechanism is the so-called electrochemical theory. In recent years, by Kelvin probe force microscopy (SKPFM), the Volta potential around grain boundaries has been mapped, and the findings have confirmed this theory [13,14,15,16,17]. For example, Namurata reported that the Volta potential of sigma precipitates is 25 mV higher than that of the ferrite matrix [15]. Krishnan discovered a 260 mV potential difference between M23C6 and the matrix [14].
The high corrosion resistance of austenitic stainless steel and nickel–iron–chromium alloy is attributed to the passive film, which is generally a double-layer structure that mainly consists of an internal chromium oxide layer and an external chromium hydroxide layer [18,19,20,21]. Spontaneously formed passive films are usually stable, but they are broken in harsh environments, leading to local corrosion. Typically, a break in passive films is associated with the passage of ions through the passive films [21,22,23,24]. The Volta potential, such as the potential difference induced by the precipitates, will affect the ion migration in the film and then affect the corrosion resistance of passive films. In our previous study [25], a double-layer atomic model was proposed to simulate the growth of a double-layer passive film. Based on this model, the migration of ion vacancies was investigated successfully. In addition, the diffusion coefficient of the ion vacancies, the semiconductor characteristics of internal and external layers, the growth-limiting step of the double-layer film, and the effect of temperature on film growth were obtained. Similarly, by using this atomic model, the ion migration in a passive film can be investigated as a function of the Volta potential, and the influence of the Volta potential on the properties and breakage of protective layer can also be obtained.
Due to the high content of Cr, Ni, and Mo, sigma precipitates would appear in the microstructure of nickel–iron–chromium alloy UNS N08028 during hot deformation [26,27]. The Cr-depleted zone would also form around the sigma phase. However, compared with austenitic stainless steel, the Cr concentration in the Cr-depleted zone of the nickel–iron–chromium alloy is much higher [28,29]. Therefore, IGC for a nickel–iron–chromium alloy does not entirely agree with the chromium depletion theory, unlike for austenitic stainless steel. Studies on the Volta potential distribution between the precipitates and matrix in nickel–iron–chromium alloy have rarely been reported.
Consequently, this paper investigated the intergranular corrosion behavior of UNS N08028 during aging at various temperatures, paying particular attention to the chemical composition and Volta potential at the interface of the sigma-precipitated phase and the austenite matrix at the grain boundaries. To clarify the effect of the potential difference between the sigma precipitates and the low-potential zone on corrosion, the diffusion coefficient of vacancies in the passivation layer under an anode electric field was studied based on the Cr2O3/Cr(OH)3 double-layer model.

2. Materials and Methods

2.1. Specimen Preparation

The test material was a UNS N08028 nickel–iron–chromium alloy, and its composition is shown in Table 1. After being solid solution treated at 1150 °C for 2 h, the original samples were water quenched. After the samples were treated by solid solution processing, they were subjected to aging treatment for 2 h at 700, 800, or 900 °C to produce precipitates. All of the surfaces of the samples were polished using emery paper up to 1200 grit and diamond paste with a 1.5 μm grain size. The samples were rinsed with distilled water and ethanol before the experiments.

2.2. Microstructure and Phase Analysis

The microstructural characterization and microanalysis of heat-treated UNS N08028 were carried out by scanning electron microscopy (SEM, FEI Quanta 200F, FEI, Hillsboro, OR, USA). The metallographic prepared samples were etched by a mixture of 1 g FeCl3, 3 mL HCl, and 12 mL H2O before morphological observation. By using scanning transmission electron microscopy (STEM) and transmission electron microscopy (TEM, FEI Tecnai G2 F20, FEI, Hillsboro, OR, USA), the precipitates and composition variation at the grain/phase boundaries of samples that had undergone aging were investigated. Samples were electropolished once more using 40 V in a solution of 5% perchloric acid in 95% acetic acid, using the MS-501B twin-jet unit (METALTHIN Mk4, MST Steel Corp, Warren, MI, USA) after being mechanically polished to a thickness of 100 μm. Then, the samples were further thinned using an argon ion beam with a precision ion polishing system (Gatan 691.CS, Gatan, Warrendale, PA, USA).

2.3. SKPFM Test

The surface morphology and surface potential difference around the precipitates in the UNS N08028 were obtained using a dimension atomic force microscope (AFM, Nanoscope III, Veeco Instruments Inc., Plainview, NY, USA). The tip was a Nanoprobe TM SCM-PIT conductive PtIr-coated silicon tip with a force constant of 2.5 N/m and a resonance frequency in the range of 60–100 kHz. With a force constant of 2.5 N/m and a resonance frequency of 60–100 kHz, the probe used in the SKPFM tests was a Nanoprobe TM SCM-PIT conductive PtIr-coated silicon tip.

2.4. Corrosion Resistance Test

A Gamry Reference 600 Electrochemical System (Gamry Instruments, Warminster, PA, USA) was used for the electrochemical studies. The traditional three-electrode cell, which consists of a saturated calomel reference electrode (SCE) and a platinum plate counter electrode, was used for the electrochemical testing. The surface of the working electrode (sample) with an area of 1 cm2 was mechanically ground and polished to 0.5 µm roughness before each experiment and finally degreased with acetone. Both the anodic polarization curves and the EIS spectra of specimens after different heat treatments were studied in the 6% FeCl3 solution at 50 °C, which is one kind of aqueous solution adopted in ASTM G48-03 [30] to analyze corrosion sensitization. The electrochemical impedance test frequency range was set to 10−1~105 Hz, the EIS test range was: high frequency (Hz) = 1 × 10⁵ and low frequency (Hz) = 0.01. The scanning rate of the anode polarization curve was 30 mV/min.
The immersion corrosion test was also carried out in a 6% FeCl3 solution at 50 °C for 72 h. The test samples were 30 × 20 × 3 mm, and their surfaces were ground and polished. Following several rinses with distilled water and anhydrous alcohol, the samples were dried in the air.

3. Results

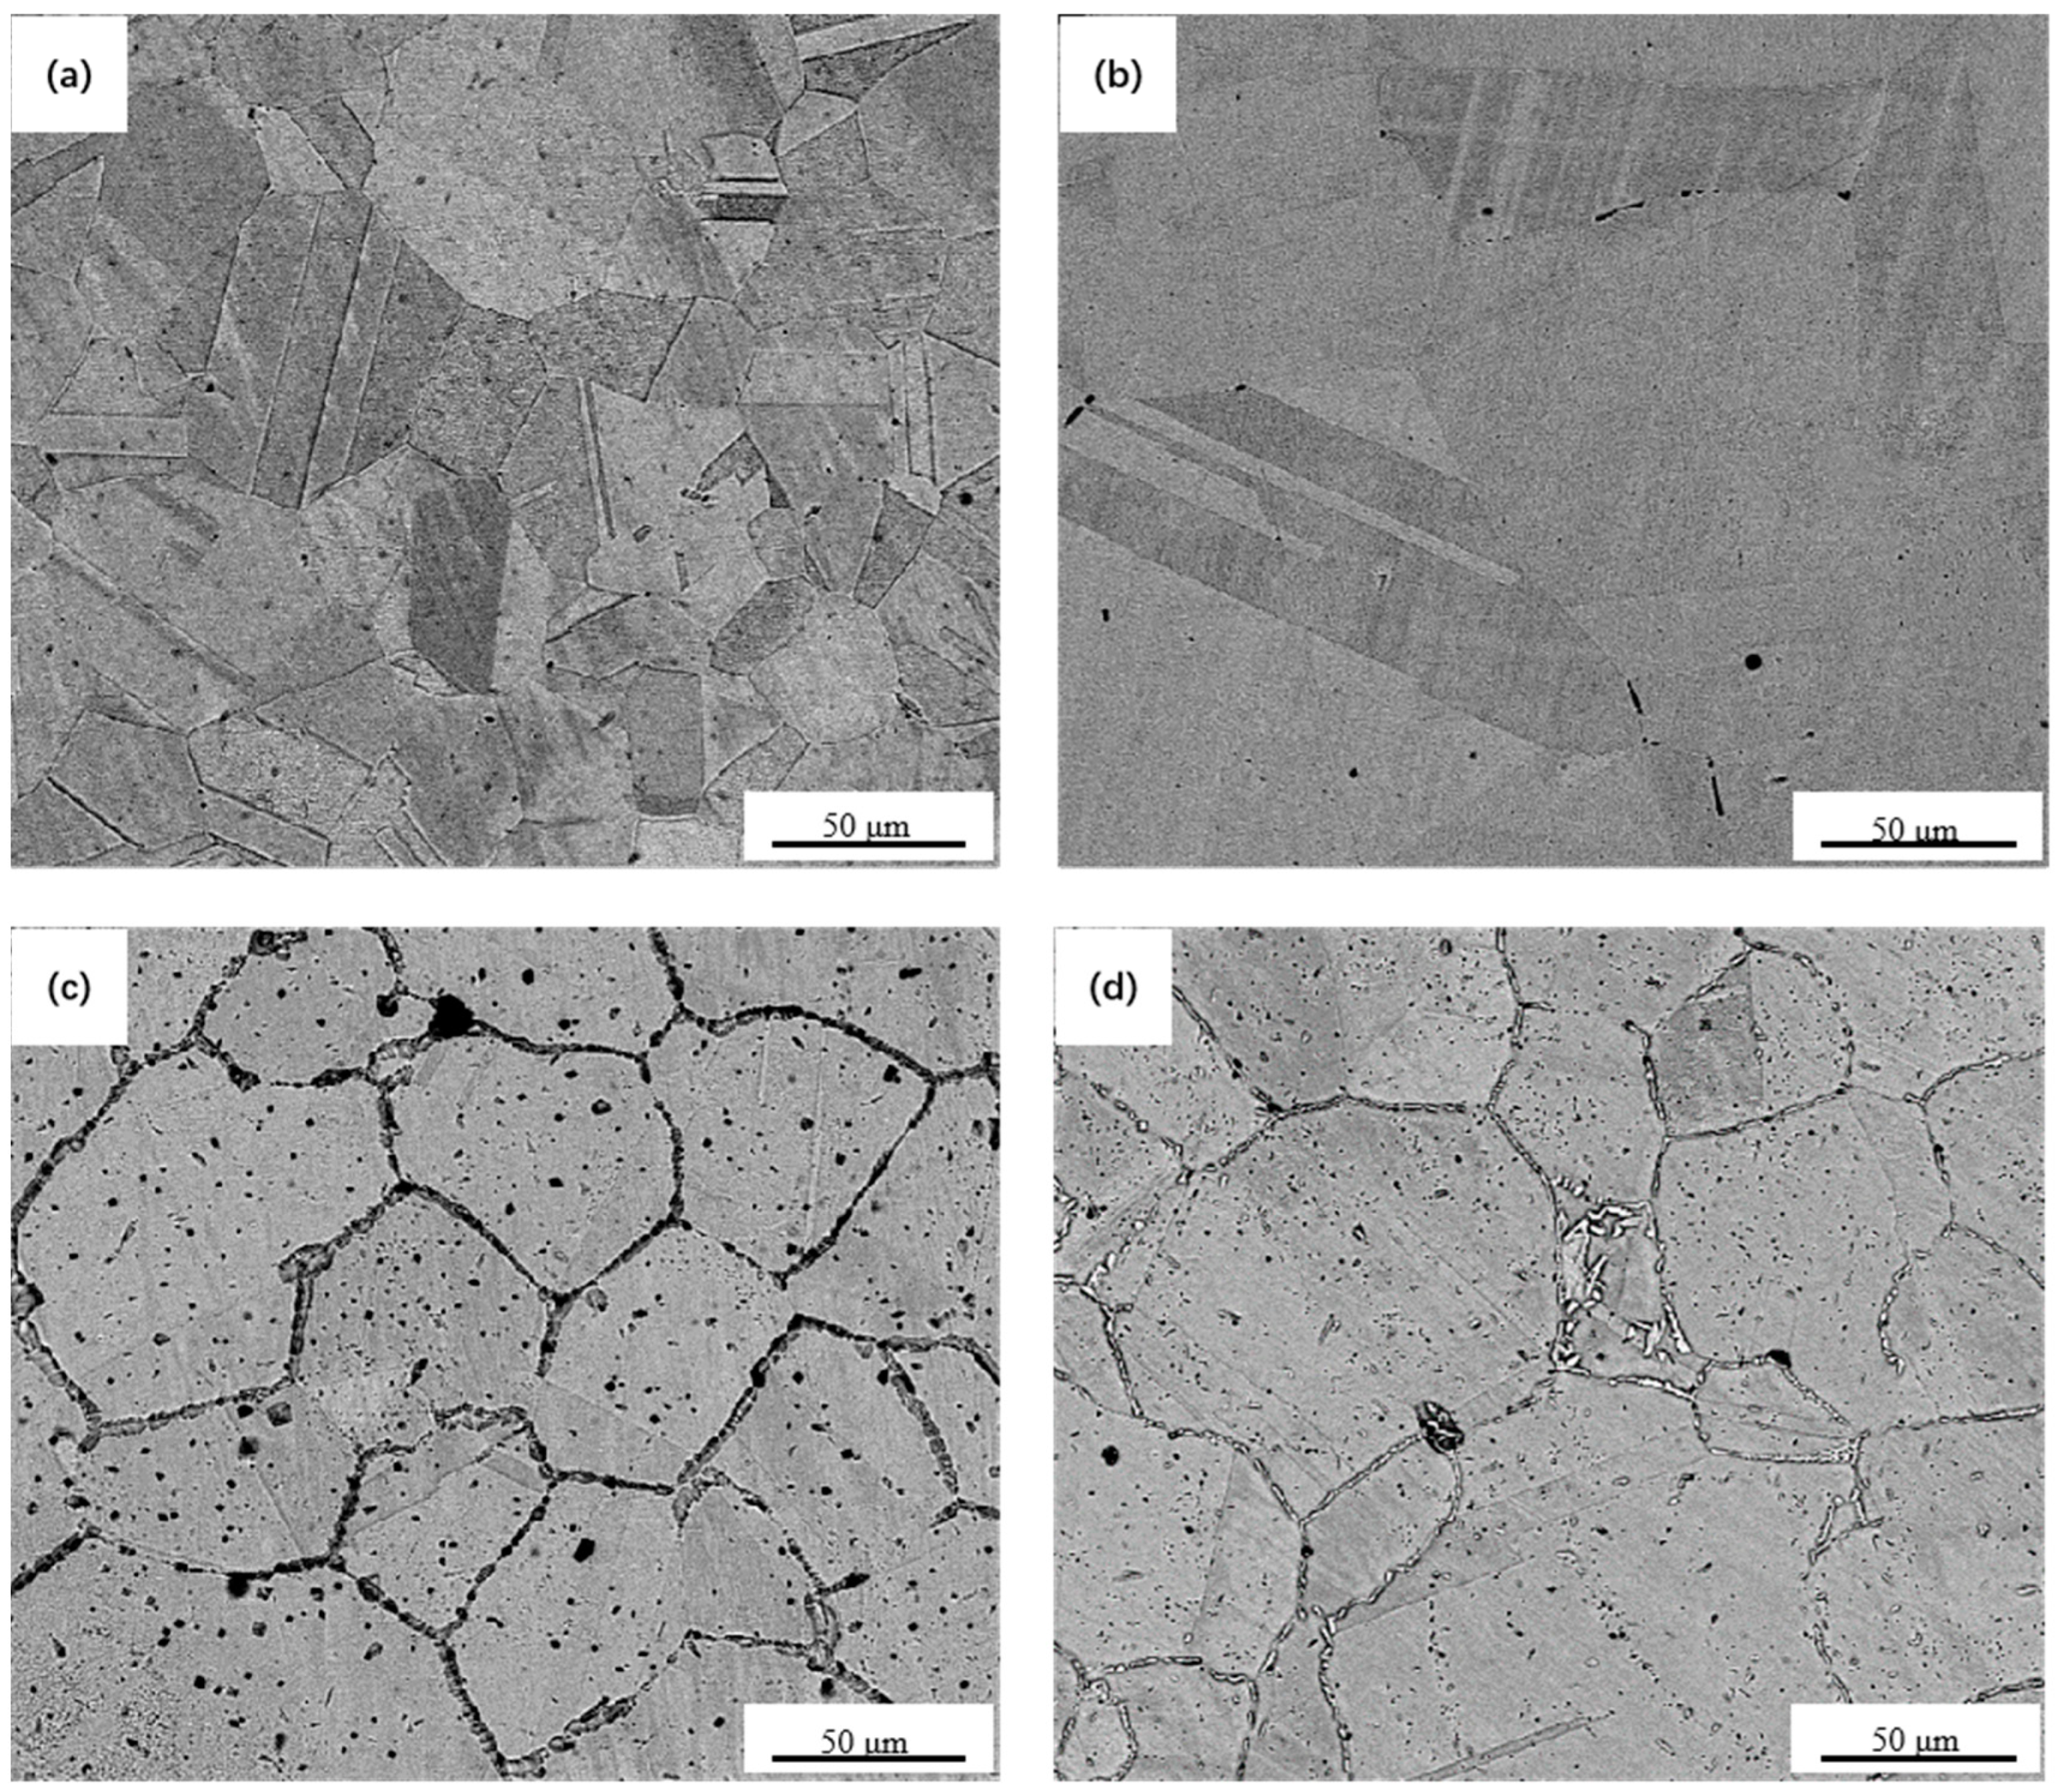
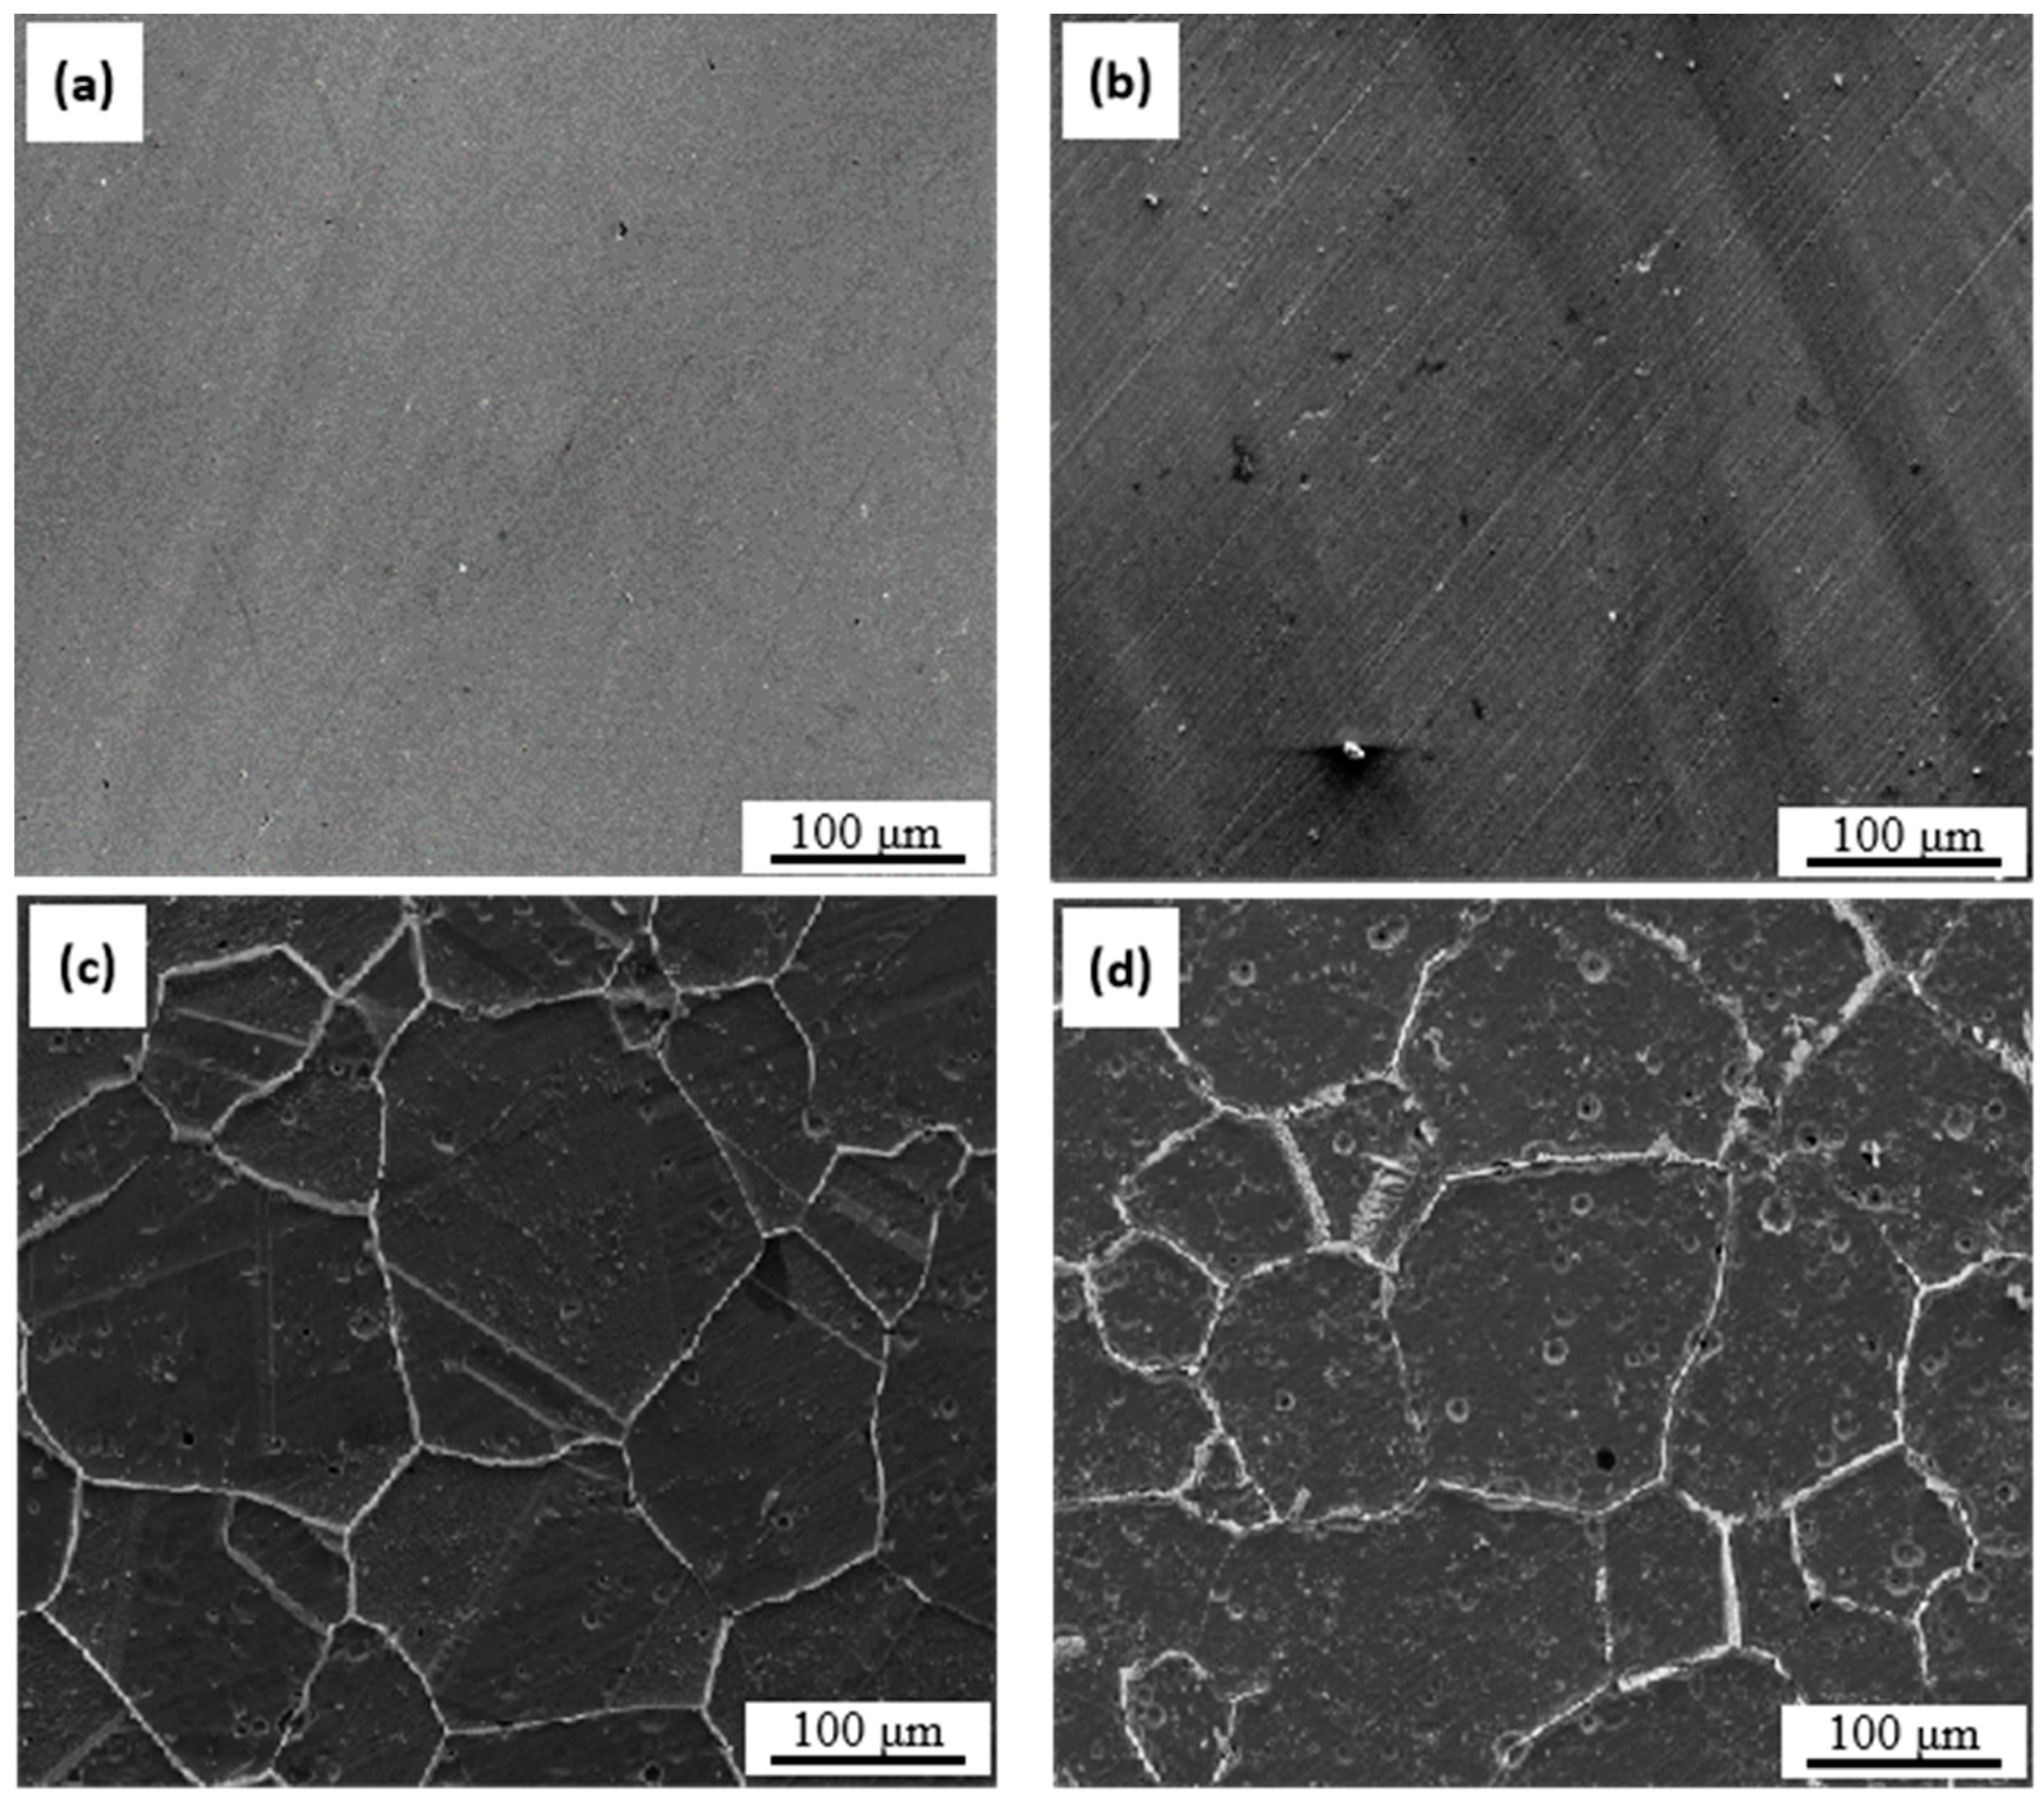
3.1. The Microstructure

Figure 1 shows the SEM images of UNS N08028 samples after different heat treatments and etching. The original UNS N08028 samples were treated by solid solution processing for 2 h at 1150 °C. In this condition, the austenite grains were mostly equiaxed, and precipitate phases were not found in either the matrix or the grain boundaries, as shown in Figure 1a. Afterward, the solution treatment samples were sensitized at 700, 800, and 900 °C, separately. Then, the precipitate phase was observed at the grain boundaries (Figure 1b,c). When the aging temperature was 700 °C, there were several small and discontinuous sediments formed at the grain boundaries. However, when the aging temperature rose to 800 °C and 900 °C, the number and size of precipitates increased significantly. Continuous precipitates were heavily enriched at the grain boundaries. Obviously, the number and average size of the precipitates also rose when the aging temperature rose. Furthermore, the grain size for samples aged at 800 and 900 °C was much smaller than that aged at 700 °C. This is because the precipitates surrounding the grains can stabilize the boundaries and suppress grain growth.
The precipitates formed in UNS N08028 were further confirmed by the selected area electron diffraction (SAED) patterns, as shown in Figure 2a,c,e. According to the diffraction pattern, only one kind of precipitate phase was found, and it was the sigma phase with a tetragonal structure (a = b = 8.96 Å, c = 4.80 Å). In addition, the width of the precipitates increased with aging time from 40 nm at 700 °C to 721 nm at 900 °C (Figure 2a,c,e). This also illustrated the increasing size of the sigma precipitate as the aging temperature increased.
The line EDS profiles of the element concentrations were collected across the sigma/austenite interface, as seen in Figure 2b,d,f. The sigma precipitates consisted of Cr, Fe, Ni, and Mo. The contents of Cr and Mo were higher than that in the matrix, while the contents of Fe and Ni were lower. The Cr-depleted zone was observed on both sides of the sigma precipitates. The width of the Cr-depleted zones was 63–78 nm, and it did not clearly expand with rising aging temperature (Figure 2b,d,f). Meanwhile, the minimum Cr content increased with the rising aging temperature. The minimum Cr content in the Cr-depleted zone was 16, 19, and 20 wt% after aging at 700, 800, and 900 °C, respectively.
In theory, because of the relatively low diffusion coefficient in substitutional diffusion, Cr atoms in the vicinity would be exhausted during the Cr-rich secondary phase growth; thus, the Cr-depleted zone would form [31]. However, the diffusion coefficient of Cr increases with temperature; therefore, the minimum Cr content at the grain boundaries rises [28,29,31].
Moreover, Figure 2 also shows that the C content was enriched at the sigma/austenite interface, as shown in Figure 2b,d,f. Increasing the C content decreases the corrosion-resisting property of austenite alloy [32]. Therefore, the appearance of the C-rich zone may also exacerbate the IGC. The reason for the C-rich zone forming may be because the grain boundary is a kind of crystal structure defect with a high Gibbs energy. The reaction between the lattice defects and grain boundaries, such as vacancies, dislocations, and foreign atoms like C, which have been demonstrated to be abundant in the grain boundary regions, reduces the system’s overall Gibbs free energy [33,34,35].

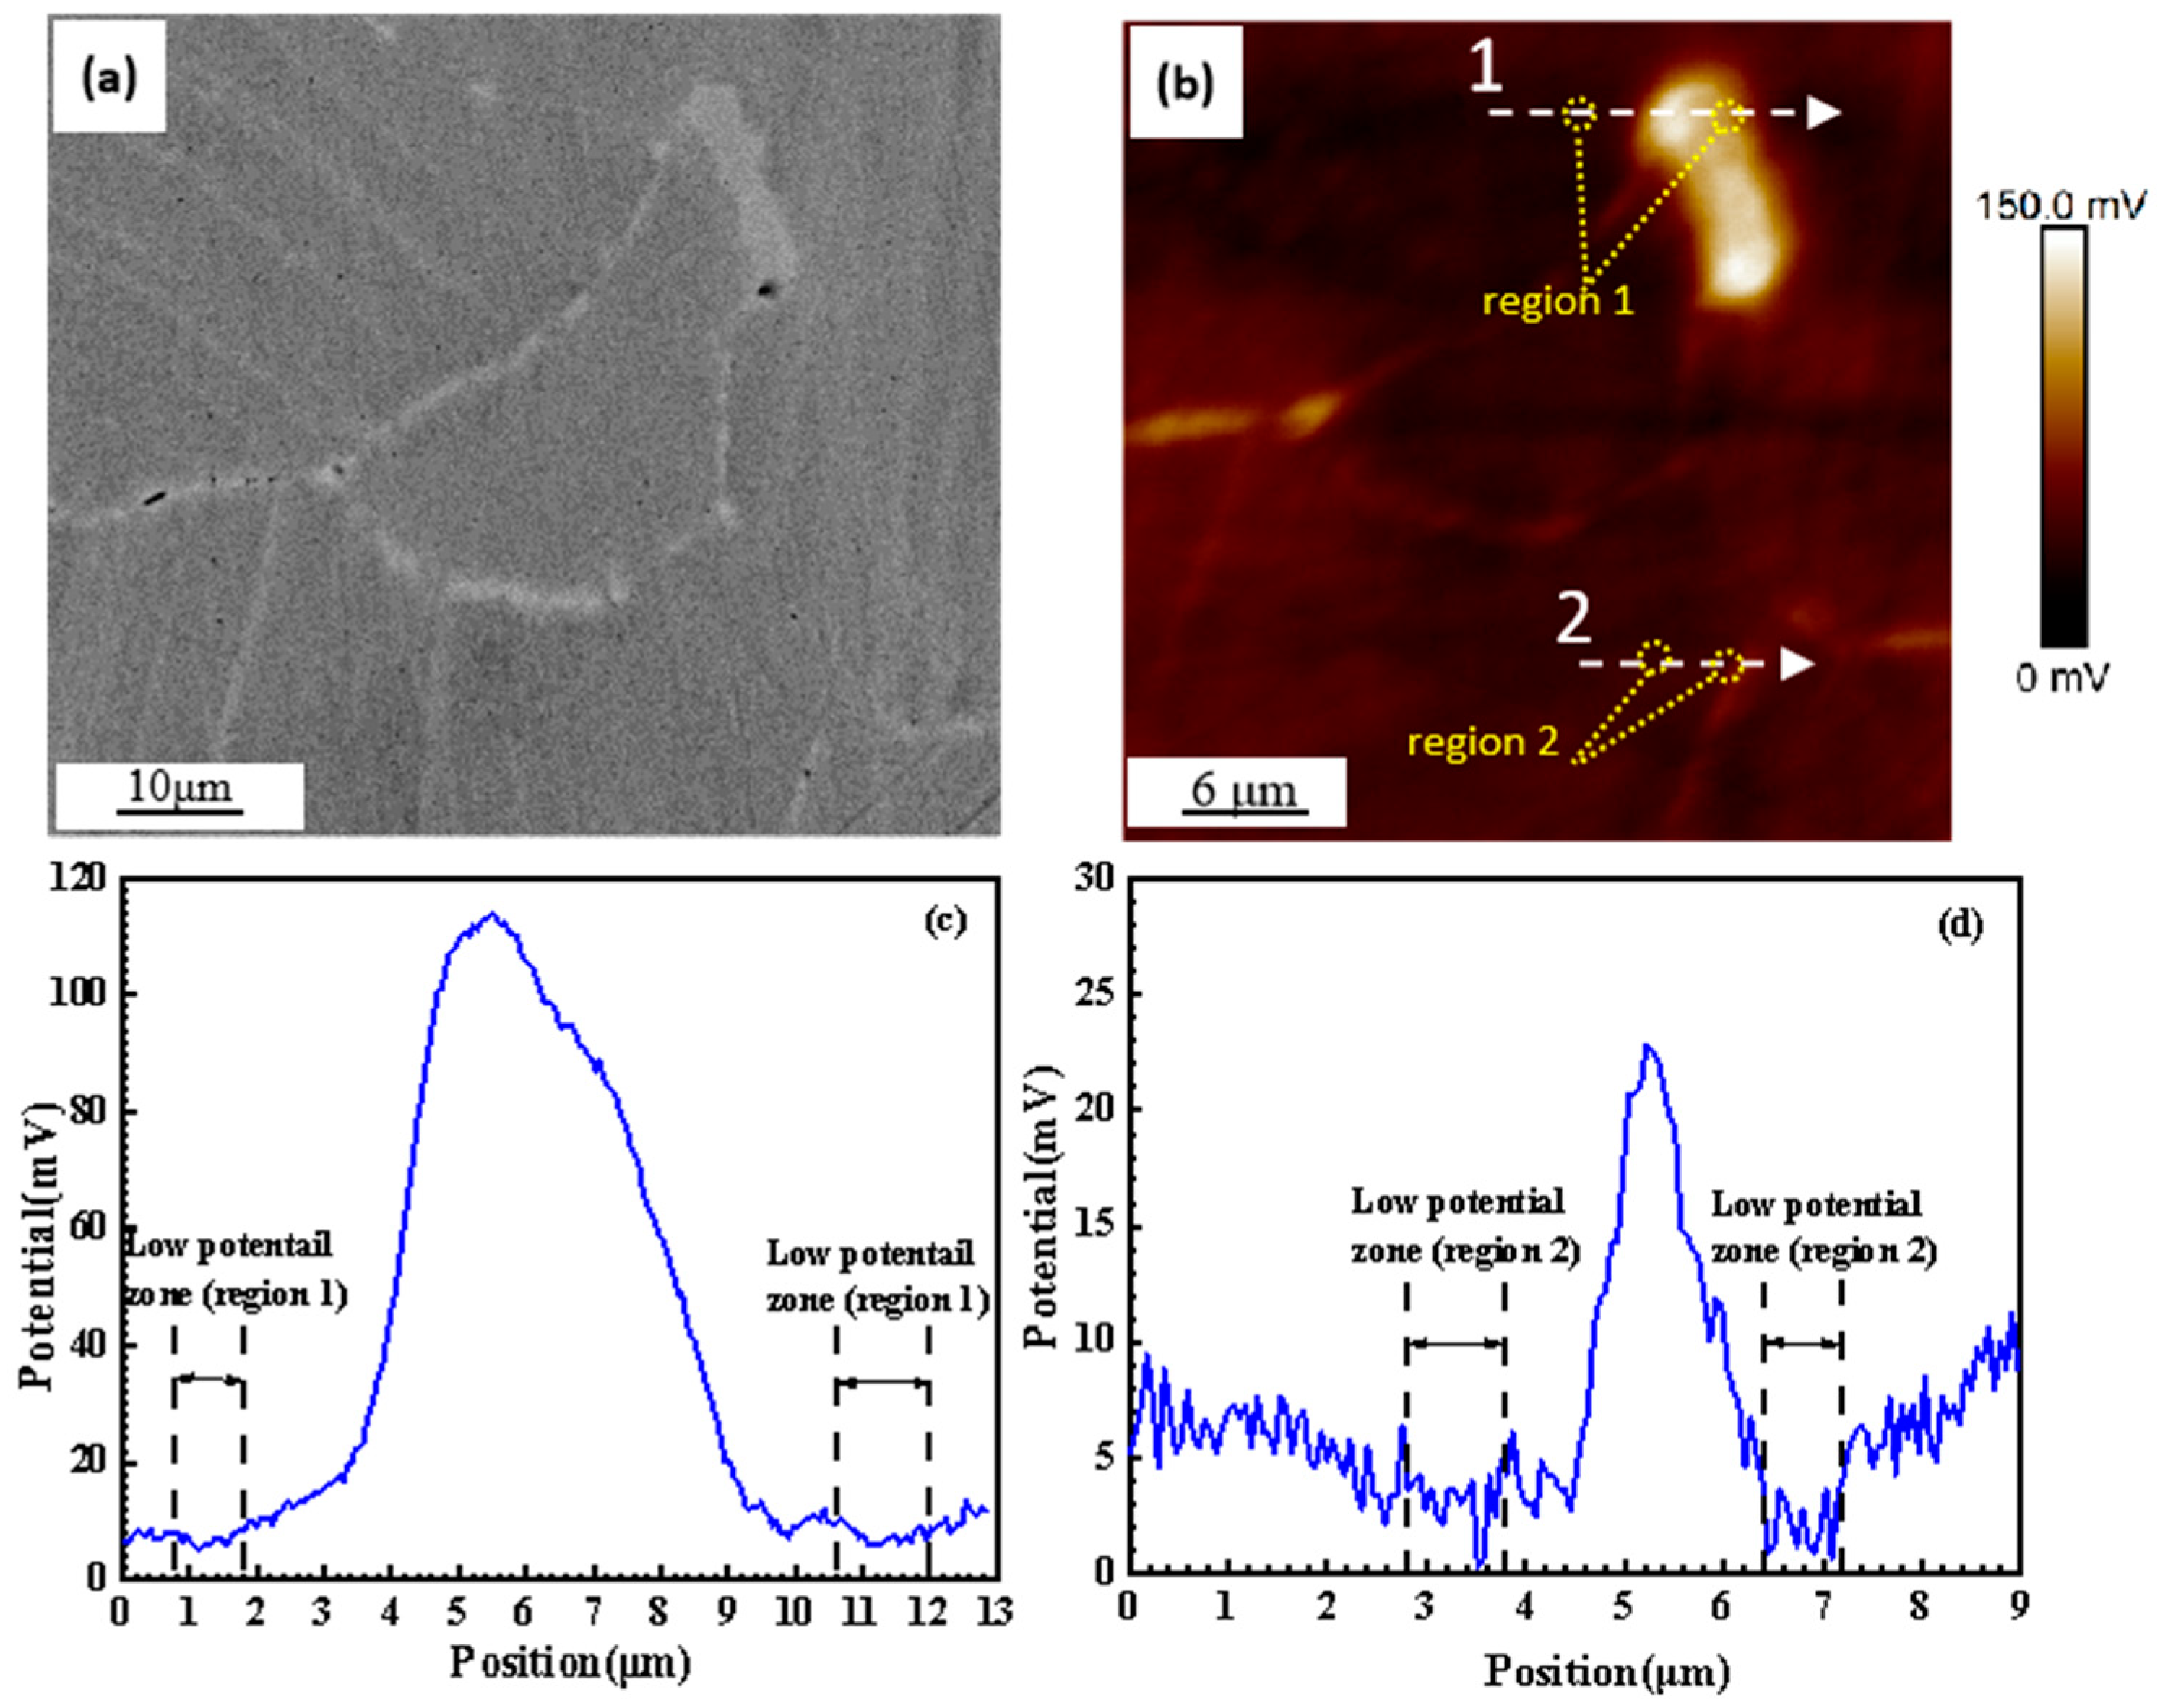
3.2. The Volta Potential Distribution at the Sigma/Austenite Boundary

Figure 3a displays the SEM image obtained in BSE mode. Continuously distributed sigma phases along the grain boundaries were noticeable in the sample aged at 900 °C. The Volta potential mapping (Figure 3b) by SKPFM was performed in the same field as Figure 3a. The potential of the sigma precipitates was much higher than that of the austenite matrix. Moreover, the potential for large sigma precipitates was higher than for small ones.
Along the two scan lines indicated in Figure 3b, the Volta potential across large and small sigma precipitate particles was measured. Figure 3c,d illustrate the results. This indicates that there was a lower potential zone on both sides of the sigma precipitates. They are marked as region 1 and region 2 in Figure 3b–d. The Volta potential of these regions was lower than that of both the austenite phase and sigma precipitates. The results also show that the potential difference between the sigma precipitates and the low-potential zone increased with the increasing size of sigma precipitates. The maximum potential difference between the large sigma precipitates and the low-potential zone was as much as 102 mV. Accordingly, the sigma phase was the cathodic area, and the low-potential zone was the anodic area. Therefore, the low-potential zone at the sigma/austenite boundary would be corroded preferentially in an aqueous corrosion environment.

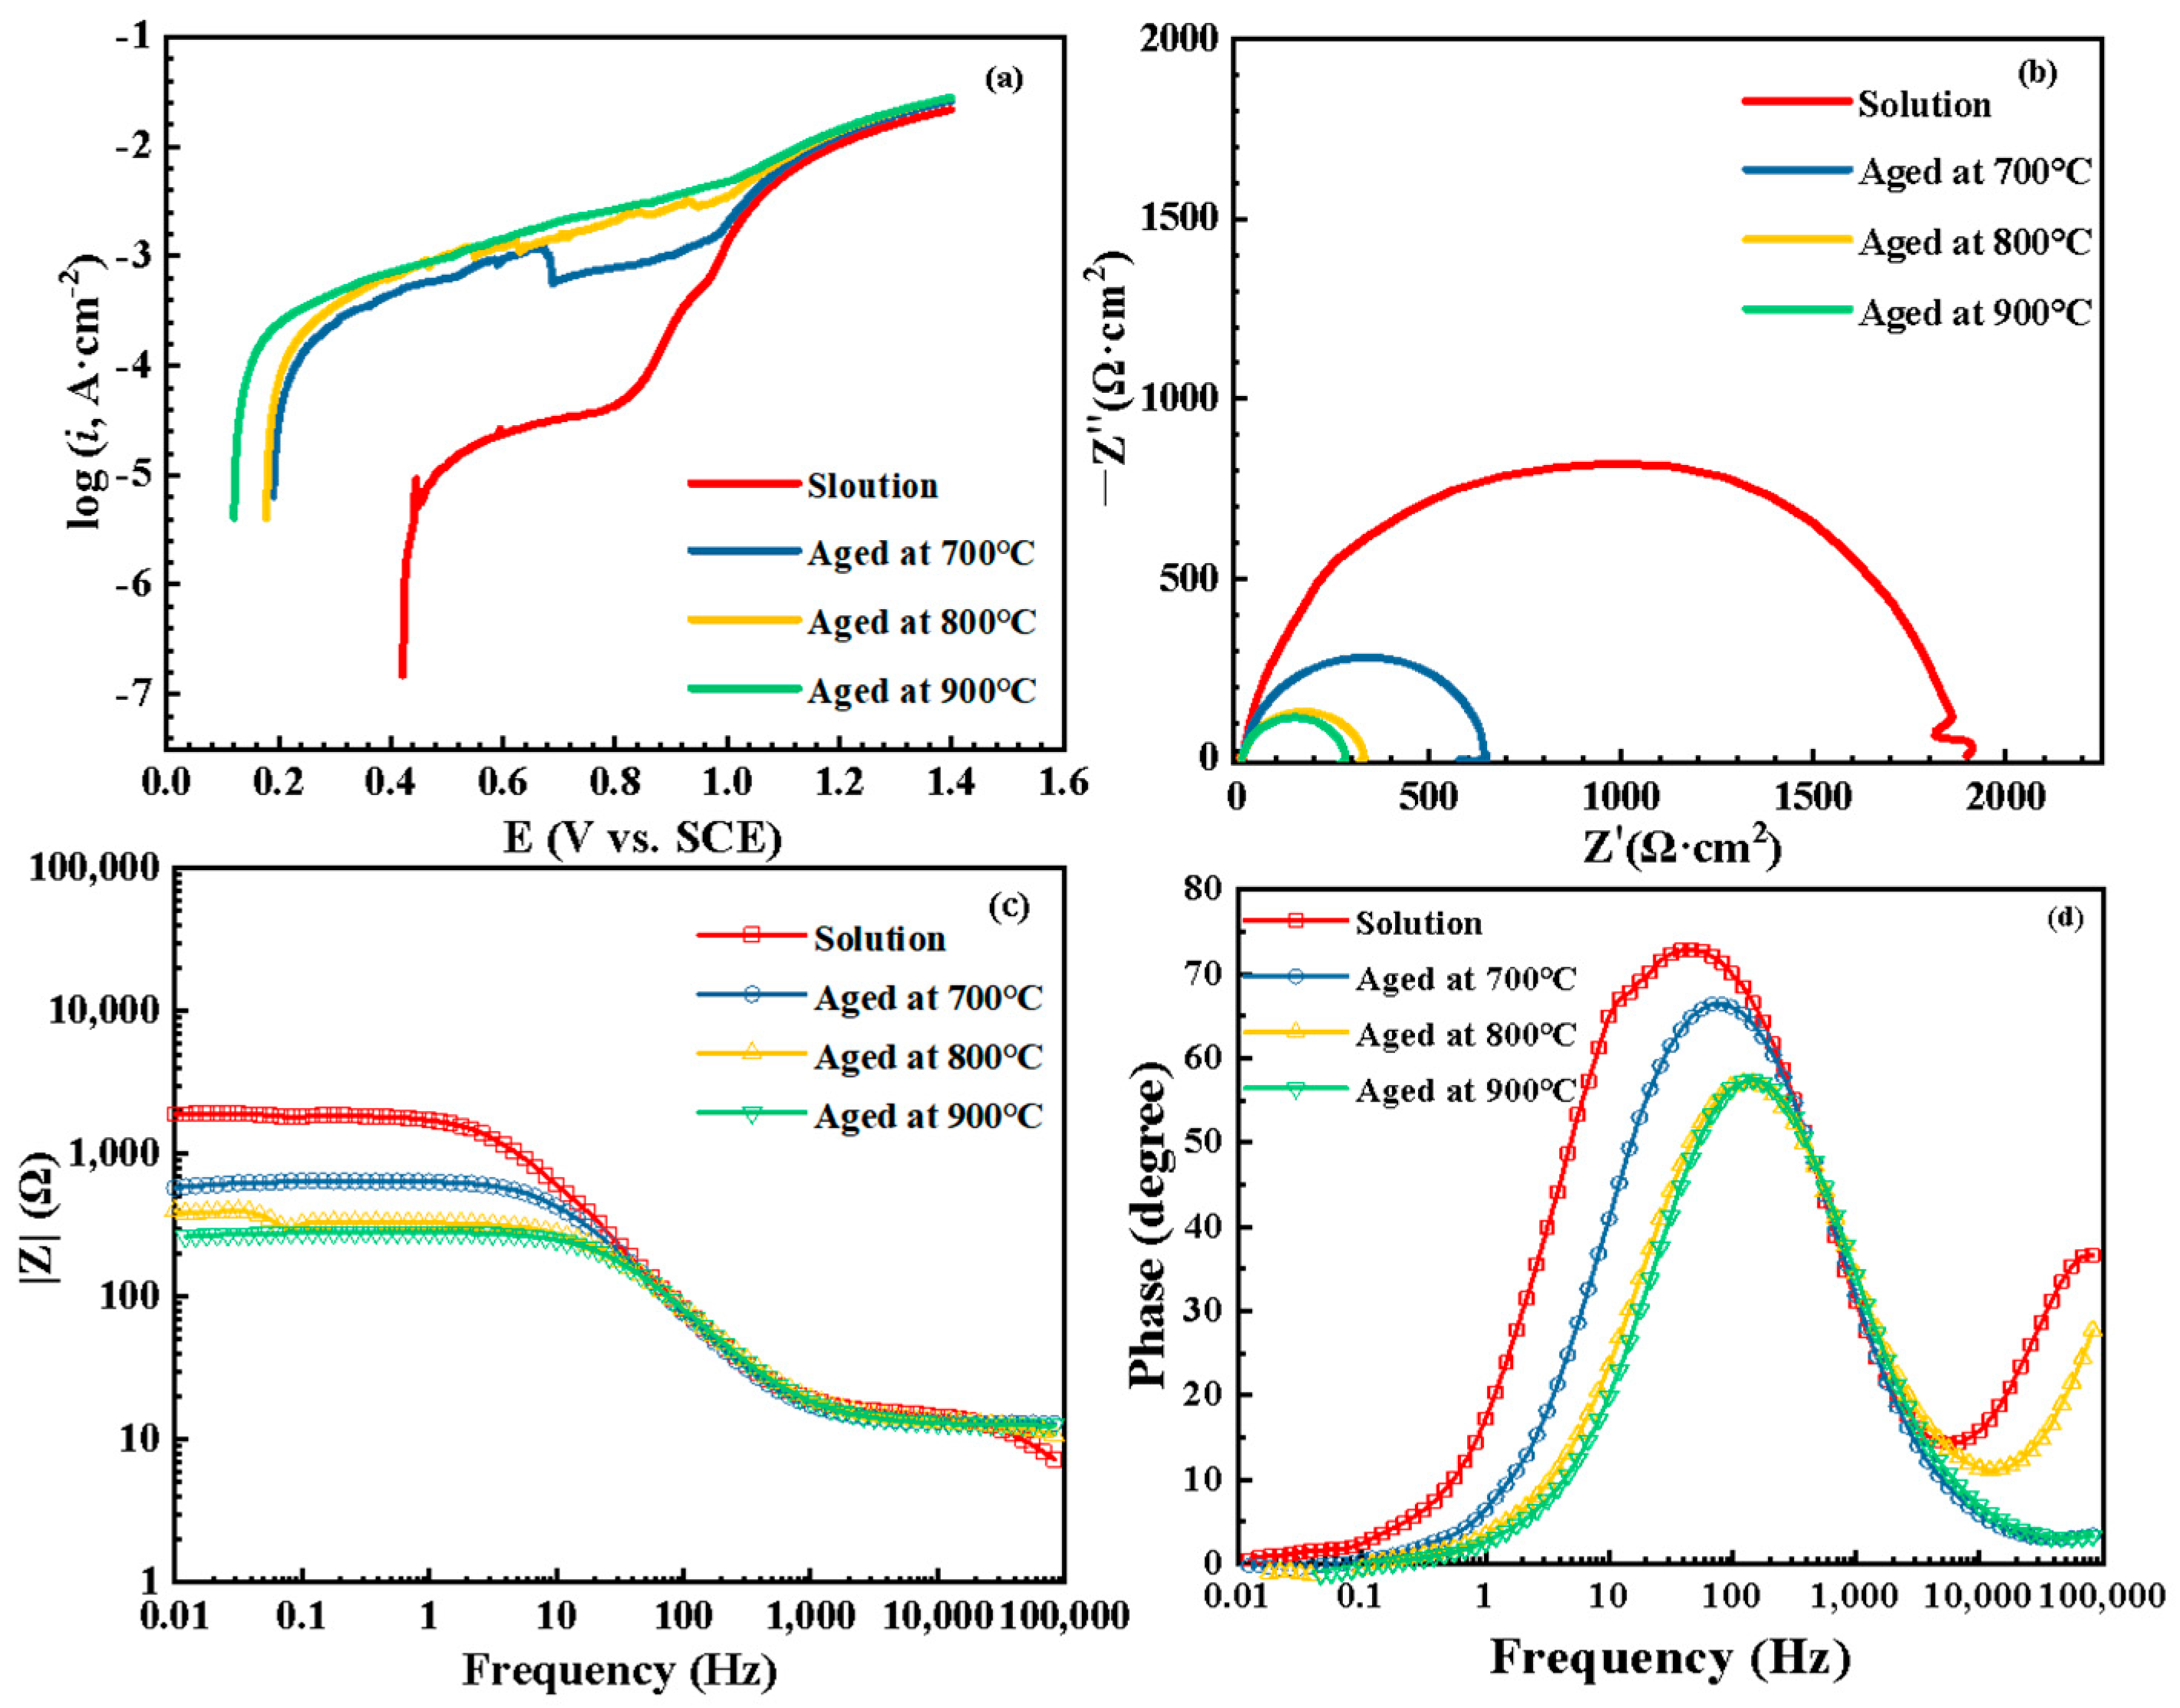
3.3. Intergranular Corrosion Sensitivity

Figure 4 displays the anodic polarization curves, the Nyquist plots, and the Bode plots of the UNS N08028 samples that were heat treated at different temperatures in a 6% FeCl3 solution at 50 °C. It can be seen that the anodic polarization curve of the sample treated with the solution had a passive zone, while the samples aged at different temperatures did not clearly show passive behavior (Figure 4a). The corrosion current densities of aged samples were much higher than those of the solution-treated samples, whereas the corrosion potentials of the aged samples were much lower than those of the solution-treated samples. In addition, with rising aging temperature, the corrosion current density further increased, and the corrosion potential decreased. This illustrated that rising the aging temperature accelerated the corrosion of UNS N08028. Figure 4b shows that there was one capacitive loop at the intermediate frequency region following an inductance tail at the low-frequency region in every Nyquist plot. The diameter of the capacitive semicircle in the Nyquist plot decreased with rising aging temperature, which means that rising the aging temperature reduced the protective properties of the passive film and increased the corrosion tendency of UNS N08028.
Figure 5 shows SEM micrographs of the UNS N08028 samples after the immersion test in 6% FeCl3 solution for 72 h at 50 °C. The samples treated and aged at 700 °C were not corroded at all (Figure 5a,b). However, intergranular corrosion was visible on the surface of the aged samples at 800 and 900 °C. The IGC of the sample aged at 900 °C was more serious than that at 800 °C. Thus, the IGC of UNS N08028 was enhanced with rising aging temperature, which corresponded to the electrochemical test results.

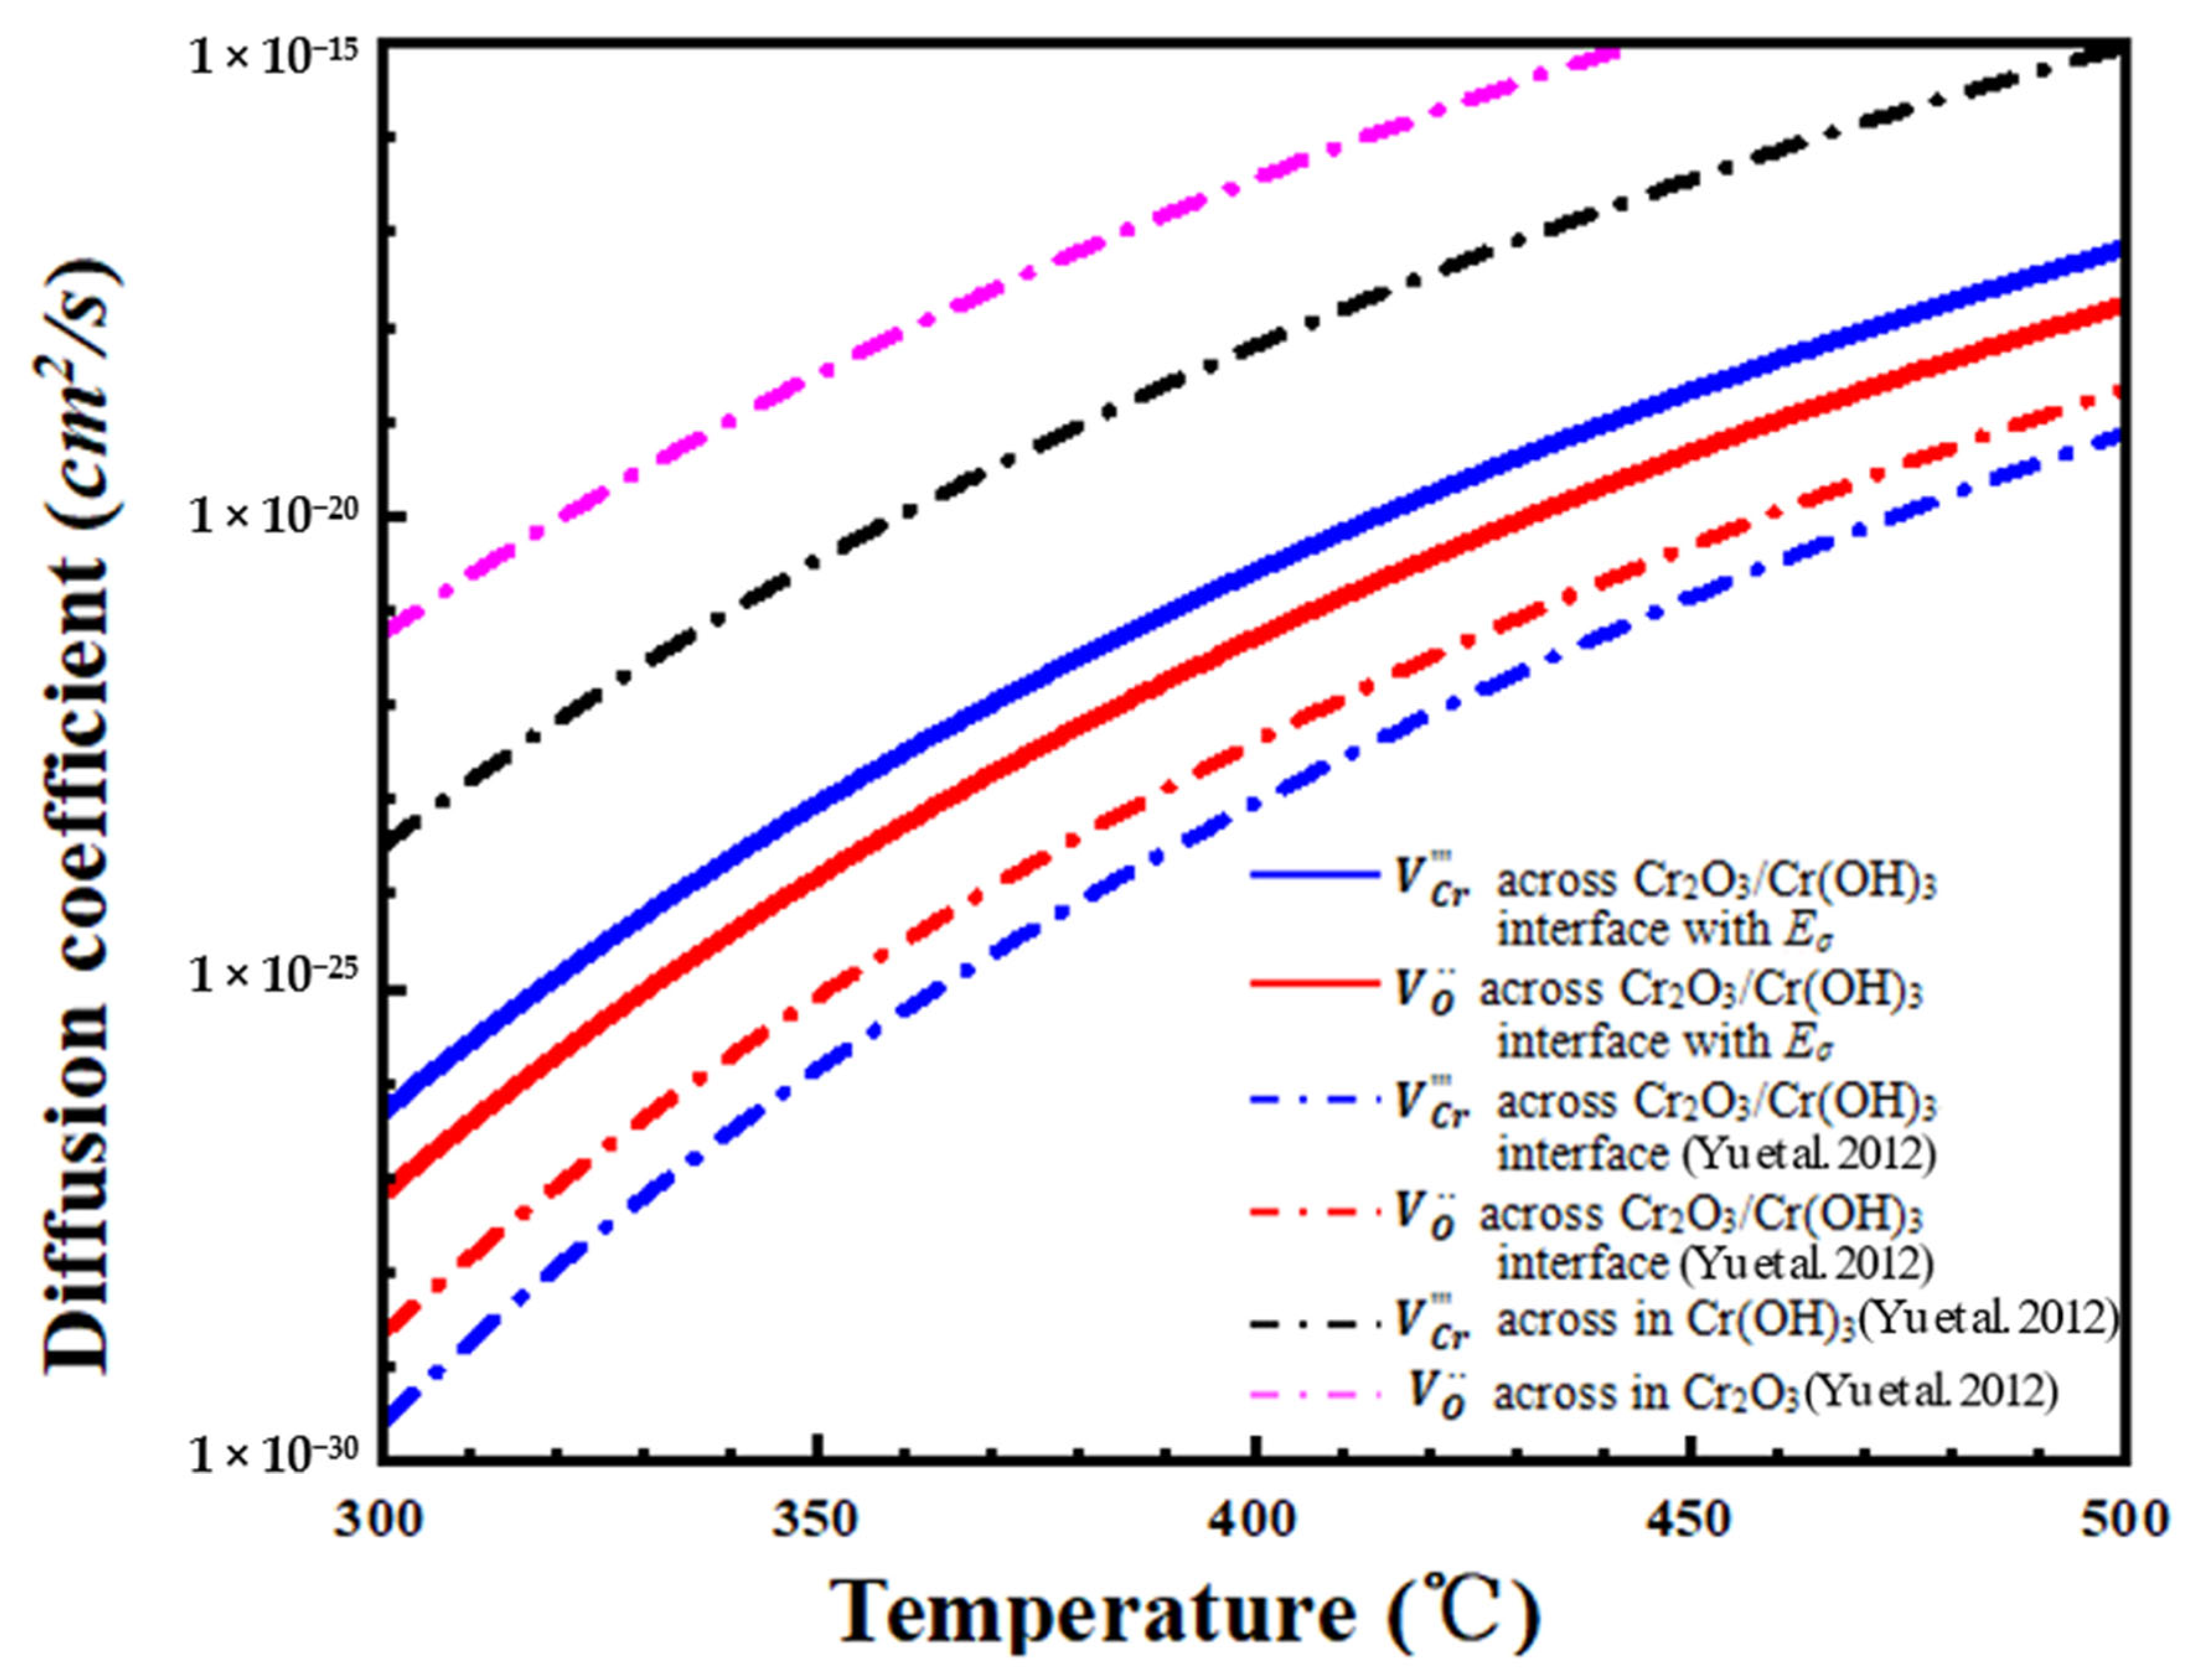
3.4. The Effect of Different Volta Potentials on Ion Migration in Passive Films

In the previous study carried out by research group [25], an atomic model, was proposed to study the migration of vacancies in the Cr2O3/Cr(OH)3 double-layer passive film based on the point defect model (PDM). The self-diffusion coefficients of the anion and cation vacancies in a passive film were calculated by density functional theory (DFT). According to calculations, the anions and cations vacancies at the Cr2O3/Cr(OH)3 interface not only have a self-diffusion coefficient that is six orders of magnitude lower than that of other interfaces, but also regulate the formation of the inner and outer layers of the passivated film. Similarly, the self-diffusion coefficient of vacancies under the effect of a Volta potential can also be estimated. According to previous research, the self-diffusion coefficient of a vacancy can be expressed as [25,36]:
D T = l 2   v   e x p ( E b k   Τ )
E b = E T S E r e a c q E h 1
where T is the absolute temperature; v is the attempt frequency; l is the hop distance;   k is the Boltzmann constant; E b is the activation barrier; E T S and E r e a c are the transition state energy and the initial state energy of the vacancy migration step, respectively; h 1 is the displacement vector versus the direction of the electric field of the vacancy migration step; E is the electric field intensity; and q is the charge of the vacancy.
In our prior study [25], there were two electric fields at the Cr2O3/Cr(OH)3 interface. They were the built-in electric field of the n p junction ( E n p ) and the anodic electric field ( E σ ) applied by the potential difference between sigma precipitates and the low-potential zone. Therefore, E is the sum of E n p and E σ . Equation (2) can be expressed as:
E b = E T S E r e a c q E n p + E σ h 1
E σ can be obtained by:
E σ = U σ / h p
where U σ is the potential difference between sigma precipitates and the low-potential zone, which was as high as 102 mV as shown in Figure 3c; and h p is the thickness of passive film.
Previous studies have shown [25] that O2− ( V O · · ) and Cr3+ ( V C r ) vacancies are generated at the metal/Cr2O3 interface and the Cr2O3/Cr(OH)3 interface separately. Before they arrive at the Cr2O3/Cr(OH)3 interface, they migrate in the inner Cr2O3 layer or the outer Cr(OH)3 layer under the electric field from the anode. During this process, the electric potential energy of the vacancy transforms to kinetic energy. This means that the vacancies initially possess kinetic energy before migrating across the Cr2O3/Cr(OH)3 interface. Therefore, the activation barrier of the vacancy migration E b is modulated by kinetic energy ( E k ) transforms from electric potential energy according to the following equation:
E b = E T S E r e a c q E n p + E σ c c   h 1 E k
And E k is estimated as:
E k = q h 2
where h 2 is the displacement vector versus the direction of the E σ of vacancy migration before reaching the Cr2O3/Cr(OH)3 interface. For V O · · , h 2 is the thickness of the inner Cr2O3 layer, and for V C r , h 2 is the thickness of the outer layer. Finally, the diffusion coefficient of vacancy across the Cr2O3/Cr(OH)3 interface can be calculated by combining Equations (1), (2), (5) and (6):
D T = l 2   v   e x p ( E T S E r e a c q ( E n p + U σ / h p )   h 1 q h 2 k   T )
The diffusion coefficients of anionic and cationic vacancies at the Cr2O3/Cr(OH)3 interface rise with increasing potential differences between the sigma precipitated phase and the low-potential area, as shown by Equation (7). Using Equation (7), the diffusion coefficients of ion vacancies migrating at the Cr2O3/Cr(OH)3 interface under the U σ are given in Table 2. The parameters shown in Table 2 originated from our earlier studies [18,20,25]. The diffusion coefficient curves (Figure 6) demonstrate that the cation and anion vacancies migrating at the Cr2O3/Cr(OH)3 interface still possess the minimum diffusion coefficient under the U σ , which restricts the mass transport in the passive film. When the potential difference between the sigma precipitates and low-potential zones is 102 mV, as measured in Section 3.2, the diffusion coefficient of V O · · increased 23 times over that without the electric field. Even the diffusion coefficient of V C r was improved by three orders of magnitude. Therefore, the potential difference between the sigma precipitates and the low-potential zones will accelerate the migration of cation and anion vacancies. This means that in the low-potential zones, the protective property of the passive film would be decreased, and the local corrosion rate would be accelerated.

4. Discussion

The most widely acknowledged explanation for the sensitization of stainless steels is the Cr-depletion theory. The Cr content and the width of the Cr-depleted zone are suggested to be two factors that affect the IGC [36]. In this study, the number and size of sigma precipitates generated at the grain boundaries increased with rising aging temperature (Figure 1 and Figure 2). Consistent with the Cr depletion theory, the formation of a Cr-depleted zone was observed at the boundary of the sigma precipitates and austenite matrix, where the IGC occurred. According to the results of electrochemical tests and immersion tests in a solution of 6% FeCl3 at 50 °C (Figure 3 and Figure 4), intergranular corrosion dramatically increased as the aging temperature rose. However, with rising aging temperature, the Cr content increased from 16% to 20% in the Cr-depleted zone, and the width of the Cr-depleted zone did not widen, as shown in Figure 2. This signifies that there are other factors that led to intergranular corrosion of UNS N08028.
The potential of precipitates in stainless steel is usually higher than that of the matrix. For example, Krishnan reported that the Volta potential of M23C6 is 260 mV higher than the matrix in 420 stainless steel [14]. In addition, in 2507 duplex stainless steel, the Volta potential difference between the α and γ phases was reported to be 80 mV [35] This potential difference between the precipitates and matrix would induce the formation of the galvanic effect, and then intergranular corrosion would occur [11,12]. In this study, the measured Volta potential of sigma precipitates was also higher than the austenite matrix in UNS N08028 (Figure 3). In addition, a low-potential zone was observed around the sigma precipitate, and the Volta potential was lower than both the sigma precipitate and matrix (Figure 3). The sigma precipitate and the low-potential zone processed the highest and lowest Volta potential separately, and the potential difference between them was as high as 102 mV. As a result, the low-potential zones acted as an anode, which would clearly improve the mass transport in the passive film. This was shown by calculating the diffusion coefficient of vacancies at the Cr2O3/Cr(OH)3 interface. Therefore, the protective ability of the local passive film would decrease, and the low-potential zone would preferentially corrode in aggressive environments.
Moreover, as the Volta potential of those large sigma precipitates was higher than small ones, the potential difference between sigma precipitates and low-potential zones will increase with increasing sigma precipitate size (Figure 3). Therefore, the IGC sensitivity of UNS N08028 will be enhanced with rising aging temperature (Figure 4 and Figure 5). Considering these observations, in addition to chromium depletion, we think that the low-potential zone also primarily causes UNS N08028 nickel–iron–chromium alloy to become sensitive. When the alloy is aged at high temperatures, the low-potential zone’s impact on intergranular corrosion may even outweigh that of chromium depletion.

5. Conclusions

The microstructure and intergranular corrosion behavior of UNS N08028 sensitized at different temperatures were investigated, and the following results were discovered:
  • After aging, UNS N08028 demonstrated sigma precipitation phases at the grain boundaries, and as the aging temperature rose, the number and size of these phases increased correspondingly.
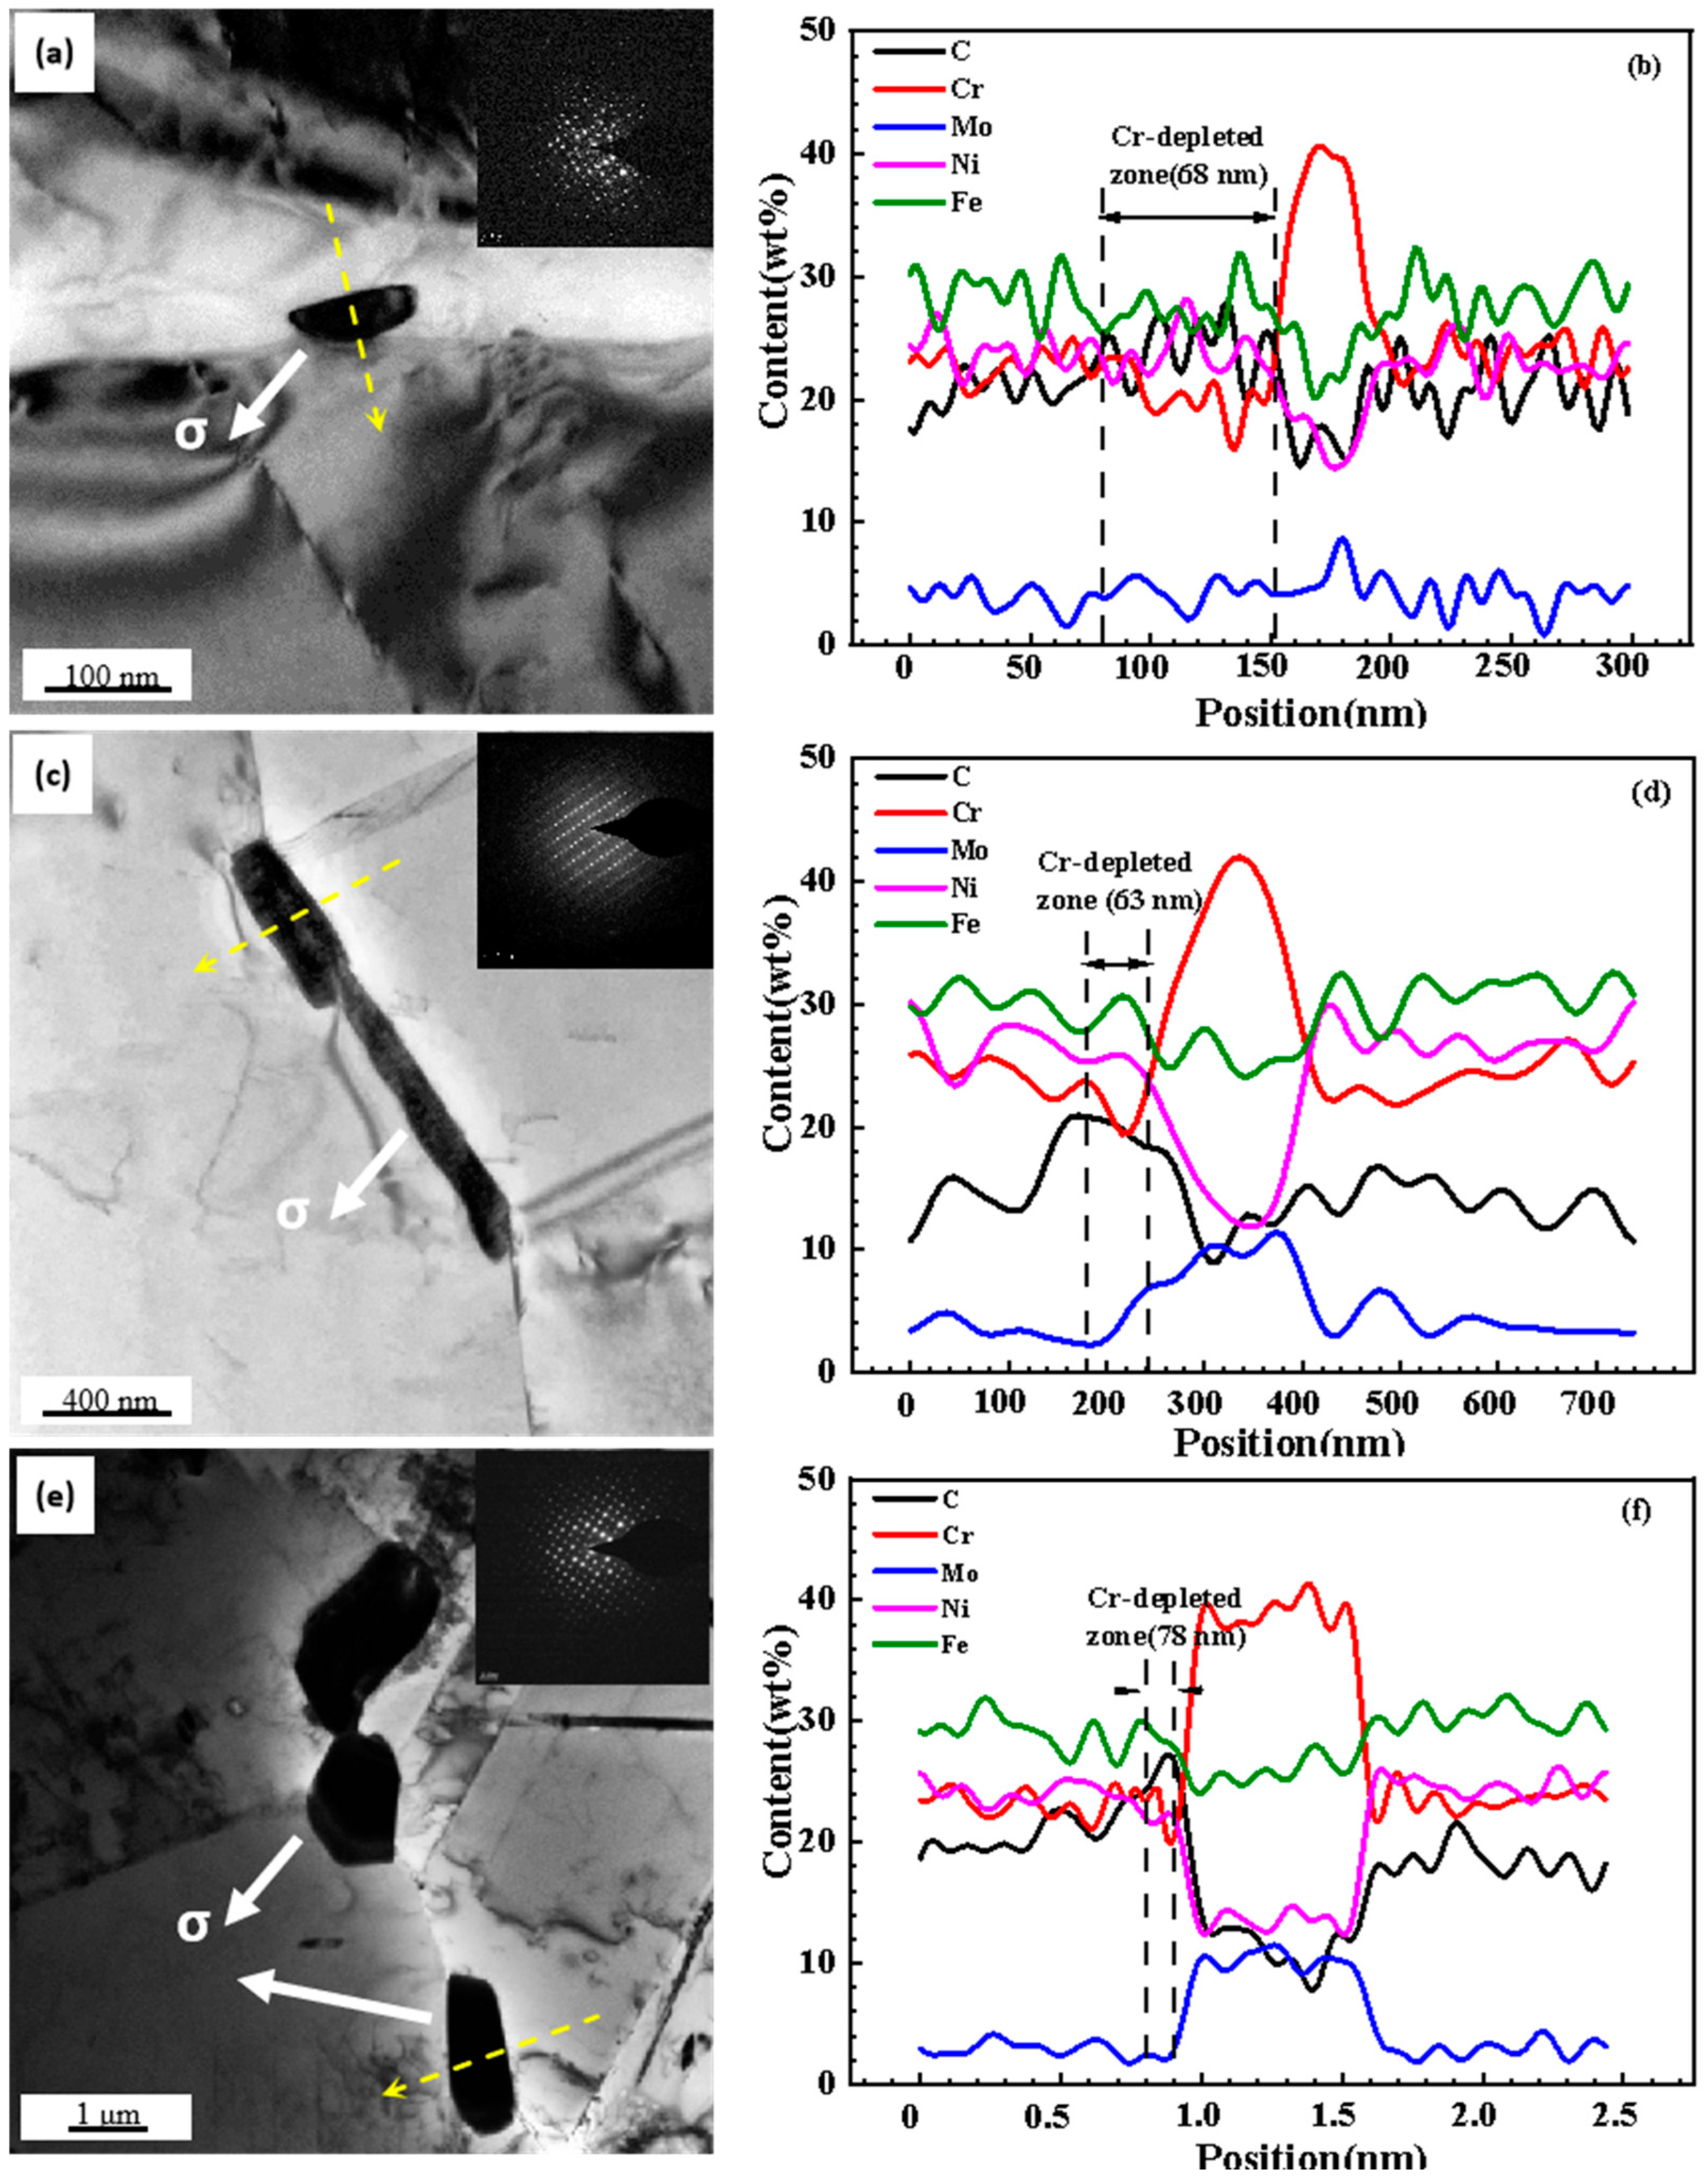
  • Around the sigma precipitates, a Cr-depleted zone was generated. With rising aging temperature, the Cr content in the Cr-depleted zone increased, but the width of the Cr-depleted zone did not widen.
  • A low-potential zone was found adjacent to the sigma precipitates by SKPFM. The potential difference between the sigma precipitates and low-potential zones was high and reached a value of 102 mV, and it increased with the growth of the sigma precipitates.
  • Under the potential difference between the sigma precipitates and the low-potential zone, the Cr2O3/Cr(OH)3 interface still controlled the mass transport. However, the diffusion coefficient of cation and anion vacancies accelerated significantly, and the blocking ability of the passive film weakened.
  • As the temperature of aging increases, the low-potential zone along the grain boundaries and Cr loss had an impact on intergranular corrosion.

Author Contributions

Writing—original draft, X.F.; Investigation, Y.Y. and K.F.; Methodology, J.W. and B.D.; Writing—review and editing, X.Y.; Validation, H.Z. and L.D.; Formal analysis, Y.L. All authors have read and agreed to the published version of the manuscript.

Funding

This work was supported by the National Natural Science Foundation of China (grant number 51301200).

Institutional Review Board Statement

Not applicable.

Informed Consent Statement

Not applicable.

Data Availability Statement

Data are contained within the article.

Conflicts of Interest

The authors declare no conflict of interest.

References

  1. King, A.; Johnson, G.; Engelberg, D.; Ludwig, W.; Marrow, J. Observations of intergranular stress corrosion cracking in a grain-mapped polycrystal. Science 2008, 321, 382–385. [Google Scholar] [CrossRef]
  2. Gwinner, B.; Auroy, M.; Balbaud-Célérier, F.; Fauvet, P.; Larabi-Gruet, N.; Laghoutaris, P.; Robin, R. Towards a reliable determination of the intergranular corrosion rate of austenitic stainless steel in oxidizing media. Corros. Sci. 2016, 107, 60–75. [Google Scholar] [CrossRef]
  3. Qian, J.; Chen, C.; Yu, H.; Liu, F.; Yang, H.; Zhang, Z. The influence and the mechanism of the precipitate/austenite interfacial C-enrichment on the intergranular corrosion sensitivity in 310 S stainless steel. Corros. Sci. 2016, 111, 352–361. [Google Scholar] [CrossRef]
  4. Kumar, S.; Prasad, B.S.; Kain, V.; Reddy, J. Methods for making alloy 600 resistant to sensitization and intergranular corrosion. Corros. Sci. 2013, 70, 55–61. [Google Scholar]
  5. Shimada, M.; Kokawa, H.; Wang, Z.J.; Sato, Y.S.; Karibe, I. Optimization of grain boundary character distribution for intergranular corrosion resistant 304 stainless steel by twin-induced grain boundary engineering. Acta Mater. 2002, 50, 2331–2341. [Google Scholar] [CrossRef]
  6. Arutunow, A.; Darowicki, K.; Tobiszewski, M.T. Electrical mapping of AISI 304 stainless steel subjected to intergranular corrosion performed by means of AFM–LIS in the contact mode. Corros. Sci. 2013, 71, 37–42. [Google Scholar] [CrossRef]
  7. Aydogdu, G.H.; Aydinol, M.K. Determination of susceptibility to intergranular corrosion and electrochemical reactivation behaviour of AISI 316L type stainless steel. Corros. Sci. 2006, 48, 3565–3583. [Google Scholar] [CrossRef]
  8. Strauss, B.; Schottry, H.; Hinnüber, J. Die Carbidausscheidung beim Glühen von nichtrostendem unmagnetischem Chromnickelstahl. Z. Anorg. Allg. Chem. 1930, 188, 309–324. [Google Scholar] [CrossRef]
  9. Bain, E.C.; Aborn, R.H.; Rutherford, J.J.B. The nature and prevention of intergranular corrosion in austenitic stainless steels. Trans. Am. Soc. Steel Treat. 1933, 21, 481–509. [Google Scholar]
  10. Sahlaoui, H.; Makhlouf, K.; Sidhom, H.; Philibert, J. Effects of ageing conditions on the precipitates evolution, chromium depletion and intergranular corrosion susceptibility of AISI 316L: Experimental and modeling results. Mater. Sci. Eng. A 2004, 372, 98–108. [Google Scholar] [CrossRef]
  11. Stickler, R.; Vinckier, A. Morphology of grain-boundary carbides and its influence on intergranular corrosion of 304 stainless steel. Trans. ASM 1961, 54, 80–82. [Google Scholar]
  12. Stickler, R.; Vinckier, A. Electron microscope investigation of the intergranular corrosion fracture surfaces in a sensitized austenitic stainless steel. Corros. Sci. 1963, 3, 1–8. [Google Scholar] [CrossRef]
  13. Rahman, S.; Priyadarshan, G.; Raja, K.S.; Nesbitt, C.; Misra, M. Investigation of the secondary phases of alloy 617 by scanning kelvin probe force microscope. Mater. Lett. 2008, 62, 2263–2266. [Google Scholar] [CrossRef]
  14. Anantha, K.H.; Örnek, C.; Ejnermark, S.; Medvedeva, A.; Sjöström, J.; Pan, J. Correlative microstructure analysis and in situ corrosion study of AISI 420 martensitic stainless steel for plastic molding applications. J. Electrochem. Soc. 2017, 164, C85–C93. [Google Scholar] [CrossRef]
  15. Guo, L.Q.; Li, M.; Shi, X.L.; Yan, Y.; Li, X.Y.; Qiao, L.J. Effect of annealing temperature on the corrosion behavior of duplex stainless steel studied by in situ techniques. Corros. Sci. 2011, 53, 3733–3741. [Google Scholar] [CrossRef]
  16. Sathirachinda, N.; Pettersson, R.; Wessman, S.; Pan, J. Study of nobility of chromium nitrides in isothermally aged duplex stainless steels by using SKPFM and SEM/EDS. Corros. Sci. 2010, 52, 179–186. [Google Scholar] [CrossRef]
  17. Sathirachinda, N.; Pettersson, R.; Pan, J. Depletion effects at phase boundaries in 2205 duplex stainless steel characterized with SKPFM and TEM/EDS. Corros. Sci. 2009, 51, 1850–1860. [Google Scholar] [CrossRef]
  18. Jiang, R.J.; Chen, C.F.; Zheng, S.Q.; Cui, L.S. The non-linear fitting method to study the semiconductor properties of passive films of INCONEL alloy G3. J. Electroanal. Chem. 2011, 658, 52–56. [Google Scholar] [CrossRef]
  19. Carmezim, M.J.; Simoes, A.M.; Montemor, M.F.; Belo, M.D.C. Capacitance behaviour of passive films on ferritic and austenitic stainless steel. Corros. Sci. 2005, 47, 581–591. [Google Scholar] [CrossRef]
  20. Jiang, R.; Chen, C.; Zheng, S. The non-linear fitting method to analyze the measured M–S plots of bipolar passive films. Electrochim. Acta 2010, 55, 2498–2504. [Google Scholar] [CrossRef]
  21. Macdonald, D.D. The history of the point defect model for the passive state: A brief review of film growth aspects. Electrochim. Acta 2011, 56, 1761–1772. [Google Scholar] [CrossRef]
  22. Bojinov, M.; Fabricius, G.; Laitinen, T.; Mäkelä, K.; Saario, T.; Sundholm, G. Coupling between ionic defect structure and electronic conduction in passive films on iron, chromium and iron–chromium alloys. Electrochim. Acta 2000, 45, 2029–2048. [Google Scholar] [CrossRef]
  23. Macdonald, D.D. Passivity-the key to our metals-based civilization. Pure Appl. Chem. 1999, 71, 951–978. [Google Scholar] [CrossRef]
  24. Guo, X.P.; Tomoe, Y.; Imaizumi, H.; Katoh, K. The electrochemical behavior and impedance characteristics of the passive film on carbon steel in nitric acid solutions. J. Electroanal. Chem. 1998, 445, 95–103. [Google Scholar] [CrossRef]
  25. Yu, H.; Chen, C.; Jiang, R.; Qiu, P.; Li, Y. Migration of ion vacancy in hydroxylated oxide film formed on Cr: A density functional theory investigation. J. Phys. Chem. C 2012, 116, 25478–25485. [Google Scholar] [CrossRef]
  26. Zuo, Q.; Liu, F.; Wang, L.; Chen, C. Evolution of secondary phases formed upon solidification of a Ni-based alloy. Metall. Mater. Trans. A 2013, 44, 3014–3027. [Google Scholar] [CrossRef]
  27. Turchi, P.E.A.; Kaufman, L.; Liu, Z.K. Modeling of Ni–Cr–Mo based alloys: Part I—Phase stability. Calphad 2006, 30, 70–87. [Google Scholar] [CrossRef]
  28. Sahlaoui, H.; Sidhom, H.; Philibert, J. Prediction of chromium depleted-zone evolution during aging of Ni–Cr–Fe alloys. Acta Mater. 2002, 50, 1383–1392. [Google Scholar] [CrossRef]
  29. Pan, Y.M.; Dunn, D.S.; Cragnolino, G.A.; Sridhar, N. Grain-boundary chemistry and intergranular corrosion in alloy 825. Metall. Mater. Trans. A 2000, 31, 1163–1173. [Google Scholar] [CrossRef]
  30. ASTM G48-03; Standard Test Methods for Pitting and Crevice Corrosion Resistance of Stainless Steels and Related Alloys by Use of Ferric Chloride Solution. Annual Book of ASTM Standards; ASTM International: West Conshohocken, PA, USA, 2003; pp. 191–201.
  31. Yin, Y.; Faulkner, R.G.; Moreton, P.; Armson, I.; Coyle, P. Grain boundary chromium depletion in austenitic alloys. J. Mater. Sci. 2010, 45, 5872–5882. [Google Scholar] [CrossRef]
  32. Trillo, E.A.; Murr, L.E. Effects of carbon content, deformation, and interfacial energetics on carbide precipitation and corrosion sensitization in 304 stainless steel. Acta Mater. 1998, 47, 235–245. [Google Scholar] [CrossRef]
  33. Lejcek, P. Grain Boundary Segregation in Metals; Springer: Berlin/Heidelberg, Germany, 2010; p. 136. [Google Scholar]
  34. Thuvander, M.; Miller, M.K.; Stiller, K. Grain boundary segregation during heat treatment at 600 °C in a model Alloy 600. Mater. Sci. Eng. A 1999, 270, 38–43. [Google Scholar] [CrossRef]
  35. Thuvander, M.; Stiller, K. Evolution of grain boundary chemistry in a Ni–17Cr–9Fe model alloy. Mater. Sci. Eng. A 1998, 250, 93–98. [Google Scholar] [CrossRef]
  36. Was, G.S.; Tischner, H.H.; Latanision, R.M. The influence of thermal treatment on the chemistry and structure of grain boundaries in Inconel 600. Metall. Mater. Trans. A 1981, 12, 1397–1408. [Google Scholar] [CrossRef]
Figure 1. UNS N08028 sample in SEM micrograph: (a) solution treated for 2 h at 1150 °C, (b) aging treated for 2 h at 700 °C, (c) aging treated for 2 h at 800 °C, and (d) aging treated for 2 h at 900 °C. The aging treatments were carried out following the solution treatment.
Coatings 13 01304 g001
Figure 2. TEM micrographs of sigma precipitates with their SAED and EDS line profiles of elements in the UNS N08028 samples aged at (a,b) 700 °C, (c,d) 800 °C, and (e,f) 900 °C. The yellow arrows indicate the direction of the EDS line scan. The white arrow is Sigma phase precipitation.
Coatings 13 01304 g002
Figure 3. SKPMP analysis of the UNS N08028 sample aged for 2 h at 900 °C, (a) SEM of surface morphology, (b) SKPFM image of the same area as (a), (c) Volta potential profile of line 1 in (b), and (d) Volta potential profile of line 2. The white arrow indicates the scan direction. The yellow dashed lines are low potential areas.
Coatings 13 01304 g003
Figure 4. Electrochemical test results of UNS N8028 heat-treated samples in 6% FeCl3 solution at 50 °C. (a) the anodic polarization curves; (b) the Nyquist plots; (c) the Bode logarithmic amplitude-frequency characteristic curve; and (d) the Bode logarithmic phase–frequency characteristic curve.
Coatings 13 01304 g004
Figure 5. SEM micrographs of UNS N08028 heat-treated samples after immersion in 6% FeCl3 solution for 72 h at 50 °C. (a) Solution treated for 2 h at 1150 °C, (b) aging treated for 2 h at 700 °C, (c) aging treated for 2 h at 800 °C, and (d) aging treated for 2 h at 900 °C.
Coatings 13 01304 g005
Figure 6. Self-diffusion coefficients of V O · · and V C r across the Cr2O3/Cr(OH)3 interface under the anodic electric field ( E σ ) formed by the potential difference ( U σ = 0.102 mV) between the sigma phase and low-potential area [25].
Coatings 13 01304 g006
Table 1. Chemical composition of nickel–iron–chromium alloy UNS N08028 (in wt%).
CrNiMoCCuSiMnPSFe
283040.020.80.0210.030.0336.1
Table 2. Parameters and diffusion coefficients of vacancies migrating across the Cr2O3/Cr(OH)3 interface.
l2v
(/s)
ETSEreac
(eV)
En-p
(V/cm2)
Uσ
(V/cm2)
q
(e)
h 1
(nm)
h 2
(nm)
Diffusion Coefficient
(cm2/s)
V O · · 2.54 × 10111.585.58 × 106102+20.3086.0 D T V O · · = 2.41 × 10 4   e x p 1.58 k T
V C r 5.64 × 10111.70−30.2628.7 D T   V C r   = 3.87 × 10 4   e x p 1.40 k T
Disclaimer/Publisher’s Note: The statements, opinions and data contained in all publications are solely those of the individual author(s) and contributor(s) and not of MDPI and/or the editor(s). MDPI and/or the editor(s) disclaim responsibility for any injury to people or property resulting from any ideas, methods, instructions or products referred to in the content.

