
Study on the Galvanic Corrosion between 13Cr Alloy Tubing and Downhole Tools of 9Cr and P110: Experimental Investigation and Numerical Simulation
Abstract
:1. Introduction
2. Experimental
2.1. Materials and Experimental Preparation
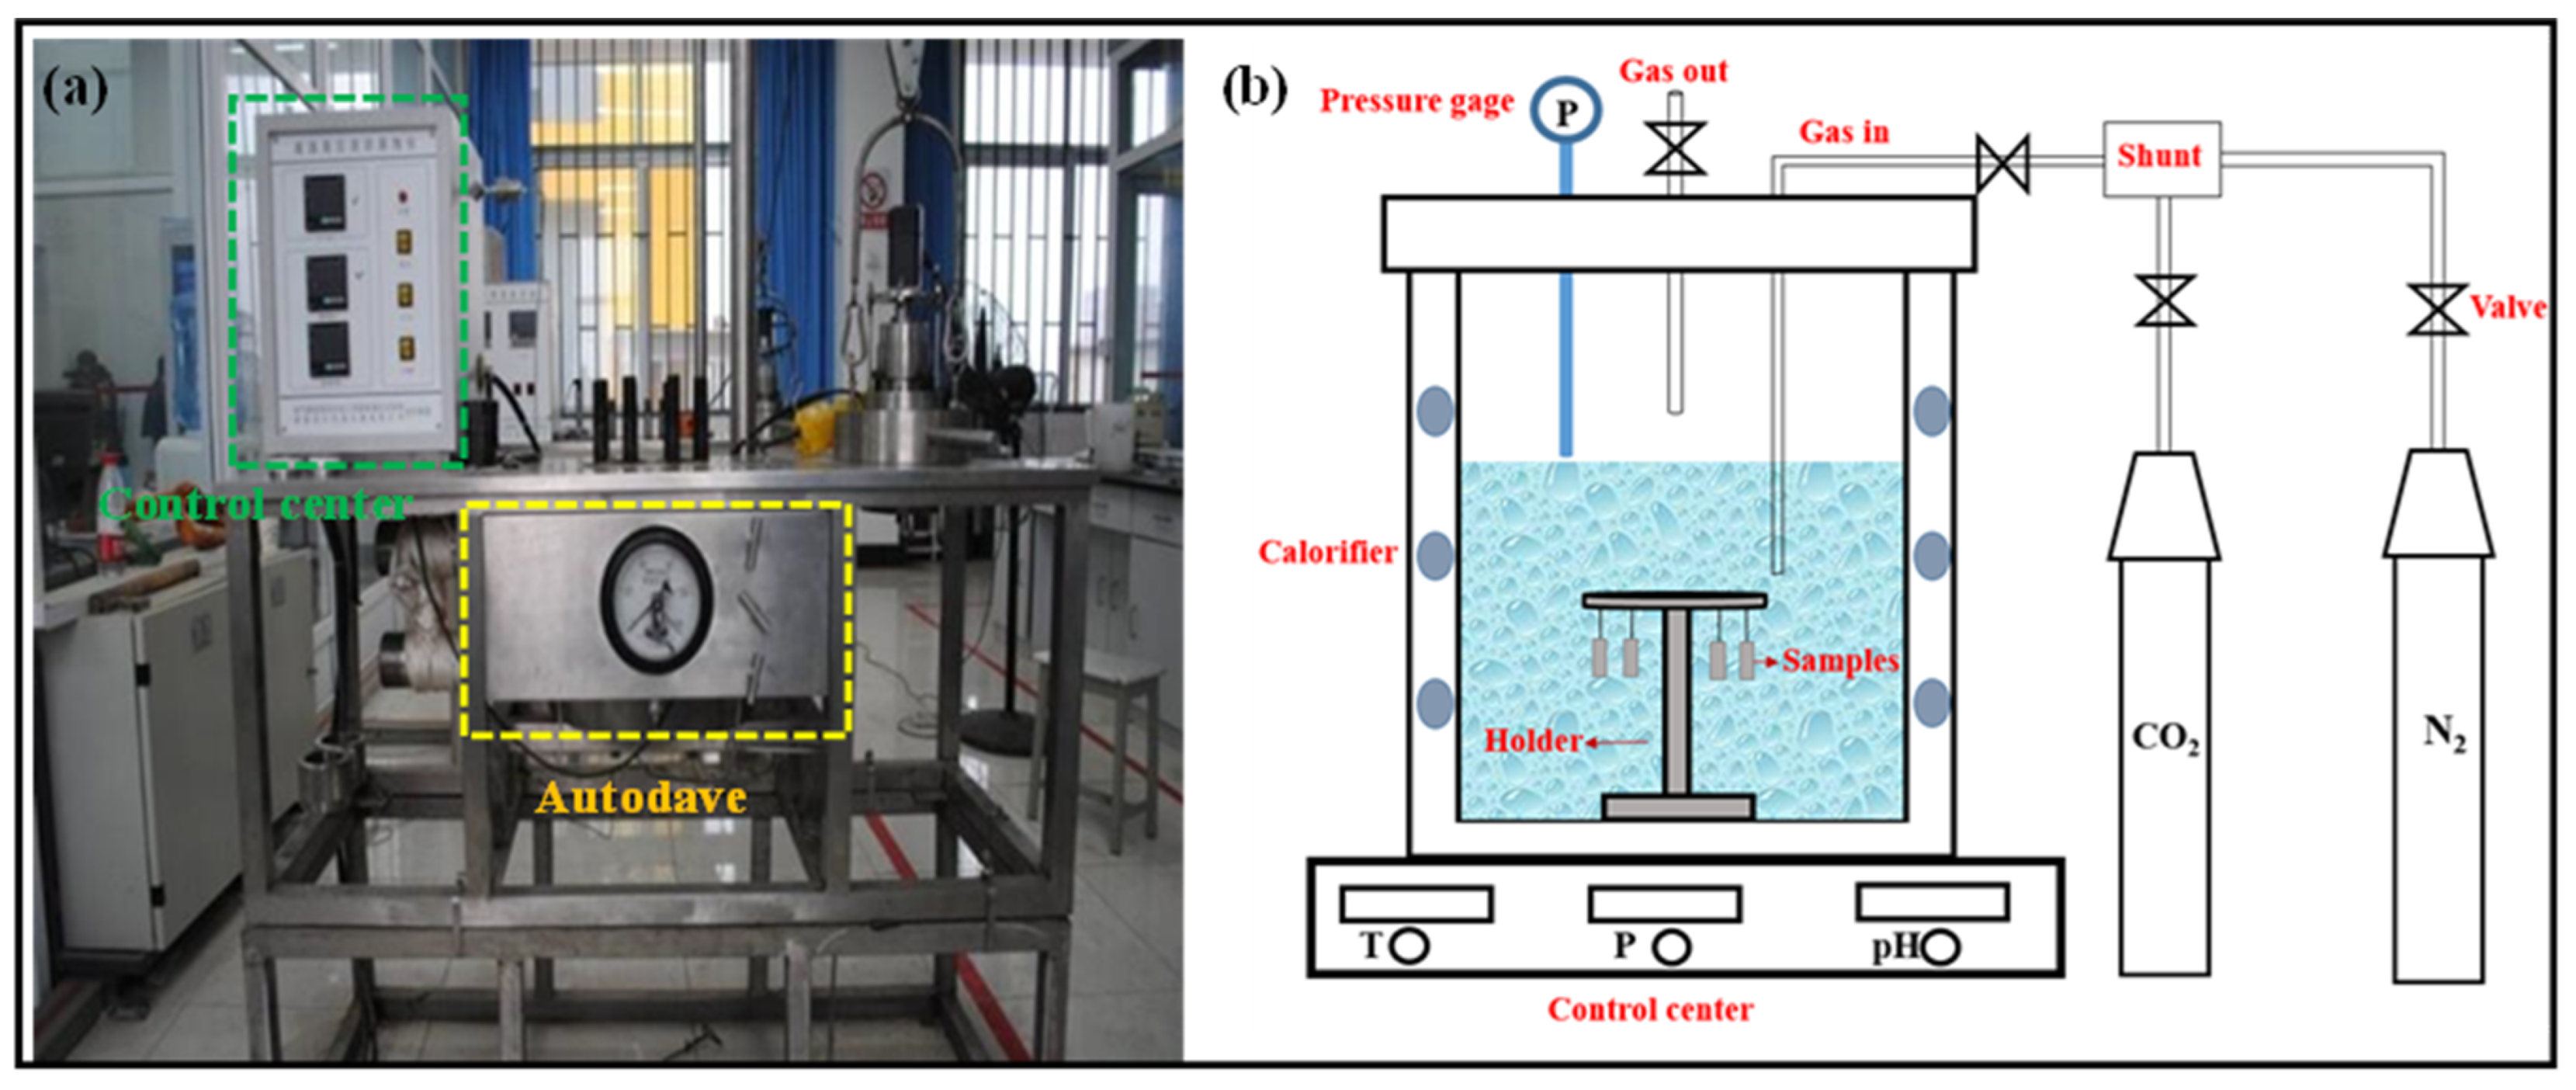
2.2. HTHP Corrosion Tests
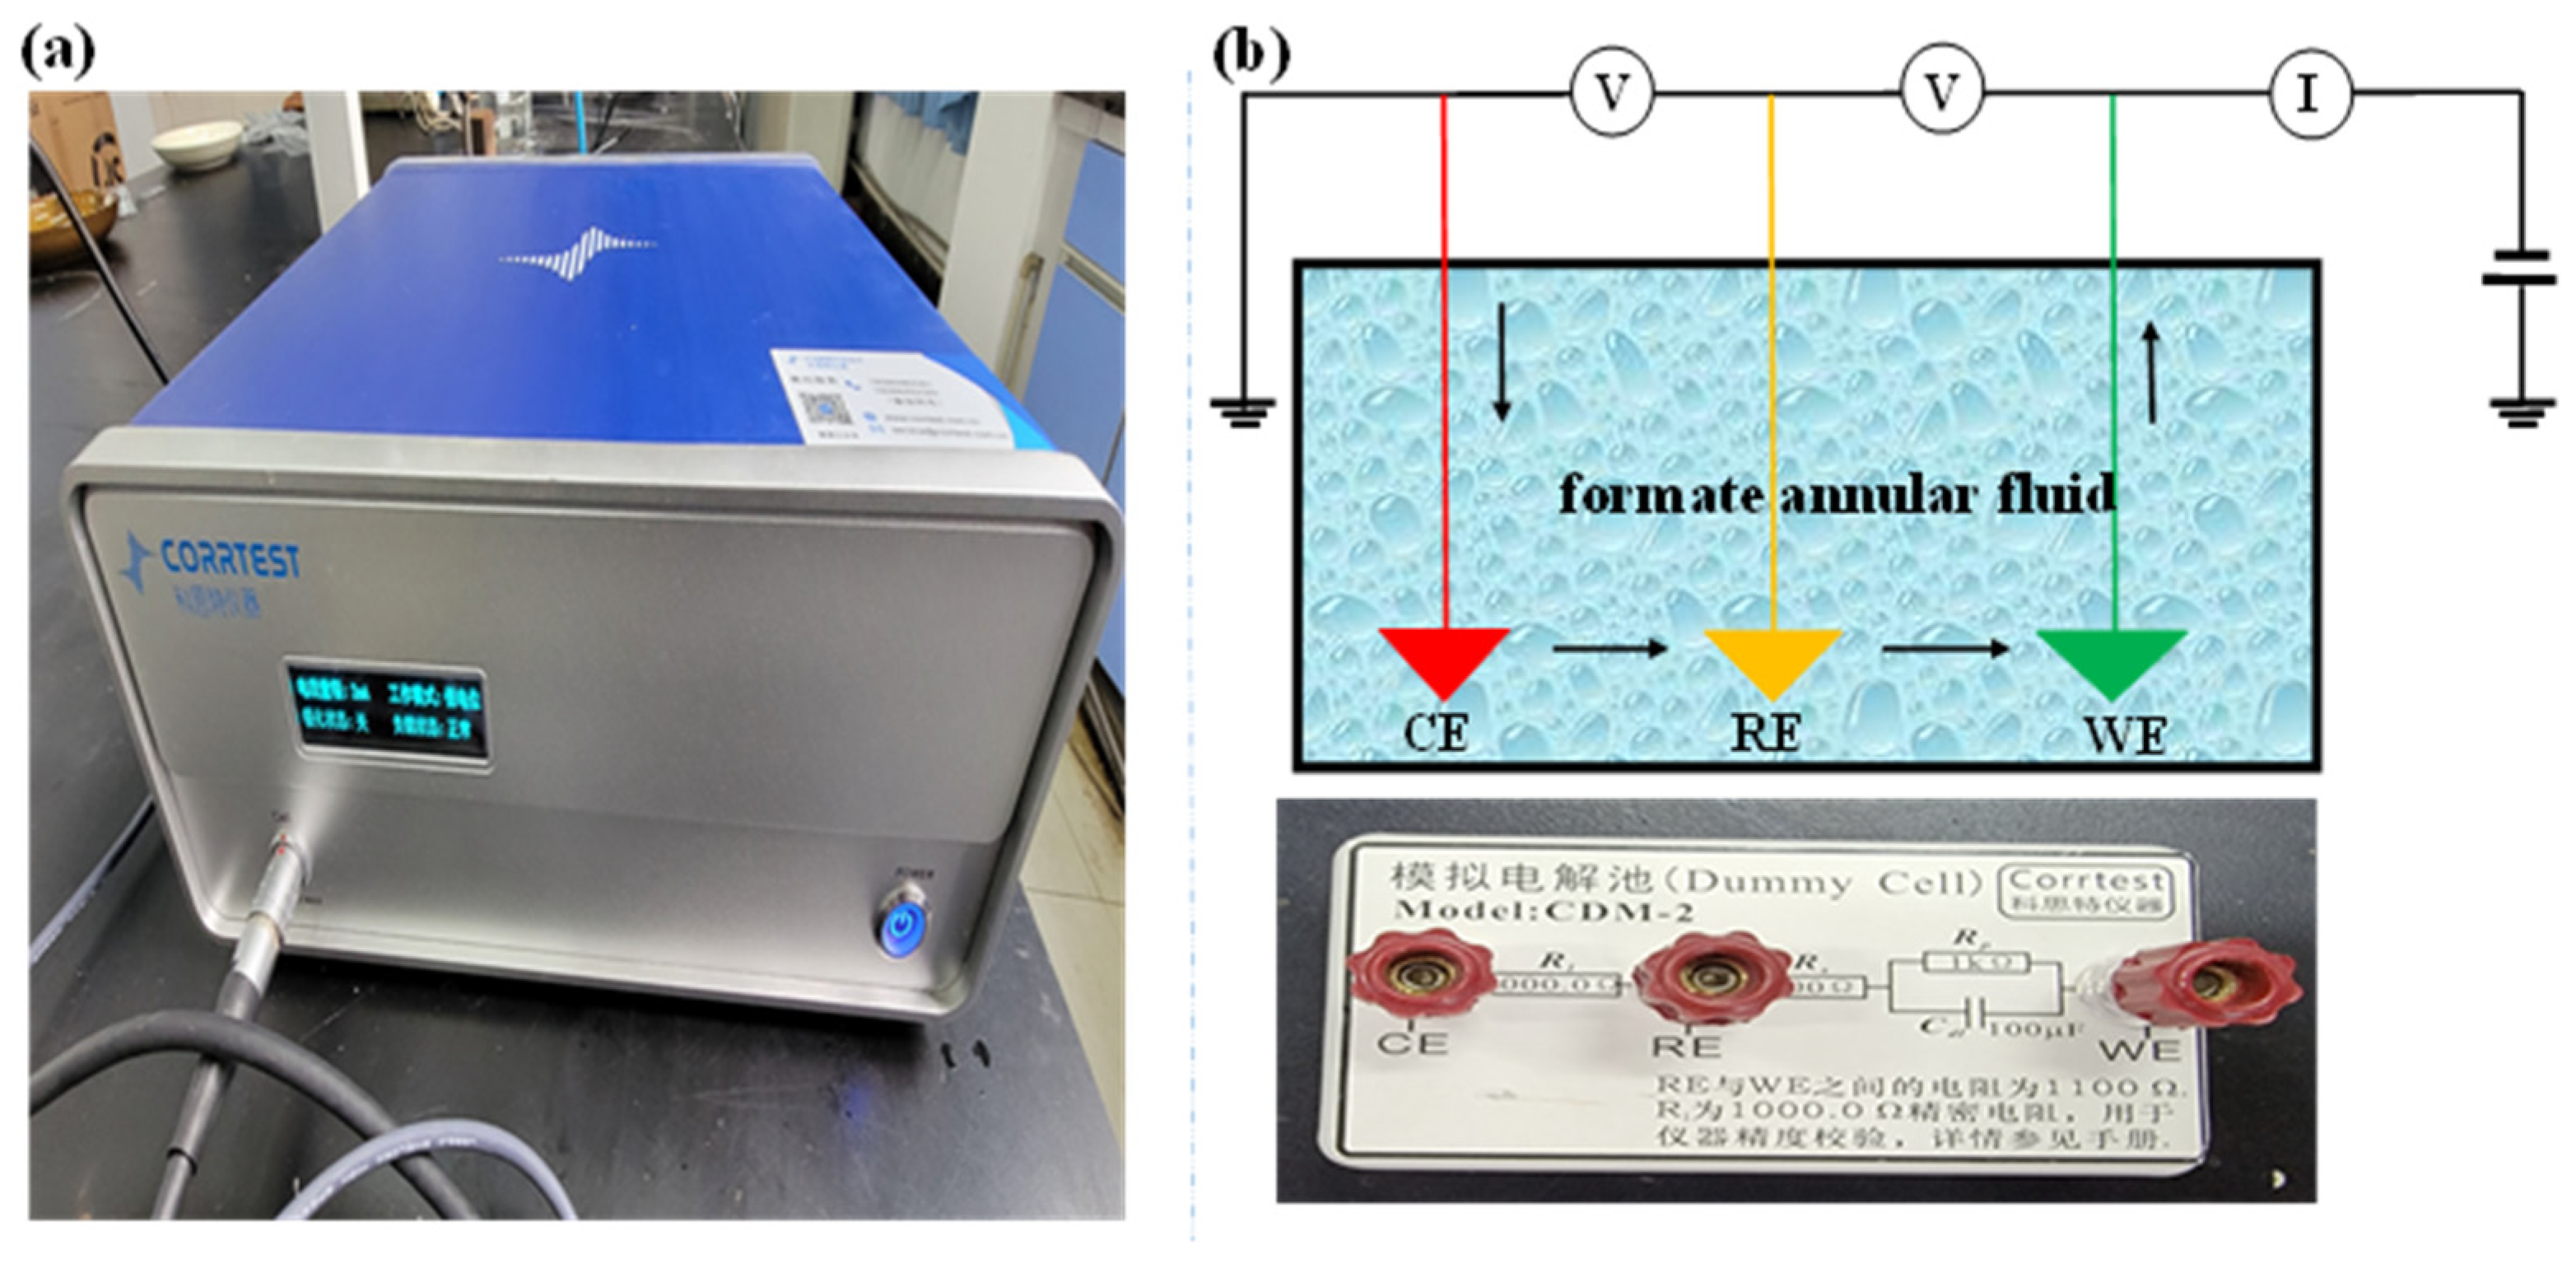
2.3. Electrochemical Measurements
3. Experimental Results
3.1. HTHP Corrosion Resistance
3.2. Electrochemical Results
4. Galvanic Corrosion Modeling
4.1. Modeling
4.2. FE Analysis
5. Discussion
- (1)
- Select materials reasonably. The driving force for galvanic corrosion comes from the potential difference between two different metals in contact; hence, the material used for the tubing string assembly should be selected to be as close as possible to the metal in the galvanic sequence. In tubing design, the use of 13Cr–P110 tubing material combinations was avoided as much as possible. Although this saved material costs, it did not pay off in the long run.
- (2)
- Reasonable structural design. Galvanic corrosion is mainly concentrated near the joint, so when two pipes of different materials are connected through the joint, a structure with a large anode area and a small cathode area should be used as far as possible.
- (3)
- Protective coating layer. Nonmetallic coatings can be applied to tubing joints to mitigate galvanic corrosion [25].
- (4)
- Change the corrosive environment. Corrosion inhibitors or cathodic depolarizers can be added to the wellbore to mitigate the corrosive effects of the downhole media.
6. Conclusions
- (1)
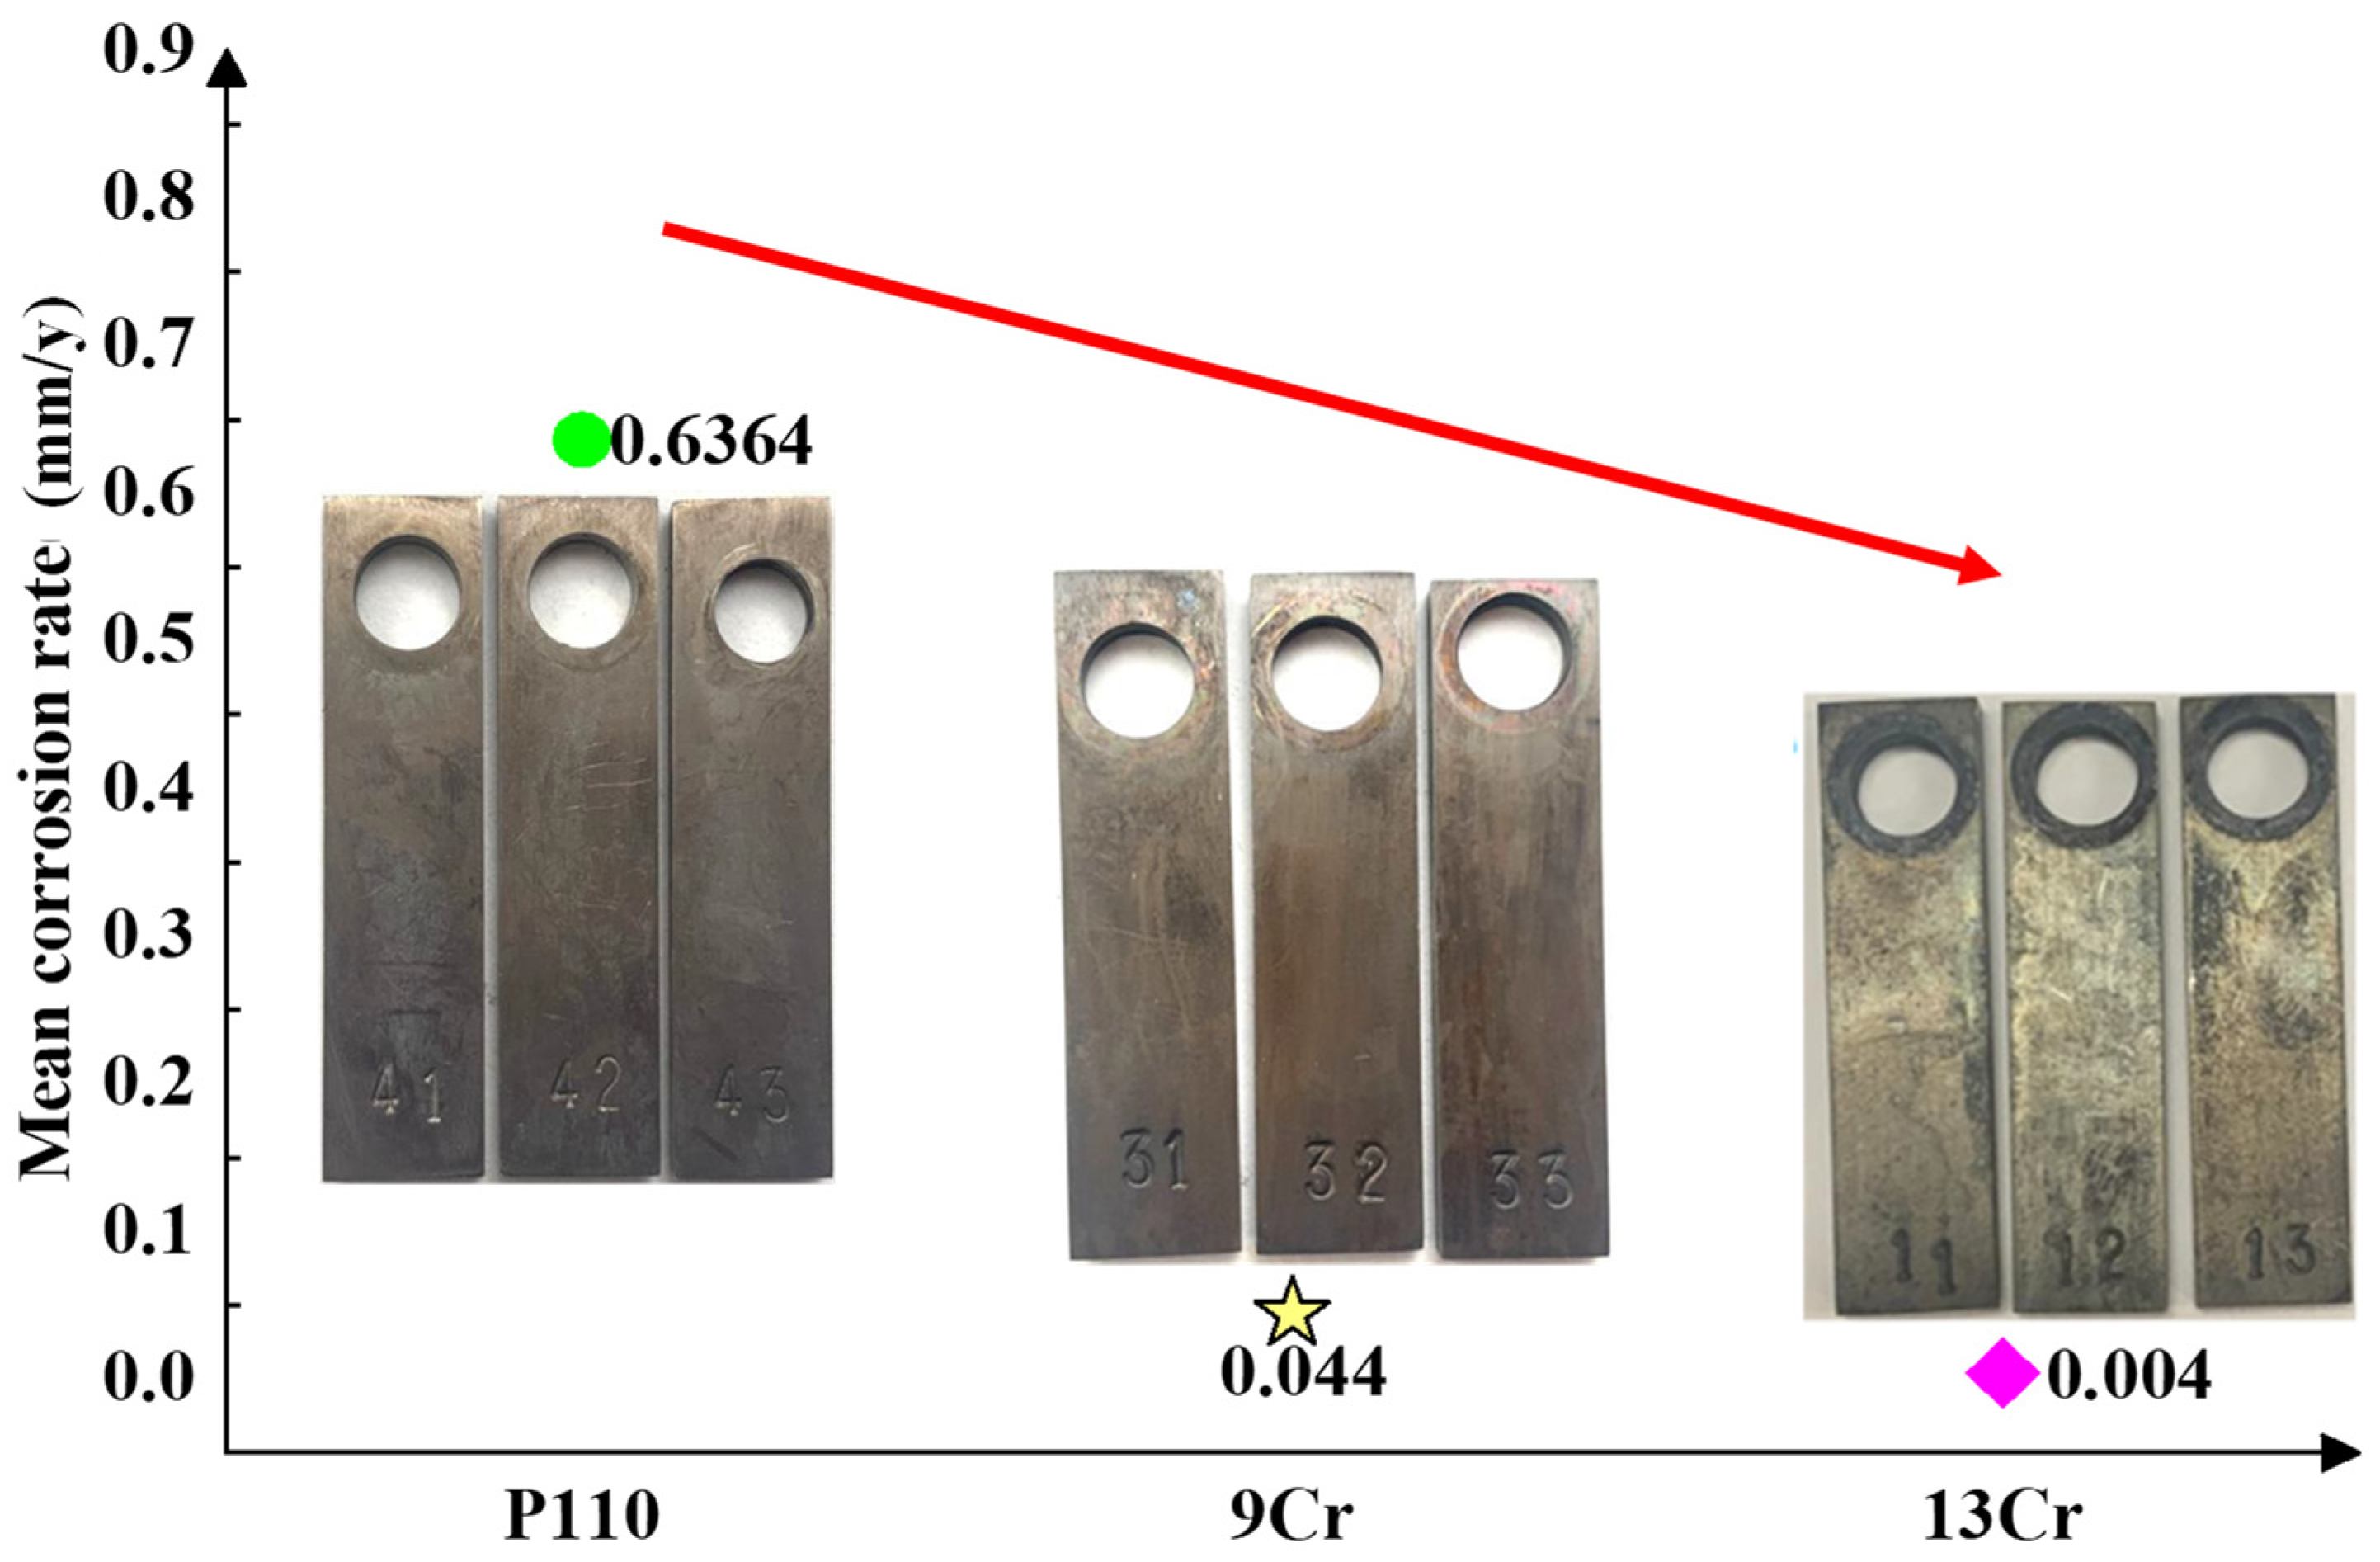
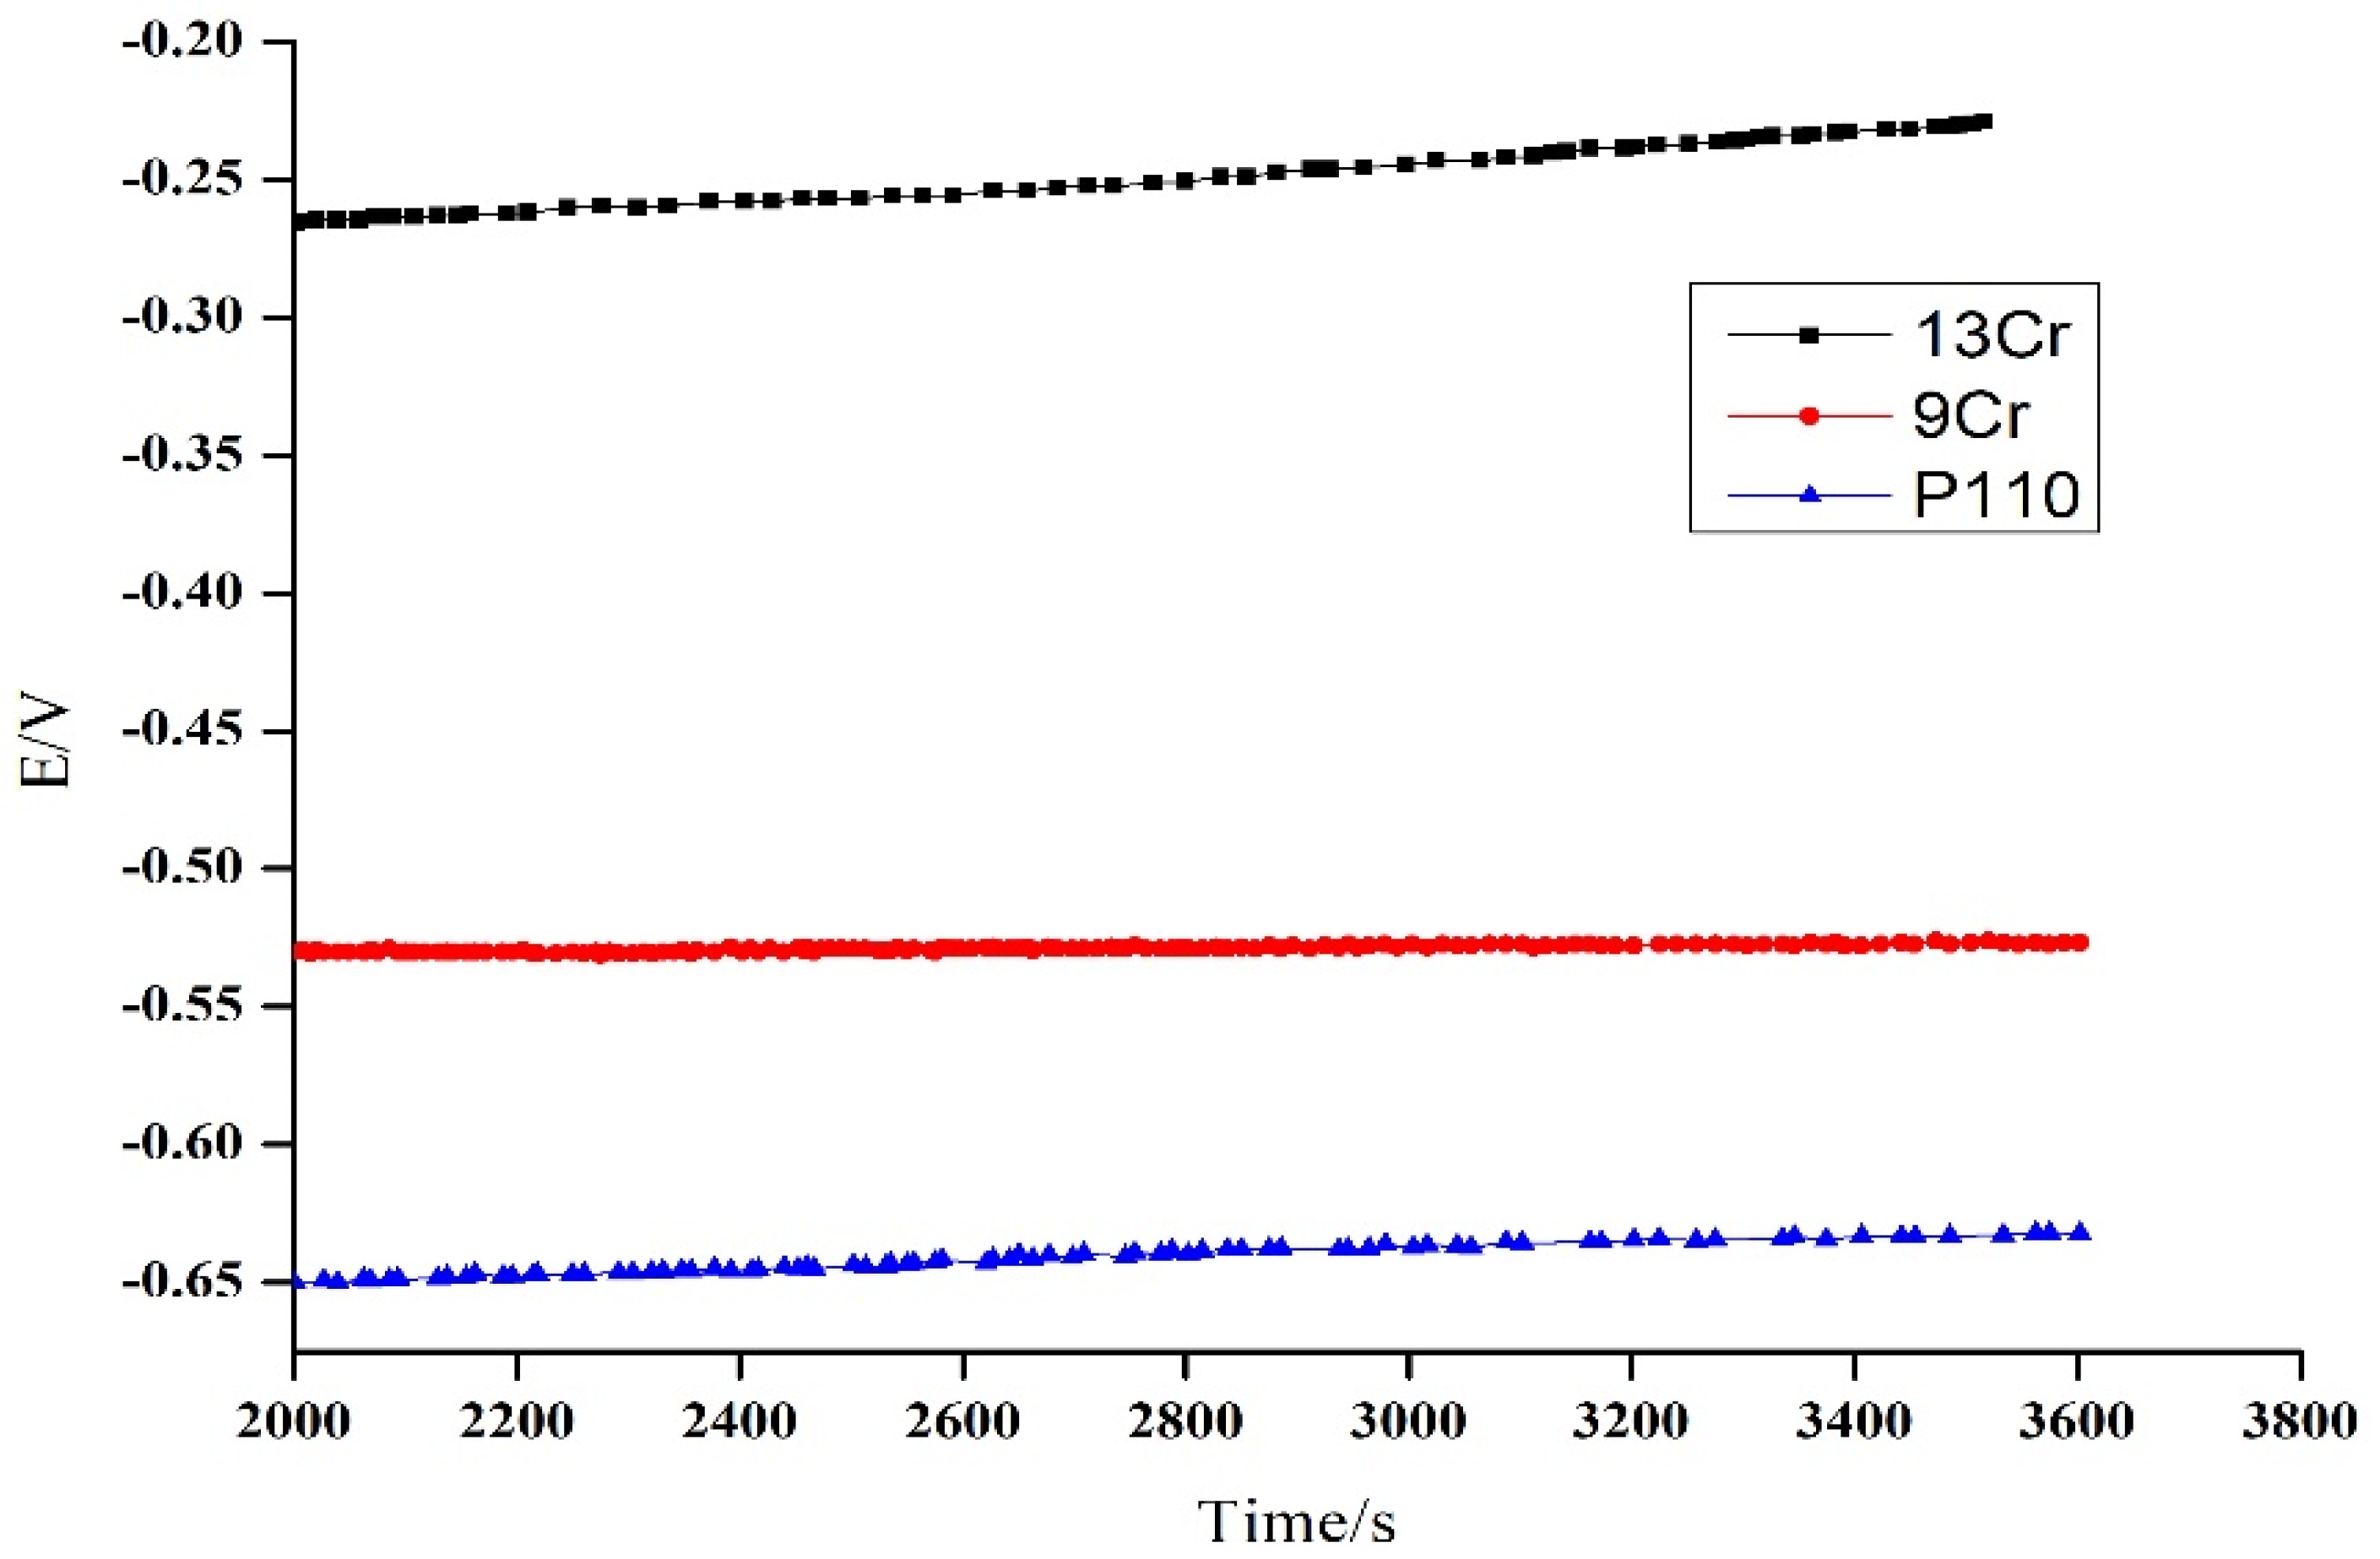
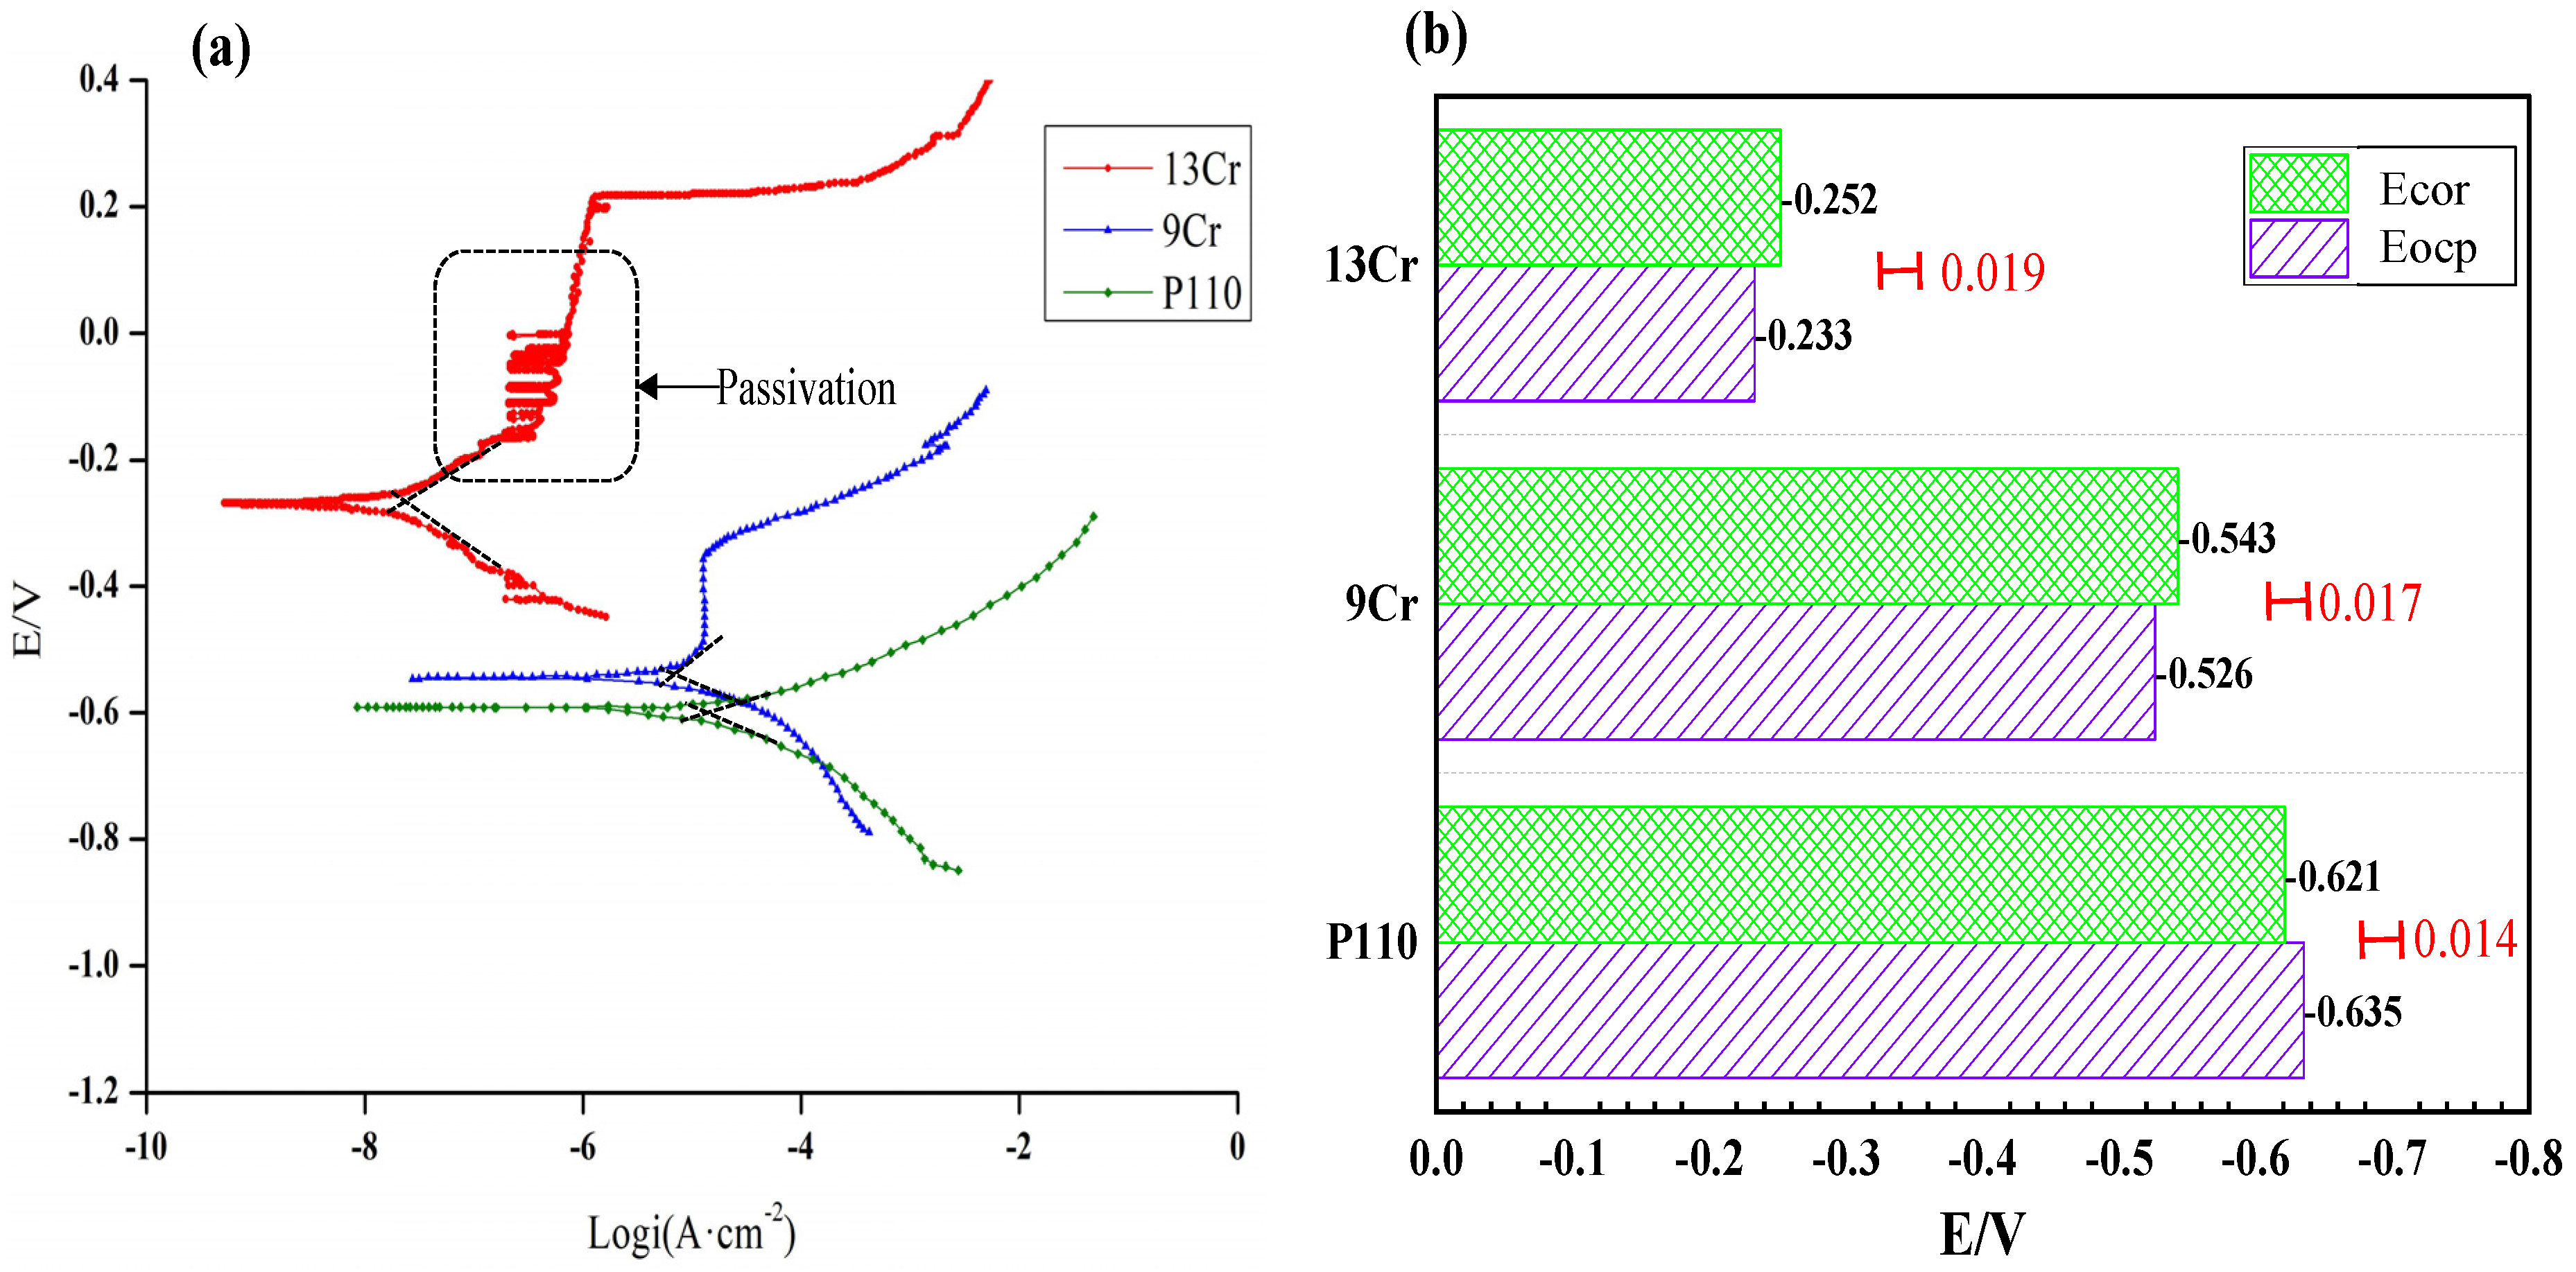
- The HTHP corrosion tests show that the corrosion rates of the three materials in formate are as follows: P110 (0.6364 mm/y) > 9Cr (0.0440 mm/y) > 13Cr (0.0040 mm/y). The electrochemical measurements reveal that the corrosion potentials of 13Cr, 9Cr and P110 are −0.2524 V, −0.5437 V and −0.621 V, respectively. The corrosion rates of the three different materials are as follows: P110 (0.072 mm/y) > 9Cr (0.033 mm/y) > 13Cr (0.0022 mm/y).
- (2)
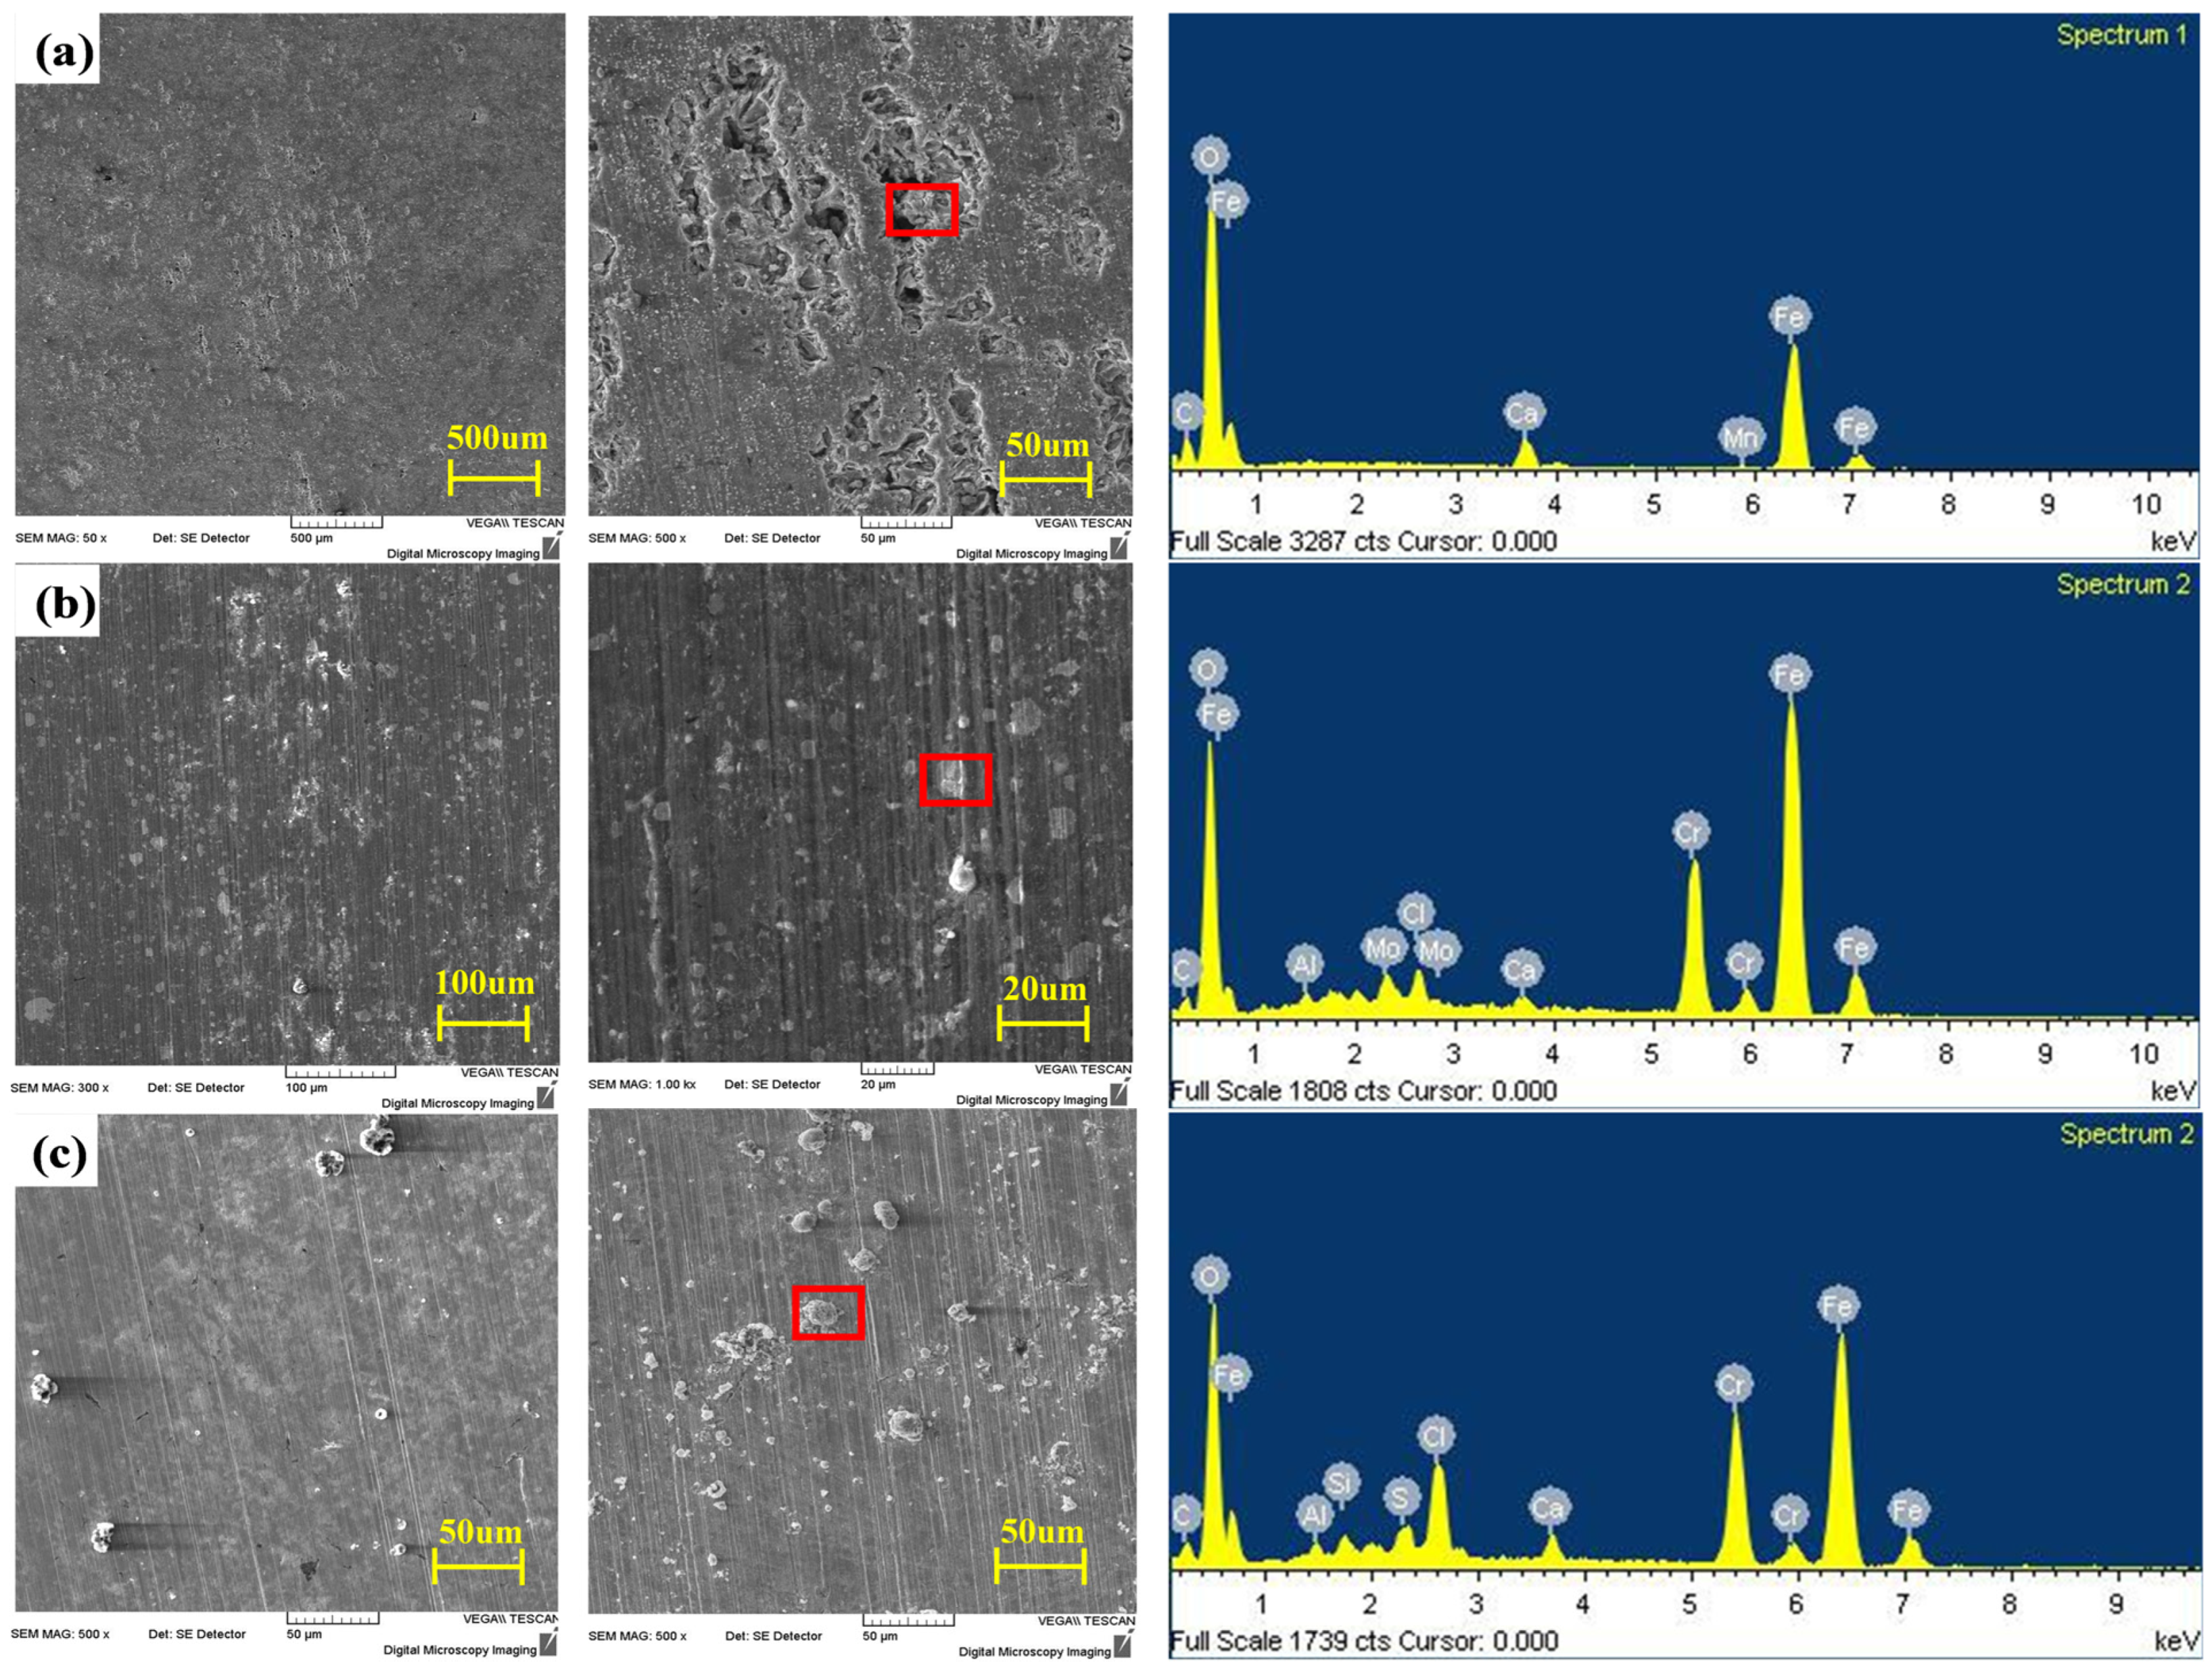
- The 13Cr and 9Cr materials have an obvious passivation zone on the polarization curve. The reason for the corrosion resistance of 9Cr and 13Cr is that the surface corrosion product Cr(OH)3 is firmly attached and dense.
- (3)
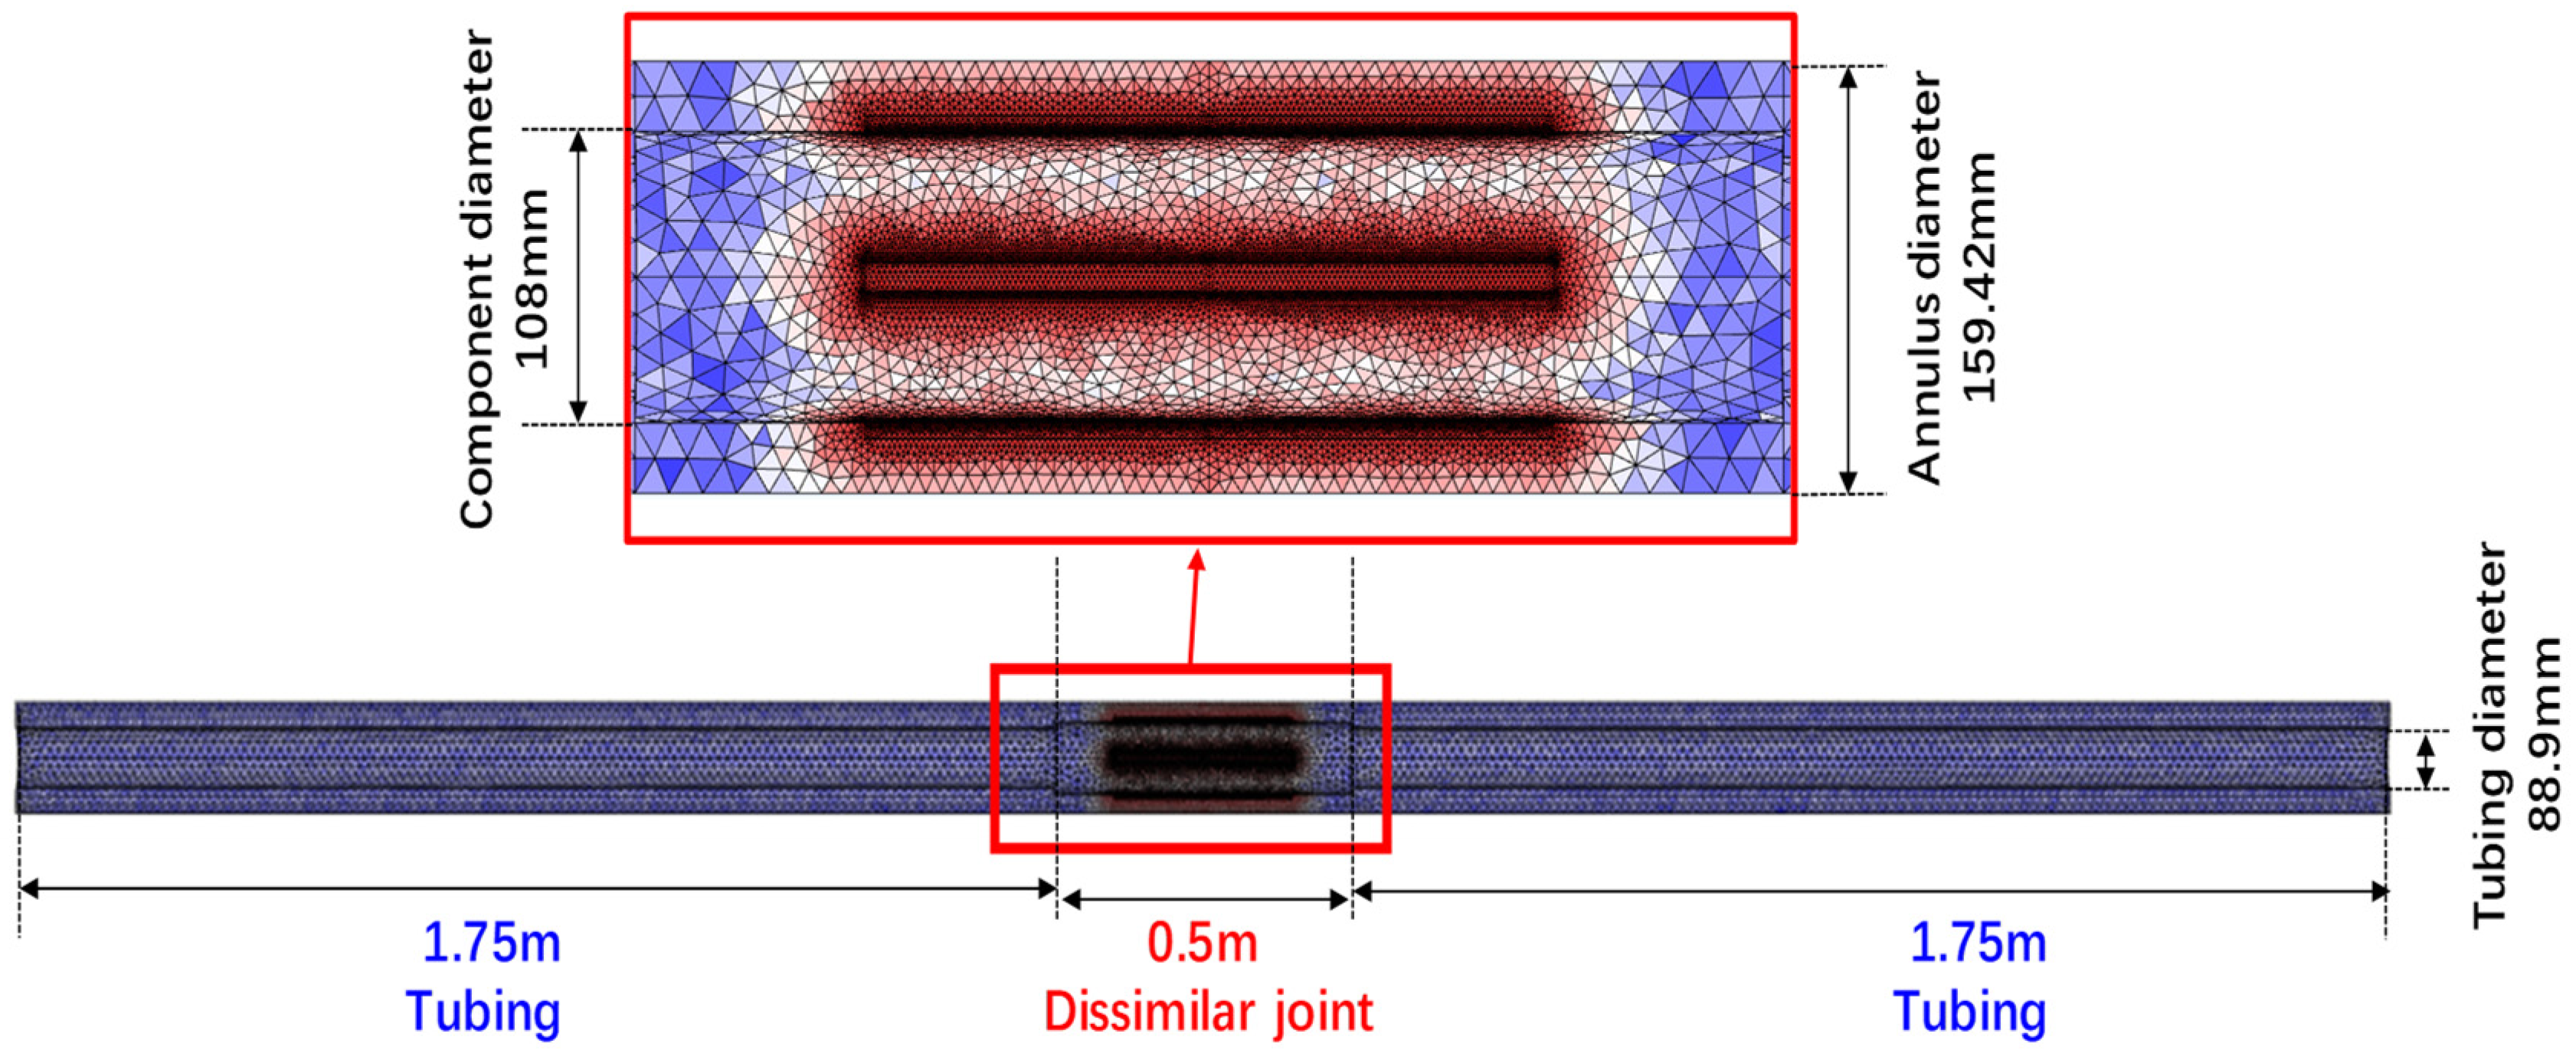
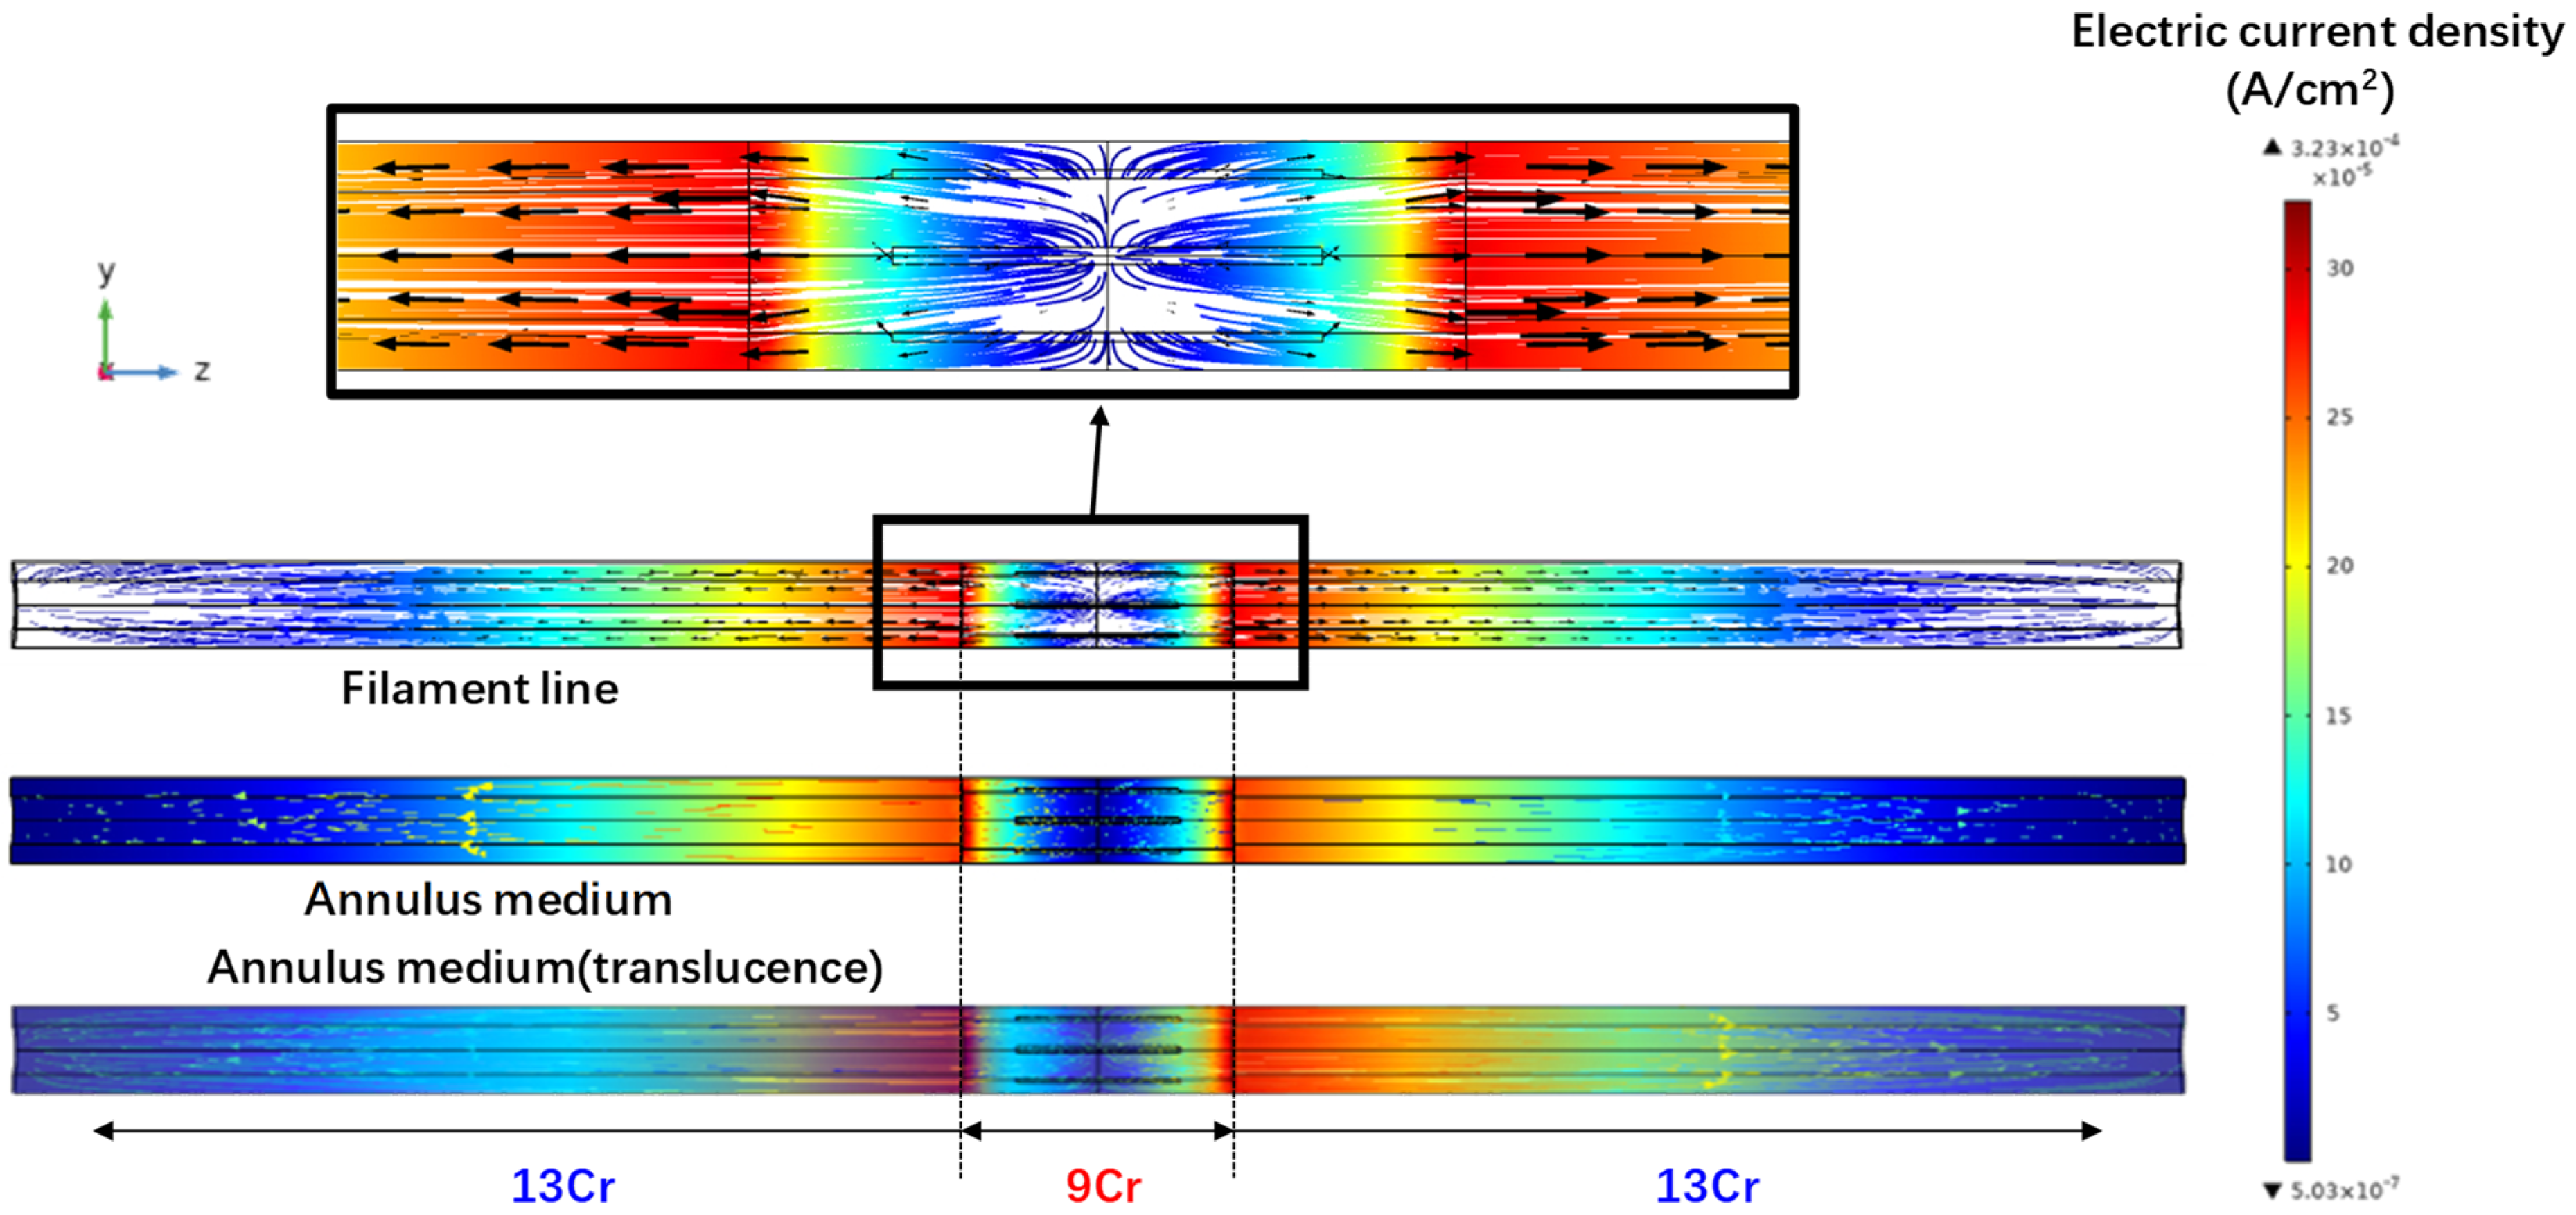
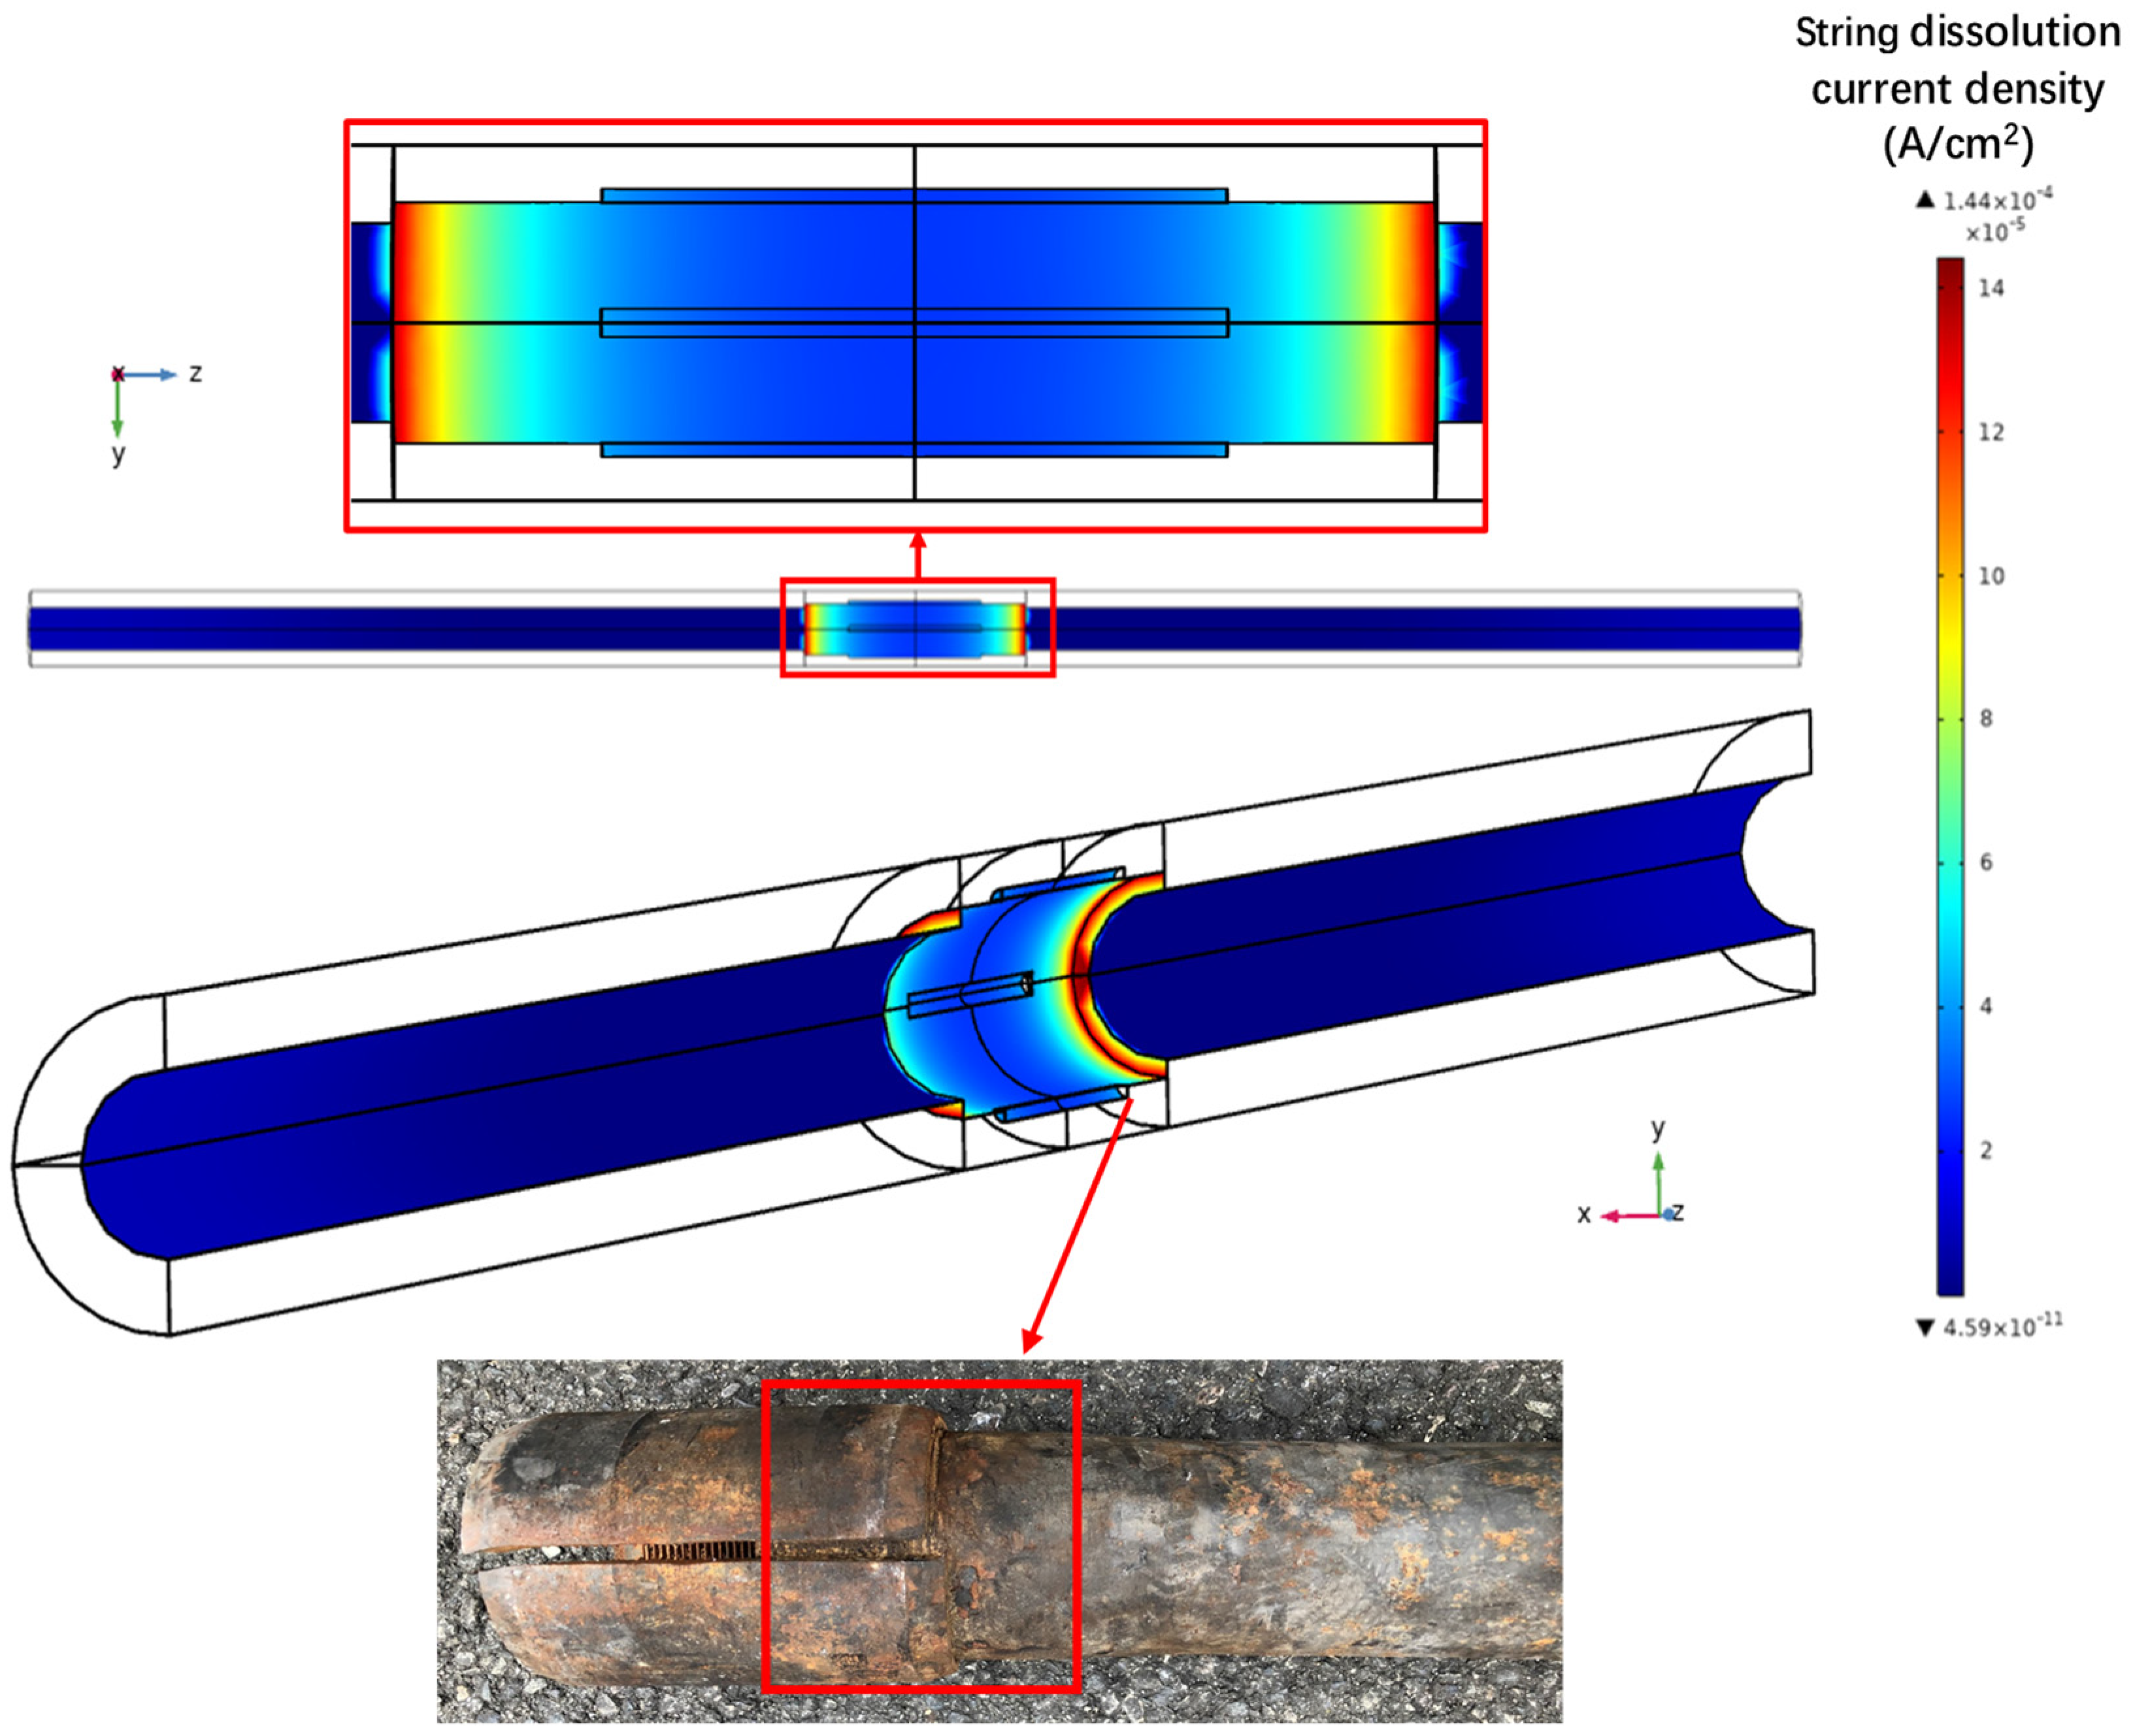
- A 3D FEM of the galvanic corrosion of 13Cr with 9Cr and P110 joints was established based on the electrochemical test results. The FEM analysis shows that the 13Cr tube has obvious galvanic corrosion with 9Cr and P110 joints, which is consistent with the analysis results of the polarization curve.
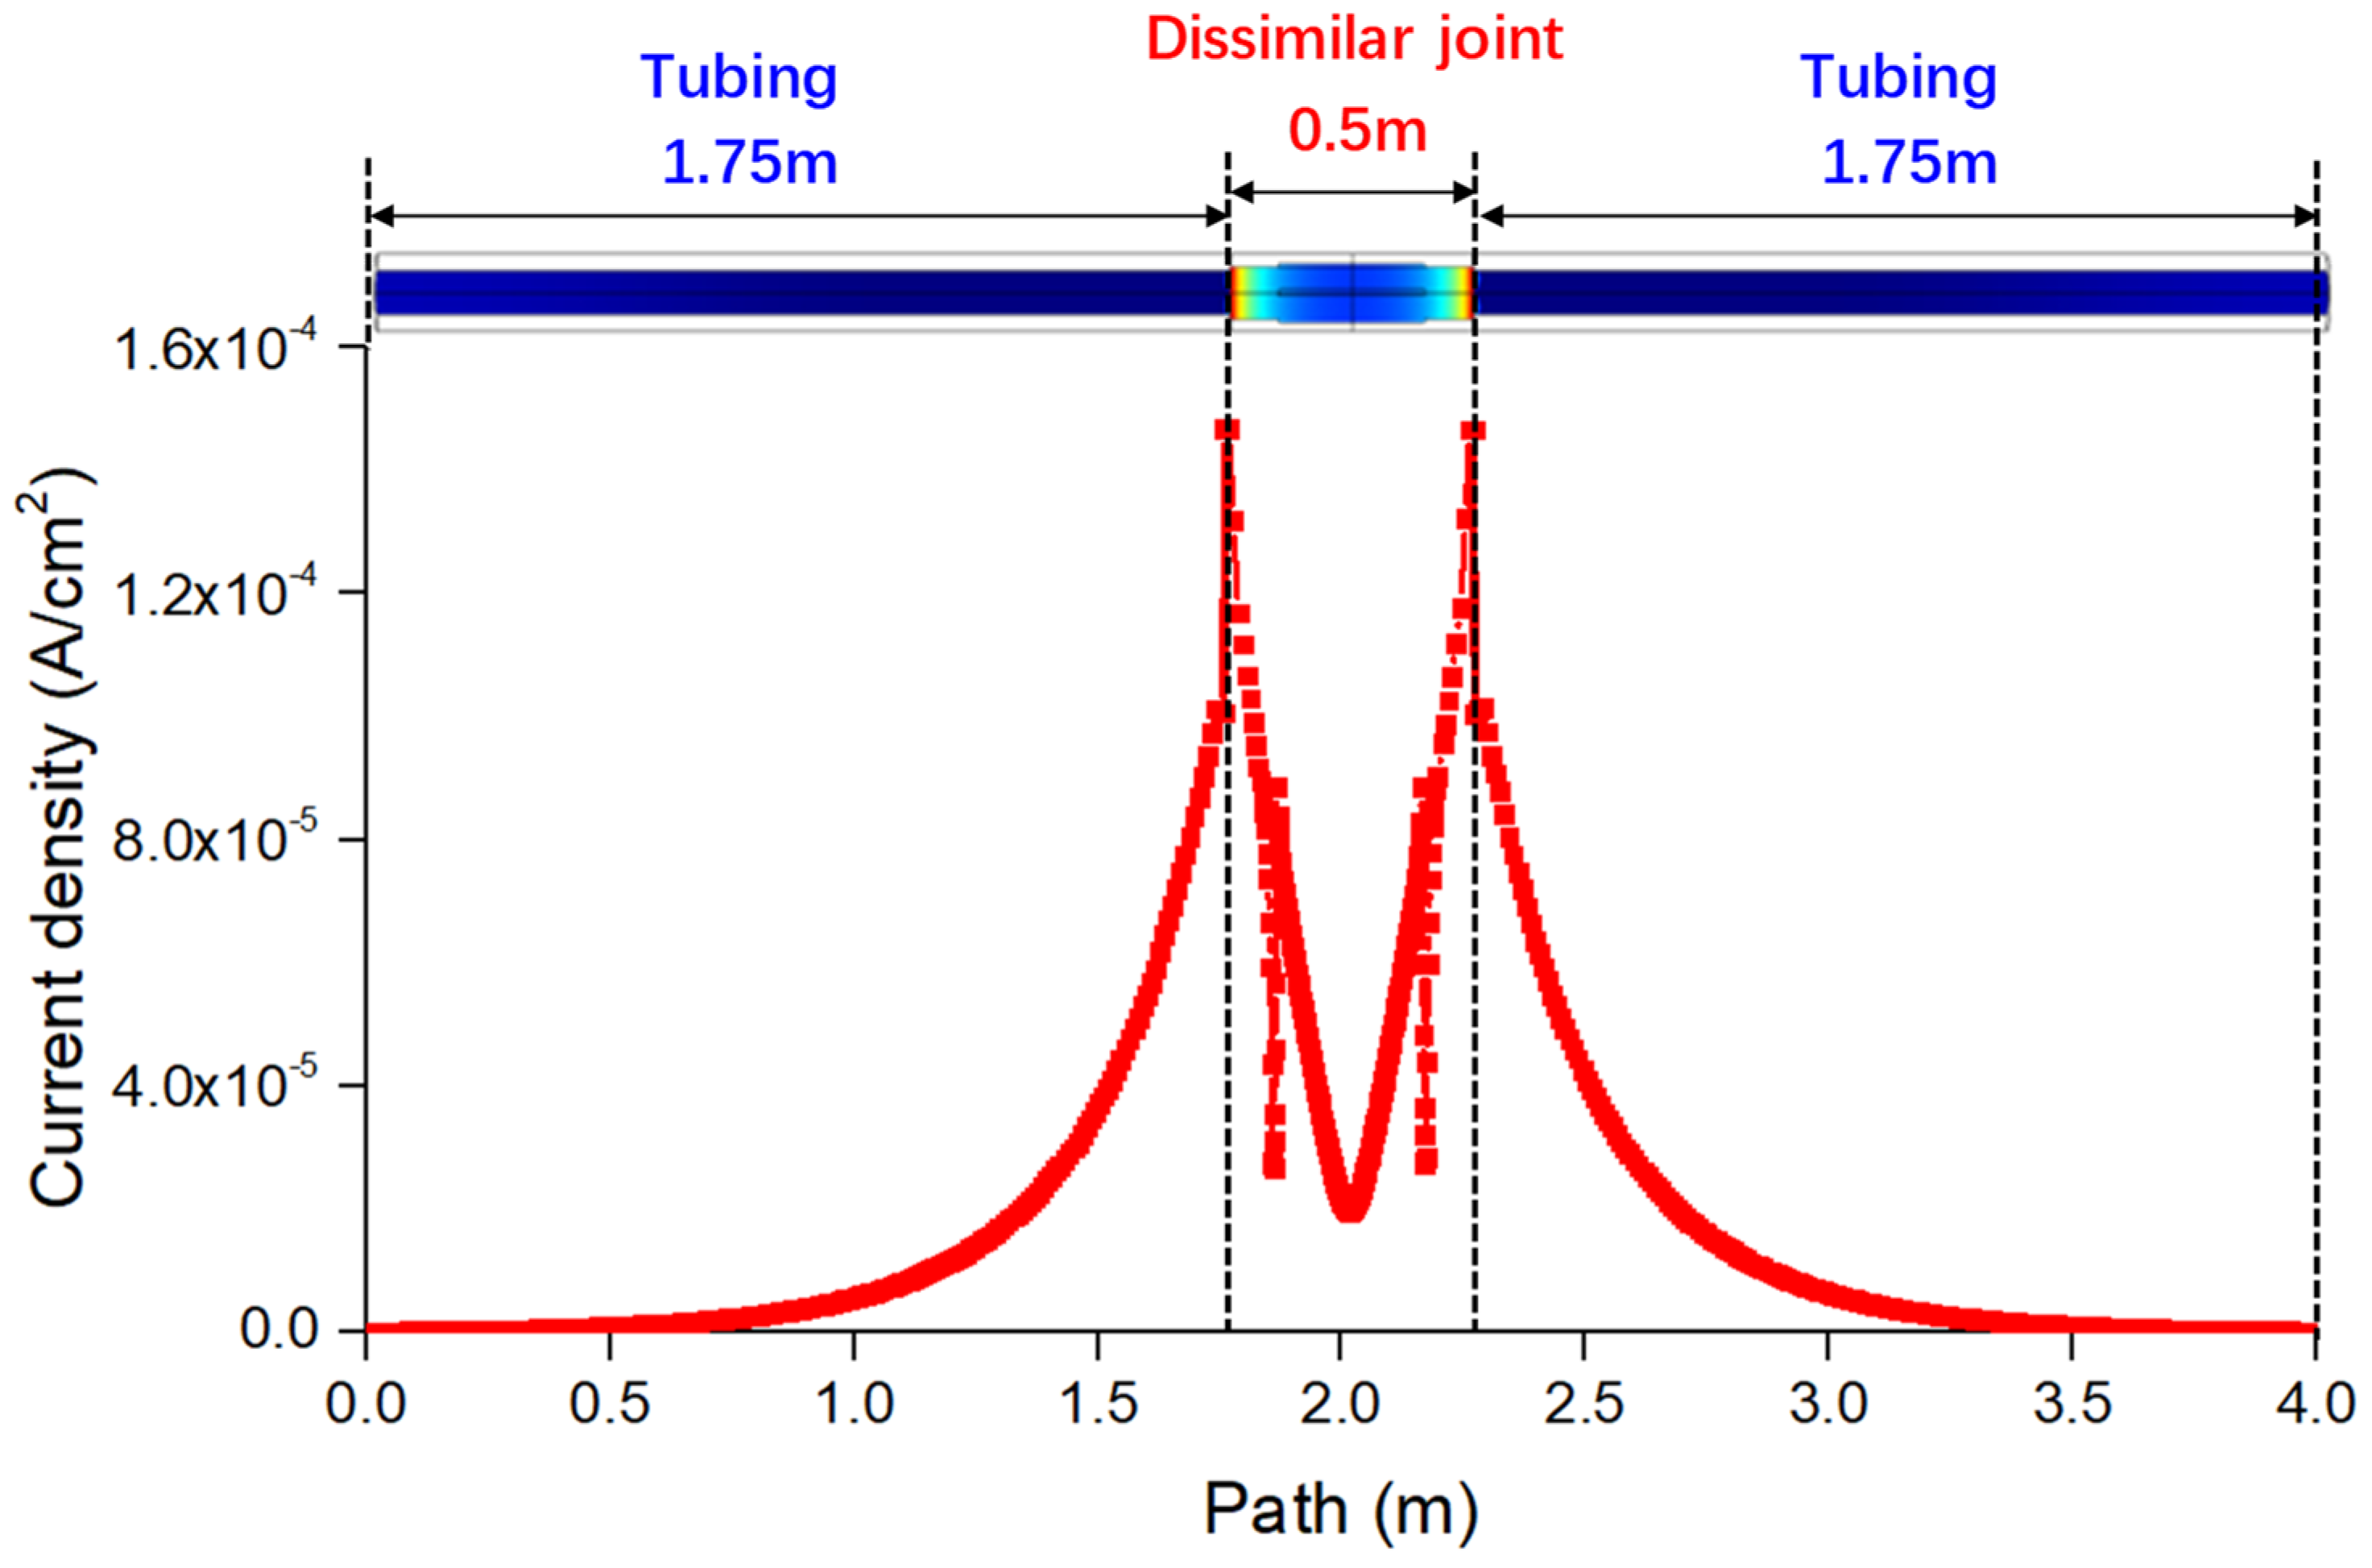
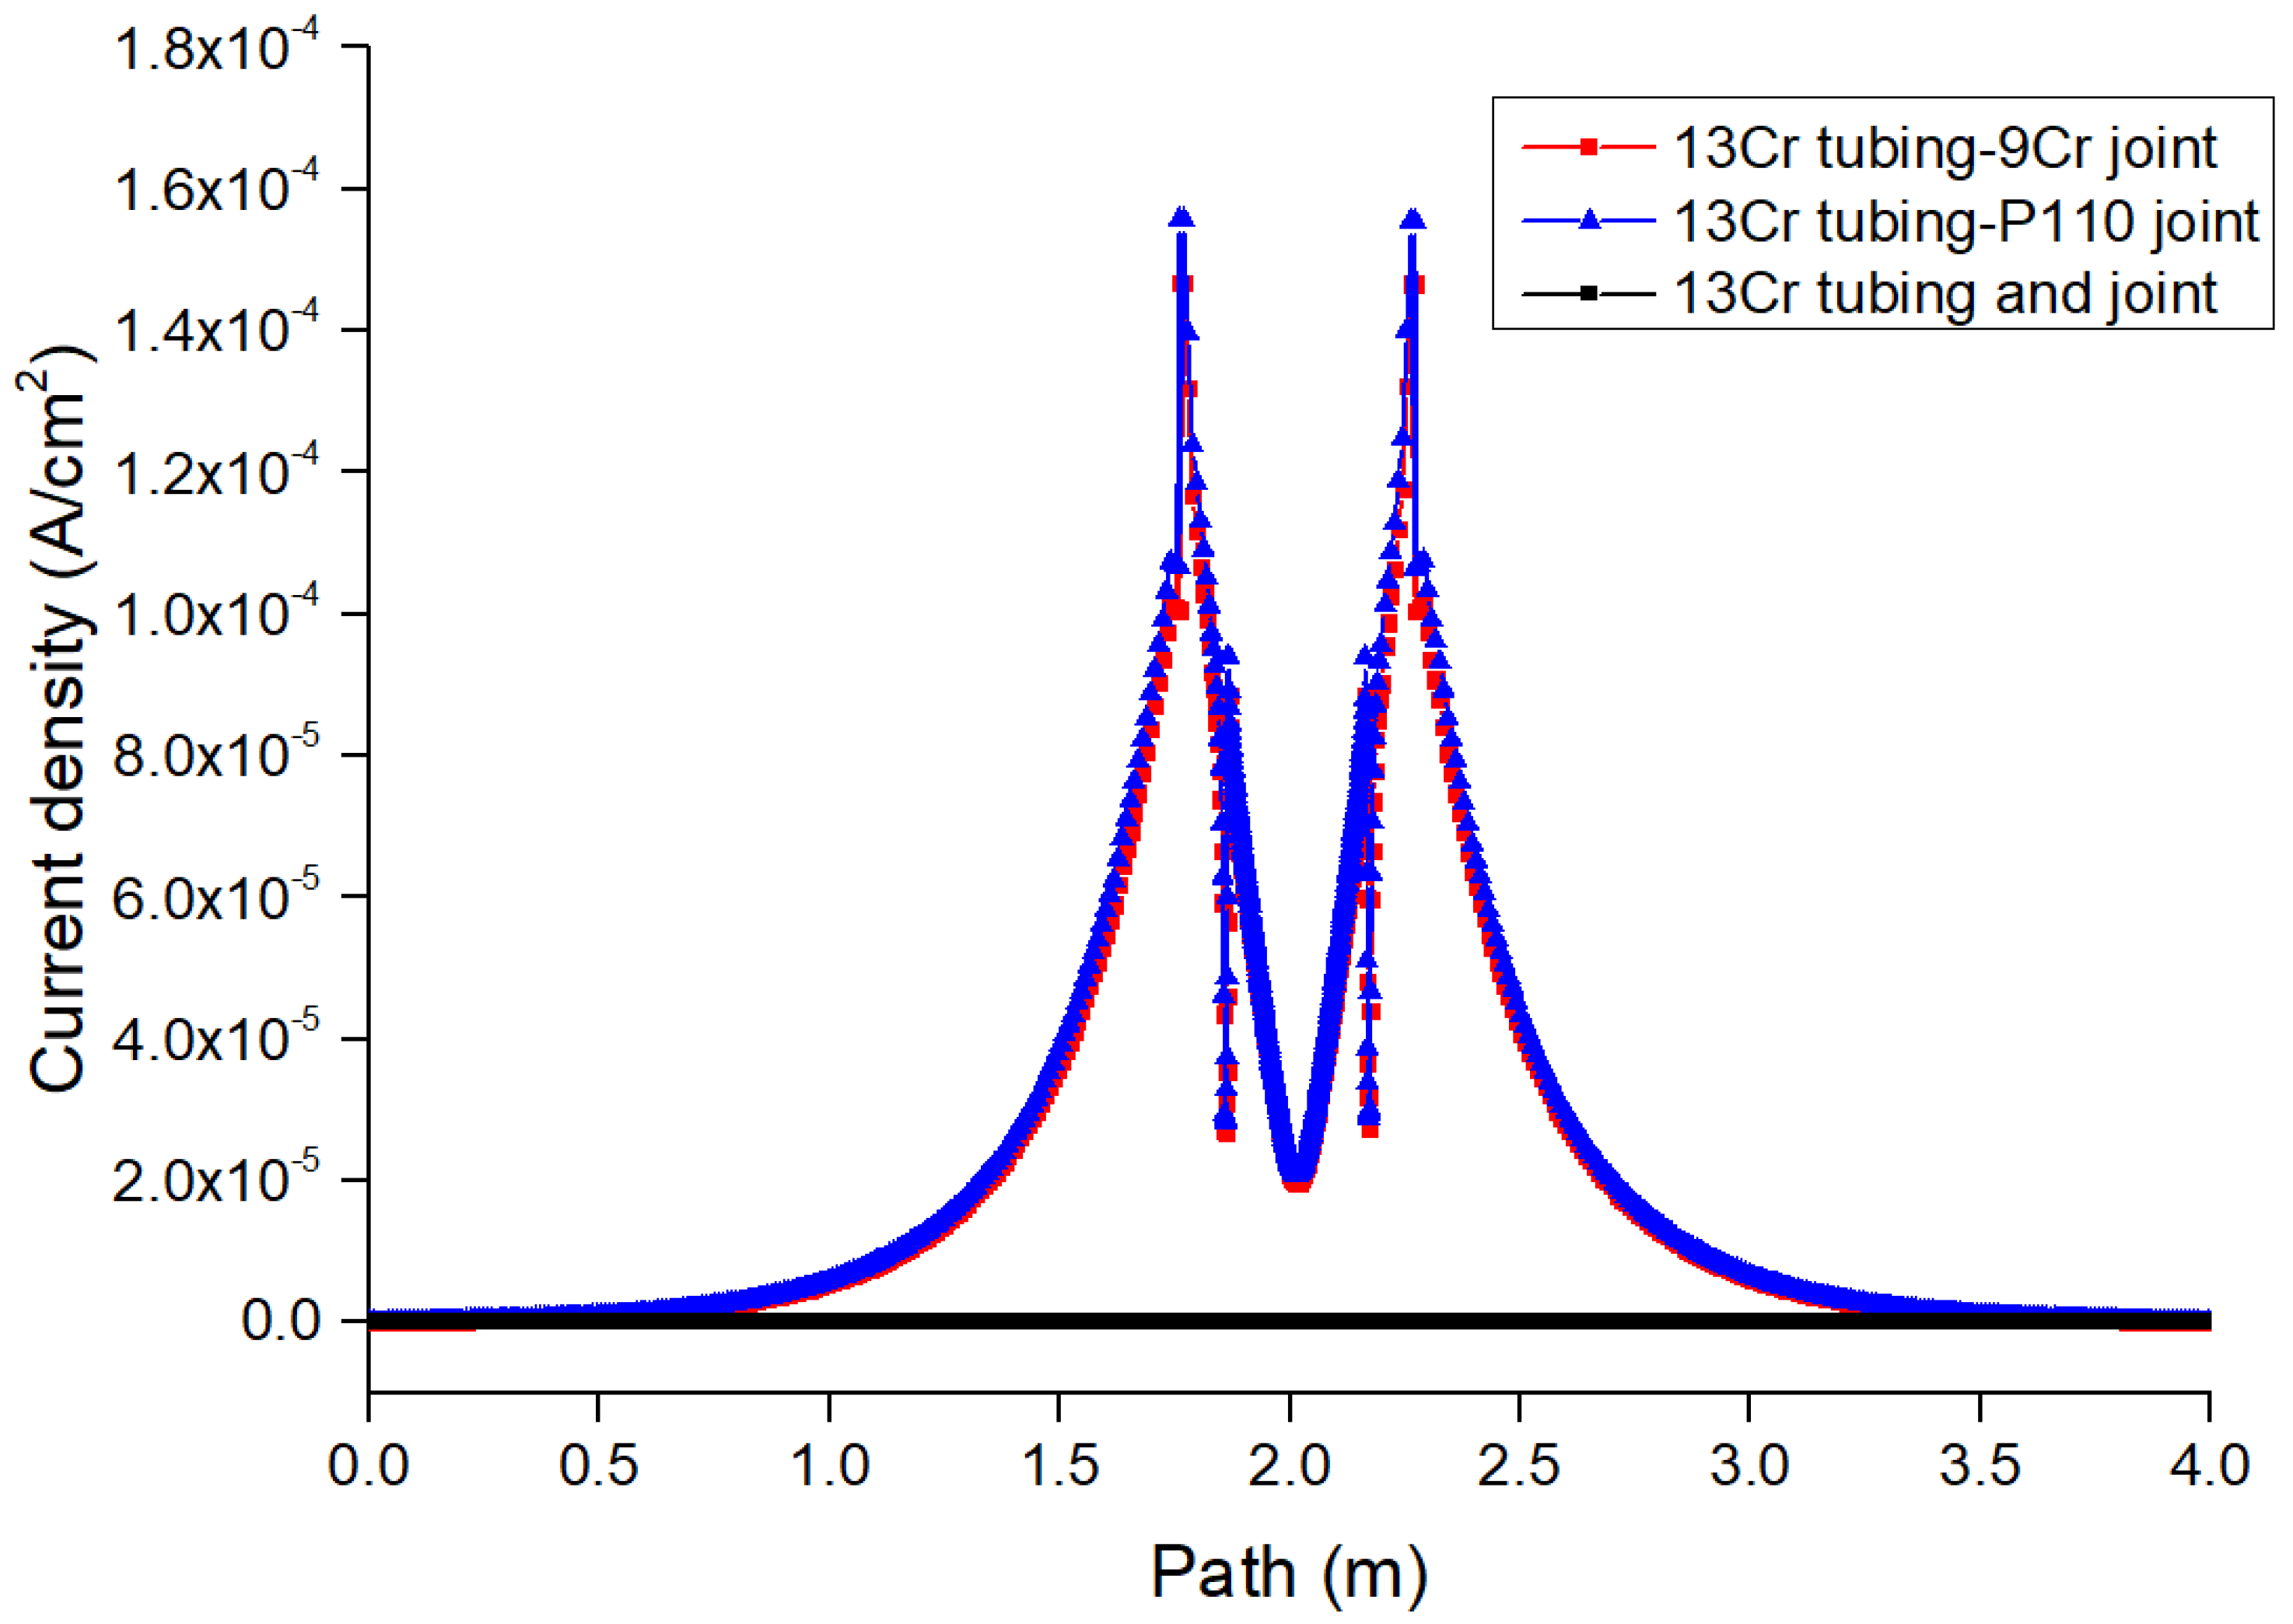
- (4)
- When both the pipe body and joint materials are 13Cr, the current density is 0, and there is no galvanic corrosion. It is noteworthy that the current densities of the combinations of 13Cr tubing with a 9Cr joint and 13Cr tubing with a P110 joint vary dramatically, and the current density of the 13Cr tubing–P110 joint reaches 1.6 × 10⁻⁴ A/cm2, which is higher than the current density of the 13Cr tubing and 9Cr joint.
Author Contributions
Funding
Institutional Review Board Statement
Informed Consent Statement
Data Availability Statement
Conflicts of Interest
References
- Yu, H.; Peng, X.; Lian, Z.; Zhang, Q.; Shi, T.; Wang, J.; Zhao, Z. Experimental and numerical simulation of fatigue corrosion behavior of V150 high-strength drill pipe in air and H2S-dilling mud environment. J. Nat. Gas Sci. Eng. 2022, 98, 104392. [Google Scholar] [CrossRef]
- Askari, M.; Aliofkhazraei, M.; Afroukhteh, S. A comprehensive review on internal corrosion and cracking of oil and gas pipelines. J. Nat. Gas Sci. Eng. 2019, 71, 102971. [Google Scholar] [CrossRef]
- Guo, X.; Liu, J.; Dai, L.; He, Y.; Huang, L.; Wang, G.; Yu, L. Fatigue investigation of tubing string in high-yield curved wells. J. Nat. Gas Sci. Eng. 2021, 85, 103688. [Google Scholar] [CrossRef]
- Yue, X.; Zhang, L.; Sun, C.; Xu, S.; Wang, C.; Lu, M.; Neville, A.; Hua, Y. A thermodynamic and kinetic study of the formation and evolution of corrosion product scales on 13Cr stainless steel in a geothermal environment. Corros. Sci. 2020, 169, 108640. [Google Scholar] [CrossRef]
- Svenningsen, G.; Morland, B.H.; Dugstad, A.; Thomas, B. Stress corrosion cracking testing of 13Cr stainless steel in dense phase CO2 with oxygen. Energy Procedia 2017, 114, 6778–6799. [Google Scholar] [CrossRef]
- Dong, B.; Zeng, D.; Yu, Z.; Cai, L.; Shi, S.; Yu, H.; Zhao, H.; Tian, G. Corrosion mechanism and applicability assessment of N80 and 9Cr steels in CO2 auxiliary steam drive. J. Mater. Eng. Perform. 2019, 28, 1030–1039. [Google Scholar] [CrossRef]
- Zeng, D.; Dong, B.; Zhang, S.; Yi, Y.; Huang, Z.; Tian, G.; Yu, H.; Sun, Y. Annular corrosion risk analysis of gas injection in CO2 flooding and development of oil-based annulus protection fluid. J. Pet. Sci. Eng. 2022, 208, 109526. [Google Scholar] [CrossRef]
- Liu, W.; Shi, T.; Li, S.; Lu, Q.; Zhang, Z.; Feng, S.; Ming, C.; Wu, K. Failure analysis of a fracture tubing used in the formate annulus protection fluid. Eng. Fail. Anal. 2019, 95, 248–262. [Google Scholar] [CrossRef]
- Ostapiuk, M.; Taryba, M.G.; Calado, L.M.; Bieniaś, J.; Montemor, M.F. A study on the galvanic corrosion of a sol-gel coated PEO Mg-CFRP couple. Corros. Sci. 2021, 186, 109470. [Google Scholar] [CrossRef]
- Kosaba, T.; Muto, I.; Sugawara, Y. Effect of anodizing on galvanic corrosion resistance of Al coupled to Fe or type 430 stainless steel in diluted synthetic seawater. Corros. Sci. 2021, 179, 109145. [Google Scholar] [CrossRef]
- Li, Y.; Wang, Z.; Guo, X.P.; Zhang, G.A. Galvanic corrosion between N80 carbon steel and 13Cr stainless steel under supercritical CO2 conditions. Corros. Sci. 2019, 147, 260–272. [Google Scholar] [CrossRef]
- Yao, X.; Tian, W.; Xie, F.; Chen, J. Study on Galvanic Corrosion Behaviors of Super 13Cr and P110 Steel Couples in NaCl Solution. Mater. Rev. 2017, 31, 166–169. [Google Scholar]
- Wang, Z.; Li, Y.; Zhang, G. Inhibitive effects of inhibitors on the galvanic corrosion between N80 carbon steel and 13Cr stainless steel under dynamic supercritical CO2 conditions. Corros. Sci. 2019, 146, 121–133. [Google Scholar] [CrossRef]
- Zhu, G.Y.; Li, Y.Y.; Hou, B.S.; Zhang, Q.H.; Zhang, G.A. Corrosion behavior of 13Cr stainless steel under stress and crevice in high pressure CO2/O2 environment. J. Mater. Sci. Technol. 2021, 88, 79–89. [Google Scholar] [CrossRef]
- Hu, S.; Liu, R.; Liu, L.; Cui, Y.; Wang, F. Influence of temperature and hydrostatic pressure on the galvanic corrosion between 90/10 Cu–Ni and AISI 316L stainless steel. J. Mater. Res. Technol. 2021, 13, 1402–1415. [Google Scholar] [CrossRef]
- Wang, P.; Cai, J.; Cheng, X.; Ma, L.; Li, X. Inhibition of galvanic corrosion between crystallographic orientations in low alloy steel by grain ultra-refinement. Mater. Today Commun. 2022, 31, 103742. [Google Scholar] [CrossRef]
- Anaman, S.; Zhang, S.; Lee, J.; Cho, H.H.; Hong, S.T. A comprehensive assessment of the galvanic corrosion behavior of an electrically assisted pressure joint of dissimilar stainless steel alloys under uniaxial tensile stress. J. Mater. Res. Technol. 2022, 19, 3110–3129. [Google Scholar] [CrossRef]
- Yue, X.; Zhao, M.; Zhang, L.; Zhang, H.; Li, D.; Lu, M. Correlation between electrochemical properties and stress corrosion cracking of super 13Cr under an HTHP CO2 environment. RSC Adv. 2018, 8, 24679–24689. [Google Scholar] [CrossRef]
- Xia, D.H.; Deng, C.M.; Macdonald, D.; Jamali, S.; Mills, D.; Luo, J.L.; Strebl, M.G.; Amiri, M.; Jin, W.; Song, S.; et al. Electrochemical measurements used for assessment of corrosion and protection of metallic materials in the field: A critical review. J. Mater. Sci. Technol. 2021, 112, 151–183. [Google Scholar] [CrossRef]
- Zhong, X.; Lu, W.; Yang, H.; Liu, M.; Zhang, Y.; Liu, H.; Hu, J.; Zhang, Z.; Zeng, D. Oxygen corrosion of N80 steel under laboratory conditions simulating high pressure air injection: Analysis of corrosion products. J. Pet. Sci. Eng. 2019, 172, 162–170. [Google Scholar] [CrossRef]
- Raupach, M. Investigations on the influence of oxygen on corrosion of steel in concrete—Part I. Mater. Struct. 1996, 29, 174–184. [Google Scholar] [CrossRef]
- Yin, L.; Jin, Y.; Leygraf, C.; Birbilis, N.; Pan, J. Numerical simulation of micro-galvanic corrosion in Al alloys: Effect of geometric factors. J. Electrochem. Soc. 2017, 164, C75. [Google Scholar] [CrossRef]
- Radouani, R.; Echcharqy, Y.; Essahli, M. Numerical simulation of galvanic corrosion between carbon steel and low alloy steel in a bolted joint. Int. J. Corros. 2017, 2017, 6174904. [Google Scholar] [CrossRef]
- Thébault, F.; Vuillemin, B.; Oltra, R.; Allely, C.; Ogle, K. Reliability of numerical models for simulating galvanic corrosion processes. Electrochim. Acta 2012, 82, 349–355. [Google Scholar] [CrossRef]
- Burduhos-Nergis, D.; Burduhos-Nergis, D.; Bejinariu, C. Galvanic corrosion behaviour of different types of coatings used in safety systems manufacturing. Coatings 2021, 11, 1542. [Google Scholar] [CrossRef]


| Element | C | Si | Mn | P | S | Ni | Cr | Cu | Mo | V | Fe |
|---|---|---|---|---|---|---|---|---|---|---|---|
| P110 | 0.26 | 0.24 | 1.53 | 0.022 | 0.003 | 0.02 | 0.05 | 0.07 | 0.01 | 0.02 | Balance. |
| 9Cr | 0.11 | 0.28 | 0.51 | 0.015 | 0.004 | 0.15 | 8.68 | 0.02 | 0.96 | 0.21 | Balance. |
| 3Cr | 0.16 | 0.25 | 0.57 | 0.012 | 0.004 | 0.04 | 2.92 | 0.06 | 0.33 | 0.01 | Balance. |
| Parameter | Value |
|---|---|
| Saturation concentration (wt%) | 49 |
| Density (g/cm3) | 1.45 |
| Funnel viscosity (s) | 30 |
| pH | 9.8 |
| Material | Length (mm) | Wide (mm) | High (mm) | Before Corrosion (g) | After Corrosion (g) | Testing Time (h) | Corrosion Rate (mm/y) | Average (mm/y) |
|---|---|---|---|---|---|---|---|---|
| P110 | 39.69 | 10.00 | 3.02 | 8.4971 | 8.3922 | 168 | 0.6370 | 0.6364 |
| 39.78 | 9.76 | 2.99 | 8.2001 | 8.1043 | 168 | 0.5932 | ||
| 39.61 | 9.93 | 2.94 | 8.3244 | 8.2142 | 168 | 0.6791 | ||
| 9Cr | 39.76 | 9.95 | 2.96 | 8.1980 | 8.1904 | 168 | 0.0465 | 0.0440 |
| 39.69 | 9.92 | 2.92 | 8.0326 | 8.0255 | 168 | 0.0438 | ||
| 39.76 | 9.95 | 2.90 | 8.0023 | 7.9955 | 168 | 0.0418 | ||
| 13Cr | 39.66 | 9.95 | 2.98 | 8.3541 | 8.3533 | 168 | 0.0050 | 0.0040 |
| 39.72 | 10.02 | 2.97 | 8.3950 | 8.3944 | 168 | 0.0037 | ||
| 39.73 | 9.81 | 2.98 | 8.1452 | 8.1447 | 168 | 0.0032 |
| Area Ratio | OCP Eocp (V) | PD (mV) | Current Density (10−6 A/cm2) | Corrosion Rate (mm/y) | |
|---|---|---|---|---|---|
| 9Cr | 13Cr | ||||
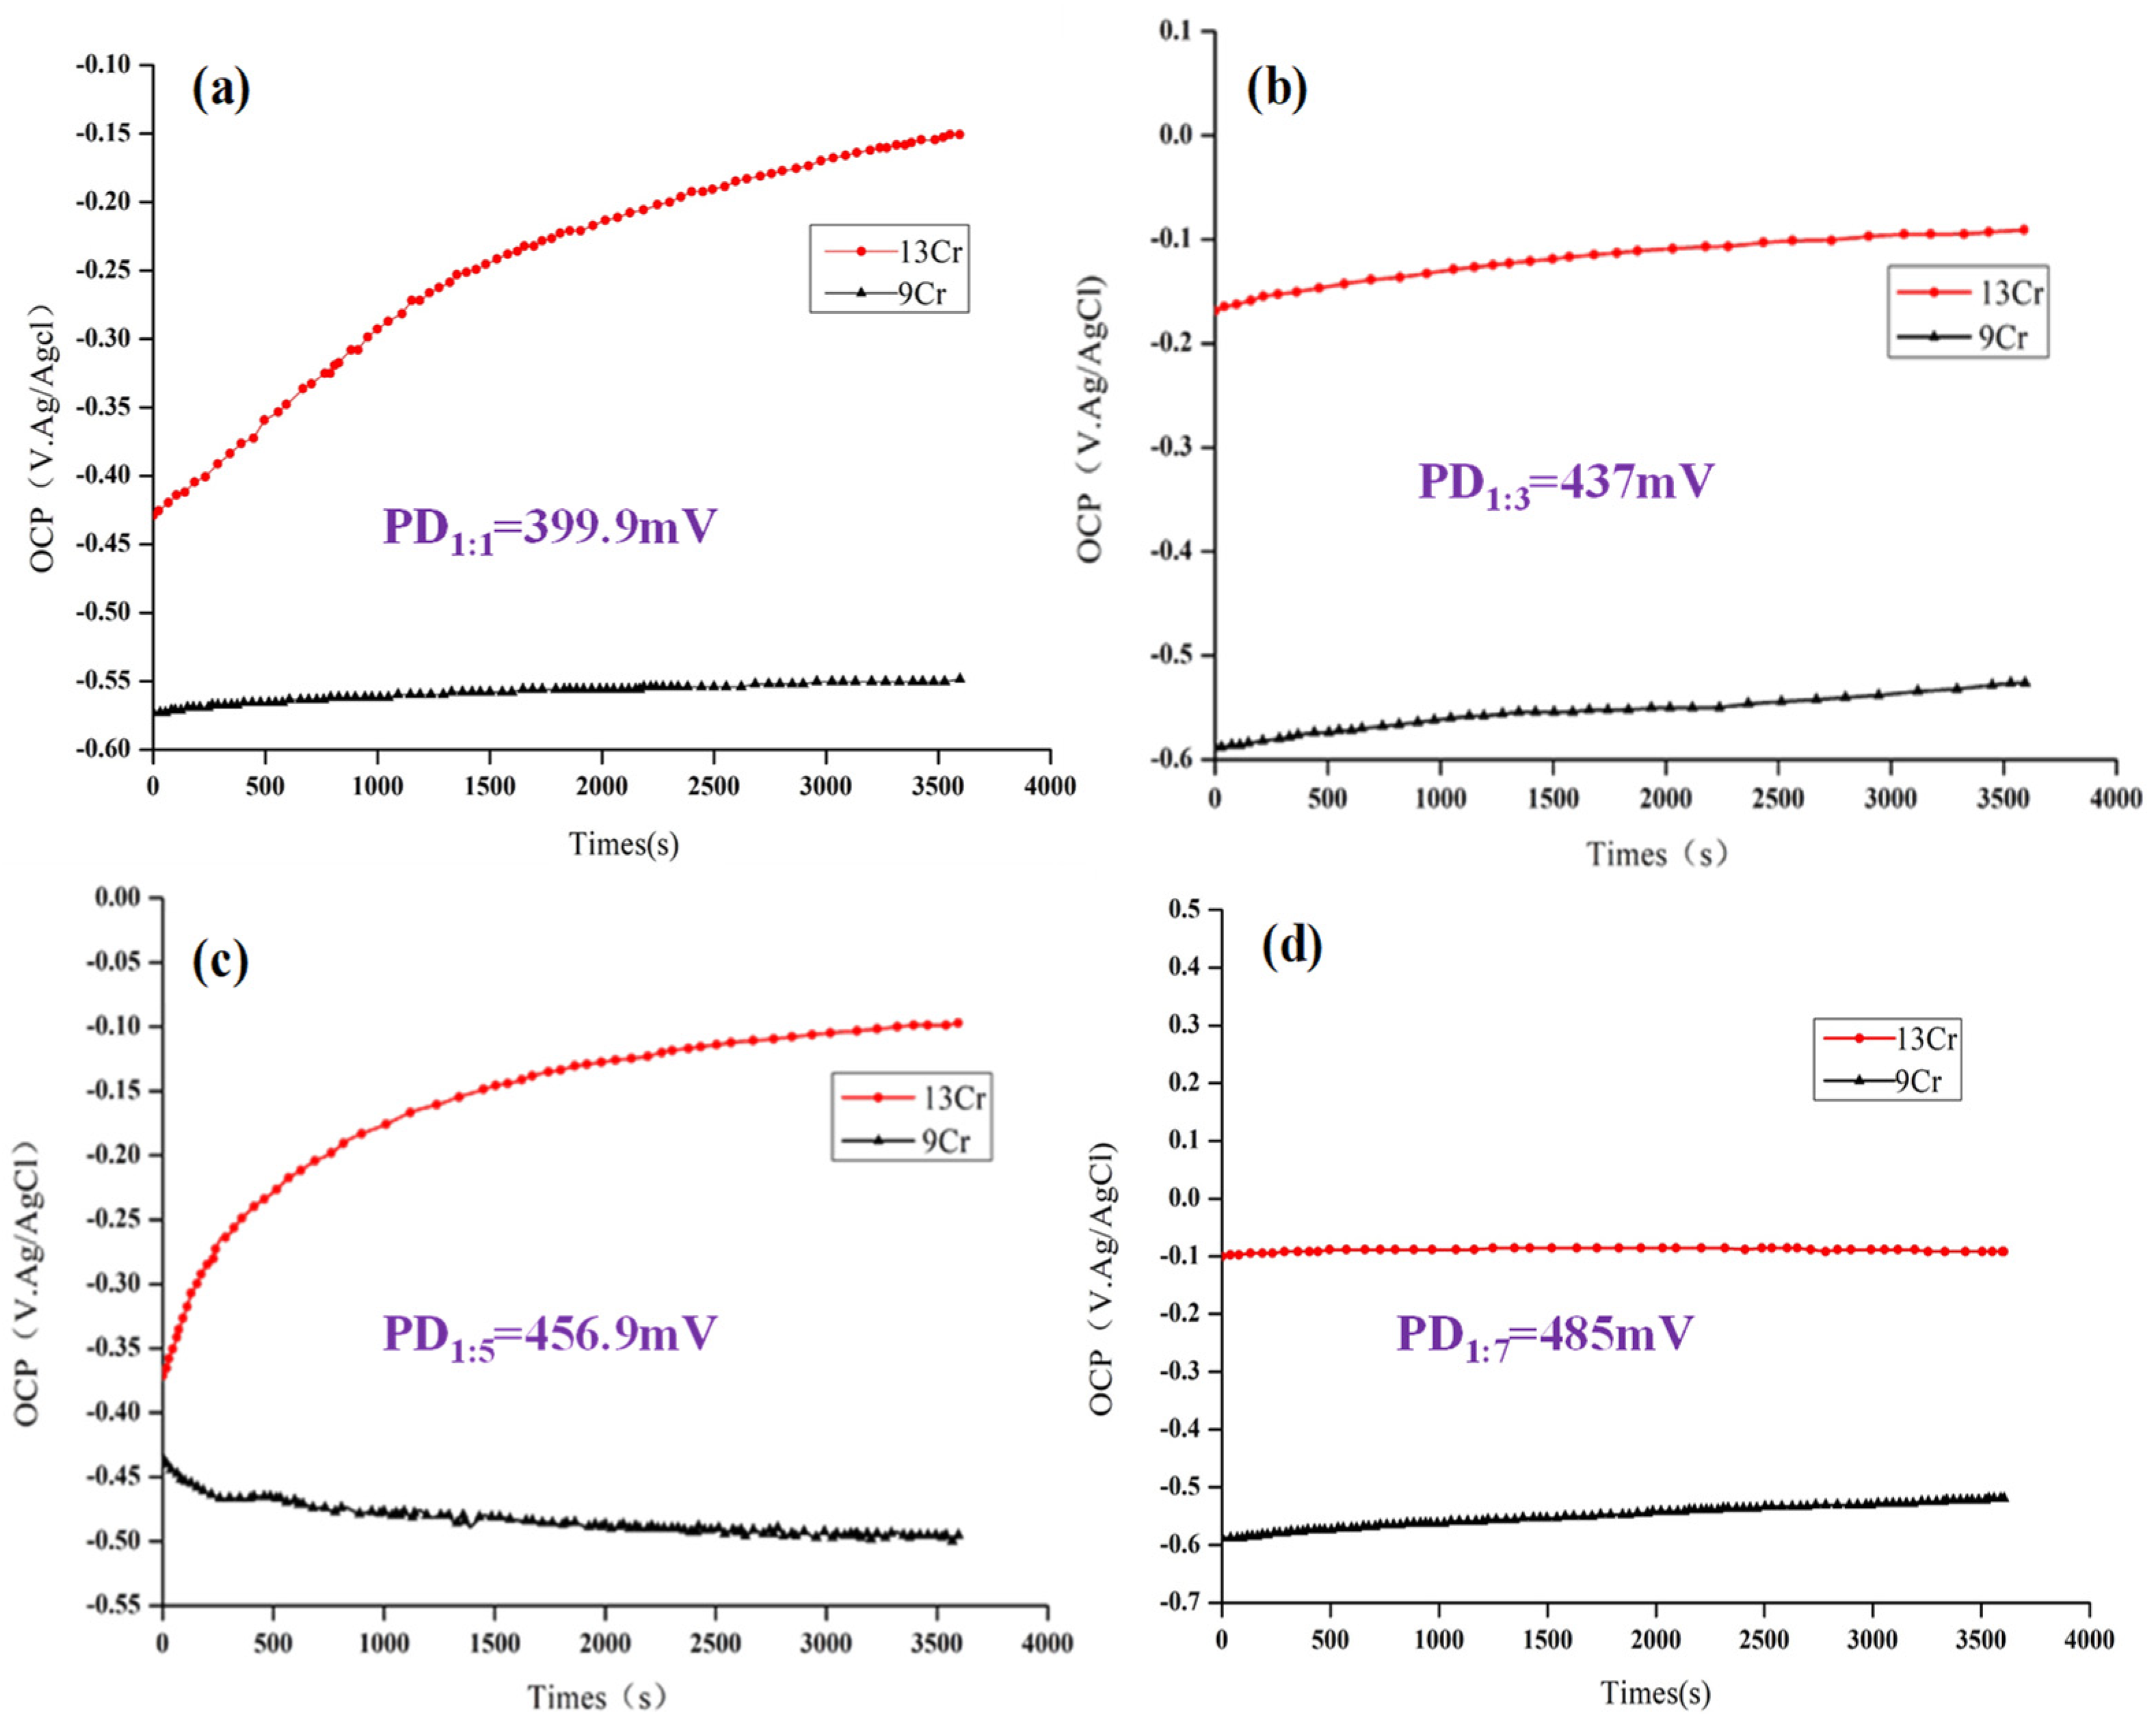
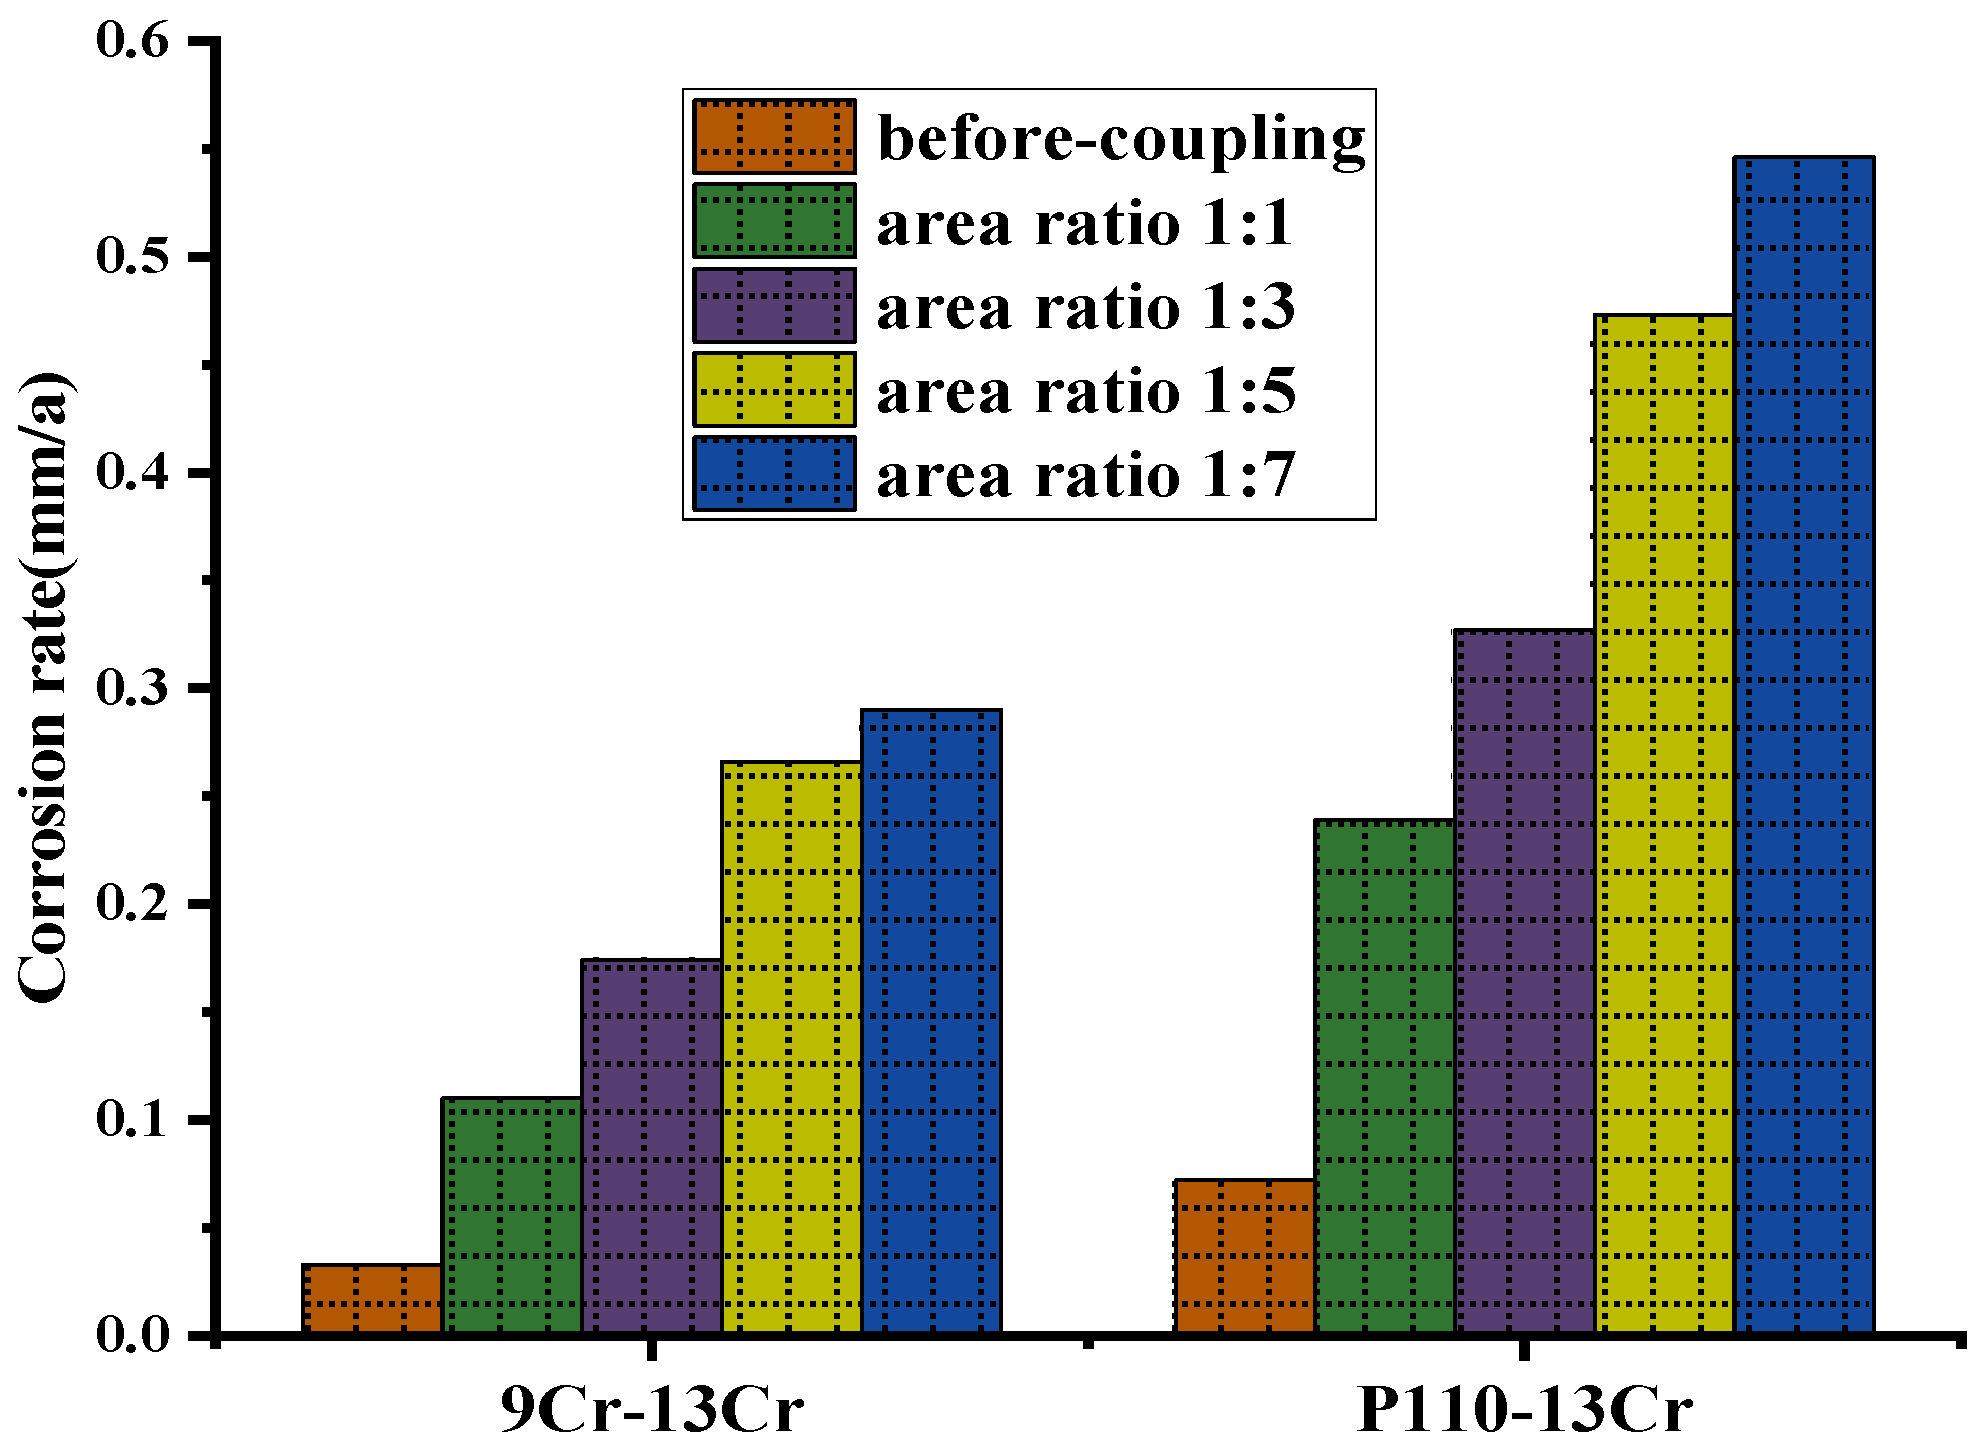
| 1:1 | −0.551 | −0.1511 | 399 | 9.8 | 0.11 |
| 1:3 | −0.559 | −0.122 | 437 | 15 | 0.174 |
| 1:5 | −0.562 | −0.1051 | 456 | 22.8 | 0.266 |
| 1:7 | −0.583 | −0.098 | 485 | 25 | 0.290 |
Disclaimer/Publisher’s Note: The statements, opinions and data contained in all publications are solely those of the individual author(s) and contributor(s) and not of MDPI and/or the editor(s). MDPI and/or the editor(s) disclaim responsibility for any injury to people or property resulting from any ideas, methods, instructions or products referred to in the content. |
© 2023 by the authors. Licensee MDPI, Basel, Switzerland. This article is an open access article distributed under the terms and conditions of the Creative Commons Attribution (CC BY) license (https://creativecommons.org/licenses/by/4.0/).
Share and Cite
Zang, C.; Jiang, H.; Lu, Z.; Peng, X.; Wang, J.; Lian, Z. Study on the Galvanic Corrosion between 13Cr Alloy Tubing and Downhole Tools of 9Cr and P110: Experimental Investigation and Numerical Simulation. Coatings 2023, 13, 861. https://doi.org/10.3390/coatings13050861
Zang C, Jiang H, Lu Z, Peng X, Wang J, Lian Z. Study on the Galvanic Corrosion between 13Cr Alloy Tubing and Downhole Tools of 9Cr and P110: Experimental Investigation and Numerical Simulation. Coatings. 2023; 13(5):861. https://doi.org/10.3390/coatings13050861
Chicago/Turabian StyleZang, Chuanzhen, Hanqiao Jiang, Zongyu Lu, Xianbo Peng, Jian Wang, and Zhanghua Lian. 2023. "Study on the Galvanic Corrosion between 13Cr Alloy Tubing and Downhole Tools of 9Cr and P110: Experimental Investigation and Numerical Simulation" Coatings 13, no. 5: 861. https://doi.org/10.3390/coatings13050861