Article

Evaluation of Galvanic and Crevice Corrosion of Watch Case Middle (1.4435 Steel) and Bottom (Panacea® Steel) Assembly Supposed to Be in Prolonged Contact with the Skin

1
Scientific Independent Consultant Biomaterials and Medical Devices, 2074 Marin-Neuchâtel, Switzerland
2
Faculty of Materials Science and Engineering, University Politehnica of Bucharest, 313 Spl. Independentei, RO60042 Bucharest, Romania
3
AMPERE, La Bruyère Engineering Department, 013000 Brégnier-Cordon, France
*
Author to whom correspondence should be addressed.
Coatings 2023, 13(5), 943; https://doi.org/10.3390/coatings13050943
Submission received: 14 April 2023 / Revised: 7 May 2023 / Accepted: 14 May 2023 / Published: 17 May 2023
(This article belongs to the Special Issue Anti-corrosion Coatings of Metals and Alloys – New Perspectives)

Abstract

:
Today, laws protecting the population at the global level aim to minimize the induction risk of allergies to type IV contact dermatitis. In the European population, the prevalence of nickel allergy is at 10%–15% of adult females and 1%–3% of adult males. A total of 30% of nickel-sensitive people in the general population develop hand eczema. This study concerns the possibility of assembling a bottom of nickel-free austenitic steel (Panacea®) in a watch case middle made of a grade of austenitic steels, steel 316L (DIN 1.44359), to avoid the risks of Ni release and to develop a galvanic pile between these two dissimilar materials. Two types of methods were used: direct measurements and prediction techniques (mixed potentials theory). For the degradation of thbottom-middle watch assembly, Nielsen–Tuccillo tests were performed, and Ni release measurements according to EN 1811 completed the study. All direct electrochemical investigations and galvanic current prediction measurements show low current values of 40–400 nA. Measurements of nickel release of Panacea® and 316L reveal small quantities of nickel, much lower than the 0.5 µg/cm2 per week that the European legislation enforces. The nickel-free steel Panacea® in the work hardening conditions 280, 427, and 510 HV0.1s were also studied. The cation extractions reveal the large quantities released from Cr, Mo, Mn, and Fe, so there is a risk of toxicity in contact with the skin.

1. Introduction

Today’s worldwide population protection legislation aims to diminish the risk of inducing contact allergies (primary prevention), which also ensures that clinical illness is not induced. When this does not protect human health, it is imperative to limit the occurrence of allergic diseases (secondary prevention). In terms of metal-induced allergies, just Ni and Cr have been subjected to legal restrictions, particularly in the European Union, USA, Canada, Latin America, and Asia (China, Japan, Korea, etc.). The aim of the legislation is to considerably limit the expression of allergic contact dermatitis (ACD) for the two metal allergens, nickel and chromium. Current data show a positive impact of regulations. Unfortunately, the overall picture of the results is complicated, and even confused, by a bad application, particularly for nickel and chromium salts [1].
Allergies induced by Ni are the most widespread of all contact allergies. In the European population, the prevalence of nickel allergy is very high [2,3,4,5]. A higher prevalence due to body piercing was observed for the teenagers and young adults population. In Europe, for objects containing nickel designed to be in continual contact with the human body, Directive 94/27/EC imposed a strict regulation against its use when the rate of nickel release exceeds 0.5 µg/cm2 per week. The subsequent Directive 2004/96/EC “Piercing in the Human Body” indicates that the Ni release limit is 0.2 µg/cm2 per week [2,4,5,6,7].
Usually, the nickel-based allergy is not inherited but acquired by some people who are in direct and prolonged skin contact with items releasing high levels of nickel. Once a person is allergic to nickel, it takes less nickel release to the skin to cause ACD than the amount initially needed to make the person nickel-allergic. Sources of nickel exposure include different types of jewelry, watches and watchbands, belt buckles, eyeglasses, metal tools, and so on. The number of watches manufactured in 2018 worldwide was estimated at 1.2 billion pieces [3]. This implies a quantity of Ni-Cr stainless steels of about 104 thousand tons/year.
On the other hand, it cannot be neglected that the risk of contact allergies associated with metals is very important if the properties of steels do not meet the manufacturers’ requirements, which has the toxicological responsibility for their items/products; in other words, watches. Still, this needs an accurate assessment since no agreement is tolerable in terms of mechanical properties, corrosion resistance, or any other possible unwanted consequences due to contact with skin.
In our laboratory, a considerable number of cation extraction assays in conformity with EN 1811 standard [8] were achieved on the austenitic stainless steels manufactured by different steelmakers from the EU, Japan, and the USA. In conclusion, it should be noted that though the grade of steel is in conformity with the DIN or AISI standards classification, its performance is not similar from one producer to another, because of the industrial parameters, namely, the production process, casting volume, additions, deoxidizers, etc.
The different manufacturing processes and operations of austenitic steel definitely have an impact on the quantities of nickel released. For example, an important variation in the quantities of Ni released from steels [9,10] was associated with the chemical composition, which depends majorly on the manufacturer. The nickel ions release can be controlled through heat treatments. Even though the surface state has little influence, the hardening process is one of the most influential treatments, impacting not only the corrosion resistance (decreasing it) but also the nickel release quantities. The latter one is also strongly influenced by the inclusion state and the secondary phases of the steel structure. This is the reason why steelmakers are obligated to respect the strict specifications of subcontractors. The control of the manufacturing parameters to respect the good quality of the stainless steel used in watch cases is very difficult, even more so in gold-steel assemblies, which are extremely complicated assemblies due to the formation of galvanic couples.
Nowadays, the tendency is to replace Ni-Cr austenitic steels with Ni-free austenitic steels (Cr-Mn-N austenitic stainless steels) [11,12,13,14,15,16,17]. These steels are characterized by an austenitic structure, without ferrite and phases (sigma) or precipitations, and with a high degree of purity obtained by remelting processes. They have only nickel traces, so there is no risk of inducing allergies to nickel. From the mechanical point of view, they reveal excellent ductility and a high work hardening potential, namely a high mechanical strength which can already be achieved at low degrees of work hardening. They can be polished to a mirror-polished degree, do not reveal magnetic properties, and have good biocompatibility. In general, nickel-free austenitic stainless steels comprise, in weight %, the values shown in Table 1.
To compare the corrosion resistance of austenitic steels, particularly those without nickel, the MARC index is usually used (Measure of Alloying for Resistance to Corrosion). Thus, the higher the MARC index, the more corrosion-resistant the alloy is. The MARC index was defined by Speidel [18] and represents the sum of the component’s concentrations of the concerned austenitic stainless steel, as follows: MARC = Cr(%) + 3.3Mo(%) + 20C(%) + 20N(%) − 0.5Mn(%) − 0.25Ni(%). For the steels used in this study, the MARC is 2.5 for DIN 1.4435 (AISI 316L) and 4.3 for steel DIN 1.4452 (PANACEA®).
The quantitative ratings and markings of the overall corrosion resistance, referred to as pitting resistance equivalent number (PREN) for these stainless steels, are as follows: 25.8 for 1.4435 and 31.2 for 1.4452.
Many nickel-free steel grades have thus emerged, especially for medical applications [19,20,21,22,23]. Several patents (EP 1786 941 B1 [24], EP 0875591 A1 [25], CN113088652A [26], US 2013/0149188 A1 [27], and EP3147378A1 [28]) covering such alloys have been filed in the last 15 years.
In order to develop austenitic steel with proper properties in terms of prolonged contact with the human body, the lack of nickel must be fulfilled by other elements which favor the austenitic structure, of which the most common are N, C, Mn, Cu, and Al. In the following, the influence of each element will briefly be presented. Manganese has a face-centered cubic structure identical to that of austenite and therefore is a possible substitute for nickel. By analogy to the iron–nickel phase diagram, the iron–manganese phase diagram highlights a wide austenitic domain γ, which allows its use for very wide ranges of temperature. Manganese decreases corrosion resistance, and it is also responsible for the steel’s hardness increase. Combined with iron, it forms a mixed carbide (Fe,Mn)3C. Manganese is detrimental to the machinability and forgeability properties of the resulting steels. Copper is an element that will stabilize austenite. The copper-rich precipitates formed during aging will improve the resistance of austenitic steel. It is shown that elements such as manganese or carbon are absent inside these precipitates. When 4 to 5% copper is added to a cast iron alloyed with 7 to 11% manganese and 1 to 8% nickel, a fully austenitic matrix that contains few carbides is obtained. Exceeding 5% copper (the solubility limit), the free copper is formed. Copper also contributes to significantly increasing the corrosion resistance of nickel-free austenitic steels. However, the addition of copper must be controlled because its solubility is limited in cast iron.
Nitrogen plays an important role in steels in terms of stabilizing austenite, increasing its mechanical characteristics, and improving corrosion resistance. If nitrogen is introduced into the liquid pig iron, the solidification of nickel-free austenitic stainless steels is, therefore, particularly critical. Especially depending on the alloy composition and the partial pressure of nitrogen and ferrite amount, there is a strong chance of generating porosity in the solidified alloy. Since the solubility of nitrogen in ferrite is much lower than in austenite, nitrogen can be released into the liquid in a gaseous form, thus creating unwanted porosity [28,29,30]. Imposing an overpressure of nitrogen during casting or remelting can be implemented to overcome these two main possibilities, for example, by using techniques known under the names Pressurized Induction Melting (PIM) or Pressure ElectroSlag Remelting (PESR, which is judiciously selecting the composition elements, for example, by increasing the concentrations of C, Mn, and Cu, and/or by reducing the concentrations of Cr and Mo). Thus, a totally austenitic solidification avoiding the release of nitrogen by the formation of ferrite is possible at ambient atmospheric pressure or even lower [28].
The addition of aluminum reduces the “gamma” phase region on the equilibrium diagram, increasing the alpha phase. Between 900 °C and 1400 °C, at below 5% aluminum, there is a small area in which an austenitic matrix can be found. The presence of aluminum in cast iron has a graphitizing effect, which can prevent the formation of carbides and allows manganese to remain in the solid solution. This element gives the material various interesting effects in terms of properties. A low addition of aluminum of 0.5% max in an austenitic GL cast iron grade contributes to improving its machinability.
Molybdenum is found in cast iron in the form of carbides, and its usage at high concentrations in austenitic cast irons has similar effects as those of chromium, for example, in terms of improving corrosion resistance in an acid environment. The presence of a small quantity of molybdenum is essential, because it makes it possible to achieve sufficient resistance to pitting corrosion (salt spray test, ISO 9227 [31]). However, it is necessary to limit the concentration of molybdenum and chromium because these elements amplify the ferritic structure to the detriment of the austenitic one. The hardening effect of solid solution is significant.
Chromium is widely used in steels to improve mechanical properties and corrosion resistance. In cast iron, chromium is used together with other additives, especially for nickel-free steels. The addition of chromium gives an excellent combination of resistance to wear, rupture, and corrosion. Chromium, combined with manganese, will provide good corrosion resistance in the marine environment and also in the atmospheric environment.
In our study, we considered using a watch assembly made of two steel grades. The part that is in contact with the skin is in nickel-free stainless steel, and the middle case part is in 316L series steel. The study is carried out for the evaluation of the corrosion resistance of the constituent parts and the galvanic effects of assembly. The aim is to be able to offer watch manufacturers solutions for the choice of austenitic steel materials without nickel in assemblies with austenitic steels with nickel and reduce the risk of inducing contact allergies to nickel.

2. Materials and Methods
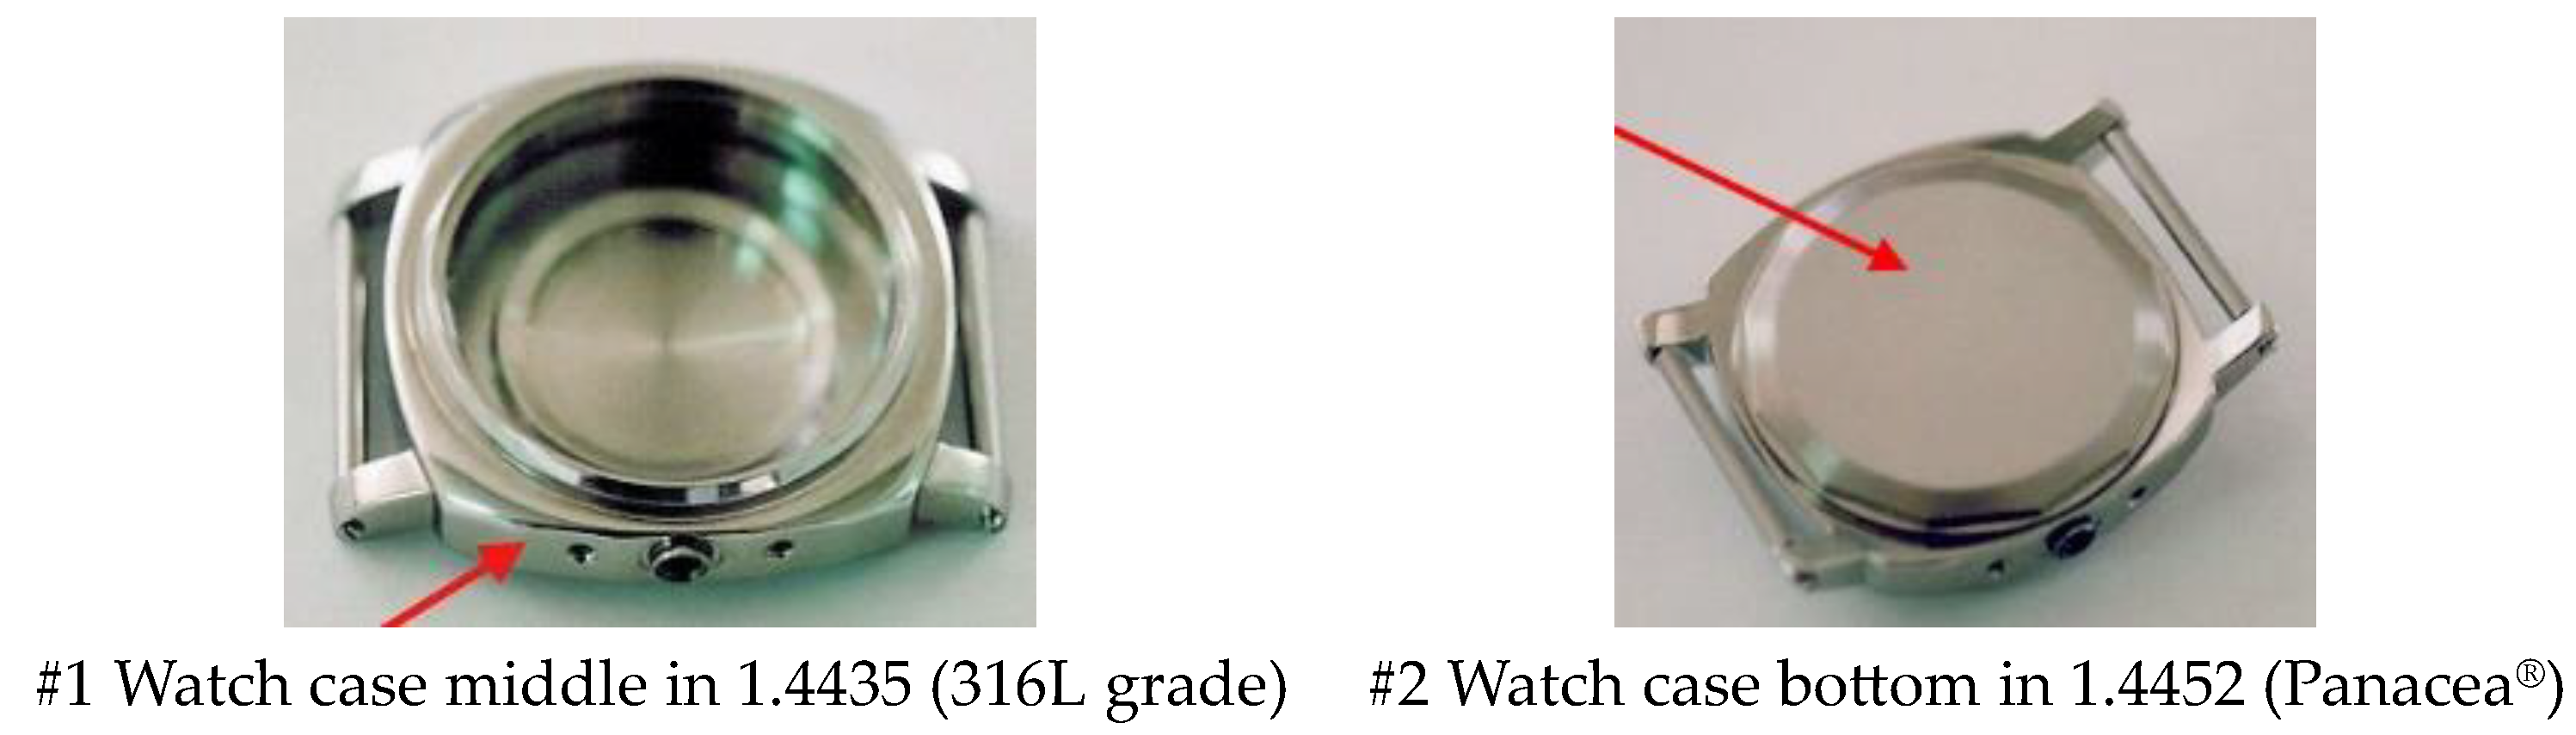
2.1. Materials

A specific DIN 1.4435 grade (316L grade) [32] has been chosen for the manufacture of watch exteriors. Regarding austenitic steel without nickel, Panacea®, developed by the Polytechnic School of Zurich Switzerland (ETHZ), was chosen. It was cast by a German steelmaker, and it can be classified as a DIN 1.4452 grade. Table 2 shows the chemical composition of the austenitic stainless steel samples used in this study.
For this study, three assemblies of watch case middles and bottoms (Panacea® steel) were provided by a watchmaker (Figure 1). It should be mentioned that the authors did not obtain access to the manufacturing process and the treatment that these materials have undergone. On the other hand, sample #3 (P280HV0.1) comes from a steel supplier and had a hardness of 280 (±4) Vickers. Samples #4 (P427HV0.1) and #5 (P510 HV0.1) were work-hardened in our laboratory, and they have hardnesses of 427 (±9) Vickers and 510 (±11) Vickers, respectively. The microhardness tests were carried out by applying a force of 100 gf for a period of 15 s. The measurements were made in triplicates, and their averages were taken into consideration. Table 3 presents the sample codifications.
All samples were prepared on SiC paper of different grits (P300–P2000), followed by polishing with alumina slurry with a particle dimension of 1 μm. All the samples were cleaned with ethanol and acetone, and then dried with fresh air before each experiment.

2.2. Electrochemical Methods

2.2.1. Corrosion Evaluation by Electrochemical Techniques (Generalized Corrosion, Crevice, and Pitting Corrosion)

For these tests, we used the rotating electrode technique. A potentiostatic assembly consisting of three electrodes was used for the electrochemical measurements as follows: the working electrode was a rotating electrode in which the samples were fixed, and a platinum counter-electrode and an SCE (saturated calomel electrode) were used as reference electrodes. The electrochemical measurements were controlled with a modified EG&G Par 273A potentiostat with a noise floor of 1 pA (Figure 2). For generalized corrosion-specific electrochemical evaluation, the tests samples #1 and #2 are in the form of 6 mm discs.
The general corrosion behavior of the alloys was investigated by using several electrochemical methods as follows:
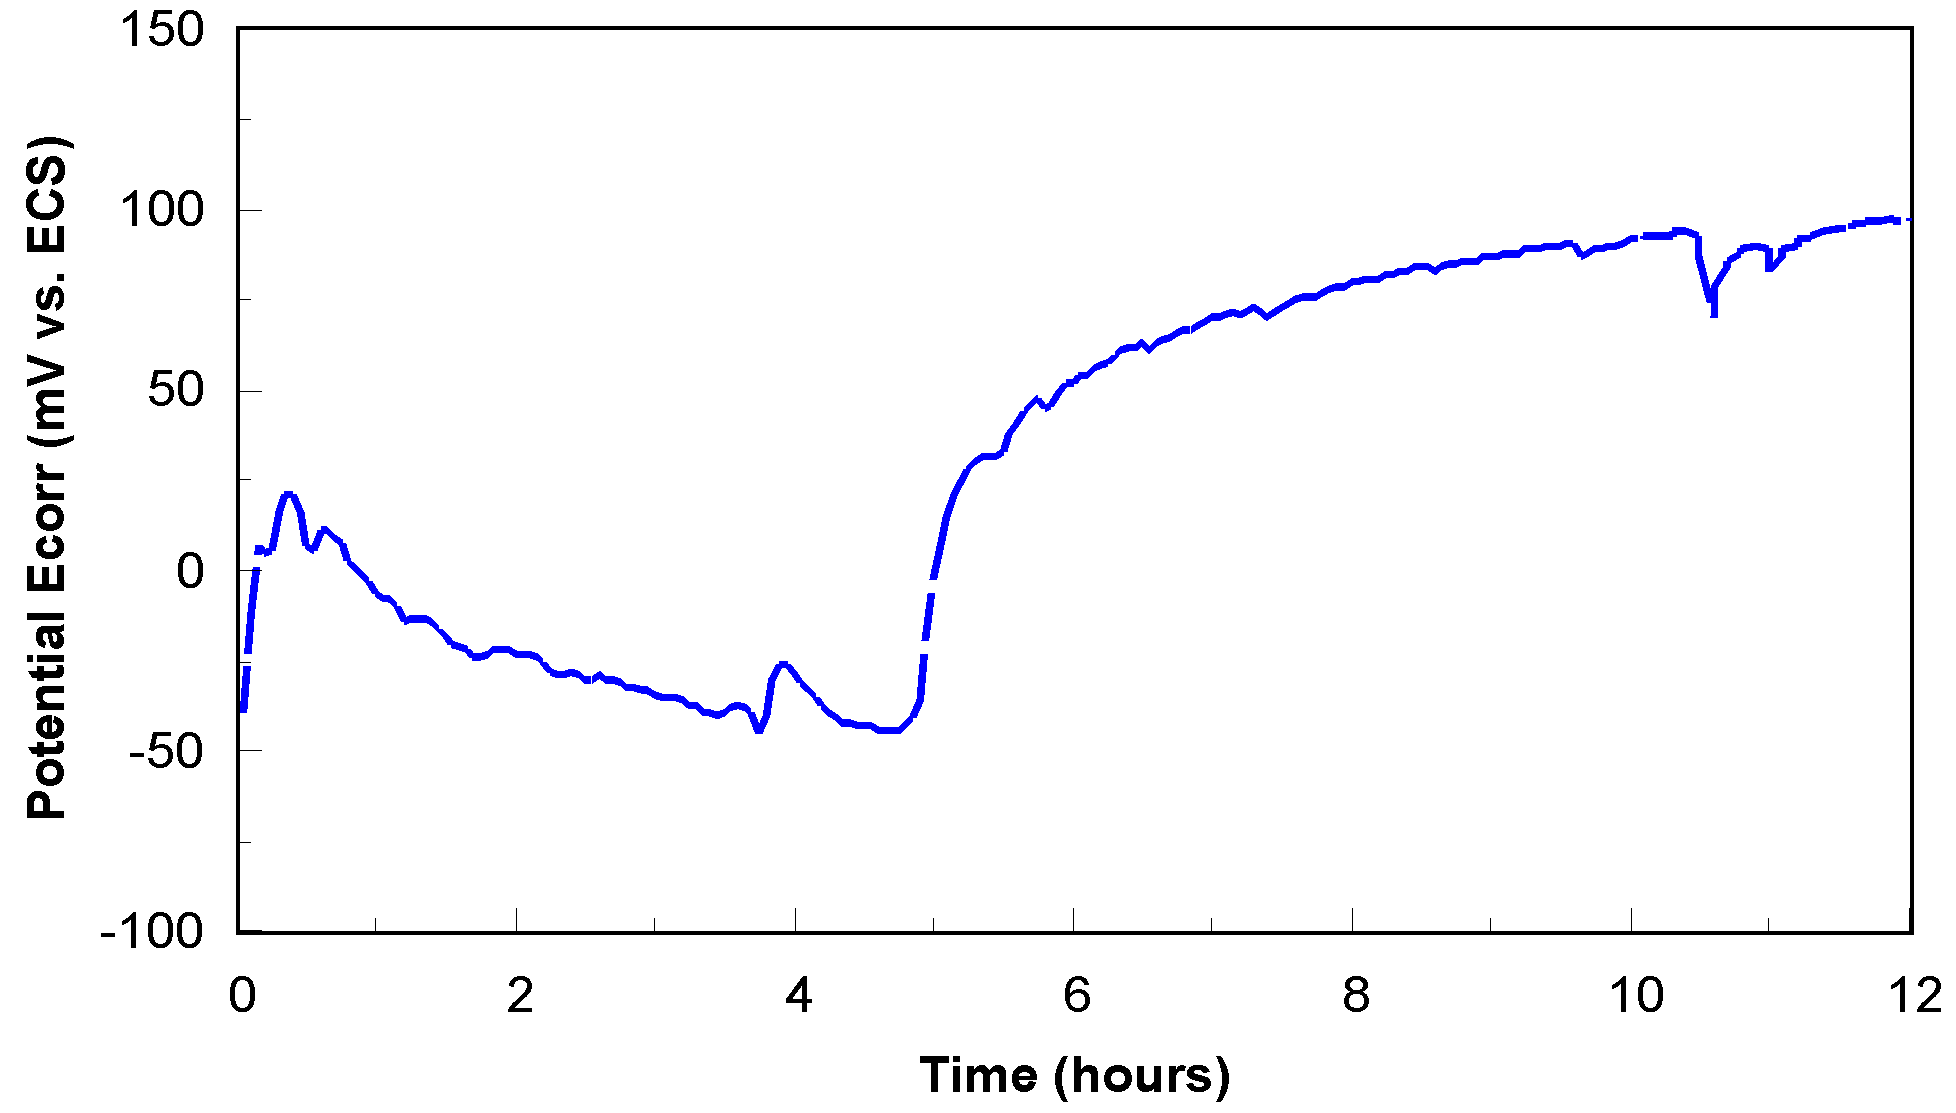
  • Open circuit potential (Eoc) was used to establish the pseudo-stationary conditions, and was recorded during 24 h of immersion in the testing medium;
  • Linear polarization resistance (Rp) was calculated from a polarization scan between ±20 mV and SCE from the Eoc (the domain of Mansfeld) at 0.1 mV/s scanning rate;
  • Tafel extrapolation was used to calculate the anodic (ba) and cathodic (bc) slopes and the corrosion current density, and icorr was recorded between ±150 mV/SCE close to the Eoc with the same scanning rate;
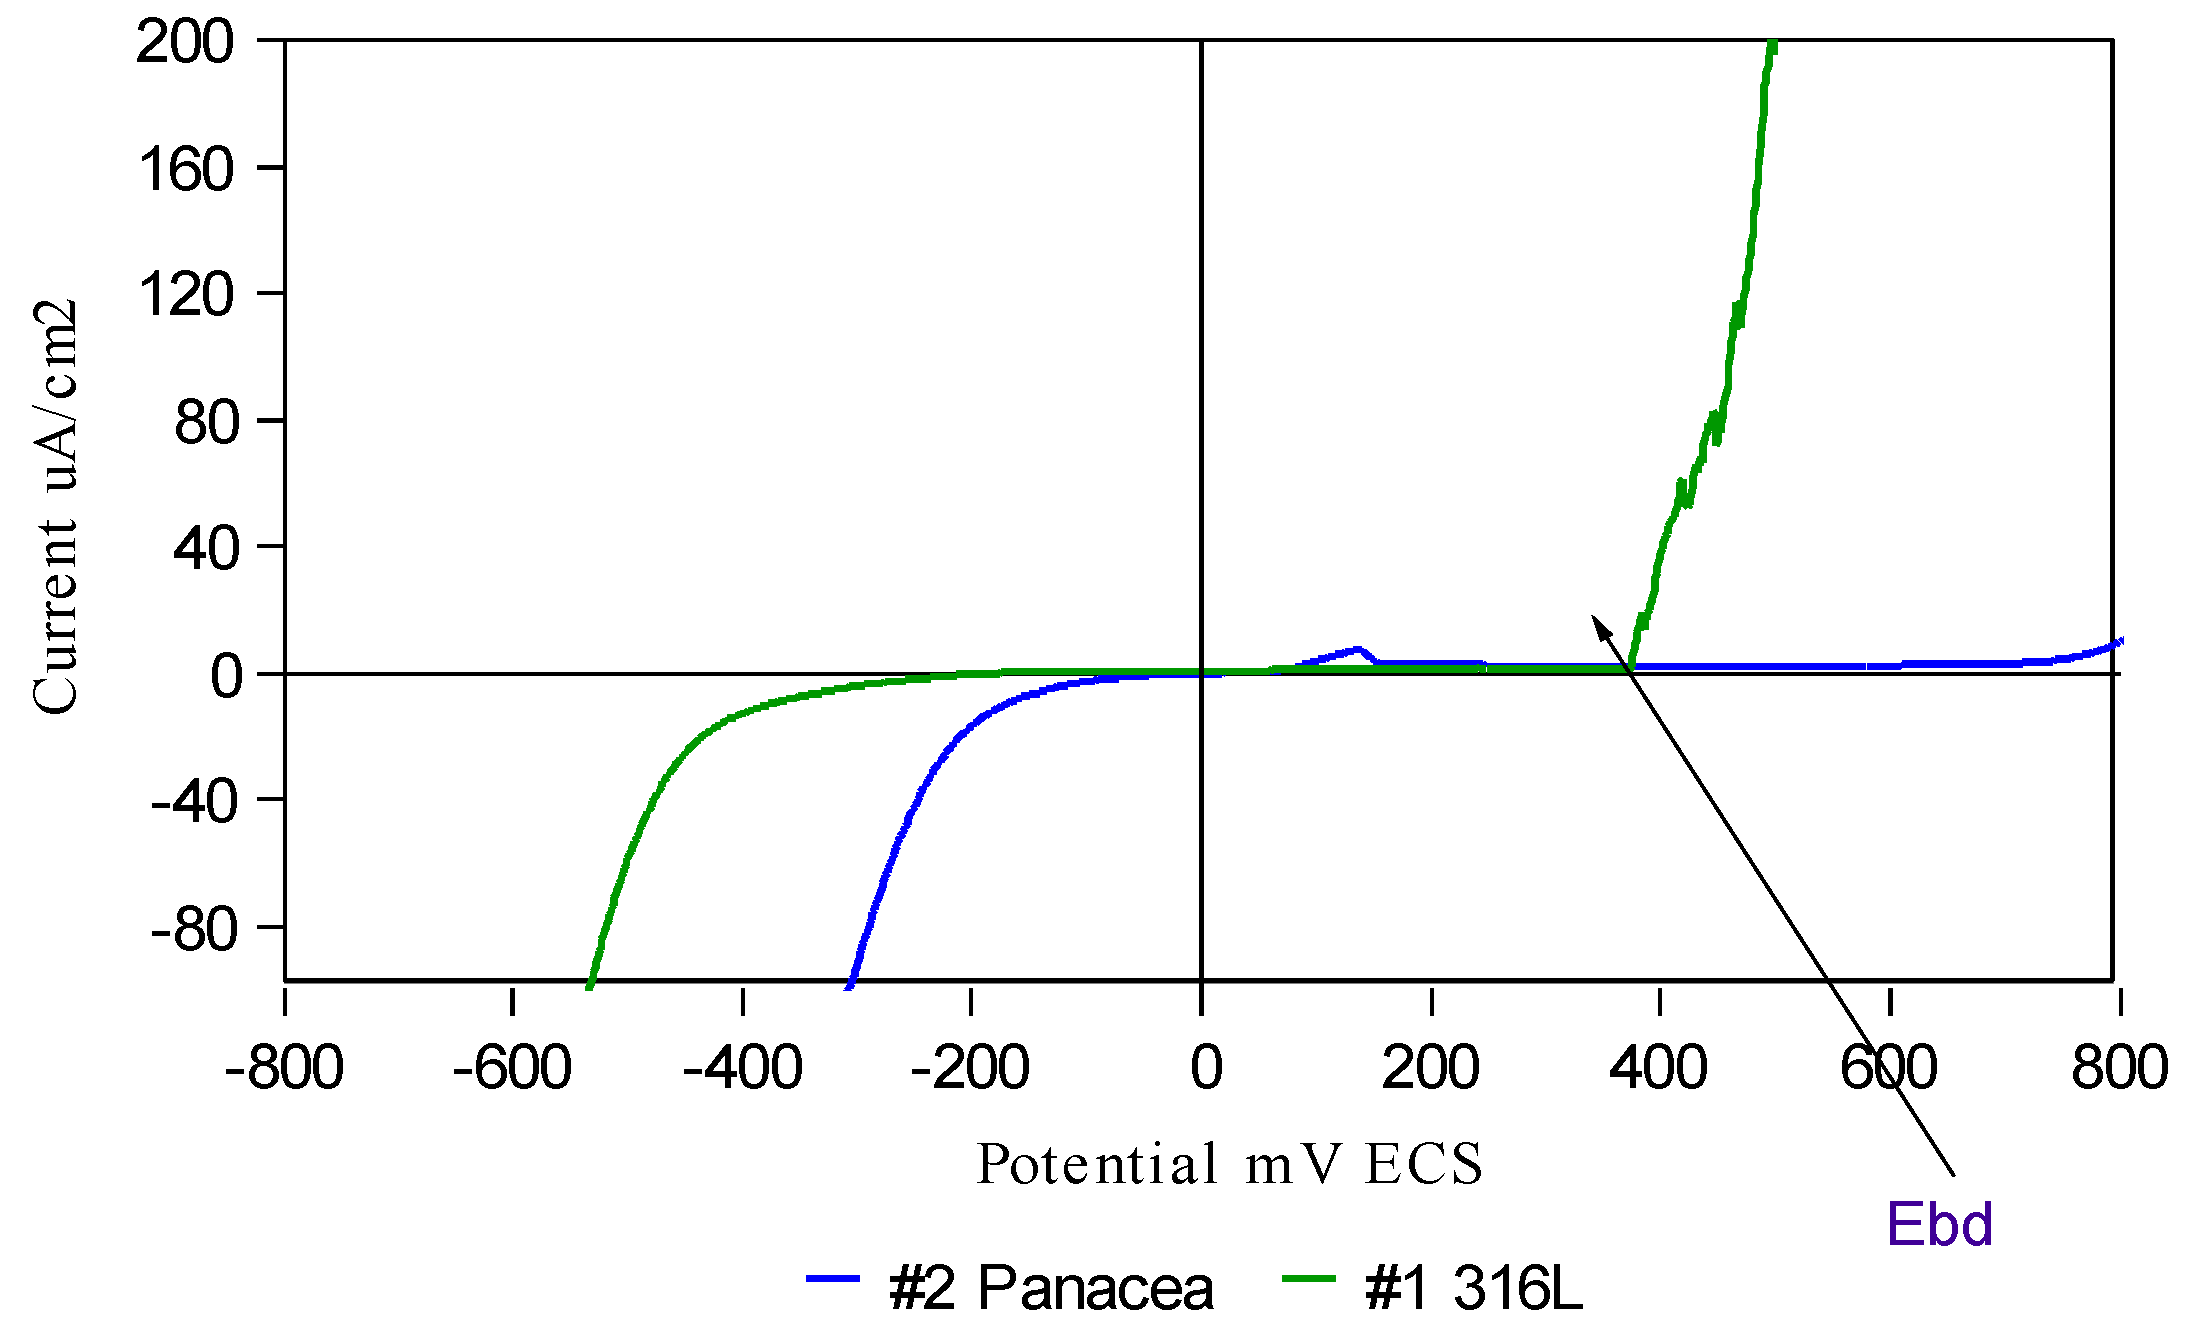
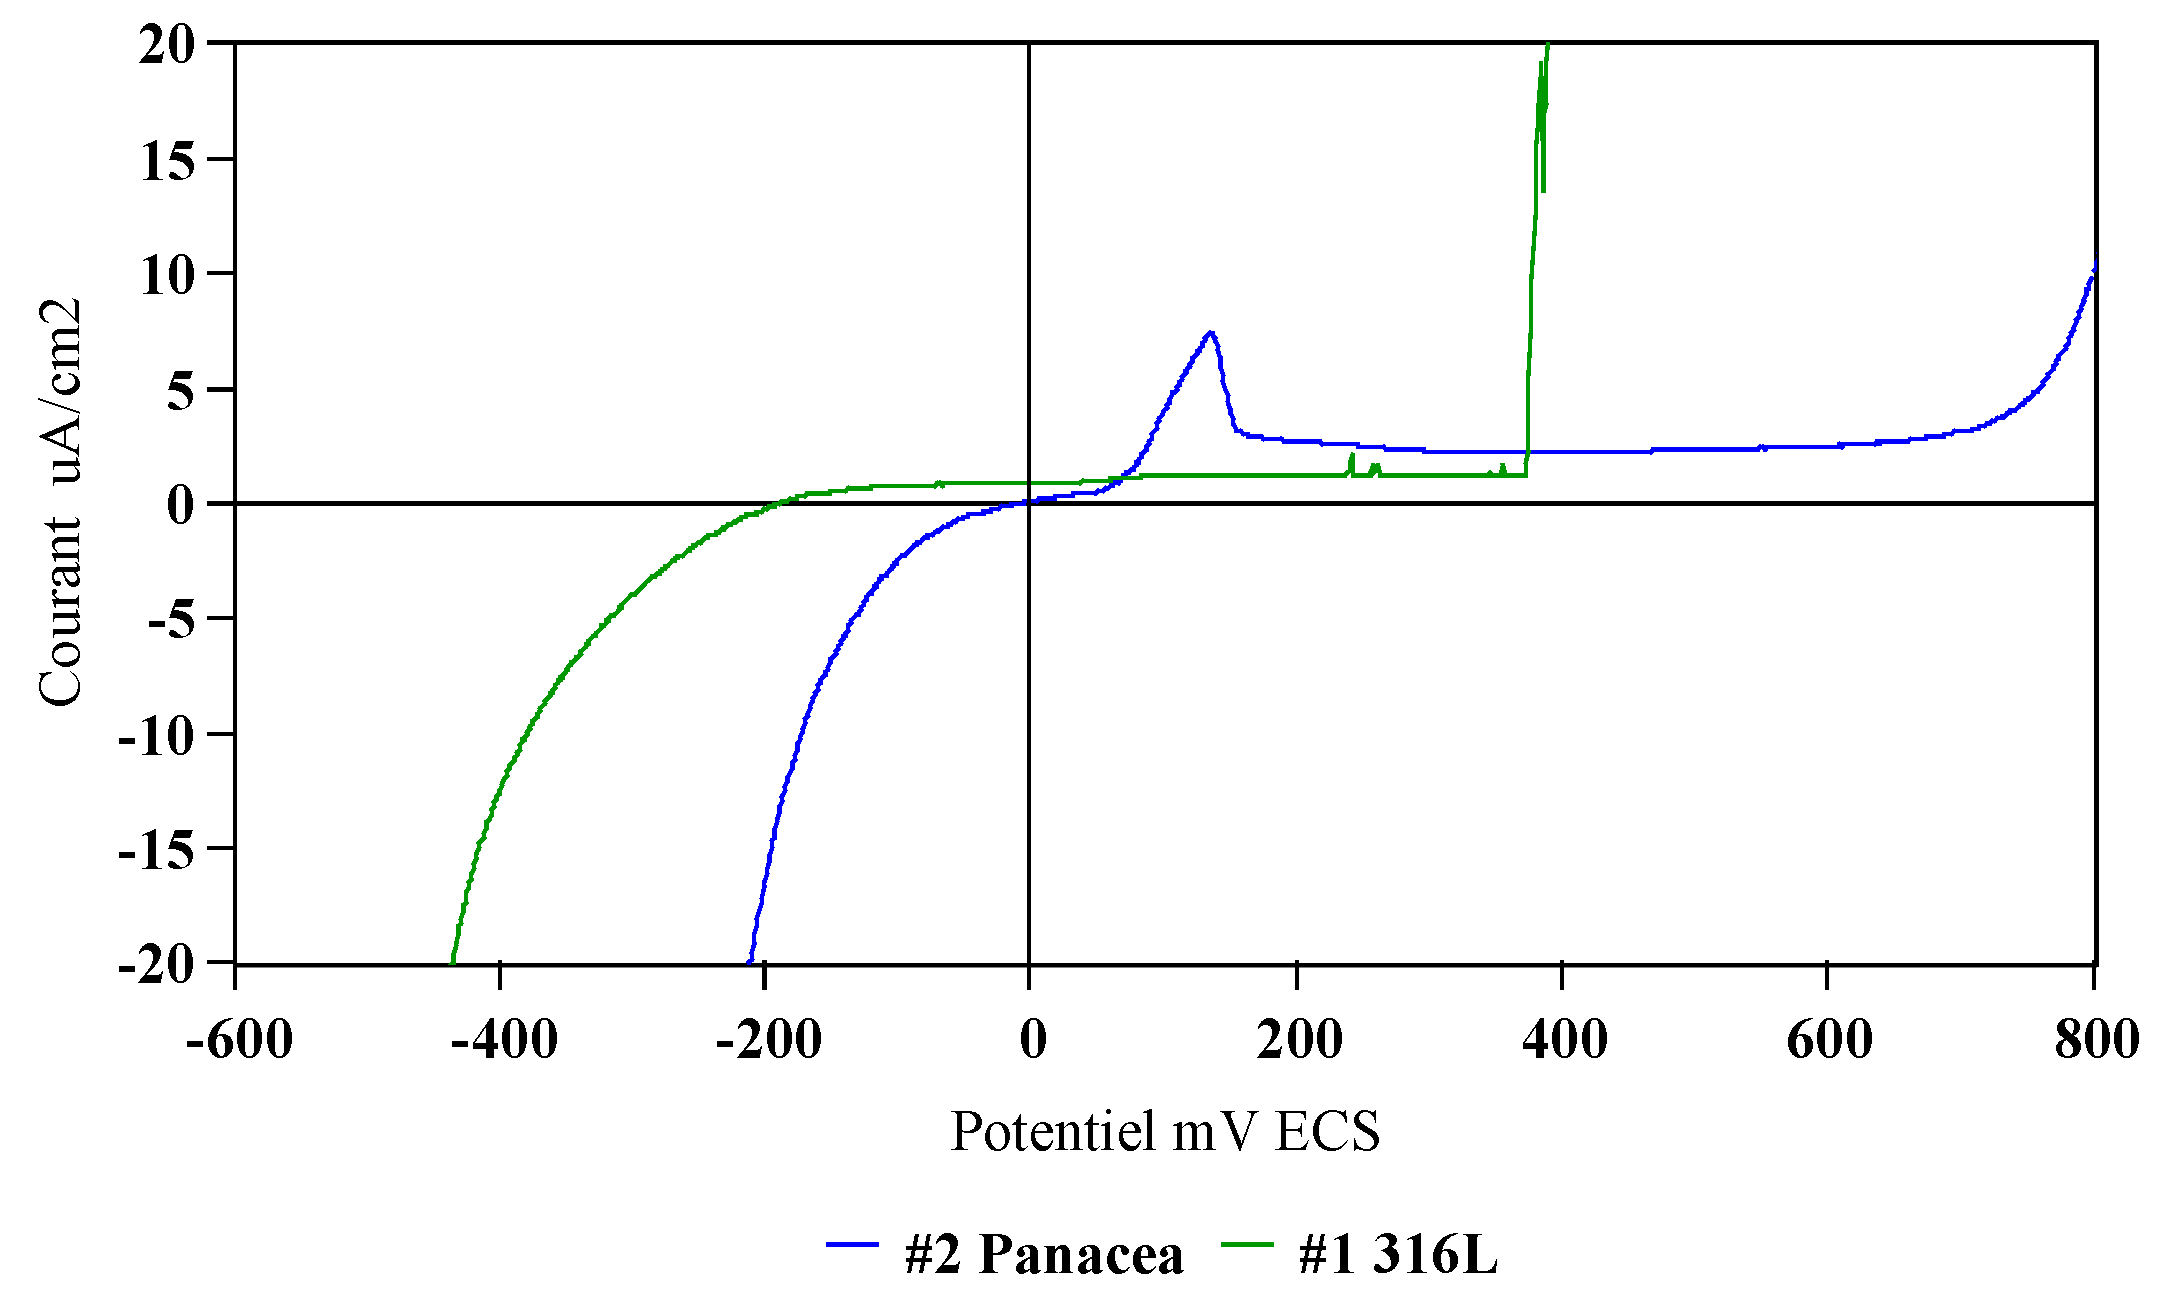
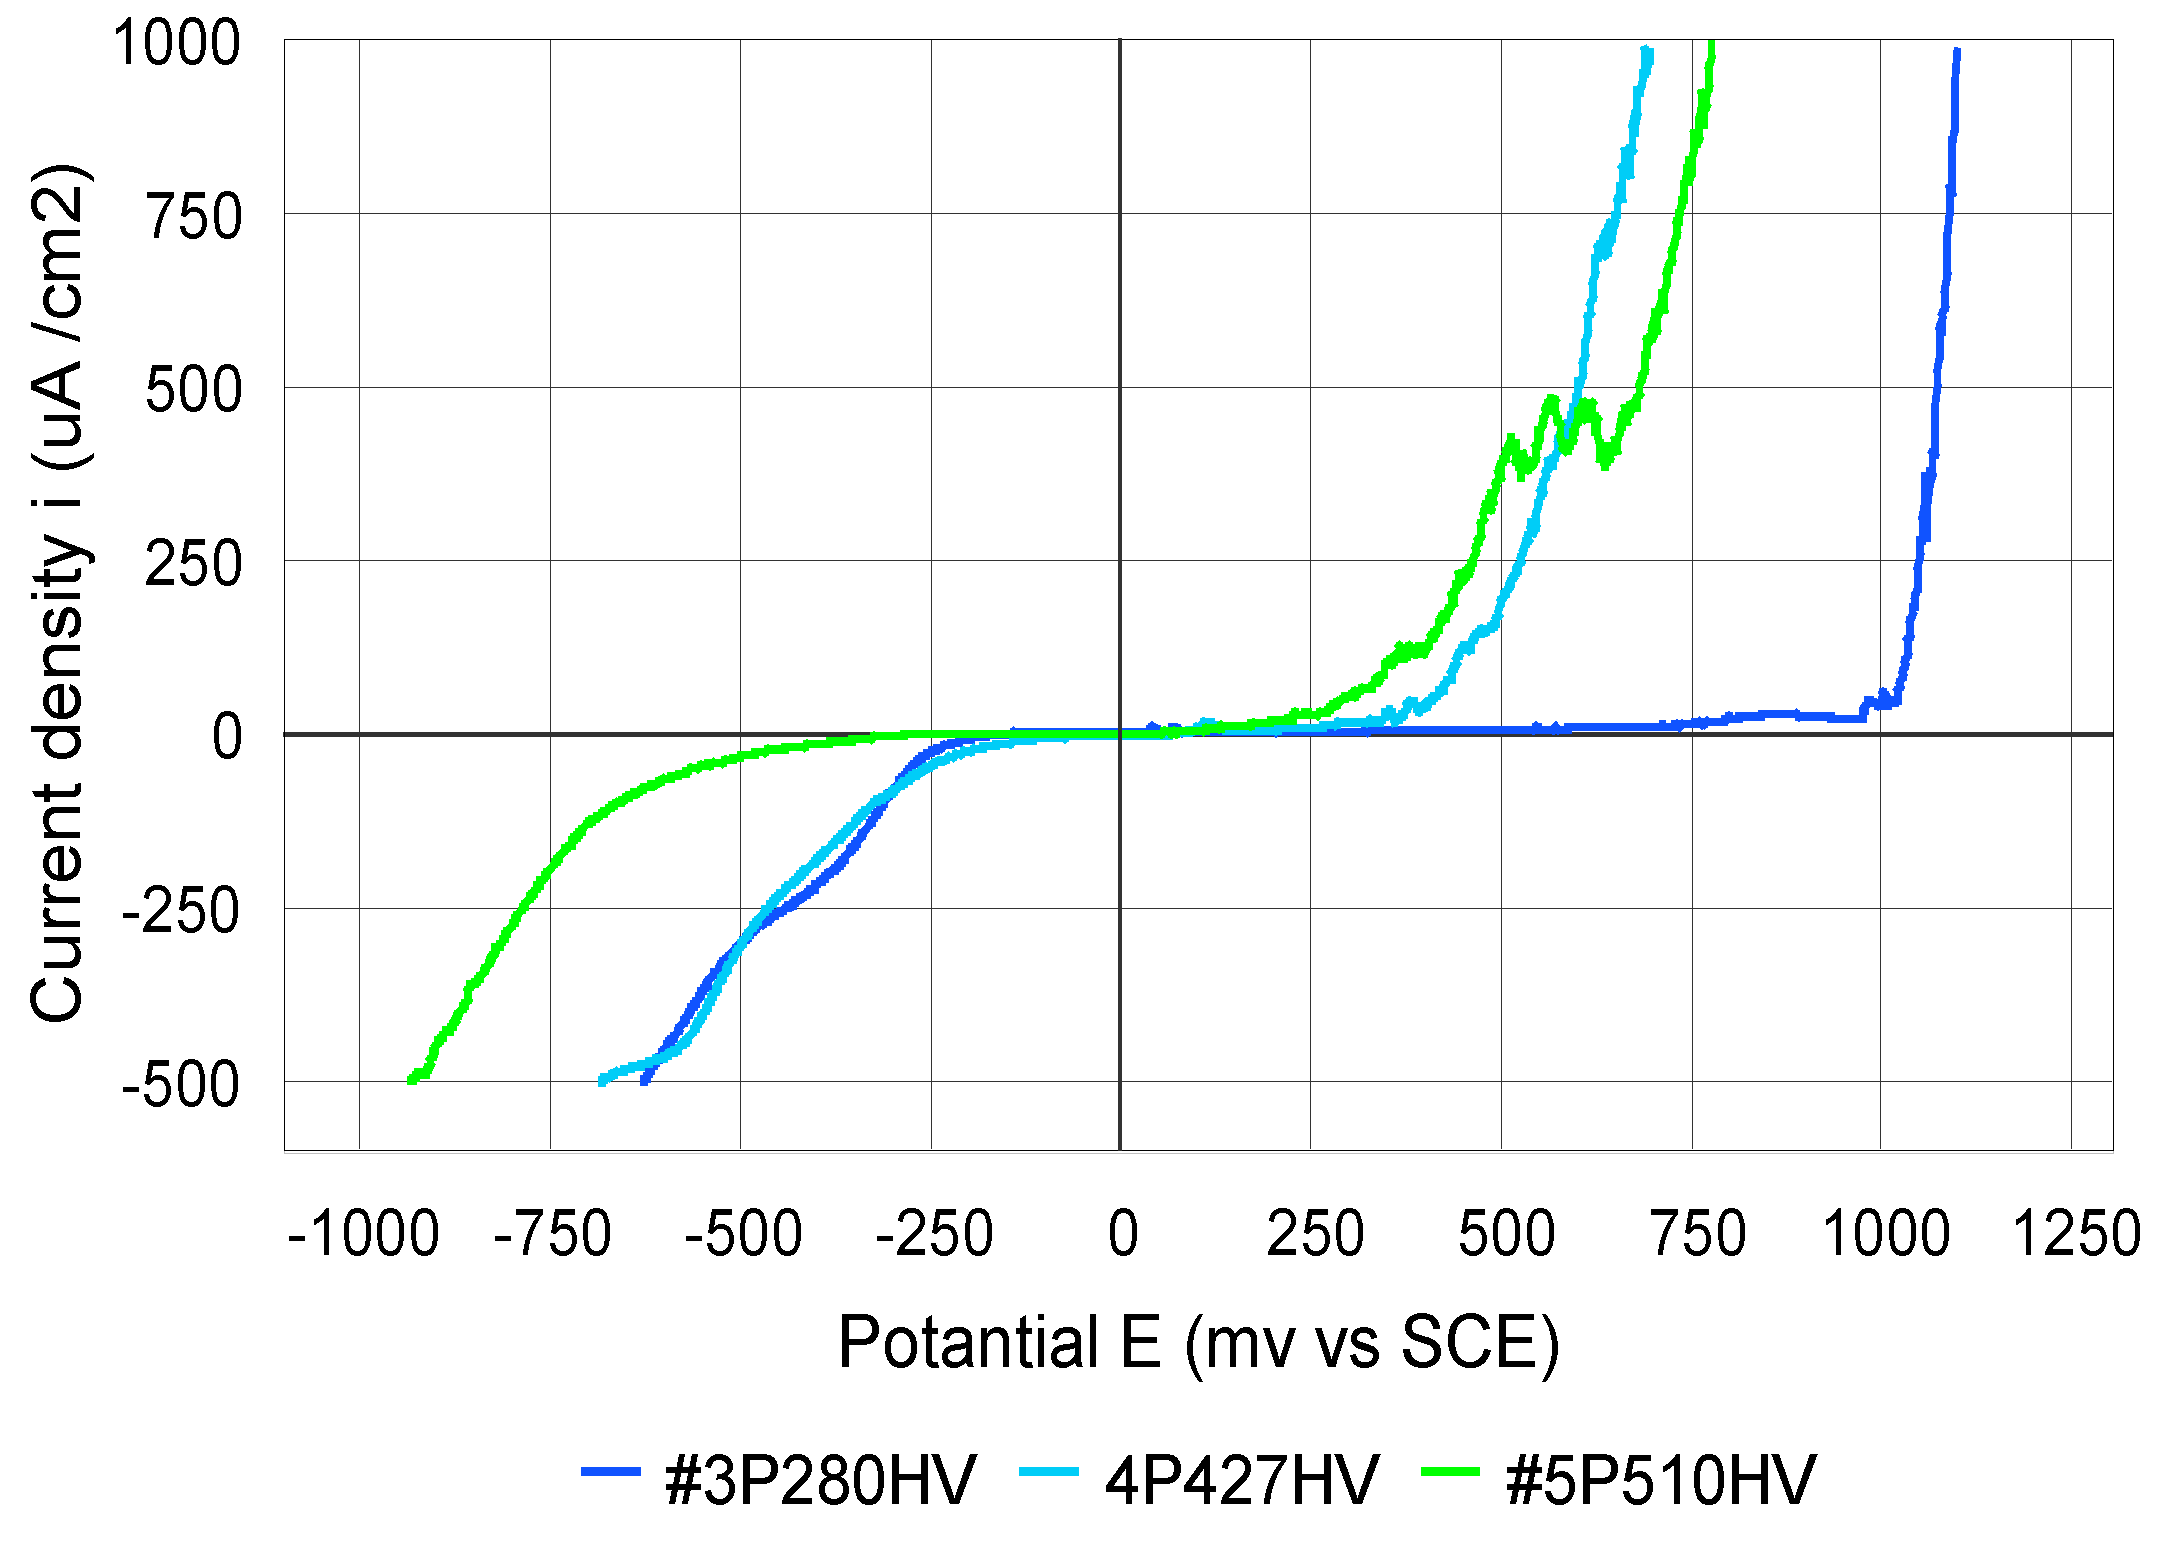
  • Potentiodynamic polarization plots, to determine the breakdown potential, Ebreak, and to highlight the existence of a passivation domain, were recorded between −1000 mV and 1000 mV/SCE at a scanning rate of 0.25 mV/s;
  • Coulometric analysis was used to calculate the quantity of the electrical charge consumed on the anodic polarization curves. The following was determined for these three different subdomains: 1st zone: Ecorr (after 24 h of immersion) to 300 mV, 2nd zone: 300 to 600 mV, and the 3rd zone from +600 mV to +1000 mV.
The electrochemical tests used to evaluate the general corrosion behavior of the investigated materials were carried out by performing one test for each type of material under similar experimental conditions.
The electrolyte used for the electrochemical measurements is an artificial sweat, according to EN1811, Table 4. All chemicals are of reagent grade and were purchased from Merck (Darmstadt, Germany).
The samples were also tested in terms of pitting and crevice corrosion. For the corrosion tests, the samples were delivered as rods with a diameter of 15 mm, which were divided into raw state #3 P280HV0.1, and hardened state, samples #4 P427HV0.1 and #5 P510HV0.1. To create a reference state, the as-received samples were first annealed and then recrystallized at 1050 °C. A continuous industrial oven under hydrogen protection with gas cooling was used for the thermal treatment. The samples used for the evaluation of crevice corrosion (#3, #4, and #5) are 4 mm diameter rods (machined from the initial rods samples) driven into Teflon sample holders suitable for the crevice test technique according to ASTM F746-87 [33].
In this regard, a test adapted to the ASTM F746-87 standard [33] was employed. The test samples with a diameter of 4 mm were prepared as those presented in Figure 3. The test medium for the electrochemical measurements in the crevice is an electrolyte of NaCl 9 g/L.
The test takes place in two stages. Initially, the sample undergoes an anodic excitation at 800 mV vs. SCE for 10 s, while in the 2nd stage, the potentiostat imposes the value of the breakdown potential for 15 min. Thus, the plot curve variation of the current as a function of time for an imposed potential is drawn.
If the recorded current remains in the cathodic range (negative values), a new measurement cycle that involves excitation for 10 s at 800 mV and measurement of the current for a potential fixed at Ebreakdown + 50 mV is started. The cycles are performed again, every time at higher potential, until the measured current remains in the anodic range. Thus, the critical potential for crevasse is determined, a potential that corresponds to the penultimate measurement where the current is positive.
Another measurement technique that has been developed consists of using the same rotating electrode head (Figure 2) and plotting the potentiodynamic curve between −300 mV to +600 mV and SCE with a very low speed (0.03 mV/s). Therefore, the potentiodynamic curve is plotted for 9 h.
For the pitting and crevice corrosion measurements, a single test for each type of material was carried out.

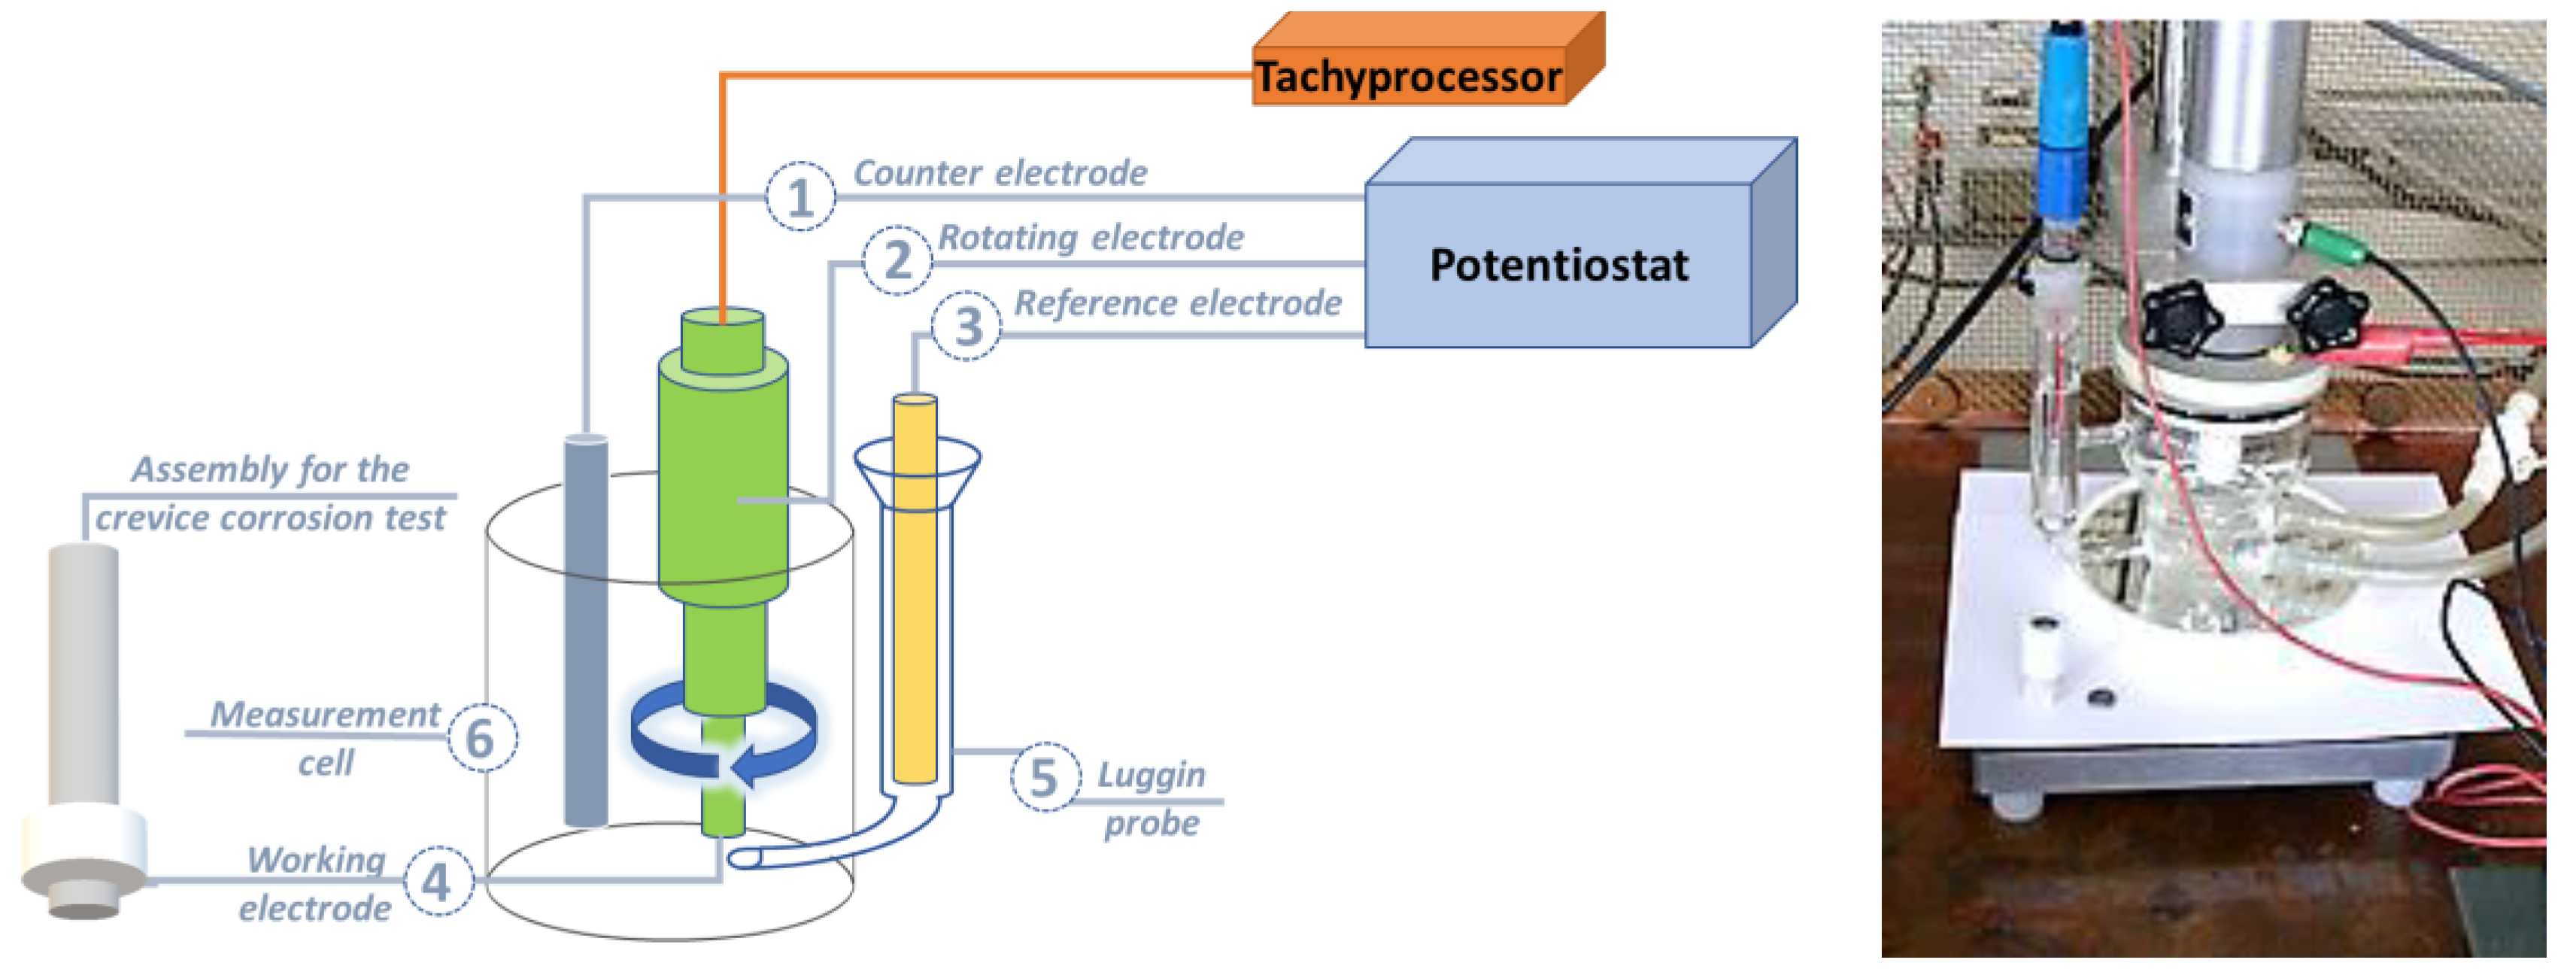
2.2.2. Galvanic Corrosion Rating

Galvanic corrosion occurs when two metals of different natures are brought into contact in a common electrolyte. ASTM standards G82-98 and G71-81 [34,35] define a galvanic coupling as a pair of dissimilar conductors which are in electrical contact. Galvanic corrosion is also defined as an increase in corrosion caused by electrical contact with a less noble metal in a corrosive electrolyte.
The corrosion morphology was evaluated in two ways: by direct Ecouple igalv measurements [34] or by prediction techniques, namely through the application of the mixed potential theory ASTM G82-98 [35].
The most direct measurement to investigate the corrosion morphology involves immersing the two dissimilar metals in an electrolyte and electrically connecting the materials together using a zero resistance ammeter to measure the current [36,37,38]. In this way, the galvanic current as a function of time can be determined directly. To determine the galvanic couple potential, the reference electrode can be used in the usual way.
The principle is shown in Figure 4. The two different materials immersed together in an electrolyte are considered to be an electrical assembly that has the ability to measure electrical potentials (E) and electrical currents (I).
Even though this method is expensive and time-consuming, it is very precise for time-dependent polarization. To acquire realistic information, the couplings are measured for 3 to 4 days. Nonetheless, to determine the corrosion rate as a function of potential, and thus make corrections if necessary using Faraday’s Law, the samples can be weighed before and after testing.
Coupling #1 316L/#2 Panacea® underwent the following measurement cycle:
  • Immersion in a deaerated medium with Ar for 24 h and recording of the open circuit potential of each electrode;
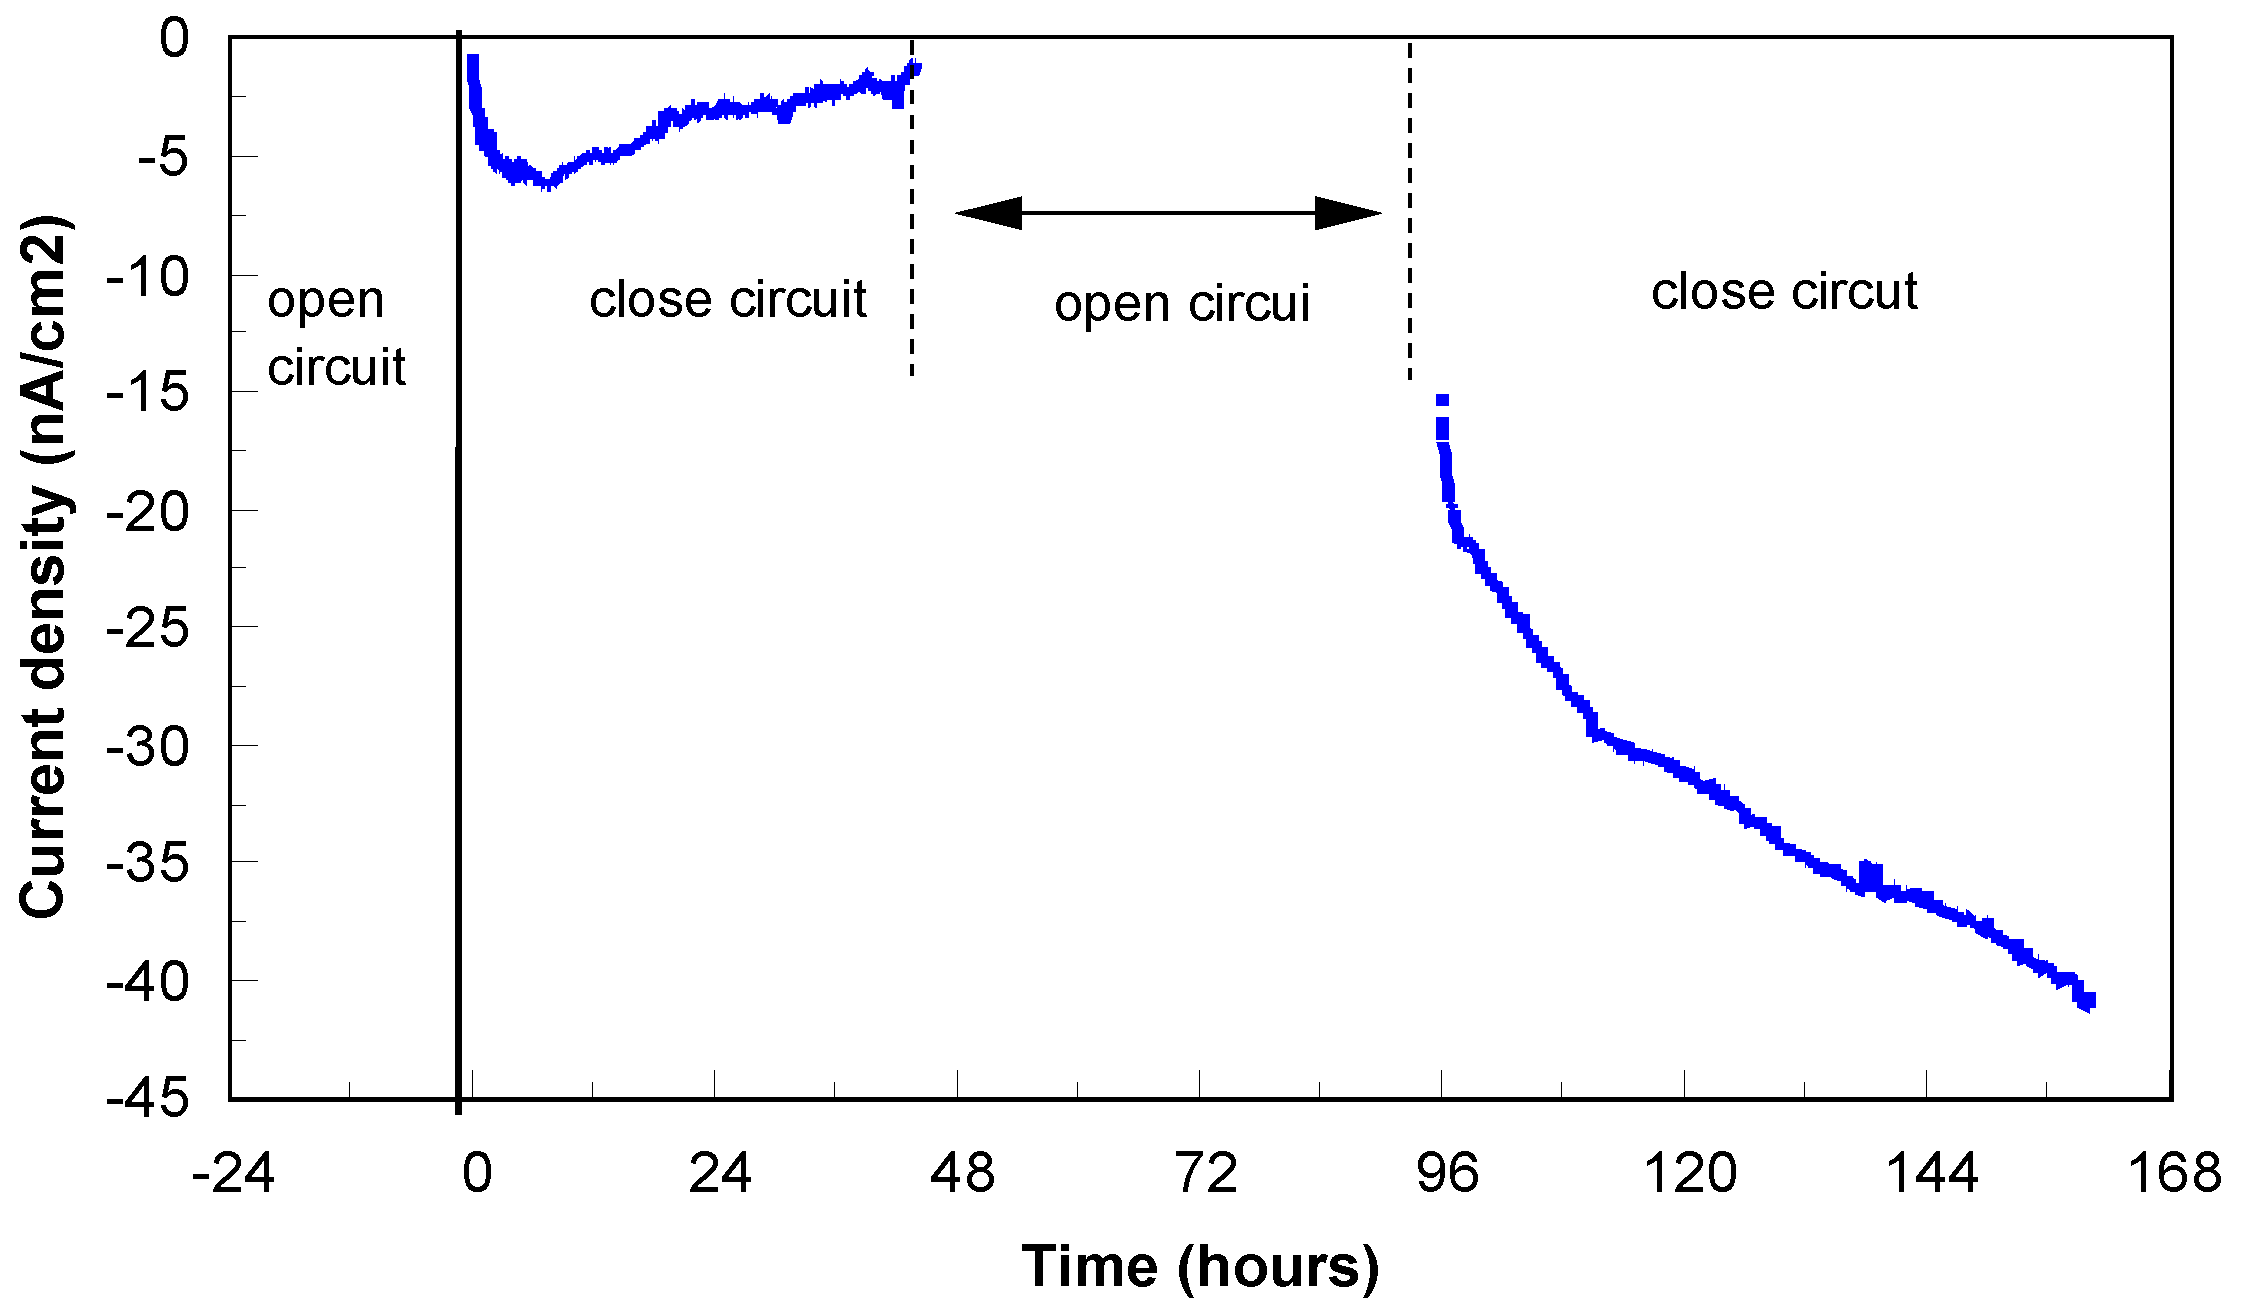
  • Recording of the galvanic coupling current for 48 h. The measurement of the galvanic coupling current was then resumed after 4 days for a duration of 72 h.
The samples were discs 11 mm in diameter, metallographically polished with 1 μm diamond paste. They were coated in a non-conductive resin and connected to the electrode gates. The measurement cell is made of glass, and the measurement electrodes are positioned face to face horizontally. The reference electrode is a saturated calomel electrode (SCE), and the anode/cathode surfaces ratio is equal to one.
The galvanic current as a function of time of the couplings studied is measured by an EG&G PAR model 273A potentiostat with the electronic modifications indicated by the manufacturer of the device. These modifications make it possible to measure galvanic coupling currents of the order of 100 pA.

Indirect Measurements

Evaluation of galvanic couplings from polarization curves
Another way to measure galvanic corrosion is through indirect measurements by examining the polarization behavior of the materials involved in the coupling. This can be performed by plotting the potentiodynamic polarization curves of each material.
The fundamental bases for this technique were developed by Wagner and Traud [39]. They have also been described by Harvey P. Hack [40]. The aim is to obtain a good indication of the measured current value of each material at an imposed potential under the same conditions and in the same medium. The technique takes place in two stages: (1) the anodic and cathodic polarization curves of each alloy are plotted after 6 days of immersion under the same measurement conditions, and (2) the polarization curves of the two alloys tested are presented in the same graph. The point of intersection between the anodic curve of one alloy and the cathodic curve of the other alloy gives the prediction values Ecouple and Icouple.
The immersion time in the artificial sweat medium was 6 days, and the scanning speed was slow. In this study, two techniques were used: (1) static measurement (fixed electrode) and (2) dynamic measurement (rotating electrode). The polarization curve plots were drawn with a scanning speed of 0.1 mV/s. The scan range is between –1000 and 1200 mV ECS.
Regarding the prediction technique for the calculation of Icouple and Ecouple in compliance with the mixed potential theory ASTM G82-98 [35], the following two assumptions are formulated: (a) the division of the electrochemical reactions into two or more oxidation and reduction reactions, and (b) the electrical charges are not accumulated during the process.
To determine the mixed potential (the galvanic potential of couples) and the resulting galvanic current from the sum of all the anode and cathode currents for each material/potential, it is necessary to meet the following situation:
ia·Aa = ic·Ac
where ia·Aa is the sum of the anodic currents (current density multiplied by the area), and ic·Ac is the sum of the cathodic currents.
Concretely, the technique consists of plotting the anodic and cathodic polarization curves in the range ±150 mV SCE with respect to the corrosion potential Ecorr and then plotting the Tafel slopes. The Tafel slopes are given by the tangents to the two anodic (oxidation) and cathodic (reduction) polarization curves which must intersect at the Ecorr point. Once the Tafel slopes are plotted, it is necessary to calculate the anodic sum of the slopes of 316L and Panacea® and the cathodic sum of the slopes of 316L plate and Panacea®. The intersection of the two new slopes will give the prediction value of Icouple and Ecouple. The electrolyte was an artificial sweat according to standard EN 1811 at a temperature of 37 °C.
The Nielsen–Tuccillo test can be used to evaluate the corrosion behavior of materials precisely at the material–electrolyte interface by a system based on cyclic immersion. The Nielsen–Tuccillo apparatus [41,42] resides on two carrying wheels for the samples and rotates continuously at 1 rpm speed so that the specimen passes in succession from the liquid to the gaseous phase. To manage a stable temperature during the entire assay, the Nielsen–Tuccillo equipment’s containers were linked to a thermostat with external recirculation [42]. The maximum temperature that was used in the equipment was 40 °C.
The artificial sweat prepared according to EN 1811 was the electrolyte used for the test. The sample, which was made up of a 316L middle assembly, shows Panacea® (Figure 5) passes successively from liquid to gaseous media in 15 days at the speed of 1 rot. min−1 (at 30 °C). The seal channel was open to the electrolyte. After the test, the sample was examined under a low-magnification optical microscope, paying particular attention to the seal channel, which is particularly sensitive to galvanic corrosion.
Since these tests require long periods of time, a single measurement was carried out for each investigated material.

2.3. Cations Release (ICP-AES and ICP-MS Techniques)

The nickel release test was carried out in artificial sweat (Table 4) prepared according to EN 1811 with a pH value of 6.5. The artificial sweat was purified through a Falcon® 0.22 μm sterilized membrane (Falcon, Lyon, France); the vials used were Medical Device type. The samples to be tested were previously cleaned in ethanol p.a. under ultrasound. The specimens were kept in an oven at 30 ± 2 °C for 7 days. The nickel was then assayed/measured by inductively coupled plasma atomic emission spectroscopy (ICP-AES).
Analysis of Cr, Cu, Fe, Mn, Ni, Al, Ba, Mo, and Sr cations release. The extraction tests were carried out on samples #3 P280HV, #4 P427HV, and #5 P510HV. The samples were rods with a diameter of 5 mm and a length of 6 mm. The samples were cleaned beforehand in ethanol p.a. under ultrasound. The cation release test was carried out in artificial sweat by analogy with the standard relating to the release of nickel (EN 1811). The cations were then assayed by ICP-AES and Inductively coupled plasma mass spectrometry (ICP-MS). The measurements were carried out in triplicates.

3. Results and Discussions

3.1. Corrosion Evaluation by Electrochemical Techniques

The corrosion potential (Ecorr or E(i=0)): Metals and alloys immersed in an electrolyte generate an electrical potential that varies as a function of time. It stabilizes at a stationary value after a long period of immersion. Since the nature of the surface of the electrode changes through different types of phenomena, such as oxidation, formation of a passive layer, or immunity, this potential varies over time. The corrosion potential thus measured makes it possible to establish a relative comparison of the alloys in the environment considered and to construct a galvanic series. It is well established that the higher the value of the potential, the better the metal or the alloy will resist corrosion. In Table 5, the potential values measured for the steels studied are presented in a comparative way: #1 316L, #2 Panacea®, #3 P280HV, #4 P427HV, and #5 P510HV, respectively.
The polarization resistance (Rp): In the immediate vicinity of the corrosion potential, the current resulting from the variation of the imposed electric potential (±20 mV) was measured on the linear polarization curves in the Mansfeld domain [43]. The polarization resistance (Rp) was calculated by determining the tangent slope to the polarization curve for I = 0. The polarization resistance (Rp) is expressed in kOhm/cm2. The Rp is representative of the passivation layer degree of protection of the alloy surface. The higher the value of Rp, the more the alloy will resist corrosion, and the lower the corrosion current will be (icorr). The best behaviors were revealed by #3 P280HV 1706 Ohm/cm2 and the worst by #5 P520HV 337 Ohm cm2 (Table 5).
The Tafel slopes (bc, ba) and the corrosion current (icorr): By a mathematical calculation involving the adjustment of a theoretical polarization curve to the experimental polarization curve drawn in the range of ±150 mV (Ecorr), it was possible to calculate the slopes of Tafel—bcathodic (bc) and banodic (ba). The Tafel slopes are given by the tangents to the two polarization curves, Ecorr −150 mV (cathode curve) and Ecorr +150 mV (anode curve). The two tangents must intersect at the point of the coordinates (Ecorr, icorr). They are expressed in mV. Whenever a value of the anodic Tafel current ba exceeds 300 mV, it should cast doubt on the validity of the corrosion current icorr value [43].
An alloy with a passivation tendency will have a higher ba value than the bc, while an alloy that corrodes will have a smaller ba than the bc. The corrosion current density icorr corresponds to the anodic component at potential icorr = ia (E = Ecorr). The corrosion current density (icorr) was representative of the alloy’s degree of degradation under the test conditions.
Table 5 presents the calculated values of ba, bc, and icorr for the evaluated steels. According to the icorr values, #1 316L, #2 Panacea®, and #3 P280 HV show the best behaviors. The corrosion currents calculated for all the steels were in the same range of magnitude (nA/cm2).
The potentiodynamic polarization curves are essentially used to determine whether an alloy tends to undergo anodic oxidation and, therefore, a corrosion process. The breakdown potential (Ebreak) is the parameter that should be searched for on the anodic polarization curve.
The breakdown potential (Ebreak) is the potential for which the anode current increases sharply. The immunity zone, where the corrosion rate is very low and almost insignificant, is found between the Ecorr and the Ebreak—the corrosion potential and the breakdown potential. The more this zone is lengthened, the less the material is prone to corrosion (by polarization or by galvanic effect resulting from the presence of another alloy).
In some electrolytes, especially those which contain chloride ions, the passive layer becomes unstable above a certain potential, also known as the critical pitting potential; there is a rapid localized attack on the metal, which leads to the formation of pitting.
The potentiodynamic polarization curves plotted in linear axes between −800 mV and +800 mV SCE of the studied steels #1 316L and #2 Panacea® used in the assembly watch case middle and bottom are presented in Figure 6. Analysis of the curves of polarization shows that the breakdown potential (Ebreak) of the 316L steel was around 200 mV, and for Panacea®, its breakdown potential is around 800 mV; see also Table 5.
Another analysis of the same potentiodynamic polarization curves can be made for currents measured between ±20 µA/cm2. It shows that the potentials E(i=0) have negative values, and the passage into the anodic domain is rapid; the curves do not lengthen on the line (i = 0), Figure 7.
Therefore, in the immunity zone, a weak current of about 1 µA/cm2 is generated by the two steels. If the values obtained are compared with those of precious metal alloys, the potentials E(i=0) moves towards positive values, and the currents in the immunity zone are of the order of a few nanoamperes. The Panacea® reveals a peak around 180 mV SCE, but this peak is attributed to a selective degradation linked to the morphology of the steel rather than to the initiation of pitting.
Figure 8 presents the potentiodynamic polarization curves in linear axes for samples #3 P280HV, #4 P427HV, and #5 P510HV. Thus, it can be noticed that the hardened samples have less good corrosion resistance.
It should also be noted that there is a difference in behavior between the #3 P280HV, #4P 427HV, and #5 P510HV. The breakdown potential values are +800 mV for the raw sample and +350 and +260 mV, respectively, for #5P510HV.
The presence of disturbances on the polarization curves for the hardened samples allows the association with phenomena specific to localized pitting corrosion.
Austenitic stainless steels cannot be hardened via heat treatment but may benefit from work hardening due to plastic deformation in the metal’s crystal lattice. This phenomenon is also referred to as strain hardening and cold working. Defects such as deformation bands, twins, dislocations, and transformation of austenitic (γ) structure to martensitic (α’) structure, known as strain-induced martensite, can be generated by the cold-working process [44,45]. The anticorrosion properties of austenitic stainless steels are dictated by the passive film formation on their surfaces. The protection accorded by the film is considerably influenced by metallurgical and mechanical factors such as alloy composition, cold working process, inclusions, heat treatment, and secondary precipitates [46]. Due to cold working and changes in microstructure, corrosion resistance is influenced, as well as the nature and stability of passive films. In a study by Vipin Tandon [45] on cold-worked 316L, it was reported that the dissolution rate of the substrate increased significantly at a higher dislocation density. An increase in dislocations and residual stresses is observed due to the introduction of strain-induced martensite, which influences the localized corrosion behavior due to the increased number of anodic sites on the surface.
The coulometric analysis is carried out by dividing the anodic polarization curves into three different areas as follows: Zone I: Ecorr (after 24 h of immersion) at +300 mV; Zone II: +300 mV to +600 mV; and Zone III: +600 mV to +1000 mV. Following that, the resulting areas, which are located under the polarization curves, are individually integrated, and the obtained results are expressed in mC. This implies that the quantity of current consumed for the electrochemical degradation of the alloy is integrated into an anodic scanning range between Ecorr and +1000 mV. Although the intensity of the electrochemical degradation phenomenon varies from one alloy to another, it can be considered that a real danger of the alloy can occur in Zone I, with an exceptional potential risk in Zone II.
The coulometric analysis for the studied steels for the zones E(i=0) at 300 mV and 300 mV at 600 mV are presented in Table 5. It also confirms the observations and remarks made for the electrochemical parameters presented previously.
The best behavior is revealed by #2 Panacea® (zone1 + zone2) = 3.72 mC/cm2 and #3 P280HV (zone1 + zone2) = 15.4 mC/cm2. The #4 P427HV (zone1 + zone2) = 99.43 mC/cm2 presented an intermediary state. The poorest corrosion behavior is observed by #5 P510 (zone1 + zone2) = 357.29 mC/cm2.
The 316L steel shows good behavior in the passive zone (immunity); on the other hand, its breakdown potential reveals a typical value of the 316L steel family. Current disturbances similar to the pitting phenomena were noticed once again in the immunity zone, with a sum of zones of (zone1 +zone 2) = 199.96 mC/cm2.

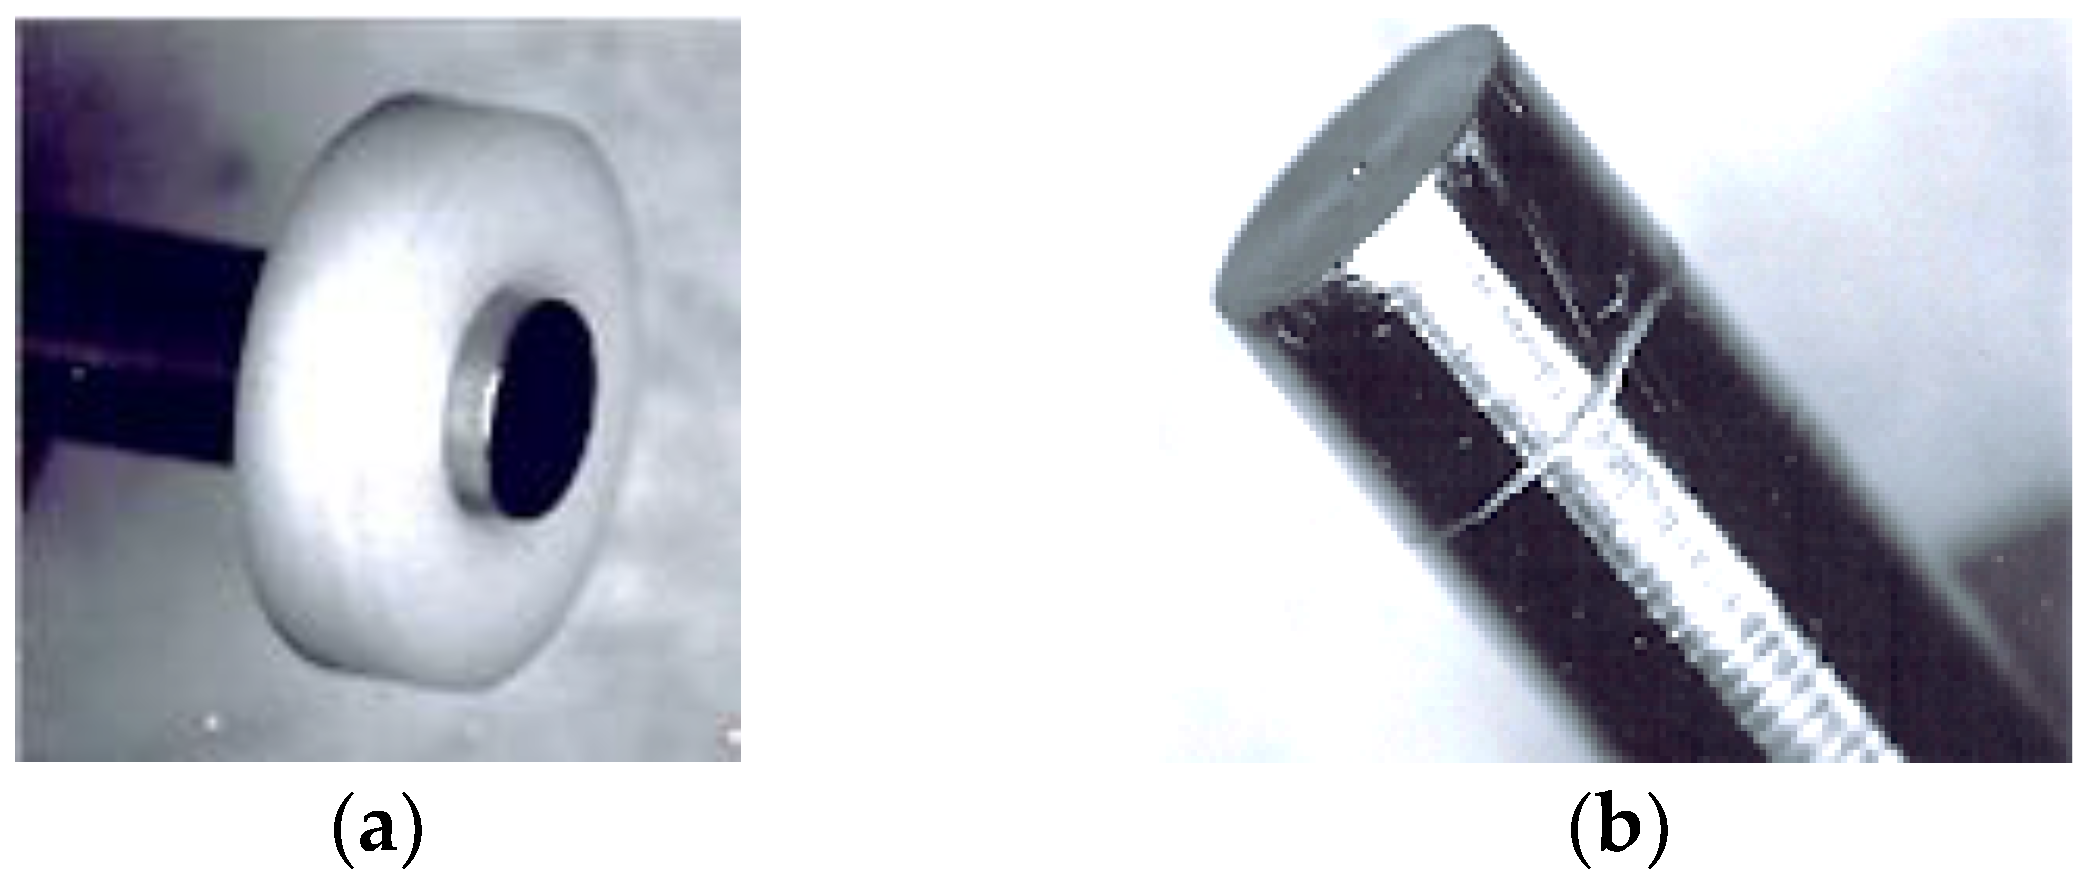
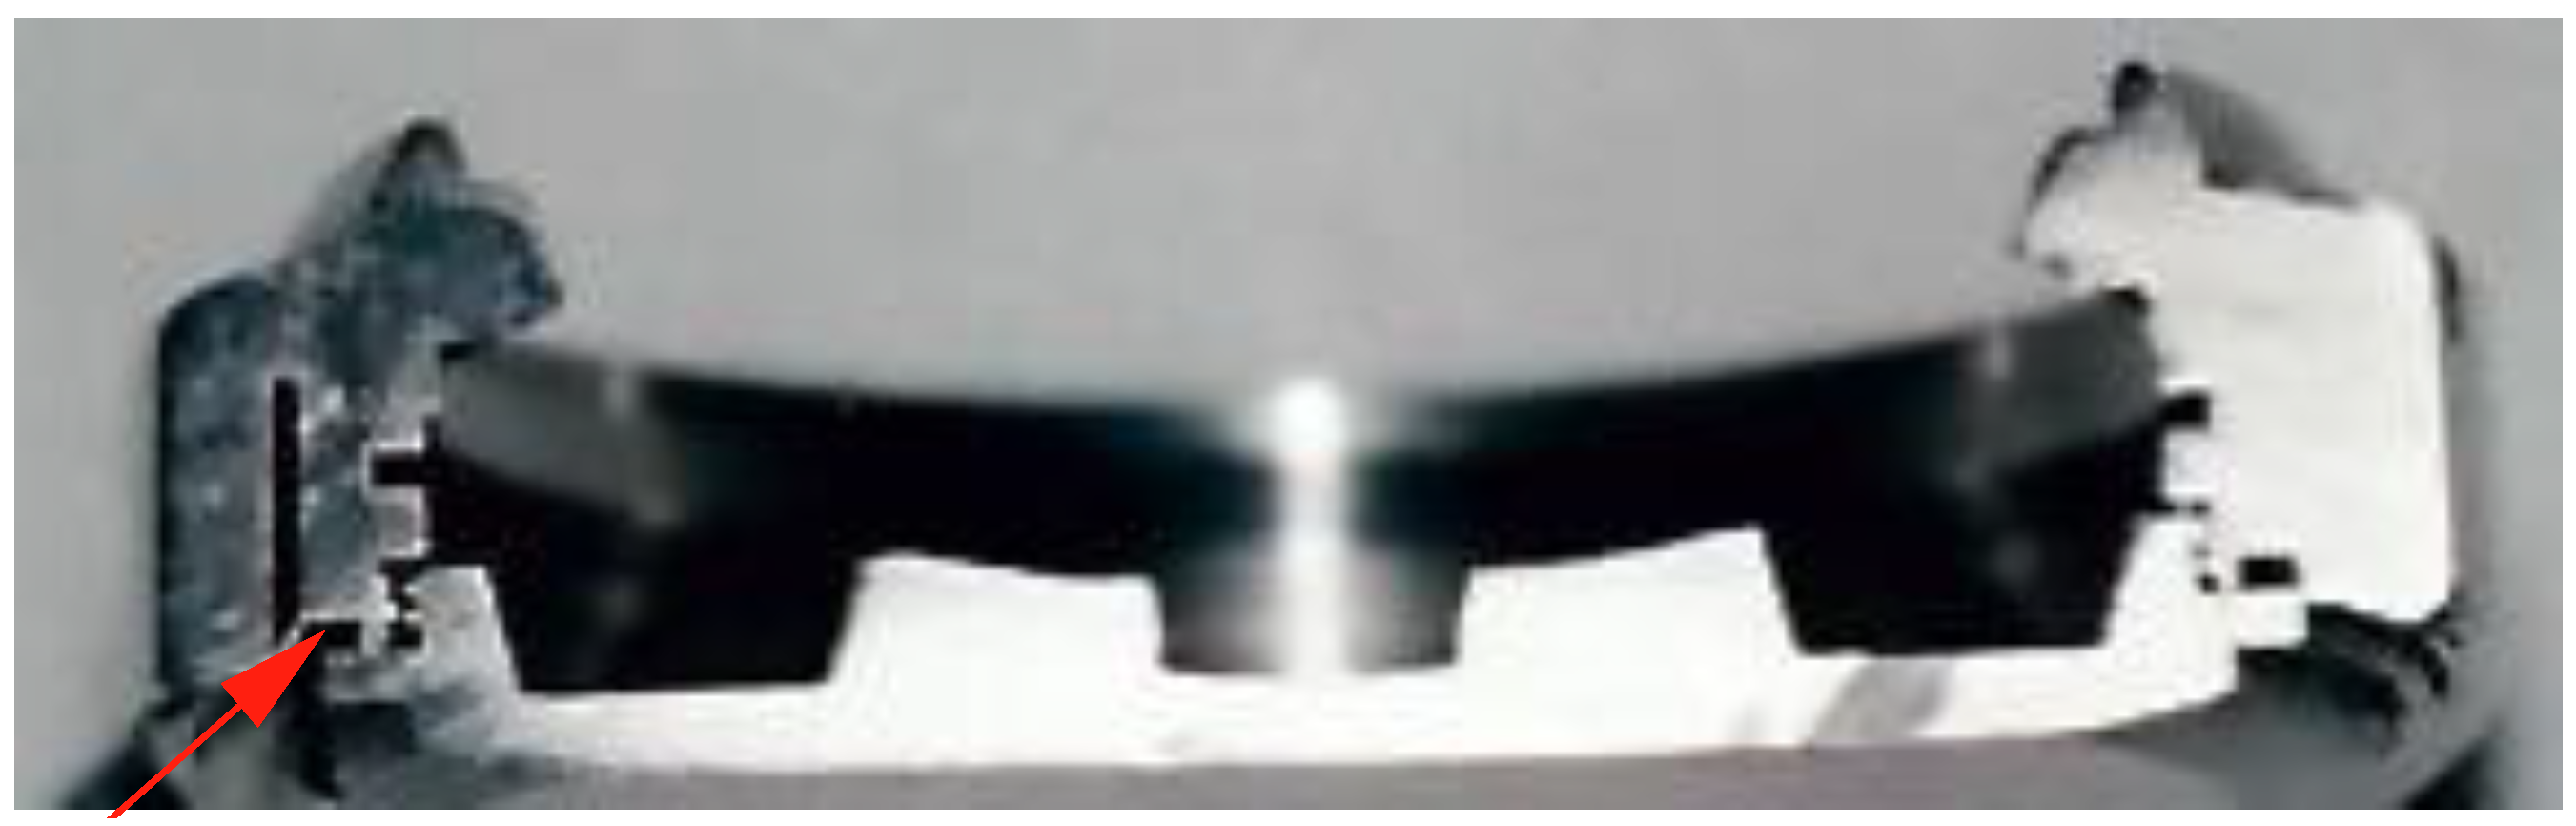
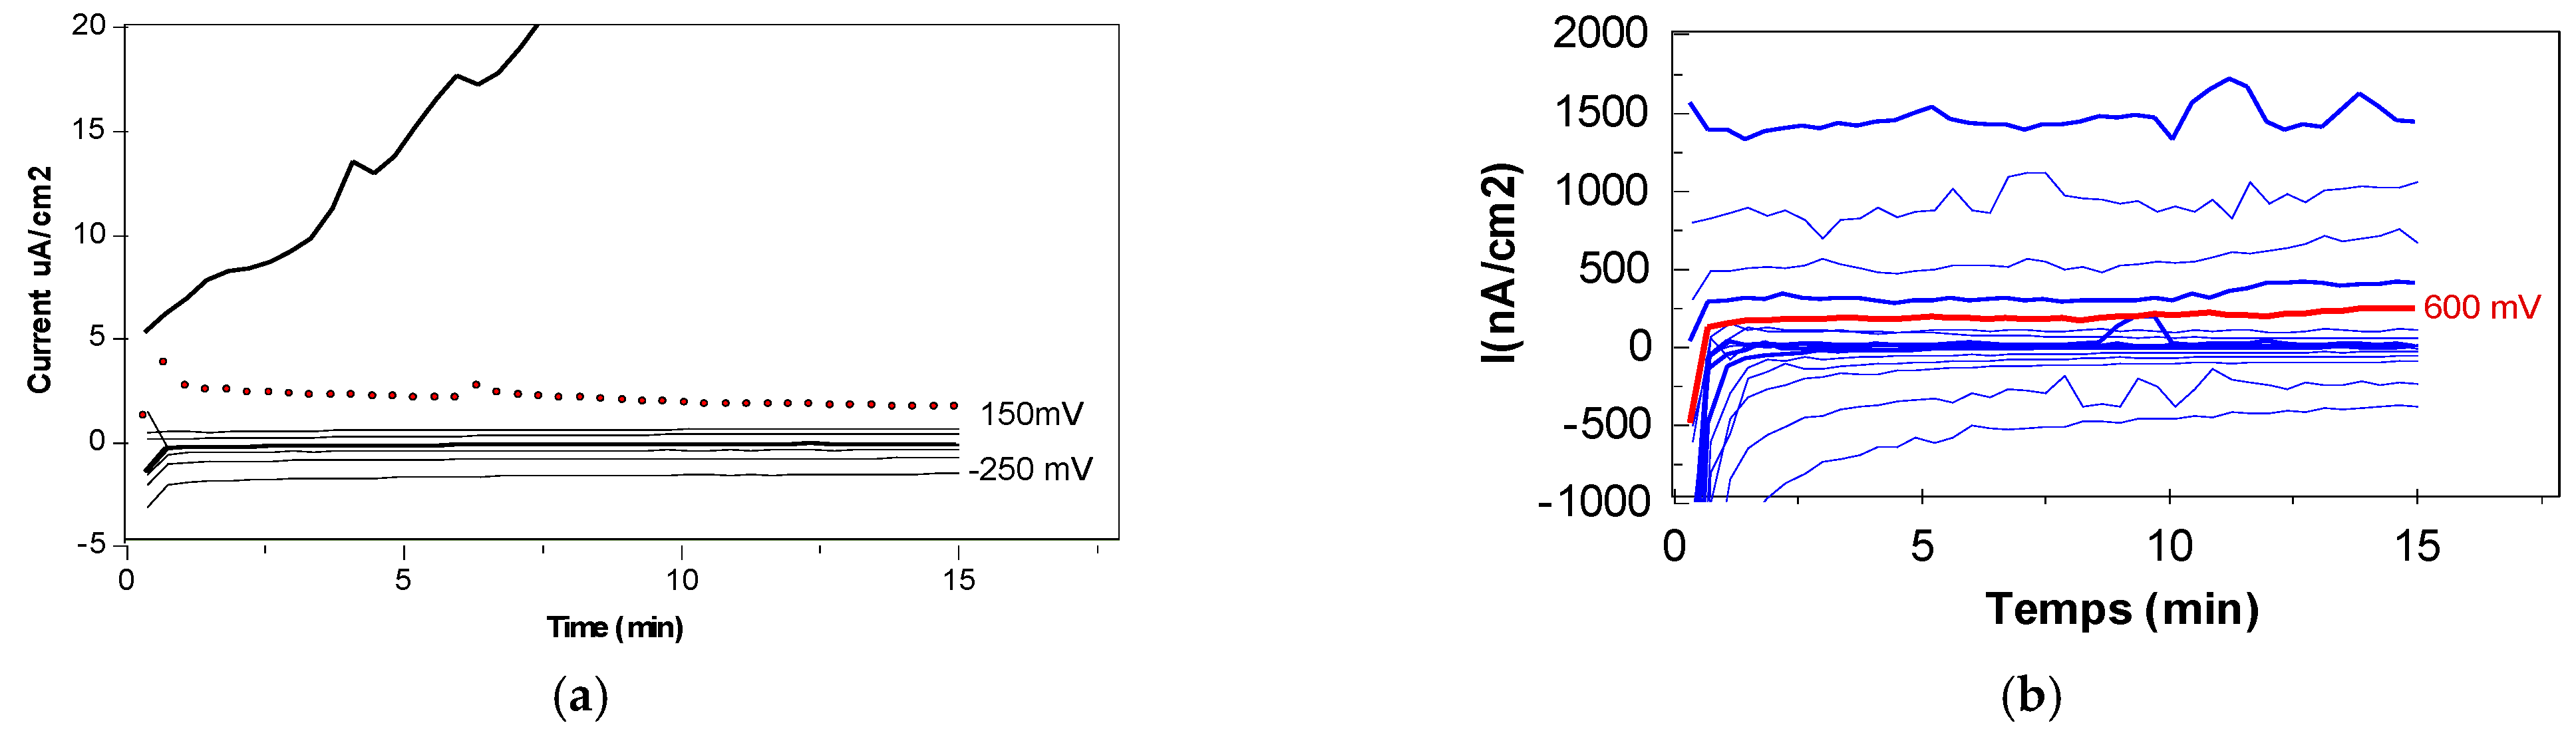
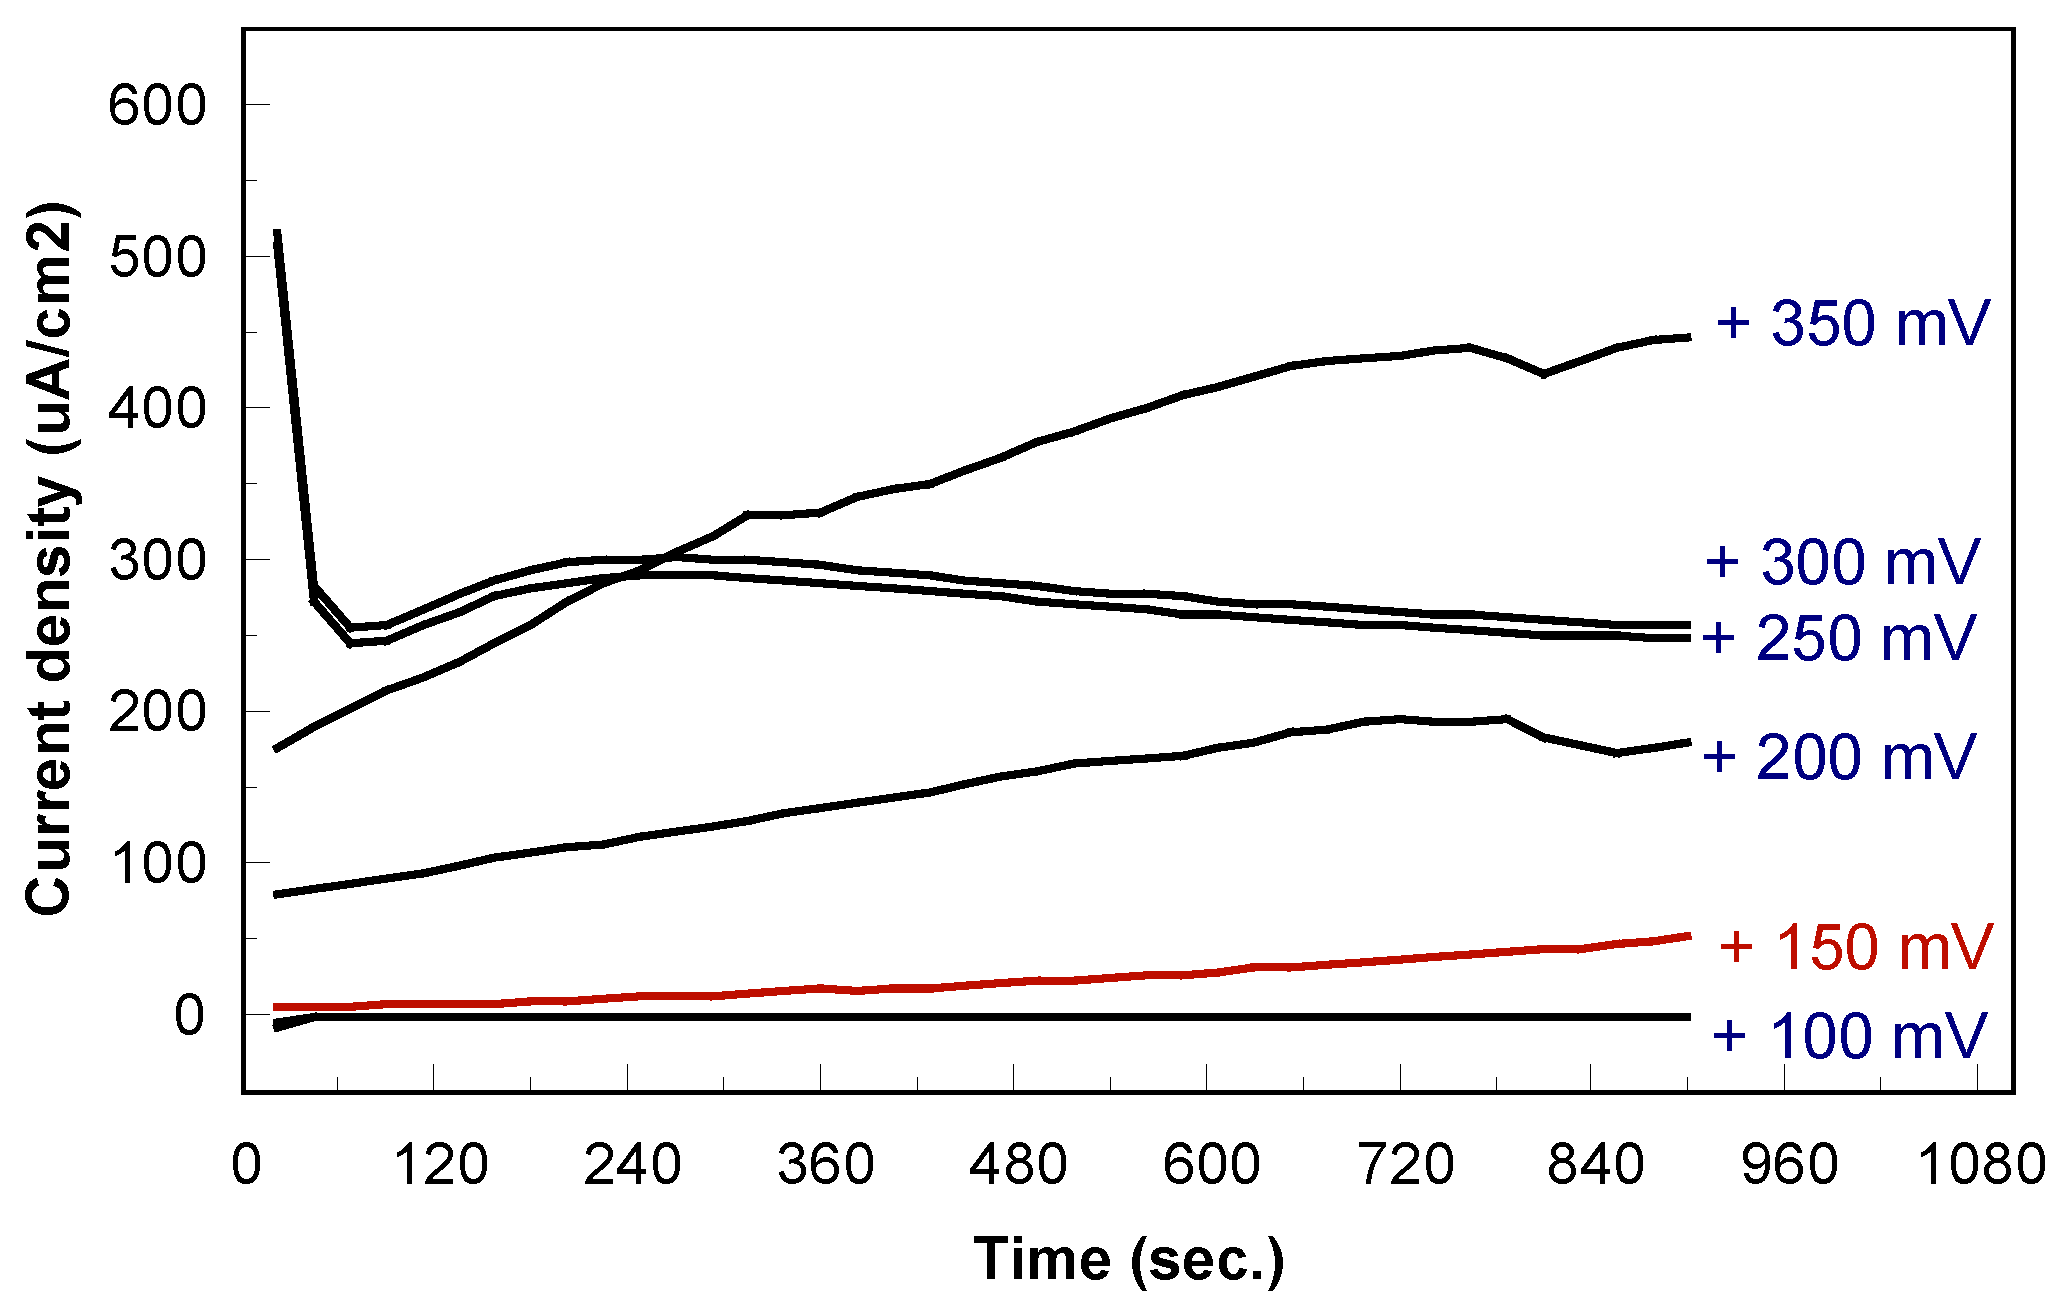
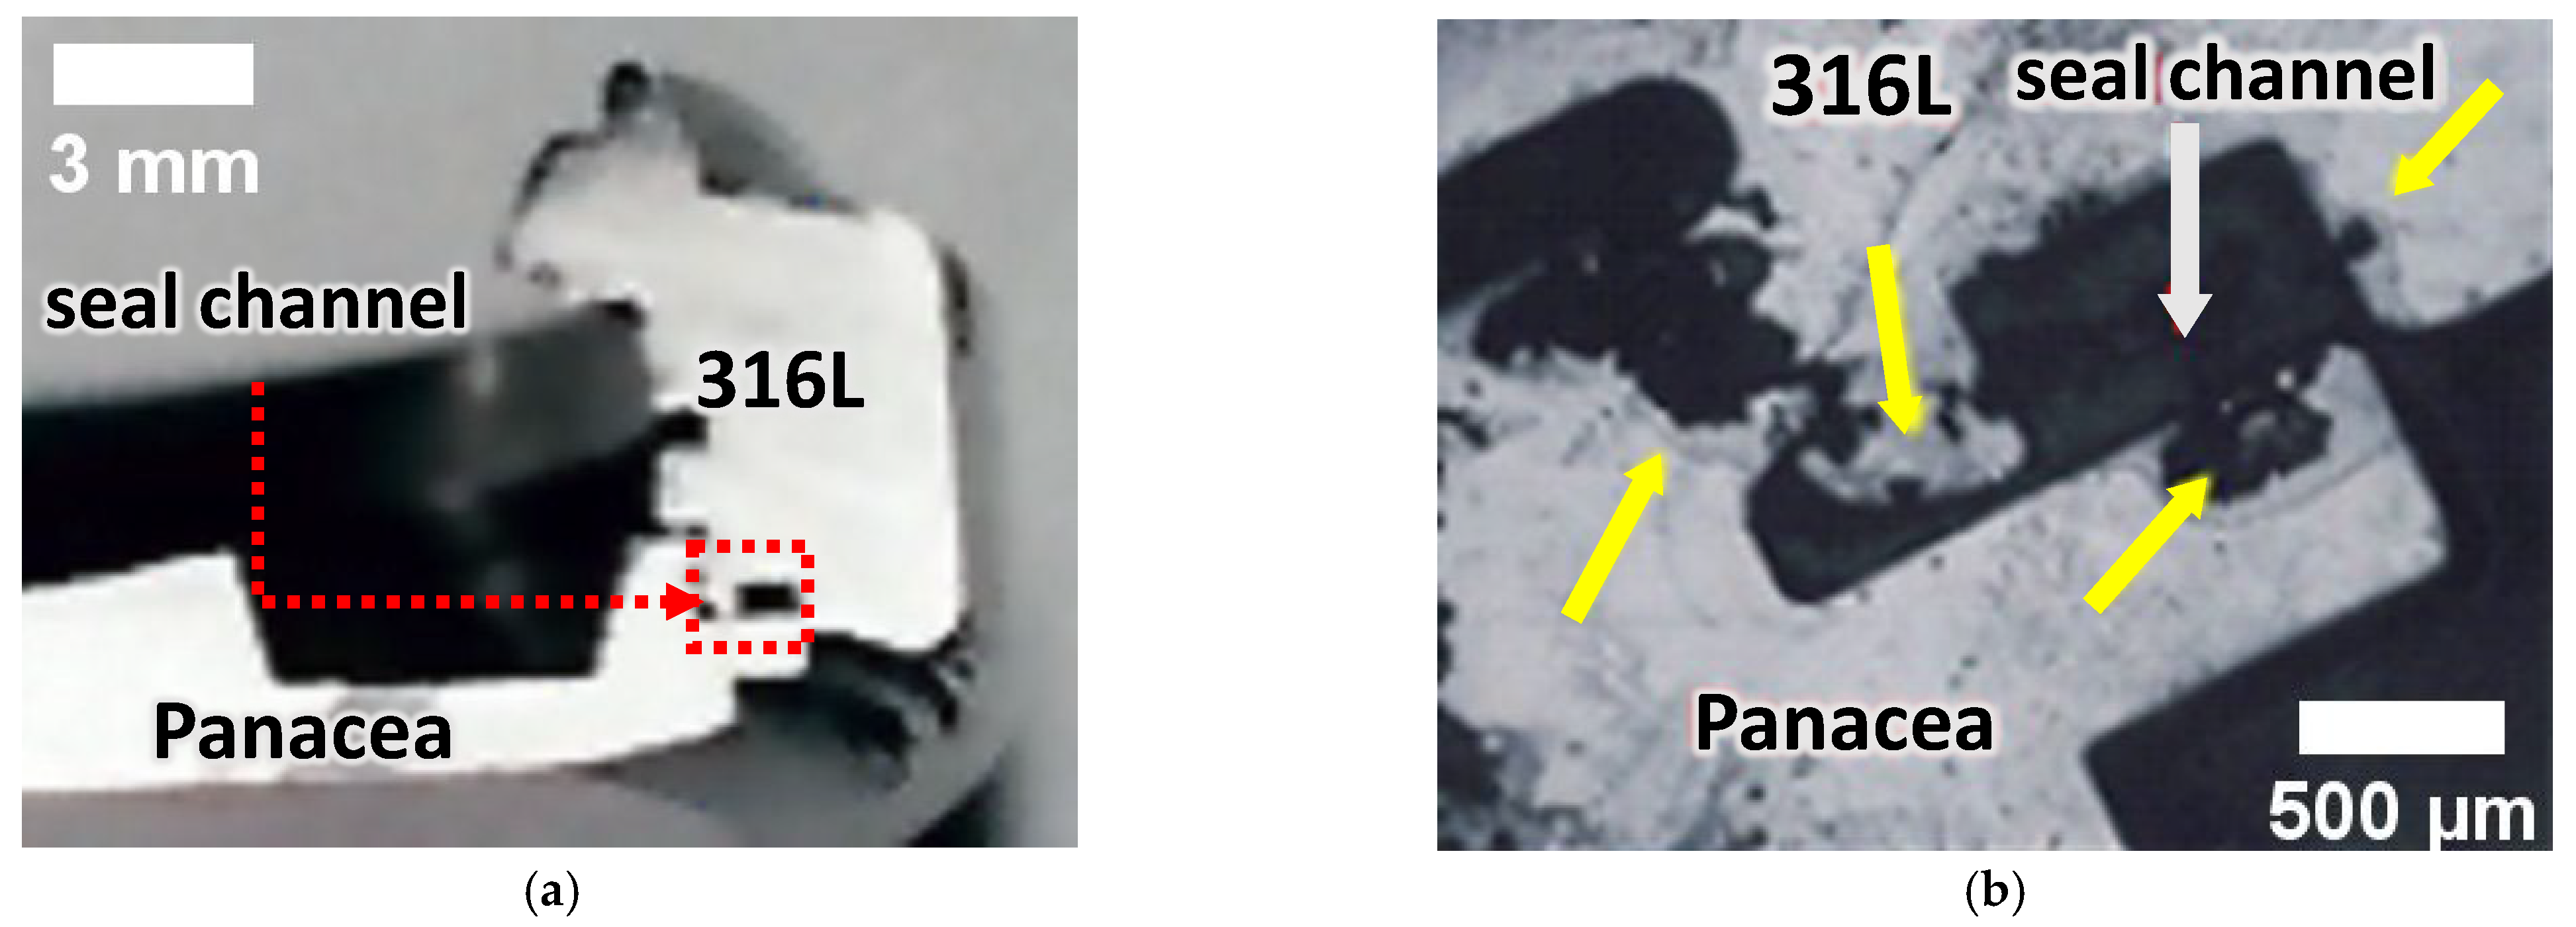
3.2. Crevice/Pitting Corrosion Evaluation

Figure 9 presents the current variation curves measured as a function of time for an imposed potential value for samples #1 316L and #2 Panacea®.
Thus, it can represent in a diagram for each imposed potential the values of the currents recorded during 15 min. According to the ASTM standard (ASTM F746-87 [31]), the crevice measurement test stops when a significant current fluctuation is generated in the anode zone.
The crevasse potential value is, therefore, equal to the value of the potential for which a measured current passes through the anode zone and increases rapidly, reduced by 50 mV. The crevasse potential values measured for all samples are presented in Table 6.
A watch case middle/bottom assembly fragment was coated in a resin and mirror polished (velvet fabric, 1 µm). The ASTM F746-87 simulation test was then carried out on it. The value of the electrical potential to initiate crevice corrosion of the assembly studied was +150 mV (Figure 10). After testing, the assembly was examined by light microscopy. The sample does not reveal any damage to the sealing channel. On the other hand, the crevice corrosion between the resin and the 316L part is noticed. So, the crevice corrosion started in the resin–metal interfaces. The corroded areas are indicated by yellow arrows in Figure 11b.
Austenitic stainless steels are the most used steels for manufacturing devices that come in contact with aggressive environments in various industries. Due to the formation of a stable passive layer on its surface, 316L stainless steel is one of the steel alloys with high corrosion resistance. Chromium is found in this steel in a quantity of 16%–19%, which favors the formation of a thin chromium oxide layer on the surface, increasing so the corrosion resistance and protection of the metal underneath [47]. It seems that based on pseudo-binary equilibrium diagrams at low temperatures, delta ferrite (δ) and sigma (σ) are the dominant phases, and at high temperatures, the austenitic phase is dominant. Moreover, it appears that the σ phase improves the resistance to pitting corrosion due to its tetragonal crystallographic system, even if this, together with the carbides, can decrease the mechanical properties and ductility in the temperature range 600–950 °C [48]. The 1.4435 austenitic stainless steel, also known as 316LMo, has a higher content of chromium, nickel, and molybdenum, and because of these elements, it is more resistant to corrosion than 316L.
In the case of aggregates made up of different materials, for example, link-pin, the interfaces often show gaps resulting from the geometry of the parts being assembled. Unfortunately, these cannot always be predicted and represents the principal cause of crevice corrosion. Once the electrolyte has entered the gap, the metal dissolves, forming metal ions. These metal ions, in the presence of a chlorinated medium, form metal chlorides which lead to the precipitation reaction of the hydroxides and the formation of free HCl acid. The confinement of the electrolyte within the crevice limits produces a decrease in dissolved oxygen and will thus create an electrochemical cell, due to the difference in oxygen concentrations of external surfaces–interstices. As the oxygen diffusion from the external environment is blocked, migration of chloride ions from the external environment will take place to maintain the neutrality of the charges. As a result, acidification with an increase in the concentration of chloride ions will occur. These cause the passive layer of the metal to dissolve and lead to an acceleration of the selective corrosion process. Acidification and an increase in the chloride ions concentration are the two essential factors in initiating and propagating the phenomenon of crevice corrosion.

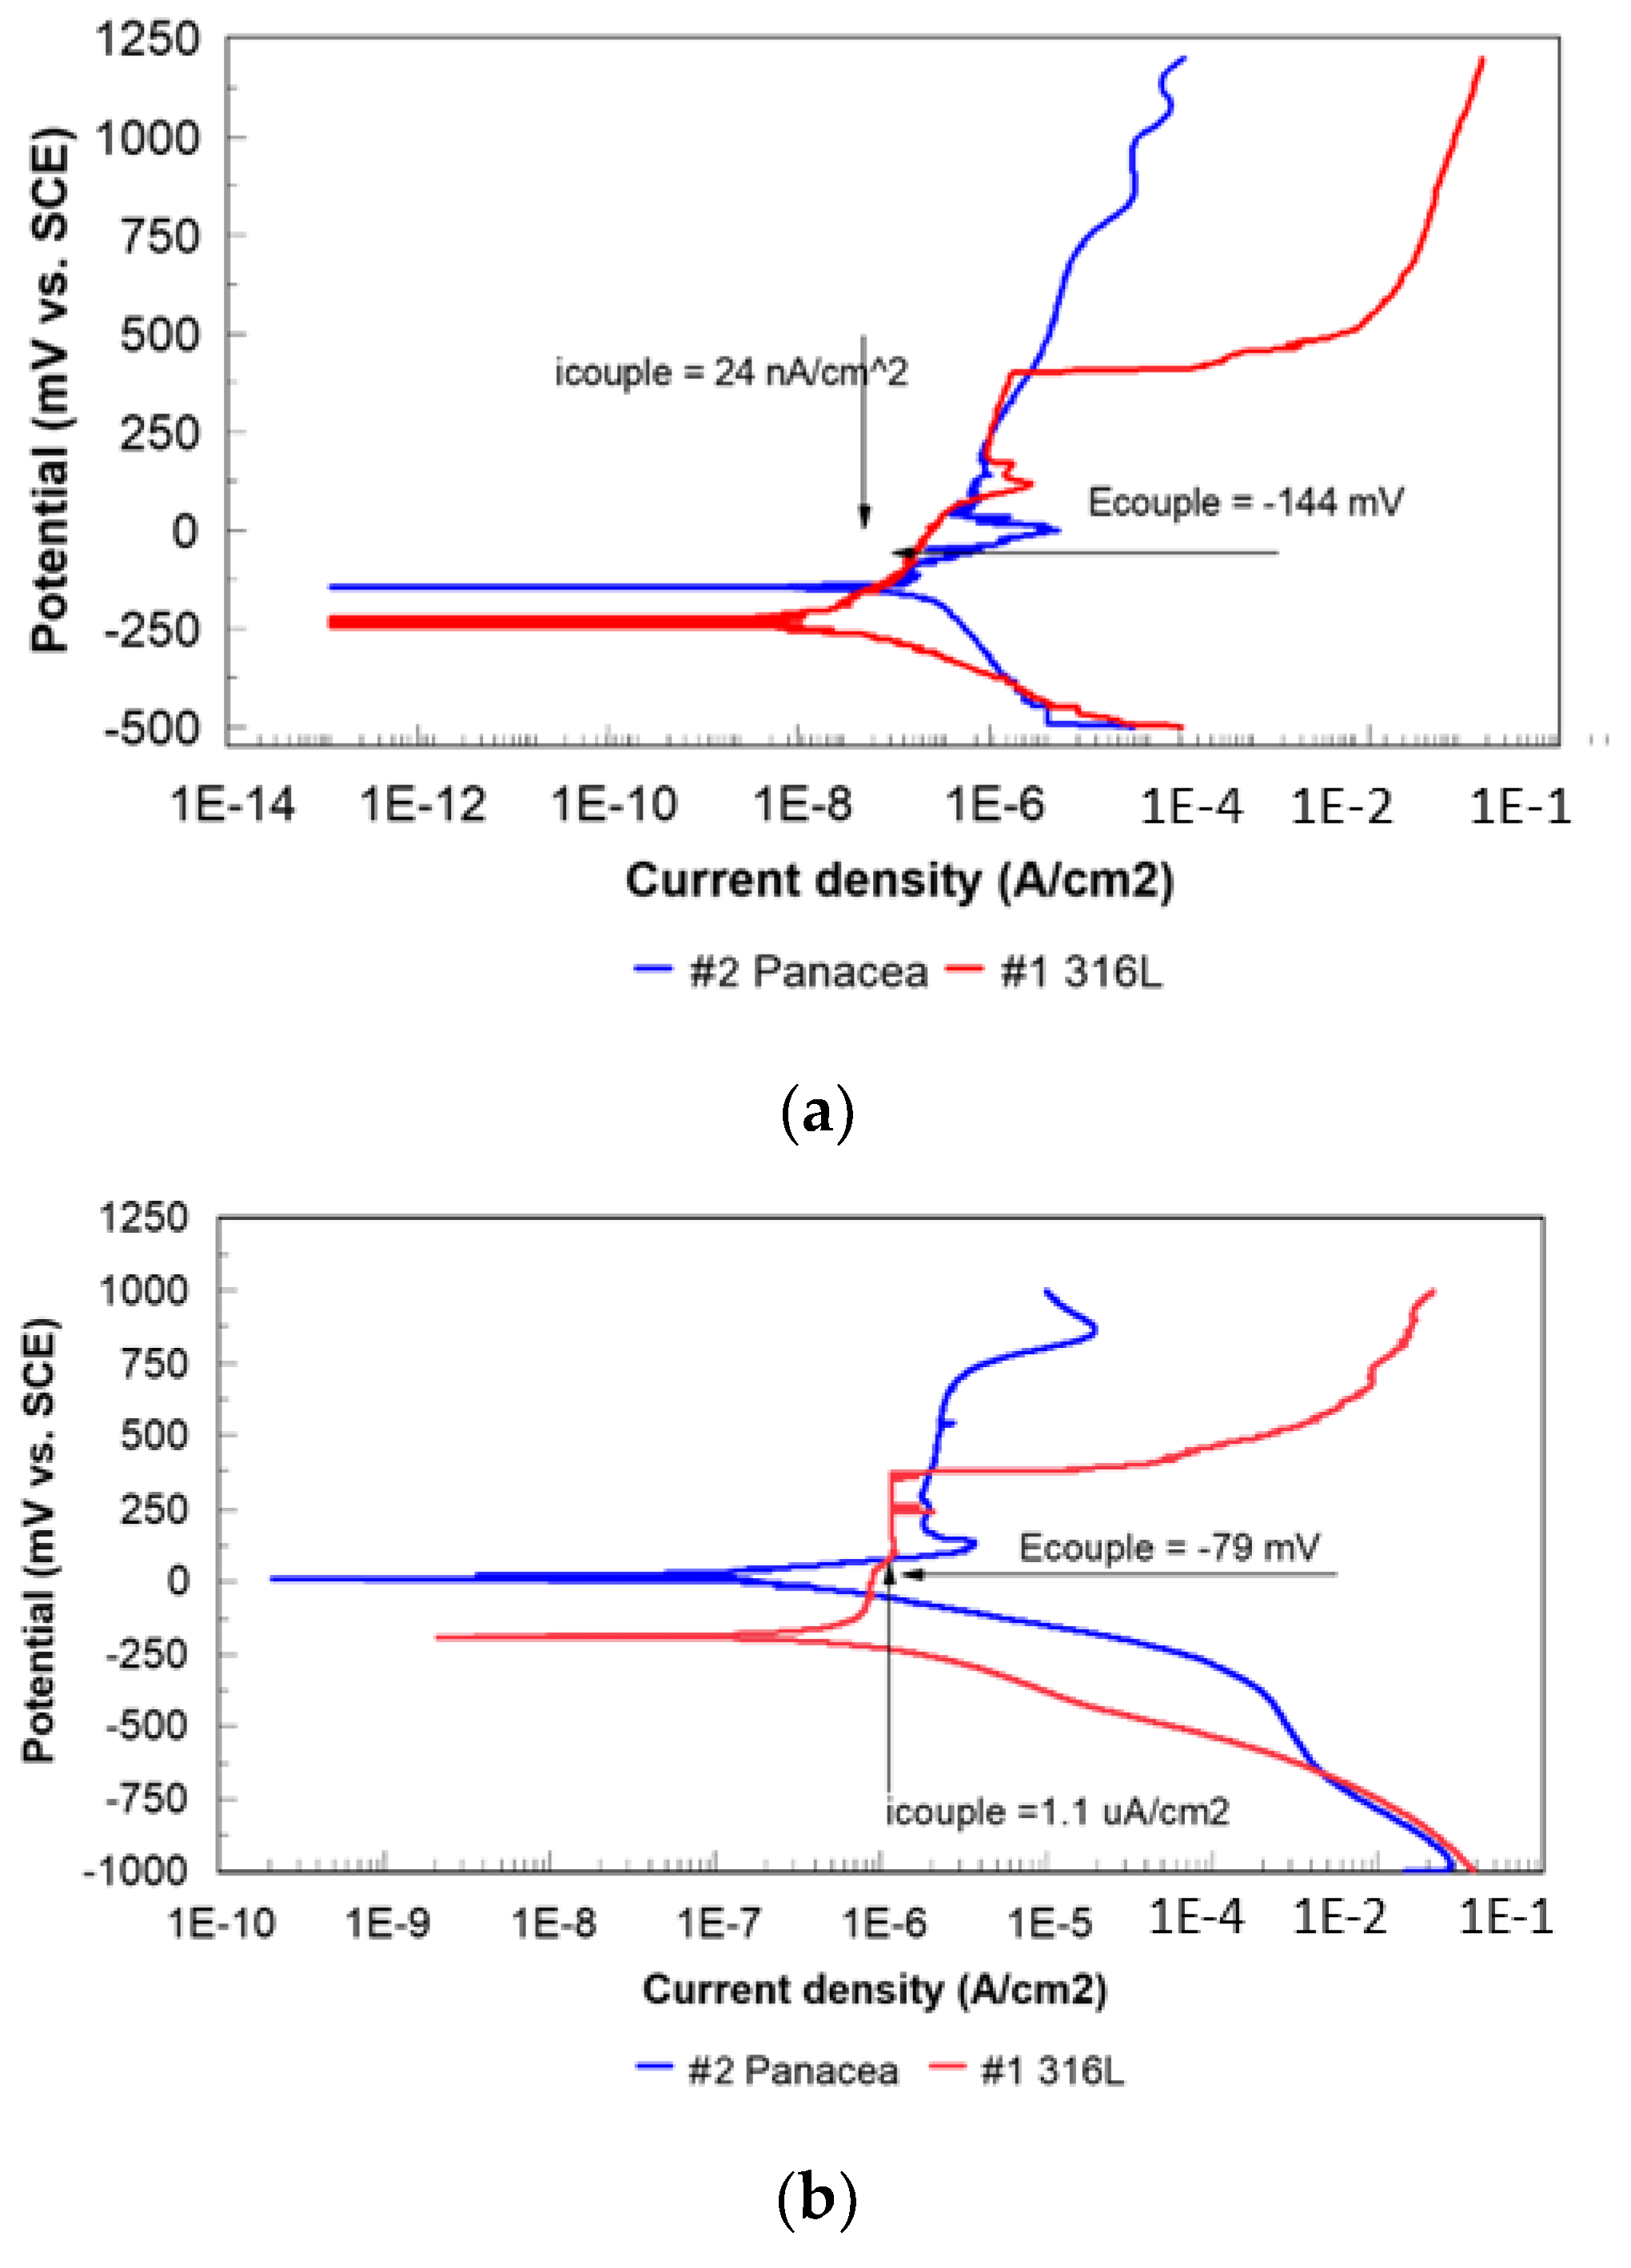
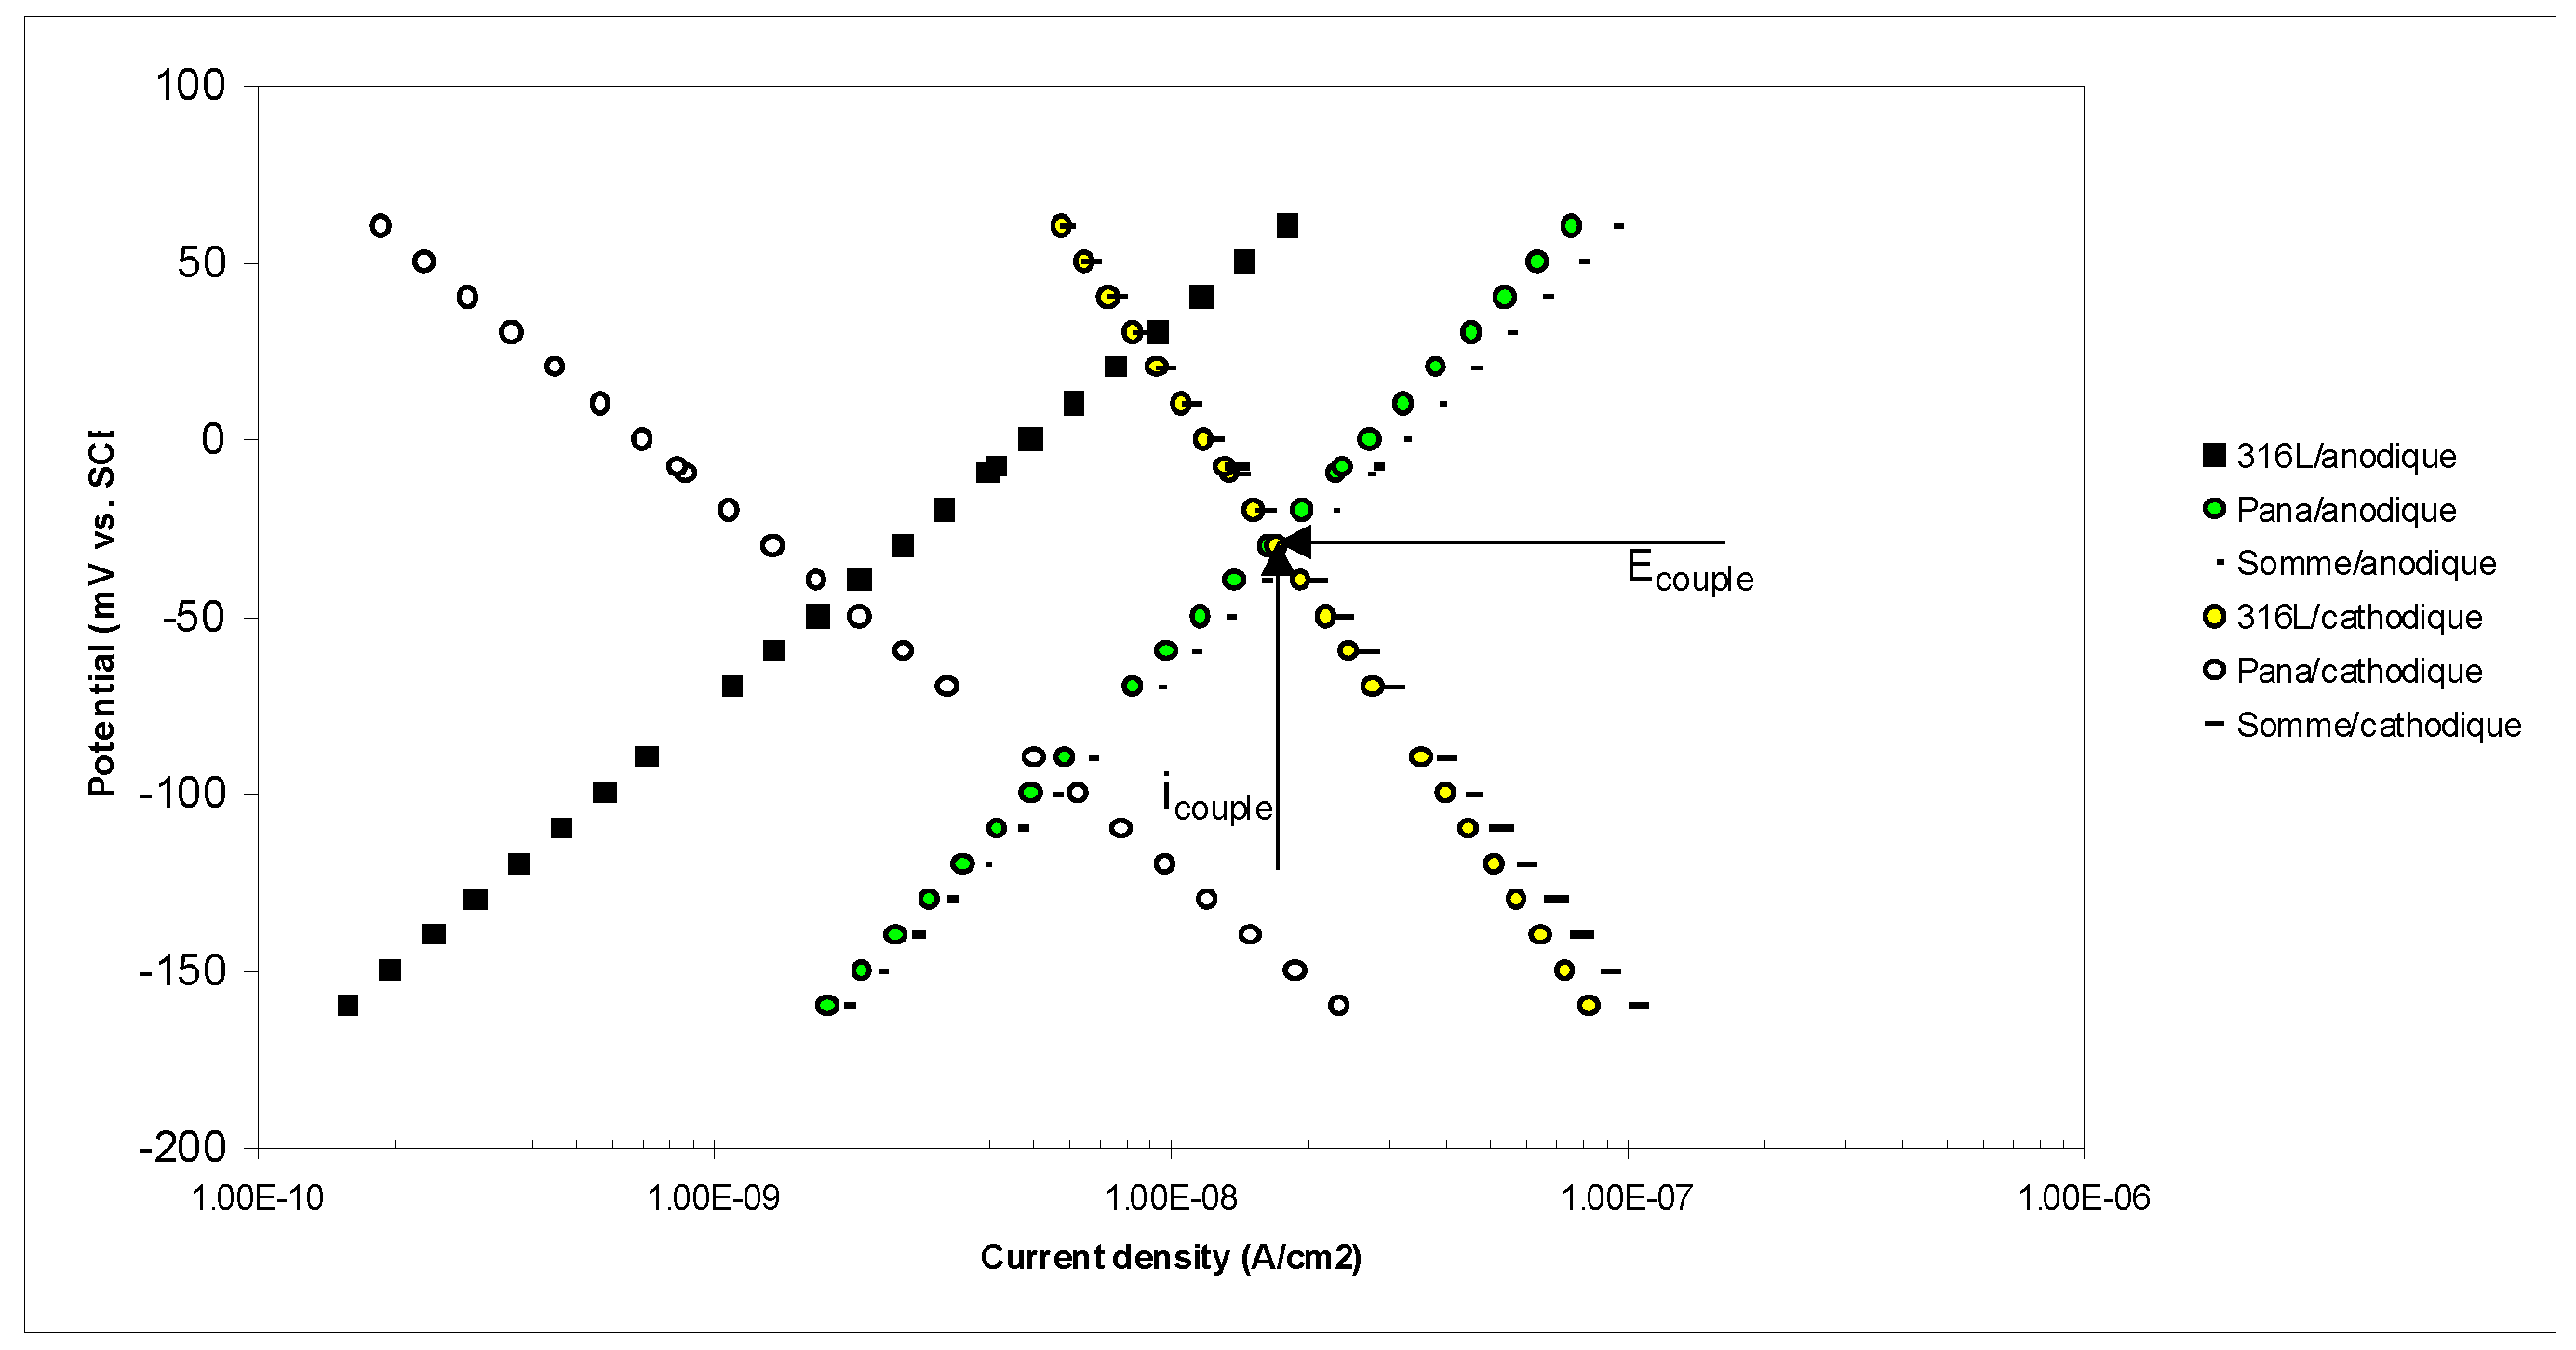
3.3. Galvanic Corrosion Evaluation

The rate of corrosion is higher in cases of significant difference in alloy nobility. This definition introduces two basic concepts: the different nature of the alloys in the galvanic coupling and their degree of nobility. When considering the concept of the difference between the degree of nobility, it would be interesting to consult the galvanic series to obtain an idea of the normal values of electrochemical potentials of the metals and to draw conclusions concerning their expected corrosion behavior. This reasoning is certainly interesting but is not sufficient, because these values were measured under standard conditions. The normal potential values can only illustrate a tendency and reveal nothing about the corrosion rate, nor the type of control of the galvanic cell (mixed, cathodic, or anodic).
A measurement of the electrical potentials of metals immersed in a considered electrolyte will give a more realistic indication of their respective tendency to corrosion, but their degree of effective degradation by corrosion will not be measured. This potential is not a metal characteristic (it is the case of the electrochemical potential). It depends on the experimental conditions, in particular on the concentration, the temperature, and the oxygen content of the electrolyte, but also on the surface conditions of the metal.
The higher the value of the potential, the more the metal or alloy will resist corrosion. It can be said that alloys with more negative potentials (anodic) will generally tend to be attacked by corrosion when they are galvanically coupled, while the other metal (cathode) will generally be preserved by the corrosion attack.
Practically, the further apart the alloys are in a galvanic series, the greater the difference between their potential will be and the stronger the corrosion of the most active metal (anode) will be. The corrosion potential of each alloy is a criterion for the analysis of galvanic corrosion behavior, which still remains incomplete.
All the results presented in this part are obtained from the tests made on the #1 316L–#2 Panacea® assembly.

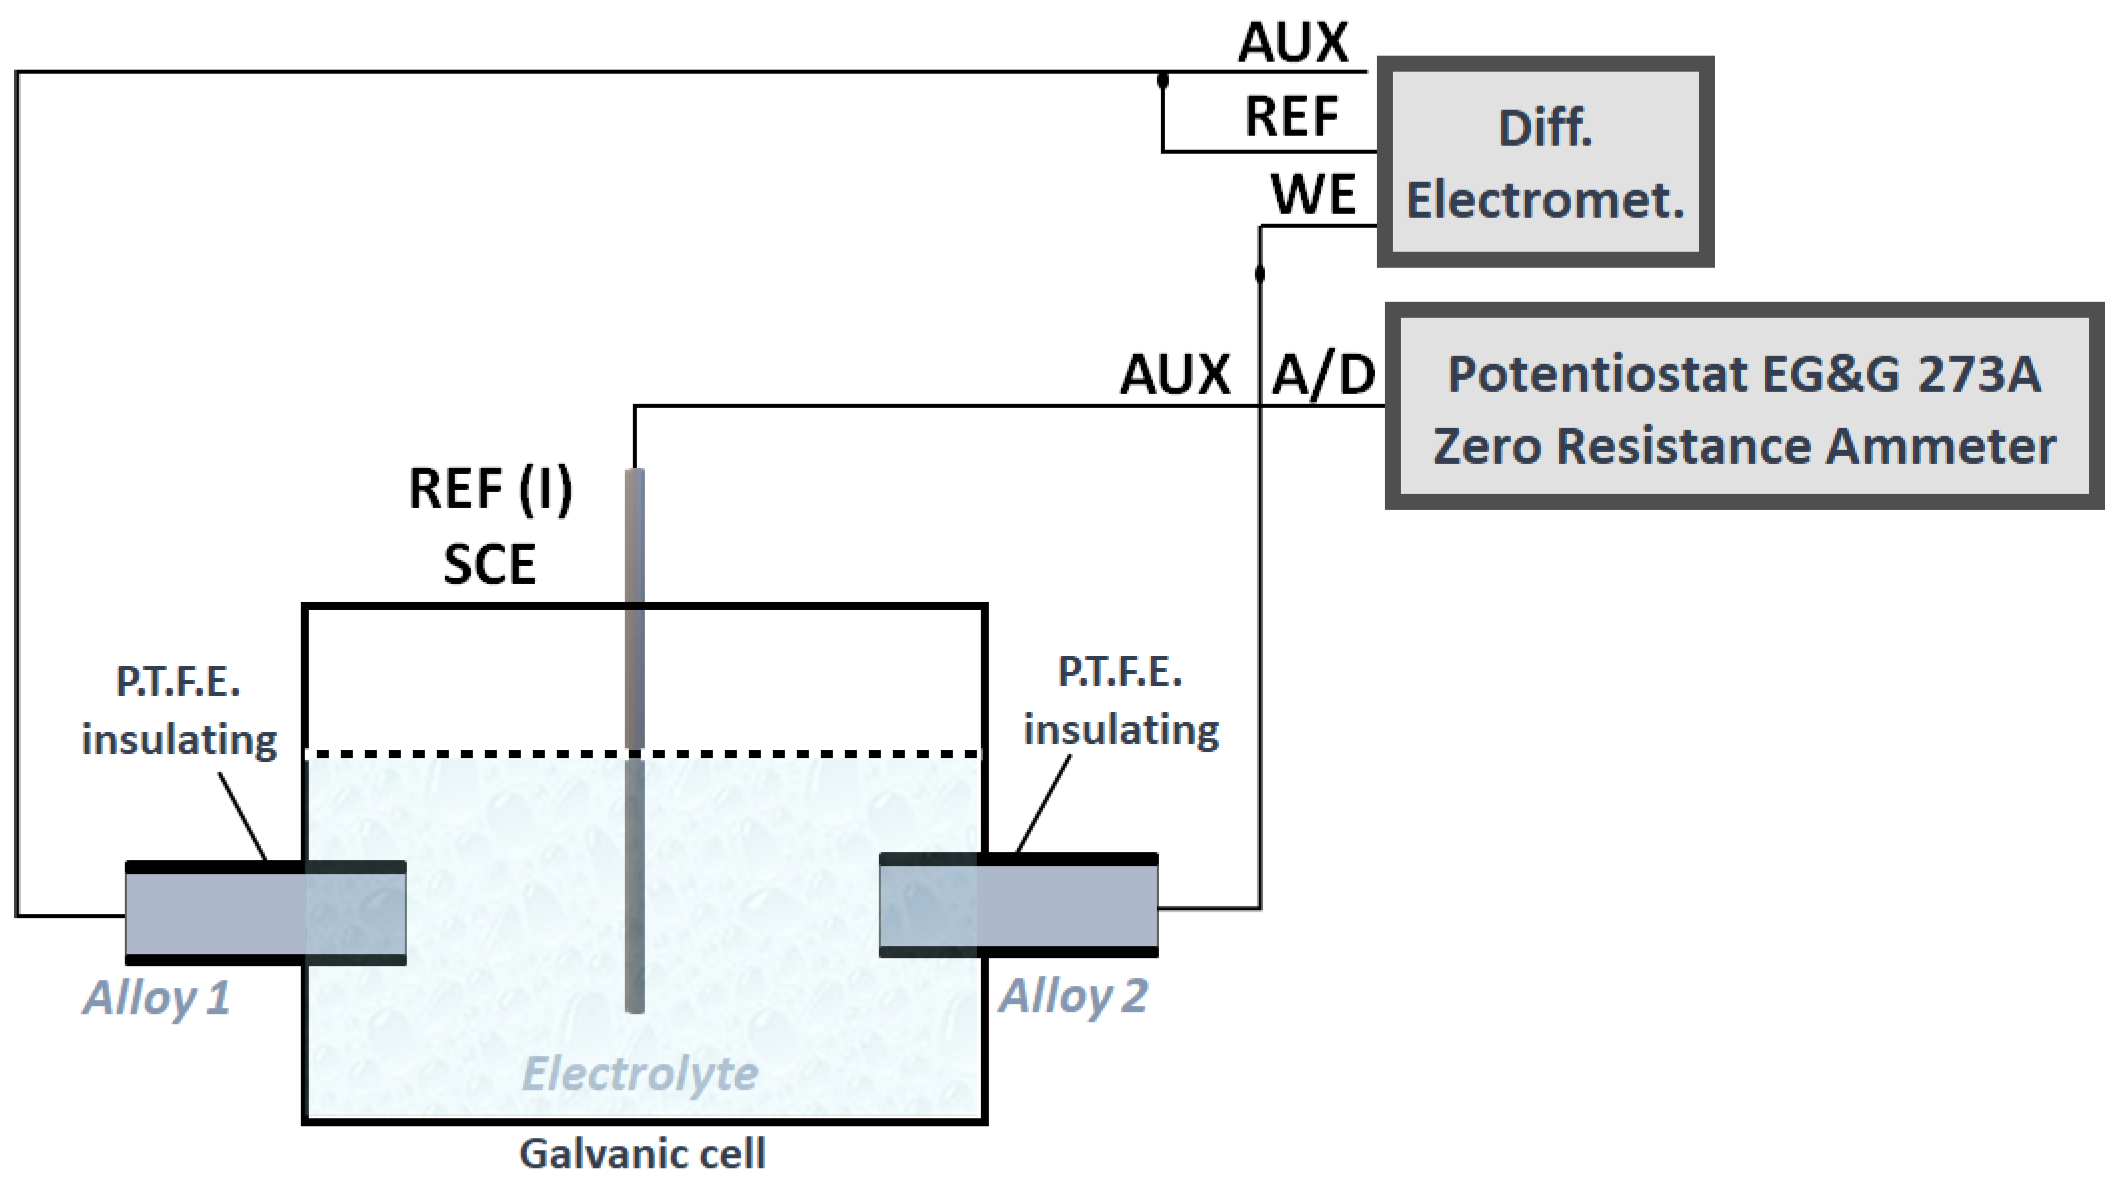
3.3.1. Direct Measurements

The Ecouple and icouple were measured in the following way: the samples of the two steels were positioned face to face at a distance of 5 cm in a glass cell designed specifically for this test (Figure 4 presents the electronic assembly).
The galvanic current recorded by direct measurement of the coupling is shown in Figure 12. The samples were immersed in the electrolyte for 24 h to establish a pseudo-stationary equilibrium of the electric potential at the metal surface. Then, an electrical coupling was carried out for 48 h. After an open circuit stage of 48 h, a new closed-circuit stage was carried out, so the total immersion time was 168 h. Note that the galvanic current increases with the coupling time. According to the mounting and positioning of the electrodes, the interpretation of the negative sign of the current reveals that steel #1 316L is in the anode position and steel #5 Panacea® is in the cathode position.
Table 7 presents the coupling potential values measured and obtained from the potentiodynamic polarization curves and by applying the mixed potential theory (Figures 14 and 15).

3.3.2. Indirect Measurements

From the potentiodynamic polarization curves
In Figure 13a, we present the potentiodynamic polarization curves of steels #1 316L and #2 Panacea® using fixed electrodes. The intersection of the anodic curve of 316L with the cathodic curve of Panacea® makes it possible to evaluate the Ecouple and icouple values, which are −144 mV and 24 nA/cm2. The plotting of polarization curves is made under the same measurement conditions.
After an immersion of 8 h, the potentiodynamic polarization curves are plotted under the same conditions as for the fixed electrodes. The results are shown in Figure 13b. An Ecouple at −79 mV and an icouple of 1.1 µA/cm2 were measured.
Galvanic coupling—evaluation using the mixed potential theory
If two or more metals are electrically in contact and form a bimetallic or multi-metal galvanic coupling, according to the theory, there will be at least a minimum of two cathodic and two anodic reactions. On each metal occurs one of each of these reactions. In this case, the nobler metal will be cathodic polarized in the electronegative direction, and its anodic rate of reaction will thus be suppressed. Conversely, the less noble or more sacrificial the metal, the more anodic material will be anodically polarized, and thus the anodic rate of reaction will be accelerated.
Thus, initially, the potentiodynamic polarization curves over a range of ±150 mV vs. SCE in the Tafel domain were plotted. Secondly, the anodic and cathodic Tafel slopes are calculated from the plotted polarization curves by using the Stern–Geary equations and PARCalc software, as follows:
χ2 = {[(∑ (Iobs, i − Icalc, i)/si]2}/(N − 4)}
The slopes I(E) = Icorr 10 (E-Ecorr)/ba and (E) = Icorr 10 (E-Ecorr)/bc are then plotted (where ba and bc are the Tafel slopes calculated with PARCalc).
In agreement with the mixed potential theory, it is necessary to sum the two anodic slopes (#1 316L+ #2 Panacea®) and then the two cathodic slopes (#2 316L+ #2 Panacea®). The intersection of the sum anodic slope with the sum cathodic slope is the theoretical value of the icouple and Ecouple. Figure 14 presents the coupling diagram for 316L-Panacea® steels.
The potentials and currents couplings (Ecouple, icouple) determined by different techniques are presented in Table 7.
All techniques studied reveal a weak galvanic coupling current (Table 5). From this point of view, the watch case middle (1.4435 steel) and bottom (Panacea® steel) assembly are entirely possible. In a weak galvanic process, another problem can arise if the crevasse potential is in the range of the galvanic coupling potential. To solve this problem, it was necessary to proceed as follows: recording the open-circuit potential for 12 h of the case middle and bottom assembly with the sealing channel open to the electrolyte (Figure 15) and then performing crevice corrosion tests (ASTM F746-87 [33] (Figure 10b).
The open circuit potential variation as a function of time, therefore, remains positive in the cathodic domain, which means that the assembly tested presents a good corrosion resistance.
According to the ASTM F746-87 simulation test, the electrical potential value to start crevice corrosion of the assembly studied is +150 mV (Figure 9b and Table 3). After the test, the assembly was examined by optical microscopy (Figure 11b). The sample did not reveal any damage to the sealing channel. On the other hand, crevice corrosion between the resin and the 316L part was noticed. So, the crevice corrosion started in the resin/metal interfaces. It can therefore be concluded that the risk of initiating crevice corrosion in the case back/middle channel is unlikely.
Nielsen–Tuccillo test
After 15 days of testing on the Nielsen–Tuccillo equipment at 30 °C in artificial sweat EN 1811, no visible degradation was observed at low magnification. Indeed, the case middle in #1 316L, as well as the bottom in #2 Panacea®, did not show pitting corrosion on the surfaces. The seal channel, open to the penetration of the electrolyte during the test, does not show any trace of corrosion.

3.4. Cations Release

The extraction test results are presented in Table 8. The nickel released quantities from the steel “#1 316L watchmaking applications” are low. It can be said that the amounts released are typical of a 316L Med medical alloy. Traces of nickel are also found in the extracts of #2 Panacea®. The values presented in Table 8 are the average values of the four samples tested. The maximum limit accepted according to current legislation is 0.5 µg/cm2 per week.
Cations extractions from an artificial sweat electrolyte describe in EN 1811. Although the nickel dosed is <4 µg/L, our interest was also to know the released quantities of the other chemical elements constituent the Panacea® steel and to answer the question “what is the effect of work hardening compared to the raw steel in cations released quantities?”. The extraction tests are carried out on three samples (Table 9). In this sense, the results are not very usable, but on the other hand, distinctions can be made between the quantities released by groups of chemical elements. In ascending order of release, we find elements such as Cu, Al, Ni, and Sr that are at a concentration below the detection limit, and then Ti and Ba at the same concentration as the blank electrolyte, followed by Mo, which has a concentration lower. The Cr concentration was measured in tens of µg/L, and the last group with Fe and Mn was measured in hundreds of µg/L released. A question that arises is related to their toxicity effect in contact with skin. We did not find information on this subject in the specialized literature.
This type of assembly is also favorable from the point of view of nickel release. Measurements of nickel release from Panacea® and 316L reveal quantities of nickel released that are low at 0.1 µg/cm2 per week, lower than current European legislation.

4. Conclusions

All electrochemical and galvanic current prediction measurements show low corrosion current values. In the galvanic coupling, the cathode was Panacea®, and the anode was 316L alloy.
The simulation of the crevice corrosion test does not show any corrosion process in the seal channel.
This observation was confirmed by the Nielsen–Tuccillo test in which, after 15 days of testing, no deterioration was observed in the case middle (316L steel) and bottom (Panacea®) interfaces.
All the tests allow us to conclude that such an assembly is possible from the point of view of corrosion resistance.
This type of assembly is also favorable from the point of view of nickel release. The quantities of nickel released from Panacea® and 316L alloy are significantly lower than those required by the current European legislation.

Author Contributions

Conceptualization, L.R.; methodology, L.R.; validation, L.R.; formal analysis, L.R.; investigation, L.R.; resources, L.R.; data curation, L.R.; writing—original draft preparation, L.R. and F.I., writing—review and editing, L.R., F.I., D.M.V. and C.M.C.; funding acquisition, L.R., C.M.C. All authors have read and agreed to the published version of the manuscript.

Funding

This research received no external funding.

Conflicts of Interest

The authors declare no conflict of interest.

References

  1. Heim, K.; Basketter, D. Metal Exposure Regulations and Their Effect on Allergy Prevention. In Metal Allergy; Springer International Publishing: Cham, Switzerland, 2018; pp. 39–54. [Google Scholar]
  2. European Parliament and Council Directive 94/27/EC of 30 June 1994 Amending for the 12th Time Directive 76/769/EEC on the Approximation of the Laws, Regulations and Administrative Provisions of the Member States Relating to Restrictions on the Marketing and Use of Certain Dangerous Substances and Preparations. 1994. Available online: https://op.europa.eu/en/publication-detail/-/publication/0a5a20d2-063e-4892-b94d-d82c9b223de0/language-en (accessed on 15 March 2023).
  3. Suisse, H. Horlogerie Suisse et Mondiale en 2018 Exportations Horlogeres Suisses Principaux Marches. 2018. Available online: https://www.fhs.swiss/file/59/Horlogerie_2018.pdf (accessed on 15 March 2023).
  4. Commission Communication in the Framework of the Implementation of Regulation (EC) No 1907/2006 of the European Parliament and of the Council Concerning the Registration, Evaluation, Authorisation and Restriction of Chemicals (REACH). Off. J. Eur. Union 2012, 520. Available online: https://eur-lex.europa.eu/legal-content/EN/TXT/PDF/?uri=CELEX:32016R0863 (accessed on 15 March 2023).
  5. Belsito, D.V. The Diagnostic Evaluation, Treatment, and Prevention of Allergic Contact Dermatitis in the New Millennium. J. Allergy Clin. Immunol. 2000, 105, 409–420. [Google Scholar] [CrossRef] [PubMed]
  6. Liden, C. Nickel in Jewellery and Associated Products. Contact Dermat. 1992, 26, 73–75. [Google Scholar] [CrossRef]
  7. Baker, M. European Standards Developed in Support of the European Union Nickel Directive. In Metal Allergy; Springer International Publishing: Cham, Switzerland, 2018; pp. 23–29. [Google Scholar]
  8. DIN EN 1811 Reference Test Method for Release of Nickel from All Post Assemblies Which Are Inserted into Pierced Parts of the Human Body and Articles Intended to Come into Direct and Prolonged Contact with the Skin (Includes Amendment A1:2015). 2015. Available online: https://standards.iteh.ai/catalog/standards/cen/41a5da69-b1e3-43b5-ae8d-89b8f0688f1a/en-1811-2011a1-2015 (accessed on 15 March 2023).
  9. Reclaru, L.; Ardelean, L.C. Corrosion Susceptibility and Allergy Potential of Austenitic Stainless Steels. Materials 2020, 13, 4187. [Google Scholar] [CrossRef]
  10. Reclaru, L.; Unger, R.E.; Kirkpatrick, C.J.; Susz, C.; Eschler, P.-Y.; Zuercher, M.-H.; Antoniac, I.; Lüthy, H. Ni–Cr Based Dental Alloys; Ni Release, Corrosion and Biological Evaluation. Mater. Sci. Eng. C 2012, 32, 1452–1460. [Google Scholar] [CrossRef] [PubMed]
  11. F04.12 ASTM F799-19; Standard Specification for Cobalt-28 Chromium-6 Molybdenum Alloy Forgings for Surgical Implants (UNS R31537, R31538, R31539). Subcommittee: West Conshohocken, PA, USA, 2019; pp. 1–4.
  12. F04.12 ASTM F1537; 11 Standard Specification for Wrought Cobalt-28Chromium-6Molybdenum Alloys for Surgical Implants (UNS R31537, UNS R31538, and UNS R31539). Subcommittee: West Conshohocken, PA, USA, 2011; pp. 1–4.
  13. Li, H.; Jiang, Z.; Zhang, Z.; Yang, Y. Effect of Grain Size on Mechanical Properties of Nickel-Free High Nitrogen Austenitic Stainless Steel. J. Iron Steel Res. Int. 2009, 16, 58–61. [Google Scholar] [CrossRef]
  14. Thomann, U.I.; Uggowitzer, P.J. Wear–Corrosion Behavior of Biocompatible Austenitic Stainless Steels. Wear 2000, 239, 48–58. [Google Scholar] [CrossRef]
  15. Li, H.; Jiang, Z.; Zhang, Z.; Xu, B.; Liu, F. Mechanical Properties of Nickel Free High Nitrogen Austenitic Stainless Steels. J. Iron Steel Res. Int. 2007, 14, 330–334. [Google Scholar] [CrossRef]
  16. Uggowitzer, P.J.; Magdowski, R.; Speidel, M.O. High Nitrogen Steels. Nickel Free High Nitrogen Austenitic Steels. ISIJ Int. 1996, 36, 901–908. [Google Scholar] [CrossRef]
  17. Siredey-Schwaller, N.; Charbonnier, P.; Zhang, Y.; Guyon, J.; Perroud, O.; Laheurte, P. Secondary Hardening of a High-N Ni-Free Stainless Steel. Materials 2022, 15, 7505. [Google Scholar] [CrossRef]
  18. Reed, R.P. Nitrogen in Austenitic Stainless Steels. JOM 1989, 41, 16–21. [Google Scholar] [CrossRef]
  19. Yang, K.; Ren, Y. Nickel-Free Austenitic Stainless Steels for Medical Applications. Sci. Technol. Adv. Mater. 2010, 11, 014105. [Google Scholar] [CrossRef] [PubMed]
  20. Montanaro, L.; Cervellati, M.; Campoccia, D.; Arciola, C.R. Promising in Vitro Performances of a New Nickel-Free Stainless Steel. J. Mater. Sci. Mater. Med. 2006, 17, 267–275. [Google Scholar] [CrossRef]
  21. Weiss, S.; Meissner, A.; Fischer, A. Microstructural Changes within Similar Coronary Stents Produced from Two Different Austenitic Steels. J. Mech. Behav. Biomed. Mater. 2009, 2, 210–216. [Google Scholar] [CrossRef] [PubMed]
  22. Yang, K.; Ren, Y.; Wan, P. High Nitrogen Nickel-Free Austenitic Stainless Steel: A Promising Coronary Stent Material. Sci. China Technol. Sci. 2012, 55, 329–340. [Google Scholar] [CrossRef]
  23. Talha, M.; Behera, C.K.; Sinha, O.P. A Review on Nickel-Free Nitrogen Containing Austenitic Stainless Steels for Biomedical Applications. Mater. Sci. Eng. C 2013, 33, 3563–3575. [Google Scholar] [CrossRef] [PubMed]
  24. Berns, H.; Gavriljuk, V.G. Highly Resistant Austenitic Stainless Steel. EPO Patent EP1786941B1, 1 December 2010. pp. 1–13. [Google Scholar]
  25. Speidel, M.O.; Uggowitzer, P.J. Use of a Biocompatible Alloy Suitable for the Skin. EPO Patent EP0875591B1, 23 August 2000. pp. 1–7. [Google Scholar]
  26. Sun, S.; Ren, Z.; Yan, X.; Wang, Y.; Ding, G.; Zu, G.; Gong, W.; Jin, S.; Cui, X. Preparation Method of Medical High-Nitrogen Nickel-Free Austenitic Stainless Steel with Dispersion Strengthening and High. Stability. Patent CN113088652A, 9 July 2021. pp. 1–16. [Google Scholar]
  27. Hwang, B.; Lee, T. C+N Austenitic Stainless Steel Having Good Low-Temperature Toughness and a Fabrication Method Thereof. U.S. Patent 13/707,699, 13 June 2013. pp. 1–12. [Google Scholar]
  28. Porret, J.; Lankert, G.; Carozzani, T. Nickel-Free Austenitic Stainless. Steel. Patent JP6435297B2, 30 March 2017. pp. 1–20. [Google Scholar]
  29. Iorio, L.; Cortie, M.; Jones, R. Technical Note: Solubility of Nitrogen in Experimental Low-Nickel Austenitic Stainless Steels. J. S. Afr. Inst. Min. Metall. 1994, 94, 173–177. [Google Scholar]
  30. Shi, F.; Zhang, X.; Li, T.; Guan, X.; Li, X.; Liu, C. Effects of Nitrogen Content and Strain Rate on the Tensile Behavior of High-Nitrogen and Nickel-Free Austenitic Stainless Steel. Crystals 2023, 13, 129. [Google Scholar] [CrossRef]
  31. ISO 9227:2022; Corrosion Tests in Artificial Atmospheres—Salt Spray Tests. International Organization for Standardization: Geneva, Switzerland, 2022; pp. 1–23.
  32. PX PRECIMET SA Technical Specification 316L (DIN 1.4435). Available online: https://pxgroup.com/sites/default/files/316L1.4435.pdf (accessed on 15 March 2023).
  33. ASTM F746-87(1999); Standard Test Method for Pitting or Crevice Corrosion of Metallic Surgical Implant Materials. ASTM International: West Conshohocken, PA, USA, 1999; pp. 1–6.
  34. ASTM G71-81(2019); Standard Guide for Conducting and Evaluating Galvanic Corrosion Tests in Electrolytes. ASTM International: West Conshohocken, PA, USA, 2019; pp. 1–5.
  35. ASTM G82-98(2021)E1; Standard Guide for Development and Use of a Galvanic Series for Predicting Galvanic Corrosion Performance. ASTM International: West Conshohocken, PA, USA,, 2021; pp. 1–7.
  36. Baboian, R. Electrochemical Tehniques for Predicting Galvanic Corrosion. In Galvanic and Pitting Corrosion—Field and Laboratory Studies, STP41394S; Baboian, R., France, W.D., Rowe, L., Jr., Rynewicz, J.F., Eds.; American Society for Testing and Materials: Cockeysville, MD, USA, 1976; Volume STP 576, pp. 5–20. [Google Scholar]
  37. Baboian, R. Electrochemical Techniques for Corrosion: Symposium on Electrochemical Techniques for Corrosion at the NACE Corrosion/76 Meeting Held in Houston, Texas; Baboian, R., Ed.; NACE, National Association of Corrosion Engineers: Houstan, TX, USA, 1976. [Google Scholar]
  38. Mansfeld, F.; Kenkel, J. Laboratory Studies of Galvanic Corrosion of Aluminum Alloys, STP41395S. In Galvanic and Pitting Corrosion—Field and Laboratory Studies; Baboian, R., France, W.D., Rowe, L., Jr., Rynewicz, J.F., Eds.; American Society for Testing and Materials: Cockeysville, MD, USA, 1976; Volume STP 576, pp. 20–48. [Google Scholar]
  39. Wagner, C.V.; Traud, W.Z. Uber die Deutung von Korrosionsvorgangen durch Uberlagerung von elektrochemischen Teilvorgangen und uber die Potentialbildung an Mischeelectroden. Z. Elektrochem. Angew. Phys. Chem. Elektrochem. 1938, 44, 391–454. [Google Scholar]
  40. Hack, H.P. Evaluation of Galvanic Corrosion. In Metals Handbook: Corrosion; Korb, L.J., Olson, D.L., Eds.; ASM International: Novelty, OH, USA, 1987; Volume 13, pp. 234–238. [Google Scholar]
  41. Tuccillo, J.J.; Nielsen, J.P. Observations of Onset of Sulfide Tarnish on Gold-Base Alloys. J. Prosthet. Dent. 1971, 25, 629–637. [Google Scholar] [CrossRef]
  42. Reclaru, L. Sensitization to Corrosion of Austenitic Stainless Steels: Watch Straps Intended to Come into Direct and Prolonged Contact with Skin. Coatings 2022, 13, 18. [Google Scholar] [CrossRef]
  43. Mansfeld, F. The Polarization Resistance Technique for Measuring Corrosion Currents. In Advances in Corrosion Science and Technology; Fontana, M.G., Staehle, R.W., Eds.; Springer: Boston, MA, USA, 1976; pp. 163–262. ISBN 978-1-4684-8988-0. [Google Scholar]
  44. Peguet, L.; Malki, B.; Baroux, B. Influence of Cold Working on the Pitting Corrosion Resistance of Stainless Steels. Corros. Sci. 2007, 49, 1933–1948. [Google Scholar] [CrossRef]
  45. Tandon, V.; Patil, A.P.; Rathod, R.C. Correlation of Martensite Content and Dislocation Density of Cold Worked 316L on Defect Densities of Passivating Film in Acidic Environment. Mater. Res. Express. 2018, 5, 086515. [Google Scholar] [CrossRef]
  46. Tandon, V.; Patil, A.P. On the Influence of Cold Working and Electrochemical Nitridation on the Corrosion Behaviour of 316L Austenitic Stainless Steel in Acidic Environment. Surf. Eng. Appl. Electrochem. 2020, 56, 63–70. [Google Scholar] [CrossRef]
  47. Salarvand, V.; Sohrabpoor, H.; Mohammadi, M.A.; Nazari, M.; Raghavendra, R.; Mostafaei, A.; Brabazon, D. Microstructure and Corrosion Evaluation of As-Built and Heat-Treated 316L Stainless Steel Manufactured by Laser Powder Bed Fusion. J. Mater. Res. Technol. 2022, 18, 4104–4113. [Google Scholar] [CrossRef]
  48. Sohrabpoor, H.; Salarvand, V.; Lupoi, R.; Chu, Q.; Li, W.; Aldwell, B.; Stanley, W.; O’Halloran, S.; Raghavendra, R.; Choi, C.-H.; et al. Microstructural and Mechanical Evaluation of Post-Processed SS 316L Manufactured by Laser-Based Powder Bed Fusion. J. Mater. Res. Technol. 2021, 12, 210–220. [Google Scholar] [CrossRef]
Figure 1. Assembly of watch case middle and bottom.
Coatings 13 00943 g001
Figure 2. The electrochemical assembly and the electrochemical measuring cell.
Coatings 13 00943 g002
Figure 3. Crevice corrosion test assembly (a) and its marks on a tested sample (b).
Coatings 13 00943 g003
Figure 4. Electrochemical assembly for the study of galvanic couplings.
Coatings 13 00943 g004
Figure 5. Test sample for galvanic corrosion and crevice to crevice. The electrolyte enters the seal channel (red arrow).
Coatings 13 00943 g005
Figure 6. Potentiodynamic polarization curves for #1 316L and #2 Panacea® steels; artificial sweat test medium, 37 °C; and measurement technique was rotating electrode, 300 rpm.
Coatings 13 00943 g006
Figure 7. Potentiodynamic polarization curves of #1 316L and #2 Panacea® steels studied in the current range −20 to 20 µA/cm2. Test medium was artificial sweat at 37 °C; rotating electrode technique, rotation speed 300 rpm.
Coatings 13 00943 g007
Figure 8. Potentiodynamic polarization curves for steels #3 P280HV, #4 P427HV, and #5 P510HV; artificial sweat test medium, 37 °C; and measurement technique was rotating electrode, 300 rpm.
Coatings 13 00943 g008
Figure 9. Crevice potential measured according to ASTM 46-87: (a) #1 316L and (b) #2 Panacea®.
Coatings 13 00943 g009
Figure 10. Potentiostatic curves recorded during the crevice test for the watch case middle/bottom assembly.
Coatings 13 00943 g010
Figure 11. Watch case middle/bottom assembly with the sealing channel open for the electrolyte penetration before (a) and after (b) the crevasse test.
Coatings 13 00943 g011
Figure 12. Variation of the galvanic current of the coupling as a function of time.
Coatings 13 00943 g012
Figure 13. Evaluation of galvanic corrosion from potentiodynamic polarization curves using (a) fixed electrodes and (b) the rotating electrode technique.
Coatings 13 00943 g013
Figure 14. Application of the mixed potential theory (Ecouple = −30 mV; icouple = 77 nA/cm2).
Coatings 13 00943 g014
Figure 15. Open-circuit potential variation for 12 h for the watch case middle/bottom assembly (the sealing channel filled with electrolyte).
Coatings 13 00943 g015
Table 1. Weight % of elements in the composition of nickel-free steel.
Element CrMnMoCuCNNiWAlSi
Weight %10–2110–200–2.50–40.15–10–10–0.50–50–3.50–2
Table 2. Chemical composition in wt.% of the grades of austenitic steels.
CodeDINAISICSiMnPSCrMoNiOther
#11.4435316L<0.03<1.00<2.0<0.045<0.02517.0–192.50–3.0012.5–15.0-
#2 1.4452
Panacea® ETHZ
-0.017<1.0012.30<0.01-17.23.25<0.026V: 0.01
Nb: 0.107
N: 0.89
Table 3. Samples codification used in the study.
Sample CodeSample Information
#1316L, watch case middle
#2Panacea® bottom case watch
#3Panacea® (raw state); round sample, 280 HV0.1
#4Panacea® round sample, 427 HV0.1
#5Panacea® round sample, 510 HV0.1
Table 4. Chemical composition of artificial sweat.
Chemical
composition
Urea NaClracemic lactic acid
1 ± 0.001 g/L5 ± 0.001 g/L 940 ± 10 μL/L
Table 5. Electrochemical parameters measured and calculated for the investigated samples.
Corrosion Parameters Coulometric Analysis
Ecorr
mV
Rp
Kohm/cm2
bc
mV/decade
ba
mV/decade
icorr
nA/cm2
Ebd
mV
E(I=0) –300 mV
mC/cm2
300 mV–600 mV
mC/cm2
#1 361L+36150776201154001.96198
#2 Panacea®+66133839195178000.332.79
#3 P280HV+981706118224396.918007.08.4
#4 P427HV+68131818821135003509.5389.9
#5 P520HV−136337162125471.1026054.38302.81
Table 6. Crevice potential values measured according to ASTM F746-87.
Sample#1 316L#2 Panacea®#3 P280 HV#4 P427HV#5 P510HV
Ecrevice [mV]150600550250200
Table 7. Potentials and currents couplings (Ecouple, Icouple) determined by different techniques.
TechniqueEcouple (mV SCE)icouple (µA/cm2)
direct measurement−250.40
rotating electrode technique−790.024
using fixed electrodes−1440.040
mixed potential theory−300.077
Table 8. Nickel release tests’ results, according to EN 1811.
SampleTotal Surface
(cm2)
Electrolyte Volume
(mL)
Ni Dosage
(mg.L−1)
Ni Release
(μg.cm−2.sem−1)
#1 316L (1.4435)4.4 (±0.00)4.4 (±0.00)0.136 (±0.01)0.136 (±0.01)
#2 Panacea® (1.4452)5.4 (±0.00)5.4 (±0.00)0.0037 (±0.0002)0.0037 (±0.0002)
Table 9. Concentrations of cations released in artificial sweat electrolyte at pH = 4.5 and ICP AES-MS analyses.
Element Blanc#3 P280HV#4 P427HV#5 P510HV
123123123
μg.L−1μg. L−1μg. L−1μg. L−1μg. L−1μg. L−1μg. L−1μg. L−1μg. L−1μg. L−1
Cr<131.935.035.369.852.856.519.718.620.5
Cu<4<4<4<4<4<4<4<4<4<4
Fe16.0575714711772699748533495512
Mn<0.4255312315340306346234225223
Ni<4<4<4<4<4<4<4<4<4<4
Ti3.03.33.23.63.43.43.43.13.43.0
Al<10<10<10<10<10<10<10<10<10<10
Ba2.63.03.03.02.82.82.82.62.72.9
Mo0.63.33.43.74.33.94.42.62.22.3
Sr<0.2<0.2<0.2<0.2<0.2<0.2<0.2<0.2<0.2<0.2
Disclaimer/Publisher’s Note: The statements, opinions and data contained in all publications are solely those of the individual author(s) and contributor(s) and not of MDPI and/or the editor(s). MDPI and/or the editor(s) disclaim responsibility for any injury to people or property resulting from any ideas, methods, instructions or products referred to in the content.

