Article

Achieving Superior Corrosion Resistance of TiB2 Reinforced Al-Zn-Mg-Cu Composites via Optimizing Particle Distribution and Anodic Oxidation Time

1
School of Materials Science and Engineering, University of Science and Technology Beijing, Beijing 100083, China
2
China Academy of Launch Vehicle Technology, Beijing 100076, China
3
Beijing Advanced Innovation Center for Materials Genome Engineering, University of Science and Technology Beijing, Beijing 100083, China
4
State Key Laboratory of Metal Matrix Composites, Shanghai Jiao Tong University, Shanghai 200240, China
5
School of Materials Science and Engineering, Shanghai Jiao Tong University, Shanghai 200240, China
*
Author to whom correspondence should be addressed.
Coatings 2023, 13(10), 1780; https://doi.org/10.3390/coatings13101780
Submission received: 29 August 2023 / Revised: 20 September 2023 / Accepted: 22 September 2023 / Published: 17 October 2023
(This article belongs to the Special Issue Anti-corrosion Coatings of Metals and Alloys – New Perspectives)

Abstract

:
In this study, the effects of particle distribution and anodizing time on the microstructure and corrosion resistance of the TiB2 particle-reinforced Al-Zn-Mg-Cu composite were investigated. Relationships between TiB2 particle distribution, anodizing time, coating growth rule, and corrosion resistance were characterized and discussed using an optical microscope, a scanning electron microscope, an electrochemical test, and a salt spray test. Dispersion of TiB2 particles by powder metallurgy improved the corrosion resistance of the anodized coating on composites. Compared with the matrix, the corrosion potential (Ecorr) of the anodized coating shifted to the positive direction, and the corrosion current density (icorr) decreased. Meanwhile, the icorr of the coating decreased initially and then increased with the extension of the anodization time. The corrosion resistance of the coating was optimal at an anodization time of 20 min. The corrosion resistance of the composite was determined by both the porosity and thickness of the coating. Additionally, all samples treated by potassium dichromate sealing had no corrosion points after a 336-h salt spray test, demonstrating an excellent corrosion resistance suitable for harsh environmental applications in industry.

1. Introduction

In recent years, the application of aluminum matrix composites has rapidly increased due to their high specific strength, fatigue resistance, oxidation resistance, and excellent processing properties. They are widely utilized in the manufacturing of ship and automotive fields [1]. However, in some harsh environments, not only mechanical properties but also high corrosion resistance are needed for aluminum matrix composites. Generally, the existence of ceramic particles increases the chemical potential between particles and matrices, inducing poor corrosion resistance of composites. Therefore, material surface treatment is usually necessary, including physical vapor deposition [2], chemical vapor deposition [3], electroplating [4], plasma spray [5], laser surface treatment [6], common anodization [7], and plasma electrolytic oxidation [8].
Among these, anodizing is a widely used process in the treatment of Al [9,10,11,12], Mg [13], Ti [14], Zr [15], Ta [16], and their alloys and composites due to its simple process, low cost, and mature technology. The sample to be treated serves as the anode, and a stainless steel plate is used as the cathode, and both are placed in the electrolyte. Commonly used electrolytes are generally acidic, including sulfuric acid [17,18], phosphoric acid [19,20], oxalic acid [21,22], chromic acid [23,24], etc. Recently, alkaline electrolytes have also been used to prepare anodic oxidation coatings [25,26,27]. By adjusting the electrical parameters, a coating mainly composed of a base metal oxide is grown on the surface of the substrate. The obtained coatings have good wear resistance, corrosion resistance, and oxidation resistance. For example, Rawian et al. [28] introduced diamond-like carbon on the surface of aluminum alloy to improve the hardness and wear resistance of the film. Gao et al. [29] proposed a facile strategy to fabricate a micro/nano-structured bionic superhydrophobic surface with enhanced anti-corrosion performance. Chen et al. [30] prepared a long-term antibacterial anodic aluminum oxide-copper coating on Al alloys and researched their antibacterial performance. Therefore, anodizing has broad application prospects in ships, 3C products, medical, and other fields.
However, the addition of particles makes anodizing of composites difficult. For example, Wang et al. [31] found that the aggregation of TiB2 particles hindered the normal growth of the oxide coating, especially in areas with severe particle aggregation, where the coating is thin and even unable to form a coating. On this basis, anodizing and rare earth sealing were combined to investigate the feasibility of an in situ TiB2p/A356 composite by Sun et al. [32]. It was found that the corrosion current density of the cerium sealing anodized composite decreased by two orders more than that of the bare sample. He et al. [33] studied the effect of the SiC reinforcement size on the oxide coating thickness of the aluminum matrix composite, and found that the larger the reinforcement size was, the thinner the obtained coating thickness was, and the poorer the film quality was. Furthermore, He et al. [34] further researched the corrosion resistance of anodized coating on an SiCp/2024Al metal matrix composite (MMC) and concluded that anodized coating on 2024Al provides better corrosion protection than SiCp/2024Al MMC. The reason was that the presence of SiC particles led to non-uniformity in thickness and cavity, resulting in a discontinuous barrier layer. Huang et al. [35] compared the corrosion resistance of the alloy and the composite after anodizing, and the corrosion resistance of the coating after anodizing on the composite was lower than the alloy through electrochemical testing. Therefore, the anodizing process for composites with different reinforcements or different reinforcement sizes is also different, and further research is needed.
This paper studied the effect of particle distribution and anodizing time on the corrosion resistance of the composite. The influence of the coating structure and morphology on the corrosion resistance of the composite was explored, combined with the quantitative analysis of the thickness and surface porosity of the anodized coating, through electrochemical testing and microscopic morphology characterization. The anodized sample was then sealed with potassium dichromate to meet the anti-corrosion requirements of industrial applications, and the corrosion resistance of the corresponding sealing coating was characterized in combination with electrochemical and salt spray corrosion tests. The results have important implications for the development and application of high-performance aluminum-based composites in corrosive environments under industrial conditions.

2. Experimental Procedure

2.1. Composites Preparation

Nano-scaled TiB2 reinforced Al-Zn-Mg-Cu composites were firstly in situ synthesized by a molten salt reaction, as previously reported [36,37]. The chemical composition of the composite was measured by an inductively coupled plasma spectrometer (ICP), and the results are presented in Table 1. Two methods were employed to obtain composites with different distribution states of TiB2: (1) conventional extrusion (CE) and (2) powder metallurgy (PM). More details of the fabrication processes can be found in our previous studies [38,39,40]. The composites obtained by the CE method had a lot of TiB2 stripes distributed along the extrusion direction, while those from the PM method exhibited uniform TiB2 particle distribution. The as-achieved composites underwent T6 heat treatment: soluted at 475 °C for 1 h, water-quenched and aged at 140 °C for 16 h.

2.2. Anodizing Process

The heat-treated profile was cut along the ED–ND plane into 30 × 30 specimens (Figure 1a), which were subsequently ground using silicon carbide sandpaper with 80 #, 180 #, 400 #, and 1200 #, respectively. Finally, the abraded samples were then cleaned with acetone and deionized water. During the anodizing process, the treated sample was used as the anode, while a stainless steel plate served as the cathode. The schematic diagram of the anodic oxidation is displayed in Figure 1b. The entire process was carried out in constant voltage mode with 20 V. The anodization time range was from 15 to 60 min and a sulfuric acid electrolyte with a concentration of 197 g/L was used for the anodic oxidation treatment. The sealing treatment was performed for 5–15 min using potassium dichromate with a concentration of 100 g/L at a temperature range of 95–100 °C.

2.3. Microstructure Characterization

Microstructures of composites and coatings were characterized applying a scanning electron microscope (SEM, MAIA, TESCAN) equipped with electron backscattered diffraction (EBSD) at 15 kV. To enhance their conductivity, all SEM coatings were sprayed with gold before observation. The grain size of the composite was determined adopting EBSD with a step size of 0.2 μm at a working voltage of 20 kV. The specimens for the EBSD observations were mechanically polished using sandpapers of up to 5000 grit, and then electrically polished in a solution of 30 vol% nitric acid and 70 vol% methanol at 12 V for 15 s at an ambient temperature to achieve stress-free surfaces. Finally, the EBSD data were analyzed by a CHANNEL 5.0 software package. Grain boundaries (GBs) with misorientation angles ranging from 2° to 15° were considered as low angle GBs (LAGBs, green lines), while GBs larger than 15° were defined as high angle GBs (HAGBs, black lines). The microstructure of the sample after corrosion was also observed by an optical microscope (ZEISS). The phase compositions of anodized coating were determined by the GIXRD (D8 ADVANCE Da Vinci) using a Cu Kα source, and the scanning range was from 10° to 80° (in 2θ).

2.4. Electrochemical Test

For the electrochemical test, a CHI660e workstation was chosen, and a three-electrode system was employed for the experiment. A sample with a test area of 1 cm2 served as the working electrode, while the platinum sheet was the counter electrode, and the saturated calomel electrode was the reference electrode. The corrosion solution was a 3.5 wt.% NaCl solution, and the test temperature was maintained at 25 ± 2 °C. The sample was immersed in the corrosion solution for 0.5 h to ensure the stability of the open circuit potential (OCP) before testing. The electrochemical impedance spectroscopy (EIS) test was conducted with an AC amplitude disturbance of 10 mV. For the polarization curve measurement, the test range was −1.2 V to 0.1 V referring to the OCP value, and the scanning speed was set to 0.5 mV/s.

2.5. Salt Spray Test

The flat salt spray test was conducted following the guidelines of the ASTM B117-03 standard practice for operating salt spray (fog) apparatus [41]. The sample size was 30 mm × 35 mm, and the corrosion solution was a 5 wt.% NaCl solution with a pH value of 6.81. The average salt spray sedimentation rate was 1.72 mL/h, and the test duration was 336 h at 35 °C. All solutions were prepared exploiting deionized water.

3. Results and Discussion

3.1. Composite Structures

Figure 2 displays the micro-morphology of the as-achieved composite obtained by two methods along the extrusion direction. In the ED−ND plane, the samples obtained by the CE method are distributed with numerous TiB2 extrusion strips with significant agglomeration (Figure 2a). Furthermore, the grains are elongated and turn into columnar grains, similar to typical hot extruded alloys. In contrast, micro/nano TiB2 particles are uniformly dispersed in the Al matrix prepared utilizing the PM method on the ED−ND plane (Figure 2c). Meanwhile, the composite comprises near-equiaxed grains, with a grain size of 2.0 μm (Figure 2d). These results imply that powder metallurgy processes can effectively disperse TiB2 particles and reduce grain size.

3.2. Effect of TiB2 Distribution on Anodizing Coating

3.2.1. Coating Characteristics

The microstructure analysis presented in Figure 3 suggests that the dispersion of TiB2 particles in the composite affects the quality of the anodizing coating. In composite with TiB2 clusters, the anodized coating exhibits a large number of micro-cracks and micro-pores, with a maximum pore size of ~10 μm (Figure 3a), resulting in poor coating quality. In contrast, in a composite containing uniform TiB2 particles, the anodized coating displays fewer micro-pores and almost no noticeable cracks (Figure 3b), indicating better coating quality. At the same time, cross-sectional morphology analysis reveals that the quality of the anodizing coating formed on the composite with uniform TiB2 dispersion is evidently superior to that of the TiB2-agglomerated composite (Figure 3c,d).

3.2.2. Polarization Curve Characteristics

The polarization curves of the composite (CE), composite (PM), coating (CE) and coating (PM) are presented in Figure 4, where specific values are given in Table 2. The icorr of the matrix obtained by the PM method is more than 1 time lower than that obtained by the CE method, implying better corrosion resistance. Compared with the matrix, both anodized coatings using the two methods show a significant positive shift in Ecorr and a decrease in icorr, indicating that anodization can improve the corrosion resistance of the samples. At the same time, the dispersion of TiB2 particles can reduce the coating icorr by ~6 times (from 7.54 × 10⁻⁵ to 1.23 × 10⁻⁵ A·cm−2), significantly improving the corrosion resistance. Compared with the CE method, the PM method results in a smaller grain size and more uniform distribution of TiB2 in the matrix without significant agglomeration (Figure 2), which is beneficial to the quality of the anodized coating. The surface of the coating formed on the TiB2 particle agglomerated composite contains many micro-pores and cracks, which can serve as channels for corrosion media. This may be the reason for the decreased corrosion resistance.

3.3. Effect of Anodizing Time on Coating

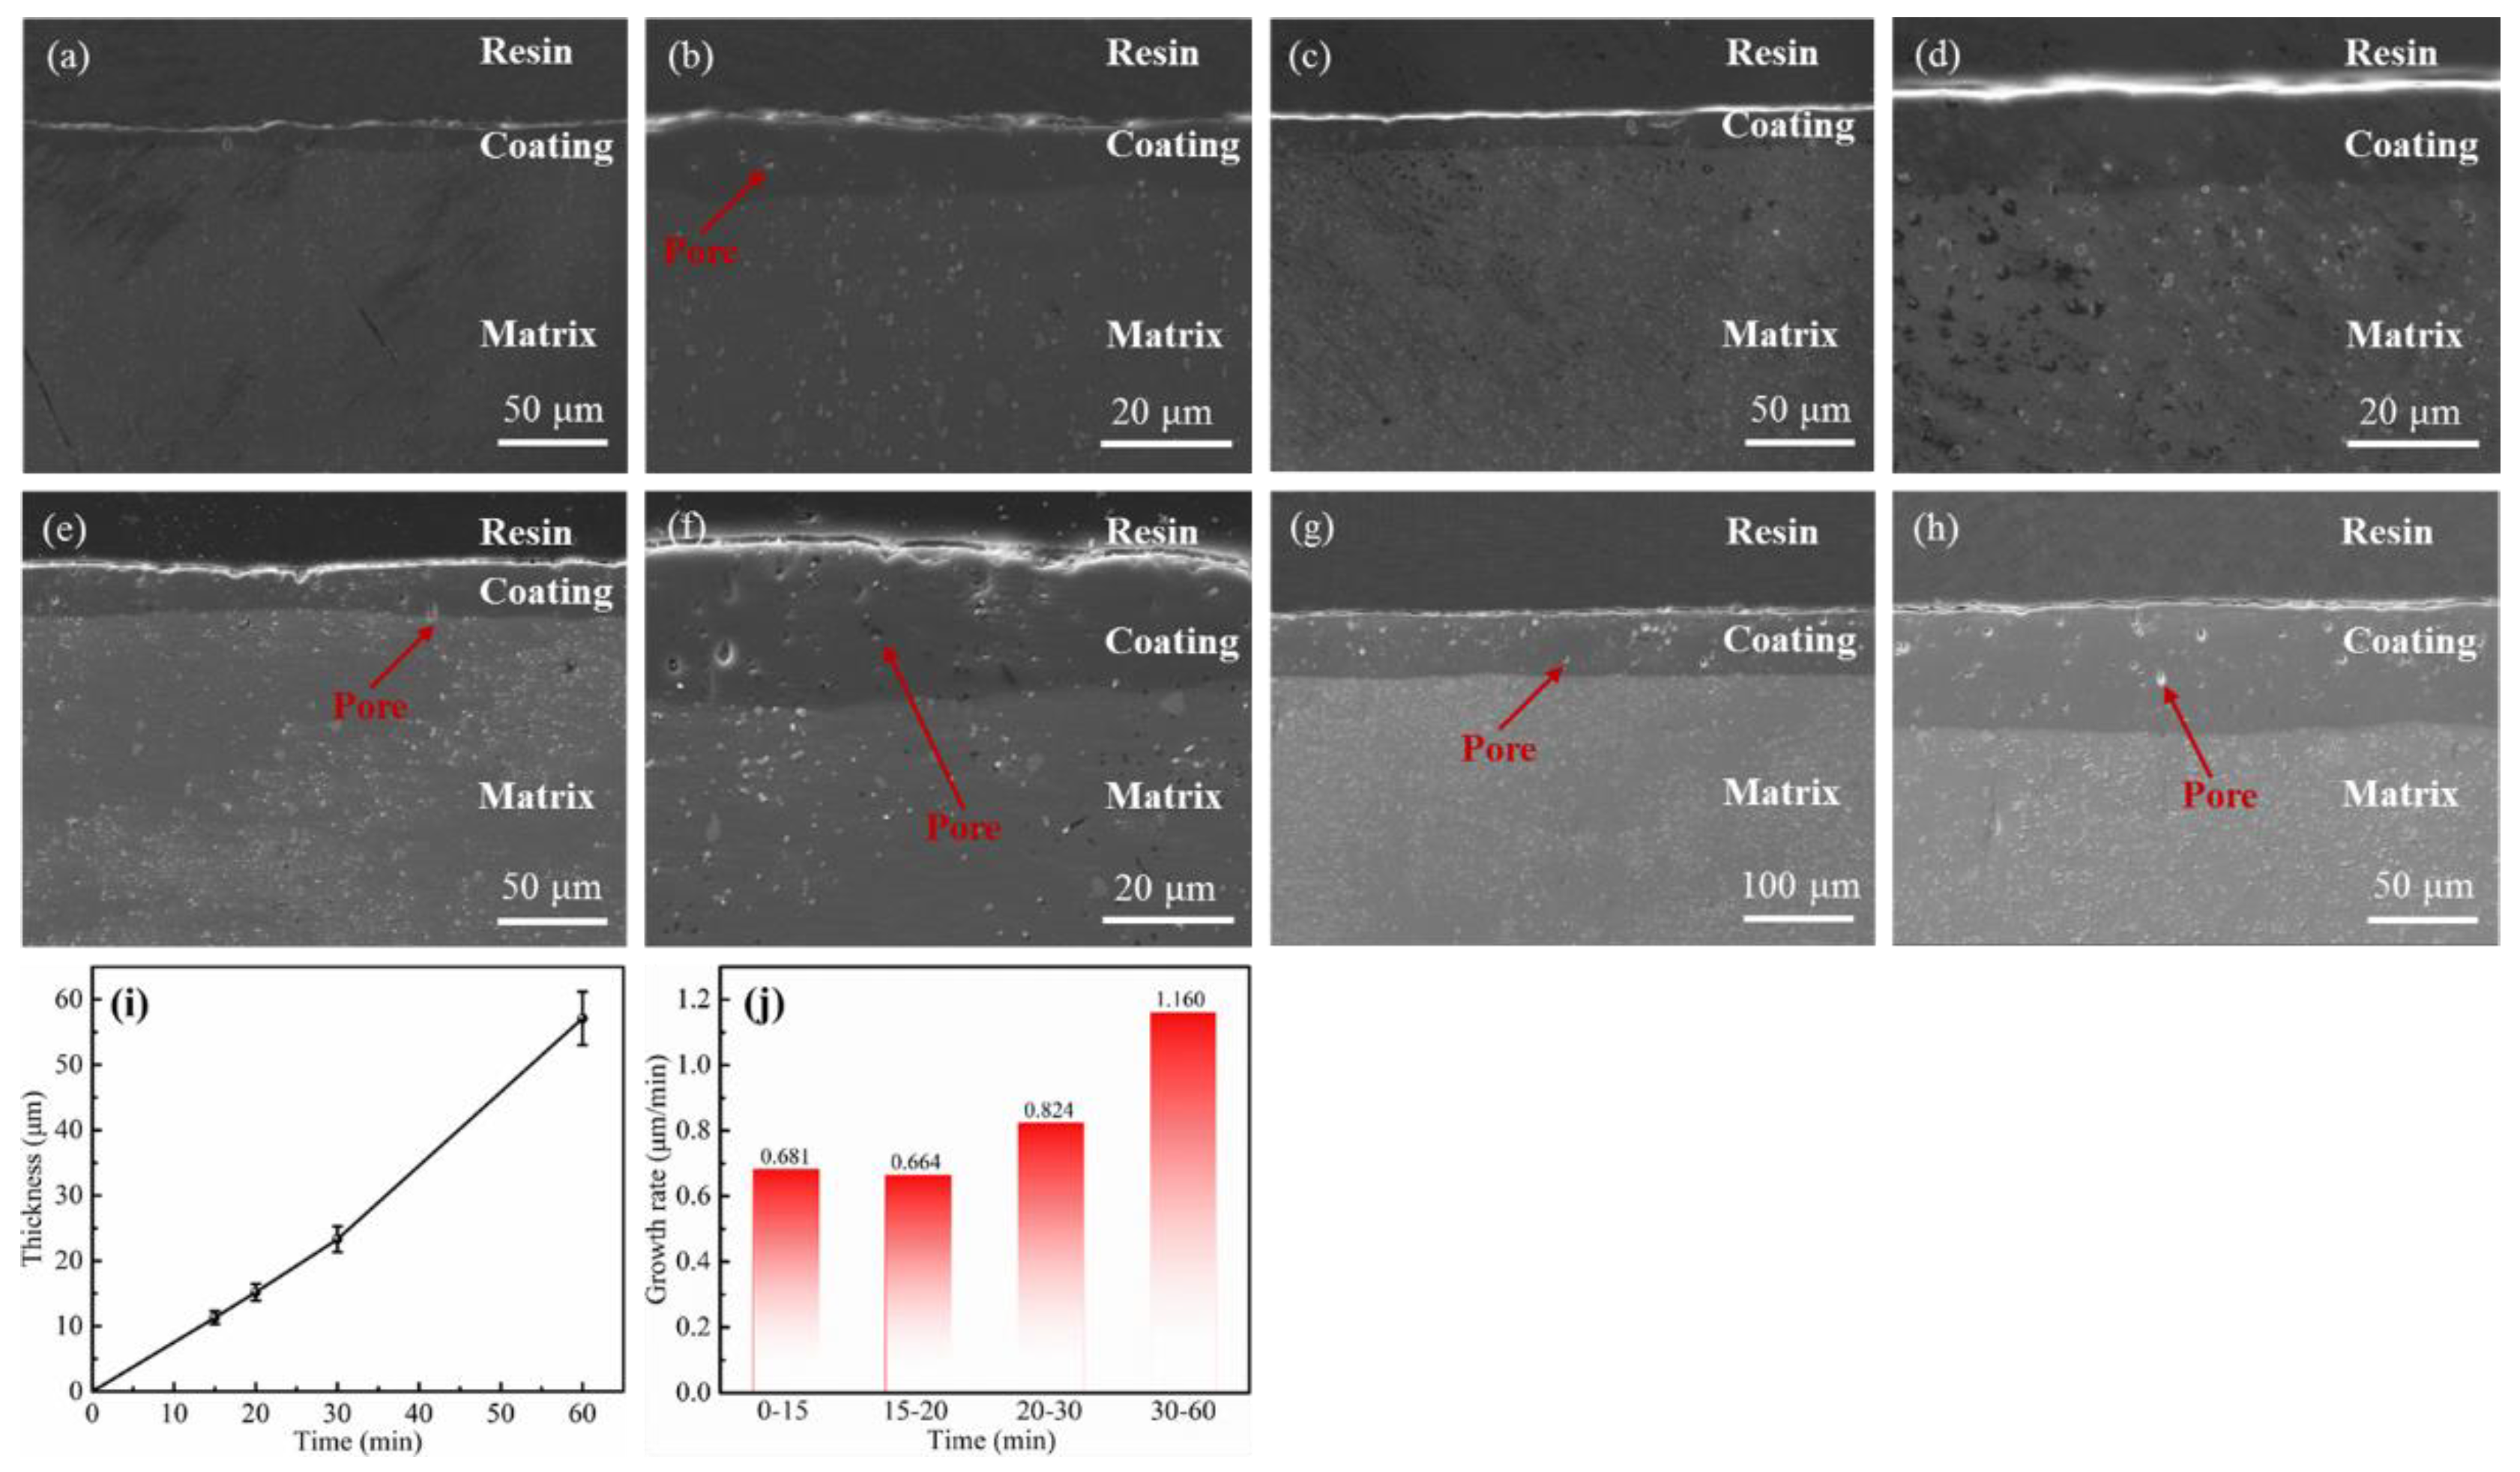
3.3.1. Coating Morphologies

After obtaining composites with uniform TiB2 particles through the PM method, the effect of the anodizing time on the microstructure and corrosion resistance of the coating is investigated. The subsequent anodized samples are the composite prepared by the PM method. Figure 5 depicts the coating surface morphology of the composite after different anodizing times. The obtained coating surface contains many micro-pores [42,43,44], and the pore structure is close to circular or elliptical. In addition, there are some micro-cracks on the coating surface.
The surface porosity and pore size of all coatings are calculated by Image J software [45,46]. The method involved converting the SEM image into a black-and-white image utilizing Photoshop software, where the area containing pores is converted to black, while the area without pores is turned to white (Figure 5i). The proportion of the black area is then calculated to reflect the surface porosity of the coating. The corresponding results are shown in Figure 5j.
It can be observed that the surface porosity and pore size of the coating obtained after anodizing for 20 min are clearly lower than other treatment times, with a value as low as 0.5% and ~1.1 μm, which will contribute to a high corrosion resistance. Furthermore, when the anodizing time exceeds 20 min, the crack length on the coating surface increases and the coating quality becomes poorer, leading to a negative impact on corrosion resistance (Figure 5f,g).
The cross-sectional morphology analysis presented in Figure 6 indicates that the thickness of the anodizing coating increases with the prolongation of the anodizing time (Figure 6i). When the anodization time is extended to 60 min, the coating thickness rises to 60 μm. Concurrently, some micro-pores are also observed on the cross-sectional morphology of the coating. Especially, when the anodizing time is more than 20 min, the number of micro-pores in the coating increases significantly (Figure 6f,h), which can compromise the corrosion resistance of the material by providing channels for the corrosive media to penetrate into the substrate [47,48].
Additionally, the growth rate of the coating is relatively slow within 0–20 min, resulting in a relatively dense coating with lower porosity (Figure 6j). However, when the anodization time exceeds 20 min, the growth rate of the coating accelerates, leading to a decrease in density and an augmentation in the porosity of the formed coating. This suggests that there is an optimal anodizing time for achieving the best balance between coating thickness and porosity, which can maximize the corrosion resistance of the composite.
Figure 7a shows the mapping of the cross-sectional morphology of the anodized coating, which is mainly comprised of Al, O, and S elements with almost no Ti element. It indicates that Ti does not participate in the coating formation during the anodizing process. The existence of the S element is primarily due to the migration of SO42− ions from the electrolyte to the metal/oxide interface, which is subsequently incorporated into the anode layer during the anodic oxidation process [49].
The GIXRD patterns of the anodized coating are displayed in Figure 7b. The strong diffusion peaks at 38.4°, 44.8°, 65.1° and 78.2° can be recognized from the GIXRD curve of anodized specimens, mainly attributed to the diffraction of Al (111), Al (200), Al (220), and Al (311), respectively. Specific diffraction peaks of aluminum oxides could not be observed, which was consistent with the results in the literature [50,51]. It was essentially amorphous aluminum oxides formed in the anodic coating [51,52].

3.3.2. Corrosion Behavior

Figure 8 exhibits the polarization curve of the matrix and coatings after different anodizing time treatments. The corrosion potential (Ecorr), corrosion current density (icorr), and corrosion protection efficiency (PE) are applied to estimate the anti-corrosive property of the coatings, where specific values are depicted in Table 3. The Ecorr and icorr are obtained from the acquired polarization curves, and the PE is computed from the calculated icorr [53,54]. In general, the icorr can directly reflect the corrosion resistance of the material [55]. Compared with the matrix, the Ecorr of the anodic oxidation coating is positively shifted and the icorr decreases (Figure 8 and Table 3). It is clear that the corrosion resistance of the composite is improved after anodizing. Meanwhile, the icorr of the obtained coating first decreases and then increases with the extension of the treatment time. As a result, the PE value reveals an increasing trend as the icorr value decreases. When the treatment time is 20 min, the icorr of the coating is the lowest and the PE value is the highest, indicating an optimum corrosion resistance, owing to the lowest porosity of the coating being obtained after 20 min (Figure 5j).

3.3.3. Corrosion Morphology Analysis

In order to further analyze the corrosion behavior of the material, both macro and micro morphologies of the coating after the polarization curve test are exhibited in Figure 9. The coating surface after anodizing treatment has clear pitting with different sizes of pits. Particularly, the diameter of the pits even reaches 350 μm when the anodizing lasts for 60 min. It indicates that the obtained coating mainly undergoes pitting corrosion in the electrochemical corrosion. Simultaneously, the size of the pits first decreases and then increases with the prolongation of the anodizing time. When the anodization time is 20 min, the number of pits on the coating surface is the least, and the pit size is the smallest, so that the corrosion degree is the mildest (Figure 9b). It further implies that the obtained coating after anodizing for 20 min has superior corrosion resistance among them, which is consistent with the previous polarization curve test results (Figure 8).
Based on the aforementioned analysis, the corrosion resistance of the material is mainly determined by both the coating thickness and porosity. In the 0–20 min range, the coating thickness plays a leading role. The thickness of the obtained coating after anodizing for 20 min is larger than 15 min (Figure 6i), so its corrosion resistance is better. When the anodization time exceeds 20 min and the coating grows to a certain thickness, the porosity of the coating surface dominates. According to Figure 5j, the coating surface porosity increases clearly after exceeding 20 min, causing a decrease in the corrosion resistance. Thus, the coating obtained by anodizing for 20 min has the best corrosion resistance.

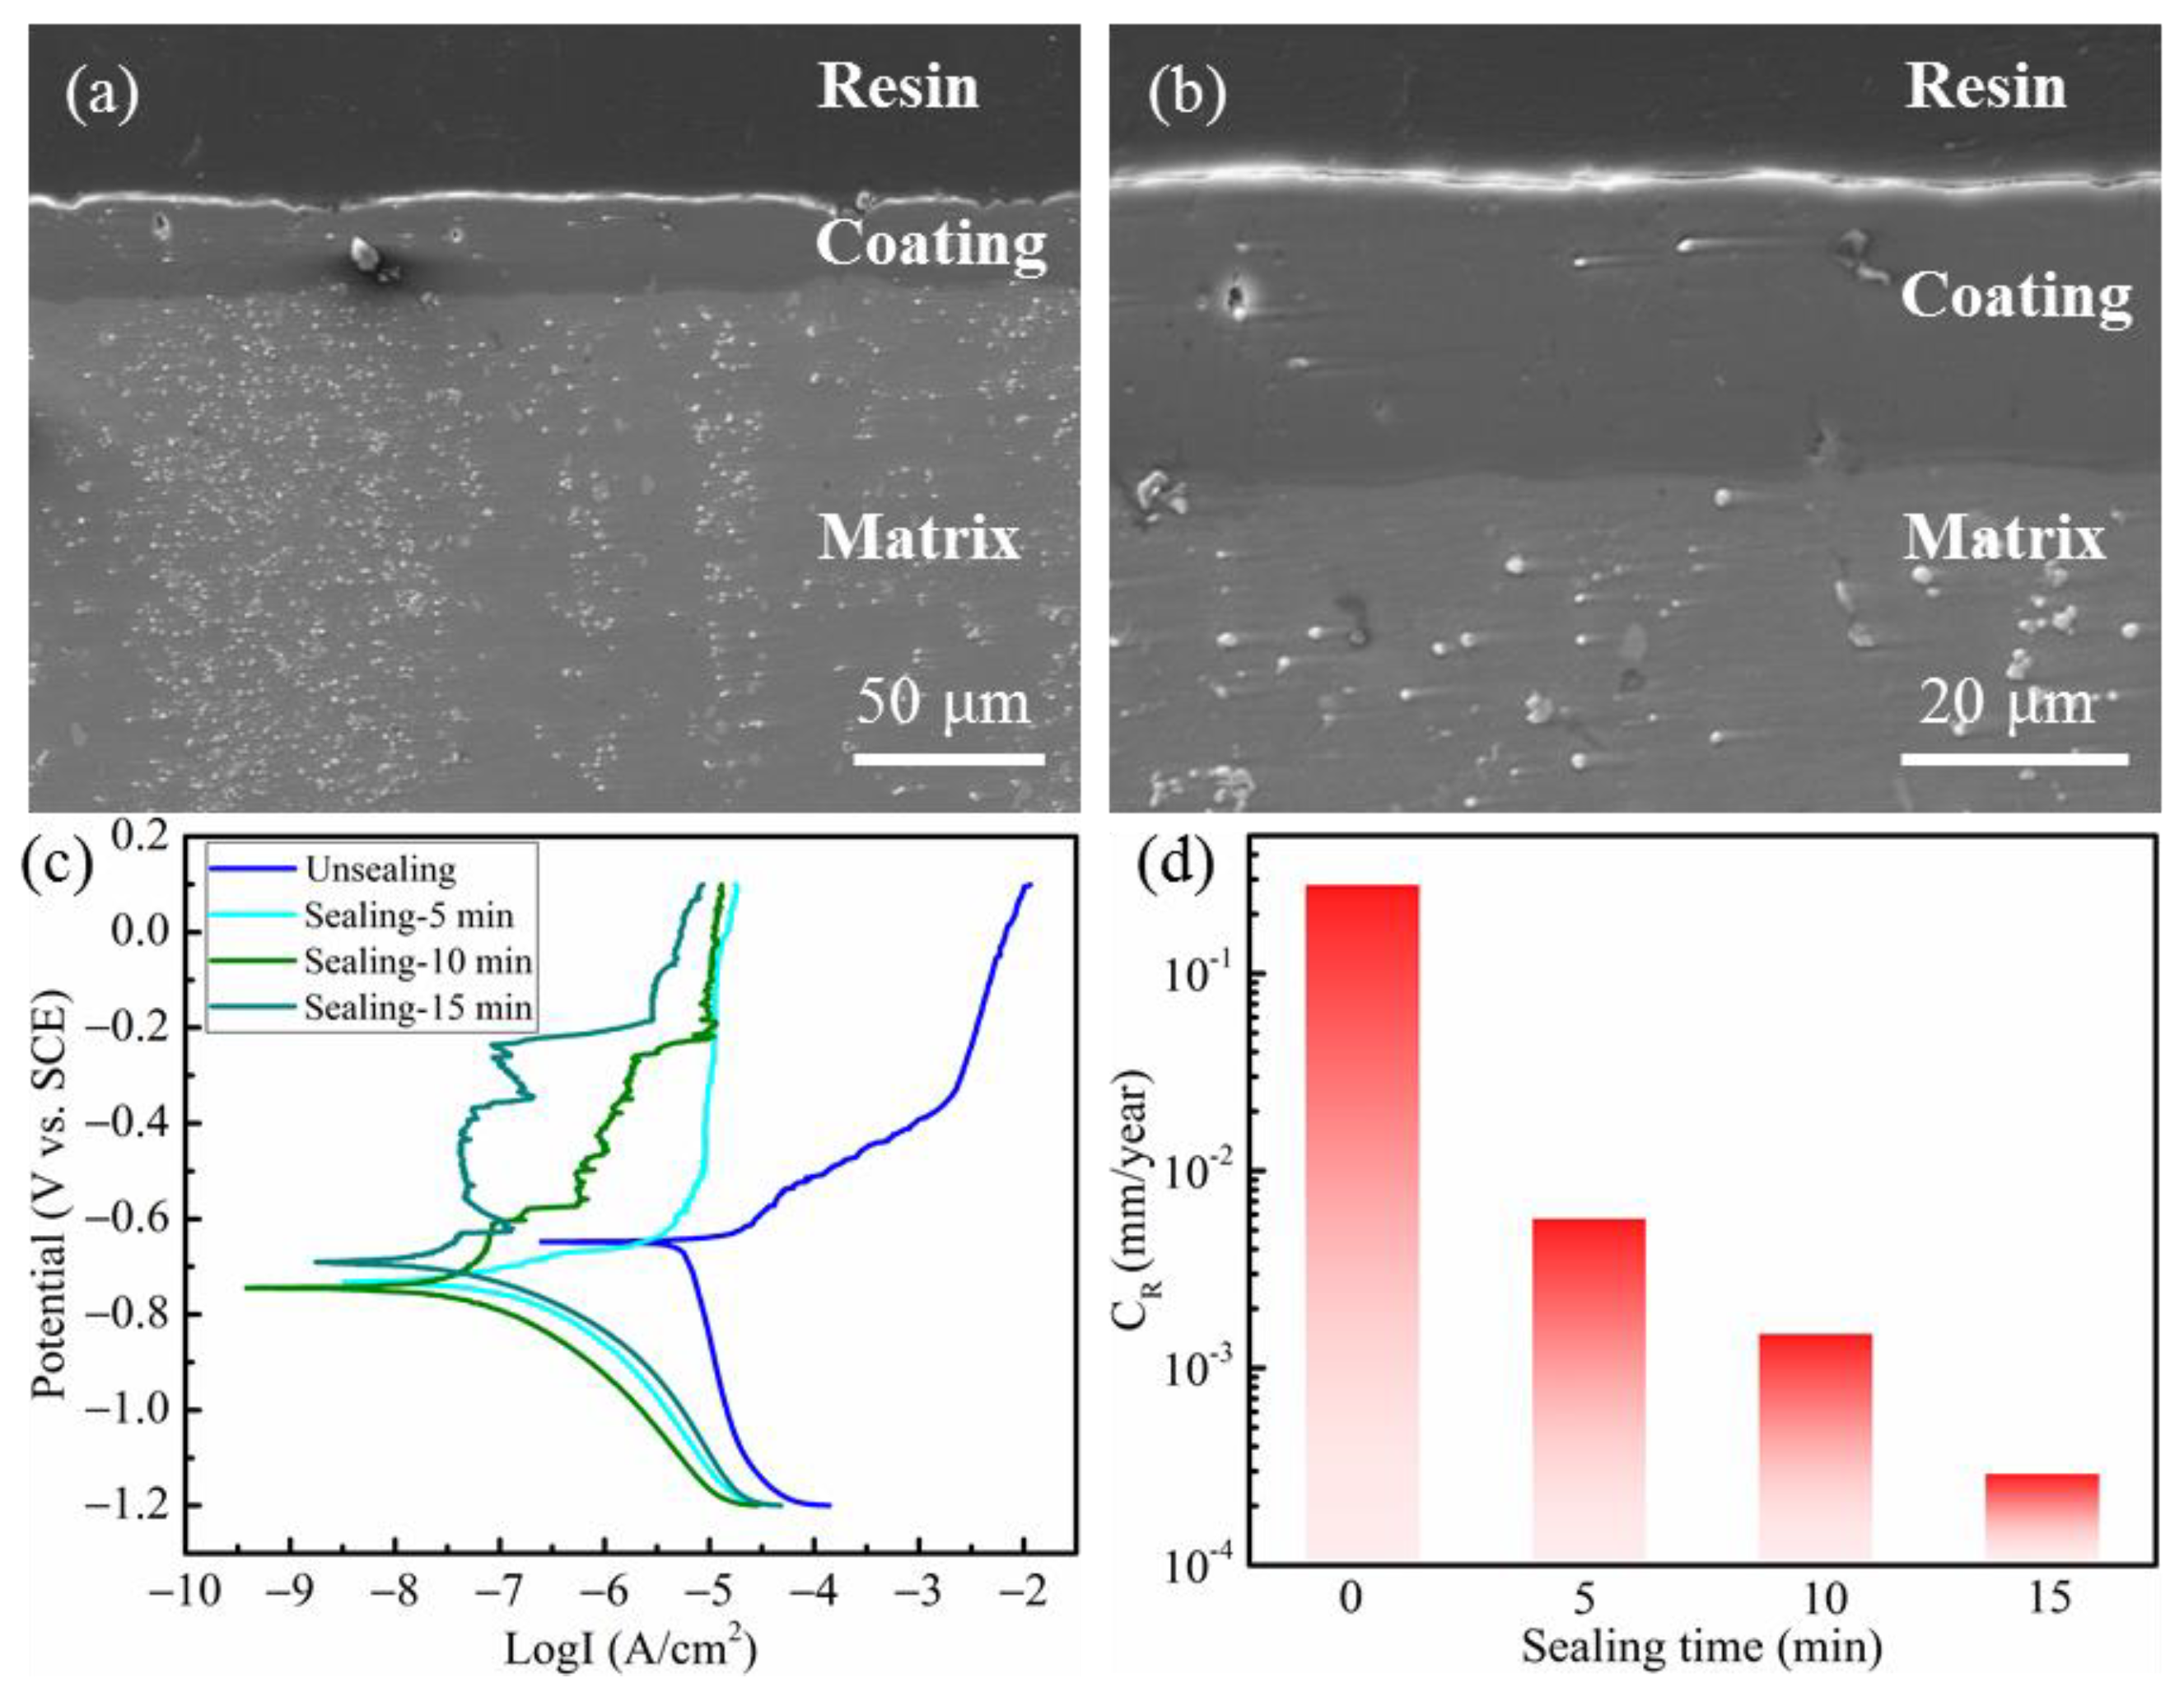
3.4. Further Improving the Corrosion Resistance of the Coating under Industrial Conditions

To further meet the corrosion resistance requirements of the composite under industrial conditions, a potassium dichromate solution is used to immerse the anodized samples. Here, we select a 20 min anodized coating for the sealing treatment. The cross-sectional morphologies of the coating after the sealing treatment are shown in Figure 10a,b. The number of micro-pores in the cross-section of the coating clearly decreases, and the coating thickness slightly increases. These contribute to the improvement in the corrosion resistance. Meanwhile, the polarization curve tests are carried out in both unsealed and sealed samples, and the results are depicted in Figure 10c and Table 4. To more intuitively determine the corrosion resistance of the sealing coatings, the corrosion rate (CR) is calculated according to Equation (1) [56,57]:
CR (mm⋅year−1) = 22.85 × icorr (mA·cm−2)
Compared with the unsealed sample, the corrosion current density (icorr) of the sample is clearly reduced (about 2–3 orders of magnitude) after potassium dichromate sealing treatment. Particularly, the icorr value of sealing-15 sample is reduced from 1.23 × 10⁻⁵ to 1.27 × 10⁻⁸ A·cm−2. This indicates that the corrosion resistance of the sealing sample is significantly improved. This may be due to a decrease in the porosity of coating after sealing. In addition, the icorr of the coating further decreases with the prolongation of the sealing time. When the sealing time is 15 min, the icorr of the coating is the lowest, and the corrosion resistance is the best (Figure 10c). Similarly, the CR value has the same results and the sealing-15 sample has the lowest CR value (Figure 10d).
At the same time, the electrochemical impedance spectroscopy (EIS) test was carried out on samples with different sealing times (Figure 11). It can be seen that the radius of the capacitive impedance arc corresponding to the sealing treatment coating is clearly raised compared to the unsealed treatment. Furthermore, the radius of the capacitive impedance arc is further raised with the extension of the soaking time (Figure 11a). In general, the impedance value in the low-frequency region reflects the corrosion resistance of the material [58,59,60]. The impedance value of the coating obtained by soaking for 15 min in the low-frequency region is about 1.80 × 10⁵ Ω·cm2, which is about two orders of magnitude higher than the impedance value of the unsealed treatment (Figure 11b). It is consistent with the aforementioned polarization curve test results (Figure 10c).
An equivalent circuit diagram is used to fit the EIS data to accurately analyze them (Figure 11b). Herein, Rs represents the solution resistance between the reference and working electrodes [61,62]. Rc and CPEc (constant phase-angle element) are the resistance and capacitance corresponding to the coating layer. Rct and CPEdl are the charge transfer resistance and capacitance of the double electric layer at the sample/electrolyte interface.
The fitting results corresponding to the equivalent circuit diagram are exhibited in Table 5. In comparison with the unsealed sample, the Rct of the sealing sample increases by at least about one order of magnitude. In particular, for th e sample sealed for 15 min, its Rct value increases by nearly three orders of magnitude (From 8.01 × 10³ to 2.69 × 10⁶ Ω·cm2). It further indicates that the corrosion resistance of the composite can be significantly improved by potassium dichromate immersion treatment.
In addition, samples with different sealing times were selected for salt spray tests. To facilitate the recording, the samples with sealing times of 5, 10 and 15 min are named as S-5, S-10 and S-15, respectively. In the meantime, each group selects six samples with the labels of 1-1 # to 1-6 #, 2-1 # to 2-6 # and 3-1 # to 3-6 # to ensure the testing repeatability. The results are shown in Figure 12 and it can be concluded that three groups of samples did not have any pitting, cracks, bubbles or corrosion defects during the 336-h salt spray test. It demonstrates that the corrosion resistance of the coating meets the industrial application requirements after immersion with potassium dichromate.

4. Conclusions

Overall, this study provides important insights into the corrosion behavior and surface protection of TiB2 reinforced Al-Zn-Mg-Cu composites. The findings suggest that anodic oxidation and sealing treatment can effectively improve the corrosion resistance of the composite, and the prepared coating can meet the requirements for corrosion resistance under industrial conditions. The main results can be concluded as follows:
(1)
The dispersion of TiB2 can improve the corrosion resistance of the anodized coating on the composite.
(2)
After anodic oxidation treatment, the corrosion resistance of the composite is improved, with the corrosion potential (Ecorr) shifting to the positive direction and the corrosion current density (icorr) reducing by one order of magnitude. Particularly, the optimum anodizing time is 20 min, exhibiting the lowest icorr of coating (1.23 × 10⁻⁵ A·cm−2).
(3)
The corrosion resistance of the anodized coating is mainly determined by both the coating thickness and the porosity.
(4)
After the sealing treatment, the icorr of the coating is 2–3 orders of magnitude lower than that of the unsealed sample, and the resistance value in the low-frequency region is about two orders of magnitude higher than that of the unsealed sample. All the samples after the sealing treatment did not have any corrosion points during the 336-h salt spray corrosion, meeting the industrial requirements of corrosion resistance for applications.

Author Contributions

Conceptualization, J.H. and Z.C.; methodology, H.W.; validation, D.L.; formal analysis, K.G., J.L., D.Z., Y.G., M.W. and Z.C.; investigation, D.L. and J.L.; resources, J.L.; data curation, K.G., D.Z., Y.G. and M.W.; writing—original draft preparation, D.L.; writing—review and editing, K.G., J.L., J.H., D.Z., Y.G., M.W. and H.W.; supervision, J.H.; project administration, J.H.; funding acquisition, Z.C. All authors have read and agreed to the published version of the manuscript.

Funding

The work is supported by the National Natural Science Foundation of China (Grant No. 52101179).

Institutional Review Board Statement

Not applicable.

Informed Consent Statement

Not applicable.

Data Availability Statement

Not applicable.

Conflicts of Interest

The authors declare no conflict of interest.

References

  1. Zhu, L.Y.; Ji, Q.; Chen, J.H.; Zhang, W.; Chen, Z.X.; Zhang, T.; Wang, F.H. Microstructure and corrosion resistance of the PEO coating on extruded Al6Cu alloy. Surf. Coat. Technol. 2019, 369, 116–126. [Google Scholar] [CrossRef]
  2. Pshyk, A.V.; Petrov, I.; Bakhit, B.; Lu, J.; Hultman, L.; Greczynski, G. Energy-efficient physical vapor deposition of dense and hard Ti-Al-W-N coatings deposited under industrial conditions. Mater. Design. 2023, 227, 111753. [Google Scholar] [CrossRef]
  3. Ellingsen, J.; Venkatachalapathy, V.; Azarov, A.; Nilsen, O.; Kuznetsov, A. Al incorporation during metal organic chemical vapour deposition of aluminum zinc oxide. Thin Solid Films 2020, 709, 138245. [Google Scholar] [CrossRef]
  4. Su, C.H.; Chen, T.C.; Tsay, L.W. Improved fatigue strength of Cr-electroplated 7075-T6 Al alloy by micro-shot peening. Int. J. Fatigue 2023, 167, 107354. [Google Scholar] [CrossRef]
  5. Wang, Y.W.; Yang, Y.; Li, H.; Ren, X.X.; Wang, X.Y.; Tian, W. Reaction and growth mechanisms of MoO3-Al system in plasma spraying. J. Alloys Compd. 2023, 938, 168661. [Google Scholar] [CrossRef]
  6. Cheng, X.W.; Cai, P.Z.; Zhang, L.; Chai, L.J. Unusual work hardening rate of a 3D gradient high purity Ti fabricated by laser surface treatment. Mater. Sci. Eng. A 2023, 862, 144417. [Google Scholar] [CrossRef]
  7. Li, Y.Y.; Liu, S.; Wu, J.H.; Du, W.N.; Qin, G.W.; Zhang, E.L. Effect of anodic oxidation on the corrosion resistance and antibacterial properties of Ti-15Mo-9Ag for biomedical application. Surf. Coat. Technol. 2023, 472, 129948. [Google Scholar] [CrossRef]
  8. Wang, L.L.; Wang, G.W.; Dong, H.; Ye, M.H.; Li, X.Y.; Liu, L.; Pan, J.L.; Ye, Z.Y. Plasma electrolytic oxidation coatings on additively manufactured aluminum–silicon alloys with superior tribological performance. Surf. Coat. Technol. 2022, 435, 128246. [Google Scholar] [CrossRef]
  9. Kim, M.; Choi, E.; So, J.; Shin, J.S.; Chung, C.W.; Maeng, S.J.; Yun, J.Y. Improvement of corrosion properties of plasma in an aluminum alloy 6061-T6 by phytic acid anodization temperature. J. Mater. Res. Technol. 2021, 11, 219–226. [Google Scholar] [CrossRef]
  10. Hui, Z.; Yuwen, F.Y.; Qiao, Y.N.; Zhao, Y.M.; Wang, C.X.; Yao, R.Q.; Lu, J.J. Surface topography and tribological behavior of anodic oxidation films on an Al–Li alloy in flooded and starved ionic liquids. Wear 2022, 496, 204280. [Google Scholar] [CrossRef]
  11. Chung, C.K.; Tsai, C.H.; Hsu, C.R.; Kuo, E.H.; Chen, Y.; Chung, I.C. Impurity and temperature enhanced growth behaviour of anodic aluminum oxide from AA5052 Al-Mg alloy using hybrid pulse anodization at room temperature. Corros. Sci. 2017, 125, 40–47. [Google Scholar] [CrossRef]
  12. Mehdizade, M.; Eivani, A.R.; Soltanieh, M. Characterization of the anodic oxide layer deposited on severely deformed and aged AA6063 aluminum alloy. J. Mater. Res. Technol. 2021, 15, 68–85. [Google Scholar] [CrossRef]
  13. Song, G.L.; Shi, Z. Corrosion mechanism and evaluation of anodized magnesium alloys. Corros. Sci. 2014, 85, 126–140. [Google Scholar] [CrossRef]
  14. Nguyen, V.T.; Cheng, T.C.; Fang, T.H.; Li, M.H. The fabrication and characteristics of hydroxyapatite film grown on titanium alloy Ti-6Al-4V by anodic treatment. J. Mater. Res. Technol. 2020, 9, 4817–4825. [Google Scholar] [CrossRef]
  15. Li, X.; Li, C.Y.; Gong, T.L.; Su, J.H.; Zhang, W.C.; Song, Y.; Zhu, X.F. Comparative study on the anodizing process of Ti and Zr and oxide morphology. Ceram. Int. 2021, 47, 23332–23337. [Google Scholar] [CrossRef]
  16. Luo, Y.; Bi, M.R.; Cai, H.Z.; Hu, C.Y.; Wei, Y.; Wen, M.; Li, L.; Wang, X.; Zhang, X.X.; Zhang, G.X.; et al. The effect of argon ion etching treatments on anodic oxide film growth and the electrochemical properties of tantalum. J. Mater. Res. Technol. 2022, 20, 4256–4268. [Google Scholar] [CrossRef]
  17. Renaux, D.V.; Chahboun, N.; Rocca, E. Anodizing of multiphase aluminum alloys in sulfuric acid: In-situ electrochemical behaviour and oxide properties. Electrochim. Acta 2016, 211, 1056–1065. [Google Scholar] [CrossRef]
  18. Olmo, R.D.; Mohedano, M.; Visser, P.; Rodriguez, A.; Matykina, E.; Arrabal, R. Effect of cerium (IV) on thin sulfuric acid anodizing of 2024-T3 alloy. J. Mater. Res. Technol. 2021, 15, 3240–3254. [Google Scholar] [CrossRef]
  19. Terashima, A.; Iwai, M.; Kikuchi, T. Nanomorphological changes of anodic aluminum oxide fabricated by anodizing in various phosphate solutions over a wide pH range. Appl. Surf. Sci. 2022, 605, 154687. [Google Scholar] [CrossRef]
  20. Owens, A.G.; Renaux, D.V.; Cartigny, V.; Rocca, E. Large-pores anodizing of 5657 aluminum alloy in phosphoric acid: An in-situ electrochemical study. Electrochim. Acta 2021, 382, 138303. [Google Scholar] [CrossRef]
  21. Zaraska, L.; Bobruk, M.; Jaskuła, M.; Sulka, G.D. Growth and complex characterization of nanoporous oxide layers on metallic tin during one-step anodic oxidation in oxalic acid at room temperature. Appl. Surf. Sci. 2015, 351, 1034–1042. [Google Scholar] [CrossRef]
  22. Chernyakova, K.; Ispas, A.; Karpicz, R.; Ecke, G.; Vrublevsky, I.; Bund, A. Formation of ordered anodic alumina nanofibers during aluminum anodizing in oxalic acid at high voltage and electrical power. Surf. Coat. Technol. 2020, 394, 125813. [Google Scholar] [CrossRef]
  23. Elabar, D.; Monica, G.R.L.; Santamaria, M.; Quarto, F.D.; Skeldon, P.; Thompson, G.E. Anodizing of aluminum and AA 2024-T3 alloy in chromic acid: Effects of sulphate on film growth. Surf. Coat. Technol. 2017, 309, 480–489. [Google Scholar] [CrossRef]
  24. Kikuchi, T.; Yamashita, M.; Iwai, M.; Suzuki, R.O. Self-ordering of porous anodic alumina fabricated by anodizing in chromic acid at high temperature. J. Electrochem. Soc. 2021, 168, 093501. [Google Scholar] [CrossRef]
  25. Oliveira, L.A.D.; Silva, R.M.P.D.; Rodas, A.C.D.; Souto, R.M.; Antunes, R.A. Surface chemistry, film morphology, local electrochemical behavior and cytotoxic response of anodized AZ31B magnesium alloy. J. Mater. Res. Technol. 2020, 9, 14754–14770. [Google Scholar] [CrossRef]
  26. Nishimoto, M.; Xiong, Z.T.; Kitano, S.; Aoki, Y.; Habazaki, H. The effect of anodizing temperature on the oxygen evolution reaction activity of anodized FeNiCo alloy in alkaline electrolyte. Electrochim. Acta 2022, 427, 140875. [Google Scholar] [CrossRef]
  27. Zaraska, L.; Gawlak, K.; Gurgul, M.; Gilek, D.; Kozieł, M.; Socha, R.P.; Sulka, G.D. Morphology of nanoporous anodic films formed on tin during anodic oxidation in less commonly used acidic and alkaline electrolytes. Surf. Coat. Technol. 2019, 362, 191–199. [Google Scholar] [CrossRef]
  28. Rawian, N.A.M.; Akasaka, H.; Liza, S.; Fukuda, K.; Zulkifli, N.A.; Tahir, N.A.M.; Yaakob, Y. Surface and tribological characterization of anodic aluminum oxide coating containing diamond-like carbon flakes. Diam. Relat. Mater. 2023, 132, 109674. [Google Scholar] [CrossRef]
  29. Gao, N.; Ding, G.X.; Wang, C.; Chen, F.; Wang, Y.P.; Ma, H.T. A facile strategy to fabricate bionic superhydrophobic armor based on utilization of metallographic structure heredity and reconstruction of anodized oxide film on alloy. Surf. Interfaces 2022, 21, 102351. [Google Scholar] [CrossRef]
  30. Chen, J.H.; He, Z.; Liu, J.M.; Wang, Y.X.; Hodgson, M.; Gao, W. Antibacterial anodic aluminum oxide-copper coatings on aluminum alloys: Preparation and long-term antibacterial performance. Chem. Eng. J. 2023, 461, 141873. [Google Scholar] [CrossRef]
  31. Wang, X.; Sun, H.H.; Wang, H.W. Anodic oxidation of in-situ TiB2 particle reinforced 6351 aluminum alloy. Mater. Protec. 2007, 10, 61–65. [Google Scholar]
  32. Sun, H.H.; Ma, N.H.; Chen, D.; Li, X.F.; Wang, H.W. Fabrication and analysis of anti-corrosion coatings on in-situ TiB2p reinforced aluminum matrix composite. Surf. Coat. Technol. 2008, 203, 329–334. [Google Scholar] [CrossRef]
  33. He, C.L.; Zhou, Q.; Liu, J.T.; Geng, X.W.; Cai, Q.K. Effect of size of reinforcement on thickness of anodized coatings on SiC/Al matrix composites. Mater. Lett. 2008, 15, 2441–2443. [Google Scholar] [CrossRef]
  34. He, C.L.; Lou, D.Y.; Wang, J.M.; Cai, Q.K. Corrosion protection and formation mechanism of anodic coating on SiCp/Al metal matrix composite. Thin Solid Films 2011, 519, 4759–4764. [Google Scholar] [CrossRef]
  35. Huang, W.M.; Zhou, C.; Liu, B.; Wang, M.L.; Wang, H.W.; Ma, N.H. Improvement in the corrosion resistance of TiB2/A356 composite by molten-salt electrodeposition and anodization. Surf. Coat. Technol. 2012, 206, 4988–4991. [Google Scholar] [CrossRef]
  36. Liu, J.; Chen, Z.; Zhang, F.G.; Ji, G.; Wang, M.L.; Ma, Y.; Ji, V.; Zhong, S.Y.; Wu, Y.; Wang, H.W. Simultaneously increasing strength and ductility of nanoparticles reinforced Al composites via accumulative orthogonal extrusion process. Mater. Res. Lett. 2018, 6, 406–412. [Google Scholar] [CrossRef]
  37. Liu, J.; Zhang, Q.; Chen, Z.; Wang, L.; Ji, G.; Shi, Q.W.; Wu, Y.; Zhang, F.G.; Wang, H.W. Fabrication of fine grain structures in Al matrices at elevated temperature by the stimulation of dual-size particles. Mater. Sci. Eng. A 2021, 805, 140614. [Google Scholar] [CrossRef]
  38. Yang, Q.; Cheng, D.L.; Liu, J.; Wang, L.; Chen, Z.; Wang, M.L.; Zhong, S.Y.; Wu, Y.; Ji, G.; Wang, H.W. Microstructure evolution of the TiB2/Al composites fabricated by powder metallurgy during hot extrusion. Mater. Charact. 2019, 155, 109834. [Google Scholar] [CrossRef]
  39. Tang, Y.B.; Liu, C.Z.; Liu, J.; Zhang, C.C.; Chen, H.; Shi, Q.W.; Dan, C.Y.; Wang, H.W.; Chen, Z. Improving the ductility of Al matrix composites through bimodal structures: Precise manipulation and mechanical responses to coarse grain fraction. Mater. Sci. Eng. A 2023, 875, 145139. [Google Scholar] [CrossRef]
  40. Liu, J.; Liu, C.Z.; Cai, H.Y.; Zhang, C.C.; Dan, C.Y.; Shi, Q.W.; Wang, H.W.; Chen, Z. Enhanced precipitate strengthening in particulates reinforced Al–Zn–Mg–Cu composites via bimodal structure design and optimum aging strategy. Compos. B Eng. 2023, 260, 110772. [Google Scholar] [CrossRef]
  41. ASTM International. ASTM B117-03 Standard Practice for Operating Salt Spray (Fog) Apparats; 100 Barr Harbor Drive: West Conshohocken, PE, USA, 2003. [Google Scholar]
  42. Ding, Z.F. Mechanistic study of thin film sulfuric acid anodizing rate difference between Al2024 T3 and Al6061 T6. Surf. Coat. Technol. 2019, 357, 280–288. [Google Scholar] [CrossRef]
  43. Chung, I.C.; Chung, C.K.; Su, Y.K. Effect of current density and concentration on microstructure and corrosion behavior of 6061 Al alloy in sulfuric acid. Surf. Coat. Technol. 2017, 313, 299–306. [Google Scholar] [CrossRef]
  44. Lu, J.Q.; Wei, G.Y.; Yu, Y.D.; Guo, C.F.; Jiang, L. Aluminum alloy AA2024 anodized from the mixed acid system with enhanced mechanical properties. Surf. Interfaces 2018, 13, 46–50. [Google Scholar] [CrossRef]
  45. Akbarzadeh, S.; Coelho, L.B.; Dangreau, L.; Lanzutti, A.; Fedrizzi, L.; Olivier, M.G. Self-healing plasma electrolytic oxidation (PEO) coating developed by an assembly of corrosion inhibitive layer and sol-gel sealing on AA2024. Corros. Sci. 2023, 222, 111424. [Google Scholar] [CrossRef]
  46. Song, D.D.; Wan, H.X. Key factor for the corrosion resistance of MAO coating on Mg alloy. Mater. Chem. Phys. 2023, 296, 127963. [Google Scholar] [CrossRef]
  47. Mehdizade, M.; Soltanieh, M.; Eivani, A.R. Investigation of anodizing time and pulse voltage modes on the corrosion behavior of nanostructured anodic layer in commercial pure aluminum. Surf. Coat. Technol. 2019, 358, 741–752. [Google Scholar] [CrossRef]
  48. Alves, A.C.; Wenger, F.; Ponthiaux, P.; Celis, J.P.; Pinto, A.M.; Rocha, L.A.; Fernandes, J.C.S. Corrosion mechanisms in titanium oxide-based films produced by anodic treatment. Electrochim. Acta 2017, 234, 16–27. [Google Scholar] [CrossRef]
  49. Runge, J.M. The Metallurgy of Anodizing Aluminum; Springer International Publishing: Cham, Switzerland, 2018. [Google Scholar]
  50. Totaro, P.; Khusid, B. Multistep anodization of 7075–T6 aluminum alloy. Surf. Coat. Technol. 2021, 421, 127407. [Google Scholar] [CrossRef]
  51. Zhang, J.H.; Cheng, F.; Wang, L.; Xu, Y.; Zhou, Z.T.; Liu, X.Y.; Hu, Y.S.; Hu, X.Z. Reinforcement study of anodizing treatment with various temperatures on aluminum substrates for stronger adhesive bonding with carbon fiber composites. Surf. Coat. Technol. 2023, 462, 129473. [Google Scholar] [CrossRef]
  52. Ghosh, R.; Dey, A.; Kavitha, M.K.; Thota, H.K.; Rani, R.U.; Rajendra, A.; Das, K. Development of flat absorber black anodic coating on 3D printed Al–10Si–Mg alloy for spacecraft thermal control application. Ceram. Int. 2022, 48, 35689–35697. [Google Scholar] [CrossRef]
  53. Bisht, B.M.; Bhandri, H.; Sambyal, P.; Gairola, S.P.; Dhawan, S. Highly durable and novel anticorrosive coating based on epoxy reinforced with poly(aniline-co-pentafluoroaniline)/SiO2 composite. Am. J. Polymer. Sci. 2016, 6, 75–85. [Google Scholar]
  54. Ko, C.L.; Kuo, Y.L.; Chen, S.H.; Chen, S.Y.; Guo, J.Y.; Wang, Y.J. Formation of aluminum composite passive film on magnesium alloy by integrating sputtering and anodic aluminum oxidation processes. Thin Solid Films 2020, 709, 138151. [Google Scholar] [CrossRef]
  55. Zhang, C.; Luo, X.; Pan, X.; Liao, L.; Wu, X.; Liu, Y. Self-healing Li-Al layered double hydroxide conversion coating modified with aspartic acid for 6N01 Al alloy. Appl. Surf. Sci. 2017, 394, 275–281. [Google Scholar] [CrossRef]
  56. Shi, Z.M.; Liu, M.; Atrens, A. Measurement of the corrosion rate of magnesium alloys using Tafel extrapolation. Corros. Sci. 2010, 52, 579–588. [Google Scholar] [CrossRef]
  57. Qian, K.; Zhang, Y.; Dong, Q.S.; Shao, Y.; Cheng, Z.J.; Ju, J.; Xue, F.; Chu, C.L.; Xia, D.D.; Bai, J. Enhancement of corrosion resistance and antibacterial properties of PEO coated AZ91D Mg alloy by copper- and phosphate-based sealing treatment. Corros. Sci. 2023, 219, 111218. [Google Scholar] [CrossRef]
  58. Wang, H.Y.; Song, Y.L.; Chen, X.G.; Tong, G.D.; Zhang, L.Y. Microstructure and corrosion behavior of PEO-LDHs-SDS superhydrophobic composite film on magnesium alloy. Corros. Sci. 2022, 208, 110699. [Google Scholar] [CrossRef]
  59. Li, Z.J.; Jing, X.Y.; Yuan, Y.; Zhang, M.L. Composite coatings on a Mg–Li alloy prepared by combined plasma electrolytic oxidation and sol–gel techniques. Corros. Sci. 2012, 63, 358–366. [Google Scholar] [CrossRef]
  60. Xu, L.Y.; Fu, X.J.; Su, H.J.; Sun, H.L.; Li, R.C.; Wang, Y. Corrosion and tribocorrosion protection of AZ31B Mg alloy by a hydrothermally treated PEO/chitosan composite coating. Prog. Org. Coat. 2022, 170, 107002. [Google Scholar] [CrossRef]
  61. Liu, G.F.; Lu, X.P.; Zhang, X.Y.; Zhang, T.; Wang, F.H. Improvement of corrosion resistance of PEO coatings on Al alloy by formation of ZnAl layered double hydroxide. Surf. Coat. Technol. 2022, 441, 128528. [Google Scholar] [CrossRef]
  62. Nadimi, M.; Dehghanian, C. Incorporation of ZnO–ZrO2 nanoparticles into TiO2 coatings obtained by PEO on Ti–6Al–4V substrate and evaluation of its corrosion behavior, microstructural and antibacterial effects exposed to SBF solution. Ceram. Int. 2021, 47, 33413–33425. [Google Scholar] [CrossRef]
Figure 1. (a) Sampling location, (b) Schematic diagram of anodic oxidation device.
Coatings 13 01780 g001
Figure 2. (a,c) SEM, (b,d) EBSD maps of the composites fabricated by (a,b) CE method and (c,d) PM method.
Coatings 13 01780 g002
Figure 3. Microstructure of the composite after anodizing 20 min: (a,b) surface SEM, (c,d) cross-sectional SEM. (a,c) CE method, (b,d) PM method.
Coatings 13 01780 g003
Figure 4. Polarization curves of matrix and 20-min anodized coating obtained by different prepared methods.
Coatings 13 01780 g004
Figure 5. Surface morphology of the composite after different anodizing times: (a,b) 15 min, (c,d) 20 min, (e,f) 30 min, (g,h) 60 min, (i) Converting original image to black and white image, (j) Porosity and pore size.
Coatings 13 01780 g005
Figure 6. Cross-sectional morphology of the composite after different anodizing time: (a,b) 15 min, (c,d) 20 min, (e,f) 30 min, (g,h) 60 min, (i) Thickness, (j) Growth rate.
Coatings 13 01780 g006
Figure 7. (a) EDS maps of the cross-sectional morphology of the coating after anodizing for 20 min, (b) GI-XRD of the coating.
Coatings 13 01780 g007
Figure 8. Polarization curve of the composite after different anodizing times.
Coatings 13 01780 g008
Figure 9. Optical microscope photos after polarization curve test: (a) 15 min, (b) 20 min, (c) 30 min, (d) 60 min.
Coatings 13 01780 g009
Figure 10. (a) Cross-sectional morphology of the coating after anodizing for 20 min and sealing for 15 min, (b) is an enlargement of (a), (c) Polarization curve of coating after treatment with different sealing time, (d) Corrosion rate (CR) of coated samples.
Coatings 13 01780 g010
Figure 11. Electrochemical plots of the coating after treatment with different sealing times: (a) Nyquist plots, (b) Bode plots.
Coatings 13 01780 g011
Figure 12. Macro photos of salt spray testing on coatings after different sealing time treatments: (a) 5 min, (b) 10 min, (c) 15 min.
Coatings 13 01780 g012
Table 1. Chemical composition of the fabricated composite (wt.%).
ZnMgCuZrSiFeCrMnTiBAl
7.932.22.40.180.030.010.00060.0013.51.5Balance
Table 2. Polarization curve-fitting results of matrix and 20-min anodized coating obtained by different prepared methods.
MethodEcorr (V)icorr (A·cm−2)
Matrix (CE)−0.7341.29 × 10−4
Matrix (PM)−0.7758.96 × 10−5
Coating (CE) −0.6607.54 × 10−5
Coating (PM) −0.6561.23 × 10−5
Table 3. Polarization curve-fitting results of the composite after different anodizing times.
Time (min)Ecorr (V)icorr (A·cm−2)PE (%)
0−0.7632.08 × 10−4/
15−0.6601.70 × 10−591.83%
20−0.6561.23 × 10−594.09%
30−0.6513.75 × 10−581.97%
60−0.6841.59 × 10−423.56%
Table 4. Polarization curve-fitting results of the coating after sealing treatment.
Sealing Time (min)Ecorr (V)icorr (A·cm−2)
0−0.6561.23 × 10−5
5−0.7322.49 × 10−7
10−0.7456.54 × 10−8
15−0.6901.27 × 10−8
Table 5. Electrochemical parameters analyzed from EIS tests.
UnsealingSealing-5 minSealing-10 minSealing-15 min
Rs (Ω·cm2)18.2915.4111.4819.25
CPEc (S·cm−2·sn)3.38 × 10−52.24 × 10−56.62 × 10−63.48 × 10−6
nc0.77860.66780.78891
Rc (Ω·cm2)298.7706.213372580
CPEdl (S·cm−2·sn)5.85 × 10−52.11 × 10−51.27 × 10−56.02 × 10−6
ndl0.62740.69370.63830.7566
Rct (Ω·cm2)8.01 × 1037.49 × 1041.69 × 1052.69 × 106
Chi-squared2.52 × 10−32.01 × 10−31.49 × 10−34.18 × 10⁻³
Disclaimer/Publisher’s Note: The statements, opinions and data contained in all publications are solely those of the individual author(s) and contributor(s) and not of MDPI and/or the editor(s). MDPI and/or the editor(s) disclaim responsibility for any injury to people or property resulting from any ideas, methods, instructions or products referred to in the content.

