Article

Corrosion Behaviors of N80 and 1Cr Tubing Steels in CO2 Containing Downhole Environment—A Case Study of Underground Gas Storage in LiaoHe Oil Field

1
LiaoHe Oilfield Gas Storage Co., Ltd., China National Petroleum Corporation, Panjin 124000, China
2
State Key Laboratory of Oil and Gas Resources and Detection, China University of Petroleum, Beijing 102249, China
*
Author to whom correspondence should be addressed.
Coatings 2023, 13(4), 737; https://doi.org/10.3390/coatings13040737
Submission received: 15 February 2023 / Revised: 27 March 2023 / Accepted: 28 March 2023 / Published: 4 April 2023
(This article belongs to the Special Issue Investigation on Structure and Corrosion Resistance of Steels/Alloys)

Abstract

:
In order to evaluate the effect of chromium content in carbon steel on the corrosion resistance of carbon steel materials, the corrosion behavior of 1Cr and N80 steels was investigated in this study by immersion weight loss method under three different CO2 partial pressure and temperature conditions in formation water for 72, 168 and 336 h. Detailed material surface morphological characterization was performed by scanning electron microscopy (SEM), energy dispersive spectroscopy (EDS), and confocal laser scanning microscopy (CLSM). The results show that the pitting corrosion of N80 carbon steel is serious at medium temperature and low CO2 partial pressure (50 °C, 0.30 MPa), and the corrosion rate is significantly higher than that of 1Cr steel. However, at high-temperature and high CO2 partial pressure (100 °C/0.63 MPa and 114 °C/0.73 MPa), 1Cr steel is more inclined to the mesa corrosion dominated by local corrosion characteristics, and the corrosion rate is seriously higher than that of N80 steel with uniform corrosion. From the experimental results, we can know the corrosion resistance of carbon steel and 1Cr steel is not only affected by the corrosion environment, but also depends on the formation process of the product film, as well as its compactness and integrity characteristics. At low-temperature and low CO2 partial pressure, 1 wt.% chromium content can provide a certain degree of corrosion resistance, while high temperature and high partial pressure can broaden the application window of carbon steel N80 and weaken the corrosion inhibition effect of chromium.

1. Introduction

The construction of gas storage is a strategic measure in response to the rapid development of natural gas pipeline networks and the natural gas industry [1]. However, the wellbore string corrosion problem seriously limits the safety of injection and production in gas storage in the early stages of gas storage operation, forming residual drilling fluids, hydrochloric acid, condensate, CO2, and other complex environments can intensify string corrosion [2,3,4,5]. Recently, due to its cost-effectiveness and good corrosion resistance [6,7,8], low chromium tubing steel with a chromium content of 1 wt.%~5 wt.% has gained attention from researchers as an advanced material for carbon steel and is expected to be an ideal choice for gas storage construction.
1Cr steel and N80 steel are two commonly used materials in the oil and gas industry. Understanding the corrosion behavior of 1Cr steel and N80 steel under different partial pressure and temperature conditions of CO2 can help in the selection of appropriate materials for oil and gas production applications, and aid in the development of corrosion prevention and mitigation strategies. However, the effectiveness of corrosion resistance improvement at low chromium content (1 wt.%) still needs to be clarified, and the difference in corrosion resistance between carbon steel and 1Cr alloy steel has yet to be fully studied.
The research on the effective Cr content in low chromium steel has not yet reached a consensus. There are a large number of published studies [7,9,10,11] that propose that adding 0.5 wt.%~1.0 wt.% Cr can prevent severe mesa corrosion. According to Guo et al. [12], a continuous and ductile inner amorphous layer will cover the entire surface of the specimen, which seems to inhibit localized corrosion when the content of Cr is around 2 wt.%. It has been observed that in an alloy containing 3 wt.% of Cr content, there is competition between the deposition of chromium-containing compounds and FeCO3, forming a compact “chromium-rich” FeCO3 corrosion product film [12,13,14,15,16]. Bai and Chen et al. [17,18,19] reported that the corrosion product film of N80 steel with 4 wt.% Cr content comprised amorphous Cr7C3, Cr2O3, and FeCO3. Ueda and Takabe [20] reported that for 4~5 wt.% chromium steel, the corrosion product film contained a huge amount of chromium content than the matrix after 24 h of immersion and that the samples corroded uniformly without pitting.
Subsequently, the best applicable critical conditions for low-chromium steel are still need to be clarified. Investigations on the corrosion behavior of 1 wt.%, 2 wt.%, 3 wt.%, and 5 wt.% low chromium alloy steels under static conditions of 80 °C and 0.8 MPa CO2 partial pressure showed slight pitting corrosion on 1Cr steel samples. In contrast, local corrosion was likely to occur on 2Cr steel due to its striped crystal-skinned surface. Both 3Cr and 5Cr steels exhibited uniform corrosion morphology, and 5Cr steel had lower corrosion rates and higher chromium enrichment than 3Cr steel [12,14,16]. Li et al. [21] studied the corrosion behavior of 3Cr and carbon steel under normal temperature and pressure and concluded that local corrosion was likely to occur under these conditions. Numerous studies have examined the effects of temperature on the corrosion behavior of N80 and N80 with 1 wt.% Cr and 4~5 wt.% Cr steel pipes at 78 °C and 1 MPa CO2 partial pressure [11,18,19,22,23,24,25,26,27]. Results showed serious and rapid pitting corrosion on N80 pipe samples, while the corrosion rate of the N80 with 1 wt.% was significantly lower. Uniform corrosion was reported for N80 steel with 4~5 wt.% Cr. Sun, Wang, and Wu et al. [28,29,30,31,32] demonstrated that at 60 °C and 1 MPa CO2 partial pressure, adding 3~5 wt.% Cr eliminated localized corrosion on X65 steel. Li [33] found that at 100 °C and 0.03 MPa CO2 partial pressure, N80 steel exhibited uniform corrosion with shallow circular pits, 3Cr showed deep pitting corrosion, while a small extent of honeycomb corrosion was noted on 1Cr.
Research on the corrosion mechanism of low chromium steel, especially low alloy steel represented by 1Cr steel, remains to be explored. It is generally assumed that the corrosion resistance of low chromium alloy steel pipes is better than that of ordinary carbon steel in various corrosive environments. However, recent literature has presented conflicting findings, but unfortunately, no deep theoretical exploration has been conducted [13,33]. Therefore, this study aims to uncover the mechanism of CO2 corrosion behavior of low chromium steel (1Cr) and N80 carbon steel under different conditions to aid in the material selection process for the Shuang-6 gas storage facility at LiaoHe Oilfield, thereby improving safety and reducing economic losses.

2. Materials and Methods

2.1. Material and Style

In this study, we analyzed 1Cr steel and N80 carbon steel samples with the chemical composition shown in Table 1. Each sample was machined into three specimens measuring 25 mm × 10 mm × 3 mm with a 6 mm round hole at one end. Two specimens from each sample were used for weight loss analysis due to corrosion, while the third was used for surface analysis. Before the tests and analysis, the specimens were polished sequentially on the metallographic abrading and polishing machine with 300 #, 600 #, and 1200 # grit silicon carbide abrasive paper. After polishing, the specimens were cleaned with water and degreased with absolute ethanol. The size of the polished specimens was measured with a vernier caliper (accurate to 0.01 mm) and weighed on an analytical weighing balance (precise to 0.1 mg) before being loaded into the PTFE rack and placed in the high-temperature, high-pressure dynamic reactor.

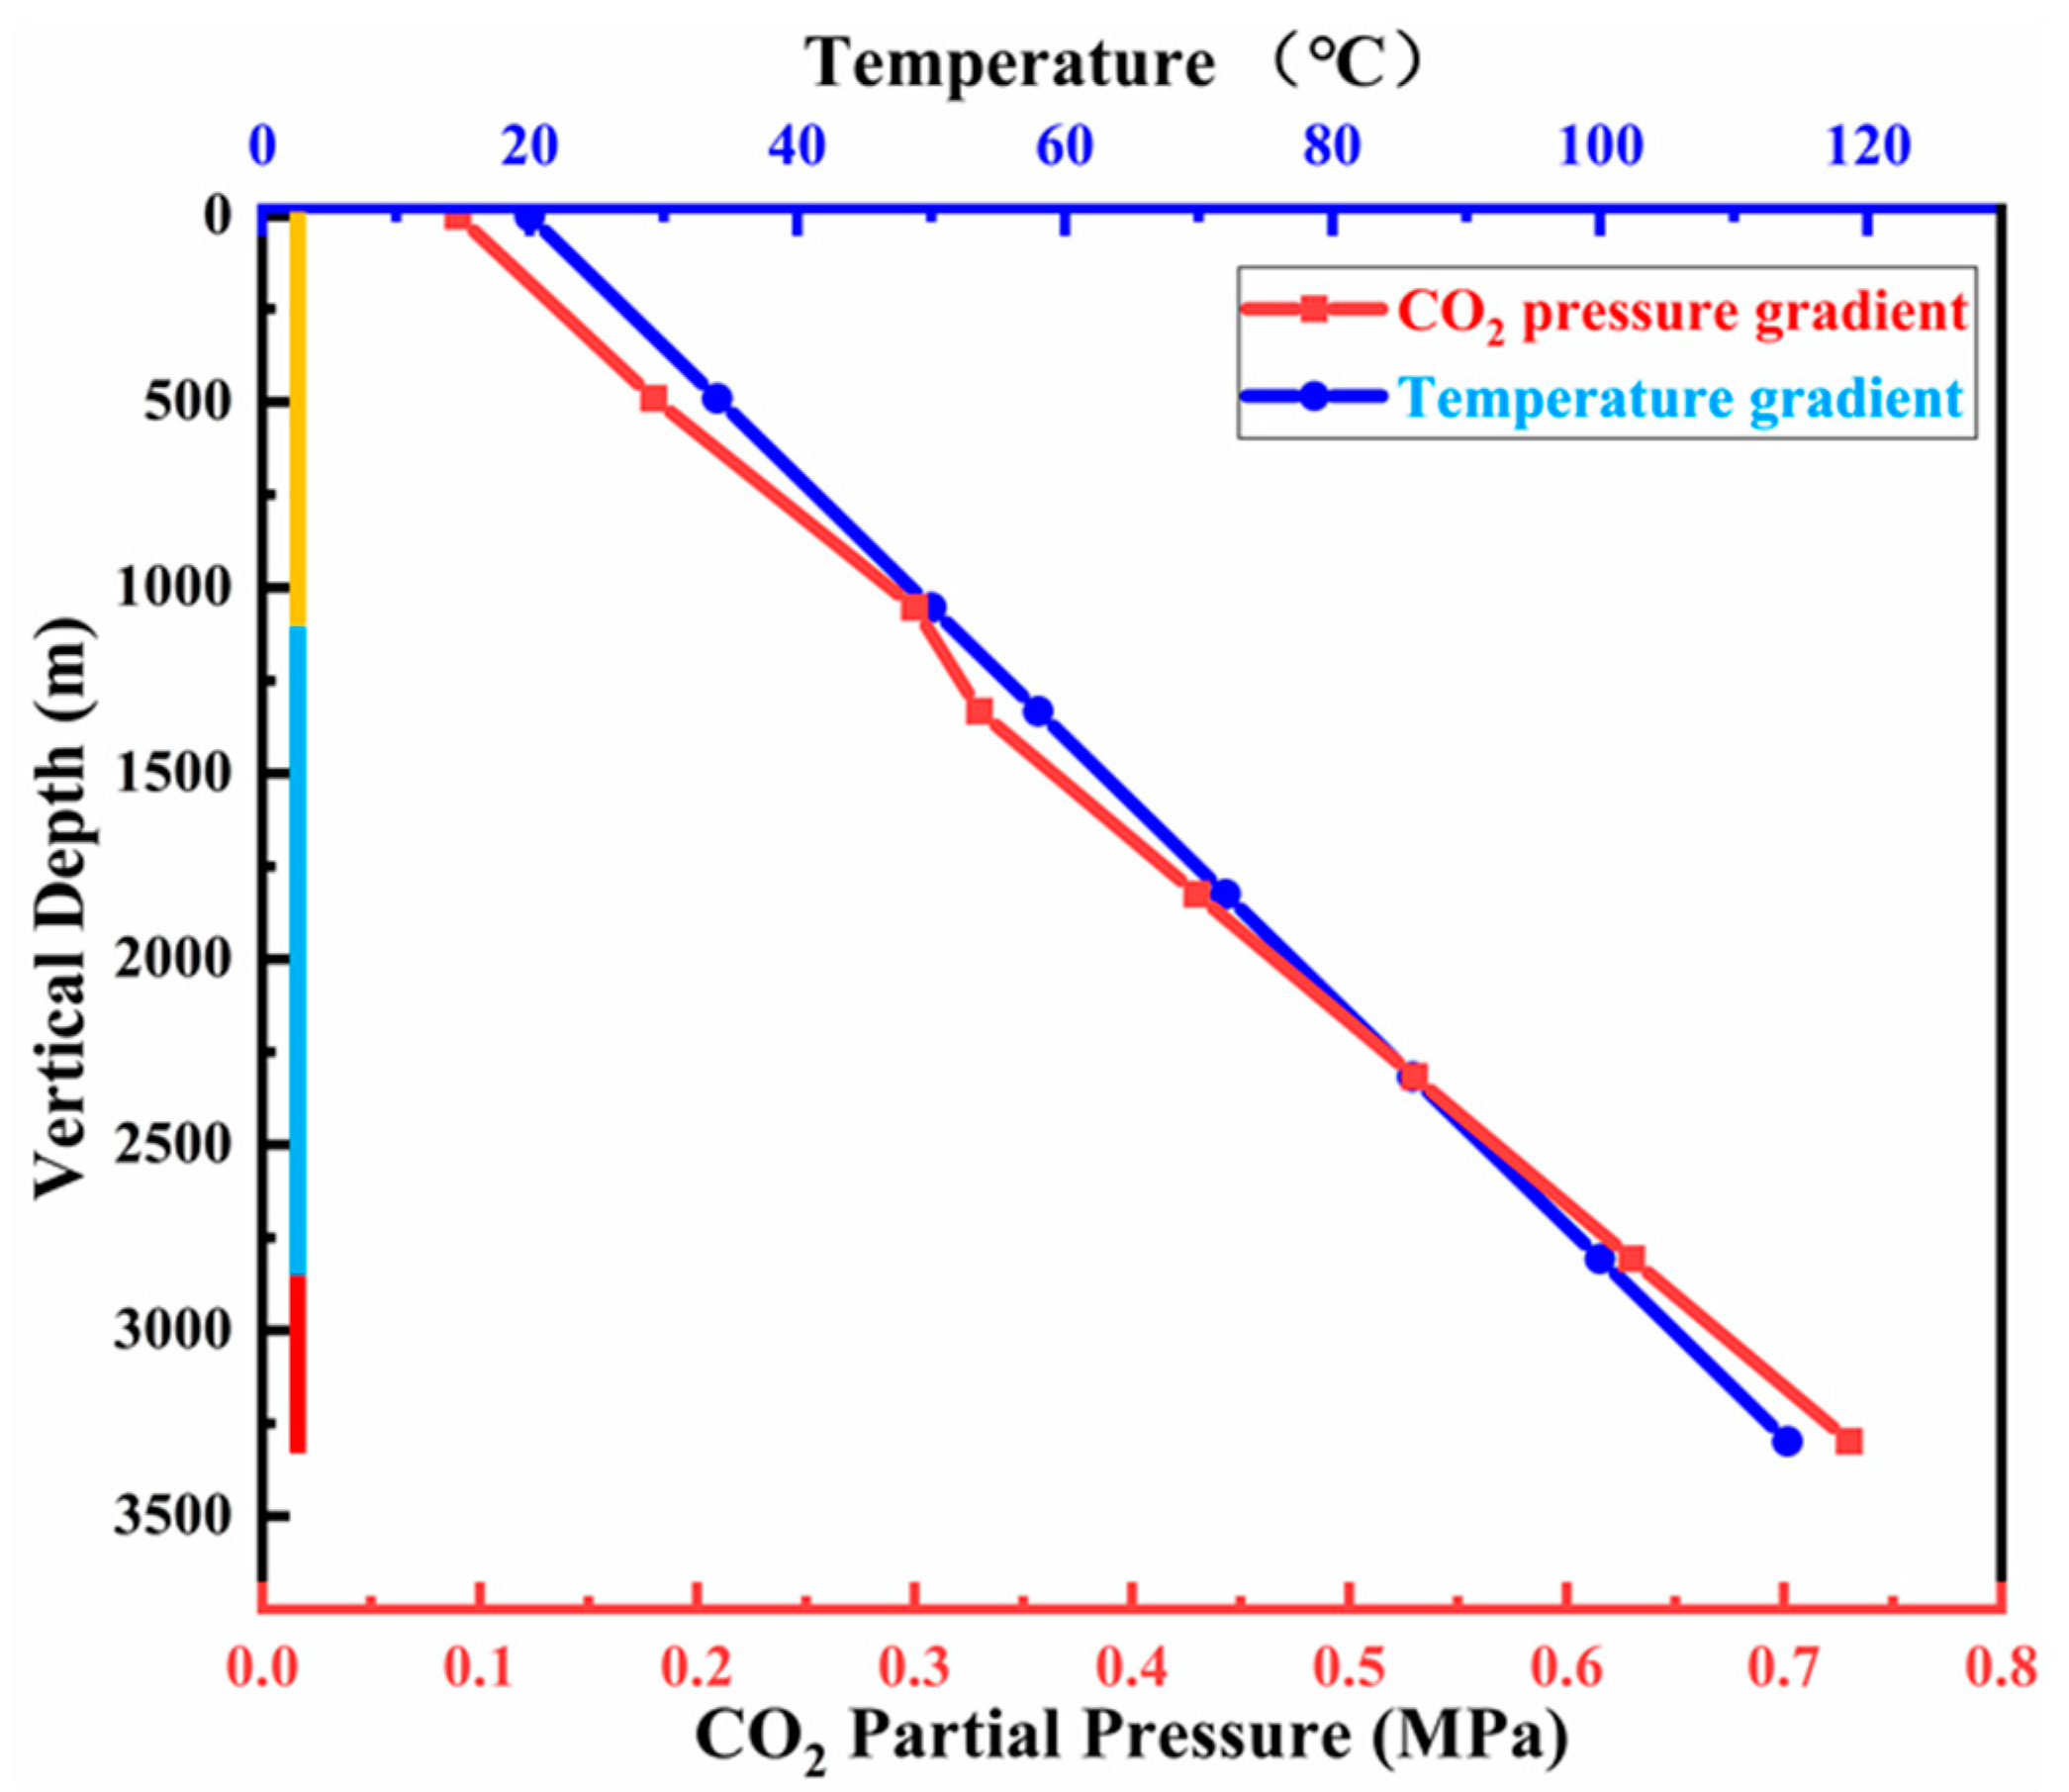
2.2. Experimental Conditions

The experimental conditions adopted in this study are based on LiaoHe Oil field formation conditions at different vertical depths (Figure 1).
Based on the above wellbore temperature profile, casing/tubing anti-corrosion materials will be selected for the medium and high-temperature zones. Therefore, three experimental conditions were established, as shown in Table 2.
The test solution was prepared using 4000 mg/L of Cl and other analytical grade reagents based on the characteristics of the formation water. The solution was then carefully poured into the reactor, and after the specimens were submerged, the reactor was tightly closed. Nitrogen purging was performed for 10 h to deoxygenate the solution, and then CO2 was passed through the solution. The reactor contents were then heated and pressurized to the experimental conditions with a flow rate of 1.5 m/s.

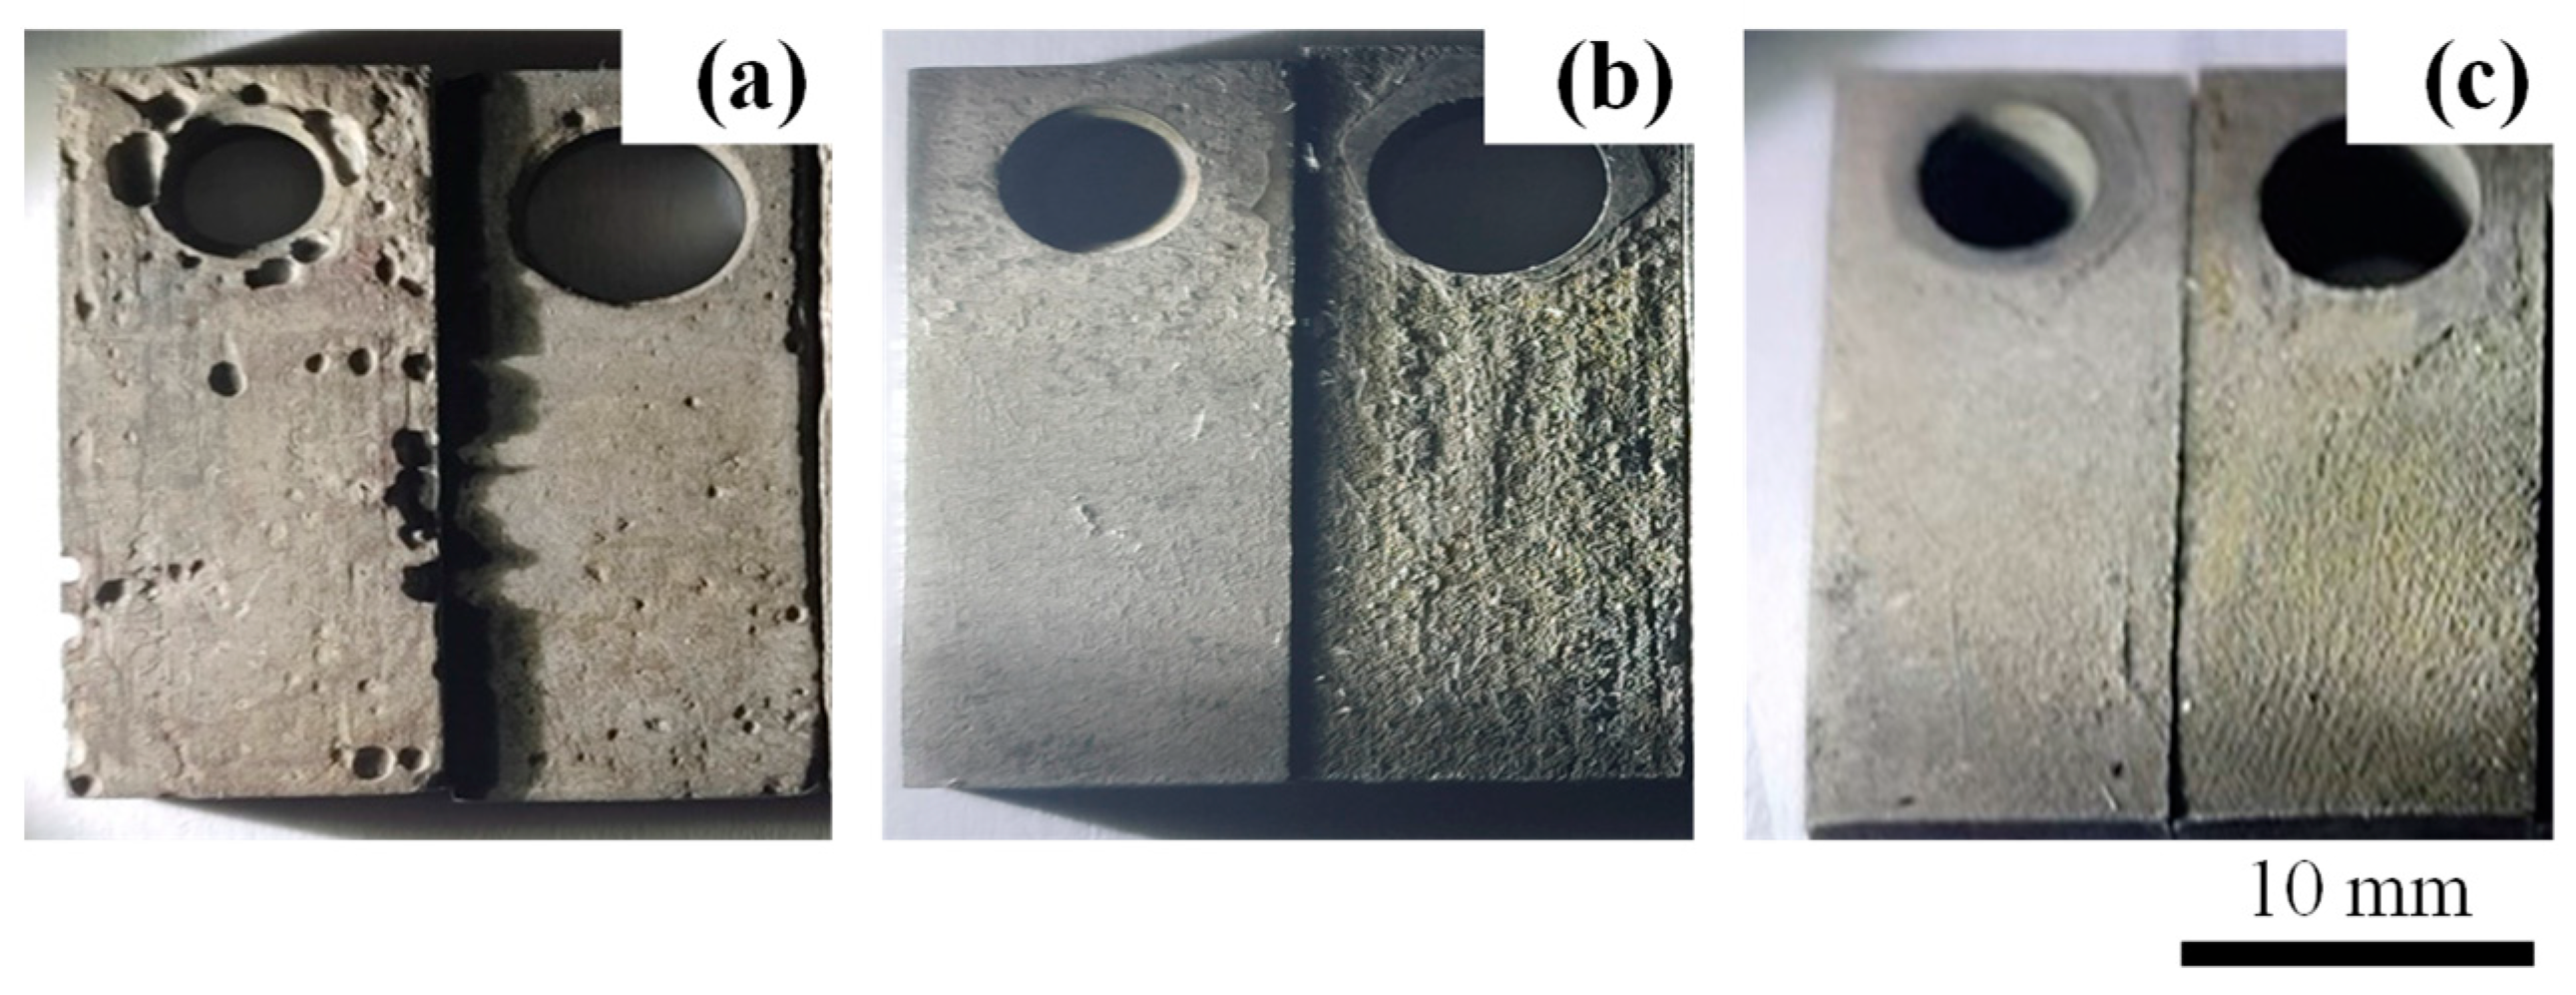
2.3. Weight Loss Test

Dynamic corrosion weight loss experiments were carried out for 72, 168, and 336 h. under the experimental temperature and pressure conditions to determine the corrosion rate. After each test, the specimen was thoroughly dried and analyzed for product film composition and pickling. According to ASTM standard G1-03, cleaning involves wiping the surface with a cotton pad soaked in Clark’s solution (20 g antimony trioxide + 50 g stannous chloride + 1000 mL 38 wt.% hydrochloric acid). After cleaning, the sample is rinsed with distilled water, followed by ethanol, dried, and then weighed. Mass loss due to corrosion is the difference in mass before exposure and the weight obtained after drying. The corrosion rate is estimated based on mass loss (∆m) using Equation (1) [34]:
V c = 87600 m ρ A T
where: Vc is the corrosion rate (mm/a), ∆m is the mass loss (g), ρ is the density (g/cm3), A is the exposed area (cm2), and T is the soaking time (h).

2.4. Micro-Structural Analysis

The morphology and elemental composition of corrosion product films were analyzed by TM-3030 desktop scanning electron microscopy (SEM) and QUANTAX-70 energy dispersive spectroscopy (EDS) derived from Hitachi High-Technologies Corporation Tokyo, Japan. The pitting corrosion morphology and depth after pickling was characterized by LSM-900 confocal laser scanning microscopy (CLSM) derived from Carl Zeiss Microscopy GmbH, Jena, Germany.
The pitting corrosion evaluation comprehensively refers to the standard NACE RP0775 and ASTM G46. A quantitative comparison was made using the pitting corrosion rate, metal penetration method, and pitting factor.

2.4.1. Pitting Rate

The depth of the pit was determined by measuring the difference between the depth of the bottom of the pit as viewed under a microscope and the surface of the metal substrate (datum plane). Once the surface pit depth data has been determined, the depth of the deepest pit is divided by the exposure time, using the following Formula (2) [34] to determine the maximum pitting rate.
P R ( m m / y ) = depth   of   deepest   pit   ( mm ) × 365 exposure   time   ( days )
Table 3 gives the qualitative criteria for explaining the measurement of corrosion and pitting rates. The average corrosion and pitting rates shown in Table 3 are compiled from data from the carbon steel system to guide corrosion degree evaluation.

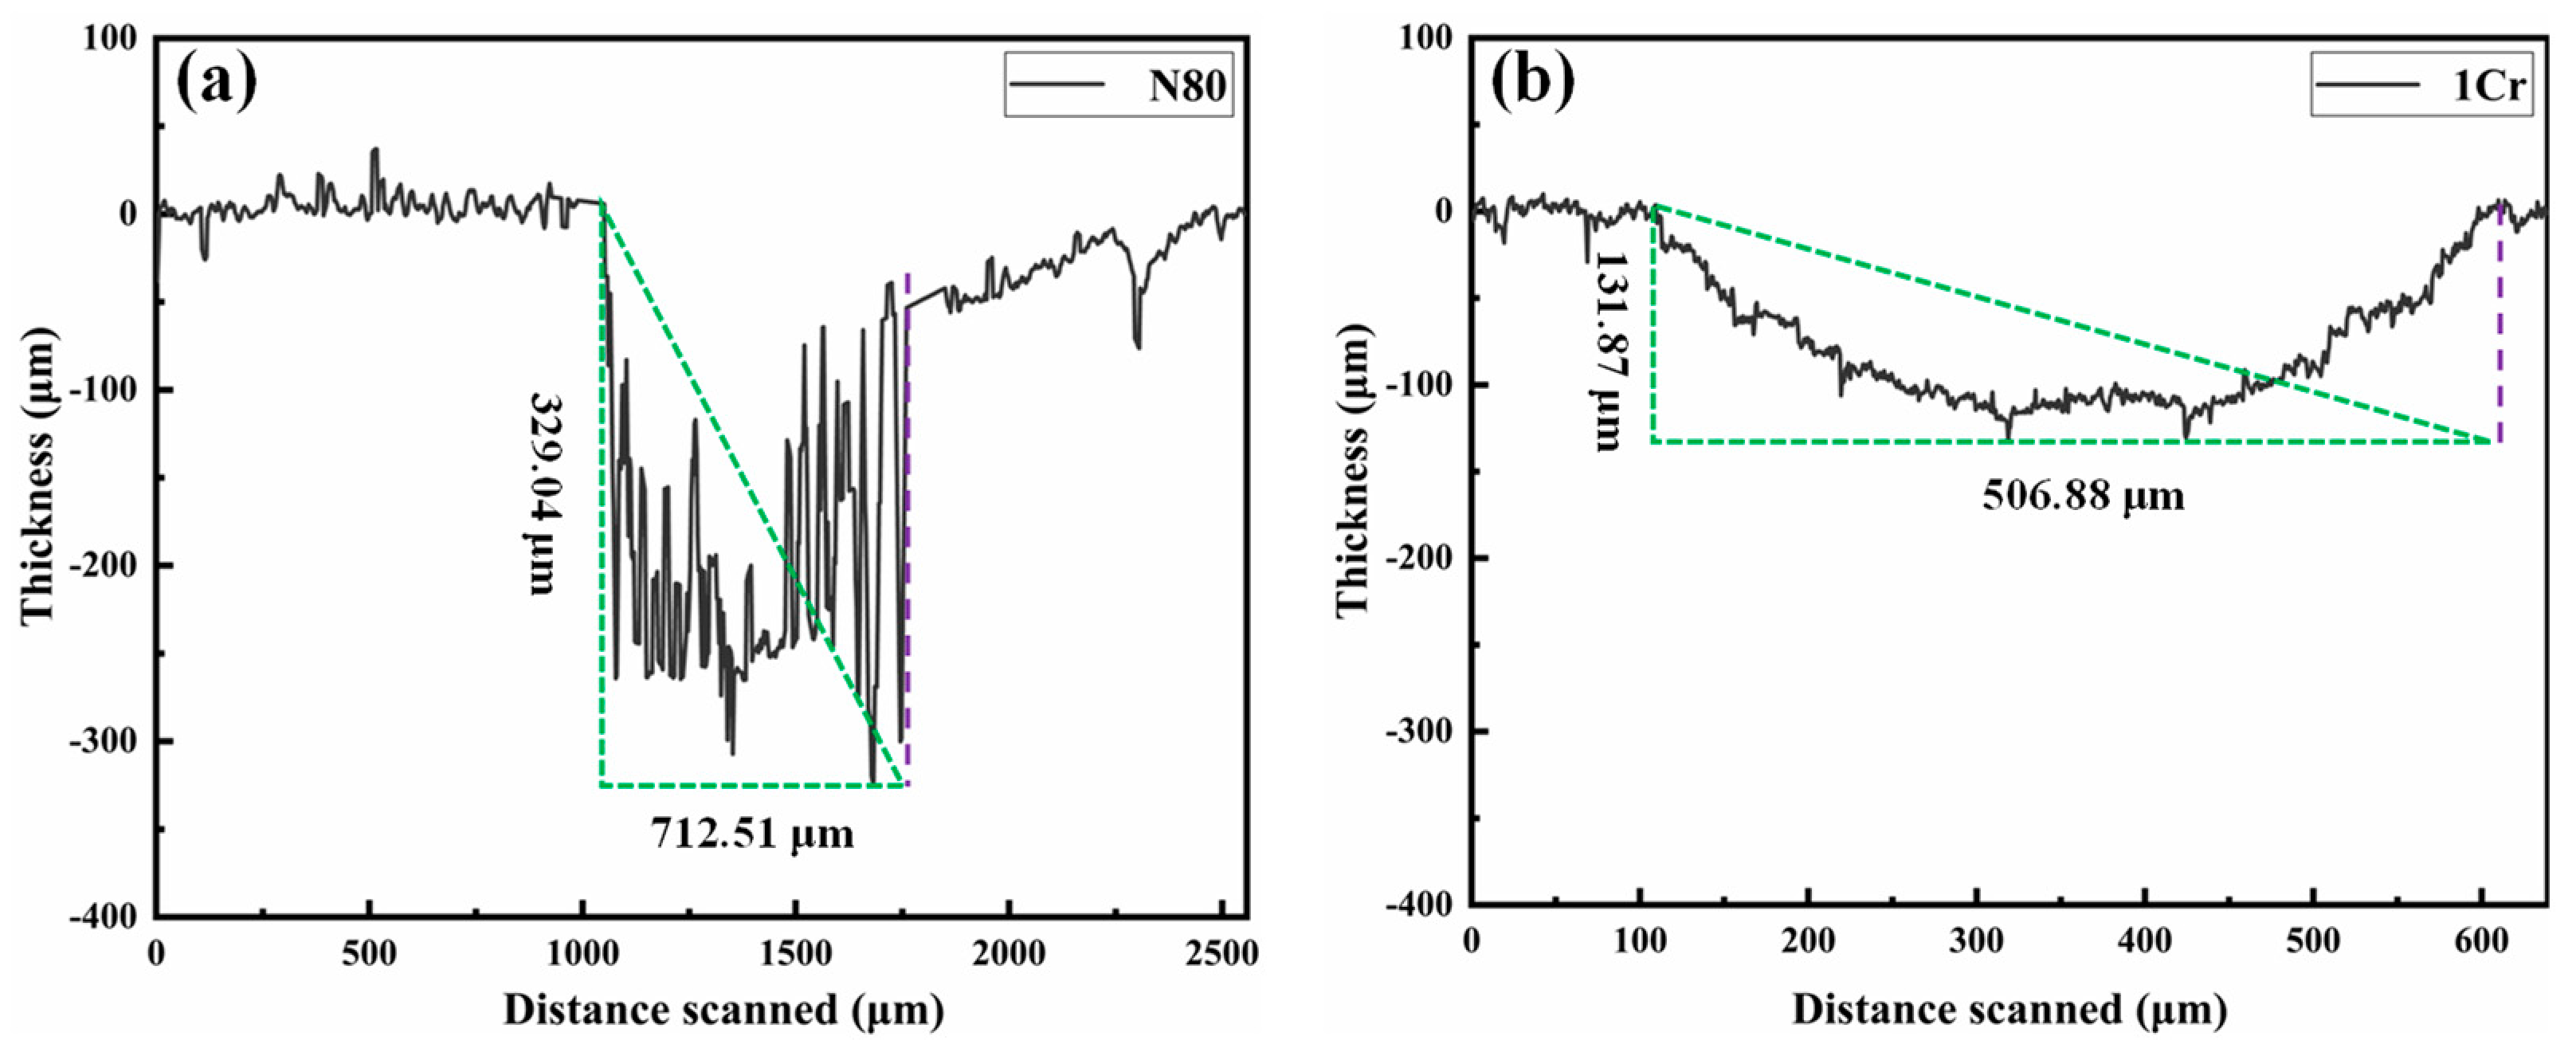
2.4.2. Metal Penetration Method

By measuring the deepest pits, the metal penetration rate is expressed by the average value of the maximum pit depth and the ten deepest pits. In this study, the pitting coefficient is also used to quantify the degree of metal penetration, which is the ratio of the deepest metal penetration to the average metal penetration determined by the weight loss method. The relationship is as follows Formula (3) [34]:
Pitting   Factor = deepest   metal   penetration average   metal   penetration
When the pitting coefficient is 1, it indicates uniform corrosion; the larger the number, the greater the penetration depth. Since the pitting and uniform corrosion rate in this test environment are not very small, the factor can achieve appropriate quantitative results.

3. Results

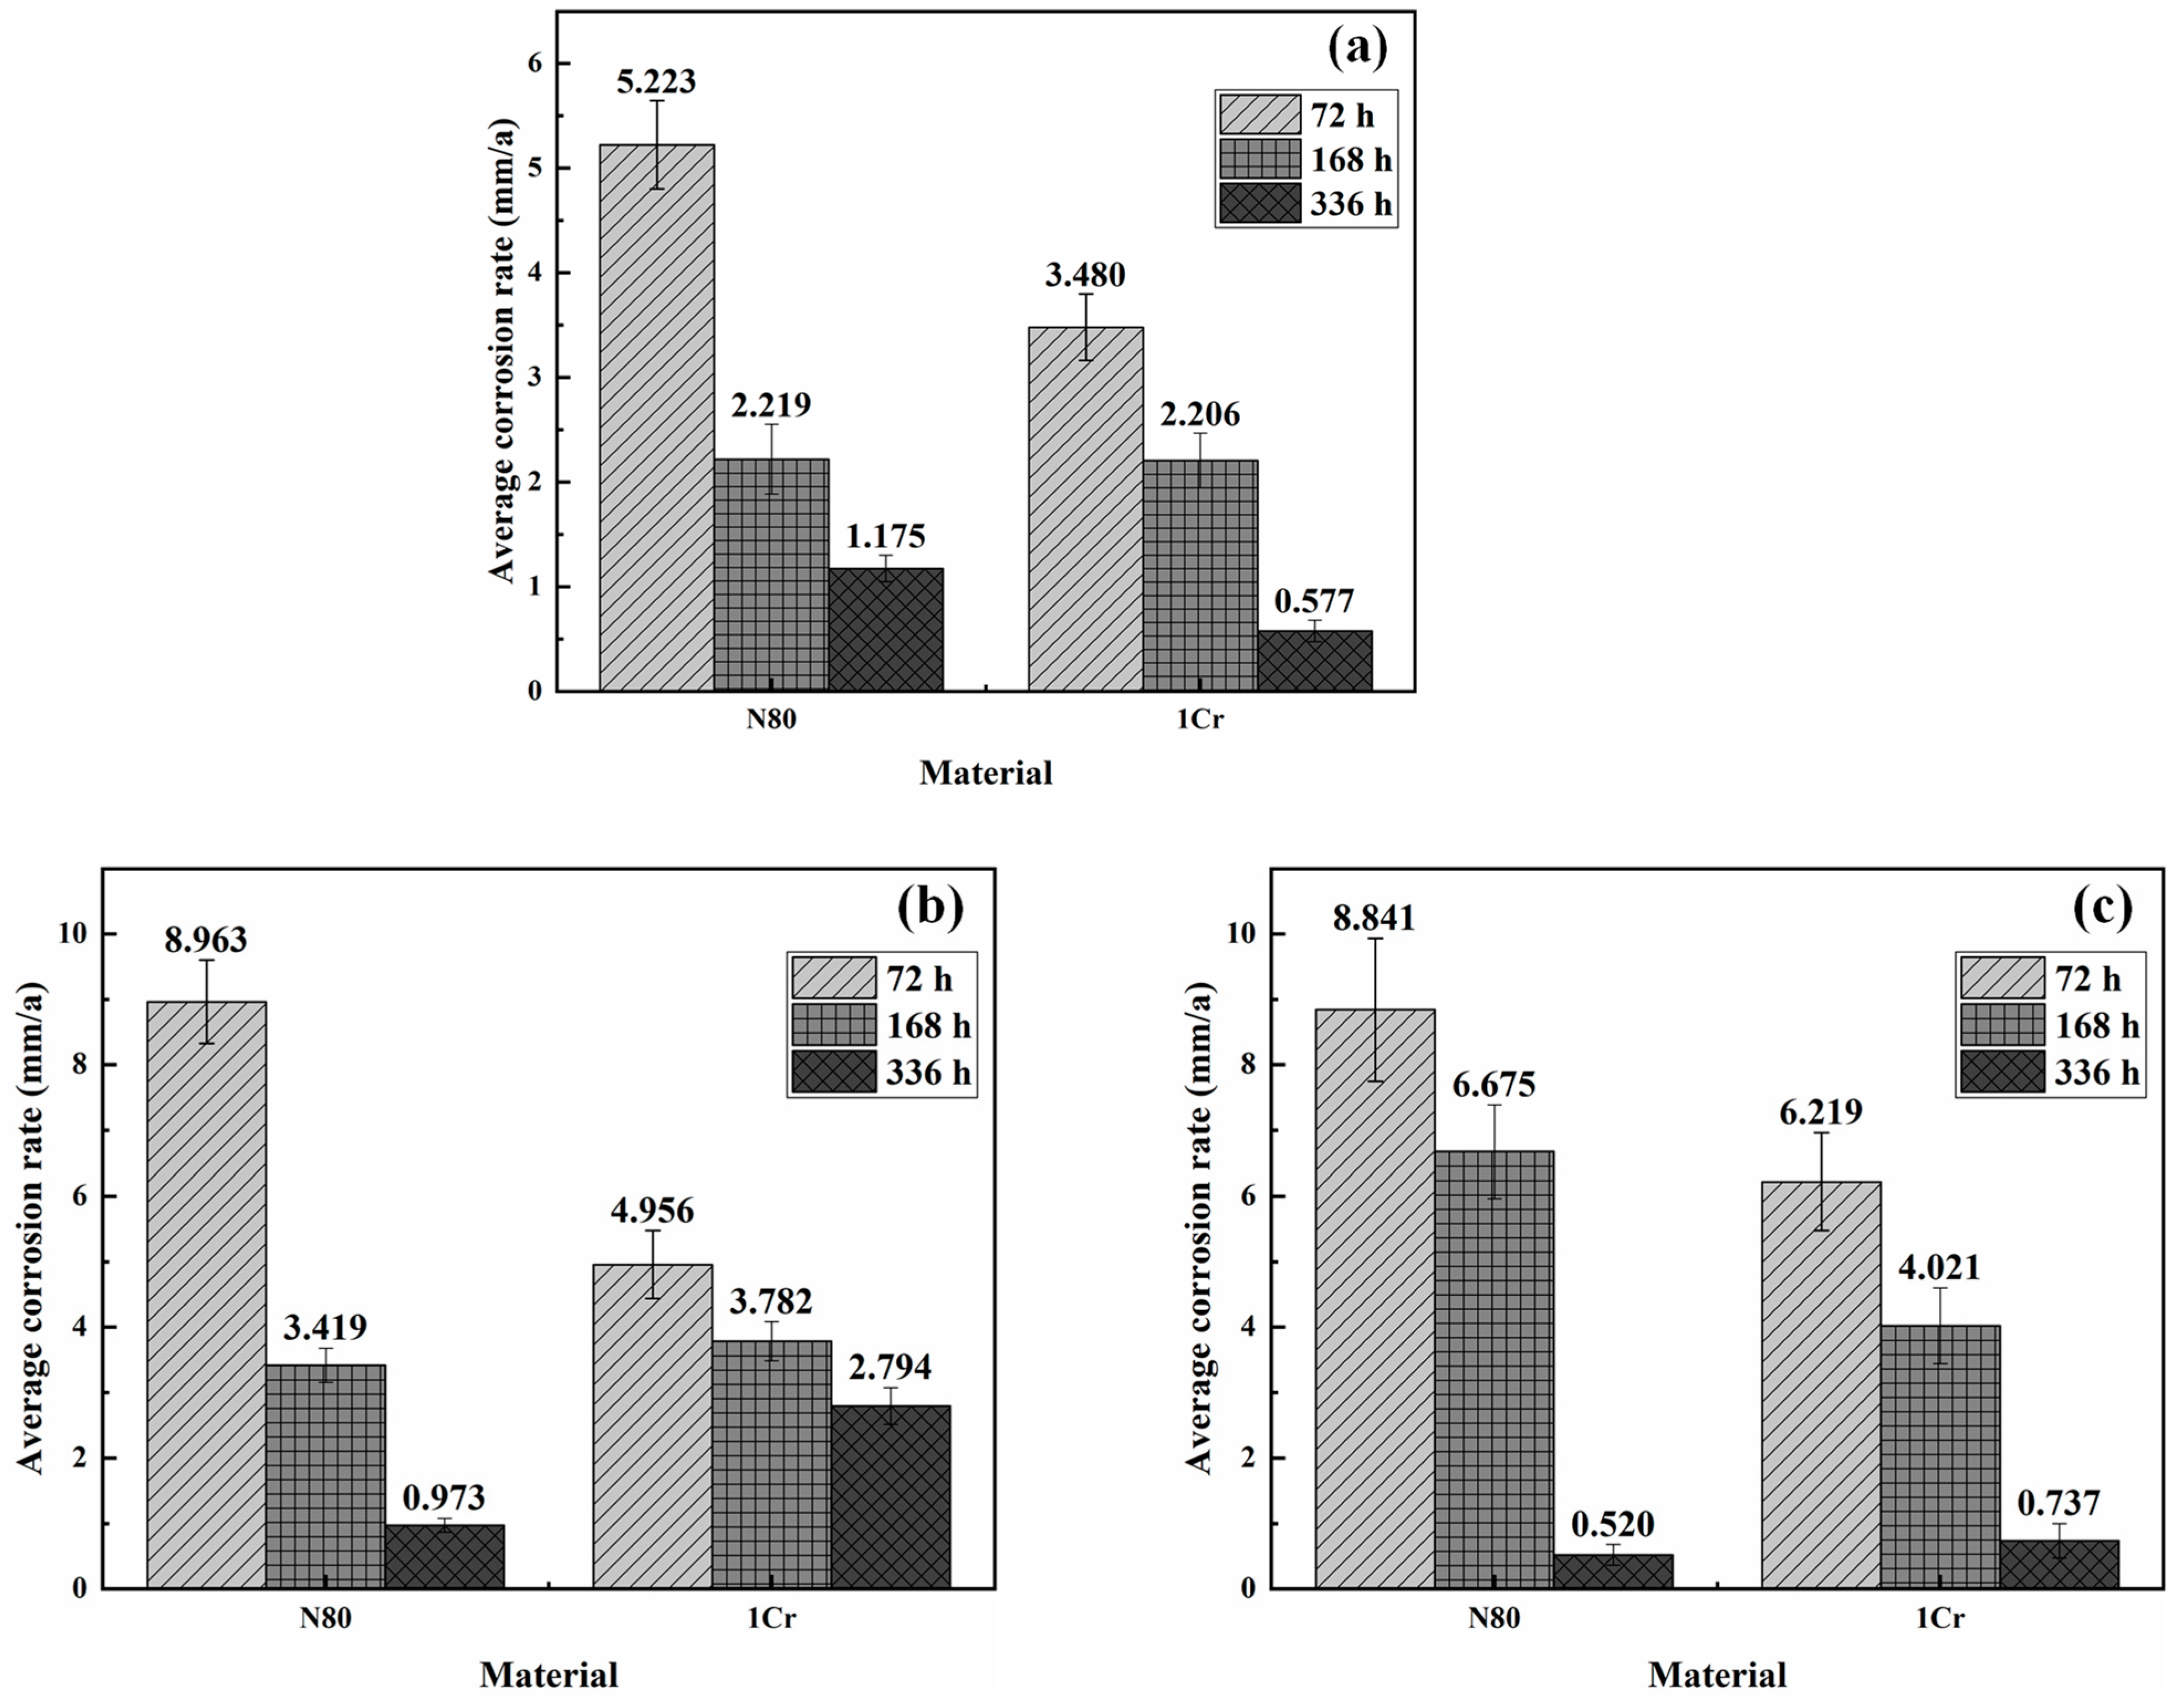
3.1. Effect of Experimental Conditions on Corrosion Rate

Figure 2 compares the average corrosion rates of N80 and 1Cr sample specimens after 72, 168, and 336 h exposure to CO2 corrosion under different temperature and pressure conditions. From this figure, we can see that the average corrosion rate of both materials shows an obvious trend of decrease. Generally, the rate of corrosion of N80 is higher than that of 1Cr, a clear indication that 1Cr can improve the anti-corrosion properties of ordinary carbon steel at medium temperature and low CO2 partial pressure (50 °C-0.30 MPa) (Figure 2a). However, at 100 °C and 0.63 MPa CO2 partial pressure, the corrosion rate of 1Cr is approximately 10% and 187% higher than that of N80 (Figure 2b) after 168 h and 336 h, respectively. With further increase in temperature and CO2 partial pressure (114 °C-CO2: 0.73 MPa), the corrosion rate of 1Cr remains lower until after 336 h, as we can see an increase of its corrosion rate by 44% than N80 (summarized in Table 7-1*).
The data analysis shows that carbon steel N80 and 1Cr low chromium steel have some corrosion resistance benefits in certain situations. However, according to the qualitative evaluation results of uniform corrosion in Table 3 and Table 4, the weight loss corrosion performance of the two low alloy steels in the above three corrosive environments is severe uniform corrosion. Since the above corrosion rate is only a short-term evaluation result, in the actual corrosion conditions, the long-term corrosion rate of the metal matrix will show a significant attenuation law due to the protection of the product film. Therefore, the above corrosion degree only qualitatively reflects the short-term corrosion resistance, and cannot represent the long-term applicability evaluation results.

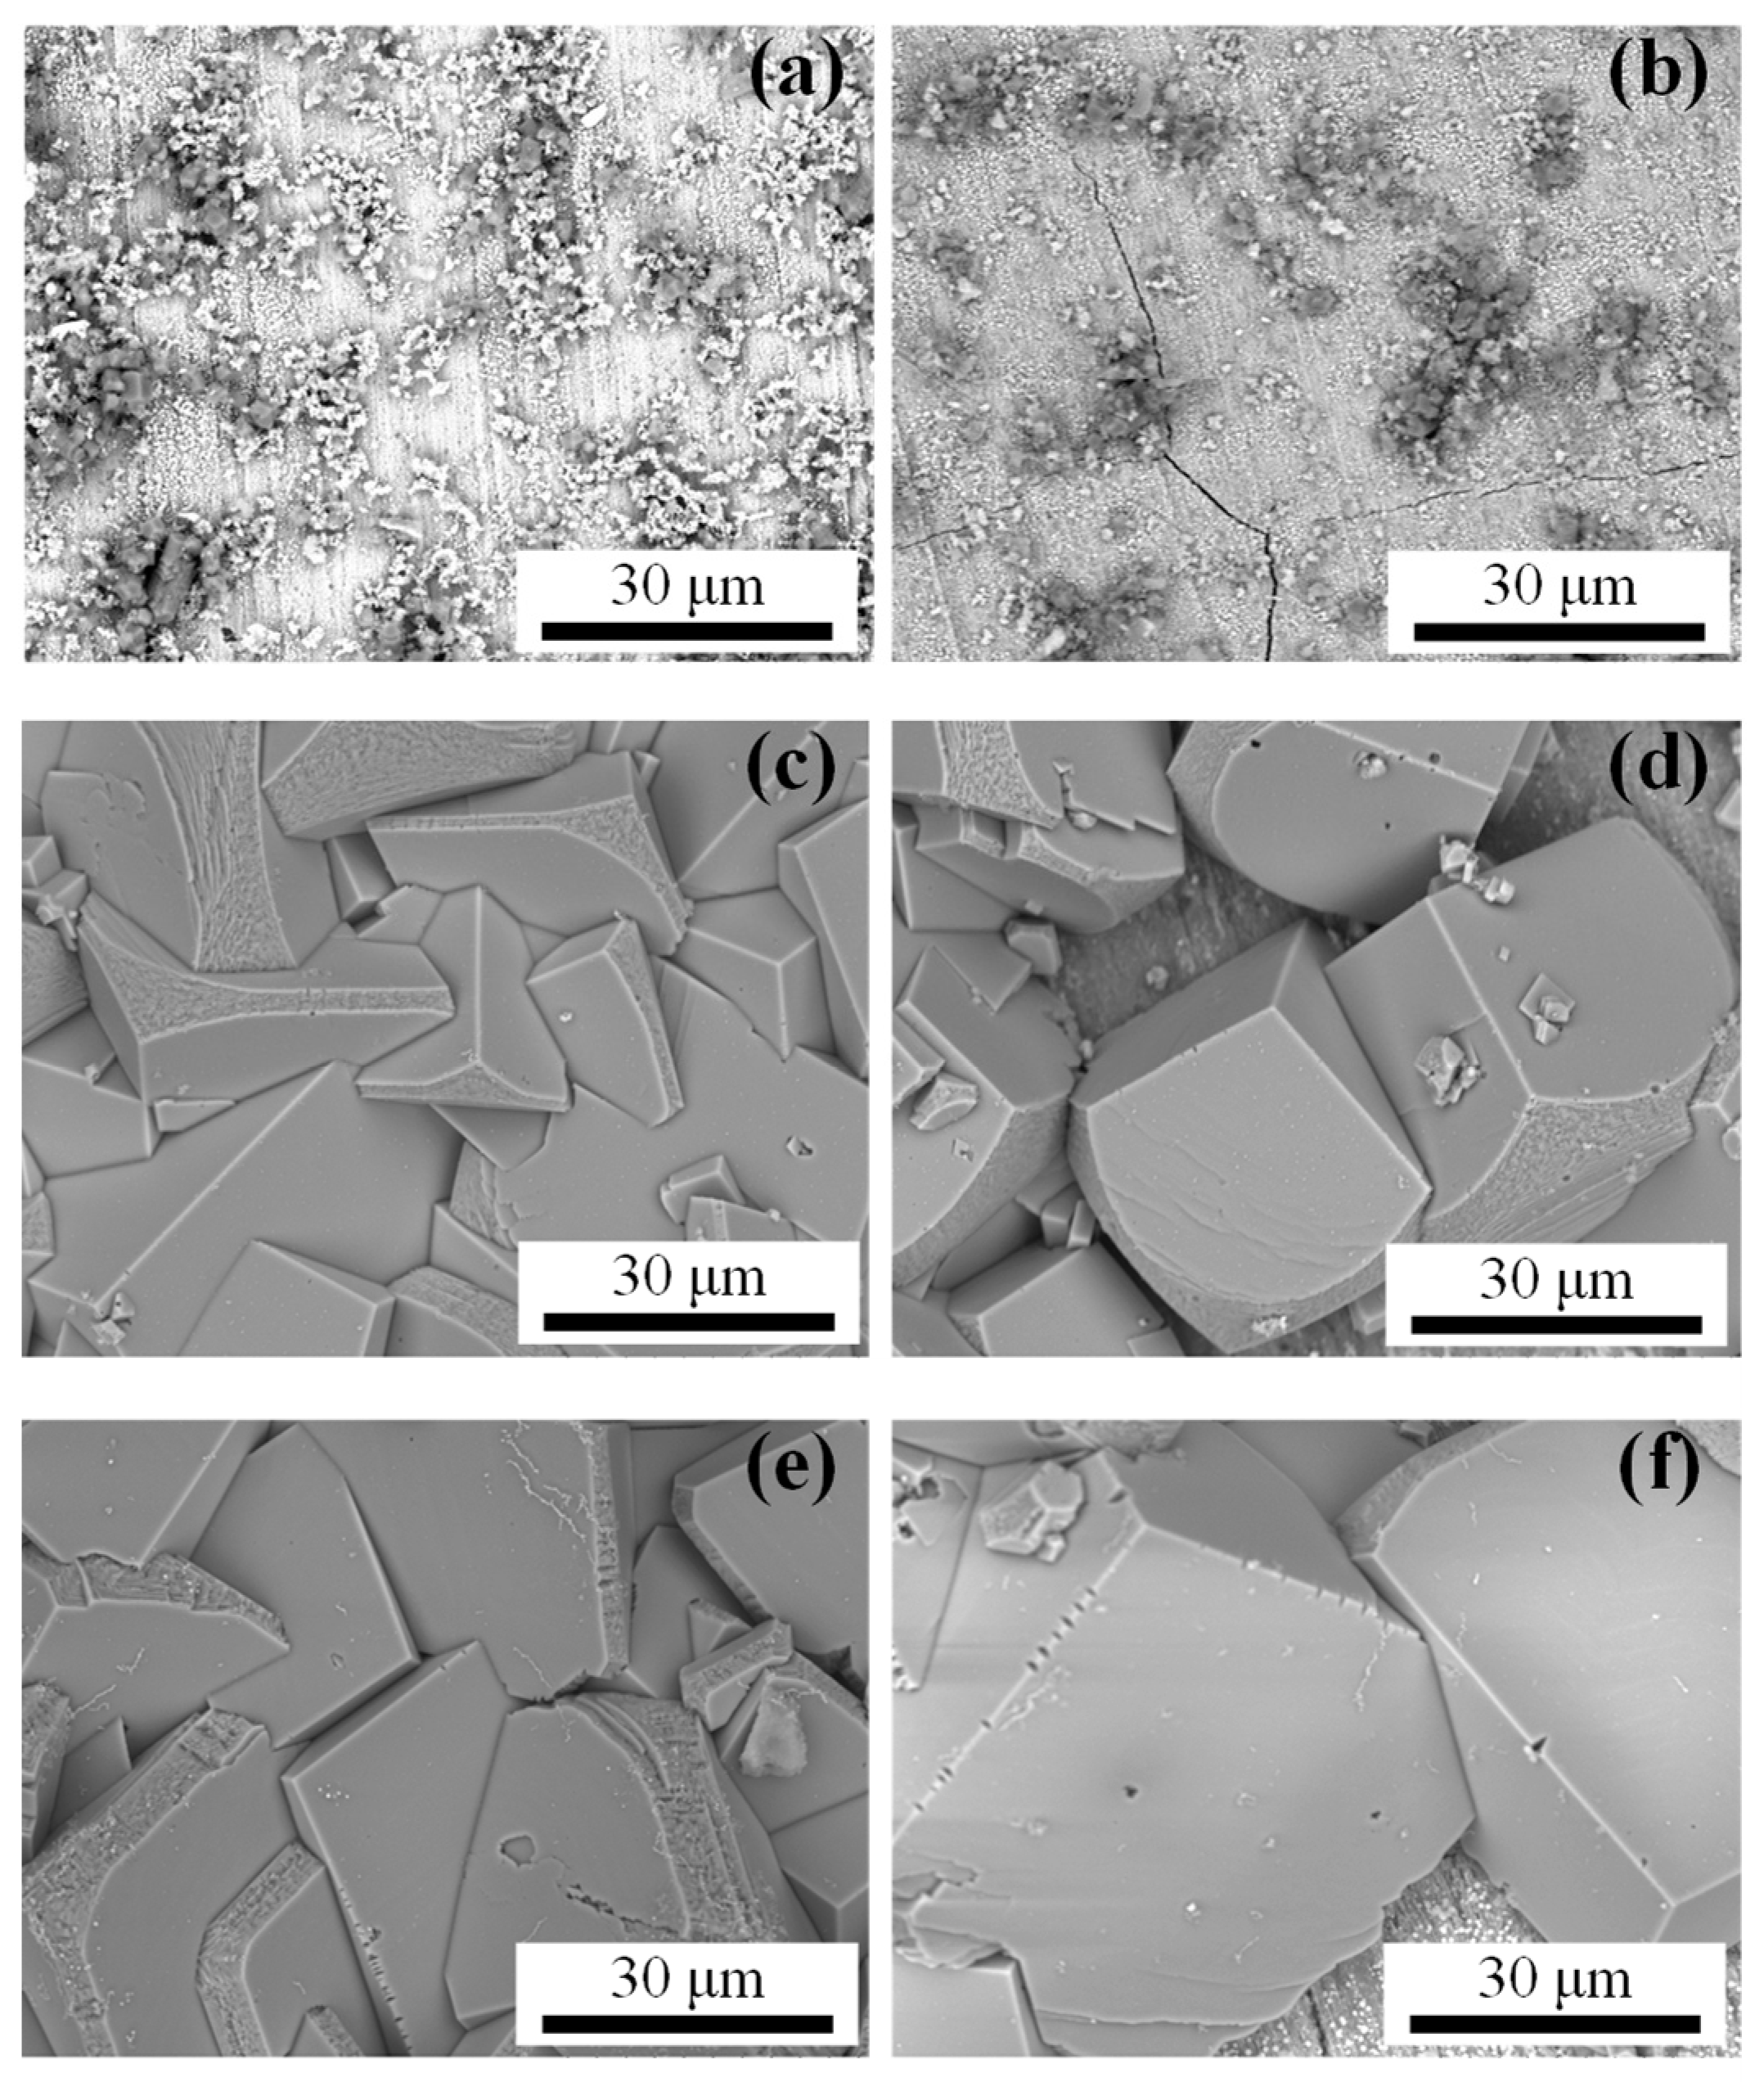
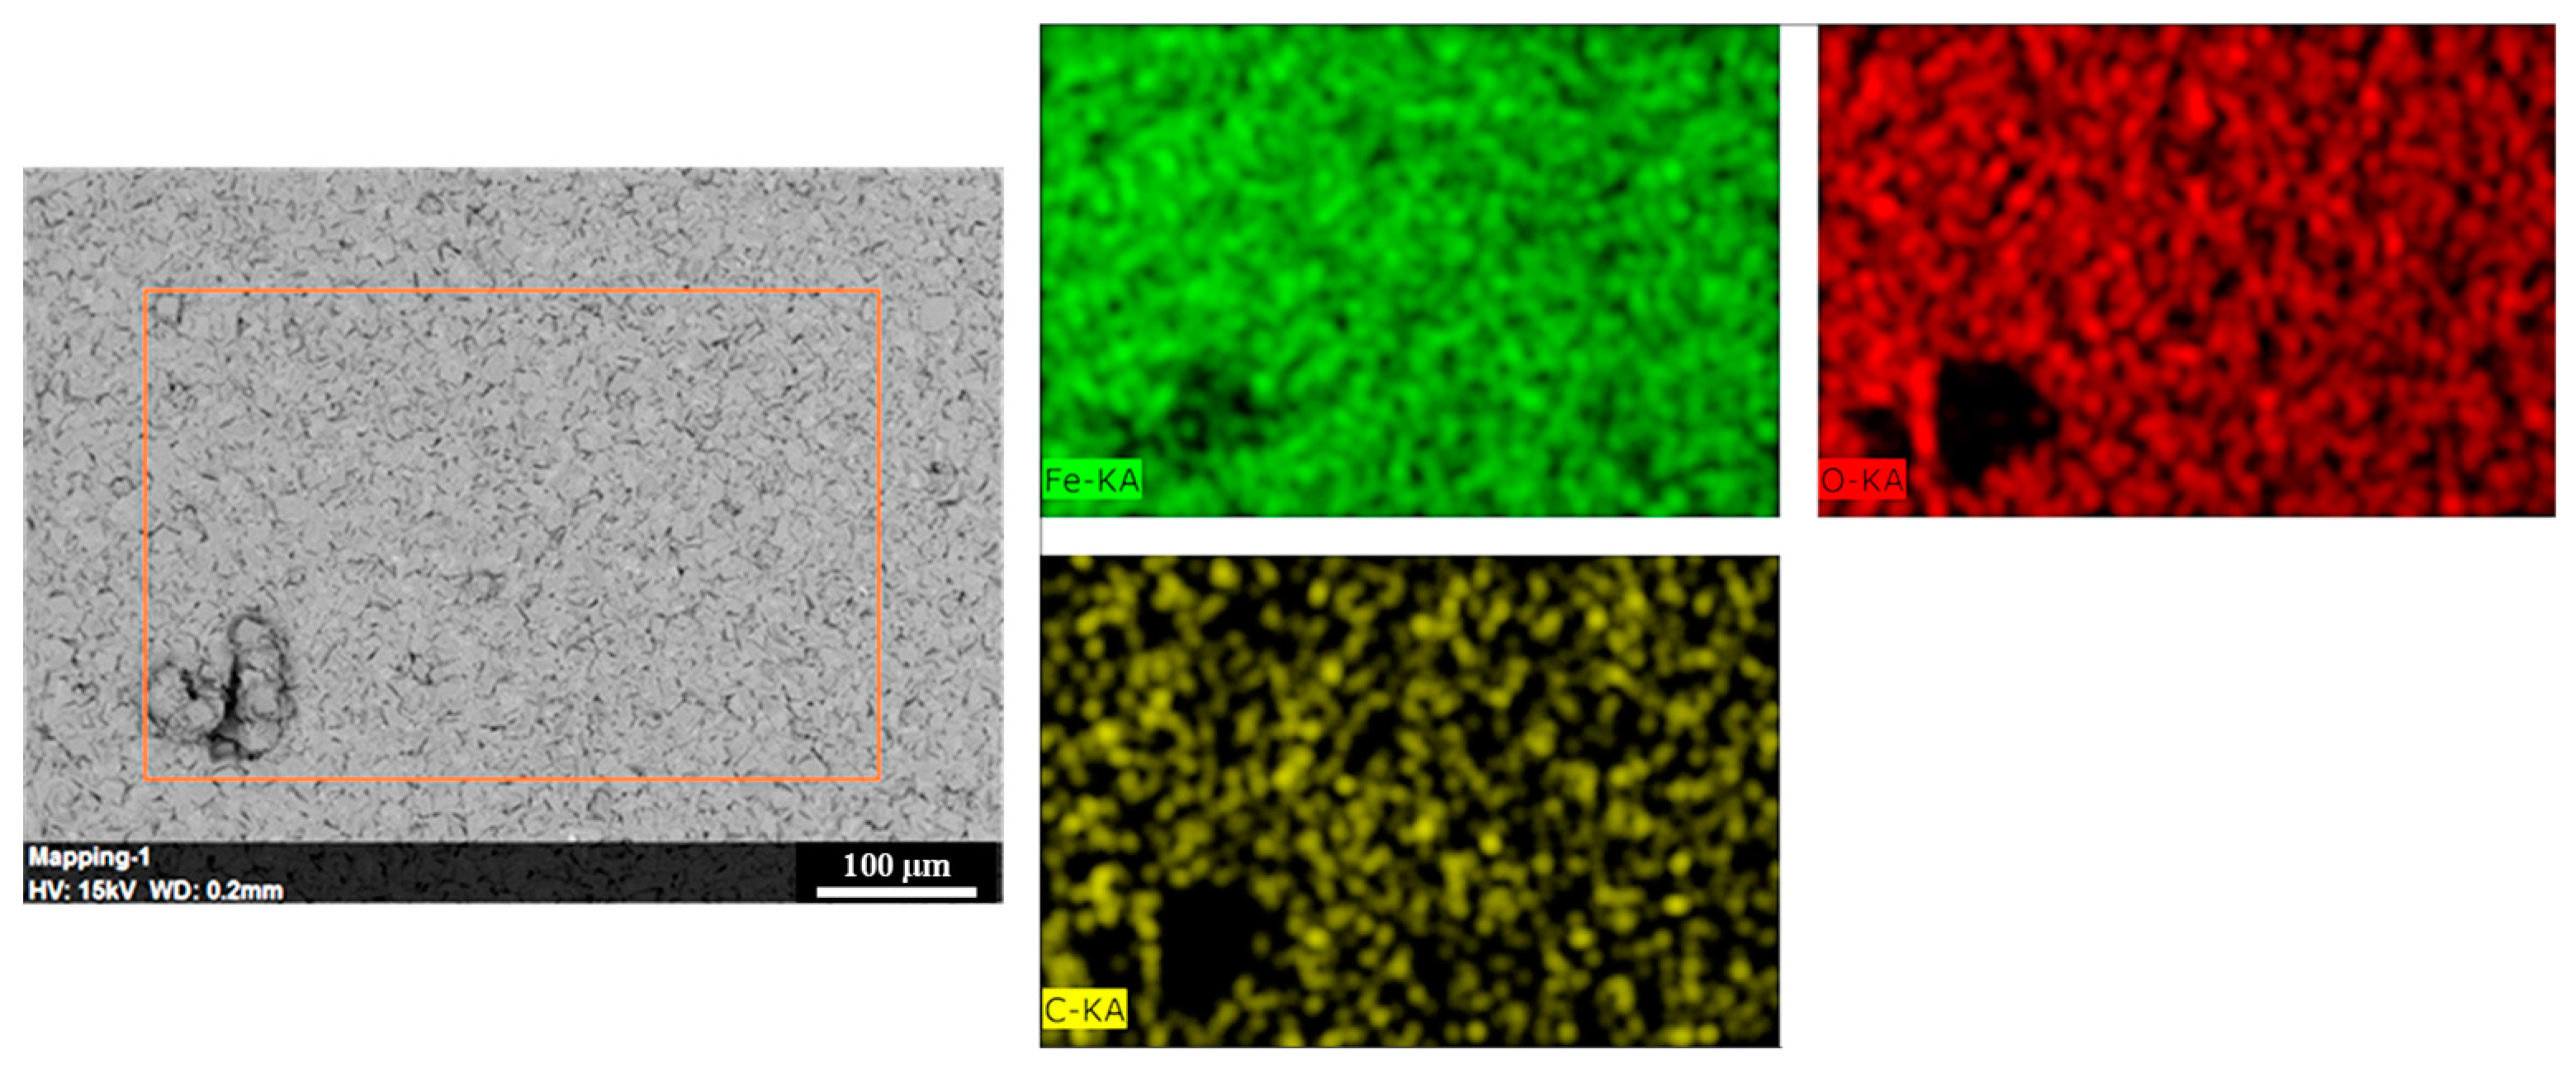
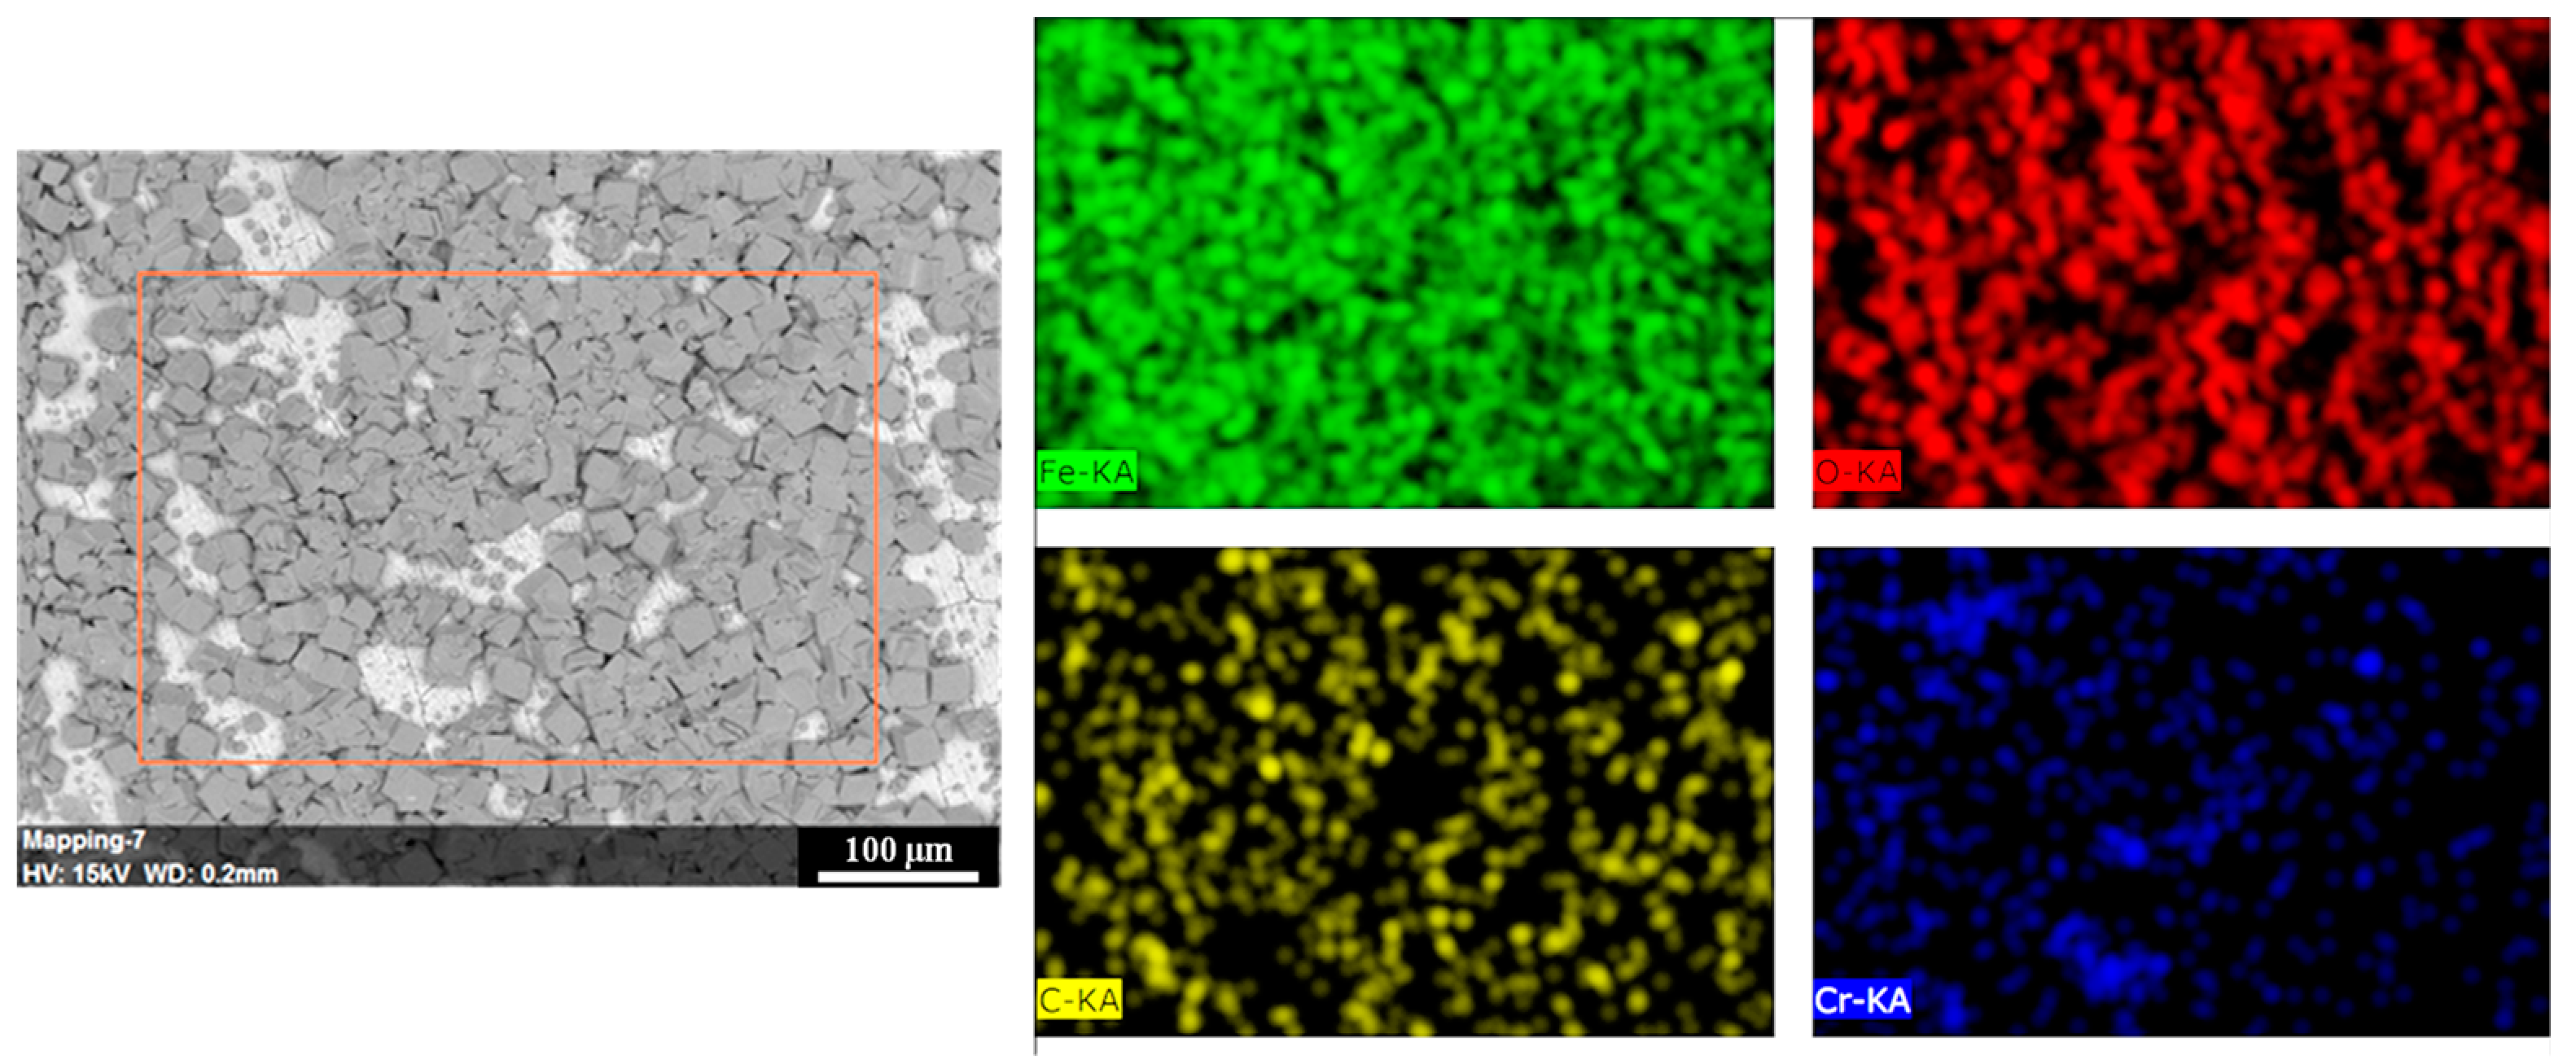
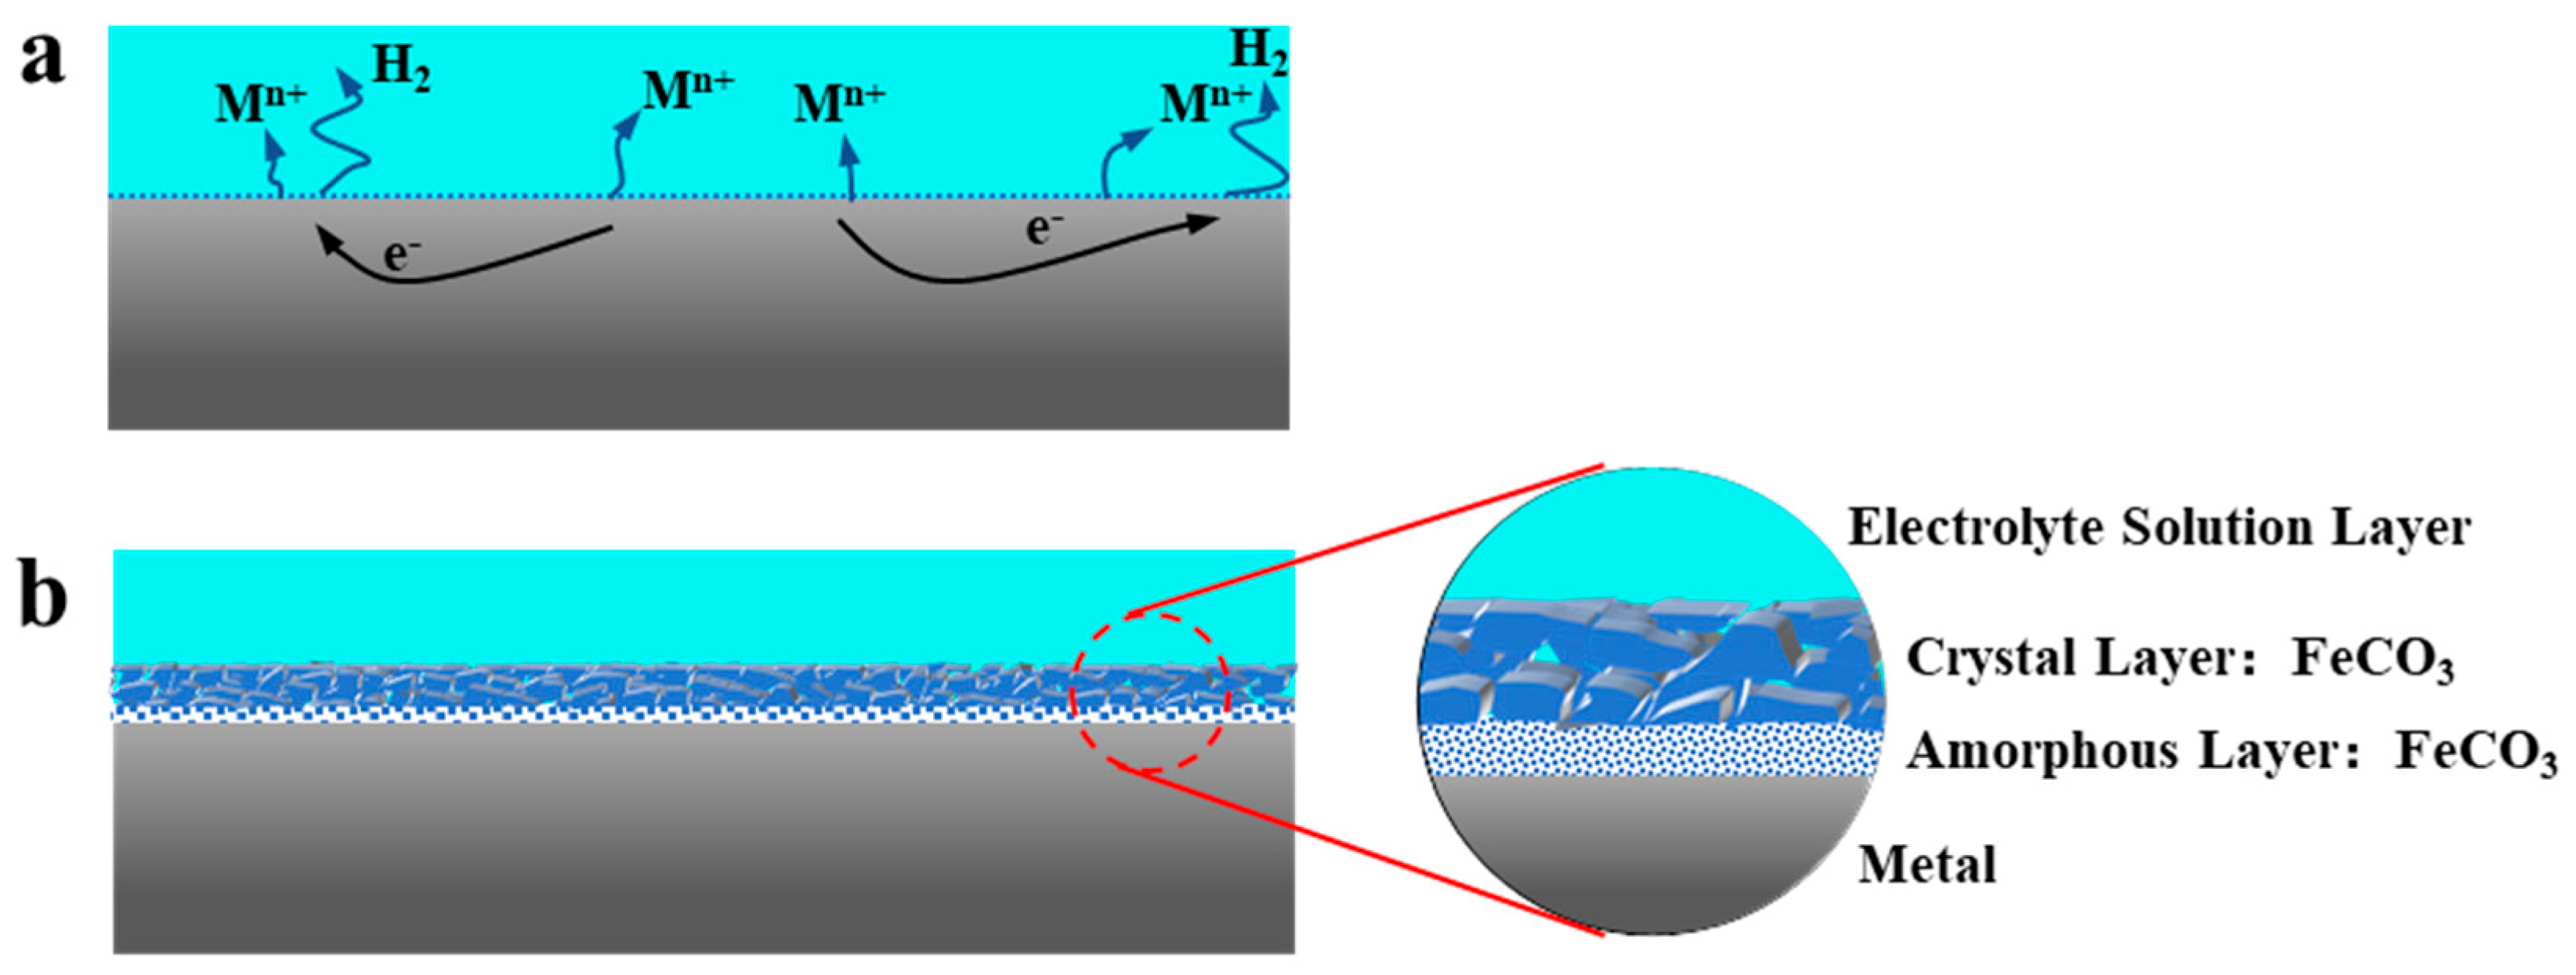
3.2. Effect of Corrosion Conditions on Product Film

The microscopic corrosion morphology under different experimental conditions of 1Cr steel and N80 steel was analyzed by scanning electron microscope (SEM), as shown in Figure 3. At medium temperature and low partial pressure, a small amount of crystal-like stripes embedded on the dense inner film formed on the surface of N80 steel, as shown in Figure 3a. Energy dispersive X-ray spectroscopy (EDS) analysis of the inner film shows that its main components are Fe, C, and O, as shown in Table 5. The atomic content of O is approximately three times higher than Fe’s, so the inner corrosion product is composed mainly of FeCO3.
Guo et al. [12,35] proposed that when the degree of saturation of FeCO3 reaches the critical point, the nucleation rate exceeds the grain growth rate, forming small particle size and even amorphous FeCO3 film. Additionally, small amount of crystal-like FeCO3 appear on the surface of 1Cr steel. The exposed product film shows cracking due to air drying, water loss, and increased internal stress (Figure 3b). EDS analysis shows that the elemental composition of the inner film consists of Fe, O, Cr, C, and up to 2.4 wt.% chromium content, which was much higher than the content of steel substrate (1 wt.%). Low chromium steel forms a two-phase mixed membrane of FeCO3 and Cr(OH)3 due to competition between the two in a CO2 corrosion environment. Due to the dissolution of some FeCO3 in a weakly acidic environment (Formula (4)), the content of Cr(OH)3 in the product film gradually increases, improving the toughness, integrity, and compactness of the corrosion film, and presents a fair degree of “chromium-rich” characteristics.
F e C O 3 + H 2 C O 3 F e ( H C O 3 ) 2
At high temperatures and high partial pressure, FeCO3 crystal-like stripes appear on the surfaces of both specimens. Due to flow velocity chipping and scouring effects, some grains have “ring-shaped” edges (Figure 3c–f). However, there is a variance in the thickness and consistency of the corrosion product film (FeCO3). On the one hand, the outermost layer of N80 is completely covered, compactly stacked, and has no obvious pore characteristics (Figure 4). The results of energy spectrum element analysis showed that the three elements of Fe, O and C were evenly distributed, which confirmed the integrity of the product film and further confirmed that the composition of the product film was ferrous carbonate. On the other hand, the crystal stacking clearance on the outer layer of 1Cr low chromium steel is significantly high, and some secondary layers’ product film is not covered (Figure 5). At the same time, it was found that there was obvious enrichment of Cr element in the exposed sub-outer layer, which confirmed that the main material composition of the amorphous film was Cr(OH)3. This may be due to the insufficient strength of the corrosion product film generated, which is peeled off the matrix surface due to the shear force generated by the fluid flow. It is also possible that the cation-selective permeability of amorphous Cr(OH)3 product film prevents the migration of Fe2+ ions generated by the anodic dissolution of the metal matrix, leading to the formation of less corrosion products after its deposition occurs on the surfaces. According to the microstructure of Figure 6, it can be inferred that the incompleteness of the 1Cr steel product film is most likely due to the coupling mechanism of the above two effects (summarized in Table 7-2*).
The observations above indicate that at 50 °C and a CO2 partial pressure of 0.30 MPa, the crystalline product film on the surface of carbon steel does not inhibit corrosion. Instead, the dense amorphous FeCO3 film on the inner layer decreases the corrosion rate. The corrosion rate of low chromium steel is primarily controlled by the colloidal mixed product film formed by the co-deposition of FeCO3 and Cr(OH)3. This dense corrosion product film plays a significant role in inhibiting corrosion. At high partial pressure and high temperature, a dense crystalline FeCO3 film forms on the surface of N80 steel, which blocks the mass transfer process between the metal matrix and the corrosion medium, thus inhibiting further corrosion. However, low chromium steel 1Cr is not immune to corrosion in this environment as its weight loss corrosion rate remains high. Additionally, its corrosion products are not dense, and the adhesion to the matrix is weak, causing the product film to peel off the matrix surface under fluid shear stress. This results in an incomplete product film on the material surface, and the poor stability of the product film reduces the corrosion resistance of low chromium steel 1Cr at these conditions.

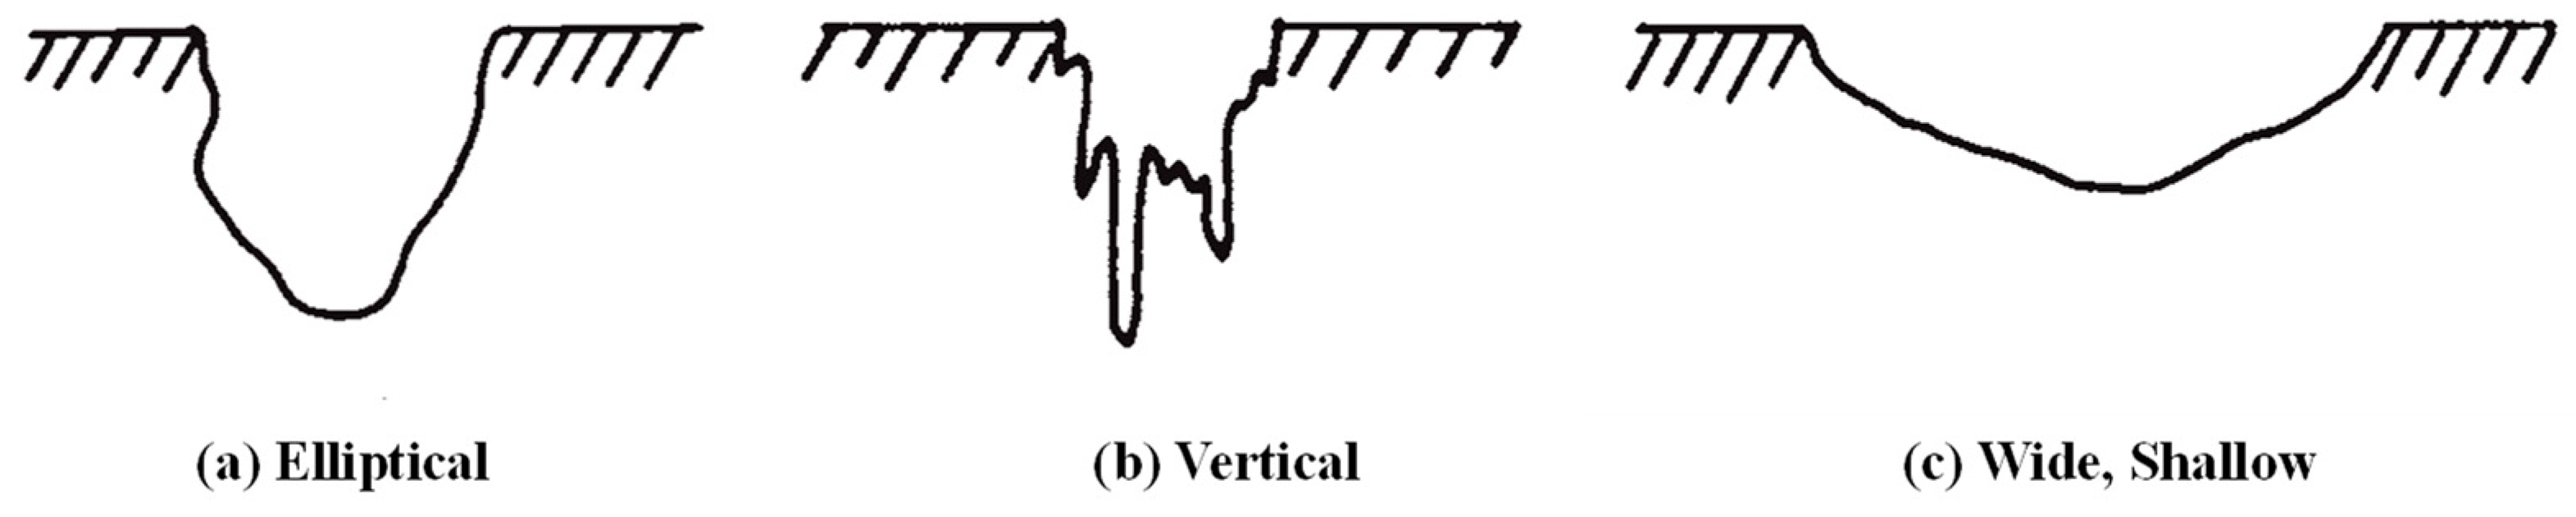
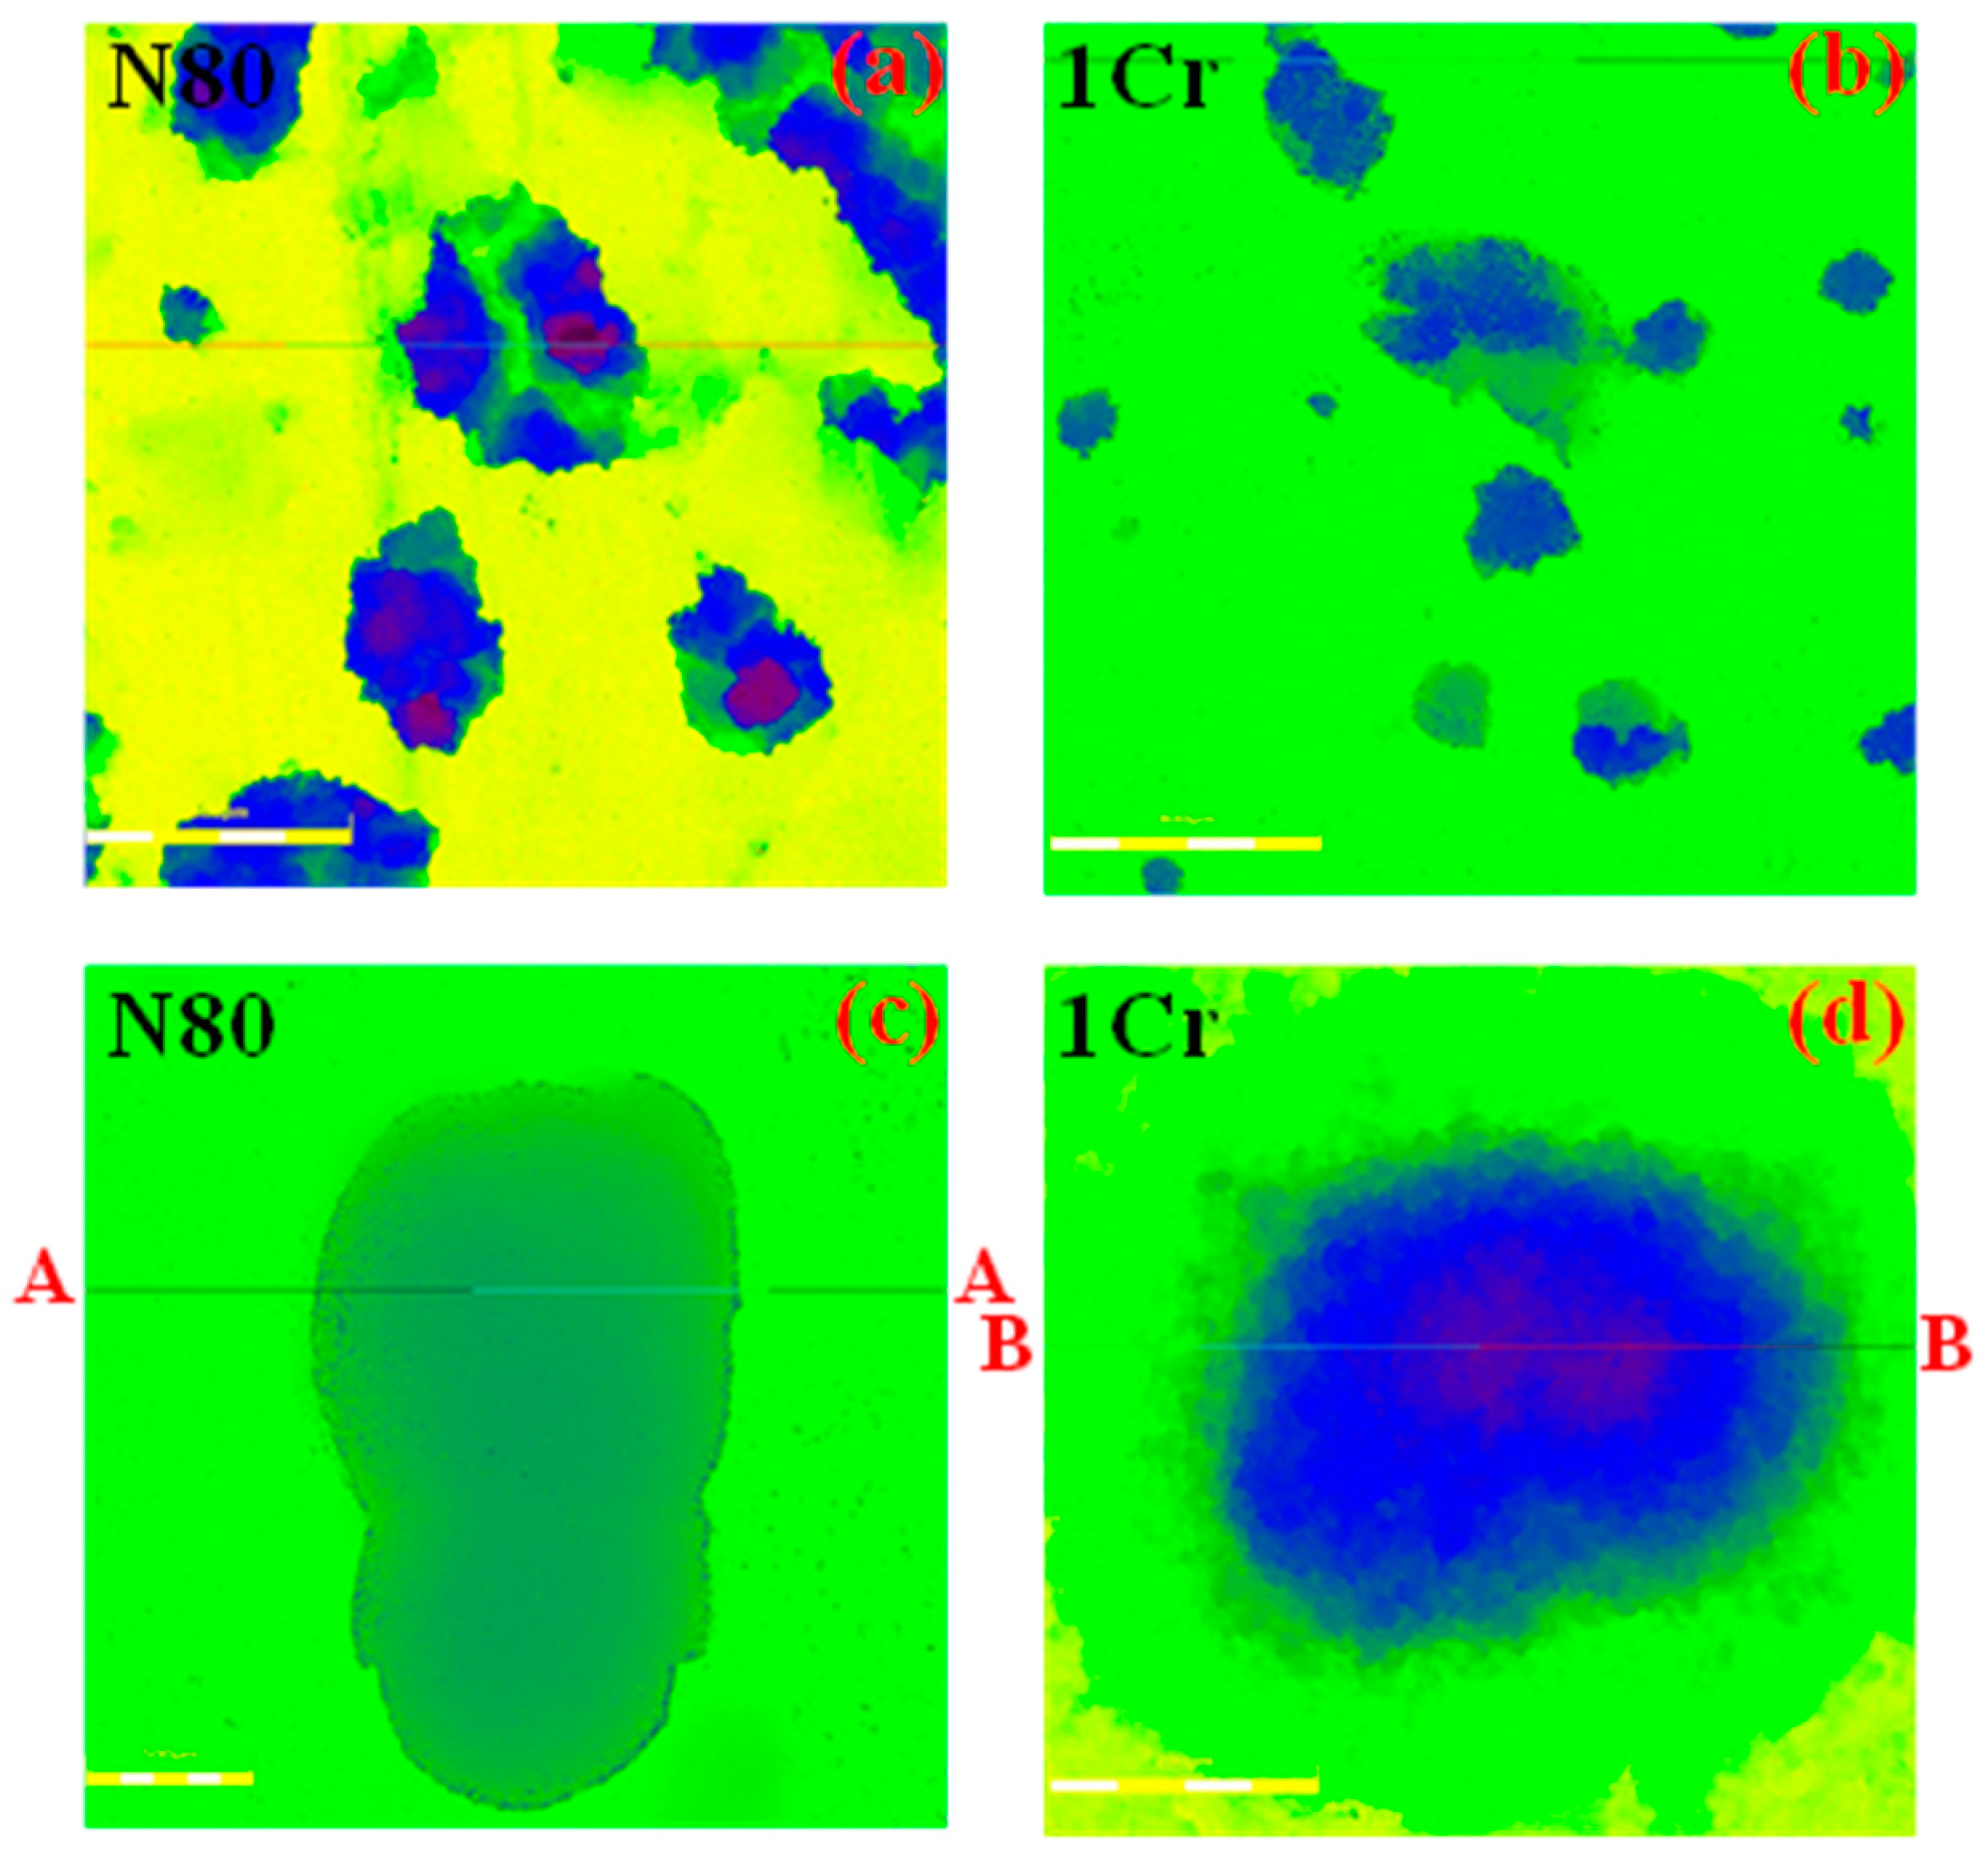
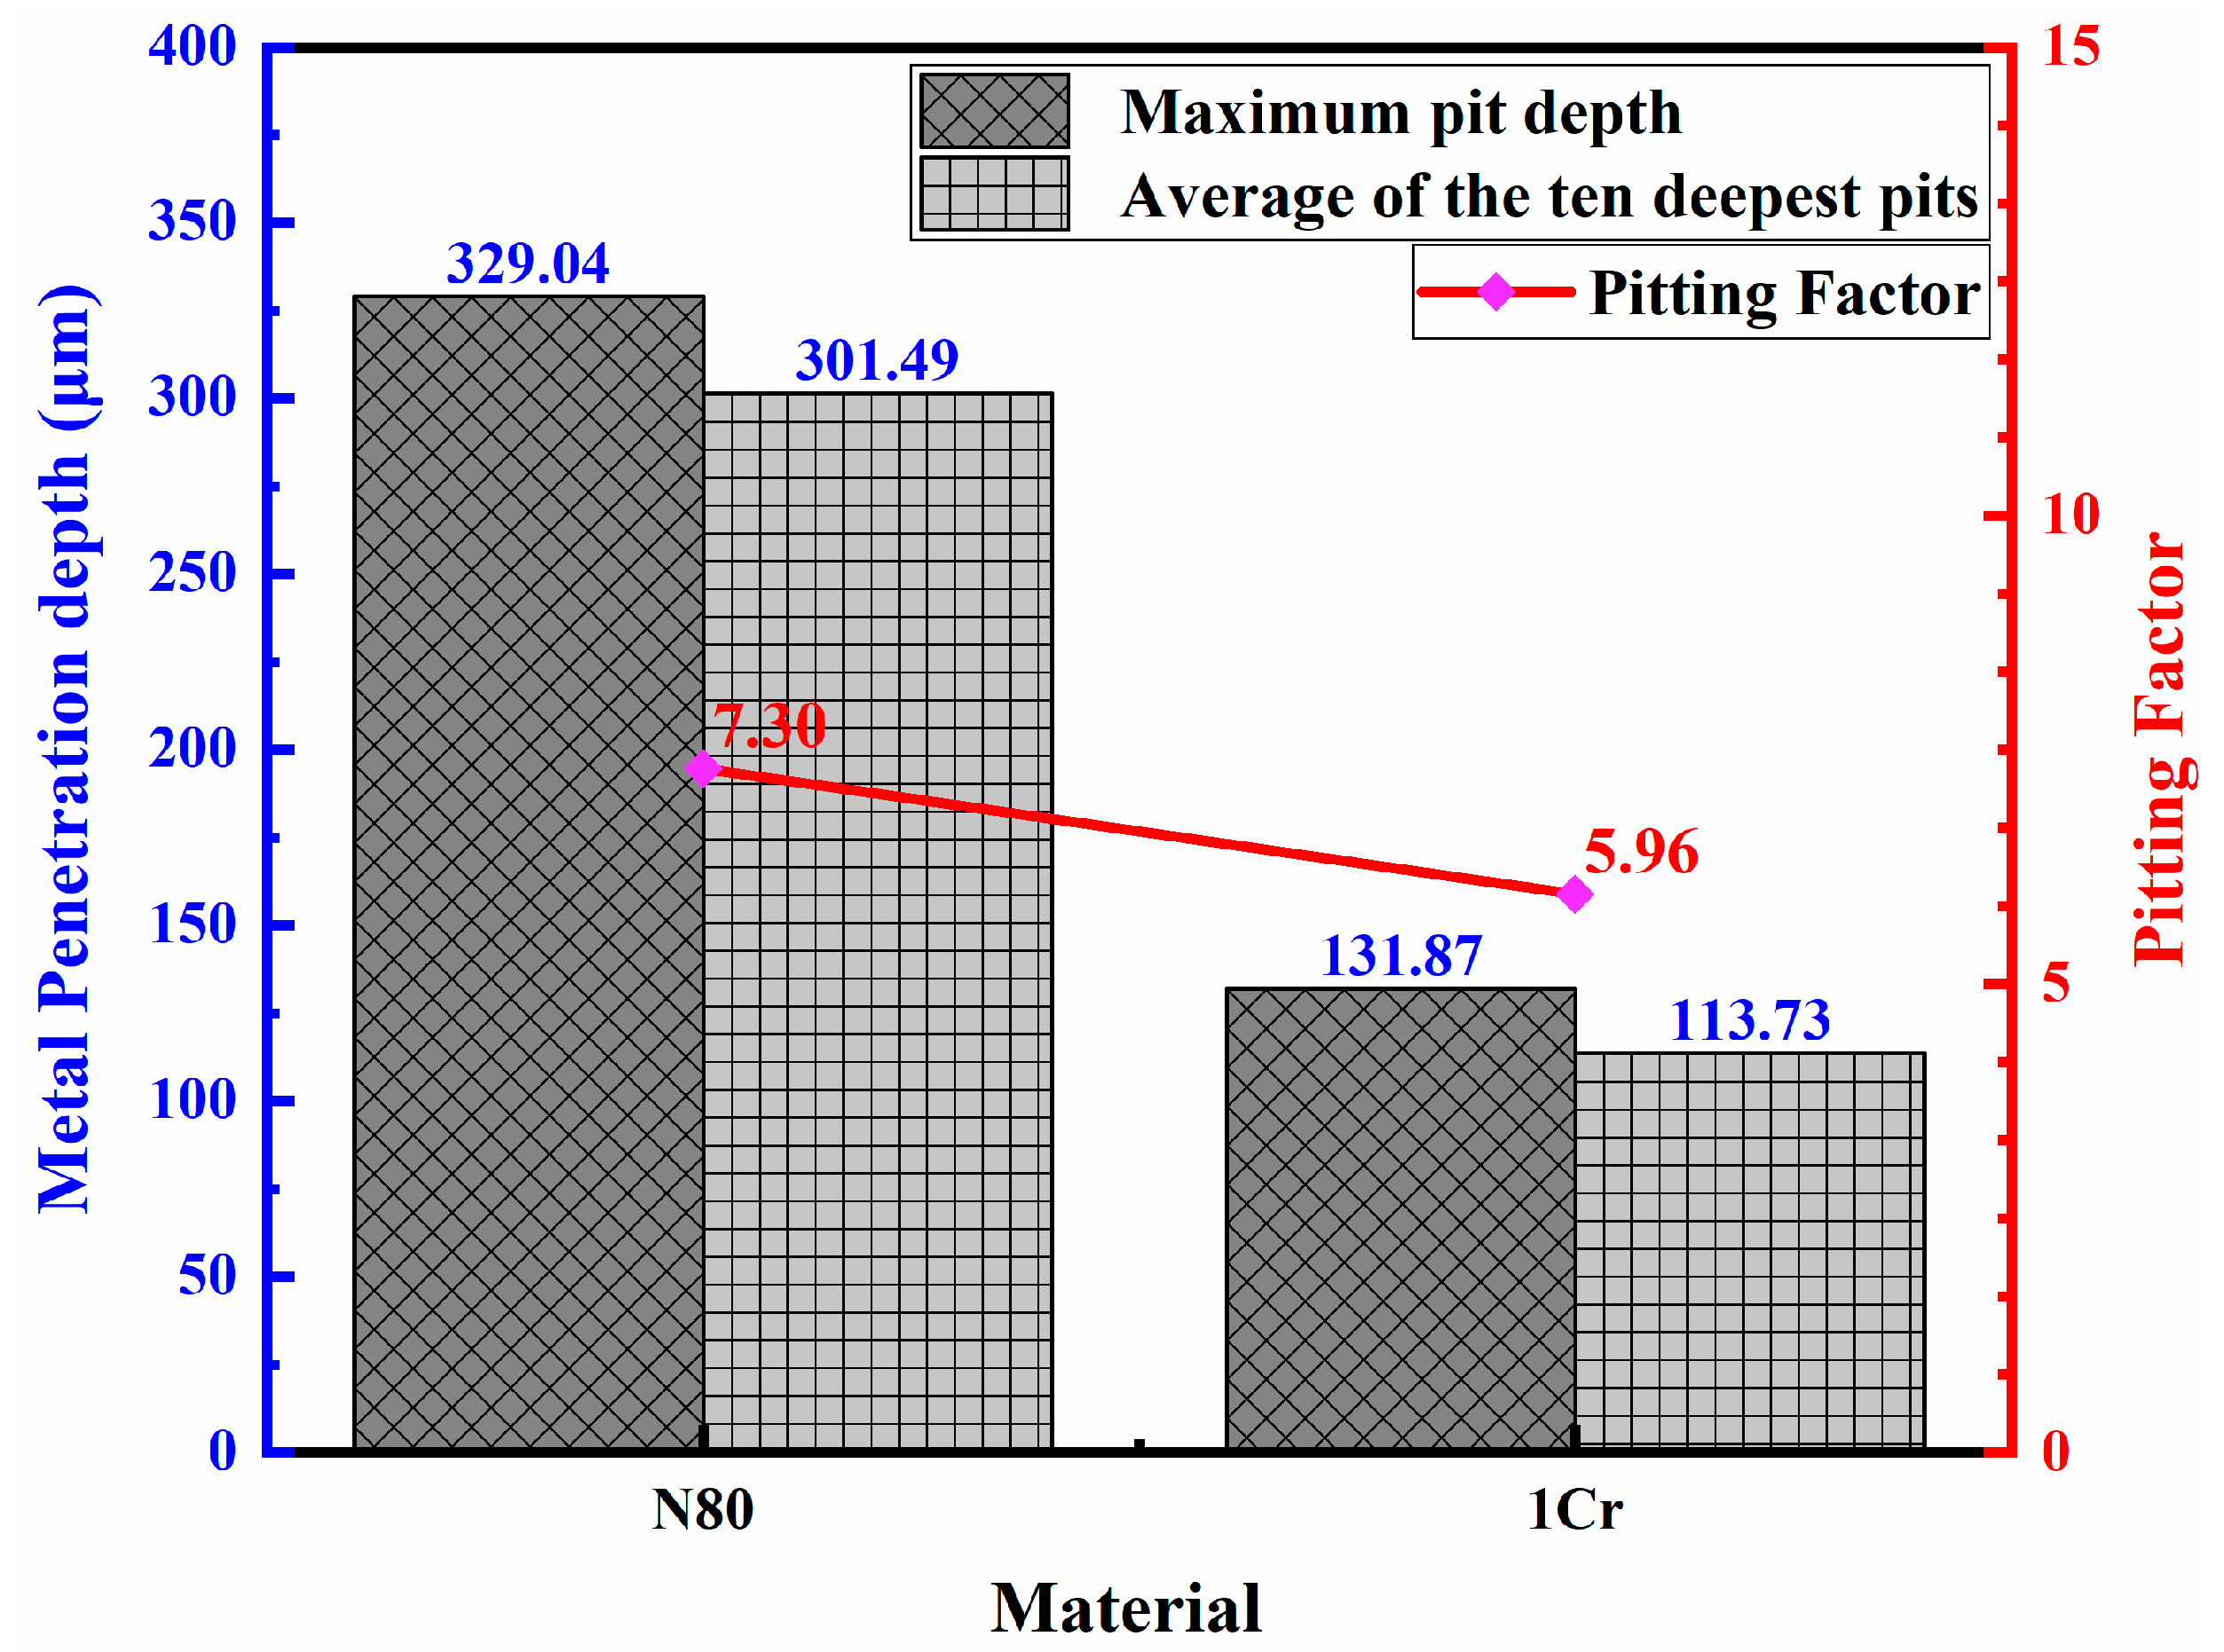
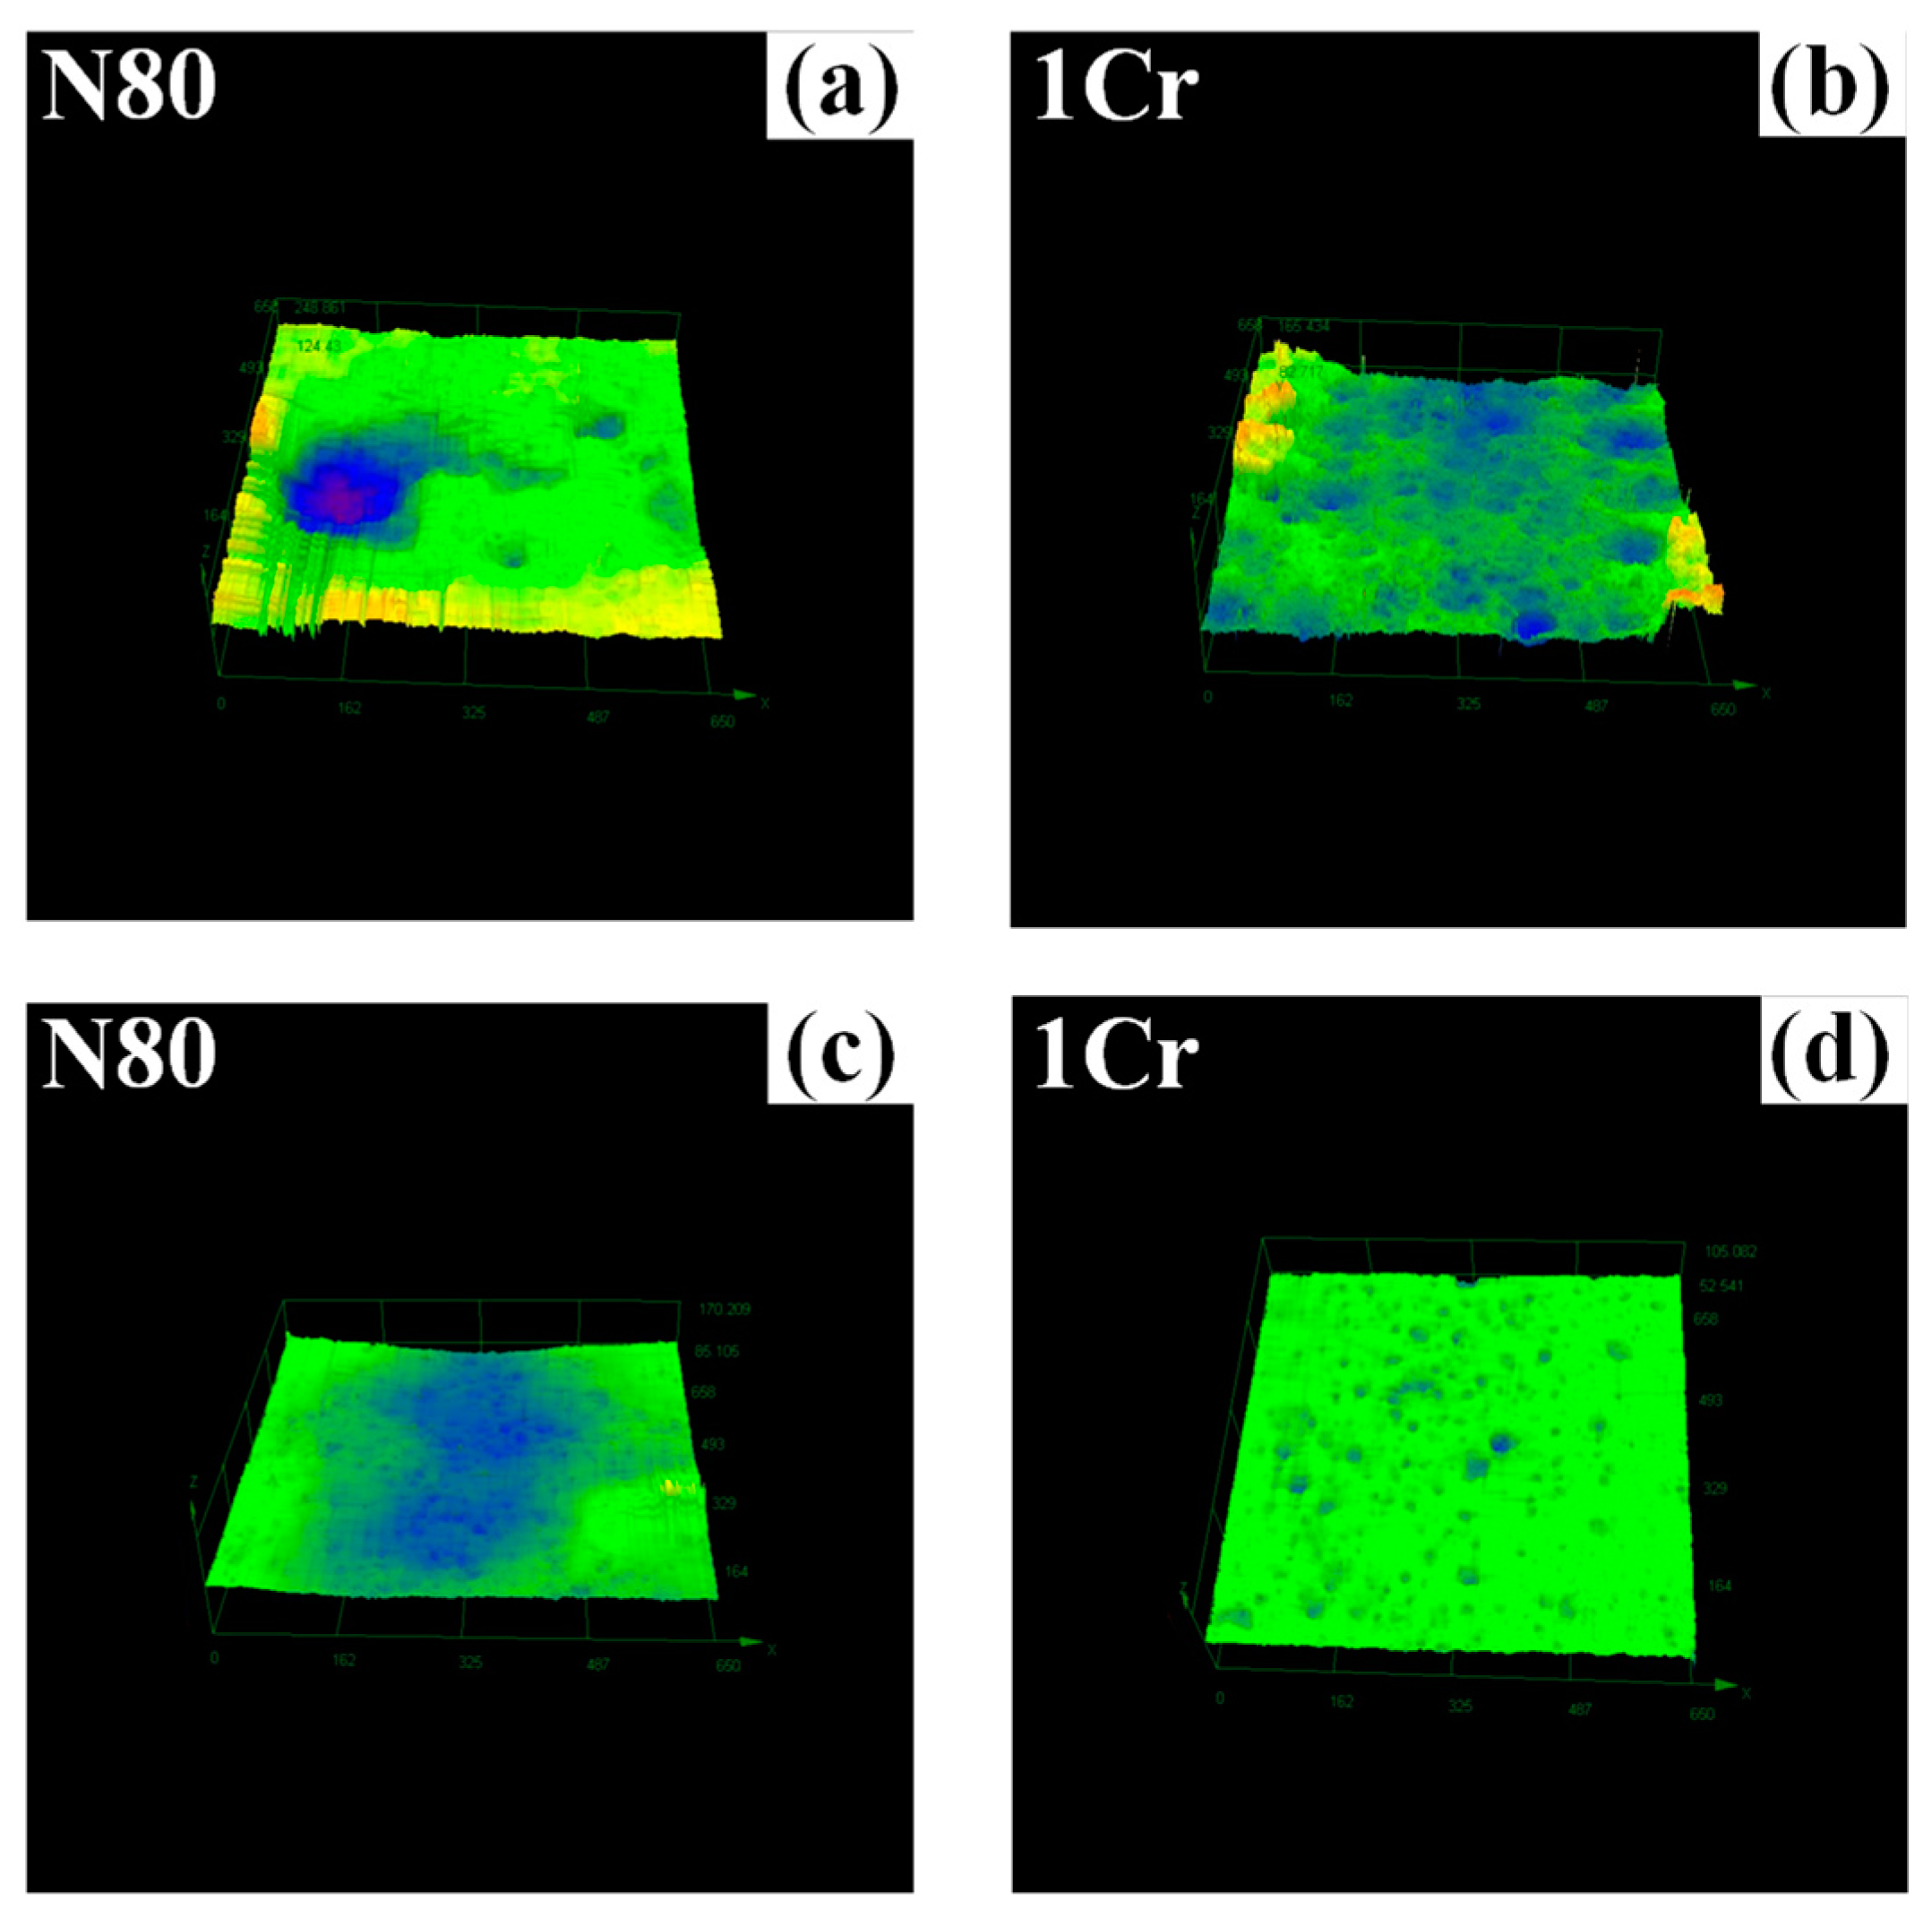
3.3. Effect of Corrosion Conditions on Pitting Characteristics

Figure 6 shows the specimen’s appearance after pickling; Figure 7 shows the corresponding pitting pit cross-section shape in ASTM G46 standard; and Figure 8 and Figure 9 are the microscopic corrosion morphology and pit depth measurement. At 50 °C and 0.30 MPa CO2 partial pressure, we can see both local and pitting corrosion on N80 carbon steel and 1Cr. However, several large “elliptical (Figure 7a)” or “vertical (Figure 7b)” pitting pits are observed on the N80 steel specimen (Figure 8a), with the largest pit having a depth of about 329.04 μm and a width of approximately 712.51 μm (Figure 9a). Nevertheless, the pitting size of 1Cr steel (Figure 9b) is relatively small compared to N80 steel, with a shape of ‘Wide, Shallow’ (Figure 7c). Its maximum pitting pit depth and width are approximately 131.87 μm and 506.88 μm, respectively.
In addition, the metal penetration depth method quantitatively characterized the pitting corrosion degree. The maximum pitting depth and the average of the ten maximum depths were selected as the quantitative parameters. Figure 10 is the pitting penetration depth and pitting factor characterization evaluation results. The average penetration depth of carbon steel N80 was 301.49 μm, which was significantly higher than that of 1Cr low alloy steel 113.73 μm (Figure 10). In terms of pitting factors, the quantitative results of N80 and 1Cr are 7.30 and 5.96, respectively, showing the rule of N80 > 1Cr >> 1, which further indicates that the corrosion characteristics of the two materials are dominated by pitting corrosion, and the pitting severity of N80 is higher than that of 1Cr steel. The maximum pitting depth was selected to calculate the pitting rate in quantifying the pitting rate. In the same environment, the pitting rate of N80 was 8.579 mm/a, while 1Cr was significantly lower at 3.438 mm/a. Although in the short term, the pitting degree of both materials is classified as severe pitting (Table 6), the pitting condition under long-term service conditions will become relatively mild, so the method is only used to quantitatively and qualitatively compare the advantages and disadvantages of materials. Fundamentally, the pitting density, size, sensitivity and other quantitative parameters of 1Cr low alloy steel are significantly lower than those of N80, indicating 1 wt.% Cr element improves its corrosion resistance.
Under the condition of higher temperature and higher partial pressure corrosion, a visual inspection of N80 carbon steel shows a relatively smooth surface, indicating uni-form corrosion (Figure 6b,c) (summarized in Table 7-3*). However, macroscopic corrosion morphology investigation, as shown in Figure 11a,c shows a minimal number of deep pitting pits, suggesting that the corrosion products on these pits do not inhibit corrosion. The dissolution of the metal in the corrosion pit produces excess metal cations (Fe2+) so that the Cl ions outside migrate inward to maintain electrical equilibrium. Consequently, the acidification autocatalytic reaction caused by accumulating Cl ions exacerbates the pitting corrosion.
The corrosion morphology (Figure 6b,c) analysis of 1Cr steel shows that except for a small area at the top of the sample, most of the metal substrate surface is uniformly corroded, resulting in serious thinning and obvious step shape, which is the result of uniform corrosion rate much larger than pitting rate. Combined with the results of micro-point corrosion analysis (Figure 11b,d), it can be seen that the pitting resistance of 1Cr low chromium alloy steel, especially the pitting density, has a certain degree of attenuation compared with N80 carbon steel, and its mesa corrosion can be attributed to the evolution of pitting pits formed in the early stage of corrosion (summarized in Table 7-3*). Due to the enrichment of corrosion product Cr(OH)3 in the pitting pit, the relative potential in the pitting pit increases, which is higher than the potential in the area around the pit, forming a corrosion environment of large anode and small cathode, promoting the anodic dissolution in the surrounding area, and finally evolving into mesa corrosion.

4. Discussion

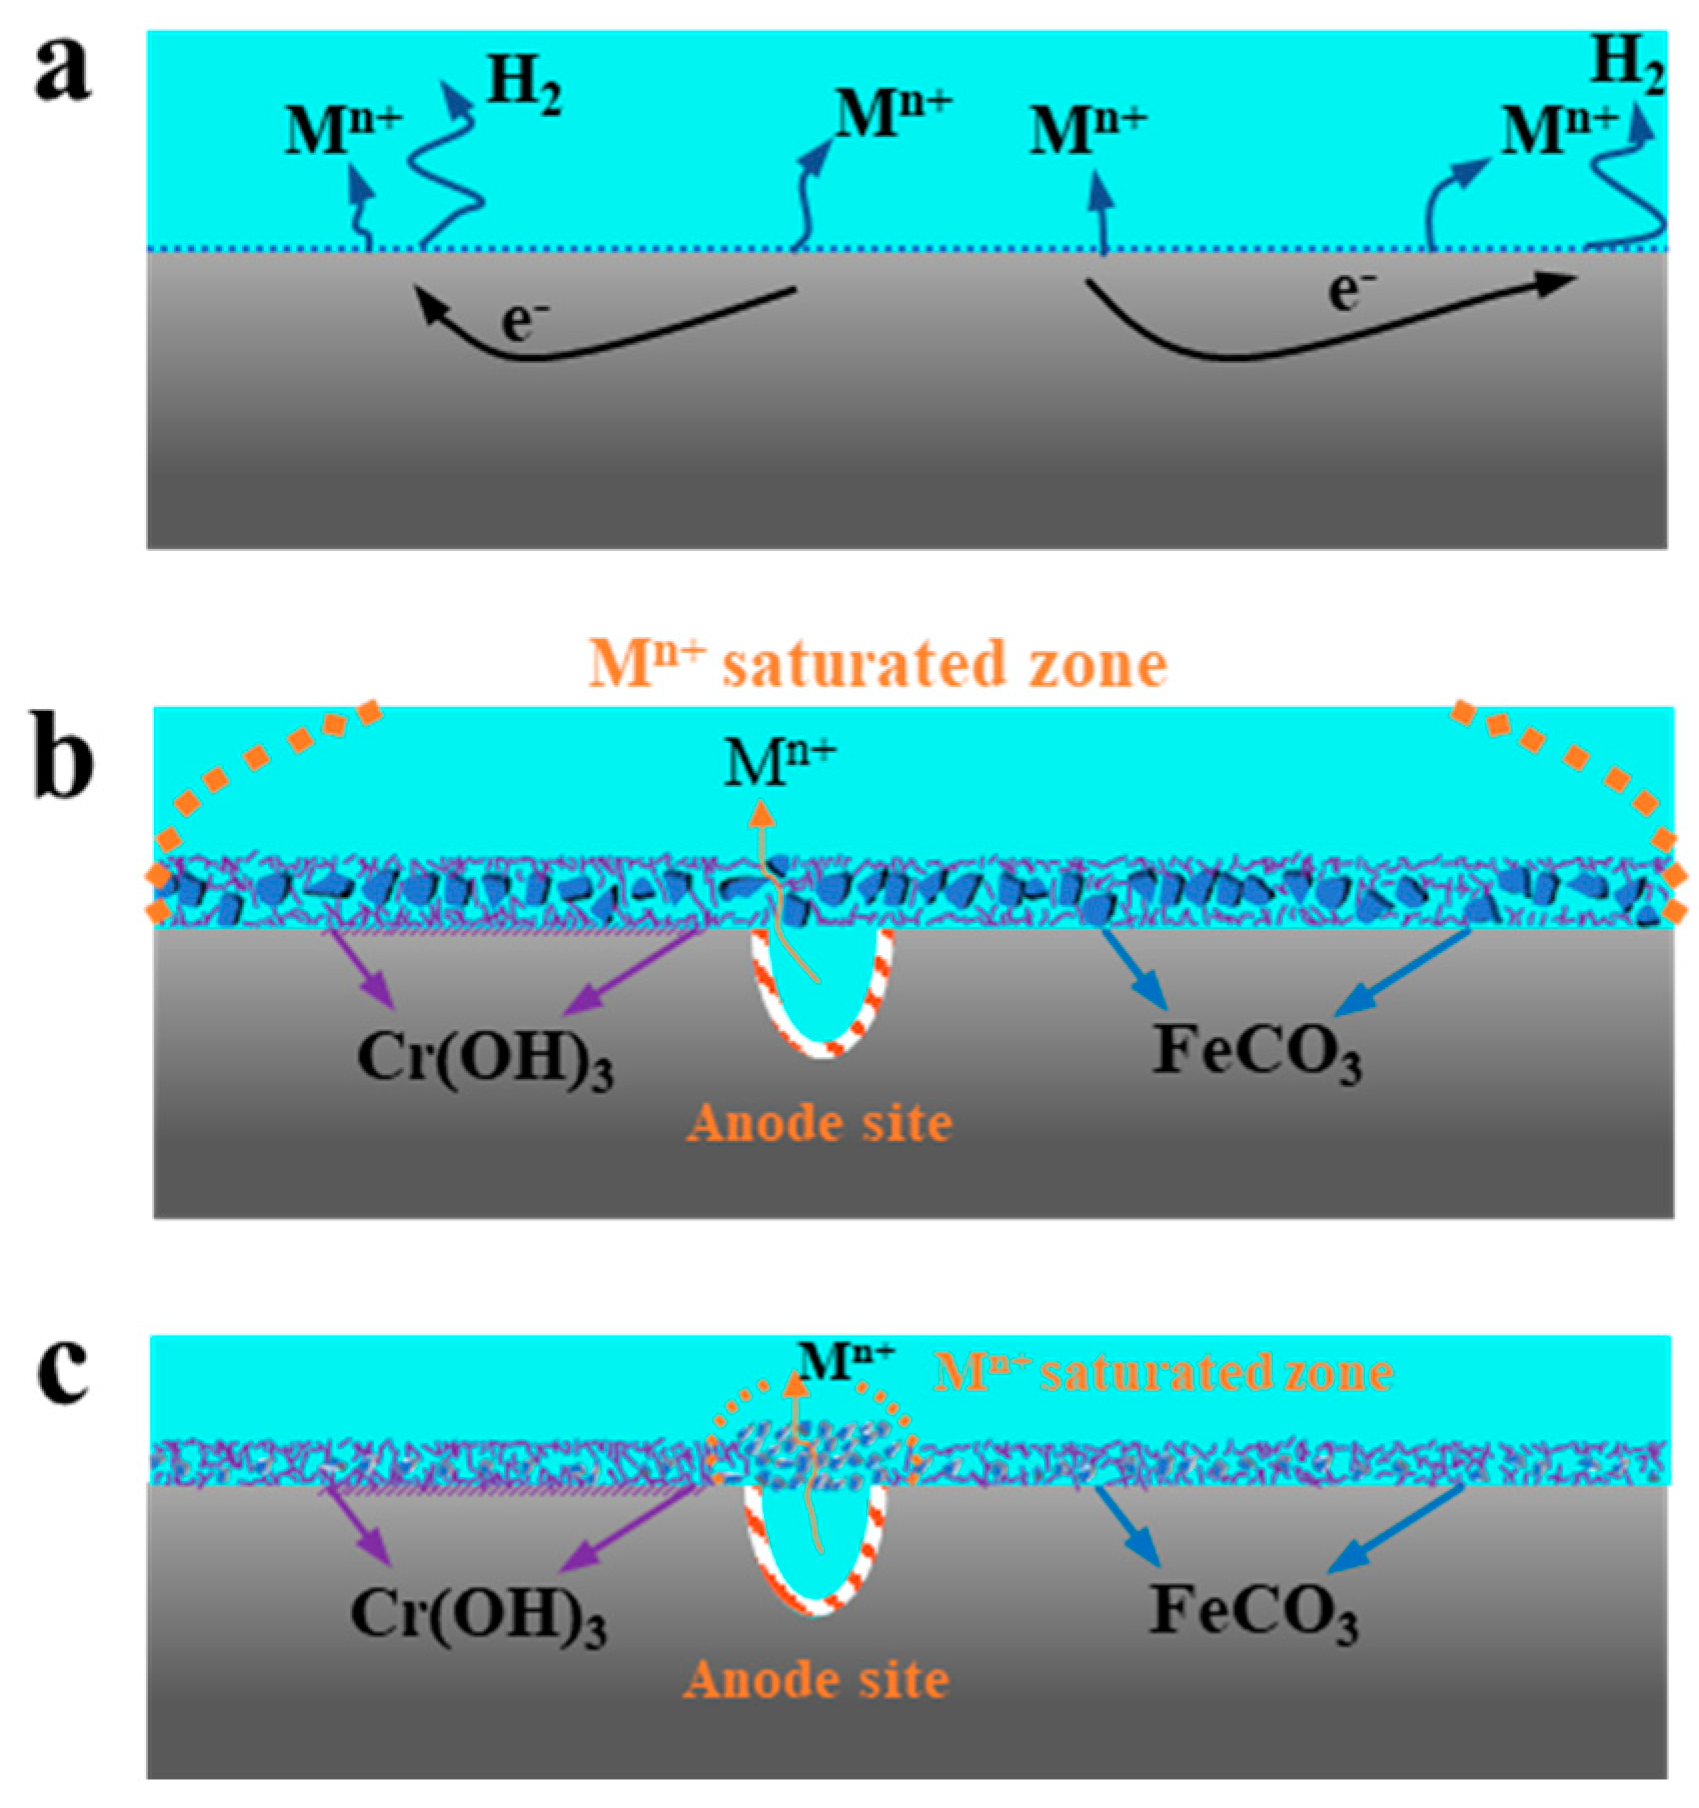
4.1. Mechanistic Insights of Corrosion Resistance Difference

Fe and Cr are relatively active metals, but the activity of Cr is higher than that of Fe. As a result, the anodic reaction of N80 carbon steel with 1 wt.% Cr progresses as expressed in Equations (5) and (6). As the corrosion reaction progresses and ions migrate, reactions expressed by Equations (7) and (8) occur on the metal’s surface. When the ionic product (K) of FeCO3 and Cr(OH)3 exceeds the solubility product constant (Ksp), the solution becomes supersaturated, and a solid film will precipitate on the specimen’s surface.
F e 2 e F e 2 +
C r 3 e C r 3 +
F e 2 + + C O 3 2 F e C O 3 ( s )
C r 3 + + 3 O H C r ( O H ) 3
The solubility product constants for FeCO3 and Cr(OH)3 corrosion products in aqueous solution are Ksp (FeCO3) = 3.2 × 10⁻¹¹ and Ksp (Cr(OH)3) > 6.3 × 10⁻³¹, respectively [36]. Therefore, the corrosion product Cr(OH)3 of 1Cr low chromium steel has better stability. This explains why 1 Cr steel has better anti-corrosion properties than N80 carbon steel at medium temperature and low partial pressure. Previous studies in this area [11,19,30,31] report that the corrosion product film of low-chromium steel in a CO2 environment is composed of a crystalline FeCO3 outer layer and a continuous, dense, amorphous Cr(OH)3 inner layer, which retard the anodic reaction (Equation (5)) slowing down the corrosion rate.
However, due to the influence of temperature and acid gas partial pressure, the corrosion reaction mechanism at high temperature and high partial pressure has changed significantly. Figure 12 and Figure 13 are schematic drawings of corrosion mechanism of carbon steel N80 and 1Cr steel under high temperature and pressure respectively. In fact, there are various reasons why the corrosion resistance of N80 is better than that of 1Cr under high temperature and high partial pressure corrosion environment. Primarily, for carbon steel N80, at high temperature, the activation energy Ea of reaction (5)/(7) decreases, and the barrier decreases, resulting in a high concentration of Fe2+ ions in the thin liquid layer on the surface of the metal matrix. Secondly, the higher CO2 partial pressure not only directly increases the concentration of saturated H2CO3, but also the higher temperature leads to the larger ionization constant Ka and more CO32− ions. Under the driving action of the above conditions, the formation rate of the product film on the carbon steel N80 is accelerated, and even the nucleation rate of ferrous carbonate is greater than the growth rate of the crystal nucleus, forming the innermost amorphous film layer, and the corrosion reaction is greatly controlled. In addition, high temperature is beneficial to improve the density of the inner membrane and improve the stability of the membrane components, which further eliminates the risk of localized corrosion, which is consistent with our observations.
On the contrary, for 1Cr steel, due to the presence of a small amount of Cr element in its composition, amorphous Cr(OH)3 is formed (Equations (6) and (8)). However, due to the content of Cr element, the coverage of Cr(OH)3 is greatly restricted, which will lead to the existence of some anode active sites, local corrosion and the formation of dissolution zone. In addition, because Cr(OH)3 has a certain cation selective permeability, it can effectively prevent anions from passing through the corrosion product film to the metal surface, resulting in a significant decrease in the rate of reaction 7 outside the active corrosion zone. In the anode active area, the initial stage of corrosion is characterized by the co-precipitation of reaction 7/8, forming the result of competitive deposition of Cr(OH)3 and FeCO3. However, with the progress of the corrosion process, in this acidic environment, the reaction 4 will gradually intensify, making the FeCO3 in the deposition layer gradually dissolve, resulting in the corrosion products tend to be ‘chromium-rich’. In addition, the presence of Cr(OH)3 weakens the adhesion between FeCO3 crystals and the amorphous layer of Cr(OH)3, resulting in a decrease in the adhesion of the product film. At the same time, under the influence of continuous fluid shear stress, the loose corrosion product film is easily peeled off. Therefore, based on the above factors, the characteristics of 1Cr tending to local corrosion are formed, which induces the incomplete coverage of FeCO3 film, and finally leads to the activation corrosion is more serious than that of N80 carbon steel [33,37,38,39].

4.2. Outlook

The results show that it is incorrect to think that adding 1 wt.% chromium can improve the corrosion resistance of metal materials. The ability of 1Cr steel to resist CO2 corrosion depends not only on the downhole corrosion conditions, but also on its corrosion characteristics. In further research, the experimental conditions can be refined, and the single variable of temperature and partial pressure can be adopted to more specifically propose the best use conditions of 1Cr steel. In addition, the above evaluation experiments are limited by the test period. Although they can be successfully used to qualitatively compare the corrosion resistance differences and reveal the corrosion mechanism, they cannot truly reflect the corrosion results under long-term corrosion conditions. Therefore, the corrosion behavior under long test cycles can be further studied to more accurately evaluate the applicability of materials. At the same time, the optimal chromium content that can eliminate local corrosion is explored, and combined with electrochemical test methods (such as potentiodynamic plan test and AC impedance spectroscopy), the corrosion reaction kinetics information and interface and product film structure information are more comprehensively revealed.

5. Conclusions

(1) Under high-temperature and high-CO2 partial pressure conditions, N80 carbon steel has greater corrosion resistance than 1Cr. This is due to its ability to quickly form a corrosion product film that is highly compact and integral, resulting in more prominent local corrosion resistance and lower surface roughness, which expands the application range of carbon steel. However, in practical applications, it may be necessary to increase the wall thickness appropriately to achieve a balance between strength and economy.
(2) Although 1Cr alloy steel develops a ‘chromium-rich’ amorphous secondary outer layer under high-temperature and high-pressure environments, its corrosion resistance is limited by the incomplete outermost dense crystalline FeCO3 layer, resulting in mesa corrosion and a higher weight loss corrosion rate than N80 carbon steel. Therefore, under such conditions, the 1 wt.% Cr element does not provide corrosion inhibition but exacerbates the risk of localized corrosion due to the uneven amorphous product film.
(3) Under low-temperature and low-CO2 partial pressure conditions, the corrosion product film of 1Cr alloy steel is enriched with more stable amorphous Cr(OH)3 due to the difference in solubility product between corrosion products FeCO3 and Cr(OH)3. Meanwhile, the low temperature leads to a slower film-forming speed of FeCO3. Therefore, 1Cr alloy steel exhibits more prominent corrosion resistance than carbon steel under these conditions.
(4) The composition and characteristics of the corrosion product film are the main factors controlling the material’s resistance to corrosion. Studying the film formation mechanism under specific corrosion conditions makes it possible to select the appropriate anti-corrosion material.
(5) The above evaluation experiments are limited by the experimental period. Although they can be used to qualitatively compare the differences in corrosion resistance and reveal the corrosion mechanism, they cannot truly reflect the long-term corrosion results. Therefore, studying the corrosion behavior under long test cycles can provide a more accurate evaluation of the applicability of materials.

Author Contributions

Data curation, M.H. and Z.M.; Methodology, L.W. and G.L.; Project administration, M.H. and W.Y.; Resources, L.Z. and S.Z.; Writing—original draft, J.L., M.L. and Z.M.; Writing—review & editing, Z.M., K.L. and W.Y. All authors have read and agreed to the published version of the manuscript.

Funding

This research was supported by The Project ‘Integrated Design of Corrosion Mechanics and Anticorrosion Material Selection for Injection–production String’.

Institutional Review Board Statement

Not applicable.

Informed Consent Statement

Not applicable.

Data Availability Statement

Data is contained within the article.

Conflicts of Interest

There is no conflict of interest related to this paper.

References

  1. Osieczko-Potoczna, K.; Gazda, A.; Dušan, M. Factors determining the construction and location of underground gas storage facilities. Acta Montan. Slovaca 2019, 24, 234–244. [Google Scholar]
  2. Wang, Y.; Li, J.; Cao, G.Q. Material Optimization of Injection and Production String in Su4 Underground Gas Storage. Adv. Mater. Res. 2014, 962–965, 448–452. [Google Scholar] [CrossRef]
  3. Liu, K.; He, N.; Zhang, Y.; Xu, F.; Wang, Y. Safety risk analysis of gas injection and recovery wells in the Xiangguosi Gas Storage and countermeasures. Nat. Gas Ind. 2013, 33, 131–135. [Google Scholar]
  4. Lei, R.; Zhang, Y.; Zhou, Y.; Chen, Y.; Li, X.; Dong, X. Study on Prediction of Corrosion Rate of Injection and Production Well in Gas Storage. Saf. Health Environ. 2017, 05, 5–7. [Google Scholar]
  5. Choi, Y.-S.; Young, D.; Nešić, S.; Gray, L.G. Wellbore integrity and corrosion of carbon steel in CO2 geologic storage environments: A literature review. Int. J. Greenh. Gas Control 2013, 16 (Suppl. S1), S70–S77. [Google Scholar] [CrossRef]
  6. Xu, L.; Wang, B.; Zhu, J.; Li, W.; Zheng, Z. Effect of Cr content on the corrosion performance of low-Cr alloy steel in a CO2 environment. Appl. Surf. Sci. 2016, 379, 39–46. [Google Scholar] [CrossRef]
  7. Lining, X.U.; Zhu, J.; Wang, B. Influence of Cr Content and pH Value on the SemiPassivation Behavior of Low Cr Pipeline Steels. Acta Metall. Sin. 2017, 53, 677–683. [Google Scholar]
  8. Chen, L.; Liu, W.; Dong, B.; Zhang, P.; Zhao, Q.; Zhang, T.; Fan, P.; Li, H. Role of Trace Dissolved Oxygen Content in Corrosion Scale of 3Cr Steel in CO2 Aqueous Environment. J. Mater. Eng. Perform. 2022, 31, 4864–4876. [Google Scholar] [CrossRef]
  9. Olsen, S.; Halvorsen, A.M.; Lunde, P.G.; Nyborg, R. CO2 Corrosion Prediction Model—Basic Principles. In CORROSION 2005; OnePetro: Houston, TX, USA, 2005; p. NACE-05551. [Google Scholar]
  10. Nyborg, R.; Dugstad, A. Understanding and Prediction of Mesa Corrosion Attack. In CORROSION 2003; OnePetro: San Diego, CA, USA, 2003; p. NACE-03642. [Google Scholar]
  11. Chen, C.; Zhao, G.; Yan, M.; Bai, Z.; Yang, Y. Characteristics of CO2 corrosion scales on 1%Cr-containing N80 steel. J. Chin. Soc. Corros. Prot. 2003, 22, 338–347. [Google Scholar]
  12. Guo, S.; Xu, L.; Zhang, L.; Chang, W.; Lu, M. Corrosion of alloy steels containing 2% chromium in CO2 environments. Corros. Sci. 2012, 63, 246–258. [Google Scholar] [CrossRef]
  13. Xu, L.; Xie, Y.; Lu, M.; Zhang, L.; Chang, W. Effect Of Temperature On Wet CO2 Corrosion Of 3%Cr Pipeline Steel. In CORROSION 2012; OnePetro: Salt Lake City, UT, USA, 2012; p. NACE-2012-1348. [Google Scholar]
  14. Guo, S.; Xu, L.; Chang, W.; Zhang, L.; Hu, L.; Lu, M. The Anti-pitting Mechanism of Low Cr Alloy Steel In CO2 Corrosion Environment. In CORROSION 2012; OnePetro: Salt Lake City, UT, USA, 2012; p. NACE-2012-1357. [Google Scholar]
  15. Qian, J.; Chen, C.; Zheng, S.; Weng, Y. Effect of partial pressure ratio H2S/CO2 on mechanical properties of 3Cr oil tube steel. In Proceedings of the 2011 International Conference on Materials for Renewable Energy & Environment, Shanghai, China, 20–22 May 2011. [Google Scholar]
  16. Guo, S.; Xu, L.; Chang, W.; Mi, Y.; Lu, M. Experimental study of CO2 corrosion of 3cr pipe line steel. Acta Metall. Sin. 2011, 47, 1067–1074. [Google Scholar]
  17. Bai, Z.Q.; Chen, C.F.; Lu, M.X.; Li, J.B. Analysis of EIS characteristics of CO2 corrosion of well tube steels with corrosion scales. Appl. Surf. Sci. 2006, 252, 7578–7584. [Google Scholar] [CrossRef]
  18. Chen, C.; Minxu, L.U.; Zhao, G.; Bai, Z.; Yan, M. The Eis Analysis of Electrode Reactions of CO2 Corrosion of N80 Steel. Acta Met. Sin. 2002, 38, 770–774. [Google Scholar]
  19. Chen, C.; Minxu, L.U.; Zhao, G.; Bai, Z.; Yan, M. Characters of CO2 corrosion scales on well tube steels N80. Acta Met. Sin. 2002, 38, 411–416. [Google Scholar]
  20. Ueda, M.; Takabe, H. The Formation Behavior of Corrosion Protective Films of Low Cr Bearing Steels in CO2 Environments. In CORROSION 2001; OnePetro: Houston, TX, USA, 2001; p. NACE-01066. [Google Scholar]
  21. Li, W.; Xu, L.; Qiao, L.; Li, J. Effect of free Cr content on corrosion behavior of 3Cr steels in a CO2 environment. Appl. Surf. Sci. 2017, 425, 32–45. [Google Scholar] [CrossRef]
  22. Chen, C.F.; Lu, M.X.; Sun, D.B.; Zhang, Z.H.; Chang, W. Effect of Chromium on the Pitting Resistance of Oil Tube Steel in a Carbon Dioxide Corrosion System. Corros. Houst. Tx 2005, 61, 594–601. [Google Scholar] [CrossRef]
  23. Chen, C.F.; Lu, M.X.; Zhao, G.X.; Bai, Z.Q.; Yang, Y.Q. Effects of temperature, Cl- concentration and Cr on electrode reactions of CO2 corrosion of N80 steel. Acta Metall. Sin. Chin. Ed. 2003, 39, 848–854. [Google Scholar]
  24. Chen, C.F.; Lu, M.X.; Zhao, G.X.; Bai, Z.Q.; Yang, Y.Q. The EIS analysis of cathodic reactions during CO2 corrosion of N80 steel. Acta Met. Sin. 2003, 39, 94–98. [Google Scholar]
  25. Chen, C.F.; Lu, M.X.; Zhao, G.X.; Bai, Z.Q.; Yang, Y.Q. Mechanical properties of CO2 corrosion scale on N80 well tube steel. Acta Met. Sin. 2003, 39, 2219–2224. [Google Scholar]
  26. Chen, C.; Minxu, L.U.; Zhao, G.; Yan, M.; Bai, Z.; Yang, Y. Electrochemical Characteristics of CO2 Corrosion of Well Tube Steels With Corrosion Scales. J. Chin. Soc. Corros. Prot. 2003, 23, 139–143. [Google Scholar]
  27. Zhao, G.; Chen, C.; Lu, M.; Li, H. The formation of product scale and mass transfer channels during CO2 corrosion. J. Chin. Soc. Corros. Prot. 2002, 22, 363–366. [Google Scholar]
  28. Wu, T.; Wu, H.; Niu, G.; Li, T.; Sun, R.; Gu, Y.; Yuan, R. Effect of Microstructure on the Corrosion Performance of 5% Cr Steel in a CO2 Environment. Corrosion 2018, 74, 757–767. [Google Scholar] [CrossRef]
  29. Wang, C.-L.; Guo, H.-D.; Fang, J.; Yu, S.-X.; Yue, X.-Q.; Hu, Q.-H.; Liu, C.-W.; Zhang, J.-X.; Zhang, R.; Xu, X.-S.; et al. The role of Cr content on the corrosion resistance of carbon steel and low-Cr steels in the CO2-saturated brine. Petrol. Sci. 2022. ISSN 1995-8226. [Google Scholar] [CrossRef]
  30. Sun, J.; Yang, L.; Liu, W.; Lu, M. Electrochemical behavior and localized corrosion of X65 steel in high salt concentration brines with CO2 saturated. Mater. Res. Express 2018, 5, 026503. [Google Scholar] [CrossRef]
  31. Sun, J.; Sun, C.; Wang, Y. Electrochemical science effect of cr content on the electrochemical behavior of low- chromium x65 steel in CO2 environment. Int. J. Electrochem. Sci. 2018, 11, 8599–8611. [Google Scholar]
  32. Sun, J.; Yapeng, J.; Sun, C.; Jiang, T.; Liu, H. Sulfide Stress Corrosion Cracking Behavior of Low-Cr Steel in H2S-CO2 Environment. Surf. Technol. 2016, 45, 1. [Google Scholar]
  33. Xun, L.; Fang, J.; Wenmei, C. The Carbon Dioxide Corrosion of Tube and Casing in Downhole. Chem. Eng. Oil Gas 2006, 4, 300–303+250. [Google Scholar]
  34. Protocol, N.S. Preparation, Installation, Analysis, and Interpretation of Corrosion Coupons in Oilfield Operations; NACE–SP0775-2013; NACE International: Houston, TX, USA, 2013. [Google Scholar]
  35. Guo, S.; Xu, L.; Zhang, L.; Chang, W.; Lu, M. Characterization of corrosion scale formed on 3Cr steel in CO2-saturated formation water. Corros. Sci. 2016, 110, 123–133. [Google Scholar] [CrossRef]
  36. Dean, J.A. Lange’s Handbook of Chemistry. Mater. Manuf. Process. 1990, 5, 687–688. [Google Scholar] [CrossRef]
  37. Gu, Y.; Wu, H.-B.; Yuan, R.; Wang, X.-T.; Wu, T.; Shuai, S. Influence of Cr content on corrosion performance of middle Cr alloy steel in CO2 environment. Mater. Res. Express 2019, 6, 046511. [Google Scholar] [CrossRef]
  38. Zhu, J.Y.; Xu, L.N.; Lu, M.X.; Chang, W. Cathodic reaction mechanisms in CO2 corrosion of low-Cr steels. Int. J. Miner. Metall. Mater. 2019, 26, 1405–1414. [Google Scholar] [CrossRef]
  39. Oleksak, R.P.; Tylczak, J.H.; Holcomb, G.R.; Dogan, O.N. High temperature oxidation of steels in CO2 containing impurities. Corros. Sci. 2020, 164, 108316. [Google Scholar] [CrossRef]
Figure 1. Temperature/partial pressure-well depth profile chart. Note: The meaning of longitudinal axis color division, yellow area represents low temperature formation; the blue area represents the medium temperature stratum; the red area represents high temperature strata.
Coatings 13 00737 g001
Figure 2. Average corrosion rates of 72 h/168 h/336 h under three corrosion conditions: (a) 50 °C-CO2: 0.30 MPa, (b) 100 °C-CO2: 0.63 MPa, (c) 114 °C-CO2: 0.73 MPa.
Coatings 13 00737 g002
Figure 3. The product film morphology of N80 and 1Cr under three conditions: (a,b) 50 °C-CO2: 0.30 MPa; (c,d) 100 °C-CO2: 0.63 MPa; (e,f) 114 °C-CO2: 0.73 Mpa. Note: (a,c,e): N80; (b,d,f): 1Cr.
Coatings 13 00737 g003
Figure 4. Product film morphology and EDS analysis of N80 Carbon Steel in high temperature and high pressure (100 °C-CO2: 0.63 MPa) corrosion environment.
Coatings 13 00737 g004
Figure 5. Product film morphology and energy spectrum element analysis of 1Cr steel in high temperature and high pressure (114 °C-CO2: 0.73 MPa) corrosion environment.
Coatings 13 00737 g005
Figure 6. Specimen appearance (N80/1Cr from left to right) under three conditions: (a) 50 °C-CO2: 0.30 MPa; (b) 100 °C-CO2: 0.63 MPa; (c) 114 °C-CO2: 0.73 MPa; after removal of product film.
Coatings 13 00737 g006
Figure 7. Variations in the cross-sectional shape of pits mentioned in ASTM G46.
Coatings 13 00737 g007
Figure 8. Micrographical analysis of the pitting corrosion at lower temperature-partial pressure (50 °C-CO2: 0.30 MPa): (a,b): shows pitting density; (c,d) Maximum pit size characterization. Note: A-A/B-B is the cross section at the maximum pitting depth of the pitting pit.
Coatings 13 00737 g008
Figure 9. The maximum Pit size measurement and evaluation along the cross-sections:(a) cross-sections A-A (N80); (b) cross-section B-B (1Cr) under the condition of 50 °C-CO2: 0.30 MPa.
Coatings 13 00737 g009
Figure 10. Pitting Penetration Depth and Pitting Factors of N80 and 1Cr at 50 °C-CO2: 0.30 MPa.
Coatings 13 00737 g010
Figure 11. The pitting corrosion density micrographs at high temperature-partial pressure: (a,b): 100 °C-CO2: 0.63 MPa; (c,d): 114 °C-CO2: 0.73 MPa.
Coatings 13 00737 g011
Figure 12. Schematic of Mesa corrosion mechanism of N80 steel under high temperature and high CO2 partial pressure: (a) Uniform corrosion stage; (b) Corrosion product deposition stage.
Coatings 13 00737 g012
Figure 13. Schematic of Mesa corrosion mechanism of 1Cr steel under high temperature and high CO2 partial pressure: (a) Uniform corrosion stage; (b) The competitive deposition of corrosion products and pitting incubation stage; (c) Pitting corrosion development and formation stage.
Coatings 13 00737 g013
Table 1. Chemical composition of test samples (% by weight).
Alloy SteelCSiMnPSCrNiMoVCu
N800.210.240.510.00240.0019 0.030.180.030.010.10
1Cr0.200.260.410.00860.00081.020.100.320.010.01
Table 2. Experimental test conditions.
Condition NumberTemperature (°C)CO2 Partial
Pressure (MPa)
Floe
Velocity
Reaction CycleAlloy Steel
1500.301.5 m/s72 h/168 h/336 hN80,1 wt.%Cr
21000.631.5 m/s72 h/168 h/336 hN80,1 wt.%Cr
31140.731.5 m/s72 h/168 h/336 hN80,1 wt.%Cr
Table 3. Qualitative Categorization of Carbon Steel Corrosion Rates for Oil Production Systems.
QualitativeAverage Corrosion RateMaximum Pitting Rate
mm/ymm/y
Low<0.025<0.13
Moderate0.025–0.120.13–0.20
High0.13–0.250.21–0.38
Severe>0.25>0.38
Table 4. General corrosion rate qualitative of N80 and 1Cr under three corrosion conditions.
Condition NumberMaterialsQualitative/Extent
1N80Severe
11CrSevere
2N80Severe
21CrSevere
3N80Severe
31CrSevere
Table 5. EDS analysis of product film of the specimens under different corrosion conditions (normalized mass percentage: less than 0.5% not listed).
Material-
Condition
FeOCCr
N80–146.542.710.3/
1Cr–144.143.910.21.8
N80–248.640.210.6/
1Cr–250.237.69.12.4
N80–346.238.712.3/
1Cr–345.936.113.72.1
Table 6. Maximum pitting rate and Qualitative of N80 and 1Cr at 50 °C-CO2: 0.30 MPa.
MaterialsMaximum Pitting Rate (PR)Qualitative/Extent
N808.579 mm/aSevere
1Cr3.438 mm/aSevere
Table 7. Conclusion Summary.
NumberResultsConclusions
1*Effect of experimental conditions on corrosion rateIn certain situations, the corrosion rate of N80 is higher than that of 1Cr, but with the increase in temperature and pressure as well as the passage of time, the corrosion rate of 1Cr is gradually greater than that of N80.
2*Effect of corrosion conditions on product filmAt low temperatures and pressures, the dense amorphous FeCO3 film on the inner layer of carbon steel reduces the corrosion rate. At high partial pressures and temperatures, the formation of a dense crystalline film of FeCO3 on the surface of N80 steel inhibits further corrosion, while the low chromium steel 1Cr is not immune to corrosion in this environment.
3*Effect of corrosion conditions on pitting characteristicsLess pitting at higher temperatures and higher pressures for both N80 and 1Cr. And the pitting resistance of 1Cr low chromium alloy steel, especially the pitting density, has a certain degree of attenuation compared with N80 carbon steel.
Disclaimer/Publisher’s Note: The statements, opinions and data contained in all publications are solely those of the individual author(s) and contributor(s) and not of MDPI and/or the editor(s). MDPI and/or the editor(s) disclaim responsibility for any injury to people or property resulting from any ideas, methods, instructions or products referred to in the content.

