Article

Linear and Nonlinear Optical Properties of PVA:SA Blend Reinforced by TiO2 Nanoparticles Prepared by Flower Extract of Aloe Vera for Optoelectronic Applications

1
Physics Department, Faculty of Science, Zagazig University, Zagazig 44519, Egypt
2
Department of Chemistry, College of Science, Princess Nourah Bint Abdulrahman University, P.O. Box 84428, Riyadh 11671, Saudi Arabia
3
Spectroscopy Department, Physics Research Institute, National Research Centre, 33 El Bohouth St. (former El Tahrir St.), Dokki, Giza 12622, Egypt
4
Department of Physics, College of Science, Qassim University, Buraydah 51452, Saudi Arabia
*
Authors to whom correspondence should be addressed.
Coatings 2023, 13(4), 699; https://doi.org/10.3390/coatings13040699
Submission received: 28 February 2023 / Revised: 20 March 2023 / Accepted: 24 March 2023 / Published: 30 March 2023

Abstract

:
In this study, a polyvinyl alcohol–sodium alginate blend, PVA:SA 3:1 (w:w), was doped with different contents of TiO2 nanoparticles (NPs) prepared by aloe vera leaf extract to form the investigated nanocomposites. The nonlinear parameters of third-order susceptibility (χ(3)) and refractive index (n2) were detected by using UV-Vis spectroscopy and Z-scan techniques. Some different optical parameters were also determined, including the refractive index (n), optical dielectric parameters, volume and surface energy loss functions, and some others. The best solar skin protection factor (SSPF) was investigated by 5 wt.% of TiO2 NPs doped in PVA:SA 3:1, which was about 84.6% compared to the corresponding value of the host blend (41%). The studied nanocomposites were examined for their utility in the optical limiting of CUT-OFF laser filters utilizing a continuous He-Ne laser working at 632.2 nm. As a result, our finding demonstrated that TiO2 NPs doped in the host blend of PVA:SA positively influences a laser light blocking for the investigated laser source. Using the estimated gap energies values, different models were used to deduce theoretical values of the linear refractive index (n). The presence of Ti peaks in the EDX spectrum confirmed the doping of TiO2 NPs in the nanocomposites. SEM showed that the TiO2 NPs are homogeneously dispersed through the host blend with some agglomerates. XRD spectra showed that the values of the lattice strain εstr. detected at 2ϴ = 19.78° are 0.058, 0.055, and 0.060, corresponding to 1, 3, and 5 wt.% of TiO2 NPs doped in the PVA:SA blend.

1. Introduction

Many different optical applications, including optical computing, broadband optical communications, refractive index modulation, integrated optics, and others, are based on their fabrication on materials with large nonlinear refractive indexes and also large third-order optical nonlinear susceptibilities. Therefore, numerous studies have focused on the nonlinear optical (NLO) properties of a large number of materials, such as organic and inorganic materials [1,2], polymers [3,4], nanomaterials [5,6], etc. Nonlinear optical characteristics can be determined using transmission and absorption measurements [7]. Methods such as diffraction ring patterns, thermal lenses, and Z-scan open and closed apertures are considered alternative methods for determining NLO [8]. Compared to the other methods, Z-scan is better since it uses a low-incident intensity laser beam to determine the nonlinear optical constants and provides valuable information on transient process dynamics and response time [9].
The innovative features of nanocomposite polymer materials that potentially open up new optical application fields drew considerable interest in their development [10]. Some of the most common and straightforward techniques used to create a polymeric composite material includes adding a suitable filler [11]. The type, concentration, and effective cost of the incorporated filler in the host matrix can affect the degree of the chemical composition alteration and the physicochemical properties of the produced nanocomposites and, therefore, the appropriate application in the industrial world. Titanium dioxide (TiO2) is considered an inorganic semiconducting NP, which has many advantages, such as being a selective absorber of UV light, having high photostability, being low cost, and exhibiting photocatalytic behavior in the anatase phase, which helps kill cancer cells. As a result, TiO2 NPs are proposed for many applications, such as the degradation of organic pollutants, as well as air and water cleaning [12].
Polyvinyl alcohol (PVA) is a spectacular adhesive polymer that is transparent, water-soluble, cheap, and simple to fabricate. When PVA was doped with titanium dioxide, it demonstrated promising electrical and third-order nonlinear characteristics [13]. Additionally, 4N4MSP chalcone-doped PVA was shown to have significantly better nonlinear absorption and refraction characteristics than pure PVA [14]. A film prepared from PVA and an aqueous solution of potassium dichromate was produced an optical conductivity with a value of 1010 s−1 and an n2 of 10−13 cm2W−1 [4]. Nanocomposites formed by doping MnS/xZnS into the host blend of PVA/CMC displayed a change in the fluorescence intensity and an enhancement in the nonlinear optical parameters, refractive index, conductivity, dielectric function, and some other optical parameters [15].
Being biodegradable, stable, biocompatible, non-toxic, and inexpensive, and possessing anti-inflammatory properties and pH sensitivity are some features of sodium alginate (SA). Because of the hardness and fragility of SA, combining it with a flexible polyvinyl alcohol (PVA) to make a patch was a good solution for this problem, as studied in a published work [16]. Increasing the added amount of multi-walled carbon nanotubes in a polyethylene oxide (PEO)/SA blend resulted in a decrease in the crystalline ratio observed from the XRD spectrum and a decrease in the energy gap denoted by spectroscopic techniques [17]. The formed nanocomposites of SA/TiO2 and SA/graphene oxide (GO) achieved an increase in the absorbance of the host matrix (SA) by raising the nanofiller’s content due to the interaction between SA and the doped nanofillers [18].
Some studies [19,20] have investigated the potential use of eco-friendly nanomaterials and their nanocomposites in optoelectronics. In this work, the authors followed this trend of research and prepared the nanocomposites based on green synthesized TiO2 NPs using aloe vera leaf extract. The aloe vera leaf was chosen for the green preparation method of TiO2 NPs because it is inexpensive and easy to be obtained. In addition, aloe vera leaf was utilized as a reducing agent to create gold and silver nanoparticles, as reported in some literature [21,22]. In this study, the aloe vera leaf extract was chosen as the reducing agent for the green synthesis of TiO2 NPs from the precursor. According to our knowledge, studying linear and nonlinear optical properties of the nanocomposites prepared by doping green synthesized TiO2 NPs using aloe vera leaf extract into a PVA:SA blend has never been explored, making the current work a novel study. This work presents the preparation of nanocomposites of PVA:SA:TiO2 with different nanofiller contents (0, 1, 3, and 5 wt.%). UV-Vis spectroscopy and Z-scan techniques were used to determine nonlinear optical parameters, including n2 and the third-order susceptibility (χ(3)). Furthermore, different important optical parameters were determined based on the absorption and transmission spectrum to understand the additional effect of TiO2 NPs on the PVA:SA host blend. Some different theoretical models were used to estimate the refractive index (n) based on the deduced values of optical gap energies estimated by different models. The structure of the prepared nanocomposites was examined by SEM measurement and XRD analysis. The studied nanocomposites were examined for their utility in the optical limiting of CUT-OFF laser filters utilizing a continuous He-Ne laser working at 632.2 nm.

2. Experimental Technique

2.1. Materials and Preparation of the Samples

Polyvinyl alcohol (PVA) with Mw ≈ 115,000 g·mol−1 was purchased from LOBA CHEMIE (Mumbai, India). Sodium alginate (SA) was purchased from Fisher Scientific (Loughborough, UK). Both of these polymers were used with no purifications. TiO2 NPs with an average size of 15.83 ± 0.902 nm were prepared in a previous work [23] using aloe vera extract at a normal pH value.
The PVA:SA:TiO2 nanocomposite films were synthesized by a solvent casting method. Firstly, the PVA solution was synthesized by dissolving PVA in distilled water and stirring at 90 °C for 2 h until a clear solution was obtained. Next, the SA solution was prepared by dissolving SA in distilled water and stirring at room temperature for 4 h. PVA and SA (PVA:SA 3:1 w/w) were then mixed under constant stirring for 6 h until a homogenous solution was obtained. Different proportions of TiO2 NP suspensions with contents of 0, 1, 3, and 5 wt.% were added to the prepared PVA:SA solution after sonication for a few minutes. The resulting suspension was stirred overnight. The final suspensions were ultra-sonicated for 15 min. The obtained suspensions were cast in Petri dishes and dried. The resulting films were reserved in a desiccator before further characterization. The preparation method is represented in Scheme 1. The films of the nanocomposites have an average thickness of 0.15 ± 0.001 mm.

2.2. Absorption Measurements

A JASCO (V-550) UV-visible spectrophotometer (Tokyo, Japan) was used for the absorption and transmission measurements.

2.3. X-ray Measurements

The measurements of the X-ray diffractometer (XRD, Panalytical X’Pert PRO diffractometer, Almelo, The Netherlands) were investigated in a scan range of 10°–70°. CuKα radiation (Philips X’Pert Diffractometer) was used to investigate the samples.

2.4. SEM and EDX Measurements

Scanning electron microscopy (SEM) and EDX analysis were carried out using a ZEISS EVO-15 (Oberkochen, Germany). For SEM measurements, the films were sputter-coated (Quorum: Q150RS plus) by a thin layer of gold. The sputtering process was carried out at 25 mA for 180 s.

2.5. Z-Scan Analysis

Z-scan technique was constructed with the assistance of a nanosecond pulsed laser produced by a Nd:YAG laser (Continuum laser, PRII 8000, Electro-optics Inc., Wyandotte, MI, USA) with an SHG crystal to generate 532 nm. The produced laser beam had a repetition rate = 10 Hz and a laser influence = 111 mJ using the delay stage knob between the laser device’s oscillator and amplifier. The sample position was tuned across the focusing point using the delay moving X-Y-Z stage had 10 μm in each step to conduct the Z-scan experiment investigation. The laser beam was concentrated in this investigation using a convex lens (f = 100 mm). Two power meter detectors (LTS 150 M THORLABS, Newton, NJ, USA). Additionally, a single-source He–Ne laser beam (632.8 nm) was used to study the optical limiting inquiry on the manufactured samples. On the front of the He–Ne laser source was mounted a focus lens of 7 cm. After that, the influence power of the employed laser source was calculated using an optical measuring instrument (Scheme 2).

3. Result and Discussion

3.1. SEM and EDX Analysis
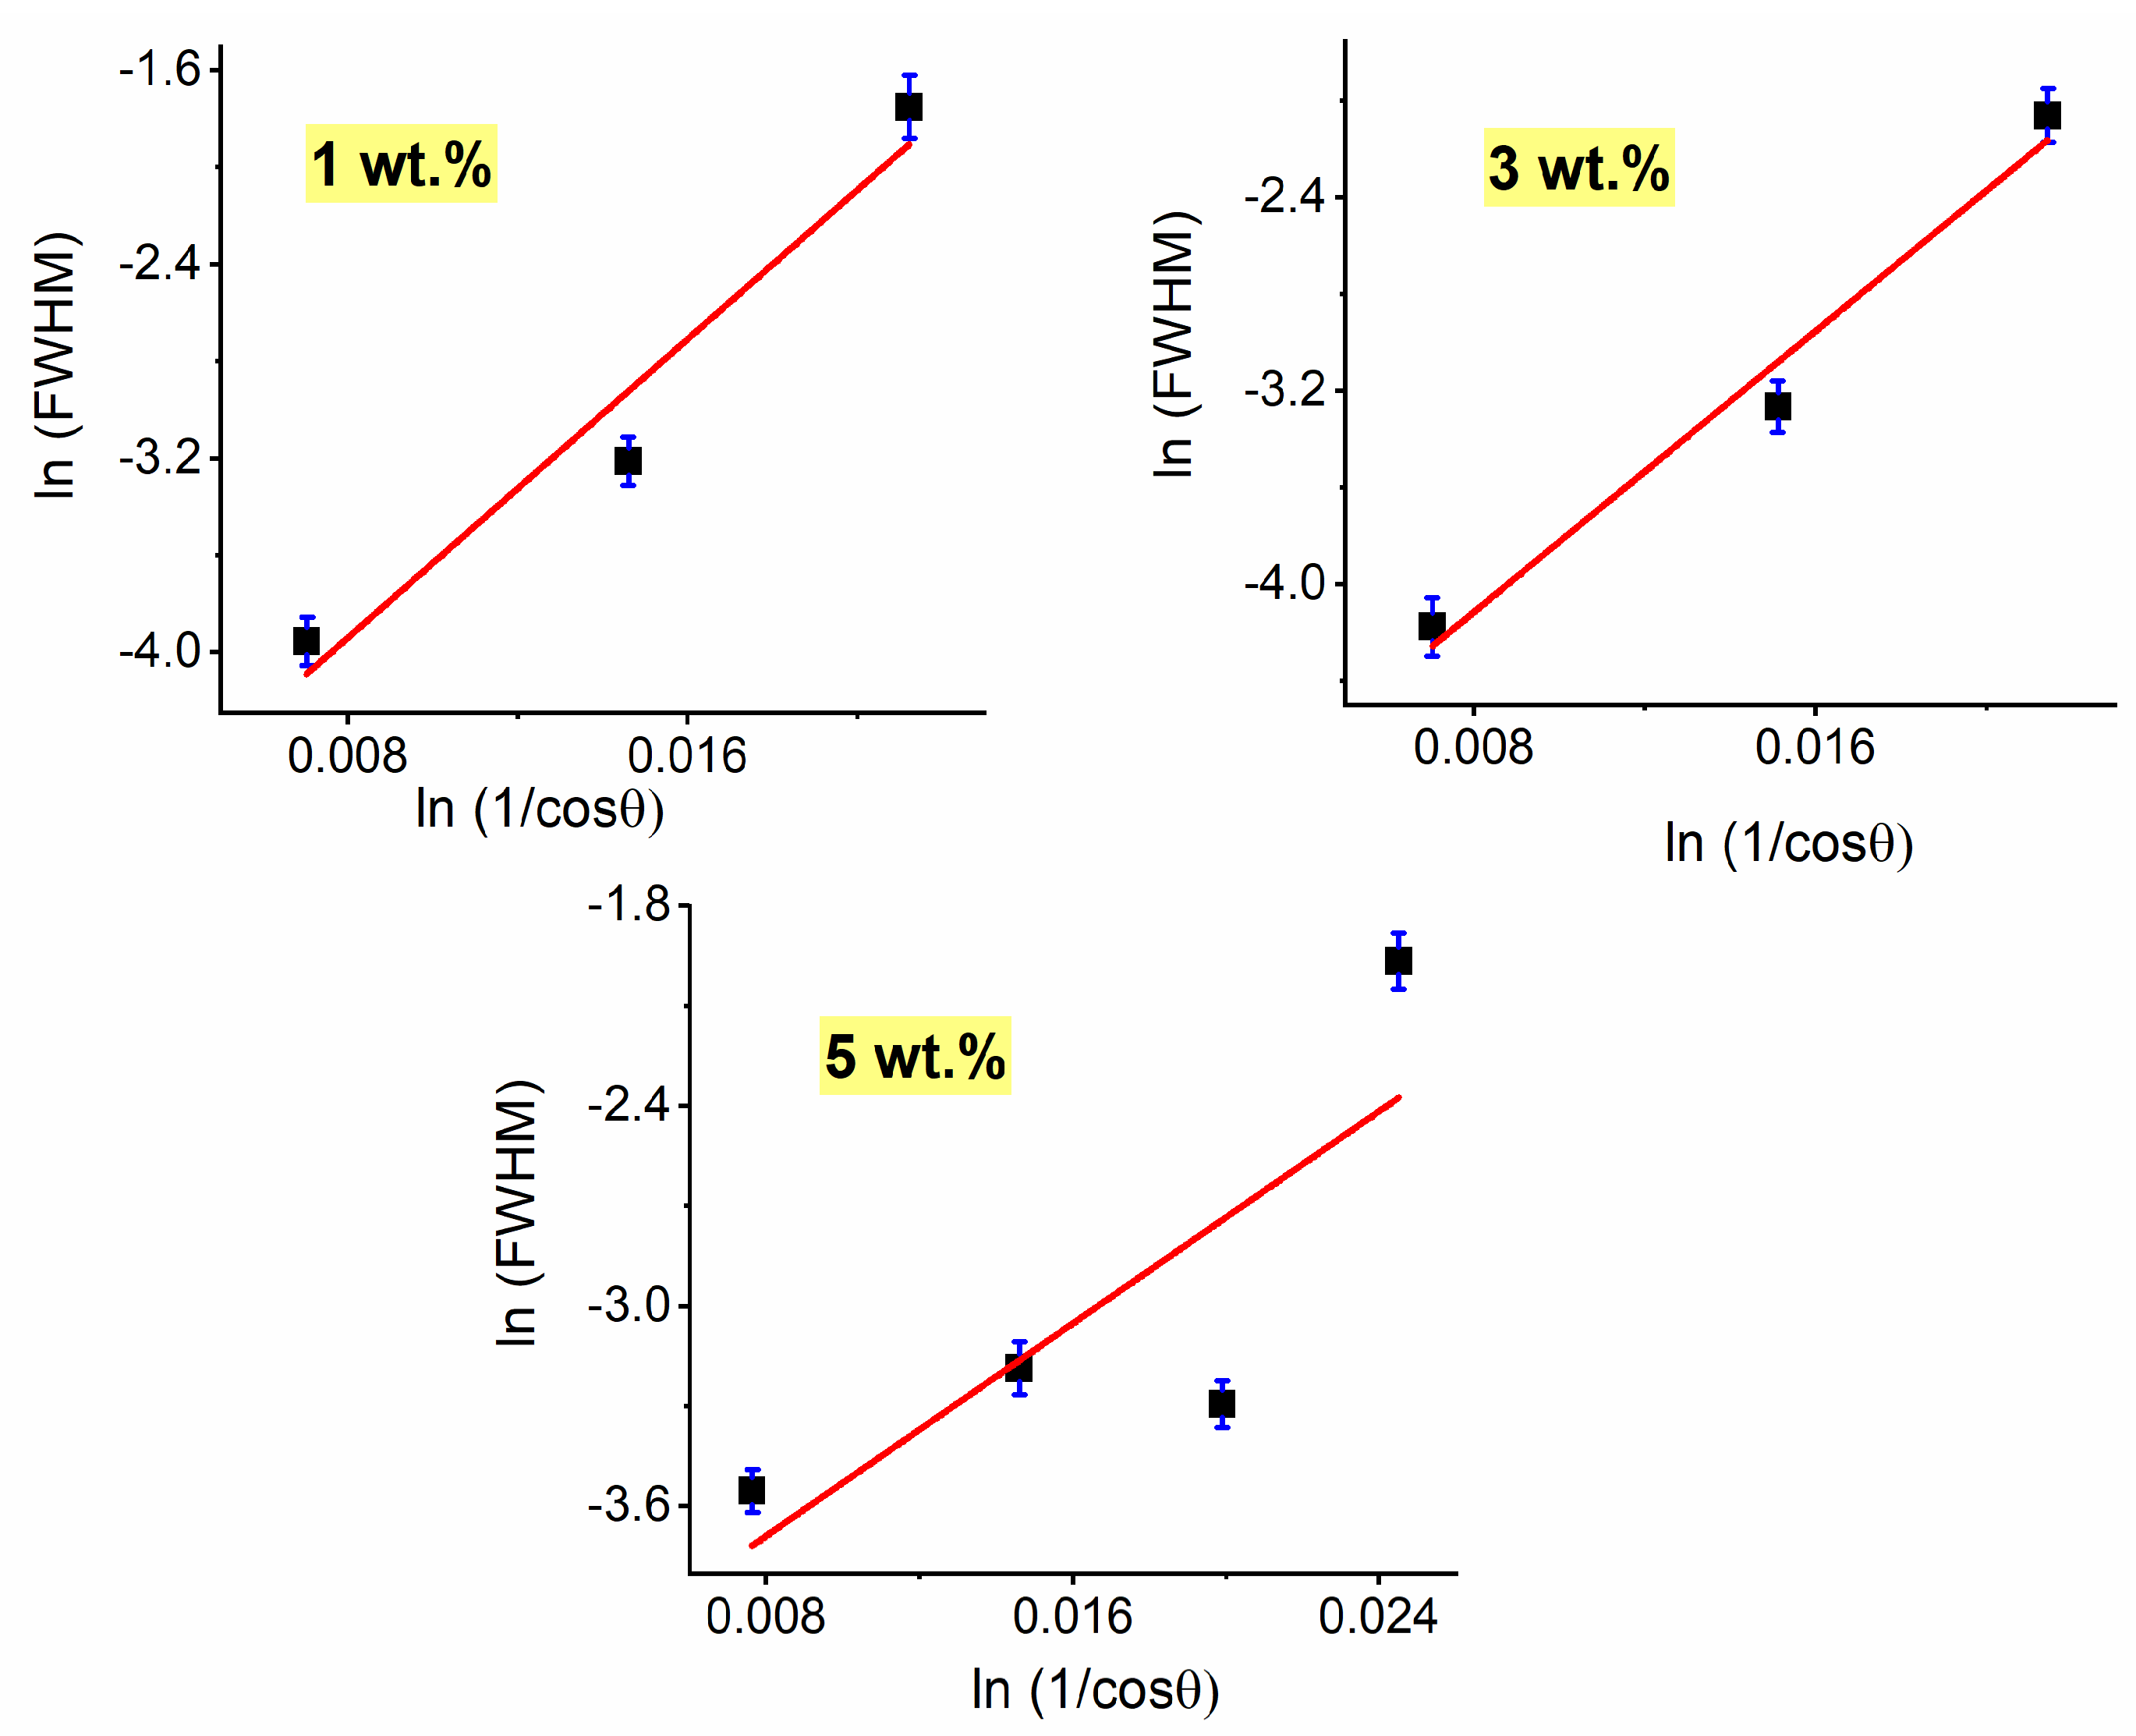
To describe the dispersion of TiO2 NPs into the host blend, SEM was used as seen in Figure 1. SEM images of the pure PVA:SA blend illustrated a close-net structure, as observed in Figure 1a. The TiO2 NPs were homogeneously dispersed through the host blend with some agglomerates; see Figure 1b–d. The agglomerates of TiO2 NPs are visible in the SEM images as lighter-colored areas in contrast to the darker area corresponding to the host blends. The non-compatibility between the TiO2 NPs and PVA:SA blend resulted in some voids in the examined nanocomposites [24]. This result can be a consequence of the poor intermolecular interaction between TiO2 NPs and PVA:SA blends. Such voids of the nanocomposites increased by raising the amount of TiO2 NPs in the host blend. The element distribution of PVA:SA:TiO2 nanocomposite films was depicted in Figure 2a–d and Table 1. In the pure PVA:SA film, there are three main elements, including C, O, and Na. The strong peaks of C and O were related to the hydrophilic functional groups of hydroxyl and carboxylic groups, which were mostly connected with PVA and SA. In contrast, the peak presence of Na was mostly associated with SA. Additionally, Ti peaks, on the other hand, verified the doping of TiO2 NPs in the generated nanocomposite. In addition, peaks of very small intensities corresponding to Mg, P, K, Ca, Zn, and Cr were detected in PVA:SA:TiO2 nanocomposites, as seen in Figure 2b–d. Such peaks are assigned to the plant bio-molecules [25], which are presented in the aloe vera leaf extract from the preparation of TiO2 NPs [26]. Additionally, the atomic percentage of Ti increased from 0.7 to 1.13% when increasing the amount of TiO2 NPs. The EDX data supports the successful preparation of PVA:SA:TiO2 nanocomposites.

3.2. XRD Analysis

The XRD patterns of the pure PVA:SA blend and its nanocomposites with TiO2 NPs are shown in Figure 3. The XRD pattern of the pure PVA:SA blend has two distinct sharp diffraction peaks at 2ϴ = 19.78° and 23.17° corresponding to FWHM of 2.44° and 11.9° and a d-spacing of 4.5 Å, and 3.8 Å, respectively. These two peaks are characteristic of PVA, which indicates a low-crystallinity system, in agreement with some published literature [27,28]. Additionally, the presence of pure SA was confirmed from the appearance of peaks at 2ϴ = 13.52° and 40.19°, corresponding to FWHM of 1.24° and 14.0°, and d-spacing of 6.5 Å and 2.2 Å, respectively [29].
The XRD spectra of the different amounts of TiO2 doped in PVA:SA blend (1, 3, and 5 wt.%) are illustrated in Figure 3. The values of 2ϴ of the characteristic peaks, FWHM, and d-spacing for the different nanocomposites of PVA:SA:TiO2 are tabulated in Table 2. For the highest content of TiO2 NPs (5 wt.%) doped in the host blend, Table 2 illustrates the presence of a characteristic peak of TiO2 NPs at 2ϴ = 25.25°, in agreement with a previously published work [23]. The addition of TiO2 NPs to the host blend caused a change in the positions of the characteristic peaks of PVA and SA. It was also observed that the intensity of the characteristic peak of PVA at 2ϴ = 19.78° increased by raising the content of TiO2 NPs up to 3 wt.%, then decreased for the highest content (5 wt.%).
The broadening of the characteristic peaks can be understood from determining the values of the lattice strain (εstr.) for the different nanocomposites. Stacking faults, coherency stresses, contact stresses, lattice imperfections, distortion, and others can affect the values of εstr. [30,31]. Therefore, it was important to estimate the values of εstr. for the different nanocomposites. Stokes–Wilson [32,33,34] proposed a relationship to calculate the lattice strain (εstr.) based on the FWHM of the peaks of the XRD pattern and the scattering angle (θ) at the maximum peak as the following:
ε s t r . = F W H M 4 ( tan θ )
The tabulated values of εstr. in Table 2 were TiO2 NP content-dependent. The values of εstr. detected at 2ϴ = 19.78° are 0.058, 0.055, and 0.060, corresponding to 1, 3, and 5 wt.% of TiO2 NPs doped in the PVA:SA blend, respectively.
The average crystallite size (D) was deduced using the Debye–Scherrer formula [35]:
D = K λ ( F W H M )   ×   COS θ
where K is a constant related to a crystal form and the Miller index of reflecting crystallographic planes. It has a value of 0.9 [36]; furthermore, λ is the X-ray wavelength, and θ is Bragg’s angle. By taking the logarithm for both sides of Equation (2):
L n ( F W H M ) = L n K λ D COS θ = L n K λ D + L n 1 COS θ
The value of ( L n K λ D ) was obtained from the intercept determined from plotting ( L n   F W H M ) versus ( L n 1 COS θ ), as observed in Figure 4. The average particle size (D) has values of 24.32 nm, 27.17 nm, and 10.42 nm, corresponding to the TiO2 NPs doped in the host blend, as listed in Table 2. The variation in the values of D can change the related deformations in the prepared nanocomposites as a result of the inverse relationship between them and the values of lattice strain (εstr.) [37].
The dislocation density (δ) was utilized to characterize the number of defects in the nanocomposites according to the following relationship [38]:
δ = D 2
From Table 2, the values of the dislocation density (δ) are 1.69, 1.35, and 9.21 (105 lines per square meter) corresponding to TiO2 NPs doped in the PVA:SA blend from the lowest to the highest content. Therefore, increasing the content of TiO2 NPs leads to an increase in their defects.

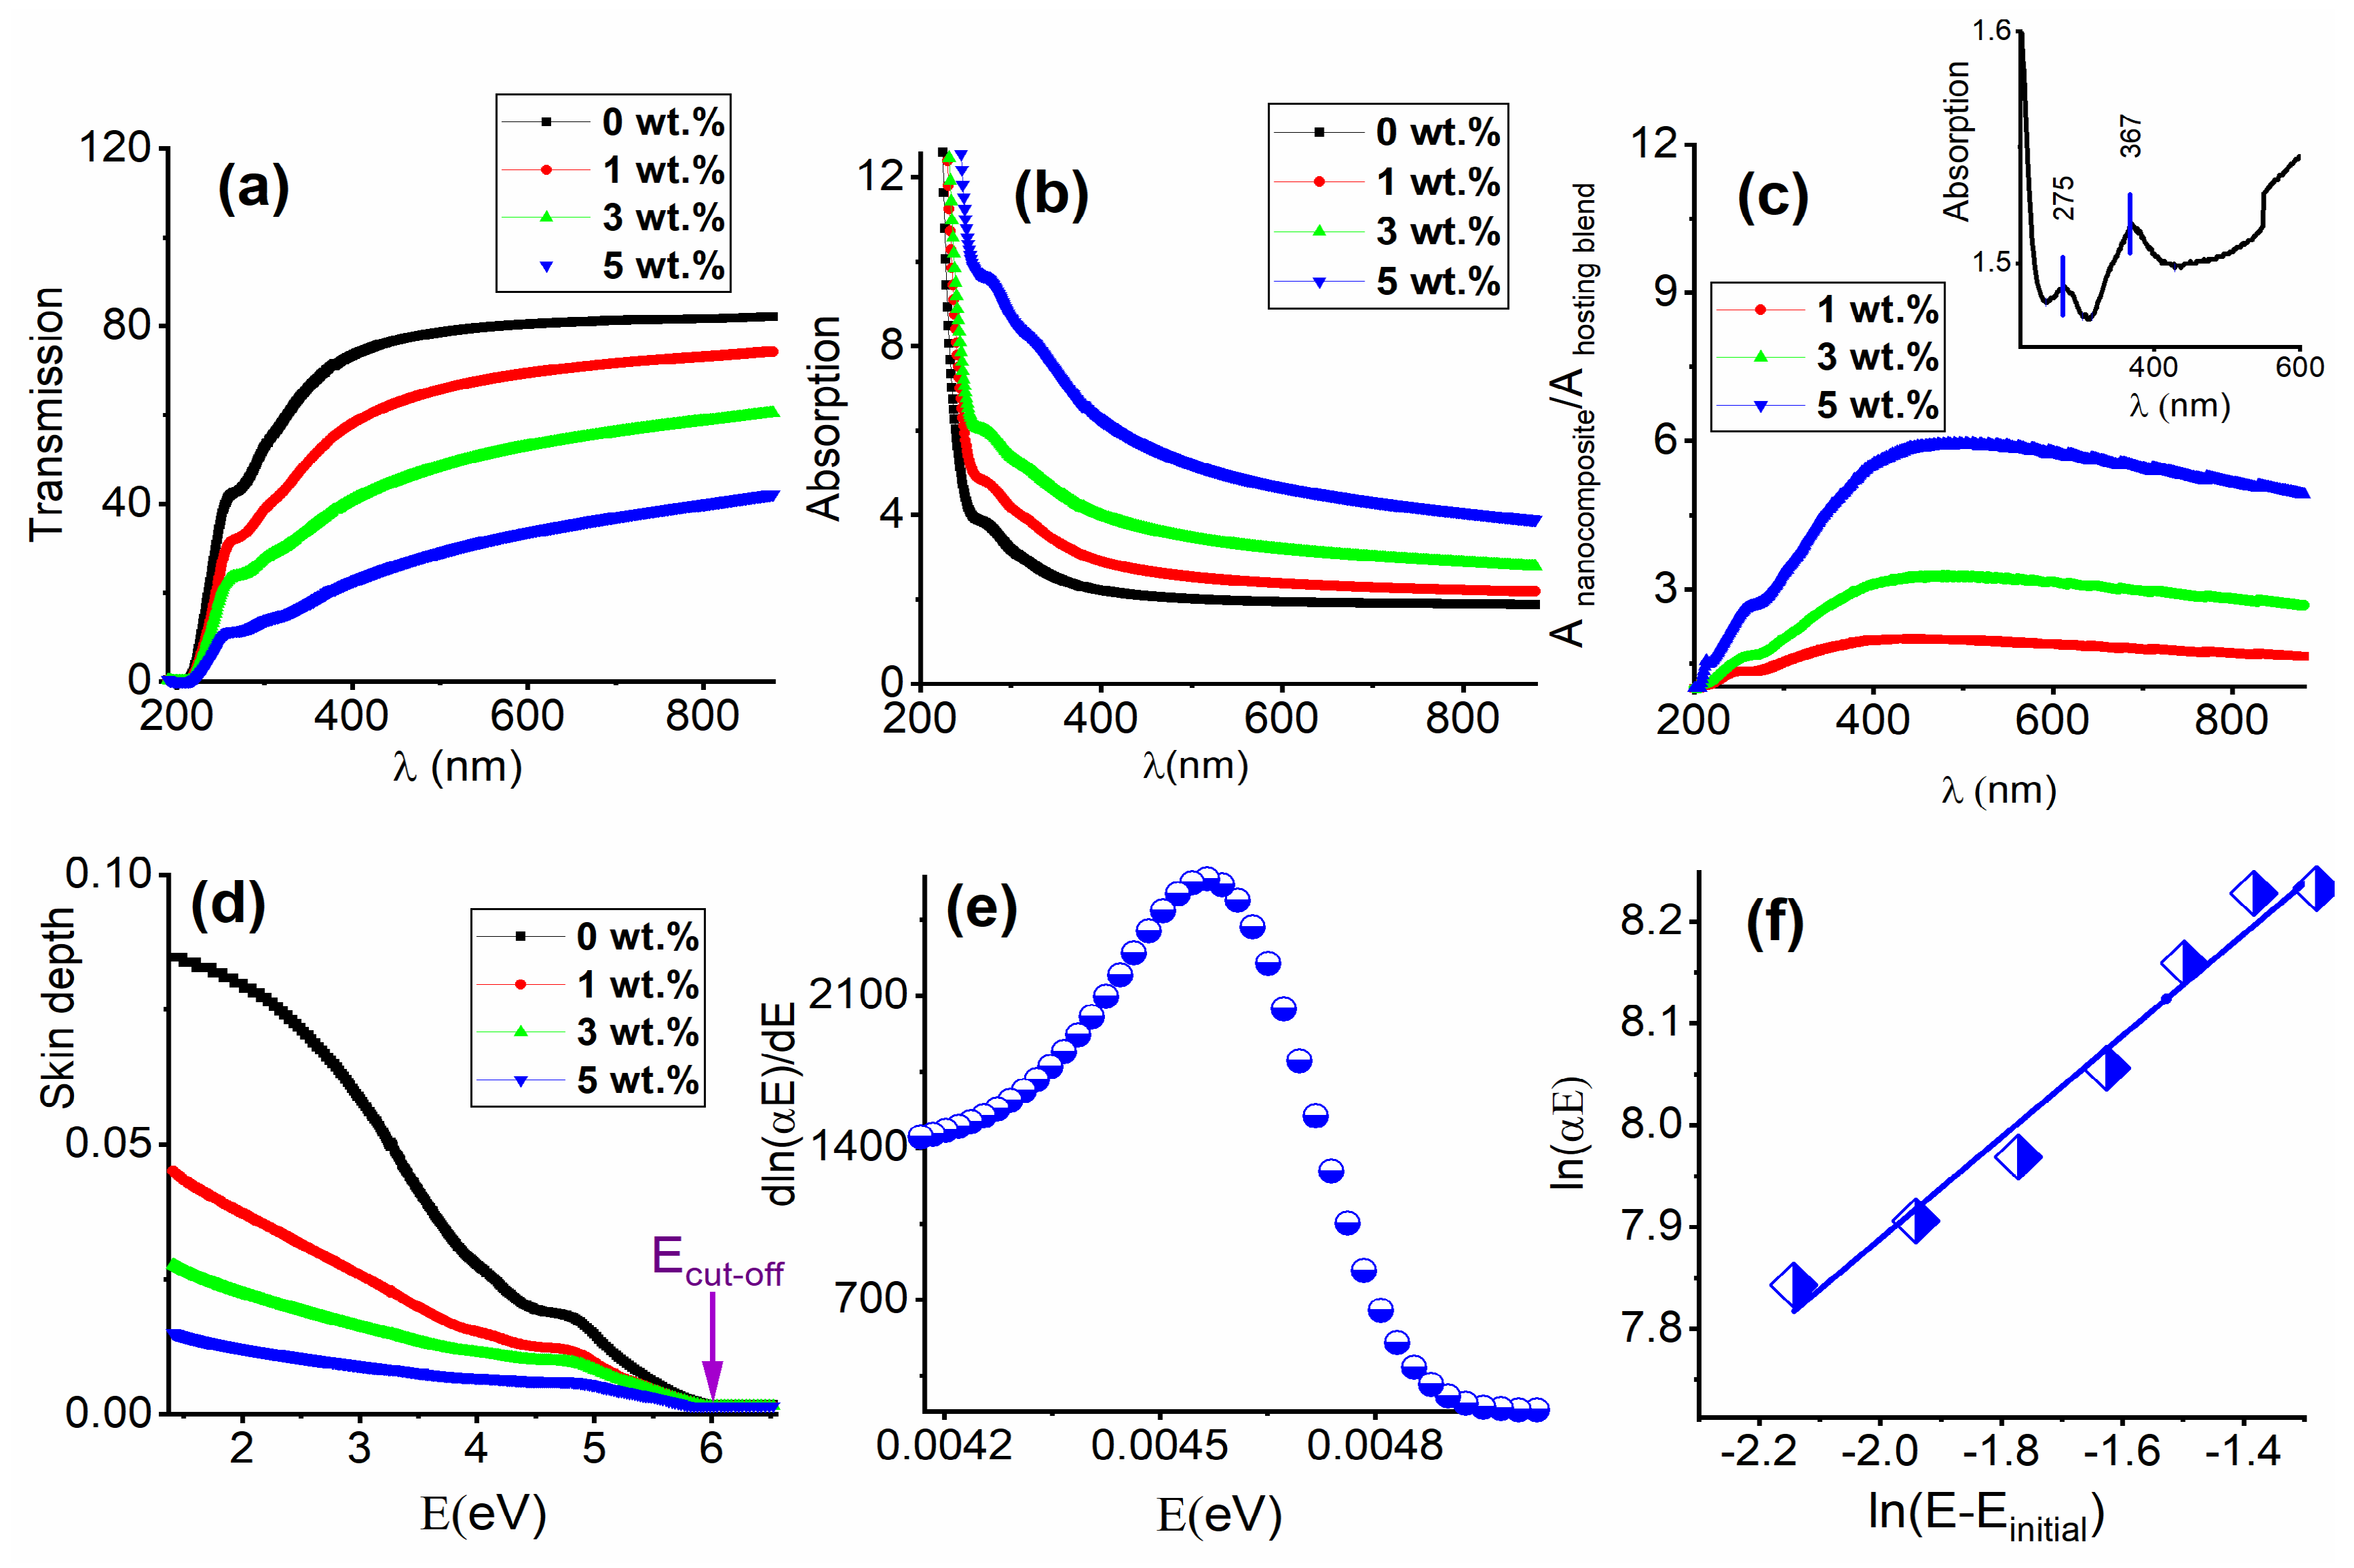
3.3. Optical Parameters Deduced from UV-Vis Spectroscopy

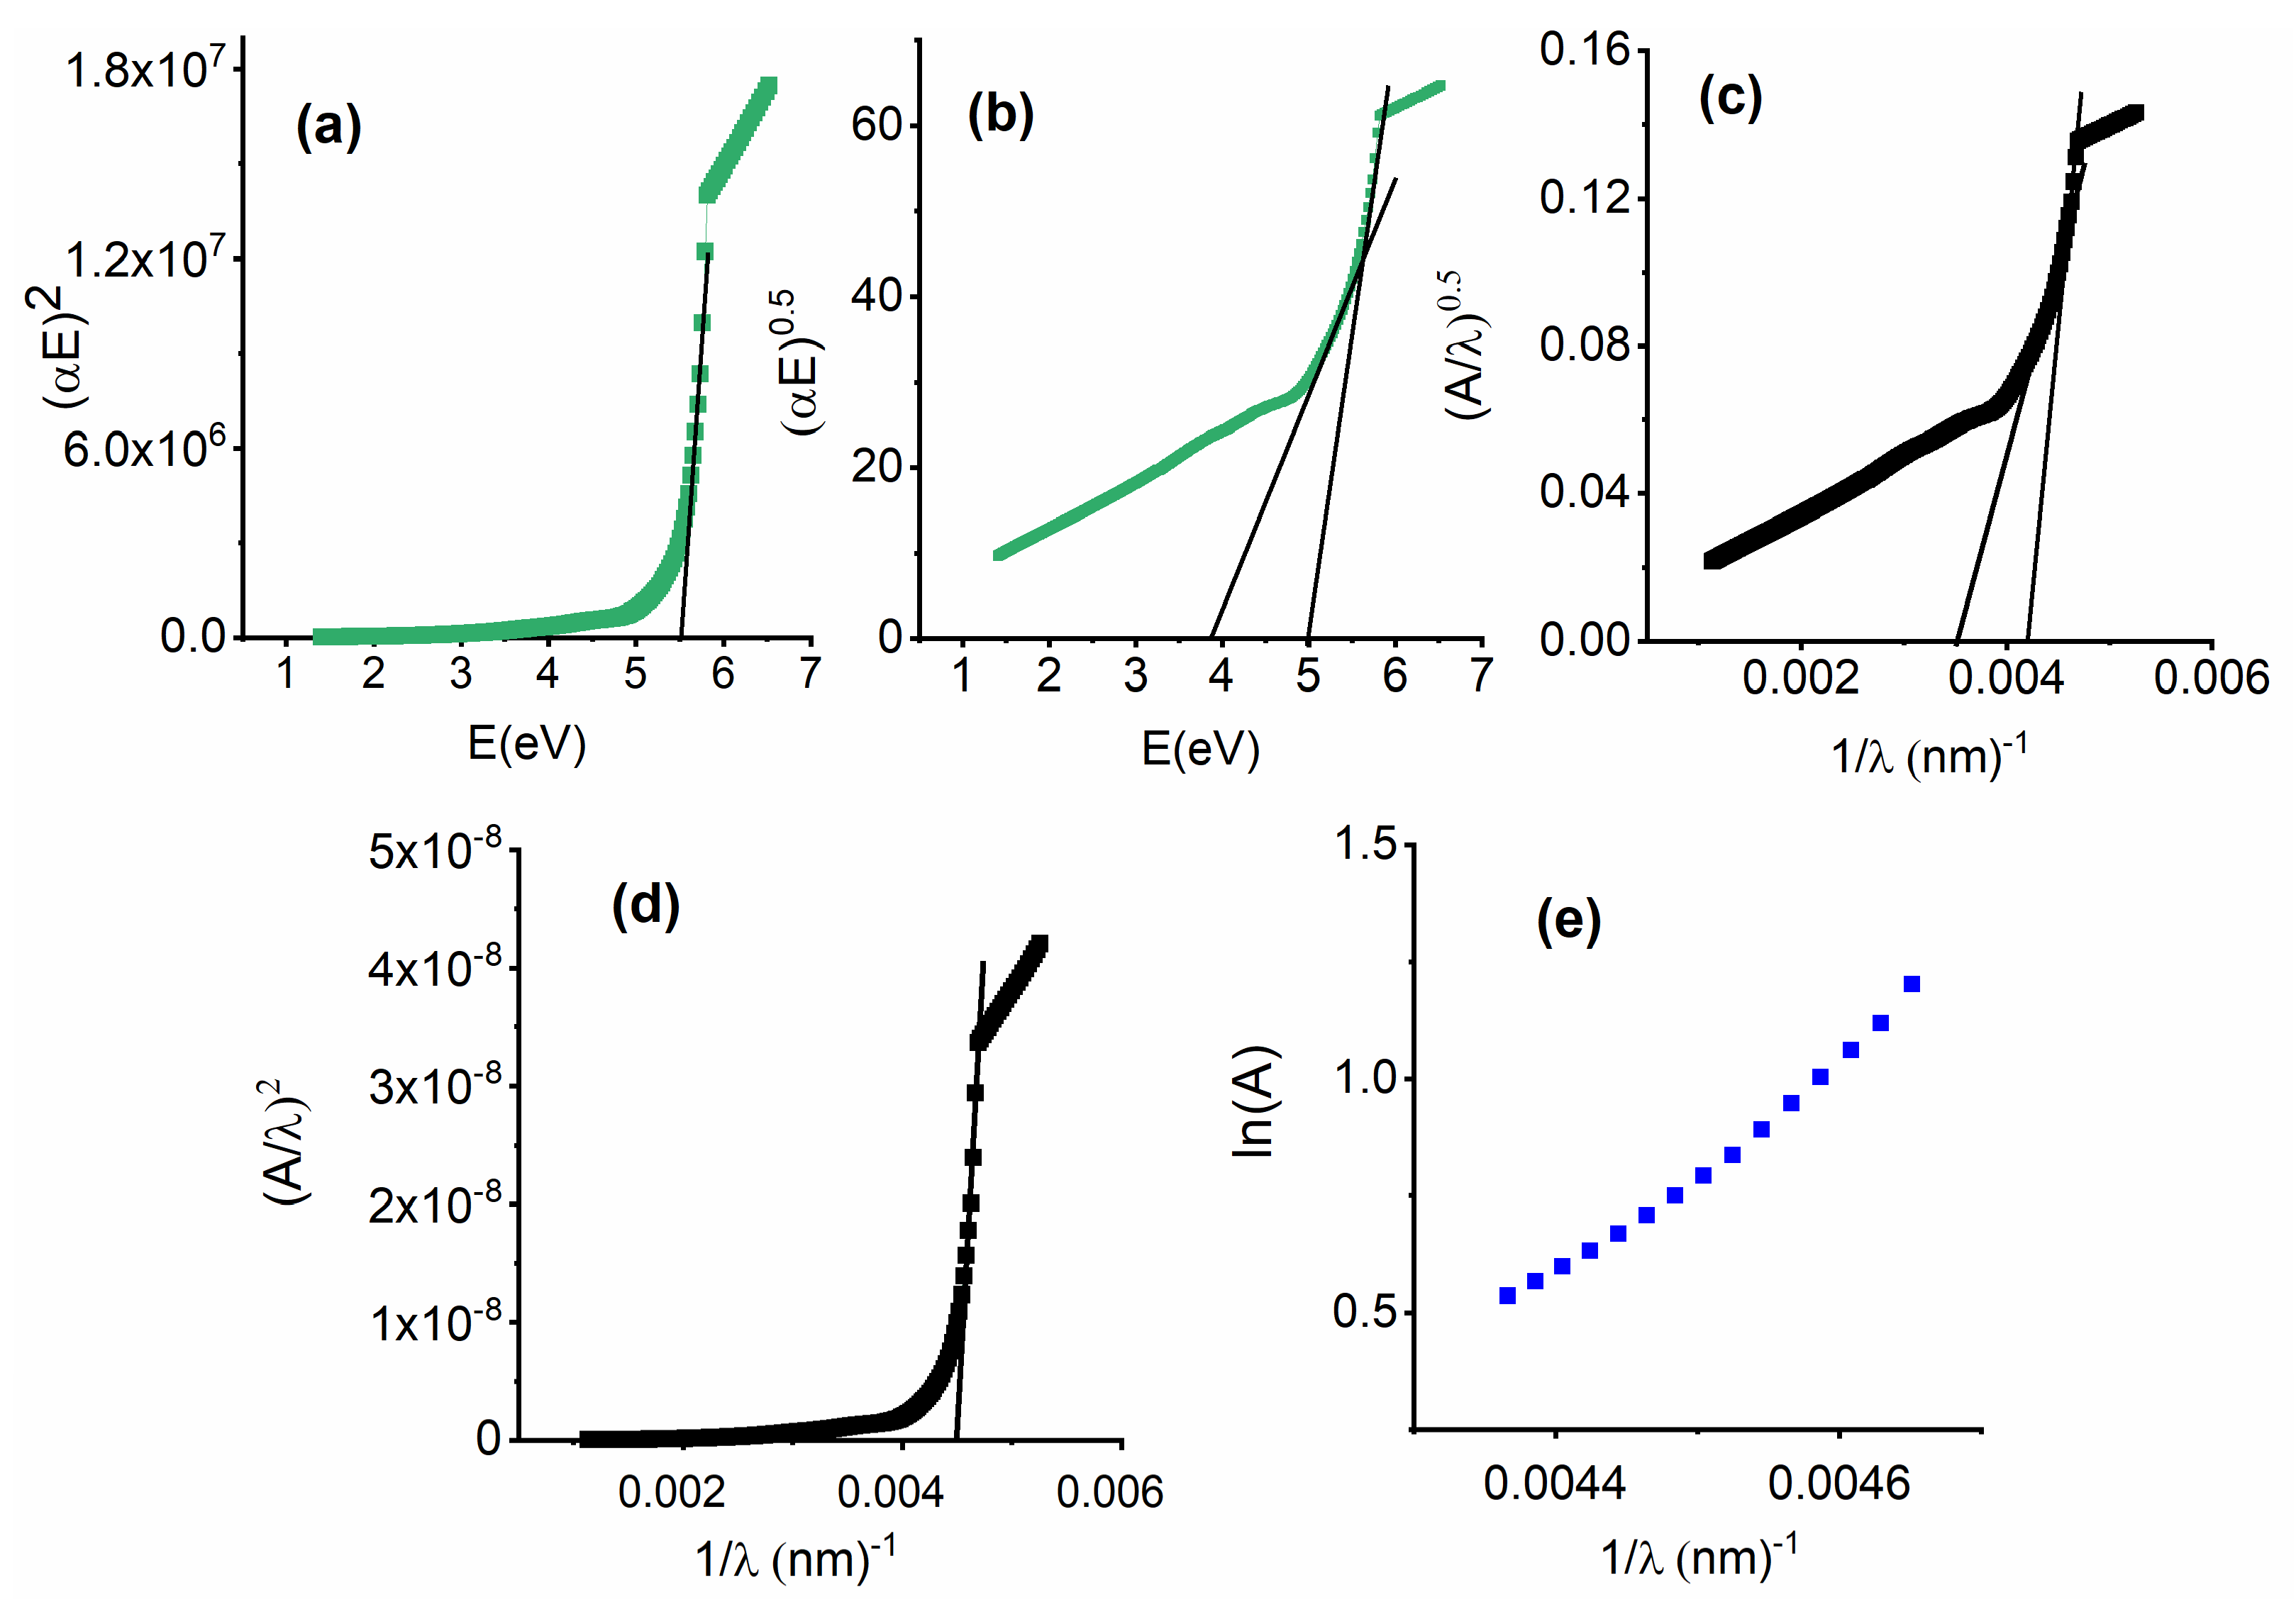
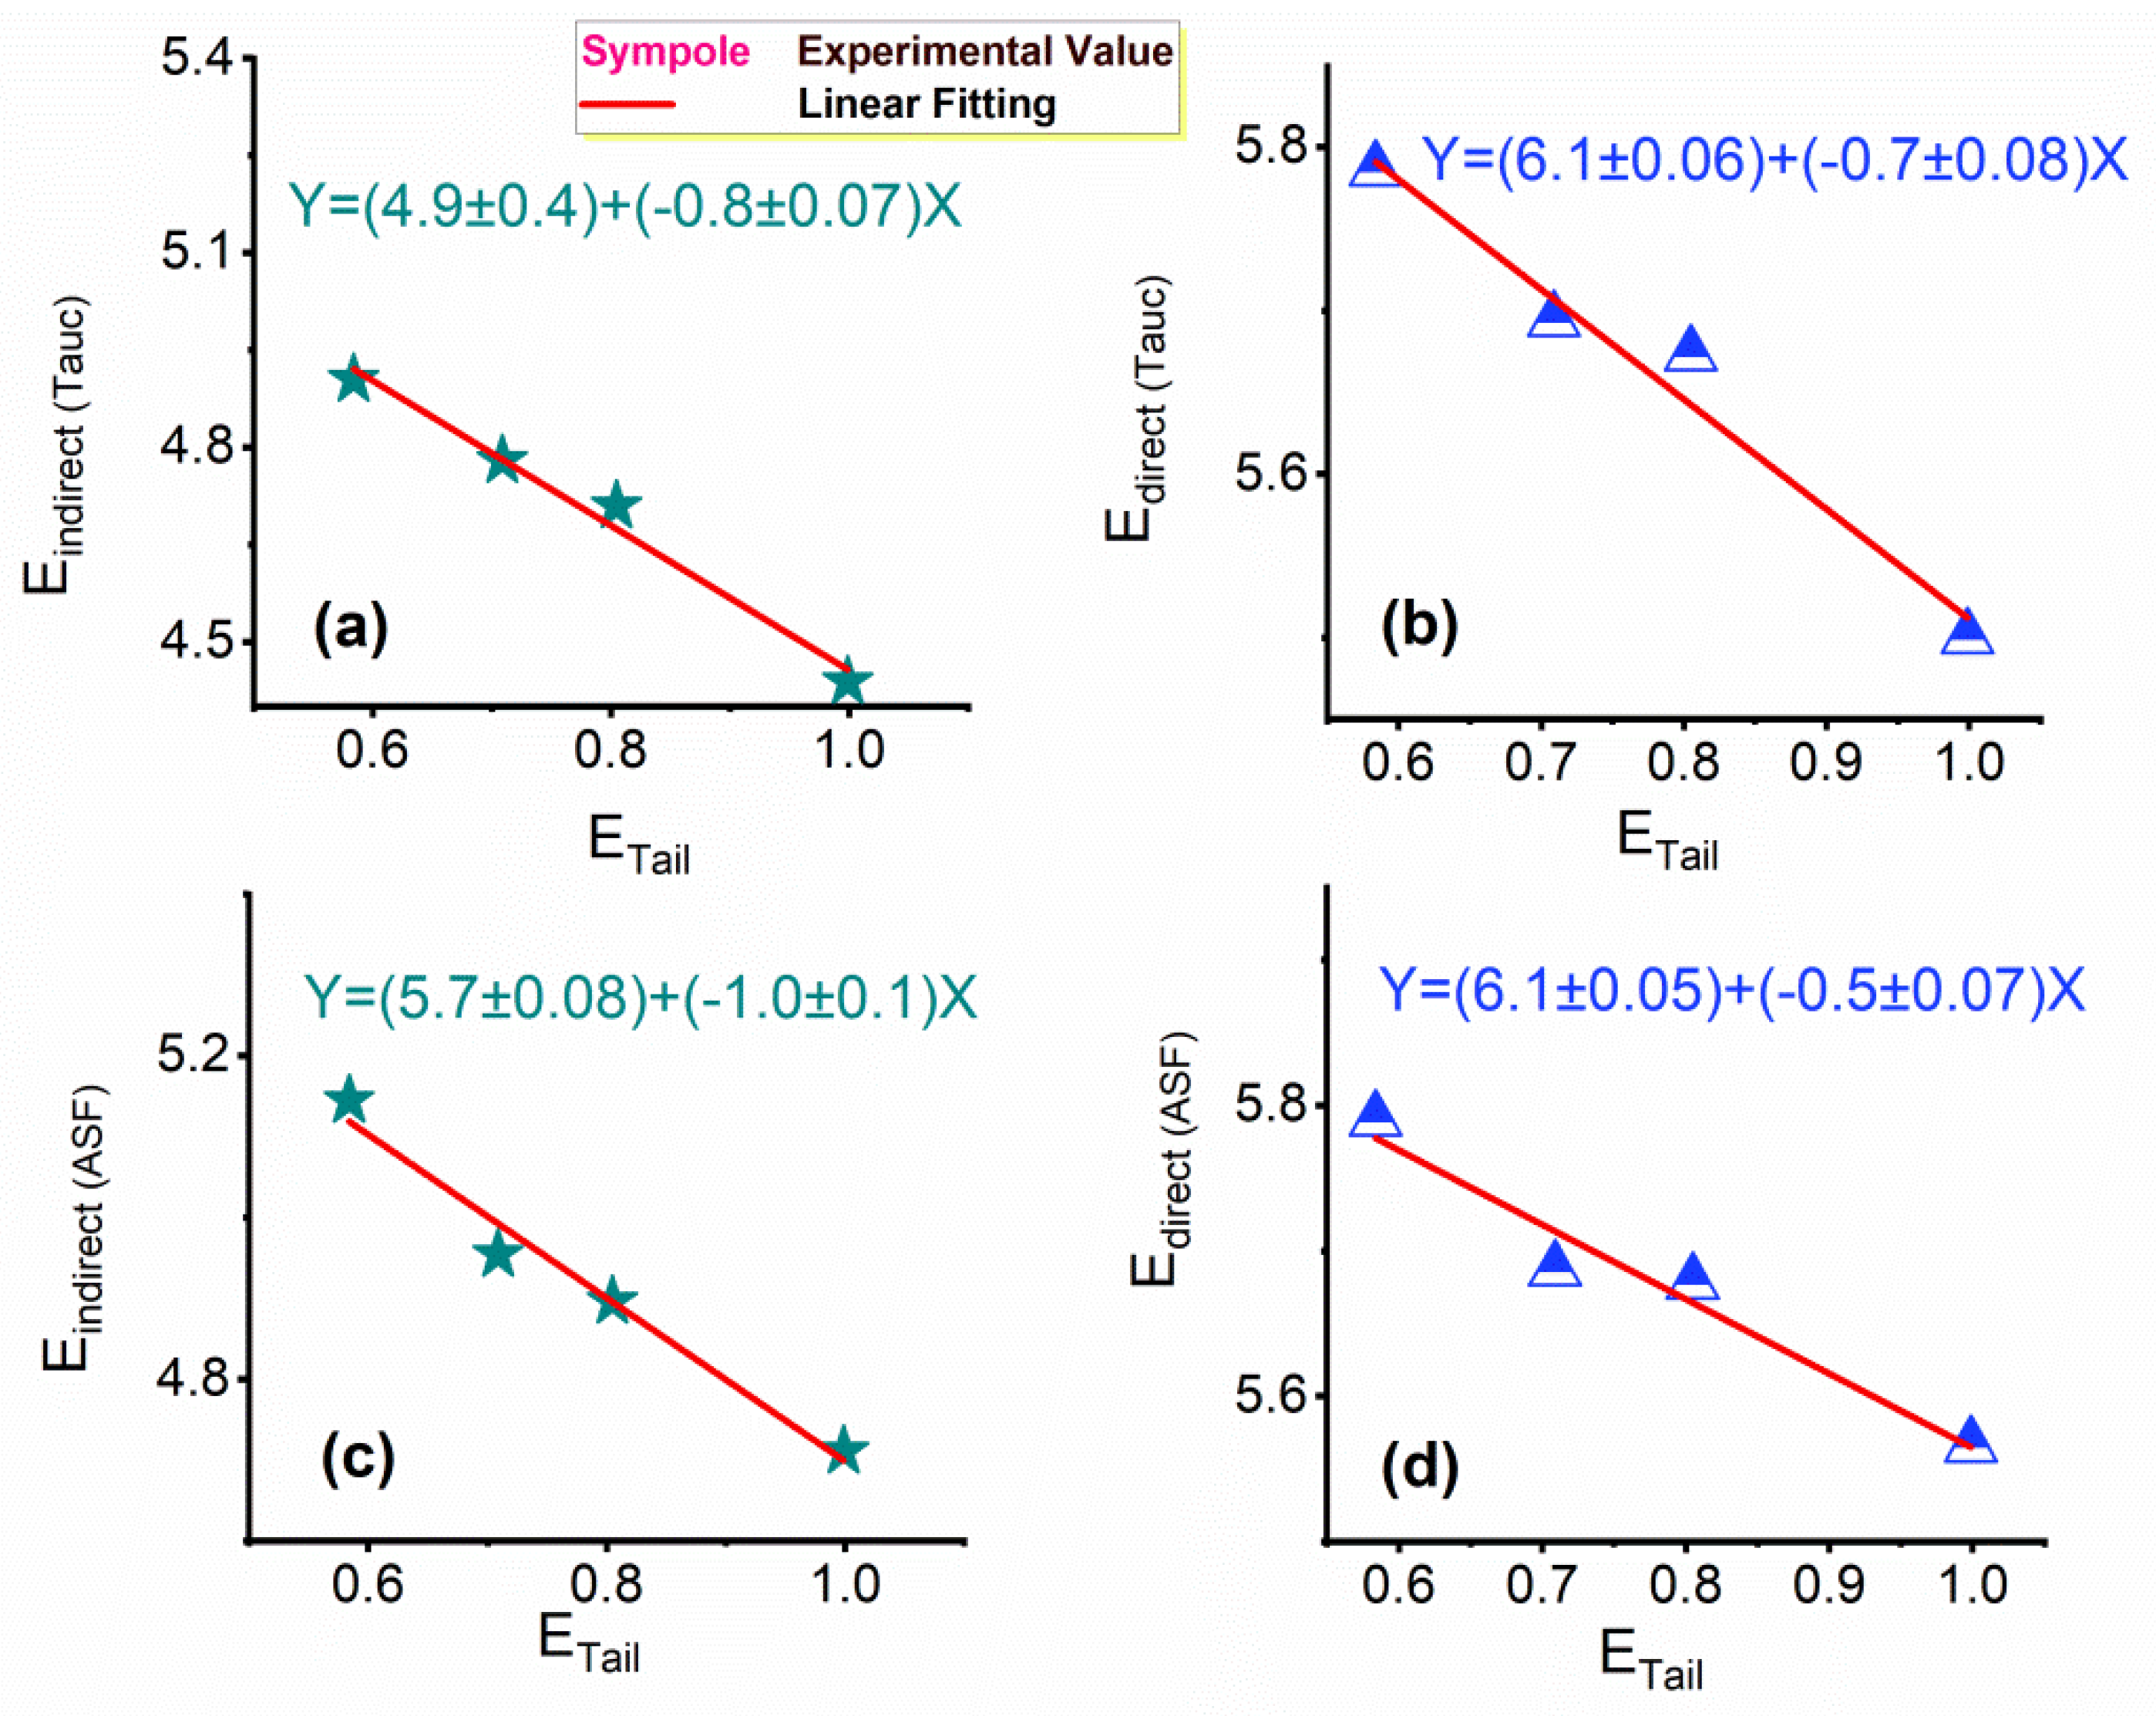
3.3.1. Interband Transitions, Urbach Energy, and the Steepness Parameter (S)

An aspect of optical absorption study is one of the essential means of comprehension of the material’s structure and energy gap. Figure 5a,b illustrates the variation of the transmission and the absorption spectra, respectively, of different contents of TiO2 NPs doped in the host blend of PVA:SA 3:1. An obvious improvement in the absorption of the PVA:SA blend was detected by raising the content of the doped TiO2 NPs. The growth of the TiO2 NPs in the host blend is thought to cause this attitude. In general, TiO2 NPs have absorption peaks at wavelengths less than 400 nm, one at around 275 nm and the other in a range from 320 nm to 382 nm, according to the published literature [39,40]. For the nanocomposites of the current study, Figure 5b shows a small peak observed around 274 ± 1.4 nm for all the samples. This peak is related to the electronic transition from O 2p in VB to Ti 3d in CB [40]. Figure 5c shows the absorption spectrum of the different nanocomposites divided by that of the host blend of PVA:SA 3:1. The produced spectrum in Figure 5c resulted in the appearance of an absorption peak at about 427 nm, 454 nm, and 450 nm corresponding to the TiO2 content of 1 wt.%, 3 wt.%, and 5 wt.%, respectively. Such peaks are due to the presence of aloe vera, in agreement with some literature [41,42]. The inset in Figure 5c illustrates the absorption spectrum of used TiO2 NPs with their extract dissolved in deionized water, which illustrates the appearance of characteristic peaks at 275 nm and 367 nm. The main characteristic peak of TiO2 NPs at wavelengths of 367 nm disappeared when they were embedded in the PVA/SA blend. Such behavior was also observed for selenium nanoparticles (characterized by absorption peaks at 262 nm and 388 nm) doped in the PVA:SA blend [43].
The penetrated distance of a material by the incident light can be described by the skin depth factor, which equals the reciprocal of the absorption coefficient (the absorption coefficient (α) is the ratio between the absorption and the thickness of the sample) [44]. The variation of the skin depth with photon energy can be illustrated in Figure 5d for all the samples under study. In Figure 5d, the increase in the TiO2 NPs in the host blend of PVA:SA 3:1 caused a decrease in the skin depth values and therefore decreased the transparency of the nanocomposites. In addition, by increasing the applied photon energy, the skin depth decreases until reaching the cut-off energy (Ecut-off), where its value equals zero. All the samples have a cut-off energy of 6 eV corresponding to the cut-off wavelength of 206.6 nm.
The interband absorption process describes the electronic transition between the bands. The energy gap (Eg) can be deduced from studying ( α E)1/m as a function of Eg according to the Tauc equation in the Tauc region (α ≥ 10,000 cm−1) [45,46,47]:
α E = B ( E E g ) m
where m is the electronic transition (its value depends on the best linear fit [48]), and B is a constant that relies on the transition probability. Equation (5) can be re-written as the following:
d ln α E d E = m E E i n i t i a l
Plotting dln (αE)/dE versus E, for 5 wt.% of TiO2 doped in PVA:SA 3:1, shows an obvious peak; see Figure 5e. This peak is centered at an energy corresponding to the initial value of energy (Einitial), whose value is supposed to be close to the energy gap (Eg). The tabulated values of Einitial in Table 3 are 5.78, 5.76, 5.74, and 5.57 eV, corresponding to 0, 1, 3, and 5 wt.% of TiO2 NPs, respectively. The values of Einitial were fruitfully utilized in Figure 5f to plot ln (αE) versus ln (E-Einitial) for 5 wt.% of TiO2 NPs doped in PVA:SA 3:1, as an example for all the samples. The estimated values of the electronic transition (m) (Figure 5f) have values from 0.45 to 0.49. Consequently, for all the nanocomposites, the suggested predominant transition could be the direct allowed transition (m = 0.5).
For greater precision, Figure 6a,b shows the direct and indirect gap energies ( E d i r e c t T a u c ) and ( E i n d i r e c t T a u c ) that were determined by using Equation (5) from the linear portion of the plot between (αE)2 and (αE)0.5, respectively, versus E, for 5 wt.% of TiO2 NPs doped in PVA:SA 3:1, as an example of the others. The values of E d i r e c t T a u c listed in Table 3 are 5.78, 5.69, 5.67, and 5.50 eV, whereas the values of E i n d i r e c t T a u c are 4.91, 4.78, 4.71, and 4.44 eV, corresponding to the content of TiO2 NPs from 0 to 5 wt.% doped in the host blend.
The absorption spectrum fitting (ASF) procedure based on absorption spectra was also used to calculate the optical band gap, which was proposed by Souri and Shomalian [49] and Escobar-Alarc’on et al. [50] by making some adjustments to the Tauc model as follows [48,51]:
α λ = 2.303 d 1 A λ = J h c 1 + m λ λ 1 λ g 1 m
where J is a constant, and λg is the wavelength at which the optical gap occurs. The index “m” corresponds to the kind of electronic transitions responsible for the absorption and takes the values of 1/2 and 2 for direct and indirect allowed transitions, respectively. Extrapolation of the linear part of the plot of (Aλ−1)1/m against λ−1 at zero value of (Aλ−1)1/m yielded the reciprocal values of λg. The indirect ( E i n d i r e c t A S F ) and direct ( E d i r e c t A S F ) energy gaps were determined from the product of 1239.83 times λ g 1 . Figure 6c,d shows the variation of (Aλ−1)0.5 and (Aλ−1)2, respectively, with λ−1, for 5 wt.% of TiO2 doped in PVA:SA 3:1, as an example for all the samples. The values of ( E d i r e c t A S F ) and ( E i n d i r e c t A S F ) are tabulated in Table 3. The listed values of energy gaps estimated from Tauc and ASF methods decreased with an increase in the content of TiO2 NPs doped in PVA:SA 3:1. This behavior can be attributed to the creation of defects in a polymeric matrix that resulted in the formation of localized states in the optical band gap [52]. This finding agrees with the XRD data of the nanocomposites under investigation.
It is known that the fundamental absorption edge of most amorphous materials follows an exponential law. The ASF model effectively modified Urbach’s law [53], which could be expressed by the following relationship [54]:
A λ = H e x p ( h c λ 1 E T a i l )
where ETail describes the width of the tail of localized states (Urbach energy) when an optical transition occurs between a localized tail state near the valence band and an extended conduction band state above the mobility edge, whereas H is a constant. The best linear fitting of lnA-λ−1 plot was used to determine the values of ETail by using the relation of ETail = 1239.83/slope. Plotting lnA against λ−1 was depicted in Figure 6e for 5 wt.% of TiO2 NPs doped in PVA:SA 3:1, as an example of the others. A redistribution of states from band to tail can be inferred based on the rising values of ETail as a result of the increasing concentration of TiO2 NPs doped in PVA:SA 3:1. This attitude can result in the possible occurrence of band-to-tail and tail-to-tail transitions [55]. This behavior is in good agreement with some previous work [56,57,58].
Table 3 illustrates a comparison between the values of the energy gap and tailing state energy (Urbach energy) of the samples of the current study and some published literature [17,18,59,60,61]. Figure 7 illustrates the variation of ETail with the optical energy gap obtained by the different techniques used (Tauc and ASF). It was observed that the behavior of ETail of the different nanocomposites is contrary to the behavior of the optical gap ( E g a b T a u c and E g a b A S F ) . In addition, the linear equation obtained in Figure 7 from the linear fitting between ETail and E i n d i r e c t T a u c , E i n d i r e c t A S F , E d i r e c t T a u c , and E d i r e c t A S F provided the intercept with values of 4.9 ± 0.4 eV, 5.7 ± 0.08 eV, 6.1 ± 0.06 eV, and 6.1 ± 0.05 eV, respectively. These values of the intercept act as the expected energy gap values in the absence of the effect of ETail (ETail equals zero).
Table 3. The determined values of initial gap energy (Einitial), the kind of electronic transitions (m), Tauc optical gap ( E g a b T a u c ), ASF optical gap ( E g a b A S F ), and energy gap (Eg) estimated from plotting (εi) versus energy, tailing state energy (Urbach energy, ETail), the steepness parameter (S), the strength of electron–phonon interactions (Ee-ph), solar material protection factor (SMPF), and solar skin protection factor (SSPF).
Current WorkPreviously Published Works
Content of TiO2 (wt.%) Doped in PVA:SA 3:1PVA Ref [59]SA Ref [18]TiO2 Ref [61]0, 1.5, and 2.5 wt.% of TiO2 Doped in PVA
Ref [60]
SA/PEO Ref [17]
30/70 wt.%
Optical Parameter0135
Einitial
(eV)
5.785.765.745.57
m0.45 ± 0.0420.47 ± 0.0390.45 ± 0.0370.49 ± 0.037
E d i r e c t A S F
(eV)
5.7905.6875.6785.566
E i n d i r e c t A S F
(eV)
5.1454.9554.8974.711
E d i r e c t T a u c
(eV)
5.7865.6945.6735.5006.35 5.44
E i n d i r e c t T a u c
(eV)
4.9054.7804.7104.4395.265.262.904.8, 4.2 & 3.85.05
Eg estimated from plotting
(εi) vs. E (eV)
5.7285.6675.6475.529
E T a i l
(eV)
0.584 ± 0.030.709 ± 0.0280.805 ± 0.030.999 ± 0.0290.23 0.2, 0.4 & 0.8
S0.0440.0360.0320.026
Ee-ph14.9418.1420.5925.64
SMPF
(%)
27.041.858.376.4
SSPF
(%)
41.156.669.484.6
The strength of the interactions between electrons and phonons (Ee-ph) is given by the steepness parameter S, which was proposed by Skettrup [62,63,64], and it is responsible for the absorbance edge broadening. The S values can be determined from the following equation [65]:
S = T r o o m k B E T a i l
where kB is the Boltzmann constant. Table 3 depicts that the values of Ee-ph (Ee-ph = 2/3S) increase by raising the content of the TiO2 NPs. The nanocomposite of PVA:SA:TiO2 with 5 wt.% TiO2 NPs have the highest value of Ee-ph, which is 25.64. This result indicates that the filled bands increased with the addition of TiO2 NPs [66]. However, the values of S decrease by raising the amount of the embedded nanoparticle, and the highest value was detected in the host blend, which was 0.044. The inverse relation between S and Ee-ph may result from the embedding of TiO2 NPs into the host blend, which leads to the alteration of ionicity and the anion valence [66,67].

3.3.2. Solar Protection Factors

Solar Material Protection Factor (SMPF)

A measure of how well the PVA:SA blend and its nanocomposites with TiO2 NPs resist degradation carried on by solar energy is called the solar material protection factor (SMPF), which determined by the following formula [68]:
S M P F = 1 Σ λ = 300   n m λ = 600   n m C λ S λ λ T ( λ ) Σ λ = 300   n m λ = 600   n m C λ S λ λ
where Cλ equals e−0.012λ, T(λ) is the sample transmittance estimated from Figure 5a, Δλ is the wavelength interval, which equals 5 in the range 300–400 nm and 10 in the range of 400–600 nm, Sλ is the relative spectral distribution of solar radiation [69,70], and C λ S λ λ is obtained from a published reference [68]. The tabulated values of SMPF in Table 3 are 21%, 41.8%, 58.3%, and 76.4%, corresponding to the content of TiO2 NPs from 0 to 5 wt.%

Solar Skin Protection Factor (SSPF)

The term “solar skin protection factor”, or “SSPF”, refers to the capacity of the PVA:SA blend and its nanocomposites with TiO2 NPs to shield the skin of humans from the degradation that is brought on by the effects of prolonged exposure to solar energy [66]:
S S P F = 1 Σ λ = 300   n m λ = 400   n m E λ S λ λ T ( λ ) Σ λ = 300   n m λ = 400   n m E λ S λ λ
where Δλ is the wavelength interval (Δλ = 5 in the λ range from 300 nm to 400 nm), E λ S λ λ is obtained from published literature [69,70], and Eλ is the CIE erythemal effectiveness spectrum [69,71]. The values of SSPF for the different studied samples are listed in Table 3. The best SSPF was investigated by 5 wt.% of TiO2 NPs doped in PVA:SA 3:1, which was about 84.6% compared to the corresponding value of the host blend (41%). As a result, the increased values of SMPF and SSPF due to the addition of TiO2 NPs enable these nanocomposites to effectively protect materials and human skin from the damaging effects of solar energy. The estimated values of the skin depth factors are fairly close to being in line with the findings of SSPF and SMPF.

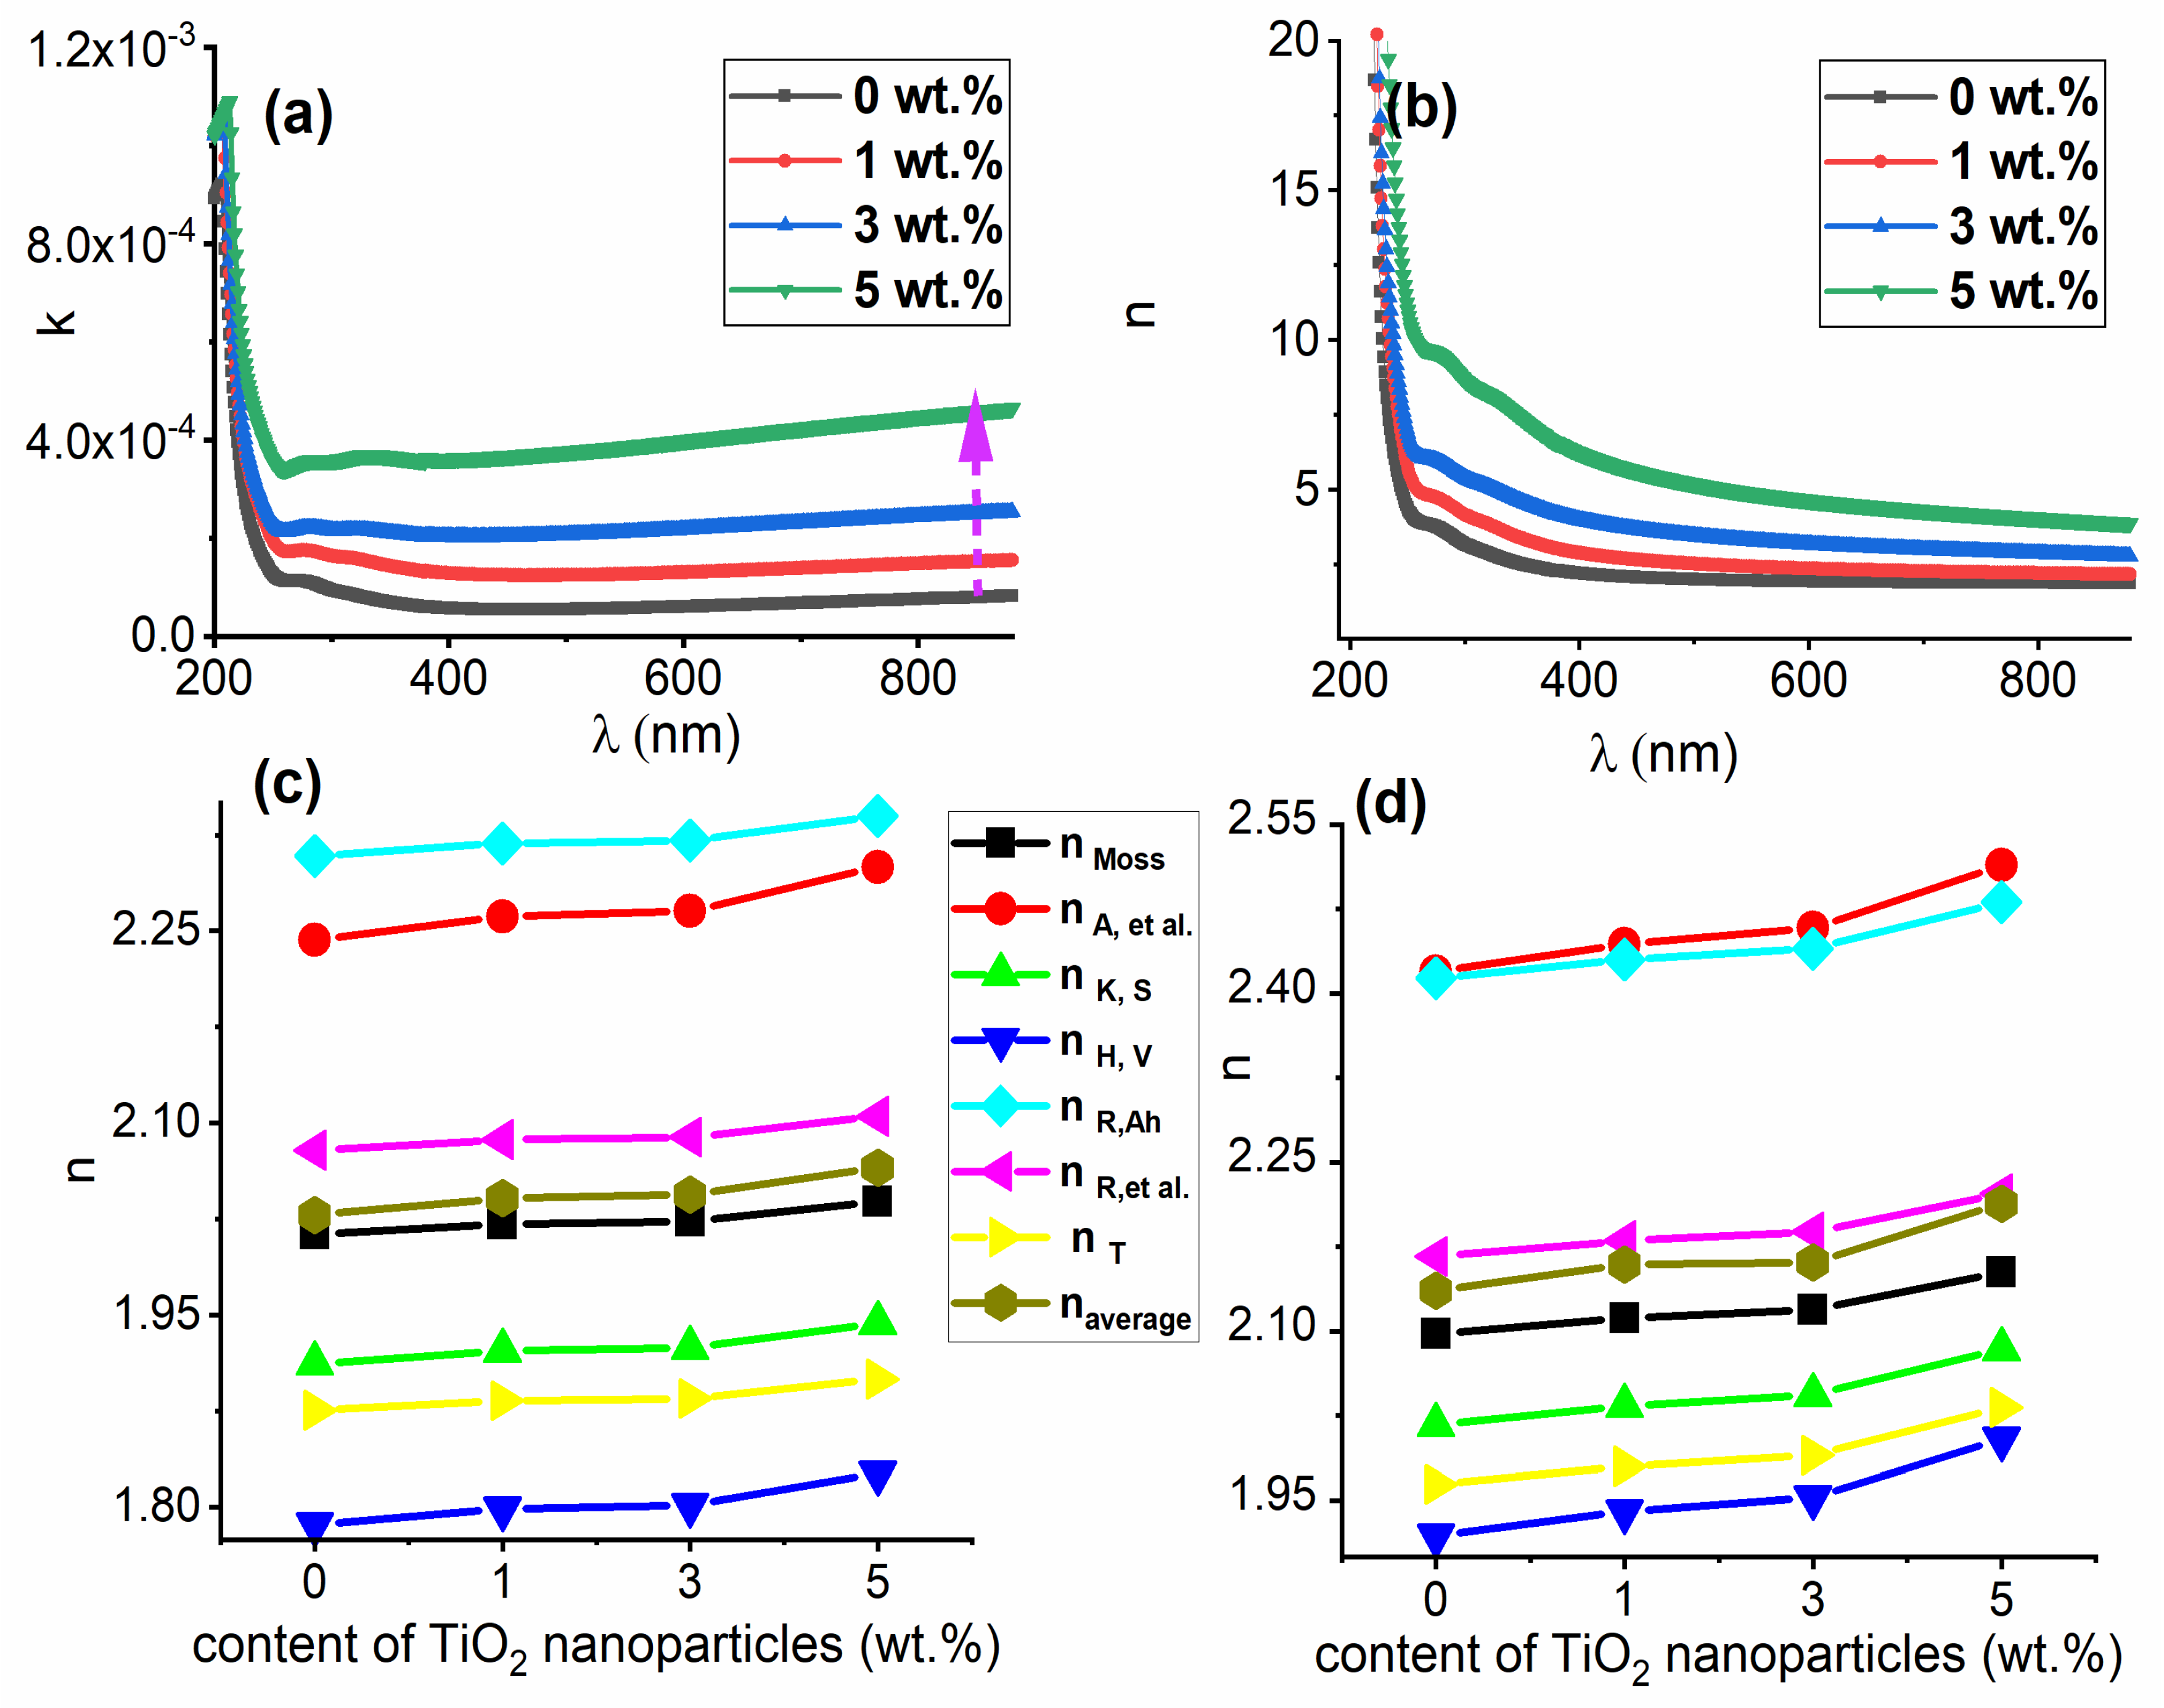
3.3.3. Refractive Index, Attenuation Coefficient, and Optical Dielectric Constants

In analyzing a material’s optical properties, the index of refraction, denoted by “n”, is one of the most important quantities. Due to its significant relationship with the local electric field and the electronic polarizability within the material, determining the refractive index of polymeric materials is one of their intriguing properties. It is also vital for assessing the materials’ suitability for application in various optoelectronic devices. The n value was calculated using Fresnel’s formula according to the following formula [72,73]:
n = 1 + R 1 R + 4 R ( 1 R ) 2 k 2
where R is the reflection ( R = 1 t r a n s m i s s i o n x exp a b s o r p t i o n [74]) and k is the extinction coefficient that relates the absorption coefficient (α), ( k = α λ 4 π [72]). The varying of k on the different nanocomposites is shown in Figure 8a, the values of k depend on the content of the nanoparticles doped in the host blend as the extinction coefficient increased by raising the TiO2 content. Because of the interaction between the incoming light and the polymeric medium, the extinction coefficient increases as the wavelength increases [75]. Figure 8b depicts a typical dispersion curve of n for PVA:SA 3:1 and its various nanocomposites based on decreasing the refractive index (n) with the wavelength. The refractive index values at 400 nm are 2.38, 2.99, 3.92, and 6.06, corresponding to 0, 1, 3, and 5 wt.%, respectively, of TiO2 NPs doped in the host blend. From previous work [60], the refractive index of 5 wt.%TiO2 NPs doped in PVA is 3.5, which is less than the refractive index of the corresponding concentration of TiO2 NPs extracted from aloe vera and doped in the PVA/SA blend (6.06). The formation of intermolecular bonds between the host blend and the embedded nanofiller is responsible for the observed enhancement in values of n with increasing the nanofiller concentration [76]. In addition, increasing the optical density of the prepared nanocomposites can also explain the enhancement of their refractive index by adding the TiO2 NPs. The enhancement in the refractive index value of the nanocomposites by increasing the nanofiller content enables the suggestion of using them in different optical devices as antireflection coating for solar cells [23].
In an effort to establish a universal correlation between the refractive index and optical bandgap, many different methods have been implemented. Therefore, it is crucial to establish a connection between (Eg) and (n) in order to comprehend the band structure of the nanocomposites under study. Understanding the relationship between Eg and n facilitates the determination of the additional optical characteristics. Within the scope of this study, several ways for establishing a correlation between Eg and n were achieved, including some models suggested by Moss ( n M ), Anani et al. ( n A , e t a l . ), Kumar-Singh ( n K , S ), Hervé-Vandamme ( n H , V ), Reddy-Ahammed ( n R , A h ), Ravindra, et al. ( n R , e t a l . ), and Tripathy ( n T ), and the average refractive index ( n a v e r a g e ) [77,78,79,80,81,82,83]:
n M 4 = C 1 E g 1 ; C 1 = 95   e V
n A , e t   a l . = C 2 + C 3 E g ; C 2 = 3.4   &   C 3 = 0.2   e V
n K , S = C 4 × E g C 5 ; C 4 = 3.3668   e V   &   C 5 = 0.32234
n H , V = 1 + C 6 E g + C 7 2 ; C 6 = 13.6   e V   &   C 7 = 3.4
n R , A h 4 = C 8 ( C 9 + E g ) 1 ; C 8 = 154   e V   &   C 9 = 0.365
n R   e t   a l . 4 = C 10 E g 1 ; C 10 = 108   e V
n T = 1 + C 11 × exp C 12 × E g × C 13 ; C 11 = 1.9017   e V   &   C 12 = 0.539   &   C 13 = 1.73
n a v e r a g e = [ n M + n A , e t   a l . + n K , S + n H , V + n R , A h + n R , e t a l . + n T ] ÷ 7
Figure 8c,d illustrates the calculated theoretical values of the linear refractive index (n) using E d i r e c t T a u c , and E i n d i r e c t T a u c , respectively, for the studied samples using these different models. The estimated values of n, for the studied nanocomposites, by the different models are close to each other, and they show their influence by increasing the addition of TiO2 NPs. The average refractive index ( n a v e r a g e ) has values of 2.029 and 2.065 when using E d i r e c t T a u c and 2.13 and 2.21 when using E i n d i r e c t T a u c , corresponding to 0 and 5 wt.% of TiO2 content, respectively.
Additionally, the complex dielectric parameter (ε*) is a summation of two parts, which are the real part (εr) and the imaginary part (εi) [75]. The imaginary part (εi) describes the dissipative rate of light during transmission through a material. However, the real part (εr) depends on electron mobility during light transformation in the medium. The following relationships provide the dependence of the two parties of complex dielectric functions on the refractive index (n) and the extinction coefficient (k) [84]:
ε r = n 2 k 2 ; ε i = 2 n k
The reliance of εr and εi on wavelength is clearly shown in Figure 9a,b, respectively, for all the investigated samples. By increasing the amount of TiO2 NPs, it can be seen that the values of εr and εi improved. The change in the values of εr by adding TiO2 NPs to the host blend can be argued to the incident photon-free electrons interactions in the material of the studied nanocomposites [85]. The change in the dipole motion of the polymeric blend can describe the change in the values of εi by the addition of TiO2 NPs to it [86].
Recent research has demonstrated that electronic transitions between occupied and unoccupied states can be primarily described by the imaginary part of the optical dielectric function, εi [87,88]. It was demonstrated by Yu et al. [89] that the fundamental absorption edge could be identified using the εi -photon energy plot since it was so similar to the value obtained using Tauc’s calculation. Plotting the change of εi with the photon energy E (eV), as shown in Figure 9c, revealed that all of the samples under investigation exhibited a nearly linear behavior at high energies. The values of Eg obtained from Figure 9c are tabulated in Table 3. Table 3 illustrates the close correspondence between the Eg values ( E d i r e c t T a u c and E d i r e c t A S F ) derived from Figure 6a,d and the values estimated from Figure 9c. Therefore, the direct allowed transition was prevalent in all examined samples, as demonstrated by three powerful methods, including Tauc’s formula, the ASF model, and the obtained fundamental absorption edge from the εi- E plot.

3.3.4. Volume and Surface Energy Loss Functions

The energy loss functions include the surface energy loss function (SELF) and volume energy loss function (VELF). VELF denotes the absence of rapid electron energy as they propagate through a material. On the other hand, the term SELF refers to the probability that fast electrons will suffer an energy loss as they go across the surface of a material. The values of SELF and VELF were determined using the real and imaginary parts of the complex dielectric as follows [90,91]:
V E L F = ε i ε r 2 + ε i 2 ;   S E L F = ε i ( ε r + 1 ) 2 + ε i 2
Figure 10a,b shows the changes in VELF and SELF with the incident wavelength for all the nanocomposites. The fast electrons lose more energy during their propagation within the examined materials than during their transit on their surfaces. This behavior can be understood from the higher values of VELF than that of SELF for the same nanocomposites investigated. The values of SELF and VELF were incident wavelength- and TiO2 content-dependent.

3.3.5. Linear STATIC Refractive Index (no), High-Frequency Dielectric Constant (ε), and Optical Electronegativity (ηopt)

Dimitrov and Sakka proposed a relationship that describes the linear static refractive index (no) for the prepared samples as follows using E d i r e c t T a u c [92]:
n o = ( 2 C 14 + 1 ) ( 1 C 14 ) 0.5 ; C 14 = E d i r e c t T a u c 20 0.5 + 1
Figure 11a shows the variation in the values of the linear static refractive index (no) with the content of TiO2 NPs. The deduced values of no are 1.89, 1.90, 1.91, and 1.93, corresponding to TiO2 NPs from the lowest (0 wt.%) to highest (5 wt.%) content. This incremental behavior of the refractive index can be due to increasing the interaction between the nanocomposites and the incident photons as a result of increasing the density of the nanofiller doped in the host blend. The following polynomial equation shows the best fitting for the relationship between no and TiO2 NP contents (wt.%) when R2 equals one:
Y = A 1 + B 1 X + B 2 X 2 + B 3 X 3
where X is the content of TiO2 NPs (wt.%), Y is no, A1 is 1.89, B1 is 0.018, B2 is −0.008, and B3 is 0.001.
The high-frequency dielectric constant (ε) was calculated from the following formula for all the investigated samples using the values of the linear static refractive index (no) [93]:
ε = n o 2
Increasing the TiO2 content in the host blend resulted in an improvement in the estimated values of ε∞, as observed in Figure 11b. The best fitting for the relationship between ε and TiO2 content is presented by a polynomial equation as follows:
Y = A 2 + B 4 X + B 5 X 2 + B 6 X 3
where X describes the content of TiO2 NPs (wt.%), Y gives ε, A2 is 3.57, B4 is 0.072, B5 is −0.032, and B6 is 0.004.
The ability of the positive radicals of the atoms of the examined material to attract the electrons to form ionic bonds is the definition of optical electronegativity (ηopt) as proposed by Duffy [94] according to the following relationship:
η o p t = C 15 n o 4
where C15 is a constant and has a value of 25.54 [95]. The variation of the optical electronegativity (ηopt) with the content of TiO2 NPs is shown in Figure 11c. The following polynomial equation provides the best match for the relationship between and TiO2 content:
Y = A 3 + B 7 X + B 8 X 2 + B 9 X 3
where Y provides ηopt and X represents the content of TiO2 NPs (wt.%) within the host blend, A3 is 1.92, B7 is −0.005, B8 is 0.002, and B9 is −0.0003. The highest value of ηopt was detected in the PVA/SA blend, which had a value of 1.92.

3.3.6. Nonlinear Optical Parameters

One of the materials’ most interesting and exciting characteristics is their nonlinearity, which broadens their potential uses in nonlinear devices. The first-ordered nonlinear susceptibility (χ(1)) and the third-ordered nonlinear susceptibility (χ(3)) were determined using Miller’s empirical rule [96]:
χ ( 1 ) = ( n o 2 1 ) 4 π
χ ( 3 ) = C 16 χ ( 1 ) 4 ; C 16 = 1.7 × 10 10   e . s . u .
The variation of χ(1) with the content of TiO2 (wt.%) is offered in Figure 11d for the differently prepared samples. The best fit for the correlation between χ(1) and the TiO2 NP concentration is given by the following polynomial equation:
Y = A 4 + B 10 X + B 11 X 2 + B 12 X 3
where Y denotes χ(1), and the content of TiO2 nanoparticles (wt.%) is given by X; A4 is 0.205, B10 is 0.005, B11 is −0.003, and B12 is −0.0004.
Figure 11e displays the dependence of χ(3) on the TiO2 content for all the examined samples. The following polynomial equation provides the best fit for the relationship between χ(3) and TiO2 content:
Y = A 5 + B 13 X + B 14 X 2 + B 15 X 3
where χ(3) describes Y and the content of TiO2 NPs (wt.%) is represented by X; A5 is 3.0 × 10⁻¹³, B13 is 3.5 × 10⁻¹⁴, B14 is −1.5 × 10⁻¹⁴, and B15 is 2.3 × 10⁻¹⁵.
The nonlinear refractive index (n2) was calculated from the following equation [97]:
n 2 = 12 π χ ( 3 ) n o
The dependence of the n2 of the different samples on the content of TiO2 is shown in Figure 11f. The best fit of the data in Figure 11f is described by the following polynomial equation:
Y = A 6 + B 16 X + B 17 X 2 + B 18 X 3
where X is the content of TiO2 NPs (wt.%), Y is n2, A6 is 6.0 × 10⁻¹², B16 is 6.3 × 10⁻¹³, B17 is −2.8 × 10⁻¹³, and B17 is 2.3 × 10⁻¹⁴.
The addition of TiO2 NPs to the host blend caused an improvement in the values of χ(1), χ(3), and n2.

3.4. Nonlinear Optical Analysis by Z-Scan Technique

3.4.1. Investigation of Nonlinear Optical Parameters

Recently, different approaches have been used to study the higher order of the nonlinear optical absorption coefficient. From these techniques, the Z-scan technique could be represented as one of the most promising, simplest, and most accurate techniques that could be used to investigate this issue with high precision. For this, the Z-scan technique was employed to study the nonlinear optical response of the prepared nanocomposites of PVA:SA:TiO2 by the ablation of the ns laser.
The Z-scan method’s open- and closed-aperture approaches (OA and CA) were used to assess the NLO-specific properties of the prepared samples. To calculate χ ( 2 ) , the OA approach method was utilized, whereas the closed-aperture approach method was used to calculate n2 and χ ( 3 ) . In the OA approach, the parameter of χ ( 2 ) is evaluated without the presence of an aperture in which the transmitted light is recorded in the far field upon travelling through the investigated materials as a function of the position from focusing on the Z-axis. Conversely, in the closed-aperture approach method, an aperture is sited past the samples. The studied samples were tuned across the laser-focused point, and the far-field profile revealed the intensity change along the beam profile as a function of the sample location through the Z-axis [98,99,100].
The prepared samples’ OA and CA Z-scan investigations are shown in Figure 12a,b. It became evident that the sample’s linear and nonlinear absorption processes under high stimulation were manifested. As shown in Figure 12a, the PVA:SA:TiO2 nanocomposite with various amounts of TiO2 NPs increased the transmittance intensity. This was due to the oxygen vacancies produced between CB and VB by laser irradiation, which resulted in the production of donor impurities with low formation energies. This was then followed by an electron transition between the bands responsible for producing the oxygen defects and CB. In other words, Figure 12b’s normalized transmittance of the prepared samples’ closed aperture had a peak-valley shape, which suggested that their NLO characteristics were self-defocusing. The nonlinear parameters of n2 and χ ( 3 ) could be estimated by these equations [101,102]:
χ ( 2 ) = 2 2 I ° L e f f T , L e f f = 1 e x p α L / α a n d I / I ° = e α L
n 2 = φ ° λ 2 π I ° L e f f ,   T p v = 0.406 1 s 0.25 φ °
where L e f f and L are the effective and real thickness of the studied sample, respectively, I and I ° are the measured laser influence following and prior to traveling the sample, respectively, φ ° is the phase shift of the laser beam at focusing, S is the used aperture linear transmittance, T p v is the difference between the peak and valley’s normalized laser transmittance, φ ° is the shift amplitude, and T is the difference transmittance intensity value between peak and baseline at the focusing. The use of the theoretical approximation formula for the transmission of OA and CA can be represented by Equation (37) and Equation (38), respectively [103,104,105]:
T z = m = 0 q o m m + 1 3 / 2 1 + Z 2 / Z ° 2 m ,   q o z = I o L e f f χ ( 2 ) , L e f f = 1 e x p α L / α ,   and   I / I ° = e α L
T z = 1 4 ( Z / Z 0 ) φ ° Z 2 Z ° 2 + 1 Z 2 Z ° 2 + 9 ,   φ ° = 2 π λ n 2 I o L e f f ,   φ ° = T p v 0.406 1 s 0.25 ,   S = 1 e x p 2 r a 2 / w a 2 ,   and   w a 2 = w 0 2 1 + Z / Z 0 2
where Z and Z 0 are the sample locations as a function of the focal point and the Rayleigh diffraction length ( k w 0 2 / 2 ), respectively; m is the number of the multi-photon process, which equals 1 for the two-photon absorption (TPA), and w 0 is the beam waist.
Additionally, Figure 12a shows the symbol data obtained from the OA Z-scan approach using Equation (35), whereas a solid line shows the experimental data that has been theoretically fitted using Equation (37). In the absence of an aperture, the normalized curves for the transmission intensity curve samples showed that the approximately symmetrical curves with a lower limit at z = 0 imply a positive value for χ ( 2 ) . The theoretical sample curves fitted to the experimental data were related to TPA, which may be a clue as to which TPA is in charge of this nonlinearity. Table 4 lists the developed nonlinear parameters of the following embedding of the host material of PVA:sodium alginate with TiO2 NPs. Furthermore, reverse saturation absorption (RSA) from TPA may be the cause of minima at the focus point in the OA technique. These results agreed with earlier work on semiconductor nonlinearity utilizing short and ultra-short laser processes, which showed that TPA was an appearance of excited state absorption. Additionally, the 2.33 eV produced by the 2nd harmonic generation of the Nd:YAG laser system (excitation wavelength: 532 nm) is less than the estimated direct Eg of the nanostructured material. As a result, it is possible to identify the TPA as the mechanism in charge of causing the nonlinearity process, which was required for the transition of the inter-band between VB and CB [106,107].
Figure 12b displays the symbol data obtained from the CA Z-scan methodology based on Equation (36), with a solid line representing the experimental data that has been theoretically fitted using Equation (38) for the Z-scan CA methodology. The aperture controlled the laser beam’s cross-sectional area. When an aperture was present, the normalized intensity sample showed a peak followed by a valley. Using the graphs from the CA Z-scan method, it is possible to calculate the interval between the peak and valley, T p v . Equation (36) was then used to compute the amount of n2. The n2 parameter could have a different sign depending on the intensity profile curve, reacting to the peak-to-valley or the reverse, respectively, in the transmission intensity curve of the Z-scan CA.
The relationship between the laser radiation and the examined sample was self-focused in the positive value of n2, whereas the relationship in the negative value was self-defocused. The NLR index is positive, demonstrating the presence of self-focusing optical nonlinearity in the material, and a peak appears following a valley. The peak-valley pattern also implies nonlinear optical refraction that is negative. Raising the amount of the TiO2 in the host materials consequently enhances the samples’ nonlinear optical properties, enabling them to change their amounts of n2, tabulated in Table 4, which showed that TiO2 NPs play a significant role in enhancing features of NLO properties of the host blend of PVA:SA due to increases in their charge transfer.
Additionally, n2 and β calculations were performed to compute the χ 3 of the prepared nanocomposite by these equations [108,109,110,111];
R e ( χ 3 ) ( e s u ) = 10 4 ε 0 c 2 n ° 2 π n 2 ( c m 2 W )
I m ( χ 3 ) ( e s u ) = 10 2 ε 0 c 2 n ° 2 λ 4 π 2 β ( c m W )
where n ° is the material linear index of refraction and ε o is the electric permittivity of free space (8.85 × 10⁻¹² F/m). From Table 4, it is clear that the values of χ ( 1 ) ,   χ ( 2 ) ,   n 2 ,   a n d   χ ( 3 ) increased as the amount of TiO2 NPs increased, which encouraged the host blend and TiO2 NPs to improve the NLO characteristics of the nanocomposite structure. The deduced values of χ(3) ranged from 4.31 × 10⁻¹² esu to 27.1 × 10⁻¹² esu using the Z-scan technique and 30.2 × 10⁻¹² esu to 37.4 × 10⁻¹² esu using UV-Vis spectrum, corresponding to the lowest (0 wt.%) and the highest (5 wt.%) contents of TiO2 NPs doped in the host blend, respectively. As a result, there is a remarkable agreement between the two approaches that were utilized to ascertain the values of χ(3).

3.4.2. Optical Limiting Effectiveness

With the aid of optical limiting flexible nanocomposite films, remarkable advancements have been made in the fabrication of optical and shielding for ocular laser sensors. To this end, prepared samples of nanocomposites of TiO2 NPs doped in the host blend of PVA:SA were examined for their utility in the optical limiting of CUT-OFF laser filters utilizing a continuous He–Ne laser working at 632.2 nm. In this study, the aperture Z-scan characteristics can be used to measure the prepared samples’ nonlinear influence power magnitudes in watts per area [112]. The synthesized nanocomposites’ output influence power and their normalized influence power are shown against the percentage of TiO2, as shown in Figure 13, where the normalized power was represented as the equivalent ratio between input influence power and output influence power. The prepared samples in this study had a negligible effect on the influence intensity. In order to achieve the limiting optical impact, the TiO2 filler concentration is essential. Absorption process interactions, such as increased sample density during differential absorption operations owing to light contact from the He–Ne laser with the produced samples, were linked to the increase in TiO2 content in the nanocomposite samples. This causes the optical restriction to be much less in the low-concentration TiO2 samples than in the higher-concentration ones. As the amount of TiO2 NPs in the host blend of PVA:SA increases by 0, 1, 3, 5 wt.%, respectively, the laser influence power of wavelength 632.8 nm is lowered by 15%, 22%, 34%, and 47%, respectively. As a result, our finding demonstrated that TiO2 NPs doped in the host blend of PVA:SA has a positive influence on laser light blocking for the investigated laser source.

4. Conclusions

The method of solution casting was used to synthesize PVA:SA:TiO2 nanocomposites with different contents of the doped nanofiller. Some voids appeared in SEM images of the nanocomposites, which raised by increasing the added amount of TiO2 NPs to the host blend. Peaks of very small intensities corresponding to Mg, P, K, Ca, Zn, and Cr were detected in PVA:SA:TiO2 nanocomposites, which are assigned to the plant bio-molecules present in the aloe vera leaves extract from which TiO2 NPs were prepared. XRD spectra illustrated that the average particle size (D) has values of 24.32 nm, 27.17 nm, and 10.42 nm, corresponding to the TiO2 NP contents of 1, 3, and 5 wt.%, respectively, doped in the host blend. The values of solar material protection factor (SMPF) are 21%, 41.8%, 58.3%, and 76.4%, corresponding to the content of TiO2 NPs from 0 to 5 wt.%. More energy is lost by the fast electrons during their propagation within the examined materials than during their transit on their surfaces. This behavior can be understood from the higher values of VELF than SELF for the investigated nanocomposites. The detected values of no, ε, ηoptical, χ(1), χ(3), and n2, for the studied nanocomposites proved to be TiO2 NP content-dependent. UV-vis spectroscopy and Z-scan analysis were effectively used to determine the nonlinear optical parameters. The studied samples were examined for their utility in the optical limiting of CUT-OFF laser filters utilizing a continuous He–Ne laser working at 632.2 nm. As the amount of TiO2 NPs in the host blend of PVA:SA increases by 0, 1, 3, and 5 wt.%, the laser influence power of wavelength 632.8 nm is lowered by 15%, 22%, 34%, and 47%, respectively. The direct allowed transition was prevalent in all examined samples, as demonstrated by three powerful methods, including Tauc’s formula, the ASF model, and the obtained fundamental absorption edge from the εi-E plot.

Author Contributions

Conceptualization, R.K.; methodology, R.K., N.A.K. and M.A.I.; software, G.M.A.-S., N.A.K. and M.A.I.; validation, N.A.K. and M.A.I.; formal analysis, N.A.K. and M.A.I.; investigation, R.K., G.M.A.-S., N.A.K., M.A.I. and A.M.M.; writing—original draft preparation, R.K., N.A.K., M.A.I., and A.M.M.; data curation, G.M.A.-S. and A.M.M.; writing—review and editing, R.K., G.M.A.-S., N.A.K., M.A.I. and A.M.M.; visualization, G.M.A.-S.; supervision, R.K.; project administration, R.K. and A.M.M.; funding acquisition, G.M.A.-S. All authors have read and agreed to the published version of the manuscript.

Funding

This research was funded by the Princess Nourah bint Abdulrahman University Researchers Supporting Project Number (PNURSP2023R67), Princess Nourah bint Abdulrahman University, Riyadh, Saudi Arabia.

Institutional Review Board Statement

Not applicable.

Informed Consent Statement

Not applicable.

Data Availability Statement

Not applicable.

Acknowledgments

The authors would like to extend their sincere appreciation to Princess Nourah bint Abdulrahman University Researchers Supporting Project Number (PNURSP2023R67), Princess Nourah bint Abdulrahman University, Riyadh, Saudi Arabia. Also, the authors are grateful to the Physics Department, Faculty of Science, Zagazig University, Egypt.

Conflicts of Interest

The authors declare that they have no known competing financial interests or personal relationships that could have appeared to influence the work reported in this paper.

References

  1. Ali, S.A.; Hassan, Q.M.A.; Emshary, C.A.; Sultan, H.A. Characterizing optical and morphological properties of Eriochrome Black T doped polyvinyl alcohol film. Phys. Scr. 2020, 95, 095814. [Google Scholar] [CrossRef]
  2. Hassan, Q.M.A.; Sultan, H.A.; Al-Asad, A.S.; Kadhim, A.J.; Hussein, N.A.; Emshary, C.A. Synthesis, characterization, and study of the nonlinear optical properties of two new organic compounds. Synth. Met. 2019, 257, 116158. [Google Scholar] [CrossRef]
  3. Al-Asadi, A.S.; Hassan, Q.M.A.; Abdulkader, A.F.; Mohammed, M.H.; Bakr, H.; Emshary, C.A. Formation of graphene nanosheets/epoxy resin composite and study its structural. morphological and nonlinear optical properties. Opt. Mater. 2019, 89, 460–467. [Google Scholar] [CrossRef]
  4. Darwish, W.M.; Darwish, A.M.; Al-Ashkar, E.A. Indium(III) phthalocyanine eka-conjugated polymer as high-performance optical limiter upon nanosecond laser irradiation. High Perform. Polym. 2016, 28, 651–659. [Google Scholar] [CrossRef]
  5. Ahmed, S.A.; Hassan, Q.M.A.; Abdulkader, A.F.; Bakr, H.; Emshary, C.A. Enhancement of the linear. nonlinear and optical limiting properties of epoxy resin decorated by zinc oxide nanoparticles. Phys. Scr. 2020, 95, 085503. [Google Scholar]
  6. Kaniyarakkal, S.; Thomas, T.; Sadagopalan, S.K.; Jayamohan, L.; Muralimanohar, R.; Vasanthakumaryamma, L. Nair vs. Synthesis. Linear and Nonlinear Optical Properties of Ag/Al2O3 Nanocomposites. Materials 2022, 15, 6322. [Google Scholar] [CrossRef] [PubMed]
  7. El-Metwally, E.G.; Mohammed, M.I.; Ismail, A.M. Promising naphthol green B dye doped (PVOH-PEG) composite films as a multifunctional material with engineered optical band gap. tunable dielectric properties and nonlinear J–E characteristics. Phys. Scr. 2022, 97, 065804. [Google Scholar] [CrossRef]
  8. Sharifi, S.; Nezhad, M.K.; Sangsefedi, S.A.; Rakhshanizadeh, F. Effect of charge and dielectric constant on linear and nonlinear optical properties of two dyes. J. Electron. Mater. 2019, 48, 4310–4323. [Google Scholar] [CrossRef]
  9. Abutalib, M.M.; Yahia, I.S. Selective CUT-OFF laser filters using brilliant green-doped PMMA polymeric composite films: Sensing approach. J. Mater. Sci. Mater. Electron. 2018, 29, 19798–19804. [Google Scholar] [CrossRef]
  10. Haripadmam, P.C.; Thanuja, T.H.; Varsha, G.S.; Beryl, C.D.; Alexander, A. Nonlinear optical absorption in PVA films doped by the novel natural dye extract from C. redflash leaves. Opt. Mater. 2021, 112, 110804. [Google Scholar] [CrossRef]
  11. Ali, F.M.; Kershi, R.M. Synthesis and characterization of La3+ ions incorporated (PVA/PVP) polymer composite films for optoelectronics devices. J. Mater. Sci. Mater. Electron. 2020, 31, 2557e66. [Google Scholar] [CrossRef]
  12. Wouters, M.; Rentrop, C.; Willemsen, P. Surface structuring and coating performance: Novel biocidefree nanocomposite coatings with anti-fouling and fouling-release properties. Prog. Org. Coat. 2010, 68, 4–11. [Google Scholar] [CrossRef]
  13. Shetty, B.G.; Vincent, C.; Rithin Kumar, N.B.; Rajesh, K.; Bairy, R.; Patil, P.S. Promising PVA/TiO2, CuO filled nanocomposites for electrical and third order nonlinear optical applications. Opt. Mater. 2019, 95, 109218. [Google Scholar] [CrossRef]
  14. D’Silva, E.D.; Ismayil, A.G.; Rao, S.V. Dopant induced modifications in the microstructure and nonlinear optical properties of 4N4MSP chalcone doped PVA films. Opt. Mater. 2020, 101, 109708. [Google Scholar] [CrossRef]
  15. Emshary, C.A.; Ali, I.M.; Hassan, Q.M.A.; Sultan, H.A. Linear and nonlinear optical properties of potassium dichromate in solution and solid polymer film. Phys. B Condens. Matter 2021, 613, 413014. [Google Scholar] [CrossRef]
  16. Kulac, M.; Aktas, C.; Tulubas, F.; Uygur, R.; Kanter, M.; Erboga, M.; Ceber, M.; Topcu, B.; Ozen, O.A. The effects of topical treatment with curcumin on burn wound healing in rats. J. Mol. Histol. 2013, 44, 83–90. [Google Scholar] [CrossRef]
  17. Alshehari, A.M.; Salim, E.; Oraby, A.H. Structural, optical, morphological and mechanical studies of polyethylene oxide/sodium alginate blend containing multi-walled carbon nanotubes. J. Mater. Res. Technol. 2021, 15, 5615–5622. [Google Scholar] [CrossRef]
  18. Omar, A.; Badry, R.; Hegazy, M.A.; Yahia, I.S.; Elhaes, H.; Zahran, H.Y.; Ibrahim, M.A.; Refaat, A. Enhancing the optical properties of chitosan, carboxymethyl cellulose, sodium alginate modified with nano metal oxide, and graphene oxide. Opt. Quantum Electron. 2022, 54, 806. [Google Scholar] [CrossRef]
  19. Kausar, A.; Ahmad, I.; Maaza, M.; Eisa, M.H.; Bocchetta, P. Polymer/Fullerene Nanocomposite for Optoelectronics—Moving toward Green Technology. J. Compos. Sci. 2022, 6, 393. [Google Scholar] [CrossRef]
  20. Kausar, A. Polymer/Nanocarbon Nanocomposite-Based Eco-friendly Textiles. In Handbook of Nanomaterials and Nanocomposites for Energy and Environmental Applications; Springer: Berlin/Heidelberg, Germany, 2021; pp. 2917–2939. [Google Scholar]
  21. Chandran, S.P.; Chaudhary, M.; Pasricha, R.; Ahmad, A.; Sastry, M. Synthesis of gold nanotriangles and silver nanoparticles using Aloe Vera plant extract. Biotechnol. Prog. 2006, 22, 577–583. [Google Scholar] [CrossRef]
  22. Tippayawat, P.; Phromviyo, N.; Boueroy, P.; Chompoosor, A. Green synthesis of silver nanoparticles in Aloe Vera plant extract prepared by a hydrothermal method and their synergistic antibacterial activity. PeerJ 2016, 4, e25892016. [Google Scholar] [CrossRef] [PubMed] [Green Version]
  23. Hanafy, M.S.; Abdel Fadeel, D.A.; Elywa, M.A.; Kelany, N.A. Green Synthesis and Characterization of TiO2 Nanoparticles Using Aloe Vera Extract at Different pH Value. Faisal Univ. (Basic Appl. Sci.) 2020, 21, 103–110. [Google Scholar] [CrossRef] [Green Version]
  24. Yang, M.; Li, L.; Yu, S.; Liu, J.; Shi, J. High performance of alginate/polyvinyl alcohol composite fifilm based on natural original melanin nanoparticles used as food thermal insulating and UV–vis block. Carbohydr. Polym. 2020, 233, 115884. [Google Scholar] [CrossRef]
  25. Ali, I.; Peng, C.; Lin, D.; Saroj, D.P.; Naz, I.; Khan, Z.M.; Sultan, M.; Ali, M. Encapsulated Green Magnetic Nanoparticles for the Removal of Toxic Pb2+ and Cd2+ from Water: Development. Characterization and Application. J. Environ. Manag. 2019, 234, 273–289. [Google Scholar] [CrossRef]
  26. Rajendran, A.; Narayanan, V.; Gnanavel, I. Study on the Analysis of Trace Elements in Aloe vera and Its Biological Importance. J. Appl. Sci. Res. 2007, 3, 1476–1478. [Google Scholar]
  27. Nasar, G.; Khan, M.S.; Khalil, U. Structural Study of PVA Composites with Inorganic Salts by X-ray Diffraction. J. Pak. Mater. Soc. 2009, 3, 67–70. [Google Scholar]
  28. Assendert, H.E.; Windle, A.H. Crystallinity in Poly (vinyl alcohol). 1. An X-Ray Diffraction Study of Atactic PVOH. Polymer 1998, 39, 4295–4302. [Google Scholar] [CrossRef]
  29. Aprilliza, M. Characterization and Properties of Sodium Alginate from Brown Algae Used as an Ecofriendly Superabsorbent. In Proceedings of the IOP Conference Series: Materials Science and Engineering, Birmingham, UK, 13–15 October 2017; Volume 188, p. 012019. [Google Scholar]
  30. Kumar, H.; Kumar, M.; Barman, P.B.; Singh, R.R. Stable and luminescent wurtzite CdS, ZnS and CdS/ZnS core/shell quantum dots. Appl. Phys. A 2014, 117, 1249–1258. [Google Scholar] [CrossRef]
  31. Ali, I.M.; Al-Haddad, R.M.; Al-Rasoul, K.T. Structural and Optical Properties of Synthesized Manganese doped ZnS Quantum Dots, International innovative science. Eng. Technol. 2014, 1, 104–114. [Google Scholar]
  32. Ahmed, R.M.; Abd Elbary, A.M. Structural and Thermal Analysis of Carbon Nano-Particles/Polypyrrole/Poly (Ethylene–Co–Vinyl Acetate) Composites. Arab. J. Nucl. Sci. Appl. 2018, 51, 51–61. [Google Scholar] [CrossRef] [Green Version]
  33. John, R.; Florence, S. Optical structural and morphological studies of bean-like ZnS nanostructures by aqueous chemical method. Chalcogenide Lett. 2010, 7, 269–273. [Google Scholar]
  34. Stokes, A.R.; Wilson, A.J.C. The Diffraction of X Rays by Distorted Crystal Aggregates-I. Proc. Phys. Soc. 1944, 56, 174. [Google Scholar] [CrossRef]
  35. Soltani, N.; Dehzangi, A.; Kharazmi, A.; Saion, E.; Yunus, W.M.M.; Majlis, B.Y.; Zare, M.R.; Gharibshahi, E.; Khalilzadeh, N. Structural, Optical and Electrical Properties of Zns Nanoparticles Affecting By Organic Coating. Chalcogenide Lett. 2014, 11, 79–90. [Google Scholar]
  36. Rathod, S.G.; Bhajantri, R.F.; Ravindrachary, V.; Sheela, T.; Pujari, P.K.; Naik, J.; Poojary, B. Pressure sensitive dielectric properties of TiO2 doped, PVA/CN-Li nanocomposite. J. Polym. Res. 2015, 22, 6. [Google Scholar] [CrossRef]
  37. Purushothan, E.; Krishna, N.G. X-ray determination of crystallite sizeand effect of lattice strain on the Debye–Waller factors of Ni nano powdersusing high energy Ball Mill. Chem. Mater. Res. 2015, 7, 1–6. [Google Scholar]
  38. Bhargava, R.N. Doped nanocrystalline materials—Physics and applications. Luminescence 1996, 70, 85–94. [Google Scholar] [CrossRef]
  39. Hussein, L.I.; Abdaleem, A.H.; Darwish, M.S.A.; Mostafa, M.H.; Elsawy, M.A. Chitosan/TiO2 nanocomposites: Effect of microwave heating andsolution mixing techniques on physical properties. Egypt. J. Chem. 2020, 63, 449–460. [Google Scholar] [CrossRef]
  40. Rathod, P.B.; Waghuley, S.A. Synthesis and UV-Vis spectroscopic study of TiO2 nanoparticles. Int. J. Nanomanuf. 2015, 11, 185–193. [Google Scholar] [CrossRef]
  41. Bekele, E.T.; Gonfa, B.A.; Sabir, F.K. Use of Different Natural Products to Control Growth of Titanium Oxide Nanoparticles in Green Solvent Emulsion. Characterization, and Their Photocatalytic Application. Bioinorg. Chem. Appl. 2021, 2021, 6626313. [Google Scholar]
  42. Khadar, A.; Behara, D.K.; Kumar, M.K. Synthesis and characterization of controlled size TiO2 nanoparticles via green route using Aloe Vera extract. Int. J. Sci. Res. 2016, 5, 1913–1916. [Google Scholar]
  43. Abdelghany, A.M.; Ayaad, D.A.; Mahmoud, S.M. Antibacterial and Energy Gap Correlation of PVA/SA Biofilms Doped with Selenium Nanoparticles. Biointerface Interface Res. Appl. Chem. 2020, 10, 6236–6244. [Google Scholar]
  44. Ahmed, R.M.; Taha, T.A.; Ezz-Eldin, F.M. Investigation of Sm2O3 effect on opto-electrical parameters and dielectric properties of some fluorophosphate glasses. J. Mater. Sci. Mater. Electron. 2021, 32, 28919–28934. [Google Scholar] [CrossRef]
  45. Ahmed, R.M. Study on Different Solution-Cast Films of PMMA and PVAc. Int. J. Polym. Mater. 2008, 57, 969–978. [Google Scholar] [CrossRef]
  46. El-Rabaie, S.; Taha, T.A.; Higazy, A.A. Novel PbSe nanocrystals doped fluorogermanate glass matrix. Mater. Sci. Semicond. Process. 2015, 34, 88. [Google Scholar] [CrossRef]
  47. Tauc, J. Amorphous and Liquid Semiconductors; Plenum Press: New York, NY, USA, 1974. [Google Scholar]
  48. Davis, E.A.; Mott, N.F. Conduction in non-crystalline systems V. Conductivity, optical absorption and photoconductivity in amorphous semiconductors. Philos. Mag. 1970, 22, 903–922. [Google Scholar]
  49. Souri, D.; Shomalian, K. Bandgap determination by absorption spectrum fitting method (ASF) and structural properties of different compositions of (60-x)V2O5-40TeO2−xSb2O3 glasses. J. Non-Cryst. Solids 2009, 355, 1597–1601. [Google Scholar] [CrossRef]
  50. Escobar-Alarc’on, L.; Arrieta, A.; Camps, E.; Muhl, S.; Rodil, S.; Vigueras-Santiago, E. An alternative procedure for the determination of the optical band gap and thickness of amorphous carbon nitride thin films. Appl. Surf. Sci. 2007, 254, 412–415. [Google Scholar] [CrossRef]
  51. Mott, N.F.; Davis, E.A. Electronic Process in Non-Crystalline Materials, 2nd ed.; Clarendon Press: Oxford, UK, 1979. [Google Scholar]
  52. Alhusiki-Alghamdi, H.M.; Alghunaim, N.S. Synthesis and Characterization of Polyethylene Oxide Incorporated with Cadmium Sulphide Nanoparticles. J. Adv. Mater. Phys. Chem. 2015, 5, 53–59. [Google Scholar] [CrossRef] [Green Version]
  53. Tauc, J.; Menth, A. States in the gap. J. Non-Cryst. Solids 1972, 8–10, 569–585. [Google Scholar] [CrossRef]
  54. Souri, D.; Mohammadi, M.; Zaliani, H. Effect of antimony on the optical and physical properties of Sb-V2O5-TeO2 glasses. Electron. Mater. Lett. 2014, 10, 1103–1108. [Google Scholar] [CrossRef]
  55. Fanchini, G.; Tagliaferro, A. Disorder and Urbach energy in hydrogenated amorphous carbon: A phenomenological model. Appl. Phys. Lett. 2004, 85, 730. [Google Scholar] [CrossRef]
  56. Ahmed, R.M. Surface and Spectroscopic Properties of CdSe/ZnS/PVC Nanocomposites, polymer composites. Polym. Compos. 2017, 38, 749–758. [Google Scholar] [CrossRef]
  57. Ahmed, R.M.; Atta, M.M.; Taha, E.O. Optical spectroscopy. thermal analysis, and dynamic mechanical properties of graphene nano-platelets reinforced polyvinylchloride. J. Mater. Sci. Mater. Electron. 2021, 32, 22699–22717. [Google Scholar] [CrossRef]
  58. O’Leary, S.K.; Zukotynski, S.; Perz, J.M. Disorder and optical absorption in amorphous silicon and amorphous germanium. J. Non-Cryst. Solids 1997, 210, 249–253. [Google Scholar] [CrossRef]
  59. Ahmed, R.M.; Ibrahiem, A.A.; El-Said, E.A. Enhancing the Optical Properties of Polyvinyl Alcohol by Blending It with Polyethylene Glycol. Acta Phys. Pol. A 2020, 137, 317–323. [Google Scholar] [CrossRef]
  60. Shehap, A.M.; Akil, D.S. Structural and optical properties of TiO2 nanoparticles/PVA for different composites thin films. Int. J. Nanoelectron. Mater. 2016, 9, 17–36. [Google Scholar]
  61. Chkirida, S.; Zari, N.; Achour, R.; Qaiss, A.E. Bouhfid R Effect of iron doped titanium oxide encapsulated in alginate on photocatalytic activity for the removal of dye pollutants. RSC Adv. 2020, 10, 22311. [Google Scholar] [CrossRef]
  62. Skettrup, T. Urbach’s rule derived from thermal fluctuations in the band-gap energy. Phys. Rev. B 1978, 18, 2622. [Google Scholar] [CrossRef] [Green Version]
  63. Urbach, F. The long-wavelength edge of photographic sensitivity and of the electronic absorption of solids. Phys. Rev. 1953, 92, 1324. [Google Scholar] [CrossRef]
  64. Karimi, M.; Rabiee, M.; Moztarzadeh, F.; Tahriri, M. Bodaghi M Retraction notice to Controlled synthesis, characterization and optical properties of CdS nanocrystalline thin films via chemical bath deposition (CBD) route. Curr. Appl. Phys. 2009, 9, 1263–1268. [Google Scholar] [CrossRef]
  65. Raja, V.; Sarma, A.K.; Rao, V.N. Optical properties of pure and dopedPMMA-CO-P4VPNO polymer films. Mater. Lett. 2003, 57, 4678–4683. [Google Scholar] [CrossRef]
  66. Al-Bataineh, Q.M.; Alsaad, A.M.; Ahmad, A.A.; Telfah, A. A novel optical model of the experimental transmission spectra of nanocomposite PVC-PS hybrid thin films doped with silica nanoparticles. Heliyon 2020, 6, e041772020. [Google Scholar] [CrossRef] [PubMed]
  67. Rothwarf, A.; Meakin, J.D.; Bamett, A. Polycrystalline and Amorphous Thin Films and Devices; Academic Press: New York, NY, USA, 1980. [Google Scholar]
  68. Jelle, B.P.; Gustavsen, A.; Nilsen, T.N.; Jacobsen, T. Solar material protection factor (SMPF) and solar skin protection factor (SSPF) for window panes and other glass structures in buildings. Sol. Energy Mater. Sol. Cells 2007, 91, 342–354. [Google Scholar] [CrossRef]
  69. ISO/FDIS 9050, 2003(E); Glass in Building—Determination of Light Transmittance, Solar Direct Transmittance, Total Solar Energy Transmittance, Ultraviolet Transmittance and Related Glazing Factors. ISO: Geneva, Switzerland, 2003.
  70. ISO 9845–1, 1992(E); Solar Energy—Reference Solar Spectral Irradiance at the Ground at Different Receiving Conditions—Part 1: Direct Normal and Hemispherical Solar Irradiance for Air Mass 1,5. ISO: Geneva, Switzerland, 1992.
  71. McKinlay, A.F.; Diffey, B.L. A Reference Action Spectrum for Ultraviolet Induced Erythema in Human Skin. CIE J. 1987, 6, 17–22. [Google Scholar]
  72. Ahmed, R.M. Optical Study on Poly (methyl methacrylate)/Poly (vinyl acetate) Blends. Int. J. Photoenergy 2009, 2009, 150389. [Google Scholar] [CrossRef]
  73. Abdullah, O.G.; Aziz, S.B.; Rasheed, M.A. Structural and optical characterization of PVA:KMnO4 based solid polymer electrolyte. Results Phys. 2016, 6, 1103–1108. [Google Scholar] [CrossRef] [Green Version]
  74. Aziz, S.B.; Hassan, A.Q.; Mohammed, S.J.; Karim, W.O.; Kadir, M.F.Z.; Tajuddin, H.A.; Chan, N.N.M.Y. Structural and Optical Characteristics of PVA:C-Dot, Composites: Tuning the Absorption of Ultra Violet (UV) Region. Nanomaterials 2019, 9, 216. [Google Scholar] [CrossRef] [Green Version]
  75. Ahmed, R.M.; Ibrahiem, A.A.; El-Said, E.A. Effect of Cobalt Chloride as Filler and PVP on the Optical Properties of, P.V.A/PEG/PVP Blends. Opt. Spectrosc. 2020, 128, 642–655. [Google Scholar] [CrossRef]
  76. El Sayed, A.M.; El-Sayed, S.; Morsi, W.M.; Mahrous, S.; Hassen, A. Synthesis, Characterization, Optical, and Dielectric Properties of Polyvinyl Chloride/Cadmium Oxide Nanocomposite Films. Polym. Compos. 2014, 35, 1842–1851. [Google Scholar] [CrossRef]
  77. Moss, T.S. Relations between the refractive index and energy gap of semiconductors. Phys. Status Solidi (b) 1985, 13, 415–427. [Google Scholar] [CrossRef]
  78. Anani, M.; Mathieu, C.; Lebid, S.; Amar, Y.; Chama, Z.; Abid, H. Model for calculating the refractive index of a III–V semiconductor. Comput. Mater. Sci. 2008, 41, 570–575. [Google Scholar] [CrossRef]
  79. Kumar, V.; Singh, J. Model for calculating the refractive index of different materials. Indian J. Pure Appl. Phys. 2010, 48, 571–574. [Google Scholar]
  80. Herve, P.; Vandamme, L.K.J. General Relation Between Refractive Index and Energy Gap in Semiconductors. Infrared Phys. Technol. 1994, 35, 609. [Google Scholar] [CrossRef]
  81. Reddy, R.R.; Ahammed, N.Y. A study on the Moss relation. Infrared Phys. Technol. 1995, 36, 825–830. [Google Scholar] [CrossRef]
  82. Ravindra, N.M.; Auluck, S.; Srivastva, V.K. On the Penn Gap in Semiconductors. Phys. Status Solidi (b) 1979, 93, K1551979. [Google Scholar] [CrossRef]
  83. Tripathy, S.K. Refractive indices of semiconductors from energy gaps. Opt. Mater. 2015, 46, 240–246. [Google Scholar] [CrossRef] [Green Version]
  84. Abdullah, O.; Saber, D.R.; Taha, S.A. The Optical Characterization of Polyvinyl Alcohol: Cobalt Nitrate Solid Polymer Electrolyte Films. Adv. Mater. Lett. 2015, 6, 153. [Google Scholar] [CrossRef]
  85. Wise, D.L. Electrical and Optical Polymer Systems: Fundamentals: Methods, and Applications; CRC Press: Boca Raton, FL, USA, 1998. [Google Scholar]
  86. Suma, G.R.; Subramani, N.K.; Shilpa, K.N.; Sachhidananda, S.; Satyanarayana, S.V. Effect of Ce0.5Zr0.5O2 nano fillers on structural and optical behaviors of poly (vinyl alcohol). J. Mater. Sci. Mater. Electron. 2017, 28, 10707. [Google Scholar] [CrossRef]
  87. Aziz, S.B.; Abdullah, O.G.; Hussein, A.M.; Abdulwahid, R.T.; Rasheed, M.A.; Ahmed, H.M.; Abdalqadir, S.W.; Mohammed, A.R. Optical properties of pure and doped PVA: PEO based solid polymer blend electrolytes: Two methods for band gap study. J. Mater. Sci. Mater. Electron. 2017, 28, 7473–7479. [Google Scholar] [CrossRef]
  88. Aziz, S.B.; Abdullah, O.G.; Rasheed, M.A. A Novel polymer composite with a small optical bandgap: New approaches for photonics and optoelectronics. J. Appl. Polym. Sci. 2017, 134, 44847. [Google Scholar] [CrossRef]
  89. Yu, L.; Li, D.; Zhao, S.; Li, G.; Yang, K. First Principles Study on Electronic Structure and Optical Properties of Ternary Ga As: Bi Alloy. Materials 2012, 5, 2486. [Google Scholar] [CrossRef] [Green Version]
  90. Abdel-Salam, A.I.; Khalid, A.; Awad, M.M.; Hussein, Y.; Ahmed, R.M. Investigating the impact of growth time of CdSe quantum dots on the structure and optical properties of its nanocomposites with SiO2 for improvement of optical devices. J. Alloys Compd. 2022, 925, 166729. [Google Scholar] [CrossRef]
  91. Sarkar, S.; Das, N.; Chattopadhyay, K. Optical constants. dispersion energy parameters and dielectric properties of ultra-smooth nanocrystalline BiVO4 thin films prepared by rf-magnetron sputtering. Solid. State Sci. 2014, 33, 58–66. [Google Scholar] [CrossRef]
  92. Dimitrov, V.; Sakka, S. Linear and nonlinear optical properties of simple oxides. II. J. Appl. Phys. 1996, 79, 1741–1745. [Google Scholar] [CrossRef] [Green Version]
  93. Das, S.; Senapati, S.; Alagarasan, D.; Varadharajaperumal, S.; Ganesan, R.; Naik, R. Enhancement of nonlinear optical parameters upon phase transition in new quaternary Ge20Ag10Te10Se60 films by annealing at various temperatures for optoelectronic applications. J. Alloys Compd. 2022, 927, 167000. [Google Scholar] [CrossRef]
  94. Duffy, J.A. Trends in energy gaps of binary compounds: An approach based upon electron transfer parameters from optical spectroscopy. J. Phys. C Solid. State Phys. 1980, 13, 2979. [Google Scholar] [CrossRef]
  95. Reddy, R.R.; Gopal, K.R.; Narasimhulu, K.; Reddy, L.S.S.; Kumar, K.R.; Reddy, C.V.K.; Ahmed, S.N. Correlation between optical electronegativity and refractive index of ternary chalcopyrites, semiconductors, insulators, oxides and alkali halides. Opt. Mater. 2008, 31, 209–212. [Google Scholar] [CrossRef]
  96. Yadav, P.; Sharma, A. Investigation of optical nonlinearities in Bi-doped Se-Te chalcogenide thin films. J. Electron. Mater. 2015, 44, 916–921. [Google Scholar] [CrossRef]
  97. Ticha, H.; Tichy, L. Semiempirical relation between nonlinear susceptibility (refractive index), linear refractive index and optical gap and its application to amorphous chalcogenides. J. Optoelectron. Adv. Mater. 2002, 4, 381–386. [Google Scholar]
  98. Mostafa, A.M.; Mwafy, E.A.; Awwad, N.S.; Ibrahium, H.A. Linear and nonlinear optical studies of Ag/Zn/ZnO nanocomposite thin film prepared by pulsed laser deposition technique. Radiat. Phys. Chem. 2021, 179, 109233. [Google Scholar] [CrossRef]
  99. Mostafa, A.M.; Mwafy, E.A.; Awwad, N.S.; Ibrahium, H.A. Au@Ag core/shell nanoparticles prepared by laser-assisted method for optical limiting applications. J. Mater. Sci. Mater. Electron. 2021, 32, 14728–14739. [Google Scholar] [CrossRef]
  100. Mostafa, A.M. The enhancement of nonlinear absorption of Zn/ZnO thin film by creation oxygen vacancies via infrared laser irradiation and coating with Ag thin film via pulsed laser deposition. J. Mol. Struct. 2021, 1226, 129407. [Google Scholar] [CrossRef]
  101. Mostafa, A.M. Preparation and study of nonlinear response of embedding ZnO nanoparticles in PVA thin film by pulsed laser ablation. J. Mol. Struct. 2021, 1223, 129007. [Google Scholar] [CrossRef]
  102. Stenzel, O.; Wilbrandt, S.; Mühlig, C.; Schröder, S. Linear and Nonlinear Absorption of Titanium Dioxide Films Produced by Plasma Ion-Assisted Electron Beam Evaporation: Modeling and Experiments. Coatings 2020, 10, 59. [Google Scholar] [CrossRef] [Green Version]
  103. Iliopoulos, K.; Guezguez, I.; Kerasidou, A.P.; El-Ghayoury, A.; Branzea, D.; Nita, G.; Avarvari, N.; Belmabrouk, H.; Couris, S.; Sahraoui, B. Effect of metal cation complexation on the nonlinear optical response of an electroactive bisiminopyridine ligand. Dye. Pigment. 2014, 101, 229–233. [Google Scholar] [CrossRef] [Green Version]
  104. Rahulan, K.M.; Padmanathan, N.; Philip, R.; Balamurugan, S.; Kanakam, C.C. Structural evaluation and nonlinear optical properties of Ni/NiO. Ni/NiCo2O4 and Co/Co3O4 nanocomposites. Appl. Surf. Sci. 2013, 282, 656–661. [Google Scholar] [CrossRef]
  105. Wang, J.; Sheik-Bahae, M.; Said, A.; Hagan, D.J.; Van Stryland, E.W. Time-resolved Z-scan measurements of optical nonlinearities. JOSA B 1994, 11, 1009–1017. [Google Scholar] [CrossRef] [Green Version]
  106. Li, Z.; Hong, R.; Liu, T.; Wang, Q.; Tao, C.; Lin, H.; Zhang, D. The enhancement of nonlinear absorption of Ag thin film on laser induced defective MoOx buffer layer. Chem. Phys. Lett. 2020, 754, 137727. [Google Scholar] [CrossRef]
  107. Ferreira, E.; Kharisov, B.; Vázquez, A.; Méndez, E.A.; Severiano-Carrillo, I. Trejo-Durán, M. Tuning the nonlinear optical properties of Au@ Ag bimetallic nanoparticles. J. Mol. Liq. 2020, 298, 112057. [Google Scholar] [CrossRef]
  108. Pepe, Y.; Karatay, A.; Donar, Y.O.; Sınağ, A.; Unver, H.; Elmali, A. Tuning the energy bandgap and nonlinear absorption coefficients of CdO nanocomposite films with doping and annealing process. Opt. Mater. 2020, 103, 109880. [Google Scholar] [CrossRef]
  109. Alkallas, F.H.; Ahmed, H.A.; Pashameah, R.A.; Alrefaee, S.H.; Toghan, A.; Trabelsi, A.B.G.; Mostafa, A.M. Nonlinearity enhancement of Multi-walled carbon nanotube decorated with ZnO nanoparticles prepared by laser assisted method. Opt. Laser Technol. 2022, 155, 108444. [Google Scholar]
  110. Darwish, W.M.; Darwish, A.M.; Al-Ashkar, E.A. Synthesis and nonlinear optical properties of a novel indium phthalocyanine highly branched polymer. Polym. Adv. Technol. 2016, 26, 1014–1019. [Google Scholar] [CrossRef]
  111. Torres-Torres, D.; Trejo-Valdez, M.; Castañeda, L.; Torres-Torres, C.; TamayoRivera, L.; Fernández-Hernández, R.C.; Reyes-Esqueda, J.A.; Muñoz-Saldaña, J.; Rangel-Rojo, R.; Oliver, A. Inhibition of the two-photon absorption response exhibited by a bilayer TiO2 film with embedded Au nanoparticles. Opt. Express 2010, 18, 16406. [Google Scholar] [CrossRef]
  112. Muhammed, M.I.; Yahia, I.S.; Farid, A.S. Synthesis and characterization g-C3N4-doped PMMA polymeric nanocomposites films for electronic and optoelectronic applications. J. Appl. Polym. Sci. 2022, 139, e53064. [Google Scholar] [CrossRef]
Scheme 1. Preparation method of PVA:SA:TiO2 nanocomposites.
Coatings 13 00699 sch001
Scheme 2. Schematic diagram of Z-scan technique.
Coatings 13 00699 sch002
Figure 1. SEM images of (a) 0, (b) 1, (c) 3, and (d) 5 wt.% of TiO2 NPs doped in PVA:SA 3:1.
Coatings 13 00699 g001
Figure 2. EDX spectra of (a) 0, (b) 1, (c) 3, and (d) 5 wt.% of TiO2 NPs doped in PVA/SA 3:1.
Coatings 13 00699 g002
Figure 3. X-ray diffraction pattern of PVA:SA and its nanocomposites with 0, 1, 3, and 5 wt.% of TiO2 NPs.
Coatings 13 00699 g003
Figure 4. Linear plots of modified Scherrer equation for different nanocomposites of PVA:SA:TiO2.
Coatings 13 00699 g004
Figure 5. Plotting (a) transmission (%), (b) absorption, and (c) Ananocomposite/Ahost blend (the inset is the absorption of TiO2 NPs with the extract in deionized water), with the incident wavelength for the different concentrations of TiO2 NPs doped in PVA:SA 3:1. (d) Dependence of skin depth on E for the different concentrations of TiO2 doped in PVA:SA 3:1. (e) Variation of dln(αE)/dE with E for 5 wt.% of TiO2 NPs doped in PVA:SA 3:1. (f) Plotting ln (αE) versus ln (E-Eg) for 5 wt.% of TiO2 doped in PVA:SA 3:1.
Coatings 13 00699 g005
Figure 6. For 5 wt.% of TiO2 NPs doped in PVA:SA 3:1, variation of (a) (αE)2 versus E, (b) (αE)0.5 versus E, (c) (A/λ)0.5 versus (1/λ), (d) (A/λ)2 versus (1/λ), and (e) ln(A) versus (1/λ).
Coatings 13 00699 g006
Figure 7. For the different concentrations of TiO2 doped in PVA:SA 3:1, the dependence of ETail on (a) Eindirect (Tauc), (b) Edirect (Tauc), (c) Eindirect (ASF), and (d) Edirect (ASF).
Coatings 13 00699 g007
Figure 8. For the different concentrations of TiO2 NPs doped in PVA:SA 3:1, the variation of (a) k and (b) n versus the wavelengths. The variation of n with the content of TiO2 NPs doped in PVA:SA 3:1 for the different theoretical models by using (c) Edirect (Tauc) and (d) Eindirect (Tauc).
Coatings 13 00699 g008
Figure 9. For the different concentrations of TiO2 doped in PVA:SA 3:1, the variation of (a) real (εr) and (b) imaginary (εi) parts of complex dielectric constant with the incident wavelength. (c) The variation of εi with E for the same nanocomposites.
Coatings 13 00699 g009
Figure 10. For the different concentrations of TiO2 doped in PVA:SA 3:1, the variation in (a) VELF and (b) SELF with the incident wavelength.
Coatings 13 00699 g010
Figure 11. Plotting (a) no, (b) ε, (c) ηoptical, (d) χ(1), (e) χ(3), and (f) n2 with the content of TiO2 nanoparticles doped in PVA:SA 3:1.
Coatings 13 00699 g011
Figure 12. The nonlinearity study of the nanocomposites of different embedded TiO2 NPs into the host blend of PVA: SA by using (a) OA and (b) CA Z-scan technique.
Coatings 13 00699 g012
Figure 13. The output and the normalized influence power for the different concentrations of TiO2 NPs doped in the host blend of PVA:SA.
Coatings 13 00699 g013
Table 1. Element content for the external surface of PVA:SA:TiO2 nanocomposite films doped with different concentrations of TiO2 NPs (0, 1, 3, and 5%) from EDX.
PVA:SA:TiO2 NPs (wt.%)ElementWeight (%)Atomic (%)
0C50.558.2
O45.539.4
Na4.002.41
1C42.250.8
O50.845.9
Na3.332.09
Ti2.310.70
3C41.950.9
O49.845.3
Na3.202.03
Ti3.541.08
5C40.449.40
O50.546.30
Na3.962.53
Ti3.691.13
Table 2. FWHM, d-spacing, strain (εstr.), crystallite size (D), and dislocation density (δ) for different concentrations of PVA:SA:TiO2 nanocomposites.
Content of TiO2 Doped in PVA/SA
(wt.%)

(Degree)
FWHM
(Degree)
d-Spacing
(Å)
D
(nm)
δ × 1015
(Lines/m2)
εstr.
113.271.106.6624.32 ± 2.21.690.041
19.512.314.550.058
23.289.953.810.211
39.9913.62.250.161
313.130.886.7327.17 ± 1.61.350.033
19.542.194.540.055
23.627.313.760.152
40.3610.42.230.123
514.071.646.2910.42 ± 1.79.210.058
19.502.374.550.060
22.762.133.910.045
25.258.033.510.156
40.2813.62.230.161
Table 4. The estimated linear and nonlinear absorption coefficients for the prepared nanocomposites.
Different Concentration of TiO2 NPs in the Blend of PVA:SA χ 1
(cm−1)
χ 2
(cm/W)
n 2
(cm2/W)
χ 3
(esu)
0 wt.%0.274 3.54 × 10−60.81 × 10−134.31 × 10⁻¹²
1 wt.%0.556 3.87 × 10−61.57 × 10−135.75 × 10⁻¹²
3 wt.%4.7510.4 × 10−61.91 × 10−1312.1 × 10−12
5 wt.%11.521.2 × 10−65.83 × 10−1327.1 × 10−12
Disclaimer/Publisher’s Note: The statements, opinions and data contained in all publications are solely those of the individual author(s) and contributor(s) and not of MDPI and/or the editor(s). MDPI and/or the editor(s) disclaim responsibility for any injury to people or property resulting from any ideas, methods, instructions or products referred to in the content.

