Article

WFRE-YOLOv8s: A New Type of Defect Detector for Steel Surfaces

College of Physical Science and Technology, Shenyang Normal University, Shenyang 110034, China
*
Authors to whom correspondence should be addressed.
Coatings 2023, 13(12), 2011; https://doi.org/10.3390/coatings13122011
Submission received: 5 October 2023 / Revised: 9 November 2023 / Accepted: 25 November 2023 / Published: 28 November 2023
(This article belongs to the Special Issue Solid Surfaces, Defects and Detection)

Abstract

:
During the production of steel, in view of the manufacturing engineering, transportation, and other factors, a steel surface may produce some defects, which will endanger the service life and performance of the steel. Therefore, the detection of defects on a steel surface is one of the indispensable links in production. The traditional defect detection methods have trouble in meeting the requirements of high detection accuracy and detection efficiency. Therefore, we propose the WFRE-YOLOv8s, based on YOLOv8s, for detecting steel surface defects. Firstly, we change the loss function to WIoU to address quality imbalances between data. Secondly, we newly designed the CFN in the backbone to replace C2f to reduce the number of parameters and FLOPs of the network. Thirdly, we utilized RFN to complete a new neck RFN to reduce the computational overhead and, at the same time, to fuse different scale features well. Finally, we incorporate the EMA attention module into the backbone to enhance the extraction of valuable features and improve the detection accuracy of the model. Extensive experiments are carried out on the NEU-DET to prove the validity of the designed module and model. The mAP0.5 of our proposed model reaches 79.4%, which is 4.7% higher than that of YOLOv8s.

1. Introduction

Steel is one of the most important industrial materials and is widely applied in the manufacture of various industrial products; therefore, quality inspection of steel is essential. During the smelting process, steel is susceptible to various defects caused by various external factors, which can affect the performance and life of the steel [1,2,3]. Traditional surface defect detection methods contain electromagnetic acoustic transducers, ultrasonic testing, and X-ray inspection. However, this method is inefficient, and it could result in less reliable results due to the experience of the inspector. Therefore, with the rapid advancement of machine vision, the industry is beginning to introduce machine vision technology into the detection of steel surface defects, which replaces the traditional surface defect detection method. However, conventional machine learning depends heavily on manual design algorithms in feature extraction. This could result in defect detection methods that lack versatility and robustness [4].
Recently, deep learning-based object detection algorithms are developing rapidly, and a great deal of excellent target detection models have emerged. More and more researchers try to use target detection models to detect different defect types, not only steel surface defects but also PCB solder joints [5,6,7], automotive paint detection [8,9], and so on. Deep learning-powered defect detection methods are separated into one-stage algorithms and two-stage algorithms. The one-stage algorithms solve the object detection as a regression problem, mainly SSD [10], YOLOv1 [11], YOLOv2 [12], YOLOv3 [13], YOLOv4 [14], YOLOv5 [15], YOLOv6 [16], YOLOv7 [17], and so on. The two-stage algorithms utilize selective search algorithms or region suggestion networks for object detection, such as R-CNN [9], Fast R-CNN [18], Faster R-CNN [19], R-FCN [20], and so on. They have the advantage of high accuracy and the disadvantage of being slow. In contrast, one-stage algorithms have the advantage of achieving a balance between accuracy and speed. They are easier to deploy on embedded devices.
In this study, a new steel surface defect detector, called WFRE-YOLOv8s, for detecting steel surface defects, which is based on YOLOv8s, is proposed. WFRE-YOLOv8s redesigns the backbone by utilizing the CFN module and EMA attention to reduce the number of parameters while enhancing the capability of the feature extraction. Besides that, the neck is improved by proposing a new module, RFN, to better fuse features at different scales. The main work is as follows:
  • The WIoU is employed as the loss function of WFRE-YOLOv8s. It effectively balances the gap between high-quality and low-quality data in steel surface defect datasets.
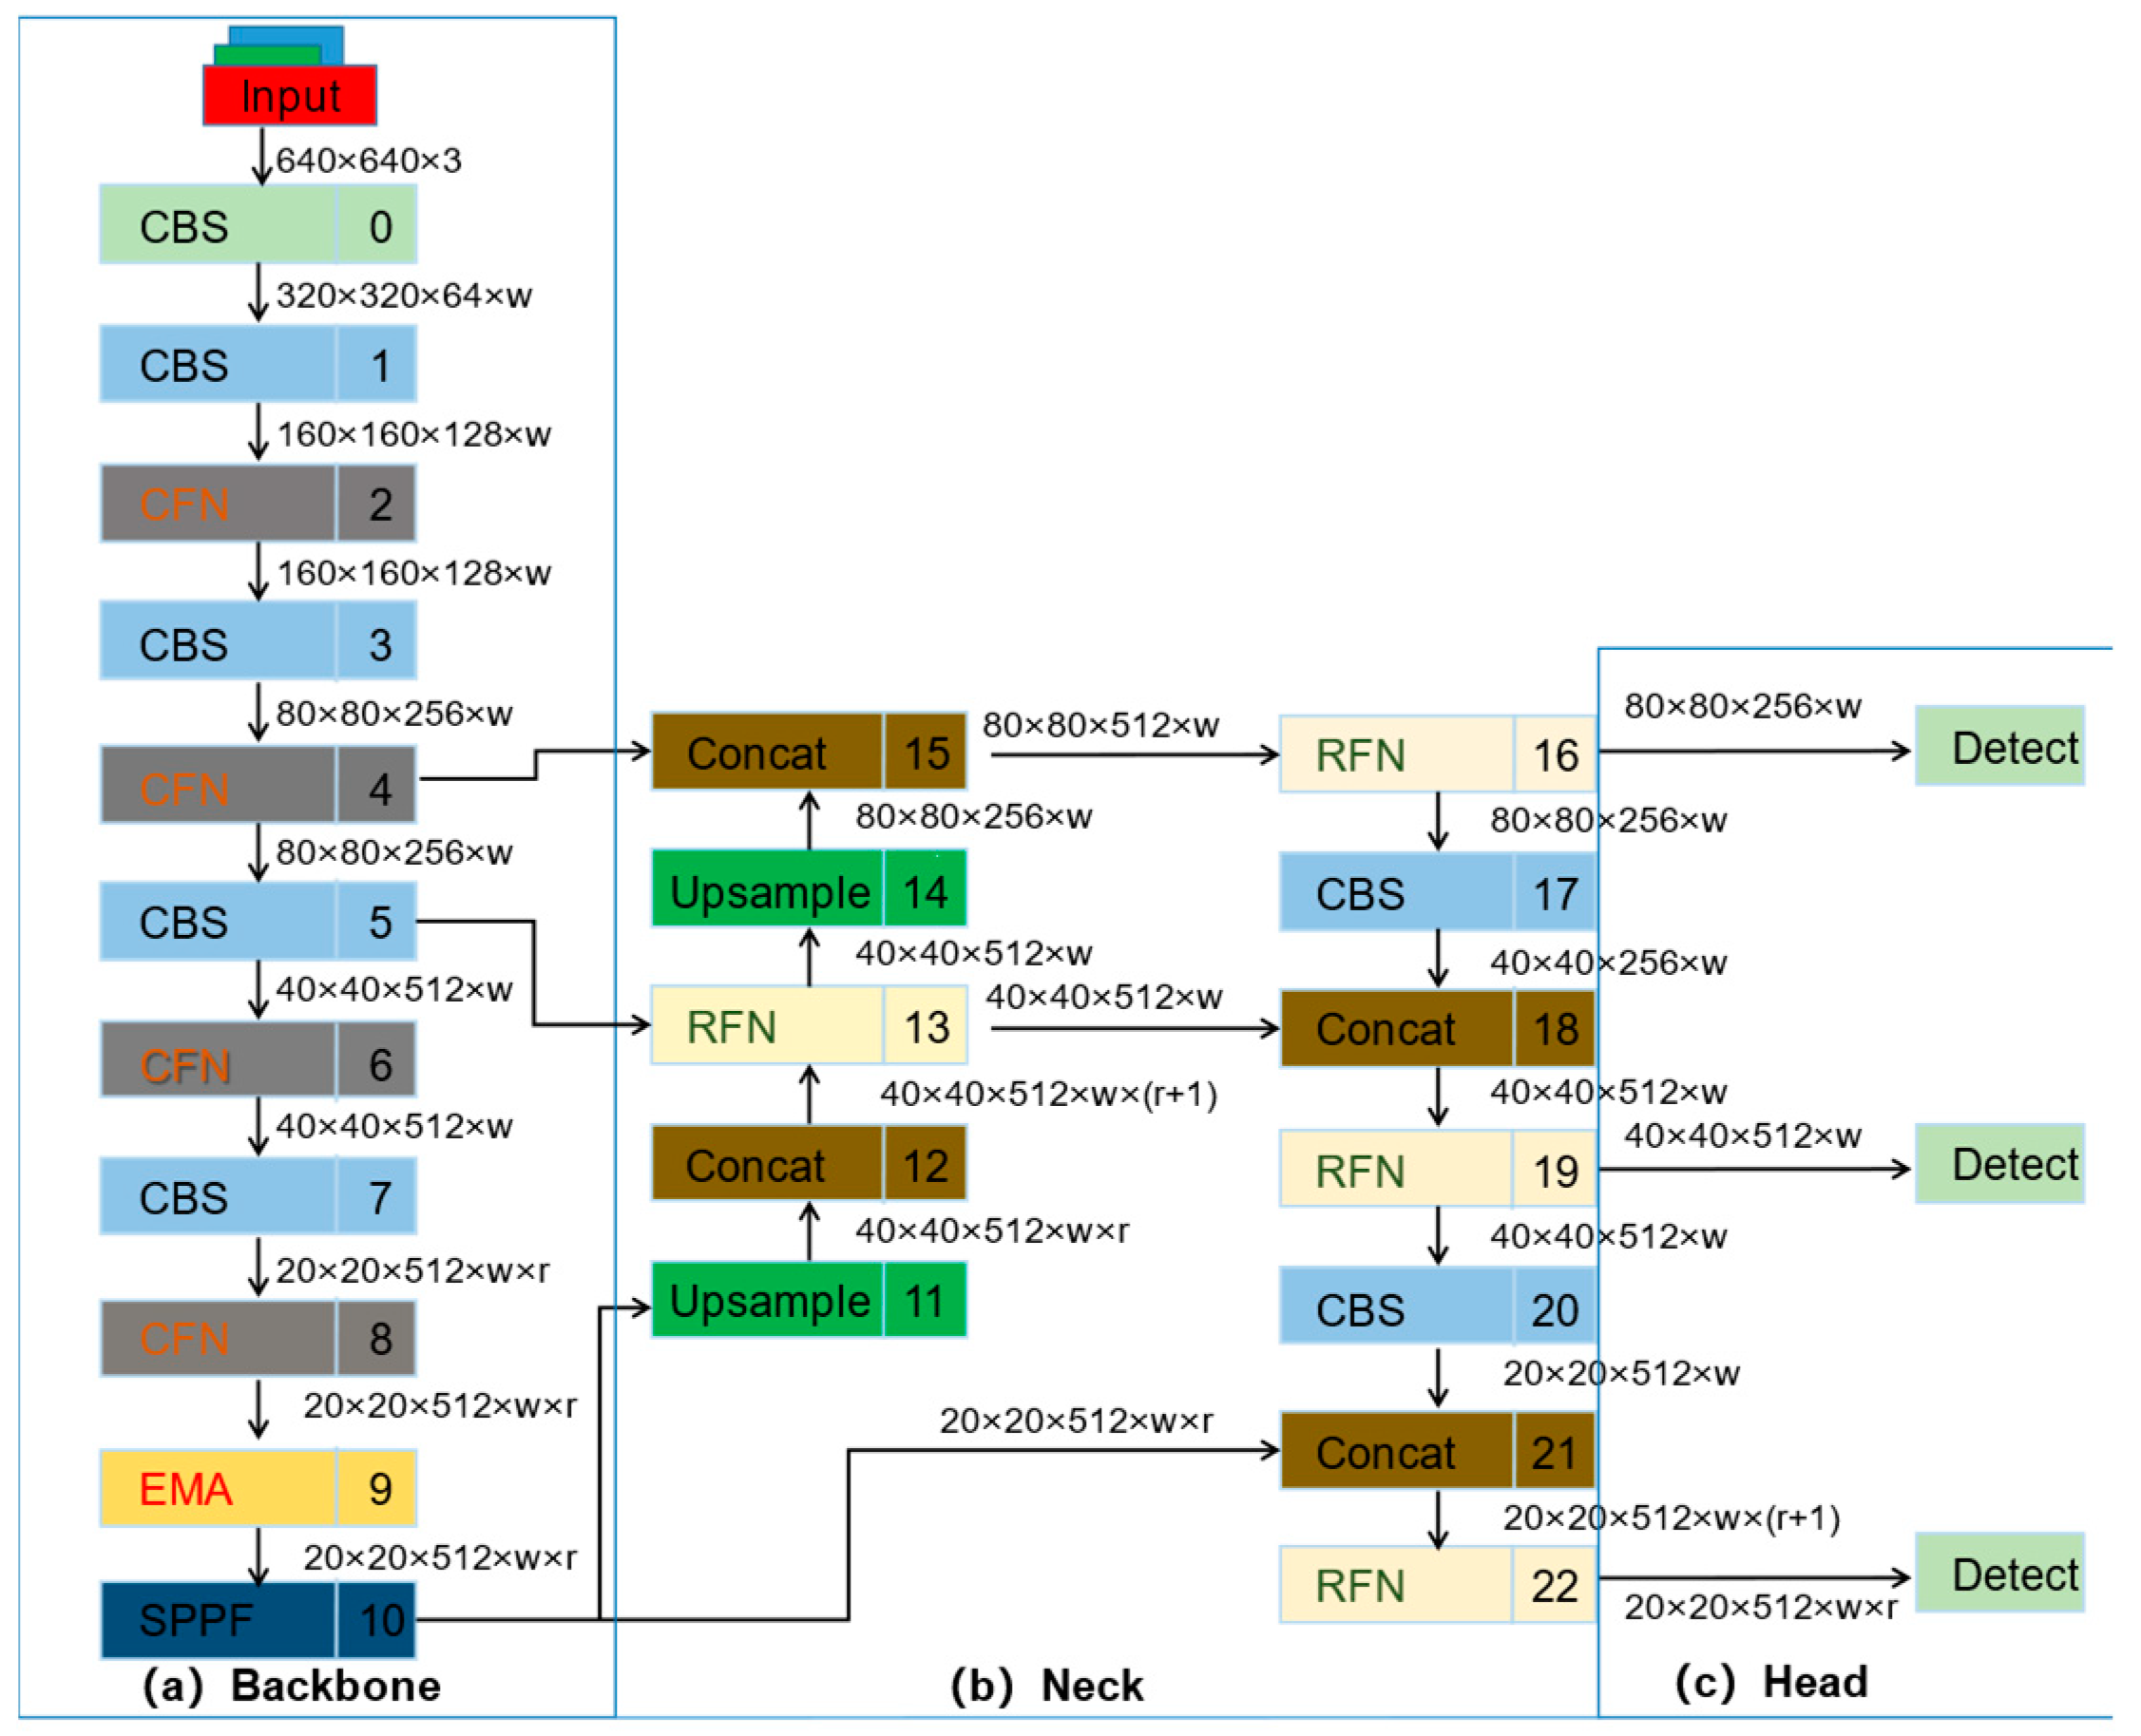
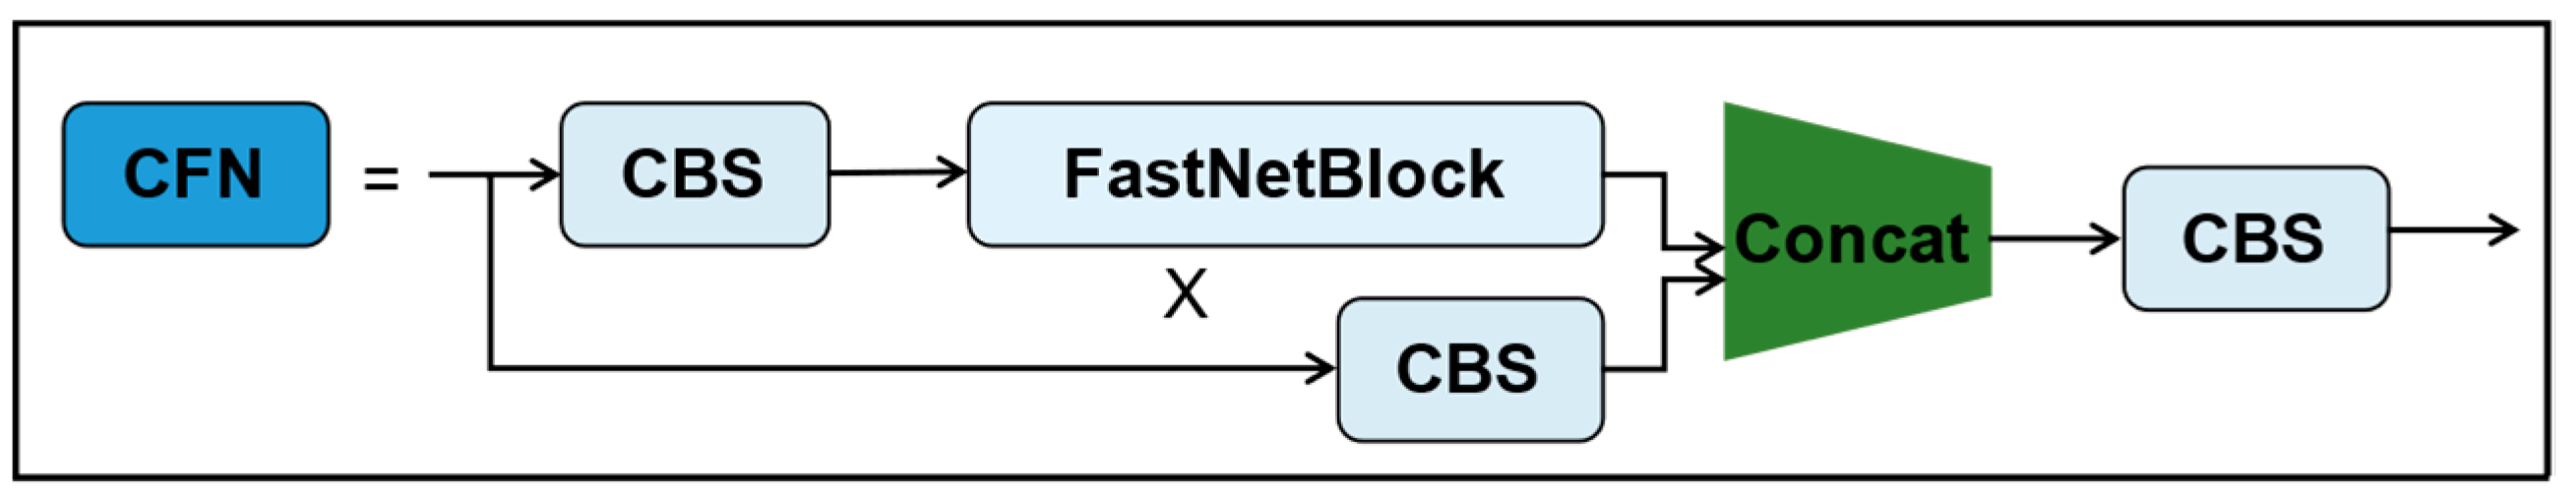
  • We have developed a CFN module that replaces the C2f module in the backbone, enhancing network detection accuracy and detection speed. Additionally, it minimizes the number of parameters and FLOPs within the entire network.
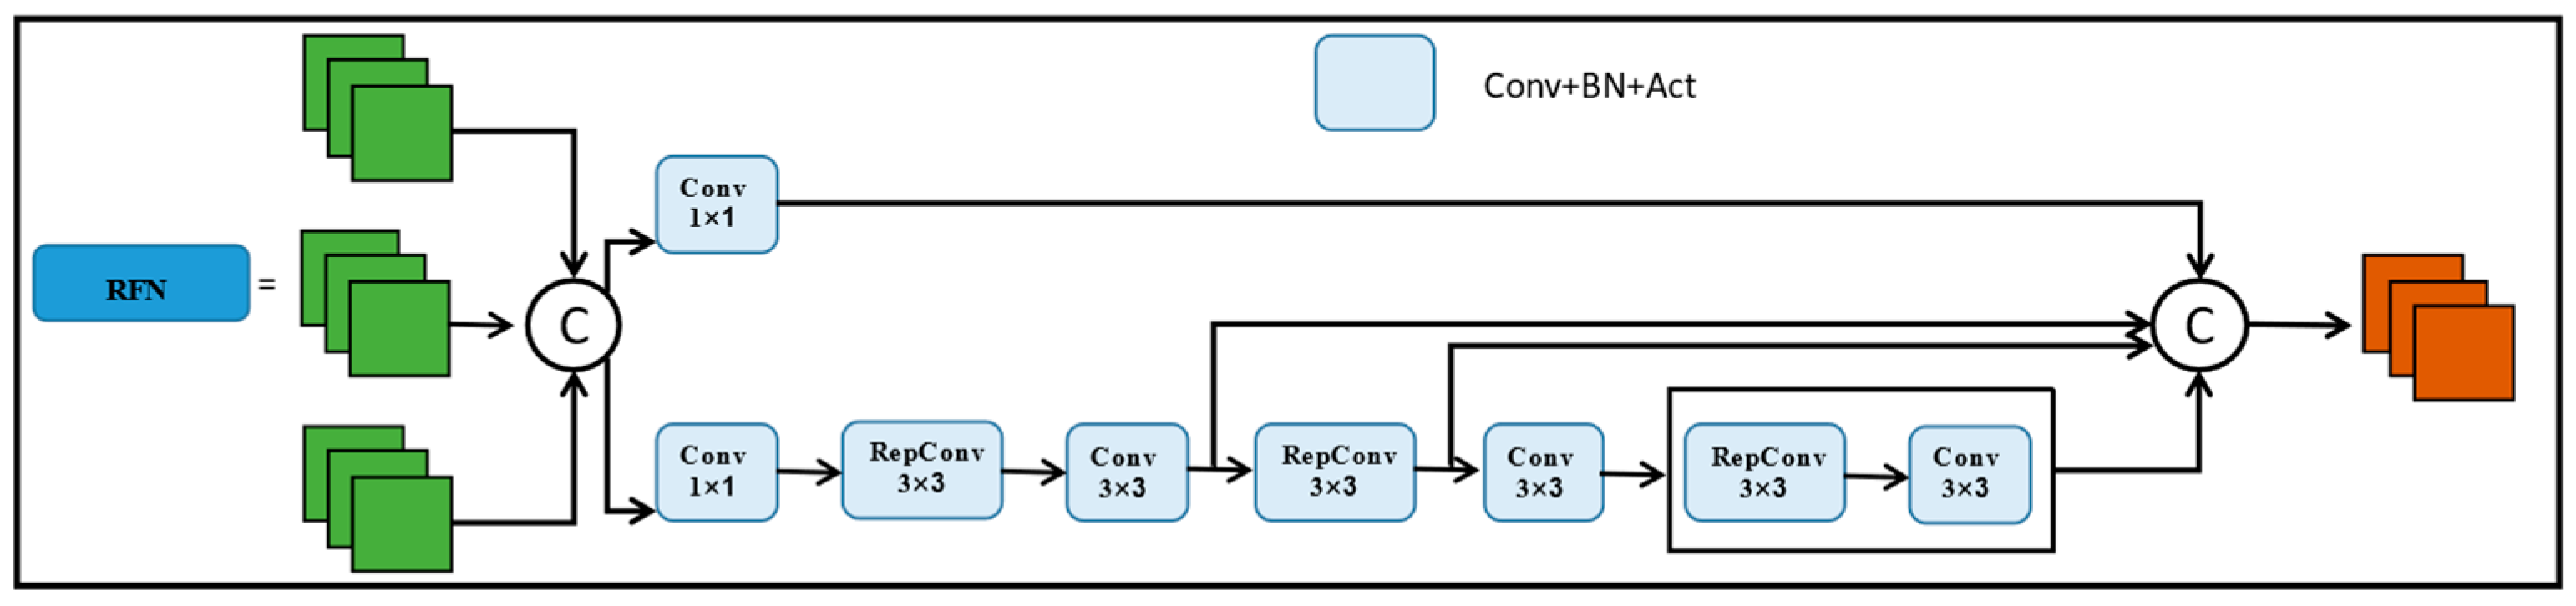
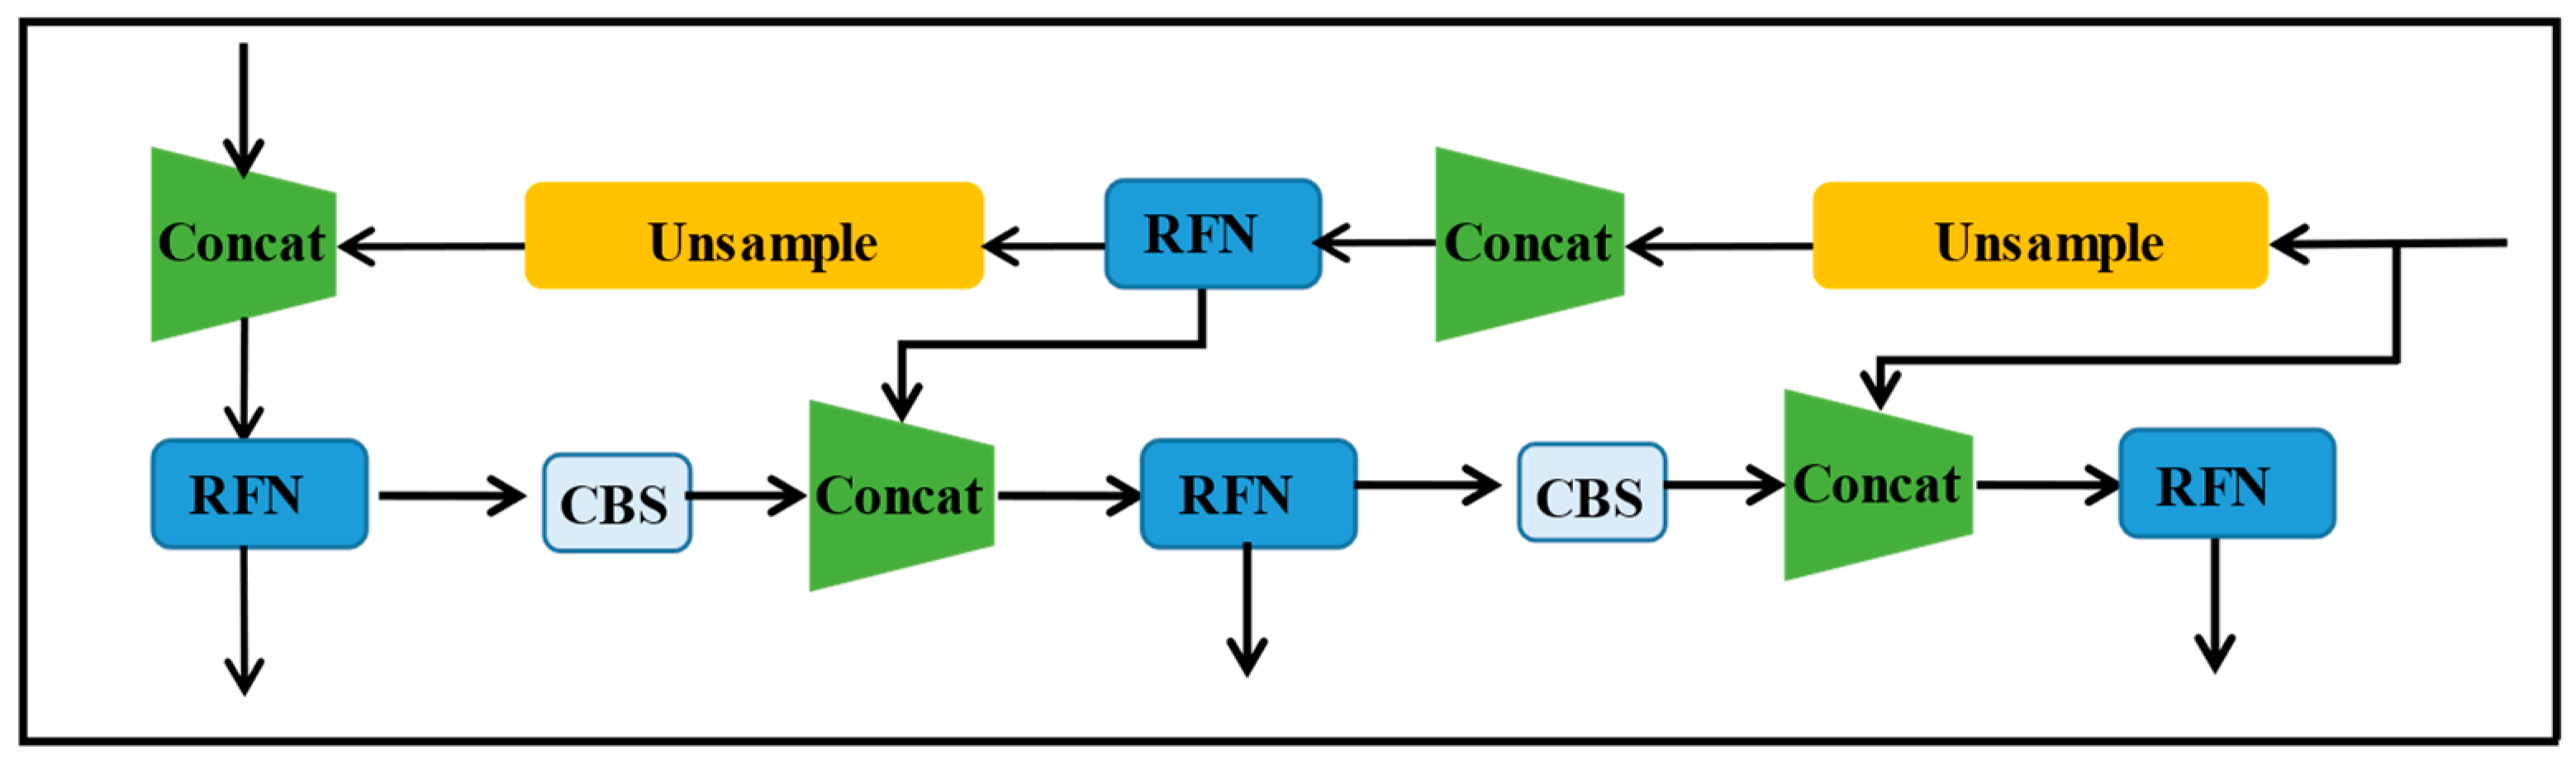
  • We have newly designed a neck, named RFN, to reduce the computational overhead. It can fuse different scale features, thus improving the accuracy of the whole detection network.
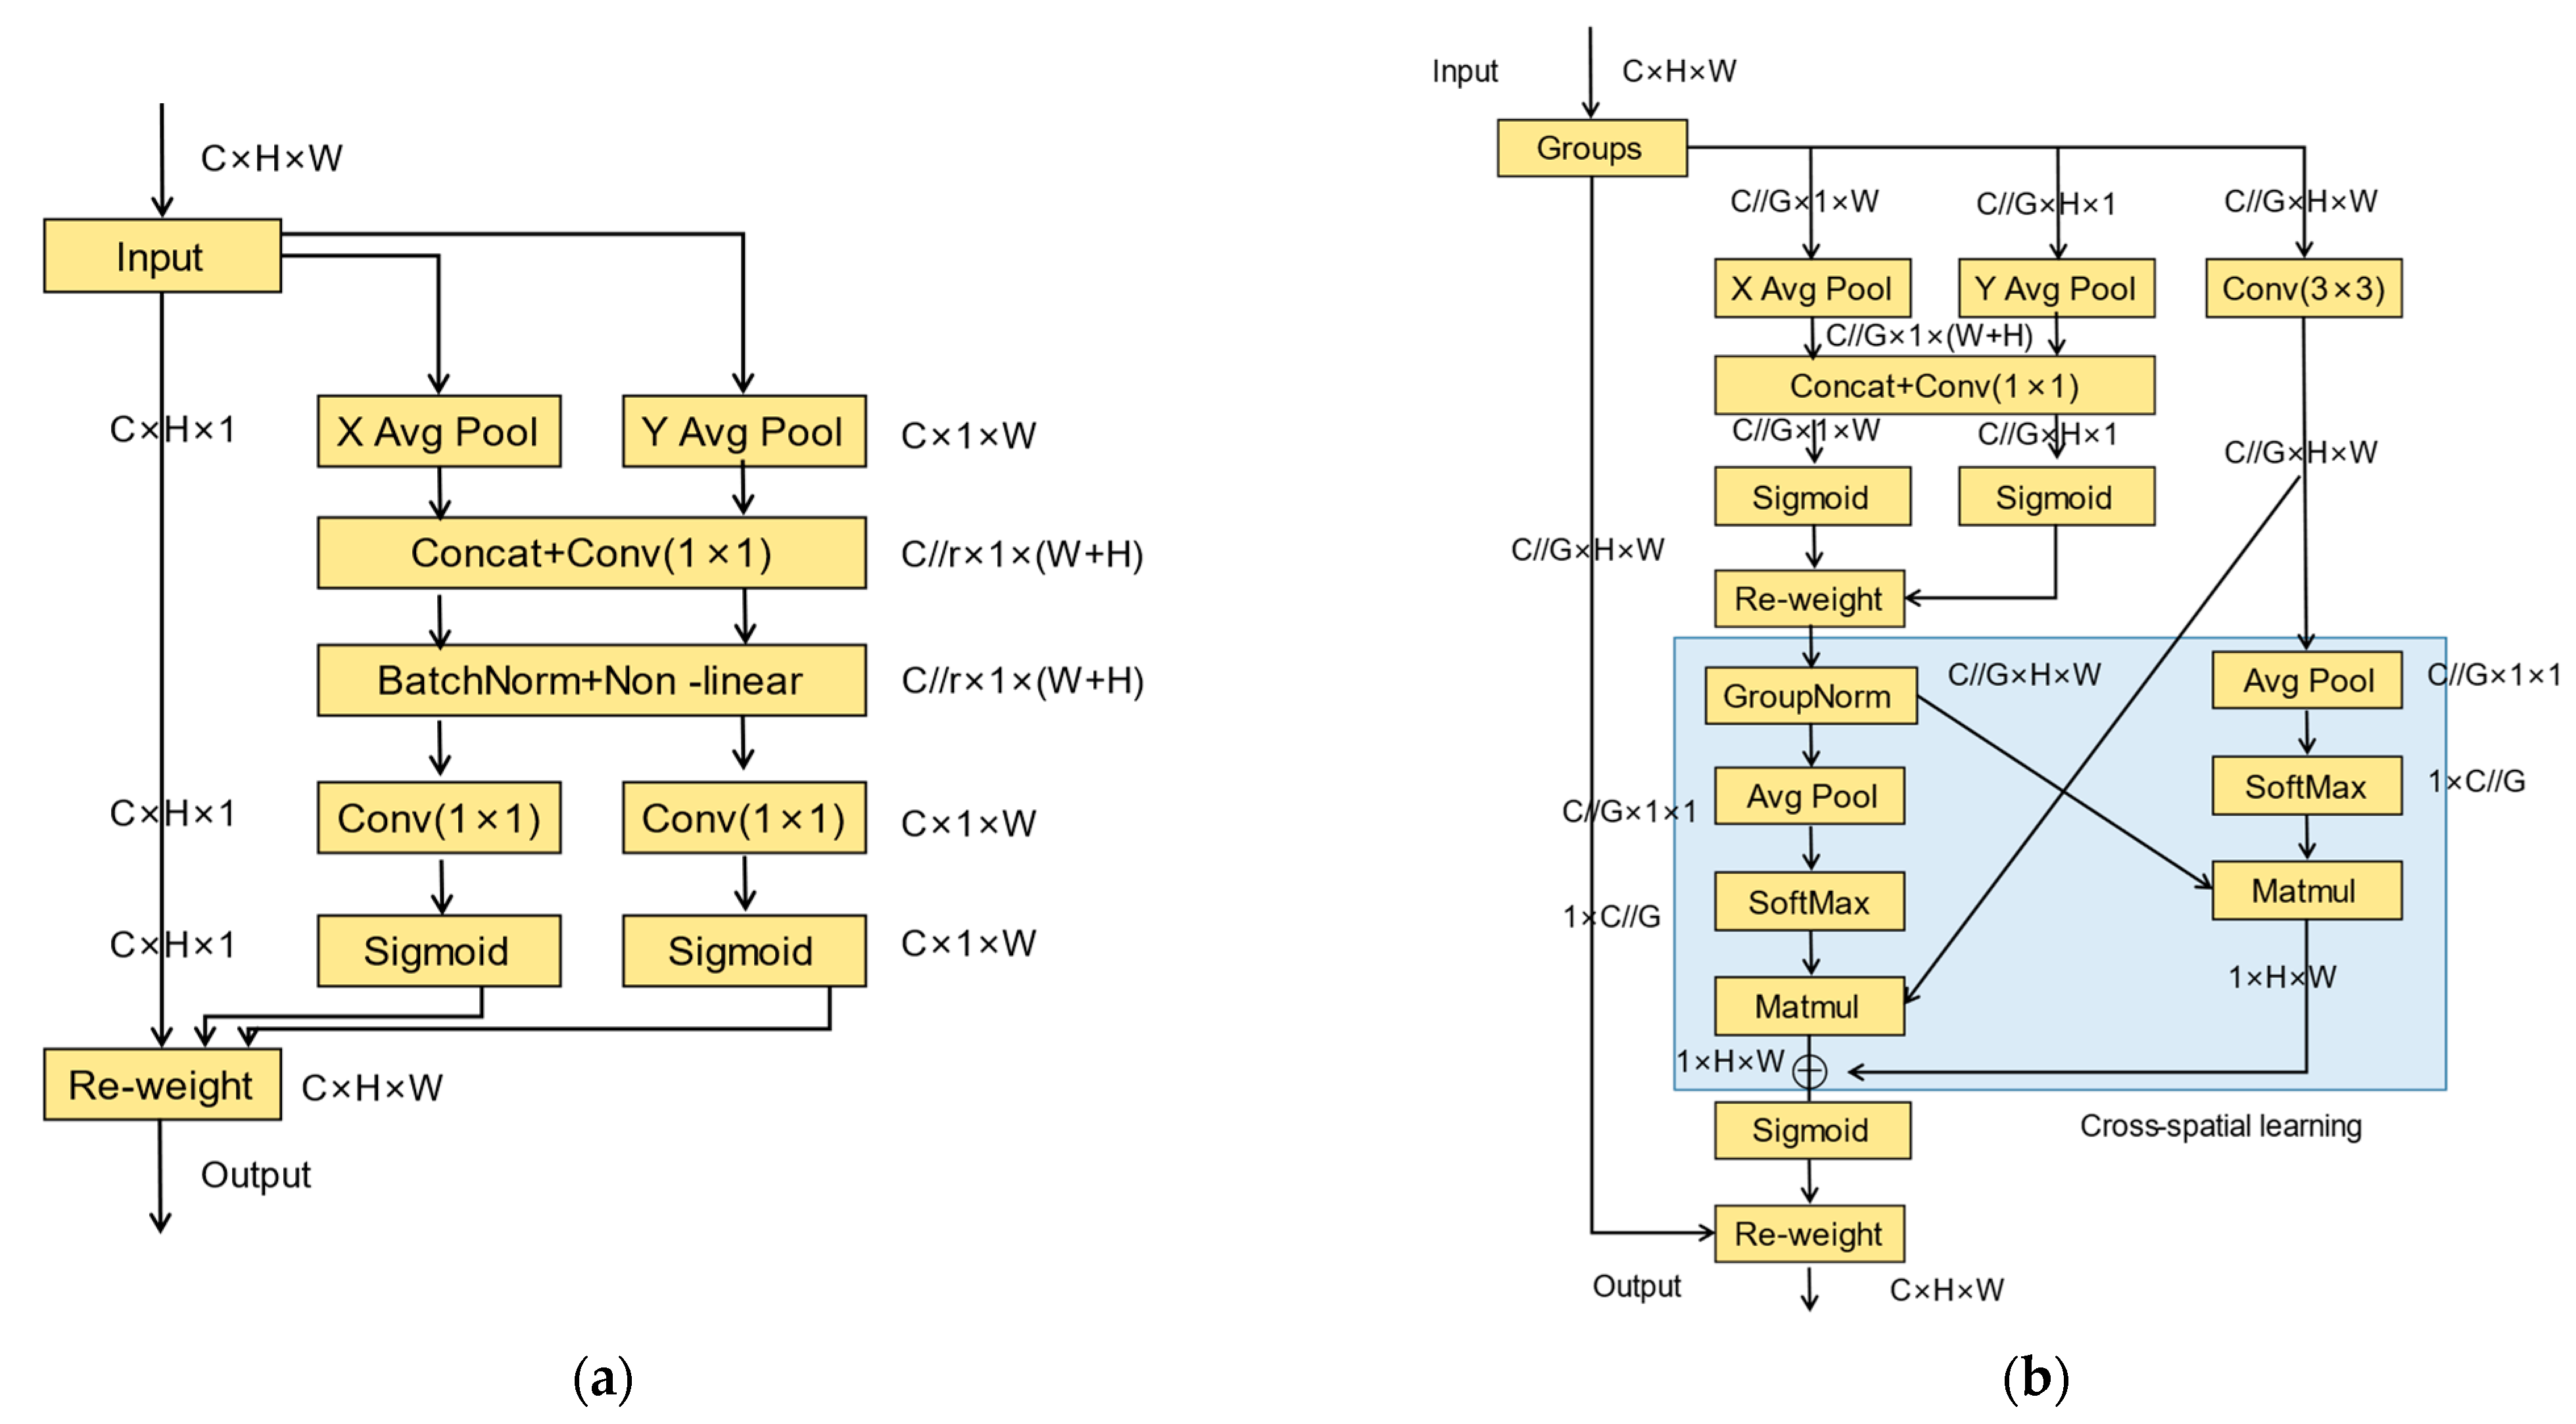
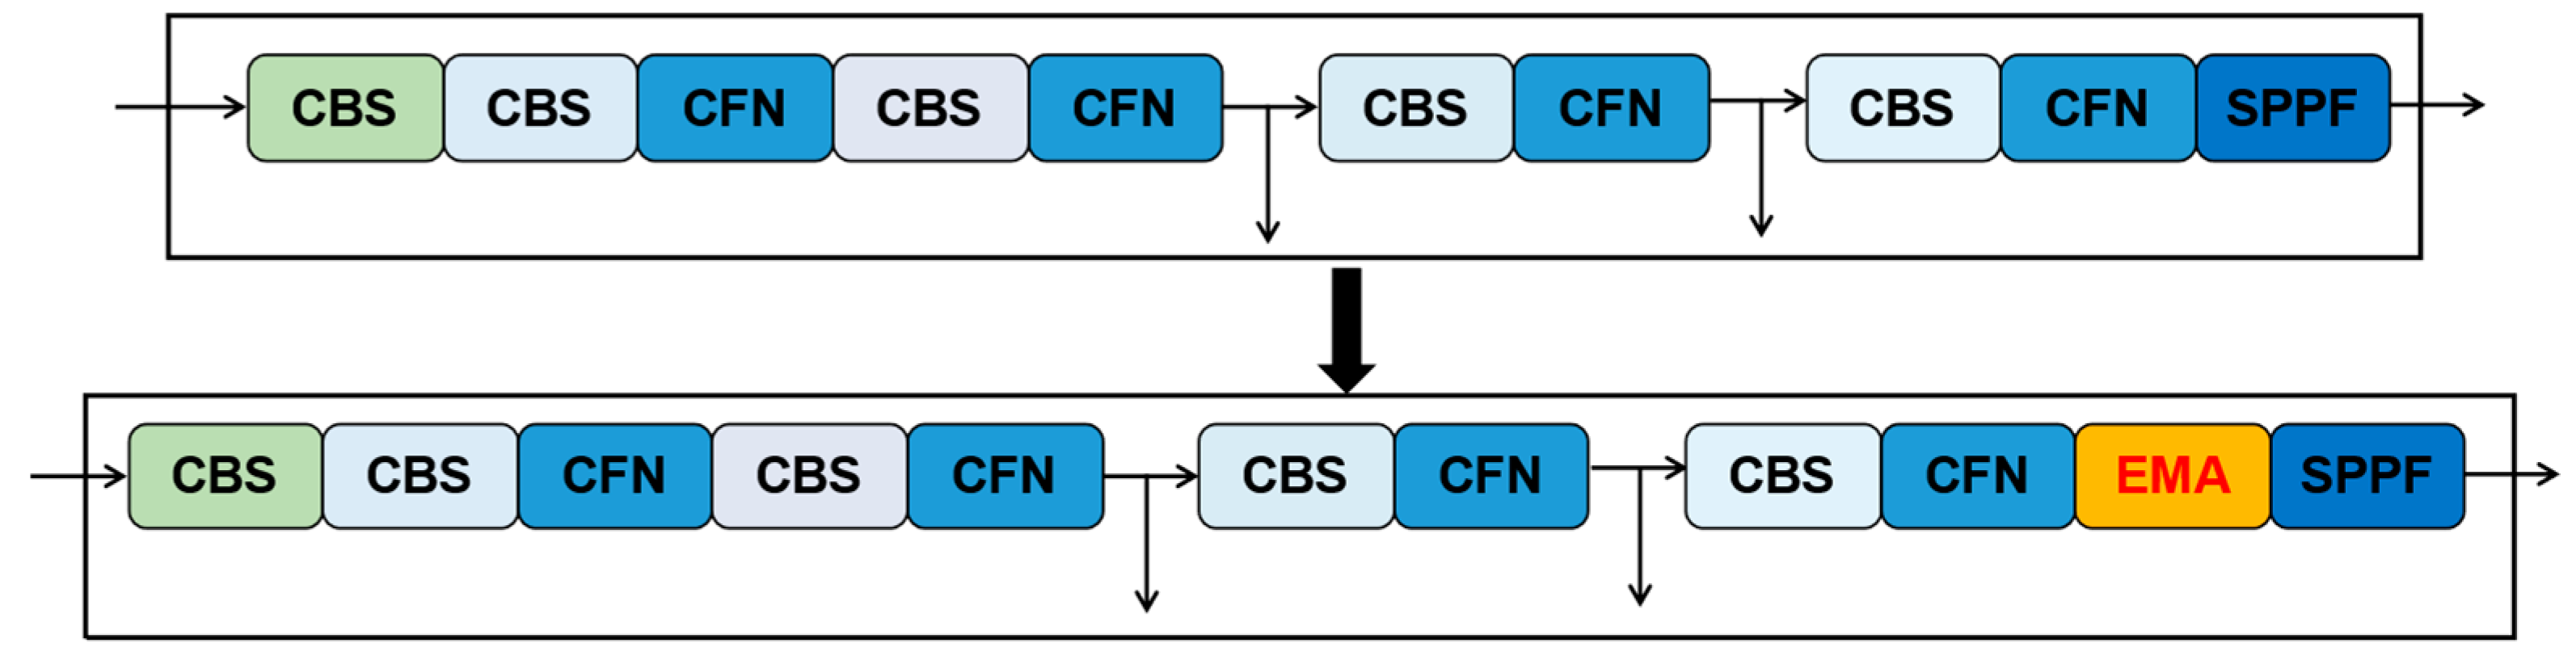
  • We have incorporated the EMA into the backbone to optimize the capacity for the extraction of valuable features for steel surface defects. This enhancement has been introduced without any additional load on the network, resulting in increased accuracy in defect detection.
  • We carry out a series of experiments primarily on NEU-DET and GC10-DET. The experimental outcomes demonstrated that our proposed methodology yields superior detection results.

2. Related Works

The defect detection methods have been comprehensively divided into conventional machine learning methods and deep learning-powered methods.

2.1. Conventional Machine Learning Methods

Machine learning has played an essential role in defect detection, and there are still many organizations that use machine learning methods to inspect their products. Franz [21] proposed using a Bayesian network classifier to detect surface defects on rough steel blocks. This method can effectively classify the defects, and the accuracy can reach 98%. Yun [22] proposed using the undecimated wavelet transform and vertical projection profile for detecting vertical line defects. Song et al. [23] proposed a new detection method incorporating saliency linear scanning morphology. This involved extracting visual saliency to eliminate background clutter and applying morphology edge processing to eliminate oil pollution edges.
Tian et al. [24] devised an enhanced ELM machine learning algorithm, incorporating a genetic algorithm, which they employed to detect surface defects on hot-rolled steel plates. Wang et al. [25] presented an improved random forest algorithm with the optimal multi-feature set fusion (OMFF-RF algorithm) for distributed defect recognition on steel surfaces. Gong et al. [26] proposed a novel multi-hypersphere support vector machine (MHSVM+) with additional information for multi-class steel surface defect classification. Chu et al. [27] developed multi-informative twin support vector machines (MTSVMs) based on binary twin support vector machines to detect steel surface defects. Zhang et al. [28] proposed a method that involves merging the Gaussian function, which is fitted to the histogram of the testing image, with the membership matrix to identify and diagnose defects. Ji et al. [29] proposed an MGH, a hybrid method utilizing machine learning and genetic algorithms, for assessing the quality of hot-rolled steel strips in production systems.

2.2. Deep Learning Approaches

The advancement of deep learning has led to the use of convolutional neural networks for target detection tasks that cannot be handled by machine learning. Object detection algorithms based on deep learning have been categorized as one-stage algorithms and two-stage algorithms. The majority of defect detection networks rely on target detection networks, while only a small portion utilize segmentation algorithms.
Bulnes [30] developed a novel defect detection technique utilizing a genetic algorithm to optimize configuration parameters. Additionally, a neural network is used for defect classification. Guan et al. [31] used VGG19 for pre-training, SVM (support vector machine), and decision trees to assess feature images’ quality. Then they adjusted the parameters and structure of VGG19, thus obtaining a new VSD network for classifying steel surface defects. Xiao et al. [32] developed an image pyramid convolutional neural network (IPCNN) model based on Mask-R CNN to detect surface defects in images. Zhao et al. [33] used deformable convolution in Faster R-CNN and introduced a feature pyramid network to obtain an improved Faster R-CNN network for steel surface defect detection.
Zhao et al. [34] proposed a variant of YOLOv5L, called RDD-YOLO, to identify steel surface defects. It changed the original backbone component to Res2Net based on YOLOv5 and designed a dual feature pyramid network (DFPN) to deepen the network. Additionally, this approach utilizes a decoupling header to separate the regression and classification to improve the precision. Wang et al. [35] proposed a variant of YOLOv5s, called multi-scale-YOLOv5, to complete the detection of steel surface defects. Li et al. [36] proposed a variant of YOLOv4 for detecting defects on steel strip surfaces, which improves the precision of detection by incorporating the CBAM, where the SPP module is replaced with the RFB module. Liu et al. [37] proposed a DLF-YOLOF for defect detection on steel plate surfaces, which uses an anchorless detector to reduce the hyperparameters, utilizes a deformable convolutional network and a local spatial attention module to expand the contextual information in the feature maps, and employs a soft non-maximal suppression to improve the detection accuracy. Wang et al. [38] proposed a unique method, which is based on YOLOv7, to improve the accuracy of detecting strip steel surface defects. The ConvNeXt module has been integrated into the backbone while the attention mechanism has been incorporated into the pooling layer to enhance the ability of YOLOv7 to extract features and identify small features. Shao et al. [39] proposed a steel surface defect detection model based on a multi-scale lightweight network. This network can effectively reduce the number of parameters while achieving better model accuracy and efficiency. Inspired by YOLOv8, we propose a model named WFRE-YOLOv8s to improve detection accuracy and reduce the number of parameters and FLOPs. Compared with YOLOv8s, WFRE-YOLOv8s significantly improves prediction accuracy and identifies a wider range of defects.

3. Methods

3.1. The YOLOv8 Algorithm

3.1.1. YOLO Algorithm

The YOLO is a one-stage object detection algorithm that not only focuses on accuracy but also speed. YOLO consists of four parts: input, backbone, neck, and head. Whether it is YOLOv3, YOLOv4, or even the latest YOLOv8, their overall architecture is similar without much change. The specific detection and recognition process of YOLOv8 for the object is shown in Figure 1. The image is scaled to the appropriate size, then it is input into the CNN. The location, size, and class of the detector are obtained through backbone, neck, and head, and the loss function is utilized to calculate the gap between the predicted frame and the real frame. The gradient descent iteration is used to narrow the gap between the predicted frame and the real frame. Finally, the weight matrix and deviation at the minimum loss function in the total number of iterations are taken to get the prediction information of the object to be detected.

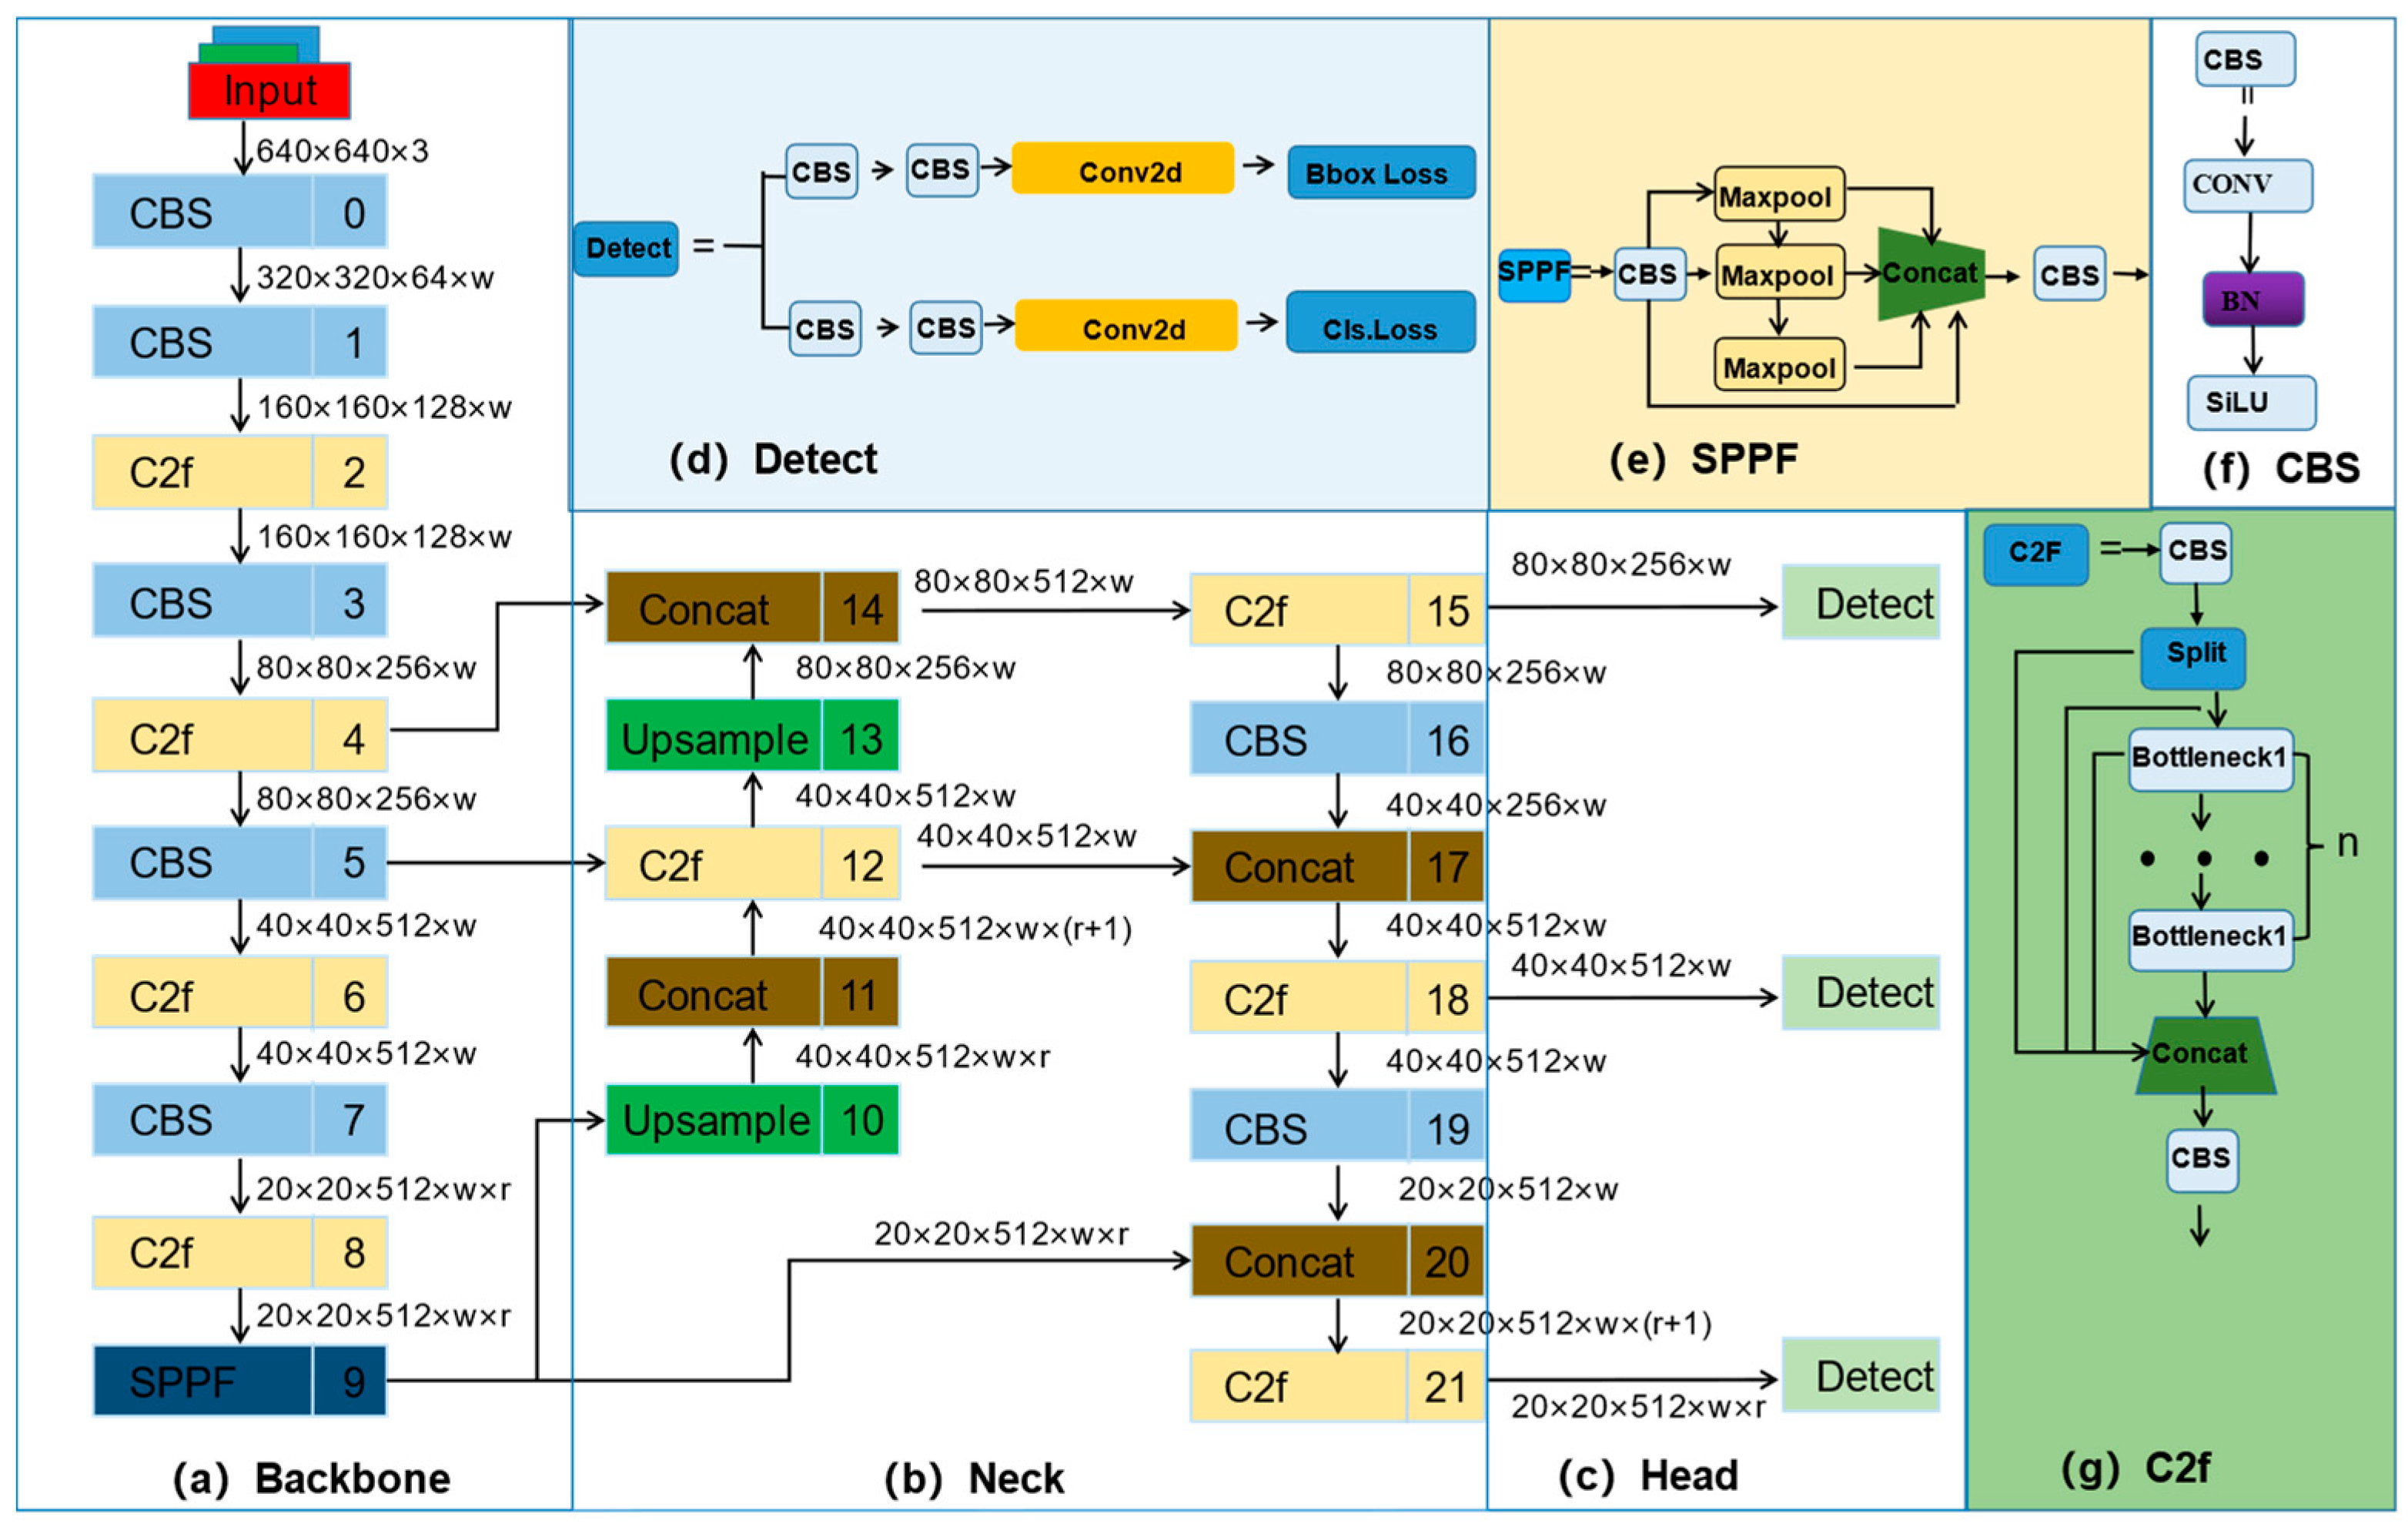
3.1.2. The Structure of YOLOv8

The YOLO algorithm has been iterated for several versions, and on 10 January 2023, Ultralytics, Inc. released YOLOv8, which is another upgrade to the many YOLO algorithms that preceded it. The YOLOv8 algorithm is similar to the YOLOv3 and YOLOv5 algorithms. It contains five versions, namely YOLOv8n, YOLOv8s, YOLOv8m, YOLOv8l, and YOLOv8x, and among these five models, YOLOv8n is the smallest and YOLOv8x is the largest. The performance differences of these models are shown in Table 1 below.
From Table 1, it is evident that YOLOv8n has the fastest detection speed among these five models. Additionally, it has the lowest amount of FLOPs and number of parameters. In contrast, YOLOv8x has the slowest detection speed among these five models and a higher amount of FLOPs and number of parameters. The difference between the models is due to their sizes. The YOLOv8 algorithm mainly consists of input, backbone, neck, and head.
The structure of YOLOv8s is shown in Figure 1:
  • The backbone is utilized for feature extraction and consists of the CBS, C2f, and SPPF modules. The CBS makes a convolution operation on the input information, applies batch normalization, and activates the information stream by SiLU activation. C2f module replaces the C3 module in YOLOv5 for residual feature learning, which enriches the information stream of the feature extraction network while maintaining a lighter weight compared to C3. The SPPF module is the same as in YOLOv5, which converts arbitrary feature maps into fixed-size feature vectors.
  • The neck adopts the structure of FPN + PAN to realize the fusion between multi-scale information. Compared to YOLOv5, C3 was updated to C3.
  • The head is utilized to output the coordinates of the predicted box and the confidence of each category. Compared with YOLOv5, this part adopts a more advanced decoupled head (decoupled head). The decoupled head makes use of two independent branches to complete the task of object classification and location prediction and uses different loss functions in these two branches.

3.2. Improvement of YOLOv8s Network

In the pursuit of greater precision in detecting steel surface defects, we propose our novel model called WFRE-YOLOv8s, which is delineated in detail in Figure 2. The backbone mainly consists of CBS, SPPF, the newly proposed CFN module in this paper, and the EMA. The CFN module is a new module specially designed to replace the C2f module for steel inspection tasks. It has the advantage of using fewer parameters and less computation than the C2f module. The neck part adopts Unsample, CBS, and the RFN module in this paper. The head part is unchanged, and the WIoU is adopted as the loss function of WFRE-YOLOv8s. The RFN module is also utilized to design a new neck for the first time, which gives the model faster detection speed and higher accuracy.

3.2.1. Improvement of the Loss Function

YOLOv8 utilizes a blend of DFL [40] and CIoU (Complete-IoU) [41] for the regression loss. However, CIoU does not take into account the balance between complex and easy samples. It also ignores the discrepancies between the bounding box and the ground truth bounding box when the penalty factor is equal to aspect ratio of the bounding box and the ground truth bounding box. As a result, CIoU boosts the computational complexity of the model. Formulas (1) and (2) illustrate the expression for the CIoU and the bounding box loss function, respectively.
CIoU = IoU ρ 2 b , b gt c 2 av
L CIOU = 1 IoU + ρ 2 b , b gt c 2 + av
In Formulas (1) and (2), IoU denotes the intersection and concatenation ratio between the bounding box and the ground truth bounding box; b, bgt denotes the centroid of the ground truth bounding box and the centroid of the bounding box; a is a parameter for balancing proportionality, and v is utilized for measuring the proportionality consistency between the widths and heights of the bounding box and the ground truth bounding box.
There are frequent instances of inferior samples within the dataset of steel surface defects. This paper introduces WIoU (Wise-IoU) [42] to replace the CIoU combined with DFL to form the regression loss of the WFRE-YOLOv8s algorithm. WIoU utilizes the dynamic non-maximum suppression to assess overlap between the predicted bounding box and the ground truth bounding box. This loss function effectively improves the imbalance between the high-quality and low-quality data in dataset and the accuracy of the object detection algorithm. The calculation formula of WIoU is shown in Formulas (3) and (4):
L WIoU = R WIoU × ( 1 - I o U )
R WIoU = exp ( x x g t ) 2 + ( y y g t ) 2 ( W g 2 + H g 2 ) *
In Formula (4), x and y represent the coordinates of the centroid of the bounding box, xgt and ygt represent the coordinates of the centroid of the ground truth bounding box, and wg and hg represent the width and height of the minimum bounding box, respectively. * represents the separation operation.

3.2.2. Improvement of the Backbone

The C2f is newly proposed in YOLOv8 to replace the C3 in YOLOv5. The C2f is designed with reference to C3 and the ELAN concept to ensure that YOLOv8 is able to acquire gradient flow information efficiently while maintaining its light weight. However, the module contains more convolutional layers, which require many convolution operations, resulting in increased computation and slowing down the model’s inference speed to some extent.
Chen et al. [43] proposed a novel convolution PConv, exploiting the redundancy of the feature map to optimize costs. PConv was also utilized in the FasterNet Block and FasterNet. PConv utilizes a standard convolutional operation to extract spatial features from a subset of the input channel while keeping the residual channels. This method has the benefit of reducing computational redundancy and memory access at the same time. The structure of PConv, FasterNet Block, and FasterNet are shown in Figure 3. The FasterNet Block comprises a PConv, 1 × 1 Conv, and 1 × 1 Conv. Formula (5) explains how to calculate the FLOPs of PConv.
F L O P s P C onv = h × w × k × k × c p × c p
F L O P s C onv = h × w × k × k × c × c
Formula (6) demonstrates how to calculate the FLOPs of Conv. When the ratio of cp to the number of input feature channels c is 1/4, the FLOPs of PConv decrease to only 1/16 of those required for conventional convolution. This leads to the conclusion that PConv reduces both the FLOPs of the network and the number of parameters.
The design of a CFN module was inspired by the C3 module and FasterNet Block, illustrated in Figure 4. CFN is composed of FasterNet Block, CBS, and Concat. It differs from the traditional C3 structure in that the BottleNeck is replaced with FasterNet Block. The FasterNet Block replaces the BottleNeck in C3. Compared to the BottleNeck, this substitution improves the efficiency of feature extraction and compresses the network volume. Consequently, we replaced the C2f with the CFN to reconstruct the backbone. This approach results in a decrease in the number of parameters, FLOPs, and model size that effectively improves the model's inference speed.

3.2.3. Improvement of the Neck

The neck of YOLOv8s is still a continuation of the neck structure in YOLOv5, where the FPN + PAN structure is used to complete the integration of features extracted by the backbone at varying stages to enhance the model’s ability to identify features at varying scales. More and more structures about neck have been proposed to enhance the neck for full integration between multi-scale information, but also increase the computational cost simultaneously. In our study, we opted not to design novel neck modules to circumvent additional connections and fusions among feature pyramids. DAMO-YOLO [44] proposed a new EfficientRepGFPN based on GFPN, which significantly improves the accuracy of the model by utilizing various scales of feature maps for different channel dimensions in feature fusion.
The RFN is illustrated in Figure 5. Input is composed of three layers, and 1 × 1 Conv adjusts the number of channels on two parallel branches after Concat. Multiple Rep 3 × 3 Conv and 3 × 3 Conv form the efficient layer aggregation network (ElAN) [16]. RepConv is a model re-referencing technique that improves the efficiency and performance of models by merging multiple computational modules into one during the inference phase. ELAN fuses features from different layers by introducing a multi-scale feature fusion module. This can make full use of different levels of semantic information to enhance the ability to demonstrate the model's features. Due to the RFN incorporating RepConv and ELAN, the RFN can achieve much higher precision without bringing an extra computational burden.
Inspired by RFN, we redesigned the neck in WFRE-YOLOv8s based on the design idea of the DAMO-YOLO network and replaced the C2f with RFN in the neck part of the initial network, which brings the higher accuracy and real-time detection of the whole detection network. The improved neck is shown in Figure 6.

3.2.4. Integration of EMA

Attention is widely used in computer vision, and incorporating attention into a network enables it to pay close attention to different regions of the feature map to some extent, leading to better accuracy in target identification. Attention can be mainly classified into channel attention, spatial attention, and channel spatial attention.
Due to the complexity of steel surface defects and the low pixel size of the dataset utilized, some defects are not detected or are inaccurately detected. In this paper, we will incorporate attention into the backbone to achieve higher detection accuracy. Notably, usual attention mechanisms used include CBAM [45], SE [46], ECA [47], SA [48], CA [49], and others. However, the attention models using channel dimensionality reduction to model cross-channel relationships may bring some side effects when extracting deep visual representations. Nonetheless, an efficient multi-scale attention (EMA) [50] module based on coordinate attention (CA) is proposed to better address this issue. It encodes global information to recalibrate the channel weights in each parallel branch while further aggregating the output features of the two parallel branches through cross-dimensional interaction to capture the pixel-level pairwise relationship, achieving the goal of reducing computational overhead while preserving the information of each channel. CA attention first divides the input information according to the two directions of width and height, thus obtaining the feature information of width and height. The global average pooling formulas for both are shown in Formulas (7) and (8).
z c h ( h ) = 1 W 0 i W x c ( h , i )
z c w ( w ) = 1 W 0 i H x c ( j , w )
Next, the feature maps of the global perceptual field in both the width and height directions are spliced, and feature transformations are performed using 1 × 1 convolution, batch normalization algorithm, and nonlinear activation. Immediately after that, the feature transformation is achieved by 1 × 1 convolution and Sigmoid activation function so that its dimension is the same as the input X vector, and then the attentional weights gh and gw are computed for the achieved feature maps in the width direction and height direction. Finally, the output gh and gw are combined into a weight matrix by weighted multiplication computation on the original feature maps, and the result is shown in Formula (9). CA is shown in Figure 7a.
EMA borrows the idea of CA and designs three parallel routes to extract the attention weight descriptors of grouped feature maps. The two routes on the left, similar to CA, are named 1 × 1 branches and the rightmost route is named 3 × 3 branch.
y c ( i , j ) = x c ( i , j ) × g c h ( i ) × g c w ( j )
In the 1 × 1 branch, similar to CA attention, the X and Y global average pooling module is used to extract feature information in the width and height directions, the feature information is spliced, and 1 × 1 convolution is used to prevent dimensionality reduction. The 3 × 3 branch utilizes the 3 × 3 convolution to capture local cross-channel interactions to expand the feature space.
In the cross-space learning module, the global spatial information in the output of the 1 × 1 branch is first encoded using global average pooling, after which a Softmax function is fitted to the linear transform to ensure efficient computation. Finally, the output of the parallel processing is multiplied by the matrix dot product operation to obtain the first spatial attention map.
Then, the second spatial attention map retaining the exact spatial location information is obtained by employing global average pooling and fitting a linear transformation with the Softmax function at the 3 × 3 branch. Finally, the output feature maps for each group are calculated by summing the two spatial attention weight values that were generated using the sigmoid function. The global average pooling operates as shown in Formula (10).
z c ( h ) = 1 H × W j H i W x c ( i , j )
As shown in Figure 8, the EMA attention is incorporated prior to the spatial pyramid pooling module of the YOLOv8s backbone network. This integration boosts the accuracy of WFRE-YOLOv8s for identifying surface flaws in steel. Additionally, this enhancement is accomplished without placing additional computational burden on the network infrastructure.

4. Experiments

4.1. Experimental Introduction

4.1.1. Experimental Setup

The running environment of the experiment is as follows: the operating system is Windows 10 Professional, the CPU is Intel I5-12490F, the GPU is NVIDIA GeForce RTX3060 12 G, and the RAM is 16 G. Some specific functions may be missing between versions causing the environment to crash. The version of Python and the version of Torch, CUDA, and CUDNN must match, or else the model will not start running. Therefore, the Python environment is based on Anaconda’s Python 3.8, the Pytorch version is 1.9, the CUDA version is 11.5, and the CUDNN version is 8005.
The specific training parameters are set as follows: the image size is 640 × 480, the initial learning rate is 0.01, the number of iterations is 200, the batch size is 16, Num_Workers is 2, and the mosaic enhancement is turned off after 190 epoch.

4.1.2. Evaluation Indicators

In this study, mAP (mean average precision), recall, precision, parameters, and FLOPs were used to evaluate the performance of the improved algorithm. The formula for calculating the mean values of recall, precision, and mAP are shown:
Recall = TP TP + FN
Precision = TP TP + FP
AP = 0 1 P ( R ) d R
mAP = 1 N i = 1 N A P i
where TP represents the number of road objects predicted correctly, FP represents the number of road objects predicted incorrectly, and FN represents the number of road objects missed. P(R) represents the value of precision under the point recall.

4.1.3. Dataset

Due to the fact that the images in the NEU-DET dataset are derived from the real steelmaking process, its defects are closer to the actual situation; this is the reason why we use the NEU-DET to validate the effectiveness of WFRE-YOLOv8s. GC10-DET contains a wider variety of metal surface defects, it can help validate the model's versatility and robustness across a broader range of defect categories. We applied mosaic image enhancement to the NEU-DET and GC10-DET. NEU-DET [51] was proposed by the team of Kechen Song at Northeastern University in 2022. NEU-DET includes six types of steel surface defects, namely, patches (pa), silvering (cr), inclusions (in), roll marks (rs), scratches (sc), and pitting surfaces (ps). The number of images per defect category is 300 and the resolution of each image is 200 × 200. The ratio of the training set to the validation set of NEU-DET is set as 9:1, which means there are 1620 images for training and 180 images for validation. GC10-DET [52] was proposed by the team of Xiaoming Lv in 2020. GC10-DET consists of ten types of metallic surface defects, namely, water spot (ws), punching (pu), silk spot (ss), crescent gap (cg), oil spot (os), waist folding (wf), inclusion (in), rolled pit (rp), crease (cr), and weld line (wl). The GC10-DET has 2294 images, and the resolution of each image is 2048 × 1000. The ratio of the training set to the validation set of GC10-DET is set as 9:1, which means there are 2064 images for training and 230 images for validation.

4.1.4. Experimental Datum Processing

After completing training for each model, a result folder is generated, and a new folder for organizing experimental data is created on the computer. Subclass folders are then created based on different models. To ensure data authenticity, we conducted 20 training sessions for each model and uniformly stored the results in the subclass folder. The final experimental result is determined as the closest result to the average.

4.2. Comparisons with Related Methods

4.2.1. Comparisons with Prevailing Methods on NEU-DET

To evaluate the effectiveness of WFRE-YOLOv8s, we compare our method with several mainstream methods. The YOLO algorithms are now commonly used in various fields. At present, most researchers have also adopted the YOLO algorithm to design steel defect detectors. Furthermore, WFRE-YOLOv8s is based on YOLOv8, so in order to ensure the objectivity of the experiments, we chose these algorithms as the comparative objects. These methods include YOLOv3s, YOLOv4, YOLOv5s, YOLOv7, YOLOv8s, YOLOv8m, and YOLOv8L.
It is evident from the data presented in Figure 9b and Table 2 that the model introduced in this study outperforms others in terms of mAP0.5 and mAP0.95. Compared to YOLOv8s, the mAP0.5 and mAP0.95 have increased by 4.7% and 2.3%, respectively, while the number of parameters and FLOPs have only increased by 20% and 13%. Compared to YOLOv8L, which has the highest accuracy among other models, WFRE-YOLOv8s is 1.2% and 1.4% higher on mAP0.5 and mAP0.95, respectively, and the number of parameters and the FLOPs in WFRE-YOLOv8s are 68.5% and 80.3% lower than in YOLOv8L. Compared to the well-known YOLOv3s and YOLOv5, our proposed WFRE-YOLOv8s is higher than these two models by 27.5% and 20.7% and 9.9% and 7.7% on mAP0.5 and mAP0.95, respectively. Furthermore, WFRE-YOLOv8s outperforms YOLOv4 and YOLOv7 in terms of mAP0.5 and mAP0.95 while utilizing significantly fewer parameters and FLOPs. Additionally, the mAP0.5 of WFRE-YOLOv8s is 10% higher than that of YOLOv4 and 5.7% higher than that of YOLOv7. Therefore, the WFRE-YOLOv8s proposed in this paper can achieve good accuracy and maintain good detection results with the average number of parameters and computational effort.

4.2.2. Comparisons with Prevailing Methods on GC10-DET

For further exploration of the effectiveness of WFRE-YOLOv8s, we conducted some experiments on GC10-DET. The results of detection are shown in Table 3. We can still observe a 3.8% increase of mAP0.5 in favor of WFRE-YOLOv8s over YOLOv8s, indicating that WFRE continues to outperform YOLOv8s. Meanwhile, the number of parameters and FLOPs have only increased by 23.8% and 14.3%. Compared to YOLOv3s and YOLOv5s, WFRE-YOLOv8s is still superior to both models in terms of mAP0.5 and mAP0.95. The mAP0.5 of WFRE-YOLOv8s is 8.9%, 5.2%, 2.4%, and 0.8% higher than YOLOv4, YOLOv7, YOLOv8m, and YOLOv8L, respectively. From the above data, WFRE-YOLOv8s is not only effective for detecting the six types of defects in NEU-DET but also has good effectiveness for detecting the ten types of defects in GC10-DET.

4.2.3. Experimental Comparison on Different Datasets

For further exploration of the versatility and robustness of WFRE on different classes of defects, we also conducted experiments on the Lv-DET [53] and PKU-Market-PCB datasets [54], and the specific experimental results as well as the performance are shown in Table 4.
From Table 4, we can find that WFRE-YOLOv8s outperforms YOLOv8s on different datasets. On NEU-DET and GC10-DET, the mAP0.5 of WFRE-YOLOv8s is 4.7% and 3.8% higher than YOLOv8s. On the other hand, our models have achieved excellent results in the detection of non-steel defects. In aluminum defect detection, the mAP0.5 of WFRE-YOLOv8 is 2.8% higher YOLOv8s. In pcb defect detection, the mAP0.5 of WFRE-YOLOv8s is 3.3% higher than YOLOv8s. From the above comparative experimental results, our proposed model has good versatility and robustness.

4.3. Ablation Experiments

To verify whether our proposed method is stable and effective, we conducted ablation experiments on the NEU-DET, and the specific experimental comparison results are shown in Table 5 and Figure 9. The YOLOv8s model is the baseline model. Firstly, in order to validate the effectiveness of the WIoU loss function in the model proposed in this paper, the WIoU loss function is used to replace the CIoU loss function, and the model is named W-YOLOv8s. Secondly, the CFN module proposed in this paper is utilized to replace the C2f module in the backbone, and the model is named WF-YOLOv8s. Thirdly, the RFN module is introduced into the neck, and the module is utilized to replace the C2f module, and the model is named WFR-YOLOv8s. Finally, an EMA attentional mechanism is incorporated into the WFR-YOLOv8s. The addition of EMA improves the extraction of valuable features and overall detection accuracy of the whole model. The model resulting from this adjustment is dubbed WFRE-YOLOv8s.

4.3.1. The Performance of WIoU

As shown in Table 5, after we improve the original loss function CIoU to WIoU, the mAP0.5 of the model reaches 75.6%, which is an improvement of 0.9% compared to the original model. The number of parameters for the network and the amount of computation do not change, which shows that the WIoU loss function effectively solves the imbalance between high-quality and low-quality data in the steel surface defects dataset.

4.3.2. The Performance of RFN

As can be seen from Table 5, after replacing the original C2f module with the proposed CFN module in W-YOLOv8s, the mAP0.5 is increased from 75.6% to 76.6%. The number of parameters and FLOps are decreased by 15% and 18%, respectively. This dramatically proves that the CFN module proposed in this paper has a strong compression effect on the number of parameters and FLOPs of the model. At the same time, it can also improve the detection accuracy of the model.

4.3.3. The Performance of CFN

As can be seen in Table 5, after replacing the C2f in the neck with our proposed RFN module in WF-YOLOv8s, the mAP0.5 improves by 1.5% to 78.1%, which indicates that the RFN structure can effectively enhance the detection accuracy of the network.

4.3.4. The Performance of EMA Attention

From Table 5, it can be seen that WFRE-YOLOv8s, compared to WFR-YOLOv8s, incorporates the EMA attention module in the network’s backbone to enhance the network’s ability to extract features of defects in low-pixel images to improve the model’s detection accuracy without increasing the network’s computational burden too much. The mAP0.5 increased by 1.3% to reach 79.4%, and the number of parameters and computation of the model only increased by 0.9% and 1.2%.

4.4. Comprehensive Performance of the Proposed Model

The results of detecting defects in NEU-DET using YOLOv8s and WFRE-YOLOv8s are illustrated in Figure 9. The results include predicted boxes, defect classes, and confidence scores. The results of detecting each type of defect using YOLOv8s and YOLOv7 are shown in Table 6.
From Figure 9, it is evident that our WFRE-YOLOv8s can detect crazing, patches, and rolled-scale defect targets more accurately than YOLOv8s, which missed one defect target. The target missed by YOLOv8s is well-detected, and our detection accuracy is also improved based on YOLOv8s. On the two defective targets of inclusion and pitted surface, the detection accuracy of WFRE-YOLOv8s is improved compared to YOLOv8s, and the accuracy of the same target is improved by 30% and 20%. On the defective target of scratches, the original YOLOv8s had the problem of misidentification in the detection result. However, WFRE-YOLOv8s solved this problem by accurately identifying the defects of the two scratches on this image. Figure 9 and Table 6 show that the WFRE-YOLOv8s proposed in this paper is more advanced and accurate compared to the YOLOv8s, which have better results.

4.5. Discussion

4.5.1. Findings

In our study, we found that the design of the backbone network is crucial, and the backbone network of WFRE-YOLOv8s can be reconfigured by CFN and EMA to be much more efficient than the detection of YOLOv8. The design of the neck cannot only focus on the design of the feature pyramid structure but also on the feature fusion effect of the model.
From Table 2, Table 3, Table 4 and Table 5, and Figure 9, we can find that WFRE-YOLOv8s is not only better than the original model in terms of detection metrics, but also in terms of actual detection results. The newly added EMA attention better focuses on the features that would be missed by the original model, improving the model's overall detection results.
According to the experimental results, in our opinion, as much as possible, it is important to design a unique structure to focus on those features that are easily overlooked. It is also necessary to try to keep the detection network as efficient as possible, rather than trying to increase the accuracy of the network by designing more parameter-heavy structures, only to result in increased redundancy in the network. In steel production, crazing and rolled-in scale are two types of defects that are easily overlooked, so these two types of features are needed in the design of the network for the design of a targeted feature extraction structure. In terms of datasets, the current size of datasets is still far from enough; we need to increase the expansion of datasets, enrich the samples of various types of defects, and improve the quality of datasets.

4.5.2. Limitations and Future Works

Compared to existing methods, WFRE-YOLOv8s is a highly competitive steel defect detector that has performed well on NEU-DET. However, the limitations of WFRE-YOLOv8s are still apparent in Figure 9 and Table 6, as evidenced by the results of detecting defects. According to the results of detecting the crazing and rolled-in scale, we can find that its accuracy is still not as good as the other categories. This suggests that WFRE-YOLOv8s is not yet adequate in identifying these two defects and has substantial scope for improvement. It appears that the lower resolution of the dataset images and the indistinctive characteristics of these two defects may be responsible for the issue at hand. Regarding data preprocessing, it may be beneficial to employ certain image preprocessing techniques and increase the number of datasets to enhance the model's ability to detect crazing and other categories of defects.
Additionally, Table 3 reveals that while the computational effort and FLOPs of WFRE-YOLOv8s are lower compared to most YOLO models, the WFRE-YOLOv8s model still requires compression due to its use in industrial production. It is clear from Table 3 that WFRE-YOLOv8s currently has a significant number of parameters. Despite being efficient on devices with higher arithmetic capabilities, it poses a challenge when running on edge terminal devices. Given that industrial production necessitates a large number of steel defect detection sensors, increasing the deployment of high-performance computing equipment would lead to higher expenses. Thus, it is necessary to compress the number of parameters in WFRE-YOLOv8s to enhance algorithmic efficiency and lower the production costs of businesses. WFRE-YOLOv8s could benefit from being optimized further through the implementation of a lightweight convolutional backbone network, pruning, and distillation.

5. Conclusions

In response to the steel used in the production process, manual quality inspection is inefficient, the traditional machine learning quality inspection method generalization and robustness is poor, and so on. In this paper, we propose a novel one-stage detector named WFRE-YOLOv8s for steel surface defect detection, which is based on YOLOv8s with improvements in the backbone, neck, loss function, and integration of the current better EMA attention module. To solve the problem of imbalance between high-quality and low-quality data in the steel dataset, we introduce the WIoU loss function to replace the CIoU loss function. In order to reduce the amount of computation and the number of parameters in the model and keep the accuracy from being degraded, we adopt the CFN module as the main component of the backbone of WFRE-YOLOv8s. In the neck, we adopt the RFN module to reduce the computational overhead while fusing different scale features well, resulting in improved detection accuracy and real-time detection speed of the network. In addition, we also incorporate the EMA attention module in the backbone part of the play network, which can enhance the extraction of adequate feature information and thus enhance the detection accuracy of the network and solve the problem of some defects being missed and wrongly detected in the solution process. In order to validate our proposed WFRE-YOLOv8s, we conducted a series of experiments on NEU-DET and not only ablation experiments but also a comparison with other SOTA target detection models. The ablation experiments proved the effectiveness of our proposed improved module, and the comparison experiments with other SOTA models proved the effectiveness of our proposed model. In comparison with other methods, WFRE-YOLOv8s achieved better performance than other models, with higher scores than others in mAP0.5 and mAP0.95.
For WFRE-YOLOv8s, with crazing and rolled-in scale, there is still the problem that detection accuracy is lower than other categories. Additionally, there is still room for compression in terms of the number of model parameters and FLOPs. Moving forward, we will focus on enhancing the ability of the model to detect defects in all categories and designing a more lightweight model.

Author Contributions

Conceptualization, Y.H. and L.W.; methodology, Y.H. and L.W.; software, Y.H., W.T. and L.W.; validation, Y.H., L.L. and L.W.; formal analysis, Y.H., L.L. and L.W.; investigation, Y.H. and L.W.; resources, Y.H., L.L. and L.W.; data curation, Y.H.; writing—original draft preparation, Y.H.; writing—review and editing, Y.H., L.L. and L.W.; visualization, Y.H.; supervision, L.L. and L.W. All authors have read and agreed to the published version of the manuscript.

Funding

This research was funded by Scientific Research Program of Liaoning Provincial Department of Education (LFW202003).

Institutional Review Board Statement

Not applicable.

Informed Consent Statement

Not applicable.

Data Availability Statement

Data are contained within the article.

Conflicts of Interest

The authors declare no conflict of interest.

References

  1. Di, H.; Ke, X.; Peng, Z.; Dongdong, Z. Surface defect classification of steels with a new semi-supervised learning method. Opt. Lasers Eng. 2019, 117, 40–48. [Google Scholar] [CrossRef]
  2. Lee, S.Y.; Tama, B.A.; Moon, S.J.; Lee, S. Steel surface defect diagnostics using deep convolutional neural network and class activation map. Appl. Sci. 2019, 9, 5449. [Google Scholar] [CrossRef]
  3. Xu, Y.; Li, D.; Xie, Q.; Wu, Q.; Wang, J. Automatic defect detection and segmentation of tunnel surface using modified Mask R-CNN. Measurement 2021, 178, 109316. [Google Scholar] [CrossRef]
  4. Zhou, A.; Zheng, H.; Li, M.; Shao, W. Defect Inspection Algorithm of Metal Surface Based on Machine Vision. In Proceedings of the 2020 12th International Conference on Measuring Technology and Mechatronics Automation (ICMTMA), Phuket, Thailand, 28–29 February 2020; pp. 45–49. [Google Scholar]
  5. Tang, J.; Liu, S.; Zhao, D.; Tang, L.; Zou, W.; Zheng, B. PCB-YOLO: An Improved Detection Algorithm of PCB Surface Defects Based on YOLOv5. Sustainability 2023, 15, 5963. [Google Scholar] [CrossRef]
  6. Liao, X.; Lv, S.; Li, D.; Luo, Y.; Zhu, Z.; Jiang, C. Yolov4-mn3 for pcb surface defect detection. Appl. Sci. 2021, 11, 11701. [Google Scholar] [CrossRef]
  7. Liu, Z.; Qu, B. Machine vision based online detection of PCB defect. Microprocess. Microsyst. 2021, 82, 103807. [Google Scholar] [CrossRef]
  8. Zhang, J.; Xu, J.; Zhu, L.; Zhang, K.; Liu, T.; Wang, D.; Wang, X. An improved MobileNet-SSD algorithm for automatic defect detection on vehicle body paint. Multimed. Tools Appl. 2020, 79, 23367–23385. [Google Scholar] [CrossRef]
  9. Kieselbach, K.K.; Nöthen, M.; Heuer, H. Development of a visual inspection system and the corresponding algorithm for the detection and subsequent classification of paint defects on car bodies in the automotive industry. J. Coat. Technol. Res. 2019, 16, 1033–1042. [Google Scholar] [CrossRef]
  10. Liu, W.; Anguelov, D.; Erhan, D.; Szegedy, C.; Reed, S.; Fu, C.Y.; Berg, A.C. Ssd: Single shot multibox detector. In Proceedings of the European Conference on Computer Vision, Amsterdam, The Netherlands, 11–14 October 2016; pp. 21–37. [Google Scholar]
  11. Redmon, J.; Divvala, S.; Girshick, R.; Farhadi, A. You only look once: Unified, real-time object detection. In Proceedings of the IEEE Conference on Computer Vision and Pattern Recognition, Las Vegas, NV, USA, 27–30 June 2016; pp. 779–788. [Google Scholar]
  12. Redmon, J.; Farhadi, A. Yolov3: An incremental improvement. arXiv 2018, arXiv:1804.02767. [Google Scholar]
  13. Bochkovskiy, A.; Wang, C.Y.; Liao, H.Y.M. Yolov4: Optimal speed and accuracy of object detection. arXiv 2020, arXiv:2004.10934. [Google Scholar]
  14. Jocher, G. Stoken Yolov5. Available online: https://github.com/ultralytics/yolov5/releases/tag/v6.0 (accessed on 26 October 2022).
  15. Li, C.; Li, L.; Jiang, H.; Weng, K.; Geng, Y.; Li, L.; Ke, Z.; Li, Q.; Cheng, M.; Nie, W.; et al. YOLOv6: A single-stage object detection framework for industrial applications. arXiv 2022, arXiv:2209.02976. [Google Scholar]
  16. Wang, C.Y.; Bochkovskiy, A.; Liao, H.Y.M. YOLOv7: Trainable bag-of-freebies sets new state-of-the-art for real-time object detectors. In Proceedings of the IEEE/CVF Conference on Computer Vision and Pattern Recognition, Vancouver, BC, Canada, 18–22 June 2023; pp. 7464–7475. [Google Scholar]
  17. Girshick, R.; Donahue, J.; Darrell, T.; Malik, J. Rich Feature Hierarchies for Accurate Object Detection and Semantic Segmentation. In Proceedings of the IEEE Conference on Computer Vision and Pattern Recognition, New York, NY, USA, 23–28 June 2014; pp. 580–587. [Google Scholar]
  18. Girshick, R. Fast r-cnn. In Proceedings of the IEEE International Conference on Computer Vision, Santiago, Chile, 7–13 December 2015; pp. 1440–1448. [Google Scholar]
  19. Ren, S.; He, K.; Girshick, R.; Sun, J. Faster r-cnn: Towards Real-time Object Detection with Region Proposal Networks. Adv. Neural Inf. Process. Syst. 2015, 28, 1–9. [Google Scholar] [CrossRef] [PubMed]
  20. Dai, J.; Li, Y.; He, K.; Sun, J. R-FCN: Object Detection Via Region-Based Fully Convolutional Networks. Adv. Neural Inf. Process. Syst. 2016, 29, 379–387. [Google Scholar]
  21. Pernkopf, F. Detection of surface defects on raw steel blocks using Bayesian network classifiers. Pattern Anal. Appl. 2004, 7, 333–342. [Google Scholar] [CrossRef]
  22. Yun, J.P.; Choi, S.; Kim, S.W. Vision-based defect detection of scale-covered steel billet surfaces. Opt. Eng. 2009, 48, 037205. [Google Scholar] [CrossRef]
  23. Song, K.; Hu, S.; Yan, Y.; Li, J. Surface Defect Detection Method Using Saliency Linear Scanning Morphology for Silicon Steel Strip under Oil Pollution Interference. ISIJ Int. 2014, 54, 2598–2607. [Google Scholar] [CrossRef]
  24. Tian, S.; Xu, K. An algorithm for surface defect identification of steel plates based on genetic algorithm and extreme learning machine. Metals 2017, 7, 311. [Google Scholar] [CrossRef]
  25. Wang, Y.; Xia, H.; Yuan, X.; Li, L.; Sun, B. Distributed defect recognition on steel surfaces using an improved random forest algorithm with optimal multi-feature-set fusion. Multimed. Tools Appl. 2018, 77, 16741–16770. [Google Scholar] [CrossRef]
  26. Gong, R.; Wu, C.; Chu, M. Steel surface defect classification using multiple hyper-spheres support vector machine with additional information. Chemom. Intell. Lab. Syst. 2018, 172, 109–117. [Google Scholar] [CrossRef]
  27. Chu, M.; Liu, X.; Gong, R.; Liu, L. Multi-class classification method using twin support vector machines with multi-information for steel surface defects. Chemom. Intell. Lab. Syst. 2018, 176, 108–118. [Google Scholar] [CrossRef]
  28. Zhang, J.; Wang, H.; Tian, Y.; Liu, K. An accurate fuzzy measure-based detection method for various types of defects on strip-steel surfaces. Comput. Ind. 2020, 122, 103231. [Google Scholar] [CrossRef]
  29. Ji, Y.; Liu, S.; Zhou, M.; Zhao, Z.; Guo, X.; Qi, L. A machine learning and genetic algorithm-based method for predicting width deviation of hot-rolled strip in steel production systems. Inf. Sci. 2022, 589, 360–375. [Google Scholar] [CrossRef]
  30. Bulnes, F.G.; Garcia, D.F.; Javier De la Calle, F.; Usamentiaga, R.; Molleda, J. A non-invasive technique for online defect detection on steel strip surfaces. J. Nondestruct. Eval. 2016, 35, 1–18. [Google Scholar] [CrossRef]
  31. Guan, S.; Lei, M.; Lu, H. A steel surface defect recognition algorithm based on improved deep learning network model using feature visualization and quality evaluation. IEEE Access 2020, 8, 49885–49895. [Google Scholar] [CrossRef]
  32. Xiao, L.; Wu, B.; Hu, Y. Surface defect detection using image pyramid. IEEE Sens. J. 2020, 20, 7181–7188. [Google Scholar] [CrossRef]
  33. Zhao, W.; Chen, F.; Huang, H.; Li, D.; Cheng, W. A new steel defect detection algorithm based on deep learning. Comput. Intell. Neurosci. 2021, 2021, 1–13. [Google Scholar] [CrossRef]
  34. Zhao, C.; Shu, X.; Yan, X.; Zuo, X.; Zhu, F. RDD-YOLO: A modified YOLO for detection of steel surface defects. Measurement 2023, 214, 112776. [Google Scholar] [CrossRef]
  35. Wang, L.; Liu, X.; Ma, J.; Su, W.; Li, H. Real-Time Steel Surface Defect Detection with Improved Multi-Scale YOLO-v5. Processes 2023, 11, 1357. [Google Scholar] [CrossRef]
  36. Li, M.; Wang, H.; Wan, Z. Surface defect detection of steel strips based on improved YOLOv4. Comput. Electr. Eng. 2022, 102, 108208. [Google Scholar] [CrossRef]
  37. Liu, G.H.; Chu, M.X.; Gong, R.F.; Zheng, Z.H. DLF-YOLOF: An improved YOLOF-based surface defect detection for steel plate. J. Iron Steel Res. Int. 2023, 1–10. [Google Scholar] [CrossRef]
  38. Wang, R.-J.; Liang, F.-L.; Mou, X.-W.; Chen, L.-T.; Yu, X.-Y.; Peng, Z.-J.; Chen, H.-Y. Development of an Improved YOLOv7-Based Model for Detecting Defects on Strip Steel Surfaces. Coatings 2023, 13, 536. [Google Scholar] [CrossRef]
  39. Shao, Y.; Fan, S.; Sun, H.; Tan, Z.; Cai, Y.; Zhang, C.; Zhang, L. Multi-Scale Lightweight Neural Network for Steel Surface Defect Detection. Coatings 2023, 13, 1202. [Google Scholar] [CrossRef]
  40. Li, X.; Wang, W.; Wu, L.; Chen, S.; Hu, X.; Li, J.; Tang, J.; Yang, J. Generalized Focal Loss: Learning Qualified and Distributed Bounding Boxes for Dense Object Detection. arXiv 2020, arXiv:2006.04388. [Google Scholar]
  41. Zheng, Z.; Wang, P.; Liu, W.; Li, J.; Ye, R.; Ren, D. Distance-IoU loss: Faster and better learning for bounding box regression. In Proceedings of the AAAI Conference on Artificial Intelligence, New York, NY, USA, 7–12 February 2020; pp. 12993–13000. [Google Scholar]
  42. Tong, Z.; Chen, Y.; Xu, Z.; Yu, R. Wise-IoU: Bounding Box Regression Loss with Dynamic Focusing Mechanism. arXiv 2023, arXiv:2301.10051. [Google Scholar]
  43. Chen, J.; Kao, S.-H.; He, H.; Zhuo, W.; Wen, S.; Lee, C.-H.; Chan, S.-H.G. Run, Don’t walk: Chasing higher FLOPs for faster neural networks. In Proceedings of the IEEE/CVF Conference on Computer Vision and Pattern Recognition, Vancouver, BC, Canada, 18–22 June 2023. [Google Scholar]
  44. Xu, X.; Jiang, Y.; Chen, W.; Huang, Y.; Zhang, Y.; Sun, X. DAMO-YOLO: A Report on Real-Time Object Detection Design. arXiv 2022, arXiv:2211.15444. [Google Scholar]
  45. Woo, S.; Park, J.; Lee, J.Y.; Kweon, I.S. Cbam: Convolutional block attention module. In Proceedings of the European Conference on Computer Vision, Munich, Germany, 8–14 September 2018; pp. 3–19. [Google Scholar]
  46. Hu, J.; Shen, L.; Sun, G. Squeeze-and-excitation networks. In Proceedings of the IEEE Conference On Computer Vision and Pattern Recognition, New York, NY, USA, 18–23 June 2018; pp. 7132–7141. [Google Scholar]
  47. Wang, Q.; Wu, B.; Zhu, P.; Li, P.; Zuo, W.; Hu, Q. ECA-Net: Efficient Channel Attention for Deep Convolutional Neural Networks. In Proceedings of the IEEE/CVF Conference on Computer Vision and Pattern Recognition, Seattle, WA, USA, 13–19 June 2020; pp. 11531–11539. [Google Scholar]
  48. Hou, Q.; Zhou, D.; Feng, J. Coordinate attention for efficient mobile network design. In Proceedings of the IEEE/CVF Conference on Computer Vision and Pattern Recognition, Nashville, TN, USA, 20–25 June 2021; pp. 13713–13722. [Google Scholar]
  49. Zhang, Q.L.; Yang, Y.B. Sa-net: Shuffle attention for deep convolutional neural networks. In Proceedings of the IEEE International Conference on Acoustics, Speech and Signal Processing, Toronto, ON, Canada, 6–11 June 2021; pp. 2235–2239. [Google Scholar]
  50. Li, X.; Zhong, Z.; Wu, J.; Yang, Y.; Lin, Z.; Liu, H. Expectation-maximization attention networks for semantic segmentation. In Proceedings of the IEEE/CVF International Conference on Computer Vision, Seoul, Republic of Korea, 27 October–2 November 2019; pp. 9167–9176. [Google Scholar]
  51. Available online: http://faculty.neu.edu.cn/songkechen/zh_CN/zdylm/263270/list/index.html (accessed on 12 December 2022).
  52. Lv, X.; Duan, F.; Jiang, J.-J.; Fu, X.; Gan, L. Deep Metallic Surface Defect Detection: The New Benchmark and Detection Network. Sensors 2020, 20, 1562. [Google Scholar] [CrossRef]
  53. Available online: https://tianchi.aliyun.com/competition/entrance/231682/information (accessed on 15 August 2018).
  54. Huang, W.; Wei, P. A PCB Dataset for Defects Detection and Classification. arXiv 2019, arXiv:1901.08204. [Google Scholar]
Figure 1. YOLOv8s structure. The w is the width of network and r is the ratio. (ac) represent the structure of YOLOv8s. (dg) represent the structure of Detect, SPPF, CBS, and C2f.
Coatings 13 02011 g001
Figure 2. WFRE-YOLOv8s structure. CFN and RFN are proposed for the first time. The EMA is introduced into the backbone for the first time.
Coatings 13 02011 g002
Figure 3. The structure of FastNet, FasterNet Block, and PConv. (ac) represent the structure of FastNet, Pconv, and FastNet Block, respectively. * represent the convolution.
Coatings 13 02011 g003
Figure 4. The structure of CFN. CFN is proposed for the first time in this paper, composed of the CBS, FastNet Block, and Concat. The core of CFN is FastNet Block; it can effectively reduce the number of FLOPs and parameters.
Coatings 13 02011 g004
Figure 5. The structure of RFN.
Coatings 13 02011 g005
Figure 6. The improved neck.
Coatings 13 02011 g006
Figure 7. CA and EMA. This figure illustrates the difference in structure between CA and EMA. The structure of CA and EMA is shown in (a,b).
Coatings 13 02011 g007
Figure 8. EMA module added to the backbone network. This figure shows where EMA is located in the backbone network.
Coatings 13 02011 g008
Figure 9. Comparison of detection results on NEU-DET. (a) YOLOv8s recognition effect. (b) Improved recognition of WFRE-YOLOv8s. (a) shows the detection results of YOLOv8s on NEU-DET. (b) shows the detection results of WFRE-YOLOv8s on NEU-DET.
Coatings 13 02011 g009
Table 1. The performance comparison of different models of YOLOv8.
ModelSize
(Pixels)
mAP
(0.5:0.95)
Parameters
(M)
FLOPs
(G)
Speed
(ms)
YOLOv8n640 × 64037.33.28.70.99
YOLOv8s640 × 64044.911.211.21.20
YOLOv8m640 × 64050.225.925.91.83
YOLOv8L640 × 64052.943.743.72.39
YOLOv8x640 × 64053.968.268.23.53
Table 2. Comparison of different network performances on NEU-DET. This table illustrates the experimental results of the different methods on NEU-DET. (The indicator of focus is mAP (0.5)).
ModelmAP
(0.5)
mAP (0.5:0.95)RecallPrecisionParametersFLOPs
(G)
YOLOv3s51.9%21.8%45.4%49.5%932238723.4
YOLOv469.4%33.8%79.3%53.1%63964611142
YOLOV5s69.5%34.8%72.7%60.8%702630715.8
YOLOv773.7%34.4%68.6%66.3%37223526105.2
YOLOv8s (baseline)74.7%39.4%69.0%69.1%1112790628.4
YOLOv8m76.7%41.1%69.2%74.5%2584323478.7
YOLOv8L78.2%41.1%71.0%75.8%43611234164.8
WFRE-YOLOv8s (ours)79.4%42.5%75.9%73.6%1377547232.6
Table 3. Comparison of different network performances on GC10-DET. This table illustrates the experimental results of the different methods on GC10-DET. (The indicator of focus is mAP (0.5)).
ModelmAP
(0.5)
mAP (0.5:0.95)RecallPrecisionParametersFLOPs
(G)
YOLOv3s55.0%27.3%58.0%51.4%%933317523.4
YOLOv460.5%30.4%68.0%46.1%808183120.6
YOLOv5s63.3%33.0%54.7%69.2%703709515.8
YOLOv764.2%32.1%57.8%69.3%37245102105.3
YOLOv8s (baseline)65.6%34.9%61.6%29.9%1112945428.5
YOLOv8m67.0%35.0%55.5%81.0%2584555078.7
YOLOv8L68.6%36.5%73.0%60.7%43637550165.48
WFRE-YOLOv8s (ours)69.4%35.7%62.6%64.8%1377547232.6
Table 4. Comparison of experimental results for different datasets. This table shows a comparison of the experimental results of YOLOv8s and WFRE-YOLOv8s on different defective datasets.
ModelModelmAP (0.5)mAP (0.5:0.95)
NEU-DETYOLOv8s74.7%39.4%
WFRE-YOLOv8s79.4%42.5%
GC10-DETYOLOv8s65.6%34.9%
WFRE-YOLOv8s69.4%35.7%
Lv-DETYOLOv8s56.4%34.5%
WFRE-YOLOv8s59.2%35.4%
PCBYOLOv8s82.0%42.7%
WFRE-YOLOv8s85.3%44.0%
Table 5. Ablation experiments. This table illustrates the experimental results of the different stages of the improved methodology. (The indicator of focus is mAP (0.5)).
ModelmAP
(0.5)
mAP (0.5:0.95)RecallPrecisionParametersFLOPs
(G)
YOLOv8s74.7%39.4%69.0%69.1%1112790628.4
W-YOLOv8s75.6%40.6%70.7%69.8%1112790628.4
WF-YOLOV8s76.6%41.2%71.4%71.1%943446623.5
WFR-YOLOv8s78.1%41.8%72.8%73.2%1364438632.2
WFRE-YOLOv8s79.4%42.5%75.9%73.6%1377547232.6
Table 6. Comparison of detection results of improved algorithms.
ModelmAP
(0.5)
CrazingInclusionPatchesPitted SurfaceRolled-in ScaleScratches
YOLOv8s (baseline)74.7%43.6%82.2%94.0%78.1%66.8%83.3%
WFRE-YOLOv8s (ours)79.4%60.0%81.4%93.8%82.5%73.8%84.8%
Disclaimer/Publisher’s Note: The statements, opinions and data contained in all publications are solely those of the individual author(s) and contributor(s) and not of MDPI and/or the editor(s). MDPI and/or the editor(s) disclaim responsibility for any injury to people or property resulting from any ideas, methods, instructions or products referred to in the content.

