Article

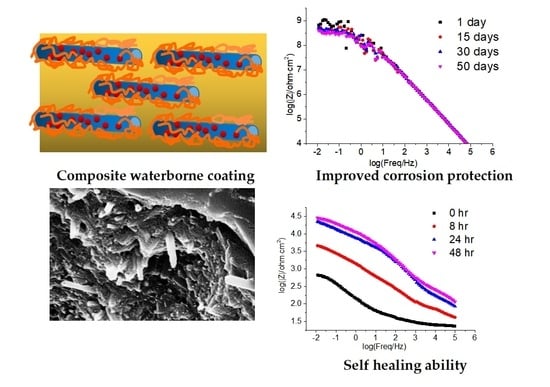
Improving the Protection Performance of Waterborne Coatings with a Corrosion Inhibitor Encapsulated in Polyaniline-Modified Halloysite Nanotubes

1
State Grid Shandong Electric Power Research Institute, Jinan 250001, China
2
Shandong Smart Grid Technology Innovation Center, Jinan 250001, China
3
Department of Chemistry, State University of New York—ESF, Syracuse, NY 13210, USA
4
The Michael M. Szwarc Polymer Research Institute, Syracuse, NY 13210, USA
*
Authors to whom correspondence should be addressed.
Coatings 2023, 13(10), 1677; https://doi.org/10.3390/coatings13101677
Submission received: 16 August 2023 / Revised: 19 September 2023 / Accepted: 21 September 2023 / Published: 25 September 2023
(This article belongs to the Special Issue Self-Healing Organic-Inorganic Coatings)

Abstract

:
Organic coatings provide an effective way to improve the corrosion resistance of metals. Traditional organic varnishes, however, either contain highly polluting or toxic components or lack self-healing ability. In this article, we report a feasible method of preparing polyaniline-modified halloysite nanotubes (PANI@HNTs). They were loaded with a corrosion inhibitor, benzotriazole (BTA), and were tested as multifunctional anticorrosion additives for environmentally friendly epoxy waterborne coatings. The PANI@HNTs were formed via the in situ polymerization of aniline in the presence of halloysites. The BTA loading was then carried out and reached up to 14.5 wt.%. The BTA retention ability of the PANI@HNTs was significantly improved in comparison to that of pure HNT. Electrochemical impedance spectroscopy (EIS) tests of the coatings immersed in a 3.5 wt.% NaCl solution showed that the barrier and corrosion inhibition effects were enhanced by two to four orders of magnitude with the incorporation of BTA-loaded PANI@HNTs. The salt spray tests on artificially scratched coatings revealed that the surfaces protected by varnishes doped with the BTA-loaded PANI@HNTs exhibited the lowest degree of corrosion compared to the control samples, illustrating the self-healing potential of the modified coatings.

Graphical Abstract

1. Introduction

Metal corrosion is an inevitable natural phenomenon causing substantial economic loss each year. To prevent this process, many anticorrosion technologies have been developed. Among these, organic coatings over metal surfaces offer an efficient and economical solution to this problem [1,2]. Traditional coatings are organic solvent-borne, which makes them harmful to the environment due to their high content of volatile organic compounds (VOCs). Currently, low-VOC-containing waterborne coatings are becoming more prevalent [3,4]. However, the protection effect of waterborne coatings is generally lower than their organic solvent-borne counterparts. In most cases, this is due to the presence of hydrophilic channels to the metal surface, formed by the surfactants used to stabilize the latex particles [5]. The addition of nanomaterials to water-based coatings is an effective way of blocking micro- and nano-pores, thus enhancing the barrier effect [6]. Various nanomaterials have been used, including graphene derivatives [7], metal–organic frameworks (MOFs) [8], and silica-based nanoparticles [9,10], to name a few. Polyaniline (PANI)-based nanomaterials might offer another promising protection pathway due to their relatively easy synthesis and intrinsic anticorrosion properties [11]. PANI nanofibers [12], PANI-modified graphene [13], and PANI-doped polymeric spheres [14,15] have been demonstrated to improve corrosion protection.
While organic coatings initially provide excellent corrosion protection, they lack the sufficient scratch resistance to withstand mechanical and/or environmental damage. The quick diffusion of water and other corrosive ions would cause an instant corrosion reaction in the damaged zone. If the exposed area is not repaired in a timely manner, the corrosion reaction tends to spread quickly and ultimately might lead to a loss of function [16]. Traditionally, chromate corrosion inhibitors containing Cr(VI) have been shown to be capable of forming a protective oxide layer at damaged sites. However, the usage of highly toxic Cr(VI) compounds was greatly reduced over the last several decades and completely banned by the EU in 2017. Propelled by the development of environmentally friendly solutions of “self-healing” coatings, various strategies have been investigated and proven to be effective, such as embedding polymerizable agents into coatings and using polymers bearing reversible bonds as binders [17].
The addition of micro/nanoparticles to organic corrosion-inhibiting reagents is a promising approach to incorporating “self-healing” or “self-repair” functionality in these coatings. In this strategy, corrosion inhibitors leak from capsules to form a passivating layer over the exposed metal surfaces in damaged areas and “heal” the “wound”. Furthermore, organic corrosion inhibitors often contain N–H, S–H, or other reactive groups suitable for epoxy binders. The chemical linkage formed by the inhibitor with the epoxy groups during the curing stage could eliminate the functionality of the inhibitor and reduce the crosslinking density of the epoxy coating. The incorporation of organic corrosion inhibitors into nanoparticles prevents their reaction to an epoxy binder. Extensive studies on various micro/nano containers have been reported, such as mesoporous SiO2 [10], clays [18], Mn2O3 [19], zirconia [20], and carbon nanotubes [21]. Halloysite is a type of naturally occurring aluminosilicate with a hollow tubular structure [22]. It has been used for the encapsulation of small organic corrosion inhibitors [23]. A common way to manipulate the release rate of guest molecules is to cover the halloysite nanotubes (HNTs) with polyelectrolytes via layer by layer self-assembly (LbL) [24,25]. Although this strategy is effective, its preparation is time consuming and not economically advantageous. In situ polymerization is an efficient way of modifying the outer surface of HNTs, forming a porous three-dimensional structure, often found in sensor applications [26]. These recent findings inspired us to extend their applications into the area of corrosion protection.
In distinction to earlier research, the main aim of this article was to combine the good corrosion inhibition properties of PANI with the broad binding/release capabilities of HNTs into a multifunctional microcapsule for waterborne epoxy coatings with an improved corrosion resistance. The PANI-modified HNTs were prepared via the emulsion-free in situ polymerization of aniline. A set of scanning electronic microscopy (SEM), energy-dispersive X-ray (EDX)and Fourier transform infrared (FT IR) spectroscopy techniques were used to characterize the structure and composition of microcapsules and evaluate their loading capacity and release profile. Electrochemical impedance spectroscopy (EIS) and salt spray tests revealed a notable improvement in the corrosion resistance and propensity for self-healing.

2. Materials and Methods

2.1. Materials

Aniline, benzotriazole (BTA), and 1M HCl were purchased from Sinopharm Chemical Co. (Shanghai, China). Ammonium persulfate (APS), (NH4)2S2O8, was acquired from J&K Scientific Co. (Beijing, China). Halloysite (HNTs), Al2Si2O5(OH)4·2H2O, was purchased from Sigma Aldrich (Shanghai, China). Waterborne epoxy resin WEP 804 and the curing reagent Wh-5 were received from Yueyang Baling Chemical company (Yueyang, China). Flash rust inhibitor Halox Flash-X 330 was obtained from Shanghai Pengpan Chemical Corporation (Shanghai, China). All the chemicals were used without any further treatment. The steel plates Q235 (0.14%–0.22% C, 0.30%–0.65% Mn, 0.30% Si, 0.08% S, 0.045% P, and major Fe) employed in the coating experiments were initially polished with 400 mesh sandpaper and cleaned with acetone before the coating application.

2.2. Preparation of Polyaniline-Modified HNT (PANI@HNT)

Three types of PANI@HNTs were prepared with different “aniline: HNT” weight ratios of 0.5, 1, and 2. PANI@HNT-0.5, with a weight ratio of aniline to HNT of 0.5, was prepared according to the literature [27]. Briefly, 1 g of HNT was suspended in 200 mL of 1M HCl, followed by the addition of 0.5 g of aniline. The suspension was magnetically stirred at room temperature for 1 h before being cooled in an ice bath, then it was further stirred for another hour. Then, 2.3 g of APS was dissolved in 30 mL of 1 M HCl and added to the cold suspension over a period of 0.5 h. The mixture was stirred in the ice bath for 1 h and allowed to warm up to room temperature. After stirring overnight, the reaction mixture was centrifuged to collect the crude product. The product was washed five times with portions of pure water and dried at 40 °C under vacuum. The product was obtained as a dark green powder. PANI@HNT-1 and PANI@HNT-2, with different weight ratios of aniline to HNT, were prepared in a similar manner. The purified PANI@HNTs were characterized with SEM, EDX, and FITR.

2.3. Scanning Electron Microscopy (SEM)

The SEM analyses were performed on a Zeiss Supra 55 Field Emission Scanning Electron Microscope (FESEM) (Zeiss China, Shanghai, China) at an accelerating voltage of 10 KeV. The specimen preparation protocol was as follows: the HNT and modified HNT samples were placed onto a conductive tape and subjected to the SEM analysis directly. The waterborne epoxy coatings were sputter coated with a thin layer of Au before the SEM observation. For the analysis of the coating’s cross-section, the samples were immersed in liquid nitrogen, fractured, and coated.

2.4. Fourier Transform Infrared Spectroscopy (FT IR)

The spectroscopic characterization of the PANI@HNTs and their precursor was carried out on a Nicolet iS10 spectrometer (Thermo Fisher Scientific, Shanghai, China). The specimens were analyzed at room temperature in KBr pellets.

2.5. BTA Loading into PANI@HNTs

The method for loading BTA into the nanotubes was adopted from reports by other groups with minor modifications [25]. The PANI@HNT (0.5 g) was dispersed in a 250 mL saturated aqueous solution of BTA (20 g/L) and stirred at room temperature overnight. The suspension was placed under vacuum with a circulating water pump at 60 °C for 4 h. Then, the vacuum was released, and the suspension was kept for an additional 2 h at the same temperature to facilitate the diffusion of the inhibitor into the nanotubes. Vacuum was applied again for 4 h and then paused for 2 h until the suspension turned into a thick slurry. The slurry was stored at room temperature overnight for the entrapped BTA to fully crystallize. Then, the slurry was quickly washed with acetone and thoroughly rinsed several times with water to remove the excess BTA. The slurry was dried at 40 °C under vacuum to obtain the final product.

2.6. Determination of the Loading Ability of PANI@HNT

The measurement of the loading capacity was adopted from the literature [25]. The PANI@HNTs loaded with BTA were suspended in water, sonicated for 20 min, and then centrifuged to extract the BTA into the supernatant. The above process was repeated twice, and the supernatants were combined. The quantity of the extracted BTA was determined from the absorbance intensity at 260 nm using a Thermo Fisher Evolution 220 UV-Vis spectrophotometer (Thermo Fisher Scientific, Shanghai, China). The calibration curve is presented in Figure S1. The loading percentage of the BTA is calculated using the following equation:
BTA   loading % = weight   of   loaded   BTA weight   of   PANT @ HNT   loaded   with   BTA × 100

2.7. Controlled Release of Corrosion Inhibitor

The release assay was conducted on ~30 mg of PANI@HNT-0.5, 1, or 2 in 5 mL of deionized water with a pH in the range of 6.5–7.2. The procedure was adopted from the literature [24,25]. The suspension was continuously stirred during the release experiment to keep the nanotubes well dispersed. To determine the amount of released BTA into the solution, 500 μL of the suspension was taken at certain time intervals, diluted to 2 mL, and filtered through a 0.22 μm syringe filter before the absorbance testing. In total, 500 μL of fresh deionized water was added to the suspension after the sample was taken to keep the total volume constant. The control experiments with bulk BTA crystals and the as-received BTA-loaded HNTs were carried out in a similar fashion. Each release test was conducted twice. The percentage of accumulative release was calculated as the average of the tests.

2.8. Coating Preparation and Characterization

The weight percentages of PANI@HNT-0.5, 1, or 2 in the dry coating in this report were set at 4, 8, and 12%. The additives were suspended in water and then added to the waterborne epoxy under vigorous stirring. After complete dispersion was visually achieved (in ~10 min), the anti-flash rust and curing agents were added. The coating was then applied onto the Q235 plates by the wire-wound metering rod (120 μm) in two layers. The coatings were further cured at room temperature overnight and then in the heated oven at 75 °C for 6 h. The total thickness was measured in the range of 180–200 μm. The micro morphology of the coatings was observed using FESEM. The coated samples were sputter coated with a thin layer of gold before observation. A thermogravimetric analysis (TGA) of the coating was conducted on a Mettler Toledo TGA/DSC 3+ instrument (Mettler Toledo China, Shanghai, China) at a heating rate of 10 °C∙min−1 under a nitrogen atmosphere. The water droplet contact angle tests on the coatings were recorded by a Shanghai JCY goniometer (Shanghai Fangrui Instrument, Shanghai, China). Differential Scanning Calorimetry (DSC) was performed on a TA Q20 instrument (TA China, Shanghai, China) by heating the sample from −40 to 200 °C at 10 °C∙min−1 under a nitrogen atmosphere. The adhesion of the coating to the substrate was evaluated using the cross-cut test according to the ASTM D 3359 standard [28].

2.9. Electrochemical Impedance Spectroscopy (EIS)

The EIS experiments were conducted on a Princeton Applied Research PARSTAT 2273 workstation (Ametek, Beijing, China) using a three-electrodes cell consisting of a 2 × 2 cm2 platinum foil as a counter electrode, a saturated calomel electrode (SCE) as a reference electrode, and a test coating applied on a piece of Q235 steel as a working electrode. The working electrode was waxed, leaving a 1 × 1 cm2 area of the test coating. An Open circuit potential (OCP) vs. time test was performed before every single EIS test lasting from 10 to 20 min. When the fluctuation of the OCP did not exceed 3 mV, the EIS test was started. The EIS tests were performed two to three times. The 10 mV sinusoidal perturbation around the OCP was performed with 10 mV peak to peak. A total of 64 points were recorded in the frequency range from 105 to 0.01 Hz. The Kramer–Kronig relations were performed in the ZSimpWin software (ZSimpWin 3.60) to validate the data.

2.10. Salt Spray Test

The salt spray tests on the coating panels with specifically made scratches were carried out in accordance with the ASTM B-117 standard [29]. The salt spray chamber remained constant at 37 °C and a 5 wt.% NaCl solution with a pH of 6.5–7.5 was used as the corrosion medium.

3. Results and Discussion

3.1. Synthesis and Characterization of PANI@HNT

The preparation of the PANI-modified HNTs was performed using the in situ polymerization of aniline on the outer surface of the HNT. According to the literature, the outer surface of HNT is negatively charged at a pH of <2 [30]. The positively charged anilinium chloride was adsorbed onto the outer surface of the HNT and polymerized at a low temperature in the presence of ammonium persulfate as an oxidant. The weight ratios of aniline to HNT were 0.5, 1, and 2 in the polymerizations performed in this study. The morphology comparison of the resulting PANI@HNT-0.5, PANI@HNT-1, PANI@HNT-2, as-received HNT, and PANI polymerized in the absence of HNT is presented in Figure 1 and Figure S2.
The SEM images show that, while the overall shape of the HNTs remained almost unchanged, they increased in thickness. For example, the PANI@HNT-0.5 diameter was 45 ± 13 nm vs. the pure HNT with a diameter of 40 ± 12 nm. The lengths of the tubes ranged from 20 nm to half a micron. When the weight ratio of the aniline monomer to HNT increased, the resulting average diameters of PANI@HNT-1 and PANI@HNT-2 rose to 80 and 97 nm, respectively. The roughness of the outer surface of PANI@HNT was notably more pronounced compared to the relatively smooth HNTs. These are clear indications that PANI was successfully grown on the HNT. The template polymer synthesis preserved the characteristic tubular shape of the HNT. In comparison, the PANI particles prepared under the same conditions, but in the absence of HNT, exhibited irregular morphology and a wide range of size distributions (Figure S2). The vacuum-dried PANI@HNTs could be easily dispersed in water by magnetic stirring, which would facilitate their usage in waterborne coatings. Additional proof for the formation of PANI layers on the HNT peripheral surfaces was provided by the EDX analyses, as shown in Figure 1. With the growth of PANI on the surface, the element contents of aluminum, silicon, and oxygen from the HNT were diminished, while the signals of carbon, sulfur, and chlorine constituting the PANI emeraldine salts increased. It should be noted that the EDX results depended strongly on the depth distribution of the detected elements on the sample surfaces due to the limited penetration ability of the electron beam. Thus, the detection of the HNT elements became more difficult as the layer of the PANI thickened.
The FT IR spectra of the HNT and PANI@HNTs are presented in Figure 2. In the HNT spectrum, the absorbance bands at 3700 and 3620 cm−1 were attributed to Al2–OH stretching. The bands at 1030 and 910 cm−1 were associated with Si–O stretching and Al2–OH bending, respectively. These bands were still present after coating with PANI, as marked in the spectra of PANI@HNT-0.5. In comparison to the neat HNT, the new bands of the PANI@HNT-0.5 were caused by the polyaniline adsorption. The band at 3460 cm−1 was assigned to the stretching of N-H. The adsorption band of the C=C stretching vibration in the quinoid ring was observed at 1580 cm−1, while the one in the benzoic ring appeared at 1496 cm−1. The C–N stretching vibration of the benzoic ring was observed at 1300 cm−1. The absorption band of the C=N stretching vibration of the quinoid ring was found at 1130 cm−1 [31,32]. The FTIR spectra of PANI@HNT-1 and -2 exhibited similar characteristic peaks, yet the bands corresponding to Al2–OH and Si–O became weaker as the PANI layer grew thicker. This was consistent with the EDX results.

3.2. Corrosion Inhibitor Loading and Release

BTA, a common corrosion inhibitor [33], was loaded into the lumen of the HNT via diffusion from its concentrated aqueous solution and deposition after solvent evaporation. The binding capacities of the HNT and modified HNTs are presented in Figure 3. The capacity of the neat HNT was estimated as 4.68%, which was quite similar to that of PANI@HNT-0.5. By increasing the PANI layer thickness, the loading capacity was significantly improved, with PANI@HNT-1 and PANI@HNT-2 binding 12.53% and up to 15.94%, respectively. It was observed that the PANI could also absorb a sizable amount of BTA. According to recent studies, PANI in situ polymerized on HNT has a more porous structure than its neat form [26]. This phenomenon could be more pronounced when the PANI layer grows. This could have contributed to the increment in the BTA loading capacity as the PANI layer became thicker.
The BTA release profiles from the HNT and PANI@HNTs are presented in Figure 3b. Since PANI@HNT-2 had the highest loading capacity, it was used in the release rate tests. It was obvious that the BTA diffusion from the neat HNT and PANI-modified HNTs was much slower than that from its neat form. The release profiles of the HNT and PANI@HNTs had two stages: the initial burst release and the later steady release. The burst release in the first two hours was attributed to the quick diffusion of the exogenously absorbed BTA. The slow and steady release was from the BTA loaded inside the lumen of the HNT. Since the PANI itself could absorb a certain amount of BTA, PANI@HNT-2 released more BTA in the burst release stage.
Electrochemical impedance spectroscopy (EIS) tests of clean steel sheets in 3.5 wt.% NaCl with and without PANI@HNT-2-BTA were performed to examine their corrosion inhibition effect, using the strategy from the literature [34]. The Bode plots for steel panels immersed in solutions for different time spans are shown in Figure S3. Usually, the impedance modulus at a low frequency (Zf = 0.01 Hz) is employed to evaluate the ability to suppress the current between the anode and cathode. The higher the Zf = 0.01 Hz, the better the corrosion suppression. After 24 h of immersion, Zf = 0.01 Hz approached 3.6 kΩ∙cm2 in the presence of PANI@HNT-2-BTA (Figure S3a), while the Zf = 0.01 Hz of the bare steel was only 0.39 kΩ cm2 (Figure S3b). This difference indicated that the corrosion of steel could be inhibited in the presence of PANI@HNT-2-BTA. The impedance modulus of PANI@HNT-2-BTA grew continuously over time and levelled off after 8 h, while the bare steel exhibited no considerable time difference during the immersion. The corrosion inhibition can be attributed to the protective film formation due to the adsorption of released BTA onto the exposed metal surface.

3.3. Coating Preparation and Physical Properties

The loading of PANI@HNT-2-BTA was performed by simply mixing the modified nanotubes with waterborne epoxy resins. The mixtures were then coated onto Q235 steel panels. The secondary amino group in the emeraldine base was active towards the epoxy groups, which could improve the compatibility of the nanotubes and the resin. On the other hand, an “overdose” of PANI could possibly affect the curing of the epoxy resin. Thus, the dosage of the PANI@HNT-2-BTA was a reasonable study target for finding the optimal recipe. Pictures of the coatings prepared by mixing the epoxy resin with 1%–12% PANI@HNT-2 (calculation based on dry film weight percentage) are presented in Figure 4. At a 1% dosage (Figure 4b), the cover was insufficient. If the content of PANI@HNT-2-BTA was higher than 3%, the coatings had a satisfactory cover efficiency. The coatings, however, started to lose glossiness as the dosage became higher. In particular, when the PANI@HNT-2 content was at 12% (Figure 4f), visible defects such as pinholes and overall roughness were spotted on the surface of the coating. It also took longer for the coating to harden. This phenomenon has also been reported in other studies with different types of PANI nanoparticles and is attributed to the role of the secondary amino group [35]. Despite its low reactivity, this secondary amino group could react with the oxirane rings in the epoxy resin and increase its stiffness. We postulate that too much PANI would encumber the curing of the epoxy resin, leading to defects in the film. Considering the fact that the high PANI content could further deteriorate the quality of the epoxy resin coating, a dosage greater than 12% was not attempted in this research. The adhesion strength of these doped coatings together with the pure epoxy coating was evaluated using the cross-cut test. It was found that all these coatings had a decent adhesion strength, with classification at 4B according to ASTM D 3359 (see detail in Table S1).
The SEM images of the coating surfaces with the PANI@HNT-2 dosage ranging from 3 to 12% are displayed in Figure 5. The surfaces of these coatings were relatively smooth and defect free, except the one at 12%. The surface of the 12% coating had cracks and wrinkles, and nanotubes were occasionally spotted, suggesting a possible overdosage of additives, as seen in Figure 5g. The SEM images of the cross-sections of these coatings are also exhibited in Figure 5, showing the increasing appearance of randomly oriented PANY@HNTs. At relatively low dosages (3% and 5%), the distribution of the nanotubes throughout the coating was uniform and without obvious agglomeration (Figure 5b,d). When the nanotube content increased (8% and 12%), nanotube clustering was observed (encircled area in Figure 5f,h). This kind of agglomeration could potentially impair the compactness of the coating, leading to a decrease in the corrosion protection efficiency. The water droplet contact angles of these coatings were also evaluated. It was found that the wettability of the varnishes was not grossly affected by the addition of the hydrophilic nanotubes (Figure S4). This implied that the nanotubes were predominantly embedded in the bulk of the coating, with a negligible effect on the surface properties.
The thermal stability of the coatings was evaluated using TGA and DSC, and the results are shown in Figure 6 and Figure S5. The derivative thermogravimetry (DTG) curve of the coatings without filler presented in Figure 6a reveals two major weight loss peaks resulting from the loss of residual solvent and the degradation of the epoxy framework. In comparison, the coatings doped with PANI@HNT had their weight loss peaks shift to a slightly higher temperature and this weight loss was also reduced. The introduction of the thermally stable filler improved the overall thermal durability of the coatings. The glass transition temperature (Tg) of the coatings was measured using DSC (Figure 6b). The doping of PANI@HNT into the coatings increased the Tg of the epoxy coatings. The Tg grew linearly as more PANI@HNT was used (Figure S6). It is possible that PANI@HNT was covalently connected to the epoxy frame via the reaction of the secondary amino group with the oxirane rings of the epoxy. These stiff nanotubes restricted the movement of the polymer chains, thus leading to the increment in Tg and the toughness of the coating.

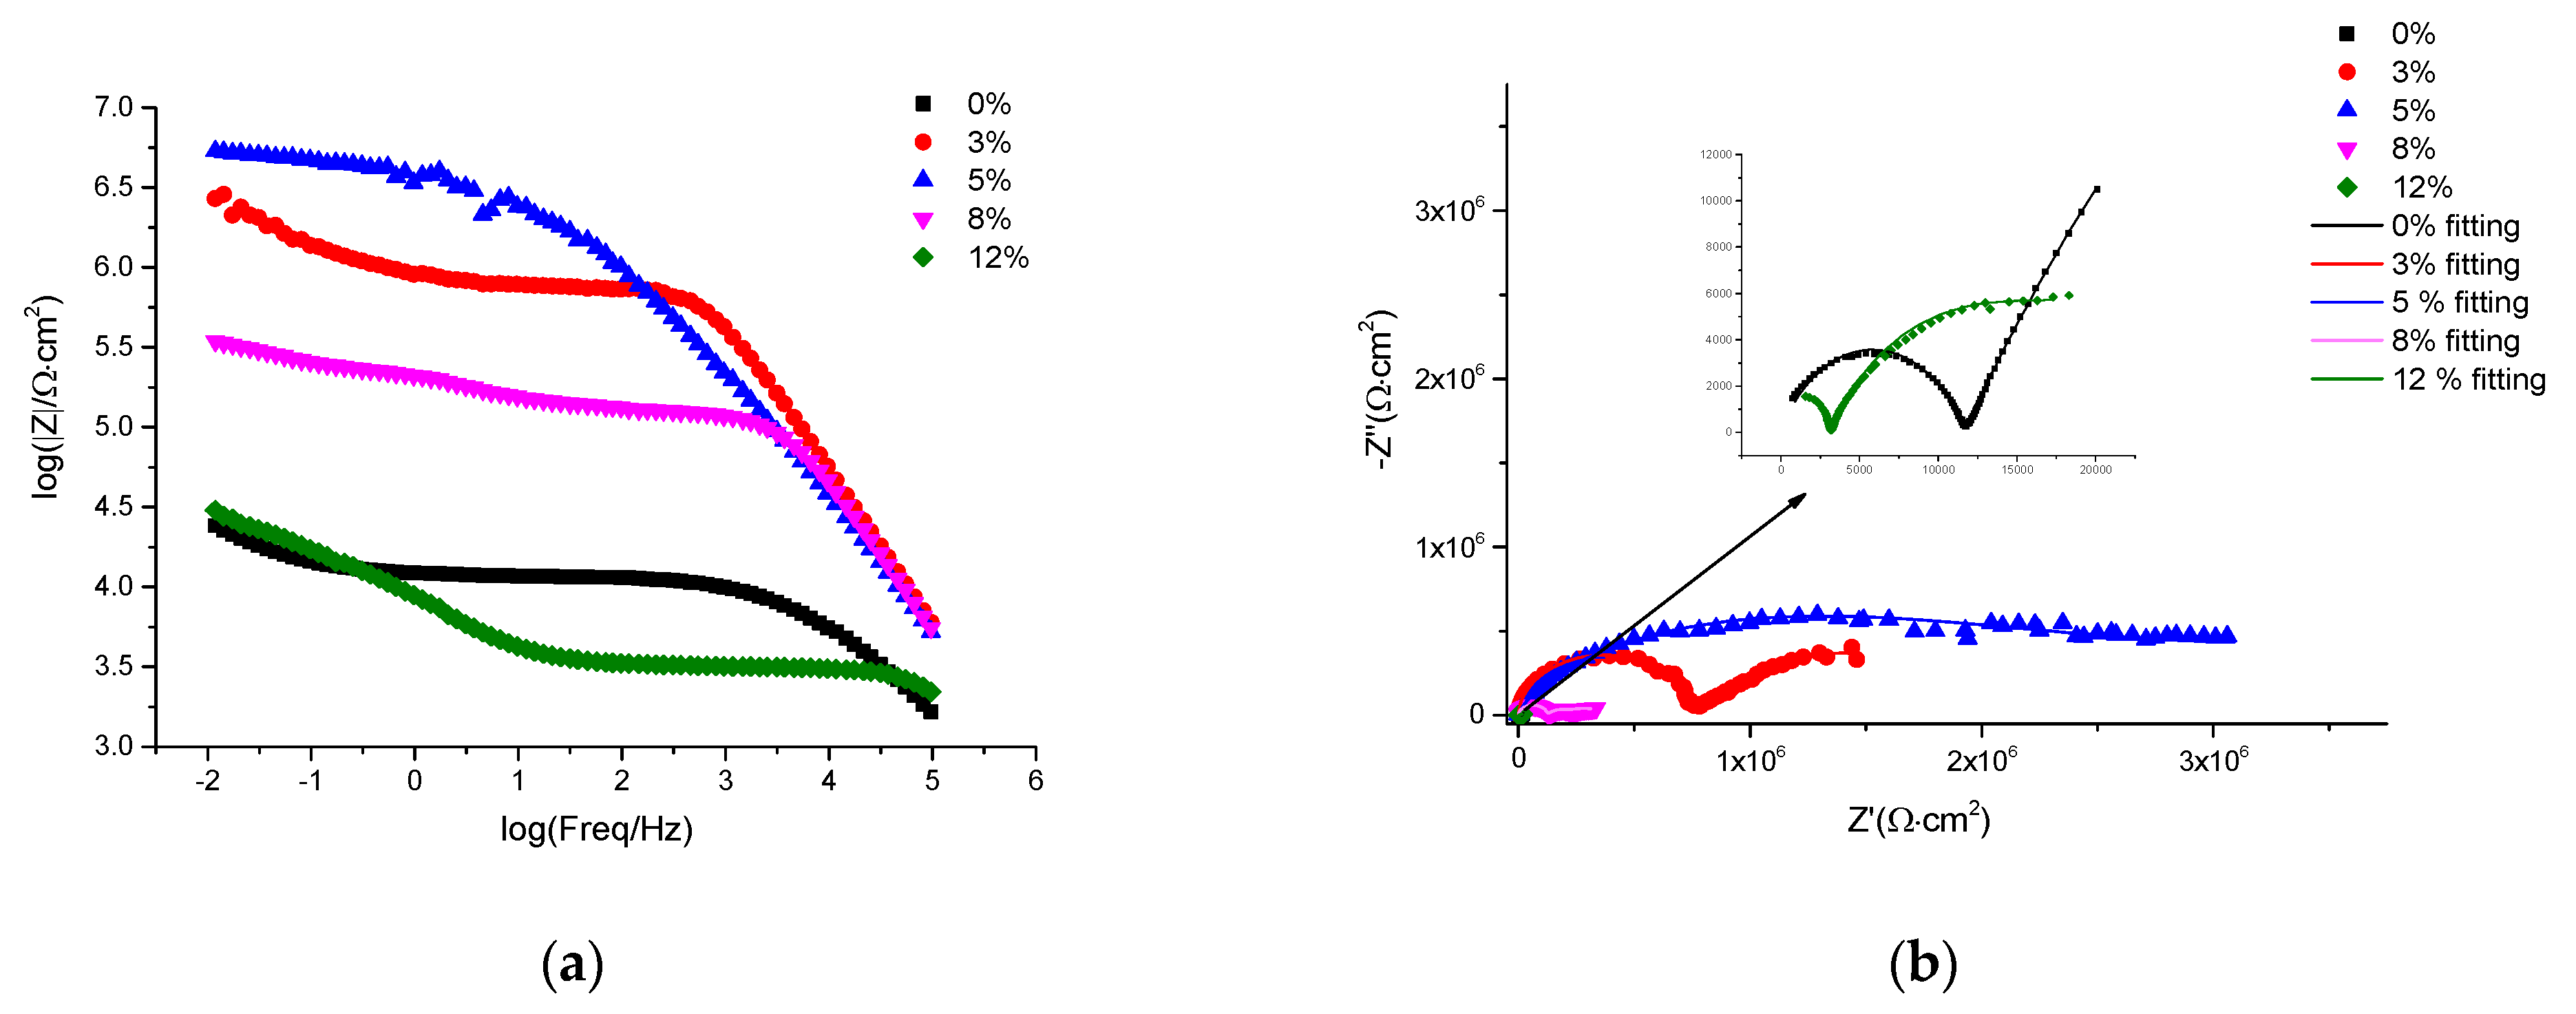
3.4. EIS Corrosion Protection Evaluation of Intact Coatings

To find the optimal PANI@HNT-2-BTA dosage, sample panels with different PANI@HNT-2-BTA amounts were immersed in a 3.5 wt.% NaCl solution and EIS was performed to evaluate the corrosion resistance. To simplify the test and save time, the experiment was carried out at 50 °C to accelerate the diffusion of the aggressive electrolytes into the coatings, thus escalating the coating failure [36]. A higher impedance modulus of the coating at a low frequency was the sign of a lower extent of corrosion (i.e., an overall better corrosion protection by the coating) [37,38]. As shown in Figure 7a, the coating with 5% PANI@HNT-2-BTA provided the best corrosion protection at Zf = 0.01Hz (5.01 × 10⁶ Ω∙cm2), followed by the 3% and 8% coatings at the same frequency (2.52 × 10⁶ and 3.45 × 10⁵ Ω∙cm2, respectively). The coating with 12% PANI@HNT-2-BTA and the pure epoxy varnish had extremely low impedance moduli, indicating a poor protective ability. This finding was not surprising in view of the surface defects observed with the 12% coatings (Figure 5 and Figure 6). The Bode phase curve presented different degrees of coating failure, as shown in Figure S7. The lower the frequency of the inflection point, the higher the degree of the protection loss. From the Nyquist plots (Figure 7b), it can be seen that more than one time constant appeared in all circumstances, suggesting that all the coatings suffered from corrosion at different degrees [39]. The semicircular arc of all the coatings decreased in the order of 5% > 3% > 8% > 0% > 12%. A larger semicircle diameter and higher impedance modulus at a low frequency generally signified a superior corrosion resistance feature [40,41]. The EIS indicated that the 5% doped coating showed the best corrosion resistance. The numerical EIS data analysis confirmed the graphical observations. The EIS results were fitted into an electrochemical equivalent circuit containing two-time constants and a Warburg element, as shown in Figure 8a. Rs, Rp, and Rct represent the resistance of the solution, the electrolyte seepage into the coating pores, and the charge transfer resistance of the double layer at the interface between the electrolytes and the metal substrate, respectively. Constant phase-angle elements (CPE) were used to simulate the capacitance of the coating and the interface double layer. The presence of the Warburg elements signified the corrosion reaction of the metal substrate caused by the diffusion of corrosive ions in the coatings. The electrochemical impedance parameters are listed in Table 1. A high Rp was a sign of a low degree of electrolyte penetration into the coating and a high barrier effect. Rct estimated the electron loss from the metal substrate during the electrochemical reaction. A large Rct hinted at a low degree of corrosive reaction. It was obvious that the 5% PANI@HNT-2-BTA-doped coating had the highest Rp and Rct, and therefore offered the best overall corrosion protection. Therefore, this type of coating was used in the subsequent studies. Epoxy coatings overdosed with PANI@HNT-2-BTA probably had nanotubes agglomeration, as discussed in the previous section. The pinholes and other defects could greatly impair the compactness of the coating layer, resulting in quick failure. The admittance magnitude of the capacitor Y0 could also be used to quantify the corrosion performance of the coating. A low value of the Y0 of Cp indicated less conductive electrolytes absorbed into the coating, and a low value of the Y0 of Cdl suggested a slower corrosion rate at the metal surface. The 3% and 5% doped coatings carried the lowest coating capacitance (Y0 of Cp is at ~10−9 F∙cm2), while the 5% and 8% doped coatings showed the slowest corrosion rate (Y0 of Cdl is at ~10−7 F∙cm2). In agreement with the above discussion about the resistance elements, the 5% doped coating exhibited the best corrosion protection performance in our tests.
To evaluate the corrosion protection performance of the coatings in the usual service environment, long-term EIS tests were conducted at room temperature with the EIS data exhibited in Figure 9. The impedance modulus in the Bode plot, together with the radius of the arch in the Nyquist plot, decreased in the following order: PANI@HNT-2-BTA coating > PANI@HNT coating > PANI-doped coating > original waterborne epoxy varnish. The Zf = 0.01Hz of the PANI@HNT-2-BTA coating remained higher than 108 Ω∙cm2 throughout the entire time test (Figure 9a), while the Zf = 0.01Hz of the waterborne varnish dropped from 108 after 1 day to 105 Ω∙cm2 after 50 days (Figure 9g). The coatings doped only with PANI@HNT and PANI also had an improved corrosion protection compared to the coating without any filler. The PANI@HNT coating exhibited a better performance than the PANI. The Zf = 0.01Hz in the Bode plot and radius in the Nyquist plot decreased slower in the EIS test (Figure 9c–f). As mentioned in Section 3.1, the PANI prepared in this research was agglomerate and the overall particle size was larger than that of the PANI@HNT. The smaller surface area and poorer dispersion of the PANI could be attributed to the deteriorated protection. The electro equivalent circuit in Figure 8b was used to fit the acquired EIS data. The electrochemical impedance parameters are listed in Table 2. After 50 days, the resistance Rp of the PANI@HNT-2-BTA coating was 1–2 orders of magnitude higher than that of the original varnish, implying that an extended barrier effect could be achieved by the incorporation of halloysite nanotubes. The Rct was also up to four orders of magnitude. The Y0 of Cdl of the PANI@HNT-2-BTA coating was at the lowest value (one magnitude lower than the PANI@HNT-2 coating and two magnitudes lower than the waterborne epoxy vanish), indicating the lowest degree of corrosion reaction at the metal surface. The inhibition of the corrosion reaction might be attributed not only to the better shielding effect of the coating, but also to the corrosion reaction suppression from the filler added [42]. Based on the literature [13], PANI@HNT-2-BTA is supposed to act in two ways: (a) the adsorption of BTA leachate onto the metal surface, causing the formation of a BTA complex layer and (b) a PANI-mediated redox reaction, promoting the formation of an Fe2O3 passivation layer on the metal substrate. These two effects may cause the synergistic anticorrosion protection of the metal surface. A similar phenomenon was also reported for a nanocomposite composed of PANI and mercaptobenzothiazole (MBT).

3.5. EIS Self-Healing Evaluation of Damaged Coatings

To evaluate their ability to inhibit the corrosion reaction in a damaged area, the PANI@HNT-2-BTA coatings were applied onto the Q235 plates and artificially scratched. The specimens were microscopically examined to verify that the metal surfaces were fully exposed. The EIS of the scratched coating doped with PANI@HNT-2-BTA after immersion in 3.5 wt.% NaCl for up to 48 h is presented in Figure 10 and compared with the coatings mixed with PANI@HNT-2 and the original waterborne epoxy varnish as control. At the initial immersion stage, the coating doped with PANI@HNT-2-BTA exhibited a low impedance modulus. As the immersion continued, the impedance modulus increased. It is logical to assume that this was affected by the released BTA that formed a passivation layer onto the metal substrate (Figure 10a). Zf = 0.01Hz increased to 44 kΩ cm2 after 48 h immersion, which was almost two orders of magnitude higher than the initial value of 0.66 kΩ∙cm2. In the Bode phase plot (Figure 10b), the phase peak shifted to a higher frequency (from 0.26 Hz to 230 Hz) at the prolonged immersion, suggesting that the corrosion was increasingly inhibited [43]. The coating doped with PANI@HNT-2 was also capable of suppressing corrosion near the scratched area, but the effect was limited. The Zf = 0.01Hz experienced a slight boost from the original 0.76 kΩ cm2 to 3.5 kΩ∙cm2 after 24 h immersion (Figure 10d). Unsubstantial phase peak shifts were also observed in the Bode phase plot (Figure 10e). The Bode plots of the scratched epoxy varnish coatings are shown in Figure 10g–i. The increment in the impedance modulus in the high-frequency region was mainly caused by the formation of less conductive corrosion products accumulated at the scratched area. The peak in the Bode phase plot shifted to an even lower-frequency region, indicating that the corrosion resistance was further reduced.
To elucidate the electrochemical process in the scratched coatings immersed in saline, the EIS data were fitted into the electrochemical equivalent circuits, as presented in Figure 11. The Rs, Rox, Rb, and Rct are defined as the solution resistance, oxide layer resistance, BTA complex layer resistance, and charge transfer resistance of the electrolytes–metal double-layer interface, respectively. Cox, Cb, and Cdl are the oxide layer capacitor, BTA complex layer capacitor, and the double-layer capacitor at the metal/electrolyte solution interface. For simplicity, the electrochemical impedance parameters with resistances only are presented in Table 3. The full set of parameters is listed in Table S2. The oxide layer resistance (Rox) was measurable due to the formation of metal oxides at the scratched area. It decreased with the passage of the test time, suggesting that the oxide layer was not sufficiently dense to prevent further corrosion. Rct, an important indicator for the corrosion rate, increased in the waterborne vanish due to the accumulation of corrosion products in the scratched area. The inhibition of the corrosion reaction by these products was, however, very limited. The redox-active PANI could catalyze the formation of passivating Fe2O3. This was evidenced by the significant increase in the Rct of the PANI@HNT-2-doped coating after 8 h of immersion, reaching 1.6 × 10⁴ Ω∙cm2 (Table 4). The Rct values dropped lower as the immersion continued. It is possible that the passive oxide layer formed with PANI assistance deteriorated over time [44,45]. In contrast, Rct together with Rb increased steadily in the PANI@HNT-2-BTA-doped coatings during the immersion test. The barrier layer formed by the BTA-ferrous/ferric ion complexes contributed to the Rb and Rct increments [46]. Thus, after 48 h of immersion, the Rct was eight times higher than the same varnish parameter. It was evident that the newly formed BTA complex served as a healing agent, covering the exposed metal surface and preventing its corrosion.

3.6. Salt Spray Test on the Scratched Coating

The scratched coating doped with PANI@HNT-2-BTA was subjected to a neutral salt spray test and compared with a coating doped with PANI@HNT and a waterborne epoxy varnish. The digital images of the sample panels during the test are shown in Table 4. Consistent with the EIS results, the PANI@HNT-2-BTA coating demonstrated the best corrosion inhibition, showing no obvious signs of corrosion. It was noticed that the scratches became narrower and less identifiable, suggesting the “self-healing” propensity of the coating. The coating infused with PANI@HNT-2 only started to corrode in the inscribed area after 100 h and corrosion became more apparent after 150 h. This coating demonstrated a certain limited ability to suppress the corrosion in the damaged area. Finally, the waterborne epoxy varnish bearing no corrosion inhibition additives started to blister after 50 h and the corrosion area began to spread after 100 h. After 150 h, severe corrosion and coat delamination were observed, evidencing the failure of the epoxy varnish.
Based on the EIS and salt spray tests, a tentative illustration of the corrosion inhibition mechanism is presented in Scheme 1. When a damage or defect appeared in the coating, the corrosive Cl ion promoted the oxidation of Fe to Fe2+ [47,48]. At the same time, the large surface area and intrinsic hydrophilicity of the HNTs could facilitate water molecule absorption, thus triggering the release of the hydrophilic BTA from the nanotubes [49]. Simultaneously, PANI could facilitate the oxidation of Fe2+ to Fe3+ [50]. The released BTA adhered onto the exposed metal surface and chelated the ferrous/ferric ions, forming a passivating layer composed of a BTA-ferrous/ferric ion complex which blocked the further interaction of the corrosive media with the metal substrate. This newly formed layer composed of [Fe2+(BTA)2]n, [Fe2+(Cl)mBTA]n, or other types of [Fe3+]m[BTA]n [51], filled the void in the existing epoxy coating and “healed” the wound.

4. Conclusions

In summary, PANI-modified HNTs were prepared via polymerization in situ. PANI@HNT-2 exhibited the best loading capacity and retention towards BTA as a guest molecule. The EIS analysis with immersion tests performed on Q235 steel plates coated with PANI@HNT-2-BTA-loaded varnishes demonstrated their positive corrosion inhibition effect compared to the control experiments with common water-born epoxy coatings. The EIS examination of the results from the accelerated corrosion tests revealed that the coating with 5% PANI@HNT-2-BTA was the most effective. An overdose of additives negatively affected the corrosion protection of the coatings. The long-term EIS tests confirmed that the corrosion protection performance was improved by adding BTA-loaded PANI@HNT-2 to the standard epoxy coatings. The tests also demonstrated the synergistic effect of BTA and PANI, promoting the formation of passivating film(s) over the exposed area. Overall, we developed a facile strategy for the preparation of ready-to-use pigment to improve the corrosion protection of water-born epoxy coatings and apply its “self-healing” mechanism to fight against external damage. Future studies will be focused on the precise control of the release kinetics of the organic inhibitors by extending the library of the polymers wrapping the HNT and encapsulated inhibitors. Optimizing the coating system elements such as binders, additives, and other fillers also needs to be considered to maximize the corrosion suppression.

Supplementary Materials

The following supporting information can be downloaded at: https://www.mdpi.com/article/10.3390/coatings13101677/s1, Figure S1: BTA concentration calibration curve, Figure S2: SEM image of PANI synthesized without template, Figure S3: Bode impedance plot of Q235 steel in 3.5 wt.% NaCl in the presence of with and without PANI@HNT-2-BTA, Figure S4: Water droplets contact angles of coatings, Figure S5: TGA and DTG analyses epoxy coatings doped with different amounts of PANI@HNT-2, Figure S6: Tg of the coatings versus PANI@HNT dosage, Figure S7: Bode phase angle plot of the waterborne epoxy coatings doped with different amount of PANI@HNT-2-BTA after heating in 3.5 wt.% NaCl at 50 °C for 5 days. Table S1. The coating adhesion strength test by cross-cut test (ASTM D 3359). Table S2. EIS parameters of scratched coatings.

Author Contributions

X.L. and I.G. conceived the concept; X.L. designed and performed experiments; X.L. wrote the first draft of the manuscript; I.G. edited the final version of the manuscript; Z.G., F.Y. and D.W. performed coating, EIS experiments, collected and analyzed the data; Z.G., B.D. and X.L. discussed and edited early drafts of the manuscript. All authors have read and agreed to the published version of the manuscript.

Funding

Science and Technology Foundation of State Grid Corporation of China (5500-202216123A-1-1-ZN) financially supported this work.

Institutional Review Board Statement

Not applicable.

Informed Consent Statement

Not applicable.

Data Availability Statement

All results of this study are included in the manuscript.

Acknowledgments

Thanks are due to G. Zhu for his assistance in acquiring waterborne epoxy resins and Q235 steel panels.

Conflicts of Interest

The authors declare no conflict of interest.

References

  1. Sørensen, P.A.; Kiil, S.; Dam-Johansen, K.; Weinell, C.E. Anticorrosive coatings: A review. J. Coat. Technol. Res. 2009, 6, 135–176. [Google Scholar] [CrossRef]
  2. Kohl, M.; Alafid, F.; Boštíková, K.; Bouška, M.; Krejčová, A.; Svoboda, J.; Slang, S.; Michalíčková, L.; Kalendová, A.; Hrdina, R.; et al. New azo dyes-based Mg complex pigments for optimizing the anti-corrosion efficiency of zinc-pigmented epoxy ester organic coatings. Coatings 2023, 13, 1276. [Google Scholar] [CrossRef]
  3. Zafar, F.; Ghosal, A.; Sharmin, E.; Chaturvedi, R.; Nishat, N. A review on cleaner production of polymeric and nanocomposite coatings based on waterborne polyurethane dispersions from seed oils. Prog. Org. Coat. 2019, 131, 259–275. [Google Scholar] [CrossRef]
  4. Chowdhury, R.A.; Clarkson, C.M.; Shrestha, S.; El Awad Azrak, S.M.; Mavlan, M.; Youngblood, J.P. High-performance waterborne polyurethane coating based on a blocked isocyanate with cellulose nanocrystals (CNC) as the polyol. ACS Appl. Polym. Mater. 2020, 2, 385–393. [Google Scholar] [CrossRef]
  5. Martín-Fabiani, I.; Lesage de la Haye, J.; Schulz, M.; Liu, Y.; Lee, M.; Duffy, B.; D’Agosto, F.; Lansalot, M.; Keddie, J.L. Enhanced water barrier properties of surfactant-free polymer films obtained by macroRAFT-mediated emulsion polymerization. ACS Appl. Mater. Interf. 2018, 10, 11221–11232. [Google Scholar] [CrossRef]
  6. Wang, N.; Cheng, K.; Wu, H.; Wang, C.; Wang, Q.; Wang, F. Effect of nano-sized mesoporous silica MCM-41 and MMT on corrosion properties of epoxy coating. Prog. Org. Coat. 2012, 75, 386–391. [Google Scholar] [CrossRef]
  7. Cui, G.; Bi, Z.; Zhang, R.; Liu, J.; Yu, X.; Li, Z. A comprehensive review on graphene-based anti-corrosive coatings. Chem. Eng. J. 2019, 373, 104–121. [Google Scholar] [CrossRef]
  8. Wang, N.; Zhang, Y.; Chen, J.; Zhang, J.; Fang, Q. Dopamine modified metal-organic frameworks on anti-corrosion properties of waterborne epoxy coatings. Prog. Org. Coat. 2017, 109, 126–134. [Google Scholar] [CrossRef]
  9. Khodabakhshi, J.; Mahdavi, H.; Najafi, F. Investigation of viscoelastic and active corrosion protection properties of inhibitor modified silica nanoparticles/epoxy nanocomposite coatings on carbon steel. Corros. Sci. 2019, 147, 128–140. [Google Scholar] [CrossRef]
  10. Ashrafi-Shahri, S.M.; Ravari, F.; Seifzadeh, D. Smart organic/inorganic sol-gel nanocomposite containing functionalized mesoporous silica for corrosion protection. Prog. Org. Coat. 2019, 133, 44–54. [Google Scholar] [CrossRef]
  11. Qiu, S.; Chen, C.; Cui, M.; Li, W.; Zhao, H.; Wang, L. Corrosion protection performance of waterborne epoxy coatings containing self-doped polyaniline nanofiber. Appl. Surf. Sci. 2017, 407, 213–222. [Google Scholar] [CrossRef]
  12. Yang, S.; Zhu, S.; Hong, R. Graphene oxide/polyaniline nanocomposites used in anticorrosive coatings for environmental protection. Coatings 2020, 10, 1215. [Google Scholar] [CrossRef]
  13. Pan, W.; Dong, J.; Gui, T.; Liu, R.; Liu, X.; Luo, J. Fabrication of dual anti-corrosive polyaniline microcapsules via Pickering emulsion for active corrosion protection of steel. Soft Matter 2022, 18, 2829–2841. [Google Scholar] [CrossRef]
  14. Zhang, F.; Ju, P.; Pan, M.; Zhang, D.; Huang, Y.; Li, G.; Li, X. Self-healing mechanisms in smart protective coatings: A review. Corros. Sci. 2018, 144, 74–88. [Google Scholar] [CrossRef]
  15. Li, C.; Zhang, C.; He, Y.; Li, H.J.; Zhao, Y.; Li, Z.J.; Sun, D.; Yin, X.Y. Benzotriazole corrosion inhibitor loaded nanocontainer based on g-C3N4 and hollow polyaniline spheres towards enhancing anticorrosion performance of waterborne epoxy coatings. Prog. Org. Coat. 2023, 174, 107276–107289. [Google Scholar] [CrossRef]
  16. Liu, T.; Ma, L.; Wang, X.; Wang, J.; Qian, H.; Zhang, D.; Li, X. Self-healing corrosion protective coatings based on micro/nanocarriers: A review. Corros. Commun. 2021, 1, 18–25. [Google Scholar] [CrossRef]
  17. Fix, D.; Andreeva, D.V.; Lvov, Y.M.; Shchukin, D.G.; Möhwald, H. Application of inhibitor-loaded halloysite nanotubes in active anti-corrosive coatings. Adv. Funct. Mater. 2009, 19, 1720–1727. [Google Scholar] [CrossRef]
  18. Liu, Y.; Wang, L.; Zhang, C.; Zhang, K.; Liu, G. A Hollow porous Mn2O3 microcontainer for encapsulation and release of corrosion inhibitors. ECS Electrochem. Lett. 2013, 2, C39–C42. [Google Scholar] [CrossRef]
  19. Habib, S.; Hassanein, A.; Kahraman, R.; Mahdi Ahmed, E.; Shakoor, R.A. Self-healing behavior of epoxy-based double-layer nanocomposite coatings modified with Zirconia nanoparticles. Mater. Des. 2021, 207, 109839. [Google Scholar] [CrossRef]
  20. Khlobystov, A.N.; Britz, D.A.; Briggs, G.A.D. Molecules in carbon nanotubes. Acc. Chem. Res. 2005, 38, 901–909. [Google Scholar] [CrossRef]
  21. Kausar, A. Review on polymer/halloysite nanotube nanocomposite. Polym. Plast. Technol. Eng. 2018, 57, 548–564. [Google Scholar] [CrossRef]
  22. Shchukin, D.G.; Yasakau, K.A.; Zheludkevich, M.L.; Ferreira, M.G.S.; Möhwald, H. Active anticorrosion coatings with halloysite nanocontainers. J. Phys. Chem. C 2008, 112, 958–964. [Google Scholar] [CrossRef]
  23. Yap, J.Y.; Mat Yaakob, S.; Rabat, N.E.; Shamsuddin, M.R.; Man, Z. Release kinetics study and anti-corrosion behaviour of a pH-responsive ionic liquid-loaded halloysite nanotube-doped epoxy coating. RSC Adv. 2020, 10, 13174–13184. [Google Scholar] [CrossRef]
  24. Njoku, D.I.; Cui, M.; Xiao, H.; Shang, B.; Li, Y. Understanding the anticorrosive protective mechanisms of modified epoxy coatings with improved barrier, active and self-healing functionalities: EIS and spectroscopic techniques. Sci. Rep. 2017, 7, 15597. [Google Scholar] [CrossRef] [PubMed]
  25. Njoku, D.I.; Li, B.; Khan, M.S.; Chinonso, U.P.; Njoku, C.N.; Onyeachu, I.B.; Li, Y. Quadruple-action coatings provided by doping epoxy with inhibitor laden clay nanotubes functionalized with layer-by-layer of cross-bridged chitosan and anionic polyelectrolytes. Prog. Org. Coat. 2021, 157, 106312. [Google Scholar] [CrossRef]
  26. Duan, X.; Duan, Z.; Zhang, Y.; Liu, B.; Li, X.; Zhao, Q.; Yuan, Z.; Jiang, Y.; Tai, H. Enhanced NH3 sensing performance of polyaniline via a facile morphology modification strategy. Sens. Actuators B Chem. 2022, 369, 132302. [Google Scholar] [CrossRef]
  27. Zhou, T.; Zhao, Y.; Han, W.; Xie, H.; Li, C.; Yuan, M. Enhanced solvent-free selective oxidation of cyclohexene to 1,2-cyclohexanediol by polyaniline@halloysite nanotubes. J. Mater. Chem. A 2017, 5, 18230–18241. [Google Scholar] [CrossRef]
  28. ASTM D3359-09; Standard Test Methods for Measuring Adhesion by Tape Test. ASTM International: Conshohocken, PA, USA, 2009.
  29. ASTM B117-19; Standard Practice for Operating Salt Spray (Fog) Apparatus. ASTM International: Conshohocken, PA, USA, 2019.
  30. Li, C.; Zhou, T.; Zhu, T.; Li, X. Enhanced visible light photocatalytic activity of polyaniline–crystalline TiO2–halloysite composite nanotubes by tuning the acid dopant in the preparation. RSC Adv. 2015, 5, 98482–98491. [Google Scholar] [CrossRef]
  31. Tang, J.; Jing, X.; Wang, B.; Wang, F. Infrared spectra of soluble polyaniline. Synth. Met. 1988, 24, 231–238. [Google Scholar] [CrossRef]
  32. Rodrigues, P.C.; Cantão, M.P.; Janissek, P.; Scarpa, P.C.N.; Mathias, A.L.; Ramos, L.P.; Gomes, M.A.B. Polyaniline/lignin blends: FTIR, MEV and electrochemical characterization. Eur. Polym. J. 2002, 38, 2213–2217. [Google Scholar] [CrossRef]
  33. Li, C.; Xia, Z.; Yan, H.; Shi, Q.; Weng, J. Benzotriazole functionalized polydimethylsiloxane for reinforcement water-repellency and corrosion resistance of bio-based water-borne epoxy coatings in salt environment. Corros. Sci. 2022, 109, 110150. [Google Scholar] [CrossRef]
  34. Tan, Z.; Wang, S.; Hu, Z.; Chen, W.; Qu, Z.; Xu, C.; Zhang, Q.; Wu, K.; Shi, J.; Lu, M. pH-responsive self-healing anticorrosion coating based on a lignin microsphere encapsulating inhibitor. Ind. Eng. Chem. Res. 2020, 59, 2657–2666. [Google Scholar] [CrossRef]
  35. Ge, C.Y.; Yang, X.G.; Hou, B.R. Synthesis of polyaniline nanofiber and anticorrosion property of polyaniline–epoxy composite coating for Q235 steel. J. Coat. Technol. Res. 2012, 9, 59–69. [Google Scholar] [CrossRef]
  36. Gray, L.G.S.; Appleman, B.R. EIS: Electrochemical impedance spectroscopy: A tool to predict remaining coating life? J. Prot. Coat. Lin. 2003, 20, 66–74. [Google Scholar]
  37. Trenin, A.; Pakseresht, A.; Duran, A.; Castro, Y.; Galushek, D. Electrochemical characterization of polymeric coatings for corrosion protection. A review of advances and perspectives. Polymers 2022, 14, 2306. [Google Scholar] [CrossRef]
  38. Ma, C.; Wang, W.; Wang, Q.; Sun, N.; Hu, S.; Wei, S.; Feng, H.; Hao, X.; Li, W.; Kong, D.; et al. Facile synthesis of BTA@NiCo2O4 hollow structure for excellent microwave absorption and anticorrosion performance. J. Coll. Interf. Sci. 2021, 594, 604–620. [Google Scholar] [CrossRef]
  39. Mei, B.-A.; Munteshari, O.; Lau, J.; Dunn, B.; Pilon, L. Physical interpretations of Niquist plots for EDLC electrodes and devices. J. Phys. Chem. C 2018, 122, 194–206. [Google Scholar] [CrossRef]
  40. Cao, K.; Yu, Z.; Yin, D.; Chen, L.; Jiang, Y.; Zhu, L. Fabrication of BTA-MOF-TEOS-GO nanocomposite to endow coating systems with active inhibition and durable anticorrosion performances. Prog. Org. Coat. 2020, 143, 105629. [Google Scholar] [CrossRef]
  41. Ye, Y.; Zhang, D.; Liu, Z.; Liu, W.; Zhao, H.; Wang, L.; Li, X. Anti-corrosion properties of oligoaniline modified silica hybrid coatings for low-carbon steel. Synth. Met. 2018, 235, 61–70. [Google Scholar] [CrossRef]
  42. Bao, Y.; Yan, Y.; Chen, Y.; Ma, J.; Zhang, W.; Liu, C. Facile fabrication of BTA@ZnO microcapsules and their corrosion protective application in waterborne polyacrylate coatings. Prog. Org. Coat. 2019, 136, 105233. [Google Scholar] [CrossRef]
  43. Wei, J.; Li, B.; Jing, L.; Tian, N.; Zhao, X.; Zhang, J. Efficient protection of Mg alloy enabled by combination of a conventional anti-corrosion coating and a superamphiphobic coating. Chem. Eng. J. 2020, 390, 124562. [Google Scholar] [CrossRef]
  44. Wan, S.; Chen, H.; Ma, X.; Chen, L.; Lei, K.; Liao, B.; Dong, Z.; Guo, X. Anticorrosive reinforcement of waterborne epoxy coating on Q235 steel using NZ/BNNS nanocomposites. Prog. Org. Coat. 2021, 159, 106410. [Google Scholar] [CrossRef]
  45. Rout, T.K.; Jha, G.; Singh, A.K.; Bandyopadhyay, N.; Mohanty, O.N. Development of conducting polyaniline coating: A novel approach to superior corrosion resistance. Surf. Coat. Technol. 2003, 167, 16–24. [Google Scholar] [CrossRef]
  46. Zhang, Y.-F.; Hu, C.; Zhao, Z.-B.; Ma, Y.; Lin, D.-D.; Du, X.-Y.; Liu, J.-D.; Li, W.-L. Fabrication of BTA-loaded mesoporous silica-encapsulated ZSM-5 molecular sieve for enhancing anti-corrosion performance of waterborne epoxy coatings. Prog. Org. Coat. 2022, 172, 107160. [Google Scholar] [CrossRef]
  47. Yang, J.; Zou, B.; Fang, Q.; Wang, J.; Wang, L. BTA loaded in various CeO2 nanocontainers in epoxy coating for long-term anticorrosion of low carbon steel. Prog. Org. Coat. 2022, 172, 107156. [Google Scholar] [CrossRef]
  48. Hassanein, A.; Khan, A.; Fayyad, E.; Abdullah, A.M.; Kahraman, R.; Mansoor, B.; Shakoor, R.A. Multilevel self-healing characteristics of smart polymeric composite coatings. ACS Appl. Mater. Interf. 2021, 13, 51459–51473. [Google Scholar] [CrossRef] [PubMed]
  49. Duan, Z.; Zhao, Q.; Wang, S.; Huang, Q.; Yuan, Z.; Zhang, Y.; Jiang, Y.; Tai, H. Halloysite nanotubes: Natural, environmental-friendly and low-cost nanomaterials for high-performance humidity sensor. Sens. Actuators B Chem. 2020, 317, 128204. [Google Scholar] [CrossRef]
  50. Tian, Z.; Yu, H.; Wang, L.; Saleem, M.; Ren, F.; Ren, P.; Chen, Y.; Sun, R.; Sun, Y.; Huang, L. Recent progress in the preparation of polyaniline nanostructures and their applications in anticorrosive coatings. RSC Adv. 2014, 4, 28195–28208. [Google Scholar] [CrossRef]
  51. Yao, J.L.; Ren, B.; Huang, Z.F.; Cao, P.G.; Gu, R.A.; Tian, Z.Q. Extending surface Raman spectroscopy to transition metals for practical applications IV. A study on corrosion inhibition of benzotriazole on bare Fe electrodes. Electrochim. Acta 2003, 48, 1263–1271. [Google Scholar] [CrossRef]
Figure 1. SEM images and EDX spectra of (a,b) pure HNT; (c,d) PANI@HNT-0.5; (e,f) PANI@HNT-1; and (g,h) PANI@HNT-2. Inserts show individual HNT and PANI@HNTs. The red squared areas mark the position where the EDX spectra are obtained.
Coatings 13 01677 g001aCoatings 13 01677 g001b
Figure 2. FT IR spectra of HNT and PANI@HNTs.
Coatings 13 01677 g002
Figure 3. Loading (a) and release (b) of BTA into/from HNT and PANI@HNTs.
Coatings 13 01677 g003
Figure 4. Digital images of waterborne epoxy coatings doped with different amounts of PANI@HNT-2-BTA: (a) 0%; (b) 1%; (c) 3%; (d) 5%; (e) 8%; and (f) 12%.
Coatings 13 01677 g004
Figure 5. SEM images of epoxy coatings doped with different amounts of PANI@HNT-2-BTA. (a,b) surface and cross-section at 3%; (c,d) surface and cross-section at 5%; (e,f) surface and cross-section at 8%; and (g,h) surface and cross-section at 12%. Orange arrows point to individual PANI@HNT-2-BTA; yellow circles mark clustered PANI@HNT-2-BTA.
Coatings 13 01677 g005
Figure 6. Thermal analysis of epoxy coatings doped with different amounts of PANI@HNT-2-BTA: (a)TGA and DTG curves; (b) DSC curves.
Coatings 13 01677 g006
Figure 7. The Bode (a) and Nyquist Plot (b) of waterborne epoxy coatings doped with different amount of PANI@HNT-2-BTA after heating in 3.5wt.% NaCl at 50 °C for 5 days.
Coatings 13 01677 g007
Figure 8. The electrochemical equivalent circuit diagrams used to fit the EIS data of the coatings: (a) the coatings after heating in 3.5wt.% NaCl; (b) the coatings immersed in 3.5wt.% at room temperature.
Coatings 13 01677 g008
Figure 9. EIS data of the coatings immersed in 3.5 wt.% NaCl at room temperature at different durations: (a) Bode modulus plot of 5% PANI@HNT-2-BTA coating; (b) Nyquist plot of 5% PANI@HNT-2-BTA coating; (c) Bode modulus plot of 5% PANI@HNT coating; (d) Nyquist plot of 5% PANI@HNT coating; (e) Bode modulus plot of 5% PANI coating; (f) Nyquist plot of 5% PANI coating; (g) Bode modulus plot of waterborne varnish; and (h) Nyquist plot of waterborne varnish.
Coatings 13 01677 g009aCoatings 13 01677 g009b
Figure 10. Bode (a,b,d,e,g,h) and Nyquist (c,f,i) plots of scratched waterborne epoxy coatings immersed in 3.5 wt.%: (ac) coating doped with PANI@HNT-2-BTA; (df) coating doped with PANI@HNT; (gi) waterborne epoxy varnish coating.
Coatings 13 01677 g010
Figure 11. Electrochemical equivalent circuit diagrams used to fit the EIS data of scratched coatings immersed in 3.5 wt.% NaCl. (a)All the scratched coatings at the early stage of the immersion and the waterborne epoxy vanish through the entire experiment; (b)The scratched coating doped with PANI@HNT-2 at the late stage of the immersion experiment; (c)The scratched coating doped with PANI@HNT-2-BTA at the middle and late stage of the immersion experiment.
Coatings 13 01677 g011
Scheme 1. Schematic illustration of the protective mechanism of coating doped with PANI@HNT-BTA.
Coatings 13 01677 sch001
Table 1. Electrochemical impedance parameters of coatings immersed in 3.5 wt.% NaCl after heating.
The Amount of PANI@HNT-2-BTA Doped in the Coatings (%)CpRp
(Ω∙cm2)
CdlRct
(Ω∙cm2)
WChi Square
(×10−3)
Y0 (F∙cm−2)nY0 (F∙cm−2)n(Ω∙cm2)
05.19 × 10−50.701.16 × 1043.12 × 10−40.625.32 × 1042.57 × 1041.29
33.72 × 10−90.987.46 × 1051.26 × 10−60.612.23 × 1061.04 × 1044.35
55.00 × 10−90.798.46 × 1055.01 × 10−70.652.83 × 1061.96 × 1054.86
83.62 × 10−60.802.19 × 1032.06 × 10−70.531.81 × 1057.50 × 1050.51
126.76 × 10−50.983.10 × 1034.44 × 10−50.612.33 × 1042.12 × 1060.58
Cp—coating CPE, Rp—coating resistance, Cdl—CPE of the double layer, Rct—charge transfer resistance, Y0—admittance magnitude of the capacitor, and n—CPE component power index. Electrochemical equivalent circuit model used: Figure 8a.
Table 2. Electrochemical impedance parameters of coatings immersed in 3.5 wt.% NaCl at room temperature and different times.
Sample Immersion Time (Days)CpRp
(Ω∙cm2)
CdlRct
(Ω∙cm2)
Chi Square
(×10−3)
Y0
(F∙cm−2)
nY0
(F∙cm−2)
n
PANI@HNT-2-BTA-doped coating14.64 × 10−100.973.74 × 1088.37 × 10−100.781.23 × 1098.94
153.73 × 10−100.991.14 × 1088.17 × 10−100.695.26 × 1083.22
303.13 × 10−100.951.04 × 1081.83 × 10−90.732.70 × 1082.67
502.98 × 10−100.987.06 × 1071.45 × 10−90.683.96 × 1081.92
PANI@HNT-2-doped coating14.99 × 10−100.989.41 × 1081.15 × 10−90.392.45 × 1096.27
153.91 × 10−100.973.10 × 1081.98 × 10−90.641.33 × 1083.38
303.93 × 10−100.982.90 × 1081.11 × 10−80.659.33 × 1073.61
503.43 × 10−100.987.74 × 1071.98 × 10−80.786.96 × 1070.91
PANI-doped coating11.9 × 10−100.994.96 × 1087.95 × 10−100.632.86 × 1082.37
152.54 × 10−100.996.76 × 1076.9 × 10−100.661.86 × 1081.91
302.81 × 10−100.994.14 × 1061.91 × 10−90.614.05 × 1070.21
503.49 × 10−100.973.65 × 1051.47 × 10−70.671.15 × 1060.32
Waterborne epoxy varnish 12.73 × 10−1015.34 × 1089.18 × 10−100.693.80 × 1088.22
153.63 × 10−100.973.92 × 1071.26 × 10−90.384.59 × 1084.39
304.30 × 10−100.973.80 × 1061.15 × 10−80.646.98 × 1061.21
505.18 × 10−100.962.85 × 1055.65 × 10−70.732.92 × 1050.78
Cp—coating CPE, Rp—coating resistance, Cdl—CPE of the double layer, Rct—charge transfer resistance, Y0—admittance magnitude of the capacitor, and n—CPE component power index. Electrochemical equivalent circuit model used: Figure 8b.
Table 3. Electrochemical impedance parameters of scratched coatings immersed in 3.5 wt.% NaCl at room temperature.
Immersion DurationRox
(Ω∙cm2)
Rct
(Ω∙cm2)
Rb
(Ω∙cm2)
Circuit Model
Waterborne epoxy varnish coating0 h517 599 -a
8 h529 858 -
24 h388 3316 -
48 h254 4378 -
Coating doped with PANI@HNT-20 h529 858 -a
8 h3260 16,190 -
24 h8105760-b
48 h6505354-
Coating doped with PANI@HNT-2-BTA0 h582 729-a
8 h42 5181 3210 c
24 h118 35,178 4245
48 h141 33,290 6181
Rox—oxide layer resistance, Rct—charge transfer resistance, Rb—BTA complex layer resistance. Circuit Model: Figure 11.
Table 4. Neutral salt spray test on scratched coatings.
SampleSalt Spray Test Duration
 0 h 50 h100 h150 h
Waterborne epoxy varnish Coatings 13 01677 i001
Coating doped with PANI@HNT-2Coatings 13 01677 i002
Coating doped with PANI@HNT-2-BTACoatings 13 01677 i003
Disclaimer/Publisher’s Note: The statements, opinions and data contained in all publications are solely those of the individual author(s) and contributor(s) and not of MDPI and/or the editor(s). MDPI and/or the editor(s) disclaim responsibility for any injury to people or property resulting from any ideas, methods, instructions or products referred to in the content.

