Article

Restoring Force Model of Precast Segmental Reinforced Concrete Piers after Seawater Freeze–Thaw Cycles

1
School of Transportation and Geometics Engineering, Shenyang Jianzhu University, Shenyang 110168, China
2
School of Civil Engineering, Shenyang Jianzhu University, Shenyang 110168, China
*
Author to whom correspondence should be addressed.
These authors contributed equally to this work.
Coatings 2023, 13(1), 16; https://doi.org/10.3390/coatings13010016
Submission received: 28 October 2022 / Revised: 5 December 2022 / Accepted: 19 December 2022 / Published: 22 December 2022
(This article belongs to the Special Issue Recent Progress in Reinforced Concrete and Building Materials)

Abstract

:
Precast segmental reinforced concrete (RC) piers have been widely used in the construction of offshore bridges to speed up construction. Offshore bridges in cold regions are inevitably affected by the seawater freeze–thaw cycles under the periodic movement of tides, which could reduce the mechanical property of RC piers. Based on the low cyclic loading test on 12 specimens with different seawater freeze–thaw cycles, axial compression ratio, diameters of longitudinal reinforcement, and stirrup spacing, the hysteresis characteristics of precast segmental RC piers were analyzed. The test results show that the peak load decreased by 11%, while the peak displacement increased by 40% after 125 seawater freeze–thaw cycles. The hysteresis curves became fuller and the residual displacement became smaller with the accumulation of freeze–thaw damage. In the same 125 freeze–thaw cycles, the peak load increased by 15% and 27% while increasing the axial compression ratio and the longitudinal reinforcement diameter. Combined with the regression analysis of the experimental results, the restoring force model of RC piers considering the seawater freeze–thaw damage and design parameters was established, and the calculation method of each characteristic point in the model was given. The deviation values of flexural capacity are not more than 6.5%, and the deviation values of peak displacement are not more than 12%. The restoring force model determined in this paper could provide a reference for seismic response analysis of offshore bridges in cold regions.

1. Introduction

A large number of offshore bridges have been built in China to optimize the transportation layout and promote economic development in the coastal regions. Compared to the inland environment, offshore bridges are located in a more complex marine environment. During the service period, the precast segmental reinforced concrete (RC) piers suffered from freeze–thaw cycles, dry–wet cycles, and chloride corrosion of seawater for a long time. The American Society of Civil Engineers (ASCE) states that freeze–thaw damage is one of the main factors that cause the durability degradation of concrete. Moreover, the freeze–thaw cycles could also cause damage to rocks and soil in cold regions. With the increase in freeze–thaw cycles, civil engineering materials, such as concrete, rock, and soil, show different degrees of deterioration [1,2,3]. Freeze–thaw damage mainly occurs in cold regions, such as northern Europe, Canada, the northern United States, northern Japan, and north central China. Although the natural environment varies from region to region, the concrete would be damaged to different degrees and result in a decrease in the durability of the RC piers [4,5,6,7]. It is known from the field survey of the offshore bridges along the Binhai Highway in the Liaoning Province of China that the RC piers of the bridges that have been in service for more than ten years were damaged by freeze–thaw cycles. In addition, the Bohai Rim region is located in the Eurasian fault zone, and bridges built in this region are bound to be threatened by strong earthquakes. Therefore, it is necessary to study the seismic performance of precast segmental RC piers after the seawater freeze–thaw cycles. The establishment of the effective restoring force model could provide a reference for the design and repair work on offshore bridges in cold regions.
Subject to the conditions of the freeze–thaw cycles test, scholars have studied the mechanical properties of RC members after freeze–thaw cycles, mainly through the static tests or the low cyclic loading tests on scaled specimens, and the research objects included RC beams, columns, walls, and joints. Duan et al. [8] performed the rapid freeze–thaw cycles test on the RC beams under a freshwater immersion environment, and the axial load was kept constant on each specimen during the test. The bending performance of RC beams with different design parameters was compared and discussed using a four-point bending static load test. The results show that the deterioration rate of freeze–thaw damage to the specimens would be accelerated by the axial load during the rapid freeze–thaw cycles test in freshwater. However, the influence on the ultimate deflection of the static test was not obvious. A bending static load test and fatigue load test were performed on prestressed RC beams after freshwater freeze–thaw cycles, and the effect of freeze–thaw cycles and prestressed degree on the mechanical properties of RC beams were studied in further research [9,10,11]. It could be seen from the analysis that the prestress degree of the specimens would be affected by the freeze–thaw cycles in freshwater, and then lead to the reduction of the flexural capacity of the specimens. Comparing the test results of specimens with different prestress degrees and freeze–thaw cycles, it could be seen that freeze–thaw damage (including the spalling phenomenon of cement mortar on the surface) is negatively correlated with the prestressing degree. The frost resistance of prestressed RC beams could be effectively improved by increasing the prestress degree of the specimens. Based on the experimental study, the calculation formulas of the flexural capacity and the fatigue damage model of prestressed RC beams after freshwater freeze–thaw cycles were established. Qin et al. [12] conducted a freshwater freeze–thaw cycles test on the RC columns (shear span ratio λ = 5.0) under the condition of raising and lowering the temperature in the air with a freshwater spraying device. Subsequently, a low cyclic loading test was performed on the RC columns after freeze–thaw damage. The effects of different numbers of freeze–thaw cycles on the seismic performance of RC columns were analyzed by comparing the failure form, hysteresis curve, flexural capacity, and displacement ductility coefficient. It could be seen that the main failure form of the RC column in the low cyclic loading test was a flexural failure according to the analysis, and the failure form was not affected by the number of freeze–thaw cycles. Both the flexural capacity and the displacement ductility coefficient of the RC column decreased with the increase in the number of freeze–thaw cycles in freshwater. Qin [13] carried out a freshwater freeze–thaw cycles test on RC columns with different design parameters (concrete strength grade, axial compression ratio, and shear span ratio) under the condition of raising and lowering the temperature in the air with a freshwater spraying device, and the low cyclic loading test was carried out on RC columns after freeze–thaw damage. The effects of freeze–thaw damage and design parameters were analyzed by comparing the failure form, hysteresis curve, flexural capacity, stiffness degradation, and energy dissipation capacity of RC columns. The results show that the failure form in the low cyclic loading test of the small shear span RC column (shear span ratio λ = 2.5) after freshwater freeze–thaw cycles changed from flexural–shear failure to shear–flexural. The flexural capacity, deformation capacity, and energy dissipation capacity of each specimen were degraded by varying degrees with the increase of the freeze–thaw cycles in freshwater, of which the degradation rate of strength and stiffness gradually accelerated. The flexural capacity and energy dissipation capacity of the RC column increased first and then decreased with the increase of the axial compression ratio in the same number of freeze–thaw cycles. The deformation capacity decreased gradually, and the degradation rate of stiffness accelerated continuously. The flexural capacity and energy dissipation capacity of RC columns increased with the increase of concrete strength grade, and the displacement ductility coefficient decreased slightly.
The research on the mechanical properties of RC piers (or columns) after the freeze–thaw cycle mainly focuses on the seismic performance and the effective restoring force model that could truly reflect the force condition of RC piers in cold regions under earthquake action. Scholars at home and abroad usually use the method of theoretical deduction or fitting test results to establish the restoring force model of RC components after the freeze–thaw cycle. Gong [14] established the restoring force model of RC piers after freshwater freeze–thaw cycles and determined the calculation method of each characteristic point in the proposed model based on the results of the low cyclic loading test. The proposed restoring force model was suitable for the study of the seismic problem of RC piers in a freshwater environment. Zheng et al. [15,16,17] established the restoring force model of (low shear span ratio) shear walls after freshwater freeze–thaw cycles, and the numerical analysis was carried out according to the relevant experiments. The effectiveness of the proposed model was verified by comparing the results of hysteresis curves and cumulative energy consumption between the experiment and numerical calculations. It was shown that the established restoring force model could well reflect the mechanical properties of the (low) shear walls after the freshwater freeze–thaw cycles under the action of an earthquake. Zheng et al. [18] obtained the mathematical expression of the ultimate work ratio coefficient of RC frame joints after the freshwater freeze–thaw cycles through a regression analysis of test results. The cycle degradation index based on the cycle energy consumption and the calculation method of each characteristic point in the model was determined. The specific hysteresis curve rule was given, and the restoring force model of the RC frame joints after the freshwater freeze–thaw cycle was established. Most of the existing studies have considered rain or steam environments.
The summary of the above literature shows that most of these scholars study the restoring force model of RC piers under a freshwater immersion environment using a test method. However, the RC piers of the offshore bridges have been in active service under a seawater immersion environment for a long time. There is a lack of corresponding experimental research to obtain the restoring force model of RC piers after the seawater freeze–thaw cycle. Therefore, a test method for freezing and thawing in seawater was designed in this paper, and the test specimens mainly adopted the structure form of precast segmental RC piers. Twelve precast segmental concrete piers with different longitudinal reinforcement diameters (12 mm, 14 mm, and 16 mm) and stirrup spacing (100 mm, 75 mm, and 50 mm) values were prepared, and the specimens were tested under a low cyclic load and at different axial compression ratios of 0.15, 0.225, and 0.3 after 0, 25, 50, 75, 100, and 125 freeze–thaw cycles in natural seawater. After analyzing the hysteretic characteristics of the specimens, the restoring force model of RC piers after seawater freeze–thaw cycles was established, which provides a reference for seismic response analysis of offshore bridges in cold regions.

2. Constitution of Concrete after Seawater Freeze–Thaw Cycles

2.1. The Overall Design of the Experiment

A total of 12 precast segmental (PS) RC pier test specimens were designed and produced in this paper to study the seismic performance of RC piers after the seawater freeze–thaw cycles. The overall design of the specimens is shown in Figure 1. The flexural failure segment of the PS pier was designed and made into a precast segment, and the seawater freeze–thaw cycles test was carried out on the precast segments. During the test, the (freeze–thaw) segments of the PS piers that would be damaged by flexing were completely immersed in a seawater environment. The advantages of the test scheme in this paper are as follows: ① The saturation state of the test specimens was closer to that of the RC piers under the seawater freeze–thaw cycles in the actual field environment [19], which makes the results more realistic. ② The test conditions of the specimens were the same as those of the study on the mechanical properties of concrete. Therefore, the research results on the mechanical properties of concrete materials could be directly applied to the numerical analysis of components. ③ Precast segmental RC piers have attracted extensive attention in the industry, especially in the field of offshore and cross-sea bridge engineering. Therefore, the results of this paper could provide a reference for the design of offshore bridges in cold regions.
During the design stage of the test specimens, the influence of different design parameters of PS piers on seismic performance should be considered comprehensively. The design parameters of the test specimens are summarized as shown in Table 1, including the number of seawater freeze–thaw cycles, axial compression ratio, longitudinal rebar diameter, and stirrup spacing. In Table 1, the letters F, A, L, and J represent the first letters of freeze–thaw, axial compression, longitudinal rebar diameter, and stirrup spacing, respectively. The letter λ represents axial compression ratio, ds stands for longitudinal reinforcement diameter, ρl stands for longitudinal reinforcement ratio, ls stands for stirrup spacing, and ρv stands for volume stirrup ratio.

2.2. Materials and Connecting Devices

The precast segment and the base were assembled with grouting sleeve, and the steel connectors were used as the connecting device of the rebar in the process of secondary casting. The grouting and sealing material used in the process of segmental assembling was produced by Beijing Sidajianmao Technology Development Co., Ltd., and the product and its specific parameters are shown in Figure 2 and Table 2.
Depending on the requirements of steel bars with different diameters, grouting sleeves with inner diameters of 44 mm, 46 mm, and 48 mm were selected to produce test specimens; the lengths were 250 mm, 280 mm, and 310 mm, respectively. The grouting sleeve was grouted and made into the tensile specimen, and the uniaxial tensile test was carried out. The failure form of the specimen was the fracture of the steel bar, as shown in Figure 3.
Due to the relatively small cross-section size of the RC pier and column body, not enough grout sleeves could be laid out. Therefore, self-made steel connectors and secondary casting were adopted to complete the production of the specimens. Steel connectors were used to extend the longitudinal rebar, and the parameters are shown in Table 3. The end of the longitudinal reinforcement connected with the steel connector should be processed to match the thread shape of the steel connector for use.
It could be known from the tensile test that the tensile specimen was broken at the steel bar thread, as shown in Figure 4. The stress–strain curve of the tensile process was extracted and compared with the tensile test results of rebar without a steel connector to verify whether the steel connector is suitable for the low cyclic loading test of the specimens, which is shown in Figure 5. Compared with the tensile test results of rebar without a steel connector, the yield strength of the two is the same. However, the ultimate tensile strength and ultimate strain of the specimen with a steel connector decreased by 8% and 52%, respectively. When the steel bar at the interface of the secondary casting does not exceed the yield strength, the steel connectors could meet the requirements of the low cyclic loading test.

2.3. Design of Freeze–Thaw Segment and Base

The structural dimensions and reinforcement details of the freeze–thaw segment are shown in Figure 6. Eight symmetrical longitudinal bars were embedded in the segment for prefabrication and secondary casting. The thickness of the concrete cover was 15 mm. The structural dimensions and reinforcement details of the freeze–thaw sections comply with the following principles: ① The section size of the freeze–thaw section should be determined according to the internal effective space of the rapid freeze–thaw cycles test device (995 mm × 550 mm), which allows the rapid freeze–thaw cycles test to be carried out on as many specimens as possible. The section size of the freeze–thaw section is 260 mm × 220 mm in this paper. ② The height of the freeze–thaw section needs to consider the internal effective height of the rapid freeze–thaw cycles test device, namely, 600 mm. Including an effective length of 135 mm longitudinal reinforcement to be inserted into the grouting sleeve and a thread length of 25 mm for the steel connector, the height of the whole segment cannot exceed 600 mm. ③ The height of the freeze–thaw section concrete must be higher than the flexural failure height of the RC pier. The failure height is estimated by the plastic hinge height of the RC pier in this paper. The calculation formula for the plastic hinge height is as follows:
L p = 0.08 H + 0.022 f y d s 0.044 f y d s  
L p = 2 3 b  
where Lp is the height of the plastic hinge; H is the height of the cantilever pier or the distance between the plastic hinge section and the anti-flexural point; b is the size of the short side of the rectangular section or the diameter of the circular section; fy is the standard value of tensile strength of longitudinal reinforcement; and ds is the diameter of longitudinal reinforcement. The height of freeze–thaw segment concrete was determined to be 400 mm, with 50 mm extension reinforcement bars reserved on the top surface and 135 mm extension reinforcement bars reserved on the bottom surface after comprehensive consideration.
The height of the post-casting section (secondary casting) determines the height of the pier specimen, which could be determined by adjusting the shear span ratio of the test specimens. The shear span ratio of the RC pier is between 2.5 and 10 to ensure that the main failure form of the RC pier is a flexural failure, as stipulated in the standard JTG/T B02-1-2008 [20]. According to the experience, the shear span ratio λ = 4 was determined. Given the height of the loading device, the height of the post-pouring section was finally determined to be 650 mm, and the height of the specimen cylinder is 1050 mm in this paper. According to the design of the column size and longitudinal reinforcement of the specimens, the structure size and reinforcement details of the specimen base were determined, which is shown in Figure 7. HRB400 reinforcement and HPB300 reinforcement were used as longitudinal reinforcement and the stirrup of the specimen, respectively. Among them, the diameters of longitudinal bars were respectively adopted at 12 mm, 14 mm, and 16 mm, and the stirrup diameter was adopted at 8 mm. The mechanical parameters of the two specifications of reinforcement are shown in Table 4. HPB300 type rebar was chosen for the following reasons: ① It is pointed out in the standard JTG/T B02-1-2008 that only the strength of the stirrup material and the spacing of the stirrup need to be considered in bridge design, and there are no excessive requirements on the type of stirrup. ② HPB300 type rebar is often used in the production of small components because of its easy flexural characteristics. The Chinese code for the design of concrete structures GB 50010-2010 [21] points out that HPB300 could be used for concrete structure stirrups. ③ Due to the continuous development of material science, most steel bars with a yield strength of 300 MPa produced in China are rolled plain steel bars.

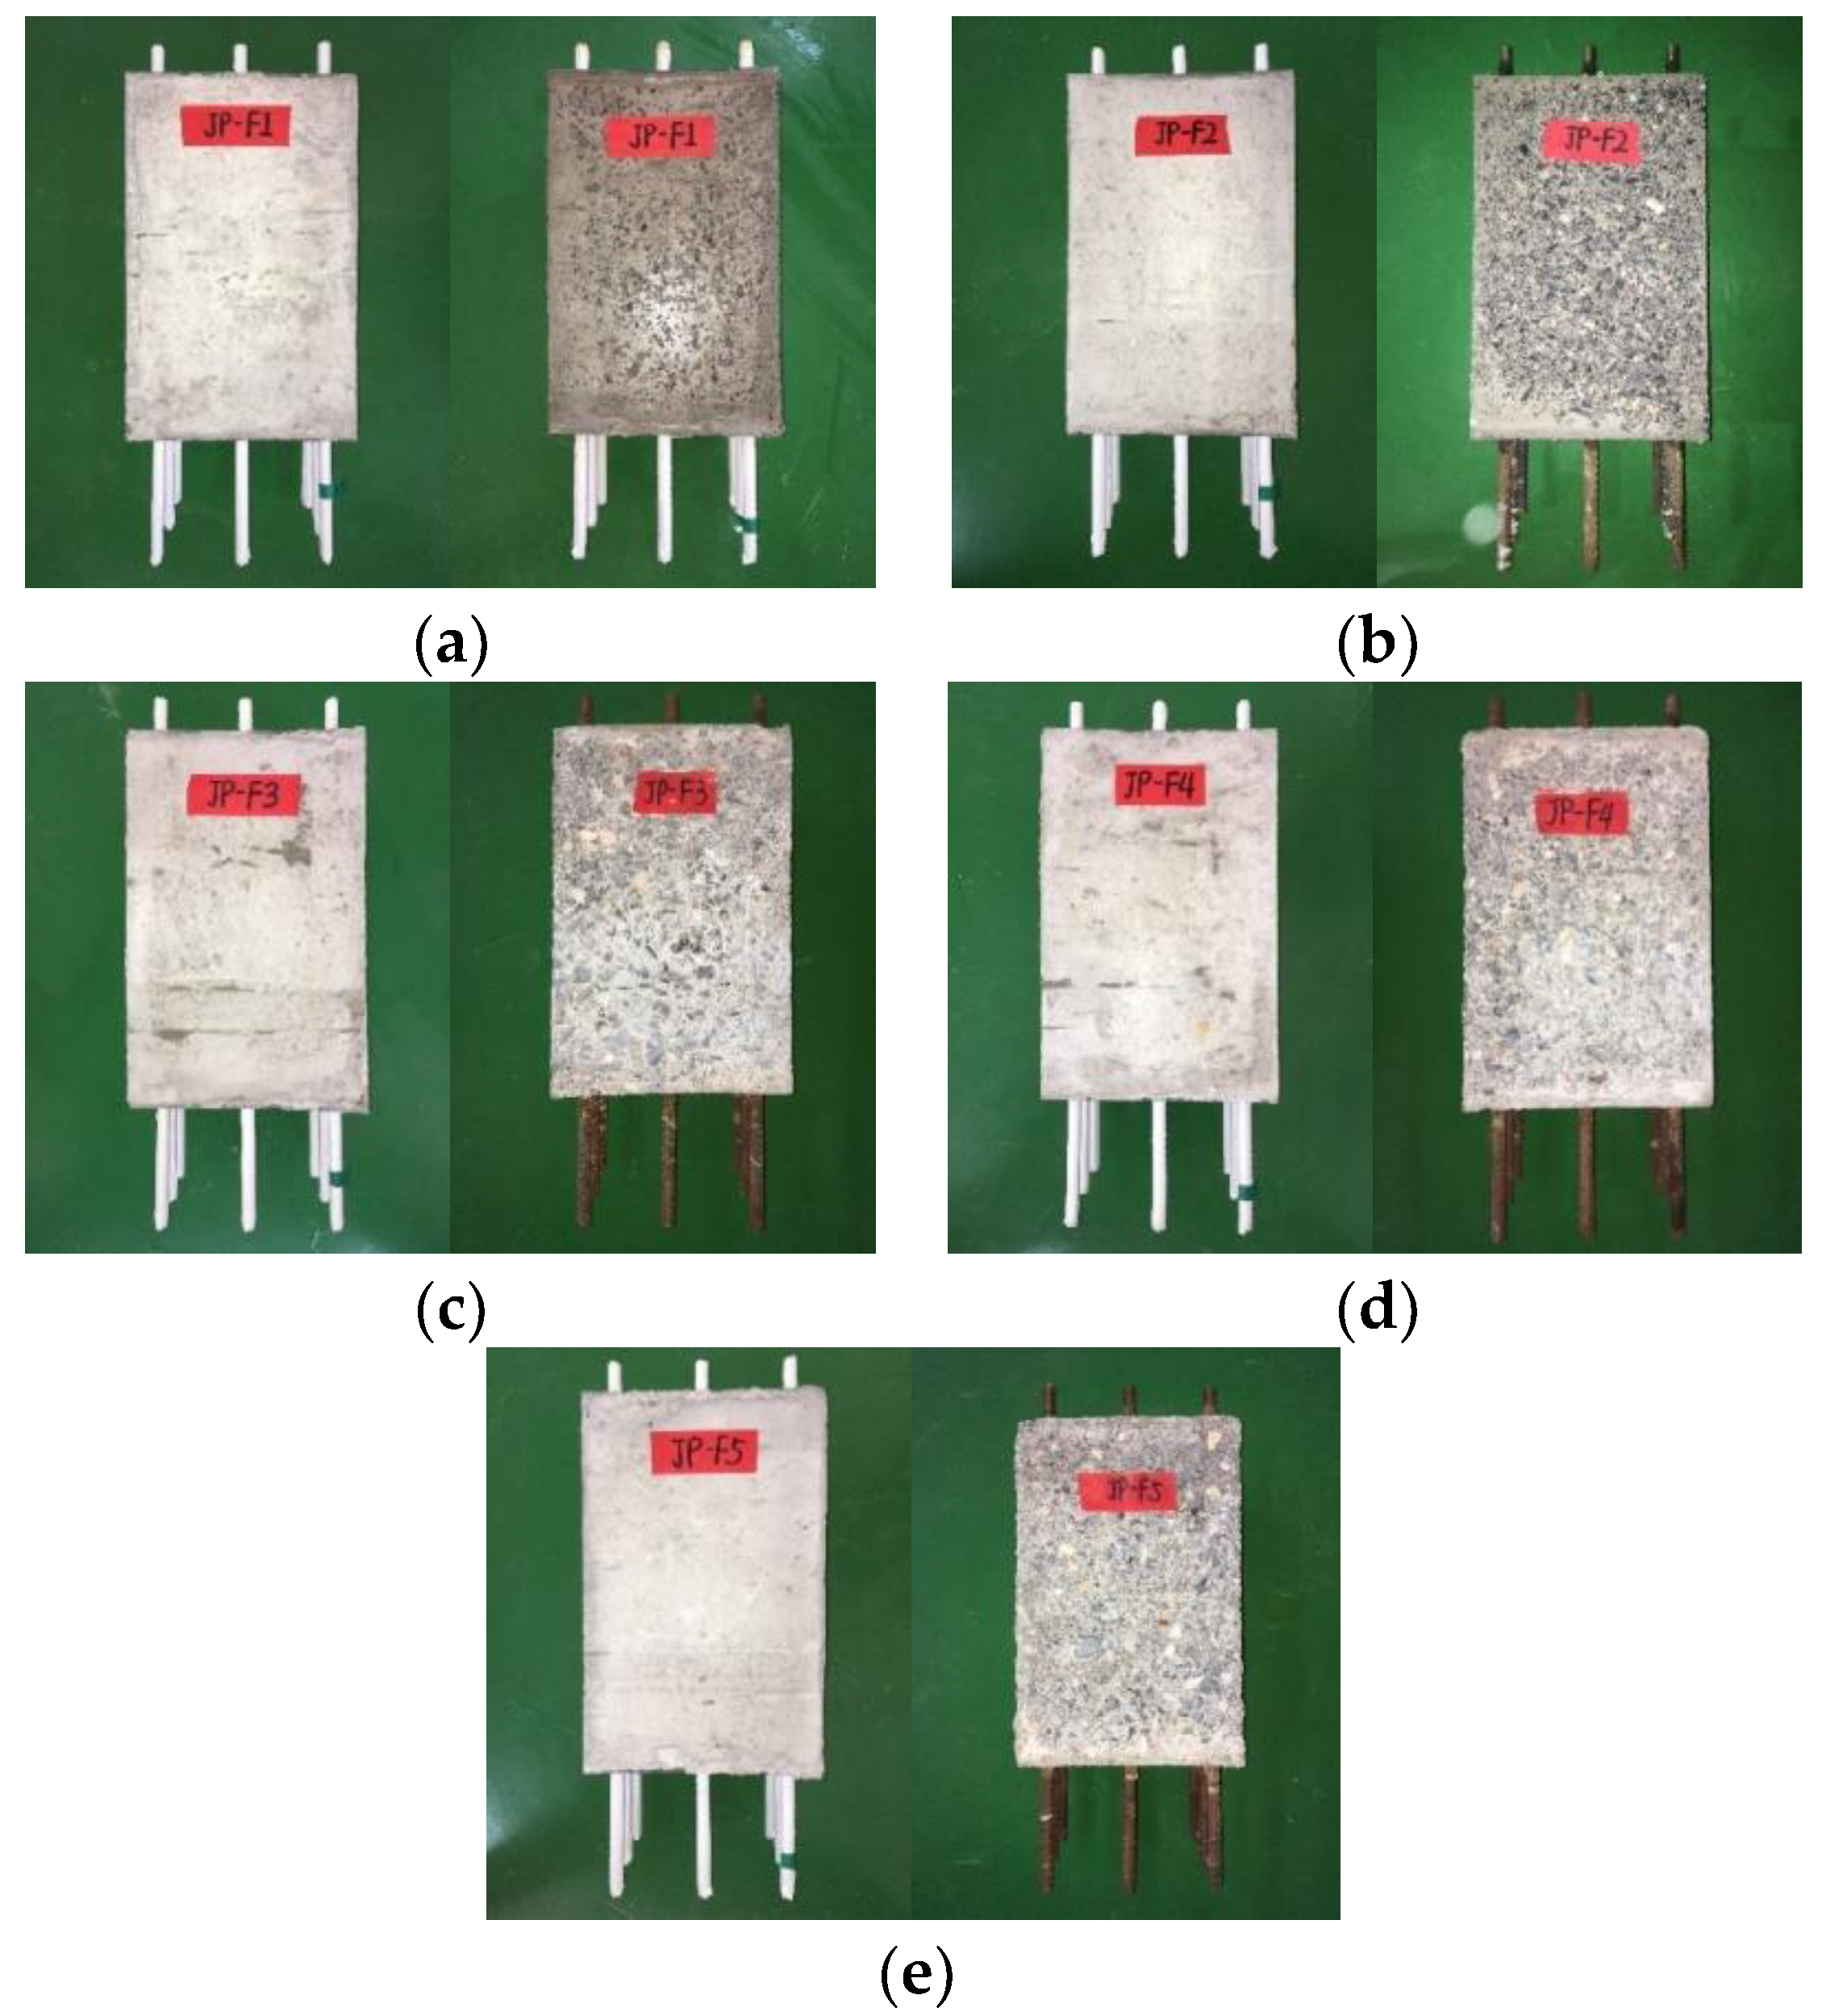
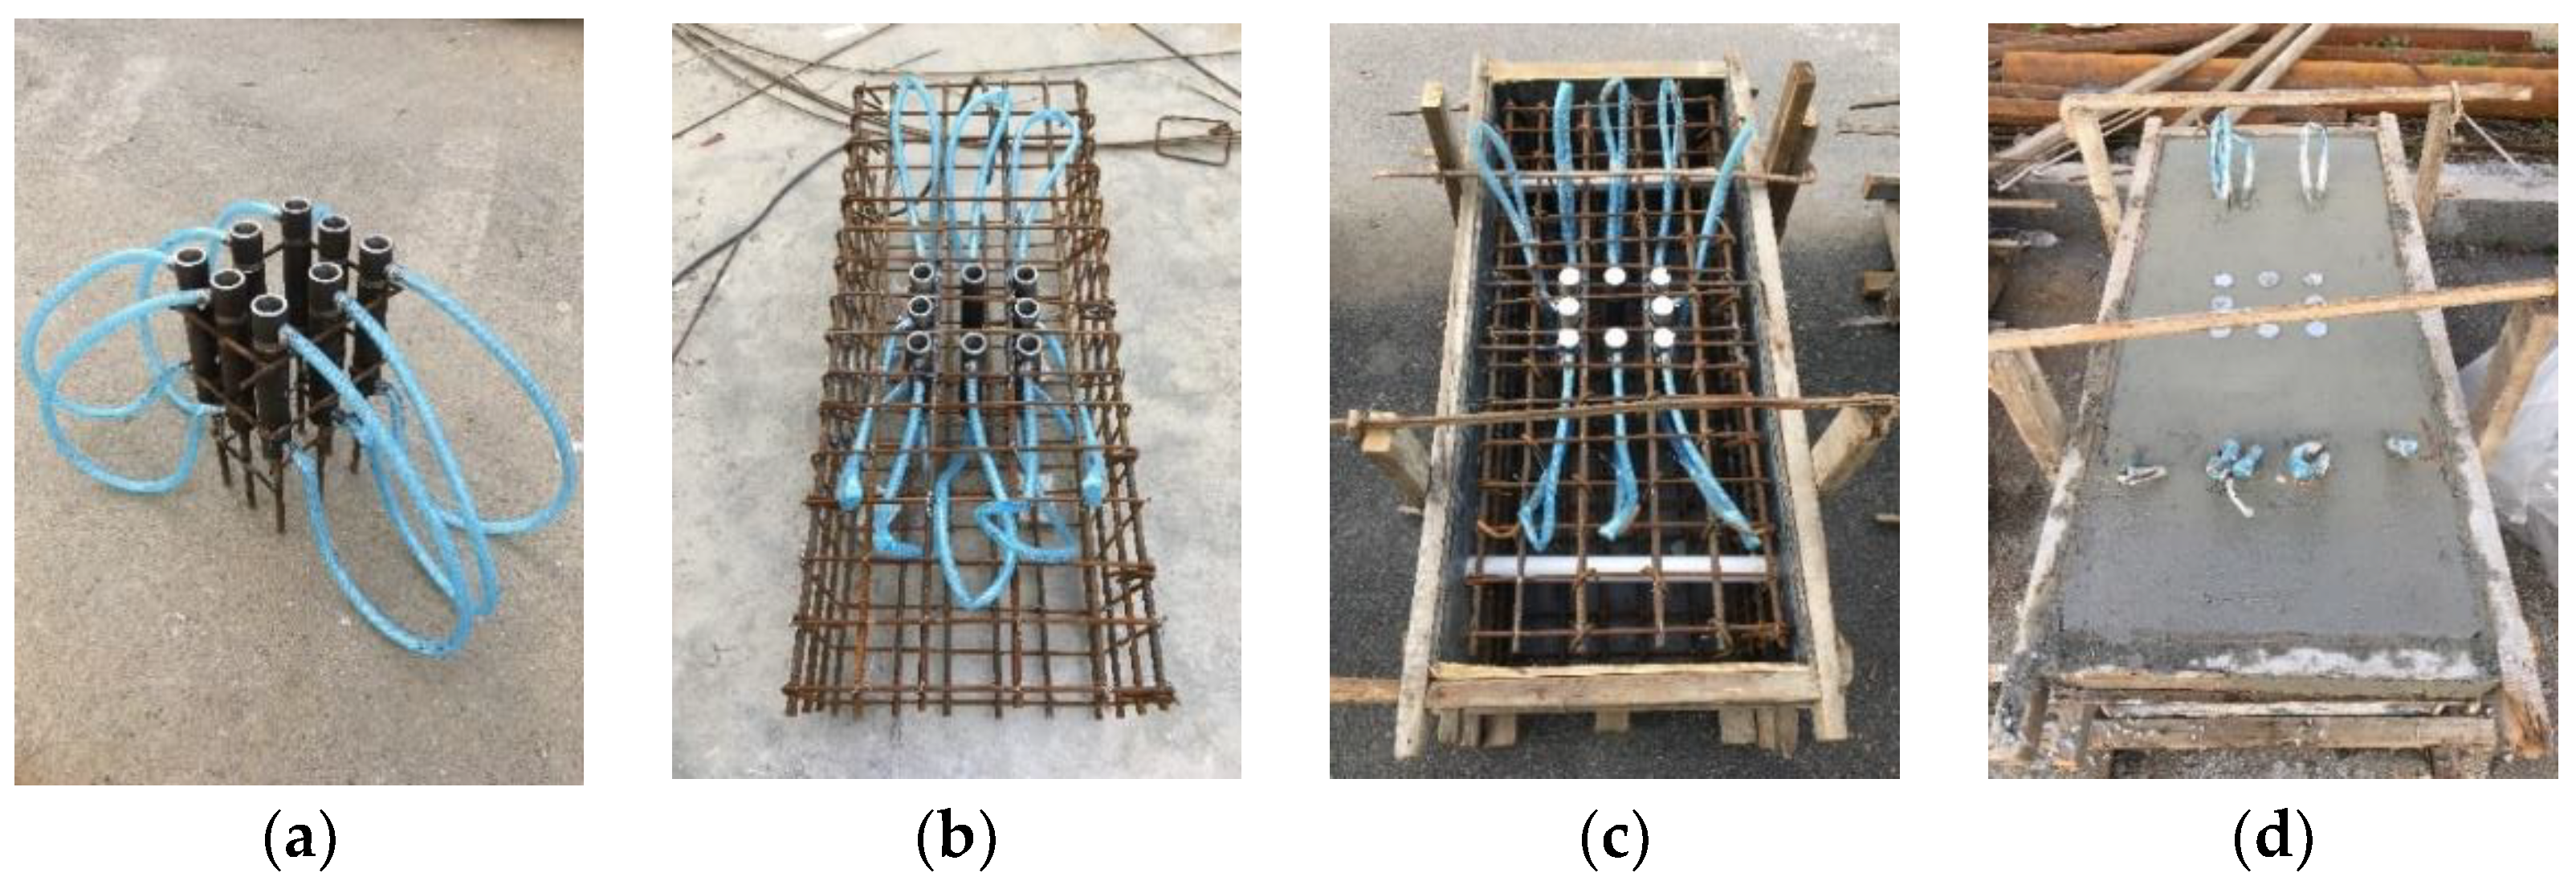
2.4. Fabrication of Prefabricated Sections and Freeze–Thaw Cycles Test

The manufacturing process of the freeze–thaw segment is shown in Figure 8. The top and bottom side of the framework was replaced with polymethyl methacrylate (PMMA) to prevent the superposition of multi-dimensional freeze–thaw damage caused by water absorption of the concrete at the top and bottom of the freeze–thaw section acrylates, as shown in Figure 8a. Round holes were cut on the PMMA plate for reinforcement to pass through. To position the longitudinal reinforcement, in preparation for assembling the specimen later, the round hole was sealed with glass glue. The concrete was poured after the binding steel bars and formwork support were completed, which is shown in Figure 8c. the mix proportions of concrete used in the test are shown in Table 5.
The rapid freeze–thaw cycles test device for concrete has been modified to perform rapid freeze–thaw cycles tests on the fabricated segments, which are shown in Figure 9. In this paper, according to the size of the abdominal cavity of the test device, five stainless steel containers were designed and manufactured, shown in Figure 9a; their size was 280 mm × 240 mm × 510 mm, used for the freeze–thaw section in the rapid freeze–thaw cycles test. All four sides of the freeze–thaw container section exceeded the section of the freeze–thaw section by 10 mm; the aim was to allow the freeze–thaw segments to be immersed evenly in seawater. At the same time, four stainless steel containers with relatively small cross sections were designed to hold the temperature measurement specimens, which are shown in Figure 9b; the size of the temperature measuring vessel was 120 mm × 120 mm × 510 mm.
After 48 h of pouring, the freeze–thawed section is strong enough to remove the mold. Remove the wood mold and retain the top and bottom PMMA panels. Before the freeze–thaw cycles test, steel bars need to be treated with rust prevention. The purpose is to prevent corrosion of steel reinforcement during the curing stage and freeze–thaw cycles test, thus affecting the test results. The anti-rust treatment is mainly achieved by winding waterproof tape on the surface of the steel bar, as shown in Figure 9c. After 24 days of freeze–thaw section curing, soak in natural seawater for hydration. After filling the specimen with water, the freeze–thaw sections and temperature-measuring concrete specimens are arranged in the concrete rapid freeze–thaw cycles test device, which is shown in Figure 9d. Set the thawing and freezing temperatures of the concrete rapid freeze–thaw cycles testing machine to 5 °C and −20 °C and start the test. The time of a single freeze–thaw cycle is not more than 4 h. The thawing time of the specimen account for less than 1/4 of the time of a single freeze–thaw cycle. Taking 25 freeze–thaw cycles as the test cycle, the segments after the freeze–thaw cycles can be taken out. Clean the cement mortar on the surface of the segment and replace the soaking solution in the freeze–thaw cycle container. After completing the corresponding number of freeze–thaw cycles, the segment is taken out. The test was not stopped until all segments completed the corresponding number of freeze–thaw cycles which was referred to in the previous research [22].
The surface conditions of the RC segment before and after the seawater freeze–thaw cycles test were compared, which is shown in Figure 10. When the number of seawater freeze–thaw cycles was 25, there was slight peeling of the cement mortar on the surface of the segment, as shown in Figure 10a. After more than 50 cycles of freeze–thaw, the cement mortar on the segment surface has a large area of spalling, accompanied by the exposure of coarse aggregate, which is shown in Figure 10b. As the number of freeze–thaw cycles increased from 50 to 125, the spalling of cement mortar on the segmental surface gradually became more serious. The depth of segment surface defects caused by freeze–thaw cycles gradually deepen, which is shown in Figure 10c,d. When the number of freeze–thaw cycles reaches 125, the cement mortar on the segment surface is all peeled off, and the coarse aggregate is completely exposed on the surface, which is shown in Figure 10e. The corner part of the segment is slightly expanded and deformed; in some areas, a single stone fell off, which indicates that freeze–thaw damage occurs at the interface between cement mortar and coarse aggregate. If we had continued our rapid freeze–thaw cycles test, freeze–thaw expansion and deformation may have affected subsequent assembly and secondary casting. The final number of freeze–thaw cycles in this test was reasonably stopped at 125.

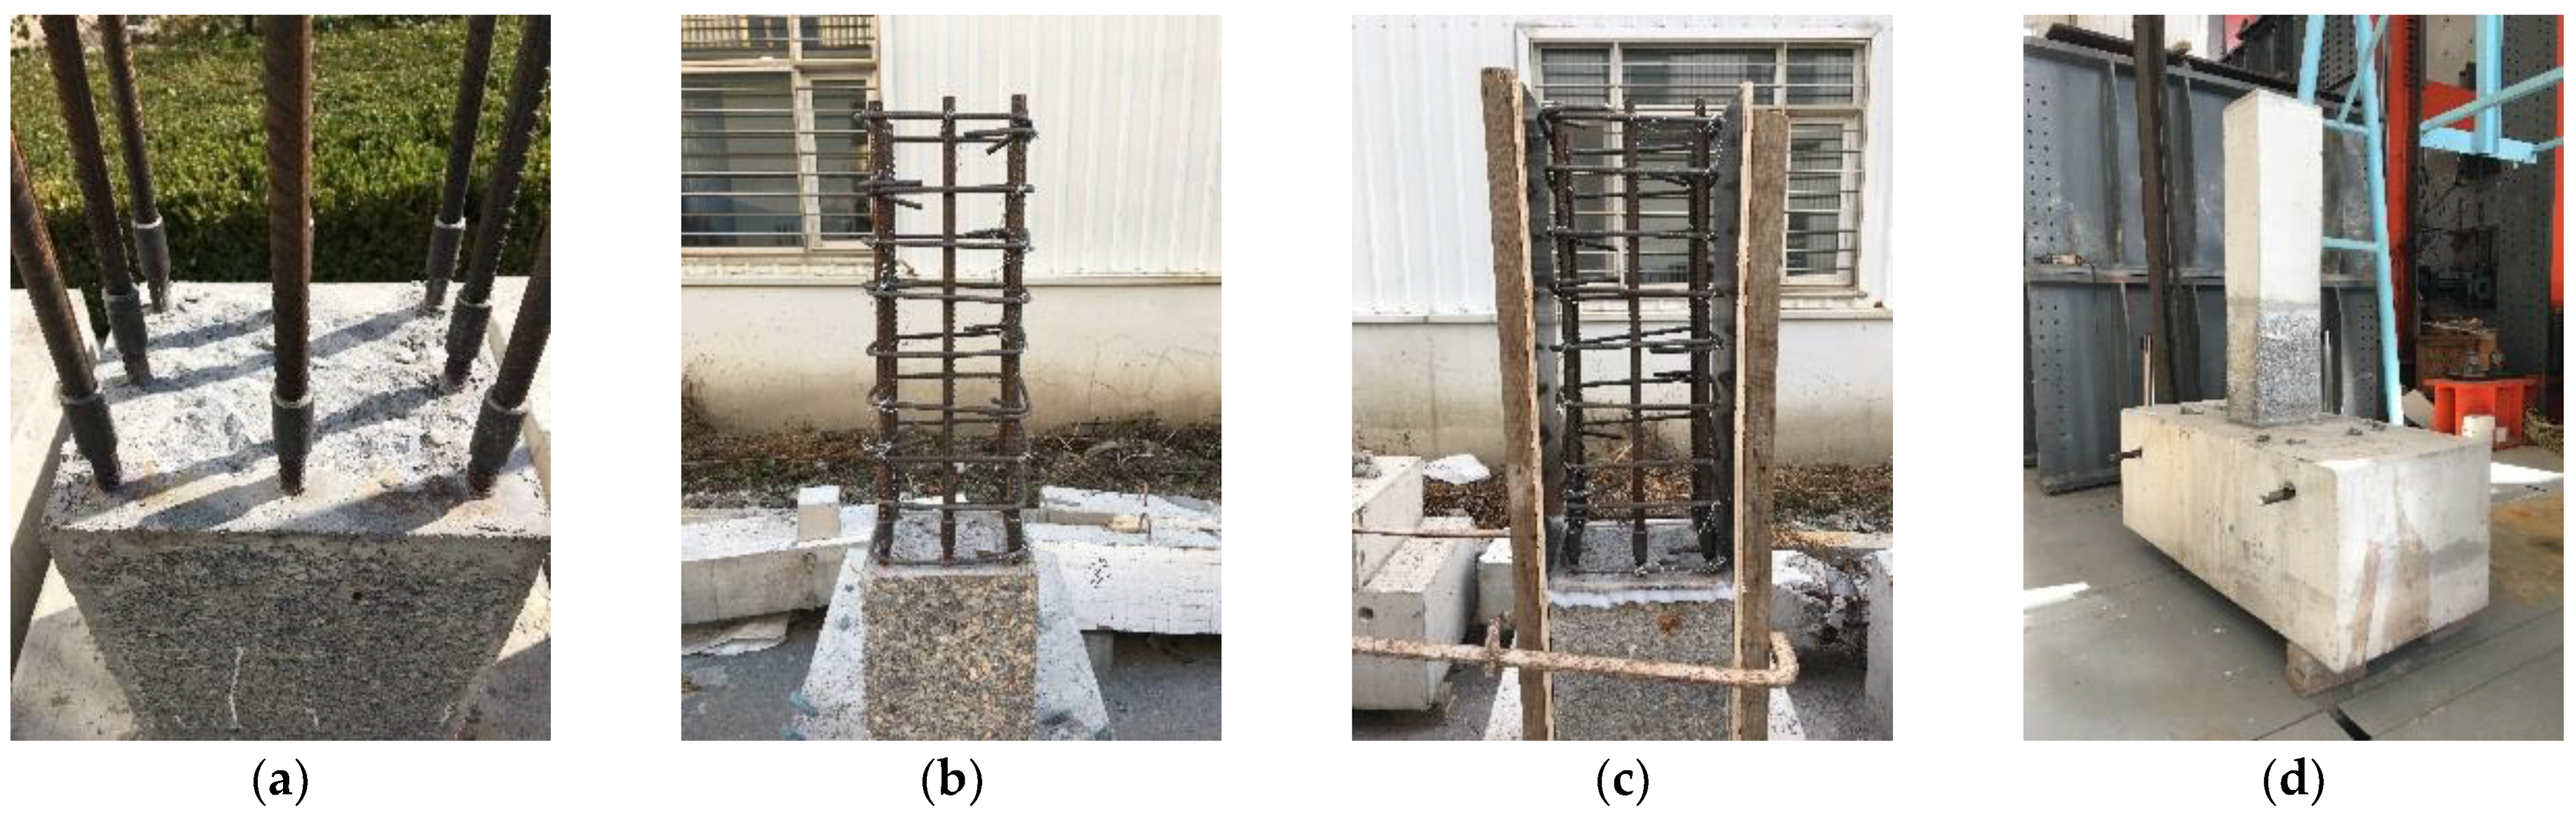
2.5. Section Assembly and Secondary Casting

After a rapid freeze–thaw cycles test, segment assembly and secondary casting were performed for the low cyclic loading test of the specimens. The first step is to complete the fabrication of the base, as shown in Figure 11.
Two points should be paid special attention to in the production process of the base: ① The position of the grouting sleeve and the position of the longitudinal reinforcement extended at the bottom of the sleeve need to be accurately located. To ensure that the rebar of the freeze–thaw section is inserted precisely into the center of the grouting sleeve, in this paper, the grouting sleeve was positioned by welding, which is shown in Figure 11a,b. ② The inlet and outlet of the grouting sleeve need to be extended through the hose to ensure the feasibility of the grouting process. The sleeve was filled with grouting material mainly through the connection principle. So, the grout and drain openings need to be extended to the surface of the base through a hose, which is shown in Figure 11c. In this paper, a hose is first used to connect the grouting port and the drainage port, as shown in Figure 11a. The hose needs to be cut off for grout and drainage after the base concrete is poured and hardened. The flow of concrete and its hardening and expansion clog the hose and then affect the grouting process to prevent the concrete from being poured for the base. Steel bars need to be inserted inside the hose to ensure that the hose is unobstructed, as shown in Figure 11c. The top of the grout sleeve should be covered before pouring the base concrete to ensure that no grout flows in and that the sleeve interior is always dry during curing. How to carry out the pouring of concrete is shown in Figure 11d.
After the standard curing of the concrete of the base for 28 days, the piecing work could be carried out. Firstly, a grid was drawn on the top surface of the base to determine the area of the sealing material. The interface of the base and the freeze–thaw segment contacting each other was roughened, as shown in Figure 12a,b. After roughening, the roughened area should be cleaned and soaked with fresh water. According to the specified proportion of sealing material and manual stirring, stop stirring when the sealing material reaches high plasticity. The sealing material was evenly spread on the surface of the base for assembly and pre-pressed with steel plates. Four nuts used for the restriction site were placed at the corners of the sealing material laying surface, the height of which was 15 mm, shown in Figure 12c.
According to the proportion specified by the manufacturer, the grouting materials were configured and manually stirred. When the grouting material reaches a high fluidity, the mixing can be stopped and the grouting poured from the top of the grouting sleeve. In the grouting process, the thin steel bar is inserted to ensure that the air is removed from the grouting sleeve and the part is filled with the grouting material, which is shown in Figure 12d. When the grout material flows out of the hose of the grout hole and the drain hole, that indicates that the inside of the grouting sleeve is filled with grouting material, the segments that have been subjected to rapid freeze–thaw cycles are vertically inserted into the base, as shown in Figure 12e. After the freeze–thaw section was inserted into the base, it was hammered down with a glue hammer and leveled and straightened by a horizontal rule. Ensure that the facade of the freeze–thaw segment is perpendicular to the top surface of the base. Additionally, ensure that the elevation of the freeze–thaw section is parallel to the elevation of the base. If the offset angle is too large, it is necessary to insert a wooden wedge into the slurry laying surface for adjustment. About half an hour later, the backseat slurry material begins to harden, the nuts need to be removed, and the gap needs to be filled with the sealing material. The finished assembly is shown in Figure 12f.
After the assembly was completed, secondary pouring was carried out. The whole secondary pouring is shown in Figure 13. The extension of the longitudinal rebar by steel connectors is shown in Figure 13a. The positioning and assembling of the stirrup are shown in Figure 13b. The formwork was made as shown in Figure 13c, and the upper margin of the F–T segment was coated with glass cement. The secondary pouring was finished, which is shown in Figure 13d.

3. Low Cyclic Loading Test of the Specimens
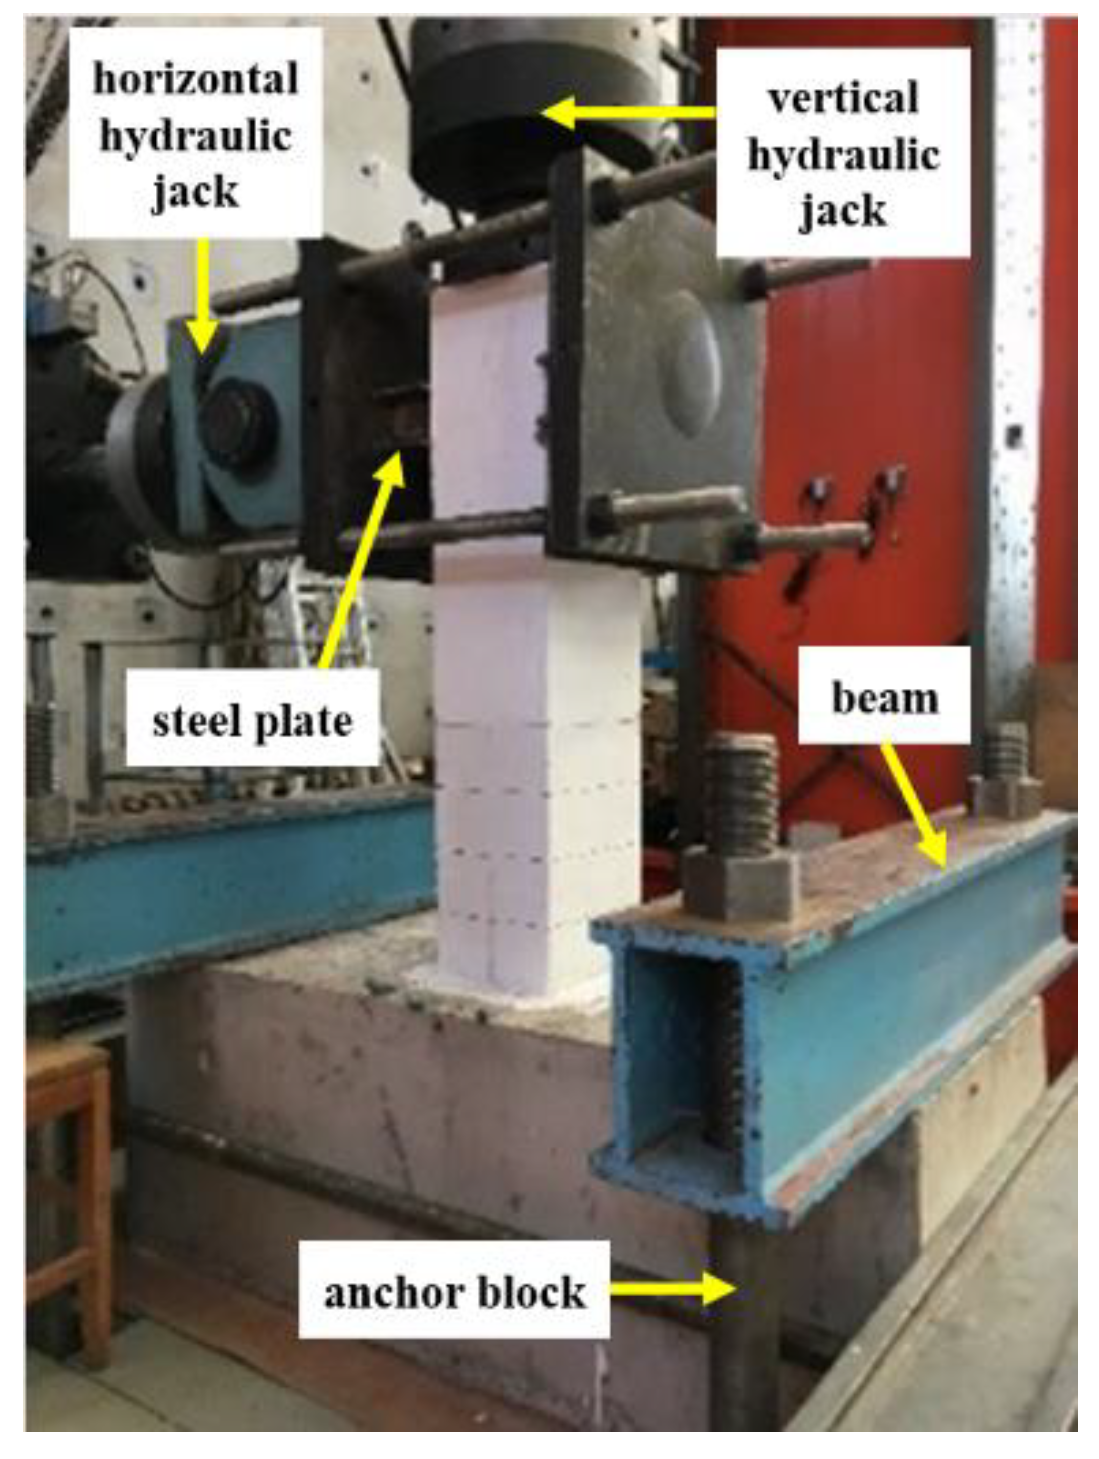
3.1. Test Device

The test was conducted in the structural hall of the bridge and tunnel Research and Development base of the Dalian University of Technology; the specimen and test loading device are shown in Figure 14. The base of the specimen was fixed on the floor of the test hall by two beams and four anchor blocks. It was fixed by two beams and two long bolts and connected with the shear wall. The vertical axial force was provided by the hydraulic jack with an ultimate load of 3000 kN. It was delivered via spherical hinges and rolling rails, and the specimen was kept with a constant vertical axial force. A vertical hydraulic jack was controlled by an electro-hydraulic servo system. It ensured that the error between the applied vertical axial force and the input value was not more than ±5%. According to the specifications for the design of highway-reinforced concrete and prestressed concrete bridges and culverts (JTG 3362-2018) [23], the vertical axial force F could be calculated according to Equation (3):
F = λ f c d A c  
where λ is the designed axial compression ratio of the specimen; fcd is the design strength of the concrete; and Ac is the cross-section area of the concrete specimen.
The horizontal cyclic loading changes from the limit displacement ±300 mm, an actuator with a range of ±1000 kN, and the pier of the specimen were connected with the shear wall by two ball hinges at the head, tail, and the self-made fixture, respectively. The actuator loading angle could then be adjusted. The weight of the actuator cylinder was lifted by an inverted chain suspended from the frame beam to try to avoid the test error caused by the P-Δ effect. The loading method of displacement control was used to load the specimen in this paper. The loading rate was set as 0.1 mm/min according to the requirements of the specification standard for test methods of concrete structures (GB/T 50152-2012) [24]. The loading process of the test is shown in Figure 15.
When the amplitude of lateral loading displacement was lower than the predicted yield displacement Δy (about ±6 mm), loading was carried out according to ±2 mm and ±4 mm steps. When the amplitude of lateral loading displacement exceeded the yield displacement Δy, loading was carried out according to the multiple of yield displacement Δy, (i.e., 0.5Δy, Δy, 2Δy, 3Δy, etc.). According to the content of the Chinese specification for seismic test of buildings (JGJ/T 101-2015) [25], when loading to the same displacement loading amplitude, it is necessary to carry out three low cyclic loading tests. The tests were stopped when the lateral load at the top of the pier decreased to 80% of the peak load during the test.

3.2. Experimental Phenomenon

The cracking and failure of the specimens after the low cyclic loading test of the specimens are shown in Figure 16 and Figure 17. The failure mode of all specimens is a flexural failure. The failure process of specimens in the low cyclic loading test of the specimens is roughly the same, which could be summarized as follows:
(1) When the loading displacement amplitude was ±2 mm, the first transverse crack was generated in the segmental assembly specimen. The cracking position was at the joint of the freeze–thaw section and post-pouring section (400 mm away from the pier foot). When the displacement amplitude of ±4 mm loading was finished, three new transverse cracks were generated on the pier surface. About 100 mm apart, subjected to 125 cycles of seawater freeze–thaw, this time, cracks appeared on the sealing interface (pier foot) of the slurry material, which is shown in Figure 17a. When the loading displacement amplitude of JP-F0 specimens reached ±6 mm, the pier foot crack appeared, as shown in Figure 17b. When the loading displacement amplitude reached ±6 mm, the transverse crack extended about 30~50 mm to the non-loaded facade of the pier, as shown in Figure 17c. At this stage, the specimen was in the elastic stage;
(2) When the displacement amplitude reached ±9 mm, the transverse crack extended diagonally in the facade of the specimen in the non-loading direction. As the horizontal displacement continued to increase, the oblique cracks in the non-loaded facade gradually extended. When the loading displacement amplitude of specimen JP-F0 reached ±24 mm, the extension length of the inclined crack was similar to that of specimen JP-F5 when the loading displacement amplitude reached ±18 mm, which is shown in Figure 16d and Figure 17c;
(3) With the continuous increase of loading displacement amplitude, the number of transverse cracks increased, and the oblique cracks continued to extend. Vertical cracks were gradually formed at pier feet due to compression. When the loading displacement amplitude reached ±24 mm, the concrete on the pier surface peeled off, which is shown in Figure 18a. The loading displacement amplitude of the surface peeling of specimens without freeze–thaw damage should reach ±30 mm, which is shown in Figure 18b. Under the action of cyclic tension and pressure, the damage to specimen concrete gradually became serious, which is shown in Figure 18c. When the loading displacement amplitude reached ±42 mm, the protective layer concrete of the specimen was crushed and gradually dropped, and the stirrup of the specimen was exposed, which is shown in Figure 18d. The loading displacement amplitude of the protective layer concrete of specimen JP-F0 should reach ±48 mm, which is shown in Figure 18e. When the loading displacement amplitude reached ±48 mm, the concrete collapse and spalling phenomenon of the pier body was serious, and the longitudinal reinforcement buckled and was completely exposed, which is shown in Figure 18f. The test was stopped when the load on the top of the specimen pier decreased to 80% of the peak capacity;
(4) The pier concrete spalling phenomenon occured after the low cyclic loading test of the specimens for specimens with different seawater freeze–thaw cycles, which is shown in Figure 19. As the seawater freeze–thaw cycles increased, the spalling height of pier concrete decreased gradually after the low cyclic load test. With the increase of seawater freeze–thaw cycles, the internal structure of cover concrete becomes looser and the bonding between aggregate and cement mortar becomes weaker. When the cover concrete spalling occured in the low cyclic loading test, specimens subjected to fewer freeze–thaw cycles were spalled in the form of bulk, and the influence range was relatively large, which led to a relatively large height of spallation caused by tension-pressure action. On the contrary, specimens subjected to more freeze–thaw cycles were spalled in the form of separation, and the range of influence was relatively small, which lead to a relatively small height of spallation caused by tension–pressure action;
(5) In the low cyclic loading test of the specimens, the crack at the sealing joint of the freeze–thaw section and post-cast section was never more than 4 mm, which will not exceed the yield displacement of the steel connector, indicating the validity of the steel connector. Because flexural deformation, shear deformation, and slip of longitudinal reinforcement at the pier foot mainly affect crack width at the pier foot [26], cracks in the joints are more likely to be caused by different ages of concrete caused by secondary casting.

3.3. Hysteresis Characteristics

The hysteresis curve of the RC pier in the process of the low cyclic loading tests of the specimens after the seawater freeze–thaw cycles, namely the load-displacement curve, is shown in Figure 20. The pinching effect of the hysteresis curve is better. After the seawater freeze–thaw cycles, the hysteretic characteristics of the RC pier in the test were roughly the same, which could be summarized as follows:
(1) When the amplitude of loading displacement does not exceed ±6 mm, the pile top load is approximately linearly related to the loading displacement. The gap between the intersection of the loading and unloading paths and the X-axis and the origin is very small, as the specimen is in the elastic stage. As the displacement loading process continues, the intersection point between the unloading path and the X-axis has a gap with the origin, so we have a residual displacement, the secant slope of the load-displacement curve decreases, and the area enclosed by the loading and unloading paths gradually increases. This indicates that the specimen gradually turns to the plastic stage. When the load reaches the peak load in the process of the low cyclic loading test of the specimens, the specimen enters the plastic stage. The area enclosed by the residual displacement and loading and unloading paths increases continuously;
(2) By comparing the hysteresis curves of the specimens after 0, 25, 50, 75, 100, and 125 seawater freeze–thaw cycles, as the number of freeze–thaw cycles increased, the initial stiffness (secant stiffness at the elastic stage) and peak load of the specimen gradually decreased. By comparing the hysteresis curves of samples with 25 seawater freeze–thaw cycles and 125 seawater freeze–thaw cycles, as the number of freeze–thaw cycles increased, the hysteresis curve of the former was fuller than that of the latter. Its residual displacement was also relatively reduced, which is shown in Figure 21;
(3) Under 125 freeze–thaw cycles of seawater, the effects of the axial compression ratio, longitudinal reinforcement diameter, and stirrup spacing on the hysteresis curve of the low cyclic loading test of the specimens were analyzed. The curve shows that increasing the axial compression ratio in the test process and increasing the longitudinal reinforcement diameter of the specimen could improve the initial stiffness and peak load of the specimen. At the same time, the residual displacement is reduced due to the narrow shape of the hysteresis loop, as shown in Figure 20g–j. After increasing the axial compression ratio in the test process, the load reduction speed of the pier top after the peak point of the specimen was accelerated. The limit displacement (the number of hysteresis loops) decreases; however, the change of longitudinal reinforcement diameter does not affect the displacement amplitude of the hysteresis curve under ultimate loading. Changing the stirrup spacing of the specimen has no obvious effect on the initial stiffness and peak load of the specimen. However, the decrease in stirrup spacing will increase the ultimate displacement, as shown in Figure 19k,l. The characteristic values of the hysteresis curves are shown in Table 6.

4. Restoring Force Model

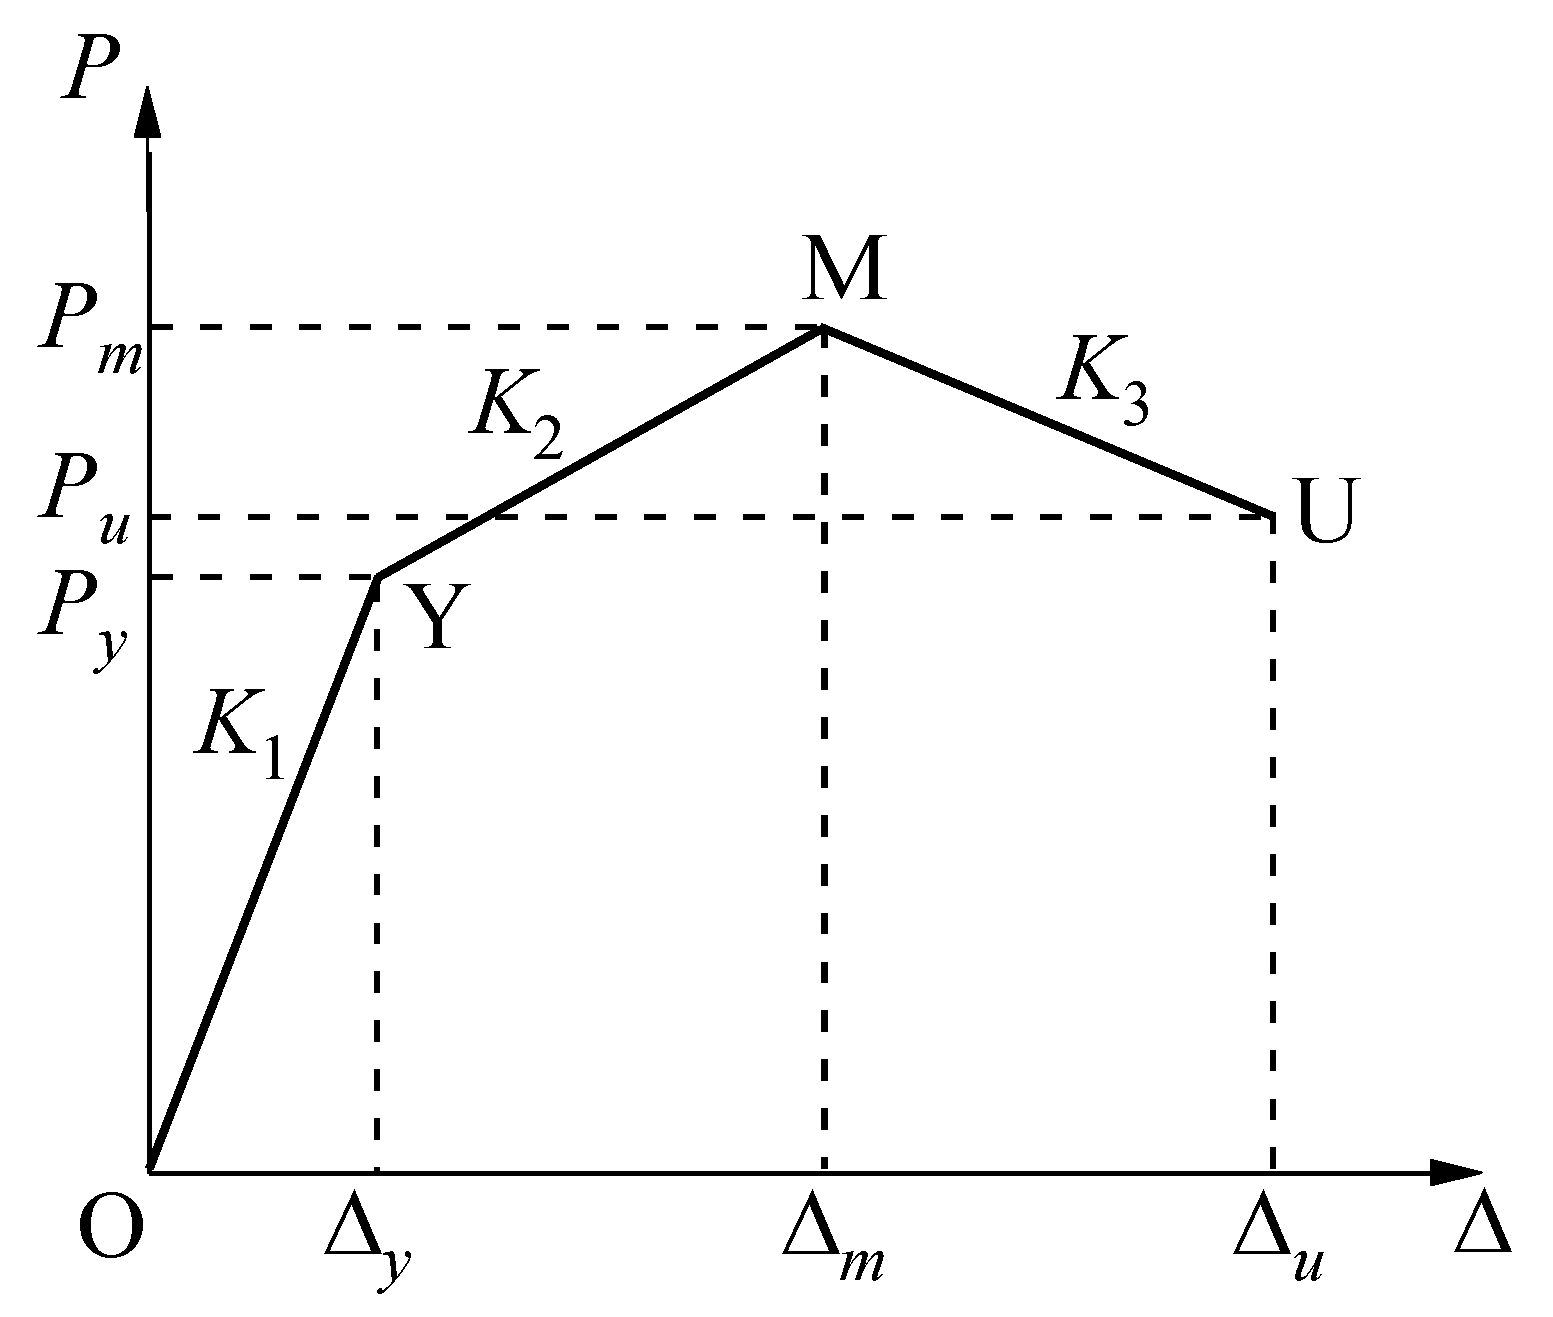
4.1. Determination of Characteristic Points of the Skeleton Curve

According to the low cyclic loading test of the specimen results of the RC pier after seawater freeze–thaw damage above, the main form of failure of the RC pier was a flexural failure. Therefore, the following requirements should be paid attention to in the selection of restoring force specimens in this paper: (1) It could reflect the hysteretic characteristics of RC columns (piers) with flexural failure as the main factor to the greatest extent, such as bearing capacity and displacement, and has a good accuracy; (2) The physical meaning of feature points is clear and easy to determine. Based on the above principles, a three-fold restoring force specimen suited for describing flexural failure is adopted in this paper to apply to practical engineering. Used to establish the restoring force model of the RC pier after seawater freeze–thaw damage, the detailed form of the model is shown in Figure 22.
According to the test results of the low cyclic loading tests of the specimens load in Section 3, the RC pier after the seawater freeze–thaw cycles mainly experiences the elastic stage, strengthening stage, and degradation stage in the loading process. The corresponding three characteristic points are yield point Y, peak point M, and limit point U. The skeleton curve of the RC pier in the low cyclic loading test of the specimens could be simplified into a three-line model, as shown in Figure 22: ① OY stage is the elastic stage of the RC pier, and the loading stiffness K1 in this stage is the initial stiffness; ② YM stage is the strengthening stage of the RC pier, and the loading stiffness K2 in this stage is the strengthening stiffness; ③ The MU stage is the degradation stage of RC pier, and the loading stiffness K3 at this stage is the degradation stiffness. The relationship between pier top load and displacement at each stage could be calculated by the following formulas:
P = Δ Δ y P y                                                                                                                                                       Δ Δ y
P = Δ Δ y Δ m Δ y ( P m P y ) + P y                                                                   Δ y Δ Δ m
P = Δ Δ m Δ u Δ m ( P u P m ) + P m                                                               Δ m Δ Δ u
where P and Δ are the load and displacement of the pier roof during the loading process, respectively.
Therefore, to determine the skeleton curve of the RC component after seawater freeze–thaw damage, a total of nine parameters, including load, displacement, and stiffness at each characteristic point on the skeleton curve, should be given: Yield load Py, yield displacement Δy, and elastic segment stiffness K1; peak load Pm, peak displacement Δm, and stiffness K2 of the strengthening section; the ultimate load Pu, the ultimate displacement Δu, and the stiffness K3 of the degenerating section. Due to the relatively large number of variables to be considered for an RC pier, it is difficult to solve the parameters of each feature point by theoretical derivation. Therefore, based on the hysteresis curve obtained by the low cyclic loading test of the specimens, this paper combined regression analysis and theoretical derivation to determine the calculation formula of eigenvalues in the above stages:
(1)
Yield load and yield displacement
After analyzing the results of the low cyclic loading test of the specimens of the RC pier after the seawater freeze–thaw cycles, the ratio between yield load Py and peak load Pm is not affected by design parameters (axial compression ratio, reinforcement ratio, stirrup ratio, number of freeze–thaw cycles). Through regression analysis of the test results, it could be seen that the ratio of yield load Py to peak load Pm is in the range of 0.74~0.76. Therefore, the approximate value of yield load Py is as follows:
P y = 0.75 P m
The bottom of the pier column of the RC pier is consolidated with the base in the test of this paper, which could be regarded as the cantilever beam with an equal section. According to the principle of structural mechanics, the lateral displacement of a purely flexural member is mainly provided by flexural deformation. The calculation formula of the lateral displacement of a constant section cantilever beam under unit lateral load is:
Δ e = Δ f = h 3 3 E I
where EI is the flexural stiffness of the RC pier section; h is the calculated height of the RC pier; RC pier section flexural stiffness EI = EcoIco + EccIcc, are the superposition of unconstrained concrete of protective layer and core constrained concrete, respectively; Eco, Ecc are the elastic modulus of unconstrained concrete in a protective layer and melted concrete in core constraint, respectively. Ico, Icc are the cross-sectional moment of inertia of unconstrained concrete with a protective layer and core concrete, respectively.
The initial stiffness and lateral displacement under unit load are reciprocal to each other, so the initial stiffness in the elastic stage of the RC pier without freeze–thaw could be calculated by the following formula.
K e = 1 Δ e = 1 h 3 / 3 E I
The initial stiffness of the RC pier after the seawater freeze–thaw cycles is affected by the number of seawater freeze–thaw cycles, axial compression ratio, reinforcement ratio, and stirrup ratio. Multivariable data fitting is carried out by MATLAB, and the calculation formula for the initial stiffness of the RC pier after the seawater freeze–thaw cycles is established in this paper as follows:
K 1 = ( 0.37 + 20.08 ρ l 2.34 ρ v + 1.52 λ + 0.0005 N ) K e
The yield displacement of the RC pier after the seawater freeze–thaw cycles could be calculated as follows:
Δ y = P y K 1
(2)
Peak load and peak displacement
According to the Chinese code for the design of concrete structures (GB 50010-2010) [21], the flexural capacity of the normal section of members with a rectangular section conforms to the following provisions:
M 0 = α 1 f c b x ( h 0 x 2 ) + f y A s ( h 0 a s )
Among them, the height x of the concrete compression zone could be calculated by Equation (13):
α 1 f c b x = f y A s f y A s
where M0 is the section flexural moment of the RC pier without freeze–thaw damage; α1 is the coefficient; fc is the axial compressive strength of concrete; As and As are the sectional areas of longitudinal ordinary reinforcement in tensile and compression zones; b is the width of the rectangular section; h0 is the effective height of the section; as is the distance between the resultant point of longitudinal ordinary reinforcement in the compression zone and the compression edge of the section.
When calculating the pier top load at characteristic points of the skeleton curve, the P-Δ effect caused by vertical axial force is taken into account, and the peak load of the RC pier without freeze–thaw damage could be calculated by Equation (14) [12]:
P m 0 = M 0 F · Δ m 0 L
where Pm0 and Δm0 are the load and displacement at the peak point of an RC pier without freeze–thaw damage, respectively.
Based on the analysis of structural mechanics principles, it is known that the relationship between the lateral displacement of the tip of a flexural member and the curvature of the plastic hinge area is shown in Equation (15) [12]:
Δ m 0 = φ L 2 3 + ( φ m 0 φ y 0 ) L p ( L L p )
where φm0 and φy0 are the peak curvature and yield curvature of the RC pier without freeze–thaw damage; L is the pier height; Lp is the height of the plastic hinge. The maximum value could be obtained through Equations (1) and (2).
According to the literature [27], the calculation formula of the peak curvature φm0 of an RC pier with peak freeze–thaw damage could be determined as follows:
φ m 0 = ε c c x h 0
The yield curvature φy0 could be calculated by the following formula [27]:
φ y 0 = f y E s ( 1 k y ) h
where fy is the yield strength of reinforcement; Es is the elastic modulus of reinforcement; ky is the height of the neutral axis, which could be calculated using the following formula [27]:
k y = [ ( A E s E c ) 2 + 2 B E s E c ] 1 2 A E s E c
A = ρ l + ρ l
B = ρ l + ρ l δ
where ρl′ is the reinforcement ratio of the compression steel bar; Δ′ = h/h. h′ is the distance from the edge of the compression zone to the center of the compression reinforcement.
According to the results of the low cyclic loading test of the specimens of RC pier after seawater freeze–thaw damage, the calculation formulas of peak load Pm and peak displacement Δm are determined by regression analysis, as follows:
P m P m 0 = 1 0.0008 N
Δ m Δ m 0 = 0.95 + 0.0061 N
Then, the strengthening stiffness K2 of the RC pier in the strengthening stage after seawater freeze–thaw damage could be calculated by Equation (23):
K 2 = P m P y Δ m Δ y
(3)
Ultimate load and ultimate displacement
In the low cyclic loading test of the specimens of the RC pier after the seawater freeze–thaw cycles, when the pier top load drops to 85% of the peak load Pm, failure of the specimen is defined, then the ultimate load calculation formula of RC pier after seawater freeze–thaw cycles is as follows:
P u = 0.85 P m
According to the low cyclic loading test of the specimens of the RC pier after the seawater freeze–thaw cycles, the displacement ductility coefficient μ is independent of the number of seawater freeze–thaw cycles N. The relationship between yield displacement and ultimate displacement is as follows:
Δ u Δ y Δ u = 0.8
Then, the degradation stiffness K3 of the RC pier in the degradation stage after seawater freeze–thaw damage could be expressed as:
K 3 = P u P m Δ u Δ m

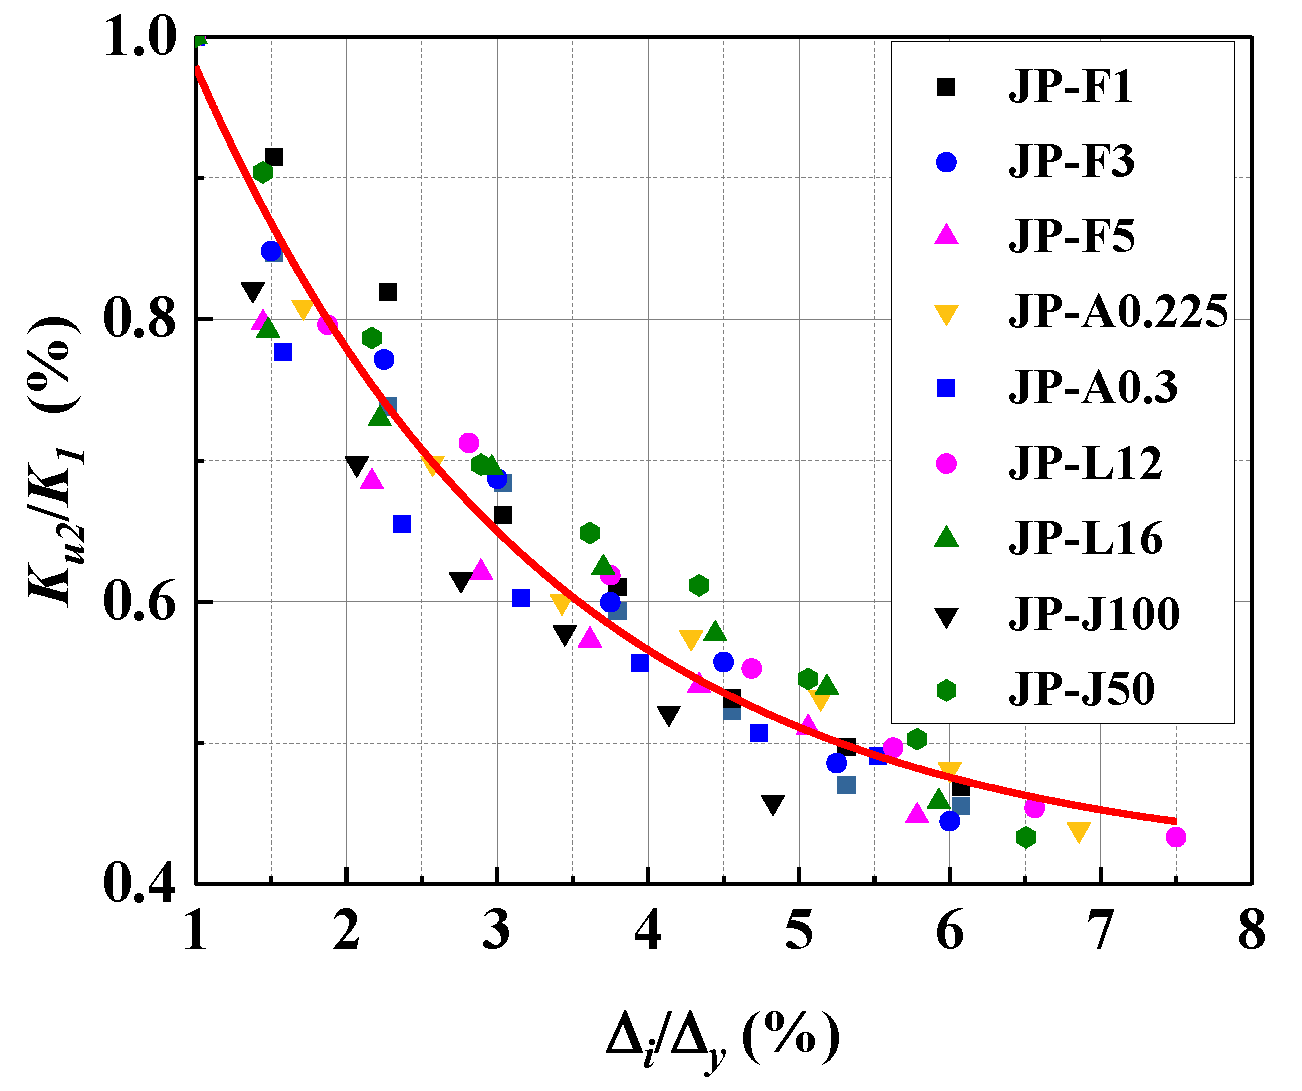
4.2. Determination of Unloading Stiffness

(1)
Unloading stiffness before yield
According to the results of the low cyclic loading test of the specimens of RC pier after the seawater freeze–thaw cycles, before the yield point, the residual deformation of the hysteresis curve unloading path is very small. It could be considered that the RC pier is in the elastic stage before the yield point. The unloading stiffness of the RC pier before the yield point after the seawater freeze–thaw cycles could be calculated by Equation (10).
(2)
Post-yield unloading stiffness
Based on the low cyclic loading test of the specimens of the RC pier after the seawater freeze–thaw cycles, the unloading stiffness of the specimen after the yield point under different parameters is extracted from the hysteresis curve. The relationship between relative stiffness and relative displacement is also established, as shown in Figure 23.
Under different design parameters, the relative stiffness degradation trend after the yield point is roughly the same, which could be calculated by a unified formula. After fitting the test data, the calculation formula of unloading stiffness at the yield point of the RC pier after the seawater freeze–thaw cycles is determined as follows:
K u 2 K 1 = 0.88 exp ( Δ i / Δ y 2.32 ) + 0.41
where Ku2 is the unloading stiffness of the RC pier after the yield point after seawater freeze–thaw damage; Δi is the displacement of unloading stiffness corresponding to a certain stage after the yield point.

4.3. Determination of Hysteresis Rules

Given an appropriate hysteresis rule in the restoring force specimens, it could truly reflect the hysteretic characteristics of RC members under a low cyclic loading test. Based on the three-fold restoring force model, the hysteresis rule of the RC pier after the seawater freeze–thaw cycles is given. As shown in Figure 24, the specific rules are described as follows:
(1) Before the pier top load reaches yield load Pyv, the RC pier is in the elastic stage. At this time, almost no stiffness degradation and residual deformation occur, and the hysteresis path could be loaded and unloaded according to the initial stiffness K1. Refer to Equation (10) for the specific numerical calculation. The loading path starts from point 0 (origin) to yield point 1, the unloading path is returned to point 0 based on the original loading path, and reverse load the reverse yield point 4;
(2) In the low cyclic loading test of the specimens, when the load on the pier top exceeds the yield load Py of the specimen and does not reach the peak load Pm, the RC pier is in the strengthening stage, and the loading path is from yield point 1 (4) to peak point 8 (12). The loading path is loaded according to the strengthening stiffness K2. Calculate according to Equation (23). When unloading is carried out at point 2 (5) in the strengthening stage, the unloading path is 2–3 (5–6), and the unloading path is unloaded according to Ku2 and calculated according to Equation (27);
(3) When the pier top load exceeds the peak load Pm, the RC pier is in the degradation stage, and the pier top load and unloading stiffness gradually decrease. The loading path is loaded according to 8–16 (12–19). The loading path is loaded according to the degradation stiffness K3 and calculated according to Equation (26). The uninstallation path is 9–10 (13–14). The uninstallation path is also uninstalled according to Ku2, which calculates according to Equation (27).
(4) The skeleton curves in the forward and reverse directions are symmetric. When the load at the top of the pier is unloaded to zero, reverse loading is carried out. When the backloaded pier top load does not exceed the reverse yield point 4, the loading path points to the reverse yield point 4. When the backloaded pier top load exceeds the yield point, the loading path points to the historical maximum value of backloading 11 or 18. The unloading path is also connected according to Ku2 and calculated according to Equation (27). When switching from reverse to forward loading, the loading path points to the historical maximum value of forward loading 7 or 15. The complete hysteresis loading and unloading path is carried out in the sequence of points 1-2-3-4-5-6-7···15-16-17-18-19-20-21 until the specimen is damaged.

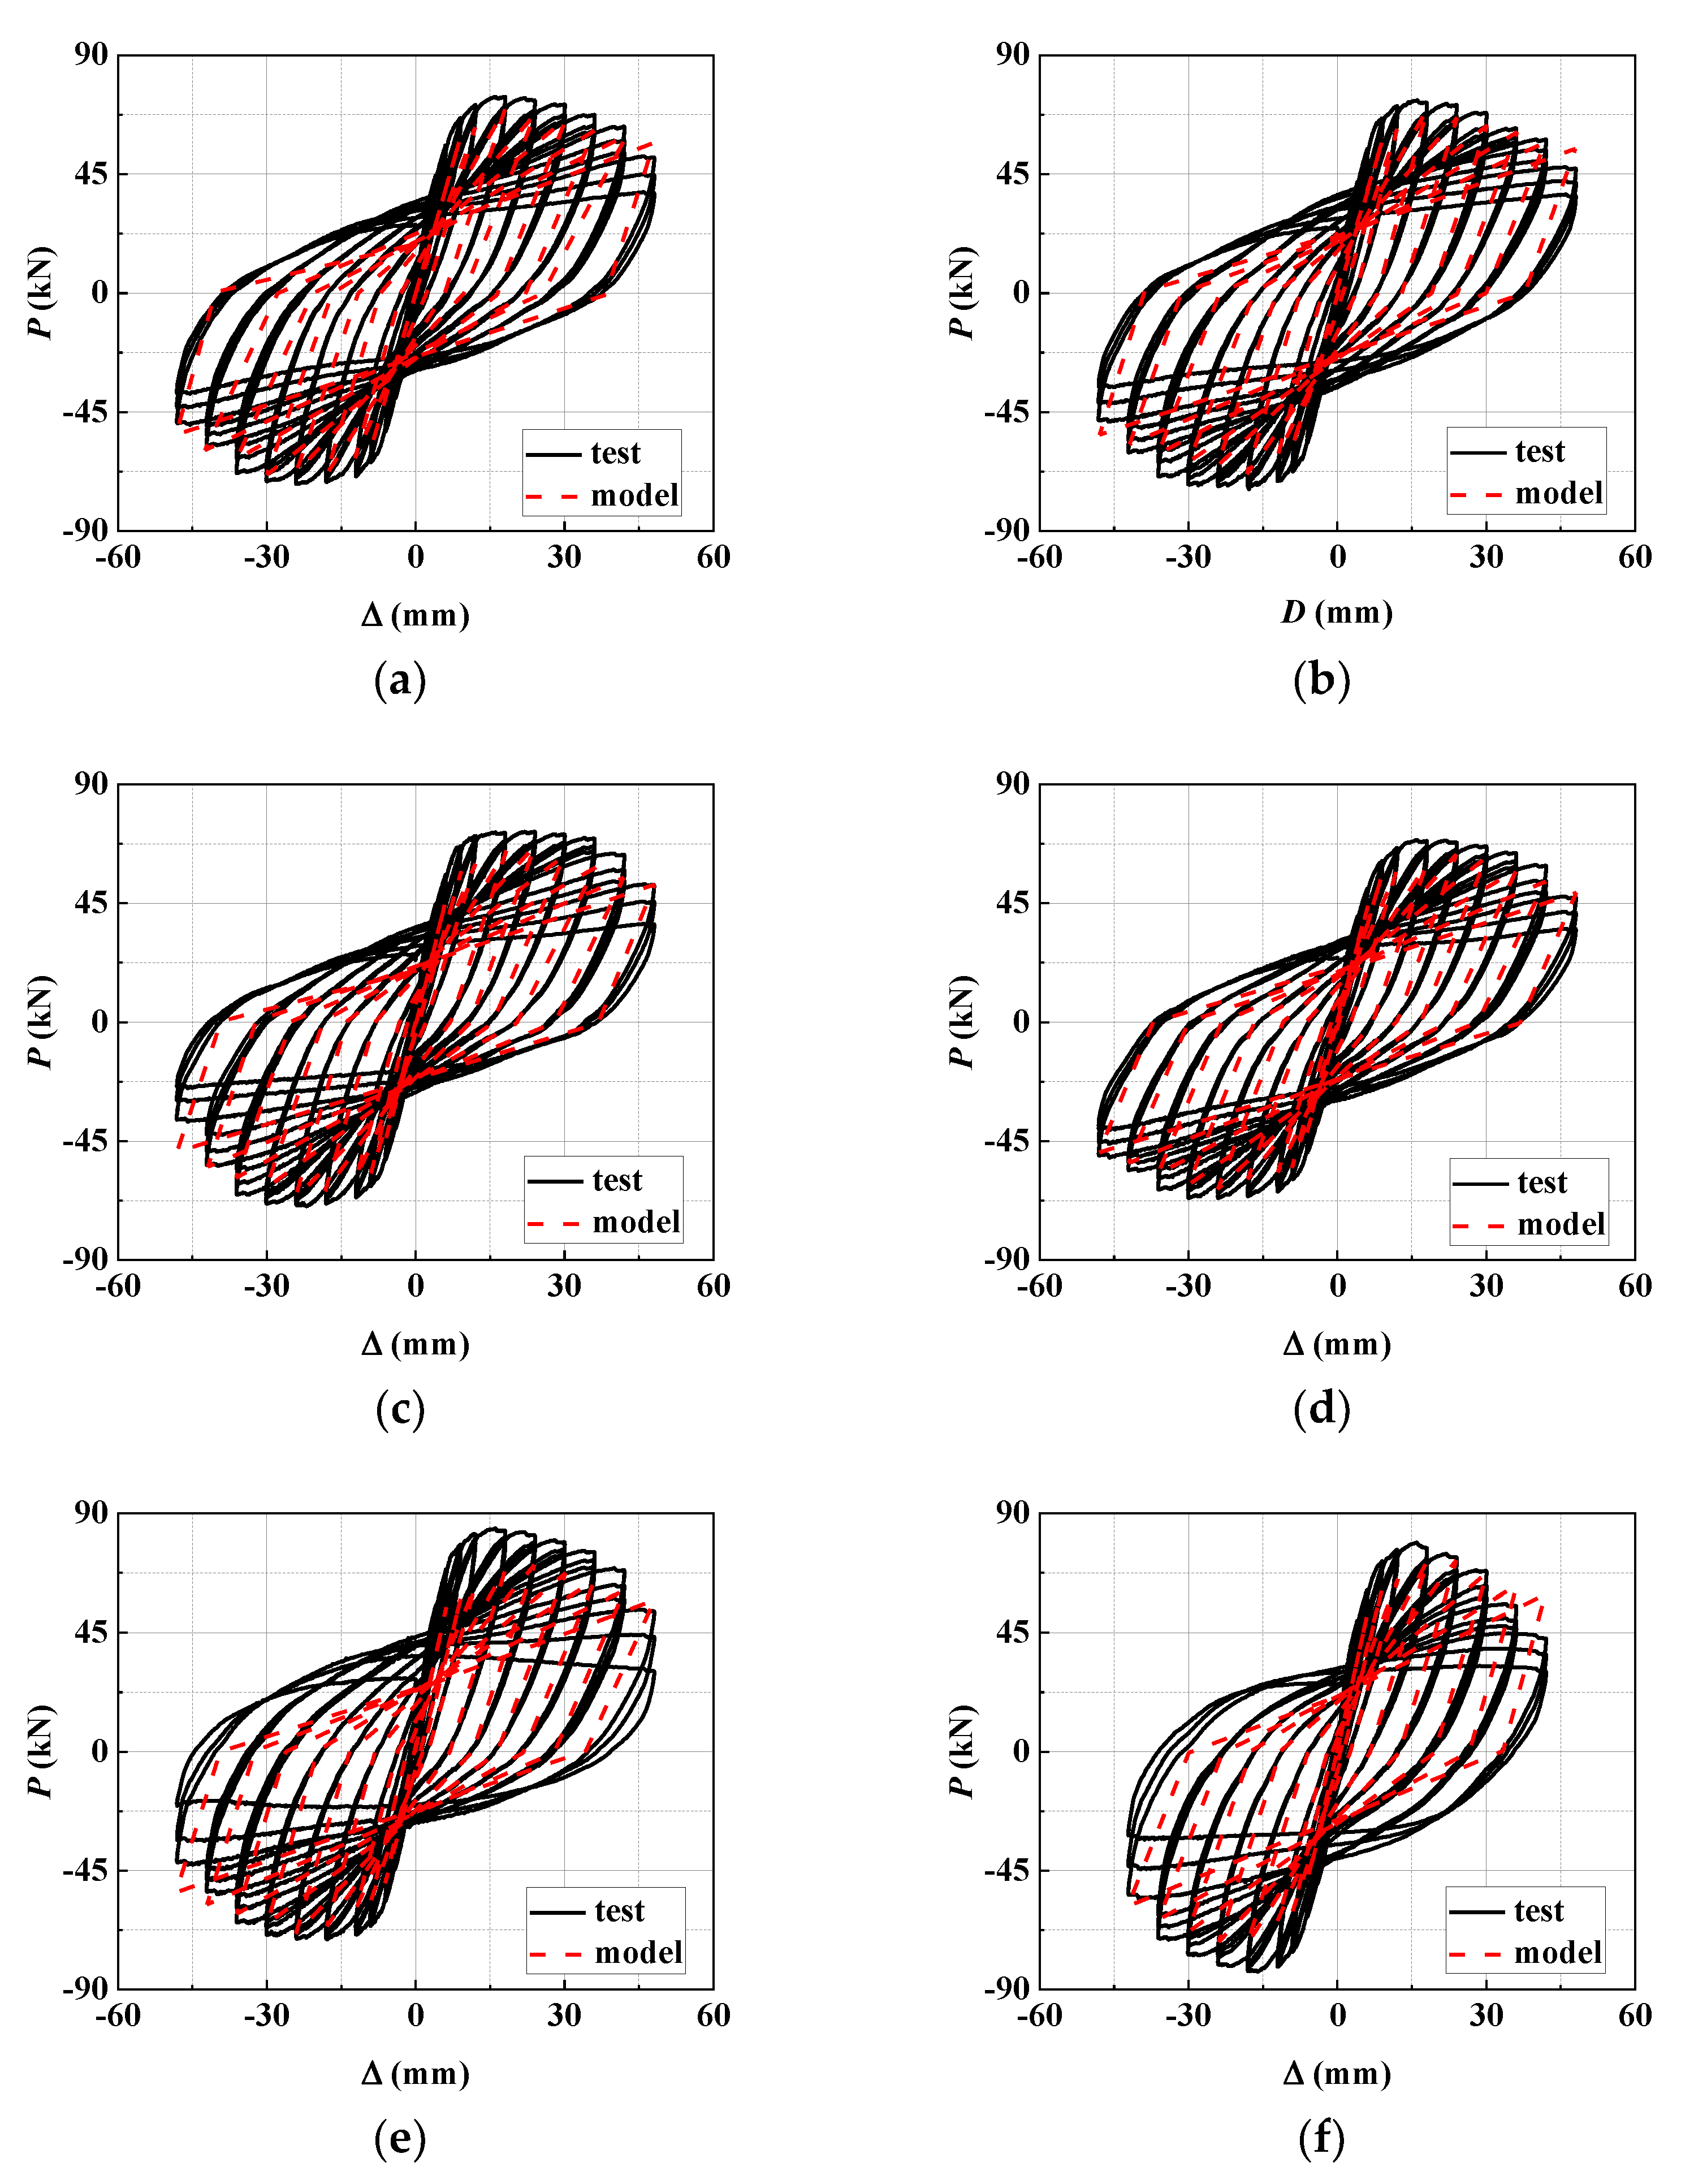
4.4. Model Verification

Combined with the calculation method of each characteristic point in the skeleton curve, the calculation formula of unloading the stiffness and hysteresis rule determined in this paper, a relatively complete restoring force model of the RC pier after the seawater freeze–thaw cycles could be obtained. The hysteresis curve of each design parameter was calculated by MATLAB programming language and compared with the hysteresis curve of the test, as shown in Figure 25. The test and calculation information of yield point, strengthening point, and degradation point is extracted, as shown in Table 7 and Table 8.
The deviation values of flexural capacity are not more than 6.5%, and the deviation values of peak displacement are not more than 12%, except for specimen JP-A0.225 in the ideal range.

5. Discussion

The comparison results between the low cyclic loading test and the restoring force model are explained as follows:
(1) Due to the limitation of the test equipment and the inherent characteristics of freeze–thaw damage, the damage of the F–T segment presented a heterogeneous state during the rapid freeze–thaw cycle test. Therefore, there was a certain difference between positive and negative peak loads in the result of the low cyclic loading test;
(2) Because the base of the specimens and the ground cannot achieve complete consolidation, there is a certain gap between the positive and negative peak loads in the low cyclic loading test. Combined with reason (1), the experimental results with relatively small absolute values are compared with the calculation results of the restoring force model. By comparison, the deviation values of flexural capacity are not more than 6.5%;
(3) In the process of the low cyclic loading test, the loading displacement amplitudes were collected at a certain interval. Therefore, the peak displacement of the test may occur between the adjacent loading displacement amplitudes. The peak displacement calculated by the restoring force model does not have such a condition. Therefore, a situation similar to specimen JP-A0.225 would appear (the difference between the peak displacement of the test and that calculated by the restoring force model is relatively large). Overall, the difference in peak displacement was no more than 12.0%, which is within the ideal range.
In actual engineering design and construction, flexural capacity is usually used as the main reference index. The deviation between the bearing capacity calculated by the restoring force model and the test results is relatively small, which indicates that the proposed restoring force model could effectively describe the mechanical properties of RC piers after the seawater freeze–thaw cycles.

6. Conclusions

The low cyclic loading test was carried out on 12 precast segmental concrete piers with different numbers of seawater freeze–thaw cycles, axial compression ratios, longitudinal reinforcement diameters, and stirrup spacing. The hysteresis characteristics of pre-cast segmental RC pies were analyzed, and the restoring force model of RC piers considering the seawater freeze–thaw damage and design parameters were established. The analysis of the results led to the following conclusions:
(1) The residual displacement decreased, and the fullness of the hysteresis curve decreased with the number of freeze–thaw cycles increased. The increase in the axial compression ratio and longitudinal reinforcement diameter could improve the initial stiffness and peak load of the specimen under the same number of seawater freeze–thaw cycles;
(2) With the increase in the number of seawater freeze–thaw cycles, the peak load decreased by 11%, and the peak displacement delays by 40%. Under the same number of seawater freeze–thaw cycles, i.e., 125 cycles, the peak load increased by 15%, while the peak displacement decreased by 40% with the increase of axial compression ratios. The peak load and displacement increased by 27% and 20% as the longitudinal reinforcement diameter of specimens increased;
(3) By comparing the hysteresis curve, calculated using the restoring force model, with the hysteresis curve obtained by the test, the deviation values of flexural capacity are not more than 6.5%, and the deviation values of peak displacement are not more than 12%. The restoring force model in this paper satisfies the engineering accuracy.

Author Contributions

Conceptualization, F.T. and X.W.; methodology, W.Y.; experiment, Y.Z. and K.Z.; validation, F.T.; formal analysis, F.T. and X.W.; investigation, Y.Z. and K.Z.; resources, W.Y.; data curation, F.T., X.W., and Y.Z.; writing—review and editing, F.T. and X.W.; supervision, W.Y. All authors have read and agreed to the published version of the manuscript.

Funding

This work was financially supported by the Natural Science Foundation Project of Liaoning Provincial (2022-BS-191) and Basic Scientific Research Project of Liaoning Provincial Department of Education (LJKMZ20220943).

Institutional Review Board Statement

Not applicable.

Informed Consent Statement

Not applicable.

Data Availability Statement

Not applicable.

Acknowledgments

This research was performed at Shenyang Jianzhu University.

Conflicts of Interest

The authors declare no conflict of interest.

References

  1. Shang, H.S.; Yi, T.H. Freeze-thaw durability of air-entrained concrete. Sci. World J. 2013, 2013, 650791. [Google Scholar] [CrossRef] [PubMed] [Green Version]
  2. Hadi Sahlabadi, S.; Bayat, M.; Mousivand, M.; Saadat, M. Freeze–thaw durability of cement-stabilized soil reinforced with polypropylene/basalt fibers. J. Mater. Civ. Eng. 2021, 33, 04021232. [Google Scholar] [CrossRef]
  3. Roustaei, M.; Hendry, M.; Aghaei, E.A.; Bayat, M. Shear modulus and damping ratio of clay soil under repeated freeze-thaw cycles. Acta Geodyn. Geomater. 2021, 18, 71–81. [Google Scholar] [CrossRef]
  4. Cui, F.K.; Zhang, H.; Ghosn, M.; Xu, Y. Seismic fragility analysis of deteriorating RC bridge substructures subject to marine chloride-induced corrosion. Eng. Struct. 2018, 15, 61–72. [Google Scholar] [CrossRef]
  5. Ou, Y.C.; Fan, H.D.; Nguyen, N.D. Long-term seismic performance of reinforced concrete bridges under steel reinforcement corrosion due to chloride attack. Earthq. Eng. Struct. Dyn. 2013, 42, 2113–2127. [Google Scholar] [CrossRef]
  6. Wu, L.J.; Zhou, Y.J.; Kou, X.J.; Jiang, M. Reliability-based service life prediction of existing concrete structures under marine environment. J. Cent. South Univ. 2015, 22, 3608–3614. [Google Scholar] [CrossRef]
  7. Yu, B.; Ning, C.L.; Li, B. Probabilistic durability assessment of concrete structures in marine environments: Reliability and sensitivity analysis. China Ocean Eng. 2017, 31, 63–73. [Google Scholar] [CrossRef]
  8. Duan, A.; Li, Z.; Zhang, W.; Jin, W. Flexural behaviour of reinforced concrete beams under freeze-thaw cycles and sustained load. Struct. Infrastruct. Eng. 2017, 13, 1350–1358. [Google Scholar] [CrossRef]
  9. Zheng, Y.; Yang, L.; Guo, P.; Yang, P. Fatigue characteristics of prestressed concrete beam under freezing and thawing cycles. Adv. Civ. Eng. 2020, 2020, 8821132. [Google Scholar] [CrossRef]
  10. Xie, J.; Zhao, X.; Yan, J.B. Experimental and numerical studies on bonded prestressed concrete beams at low temperatures. Constr. Build. Mater. 2018, 188, 101–118. [Google Scholar] [CrossRef]
  11. Qin, X.; Meng, S.; Cao, D.; Tu, Y.; Sabourova, N.; Grip, N.; Ohlsson, U.; Blanksvärd, T.; Sas, G.; Elfgren, L. Evaluation of freeze-thaw damage on concrete material and prestressed concrete specimens. Constr. Build. Mater. 2016, 125, 892–904. [Google Scholar] [CrossRef]
  12. Qin, Q.; Zheng, S.; Li, L.; Dong, L.; Zhang, Y.; Ding, S. Experimental study and numerical simulation of seismic behavior for RC columns subjected to freeze-thaw cycles. Adv. Mater. Sci. Eng. 2017, 3, 7496345. [Google Scholar] [CrossRef] [Green Version]
  13. Qin, Q.; Zheng, S.; Dong, L.; Hou, P.; Wang, F. Considering Shear Behavior of Beam-Column Connections to Assess the Seismic Performance of RC Frames Subjected to Freeze-Thaw Cycles. J. Earthq. Eng. 2021, 25, 381–406. [Google Scholar] [CrossRef]
  14. Gong, F.; Maekawa, K. Multi-scale simulation of freeze-thaw damage to RC column and its restoring force characteristics. Eng. Struct. 2018, 156, 522–536. [Google Scholar] [CrossRef]
  15. Rong, X.-L.; Zheng, S.-S.; Zhang, Y.-X.; Zhang, X.-Y.; Dong, L.-G. Experimental study on the seismic behavior of RC shear walls after freeze-thaw damage. Eng. Struct. 2020, 206, 110101. [Google Scholar] [CrossRef]
  16. Yang, W.; Zheng, S.-S.; Zhang, D.-Y.; Sun, L.-F.; Gan, C.-L. Seismic behaviors of squat reinforced concrete shear walls under freeze-thaw cycles: A pilot experimental study. Eng. Struct. 2016, 124, 49–63. [Google Scholar] [CrossRef]
  17. Rong, X.-L.; Zheng, S.-S.; Zhang, Y.-X.; Dong, L.-G.; Liu, H.; Dai, K.-Y. Seismic behavior of frost-damaged squat RC shear walls under artificial climate environment: A further experimental research. Arch. Civ. Mech. Eng. 2020, 20, 106. [Google Scholar] [CrossRef]
  18. Zheng, J.; Dong, L.G.; Qin, Q. Experimental study on seismic behavior of reinforced concrete frame beam-column joints under freeze-thaw cycle. J. Build. Struct. 2016, 37, 73–81. (In Chinese) [Google Scholar]
  19. Hamze, Y. Concrete durability in harsh environmental conditions exposed to freeze-thaw cycles. Phys. Procedia 2014, 55, 265–270. [Google Scholar] [CrossRef] [Green Version]
  20. JTG/T B02-1-2008; Guidelines for Seismic Design of Highway Bridges. China National Standardization Management Committee: Beijing, China, 2008.
  21. GB 50010-2010; Code for Design of Concrete Structures. China National Standardization Management Committee: Beijing, China, 2010.
  22. Qiu, W.L.; Teng, F.; Pan, S.S. Damage constitutive model of concrete under repeated load after seawater freeze-thaw cycles. Constr. Build. Mater. 2020, 236, 117560. [Google Scholar] [CrossRef]
  23. JTG 3362-2018; Specifications for Design of Highway Reinforced Concrete and Prestressed Concrete Bridges and Culverts. China National Standardization Management Committee: Beijing, China, 2018.
  24. GB/T 50152-2012; Standard for Test Method of Concrete Structures. China National Standardization Management Committee: Beijing, China, 2012.
  25. JGJ/T 101-2015; Specification for Seismic Test of Buildings. China National Standardization Management Committee: Beijing, China, 2015.
  26. Liu, K.; Yan, J.; Zou, C. A pilot experimental study on seismic behavior of recycled aggregate concrete columns after freeze-thaw cycles. Constr. Build. Mater. 2018, 164, 497–507. [Google Scholar] [CrossRef]
  27. Wang, B.; Huang, W.; Zheng, S. Study on restoring force performance of corrosion damage steel frame beams under acid atmosphere. Appl. Sci. 2018, 9, 103. [Google Scholar]
Figure 1. The dimensions and reinforcement details of the specimens (unit: mm).
Coatings 13 00016 g001
Figure 2. Material for grouting and sealing. (a) High strength grouting material. (b) Sealing material.
Coatings 13 00016 g002
Figure 3. The failure mode of grouting sleeves. (a) Steel tensile. (b) The concrete expands and deforms. (c) Failure of concrete.
Coatings 13 00016 g003
Figure 4. Tensile failure test of steel connector. (a) Steel connector. (b) Uniaxial tensile test of steel connector.
Coatings 13 00016 g004
Figure 5. The stress–strain curve of the specimens with or without steel connector. (The red dotted line is the steel connector specimen, and the black solid line is the rebar specimen).
Coatings 13 00016 g005
Figure 6. The dimensions and reinforcement details of the freeze–thaw segments (unit: mm).
Coatings 13 00016 g006
Figure 7. The dimensions and reinforcement details of the base (unit: mm).
Coatings 13 00016 g007
Figure 8. The main process of the F–T segments. (a) Details of a segment. (b) Preparation before pouring. (c) Pouring concrete of segment.
Coatings 13 00016 g008
Figure 9. Rapid freeze–thaw cycles test for the F–T segments. (a) Freeze–thaw cycles container. (b) Constant temperature container. (c) Rust prevention. (d) Inside the testing machine.
Coatings 13 00016 g009
Figure 10. Experimental results of the rapid freeze–thaw cycles. (a) Comparison before and after 25 freeze–thaw cycles. (b) Comparison before and after 50 freeze–thaw cycles. (c) Comparison before and after 75 freeze–thaw cycles. (d) Comparison before and after 100 freeze–thaw cycles. (e) Comparison before and after 125 freeze–thaw cycles.
Coatings 13 00016 g010
Figure 11. The main process of the base. (a) Fixation of grouting sleeve. (b) Assembling reinforcement. (c) Manufacture of molds. (d) Pouring concrete for the base.
Coatings 13 00016 g011
Figure 12. The main process of the second pouring. (a) Base cut hair. (b) Roughening of the F–T segment. (c) Laying the sealing material. (d) Artificial grouting. (e) Inserting freeze–thaw segments. (f) End of the assembly.
Coatings 13 00016 g012aCoatings 13 00016 g012b
Figure 13. The main process of the second pouring. (a) Lengthening of the longitudinal bar. (b) Assembling reinforcement. (c) Formwork. (d) Finished secondary pouring.
Coatings 13 00016 g013
Figure 14. The specimen and the testing apparatus.
Coatings 13 00016 g014
Figure 15. Loading procedure for the low cyclic loading test.
Coatings 13 00016 g015
Figure 16. The failure mode of the specimens. (a) JP-F0. (b) JP-F1. (c) JP-F2. (d) JP-F3. (e) JP-F4. (f) JP-F5. (g) JP-A0.225. (h) JP-A0.3. (i) JP-L12. (j) JP-L16. (k) JP-J50. (l) JP-J100.
Coatings 13 00016 g016
Figure 17. The cracking phenomenon of low cyclic loading test. (a) JP-F5(−4). (b) JP-F5(−6). (c) JP-F5(−18). (d) JP-F0(−24).
Coatings 13 00016 g017
Figure 18. The spalling phenomenon of low cyclic loading test. (a) JP-F5(+24). (b) JP-F0(−30). (c) JP-F5(−36). (d) JP-F5(−42). (e) JP-F0(+48). (f) JP-F5(−48).
Coatings 13 00016 g018
Figure 19. Concrete spalling height of the specimen. (a) JP-F0. (b) JP-F1. (c) JP-F2. (d) JP-F3. (e) JP-F4. (f) JP-F5.
Coatings 13 00016 g019
Figure 20. Hysteresis characteristics of the specimens. (a) JP-F0. (b) JP-F1. (c) JP-F2. (d) JP-F3. (e) JP-F4. (f) JP-F5. (g) JP-A0.225. (h) JP-A0.3. (i) JP-L12. (j) JP-L16. (k) JP-J50. (l) JP-J100.
Coatings 13 00016 g020aCoatings 13 00016 g020b
Figure 21. Hysteresis curves of the specimens with 25 and 125 cycles. (a) Comparison of JP-F1 and JP-F5 curves. (b) Locally enlarged view.
Coatings 13 00016 g021
Figure 22. The triple-fold linear restoring force model.
Coatings 13 00016 g022
Figure 23. Relationship between relative displacement and relative stiffness after yield.
Coatings 13 00016 g023
Figure 24. Hysteretic rule.
Coatings 13 00016 g024
Figure 25. Comparison between the calculated hysteretic curve and test hysteretic curve. (a) JP-F0. (b) JP-F1. (c) JP-F3. (d) JP-F5. (e) JP-A0.225. (f) JP-A0.3. (g) JP-L12. (h) JP-L16. (i) JP-J100. (j) JP-J50.
Coatings 13 00016 g025aCoatings 13 00016 g025b
Table 1. Parameters of the specimens.
No.Nλdsls
JP-F000.151475
JP-F1250.151475
JP-F2500.151475
JP-F3750.151475
JP-F41000.151475
JP-F51250.151475
JP-A0.2251250.2251475
JP-A0.31250.31475
JP-L121250.151275
JP-L161250.151675
JP-S501250.151450
The letter N represents number of freeze-thaw cycles, λ represents axial compression ratio, ds stands for longitudinal reinforcement diameter, and ls stands for stirrup spacing.
Table 2. Properties of assembly materials.
ParameterGroutingSealing
TypeCGMJM-VIJM-Z
Initial fluidity (mm)≥300≥380
60 min fluidity (mm)≥260--
Vertical expansion rate (%)0.02–0.5--
Bleeding rate (%)0--
Compressive strength (MPa)1 day≥35--
3 days≥60--
28 days≥85≥50
Chlorine ion content (%)≤0.03--
Amount of contraction (mm)--0
Table 3. Parameters of the steel connector.
ParameterValue
MaterialCarbon steel
Thread spacing (mm)2
Vertebral angle (°)60
Length of thread (mm)50
Type of inner threadM12 / 14 / 16
Table 4. Parameters of the longitudinal reinforcement and stirrup.
ParameterLongitudinal ReinforcementStirrup
Reinforcement typeHRB400HPB300
Physical qualityRibbedPlain
Diameter (mm)12, 14, or 168
Yield strength (MPa)422450
Ultimate strength (MPa)605550
Table 5. The mixed proportions of concrete (kg/m3).
CementFine
Aggregate
Coarse
Aggregate
WaterFly AshWater
Reducer
373873838180668.8
Table 6. The characteristic value of the hysteresis curve.
Py (kN)Δy (mm)Pm (kN)Δm (mm)Pu (kN)Δu (mm)
JP–F055.87.974.218.063.141.4
JP–F154.97.873.018.062.139.8
JP–F352.08.069.724.059.039.4
JP–F549.38.366.430.056.141.6
JP–A0.22553.47.071.818.060.738.9
JP–A0.359.57.678.018.067.732.8
JP–L1242.36.457.018.048.238.6
JP–L1657.98.177.830.065.844.5
JP–J10050.38.667.718.057.237.7
JP–J5050.18.367.430.057.045.4
Py and Δy are the load and displacement at the yield point, respectively. Pm and Δm are the load and displacement at the peak point, respectively. Pu and Δu are the load and displacement at the limit point, respectively.
Table 7. Comparison of load test value and calculation value.
No.PyPmPu
Test
(kN)
Model
(kN)
Deviation
(%)
Test
(kN)
Model
(kN)
Deviation
(%)
Test
(kN)
Model
(kN)
Deviation
(%)
JP-F055.853.05.174.270.64.963.160.04.9
JP-F154.951.95.473.069.25.262.158.65.6
JP-F352.050.92.169.767.92.659.057.72.2
JP-F549.348.12.466.464.13.556.154.52.9
JP-A0.22553.452.51.671.870.02.560.759.52.0
JP-A0.359.556.55.178.075.33.567.763.36.5
JP-L1242.341.91.157.055.82.148.247.51.5
JP-L1657.961.0−5.377.881.3−4.565.869.1−5.0
JP-J10050.348.92.867.765.23.657.255.53.0
JP-J5050.152.7−5.167.470.2−4.257.059.7−4.7
Py is the load at the yield point. Pm is the load at the peak point. Pu is the load at the ultimate point.
Table 8. Comparison of displacement test value and calculation value.
No.ΔyΔmΔu
Test
(mm)
Model
(mm)
Deviation
(%)
Test
(mm)
Model
(mm)
Deviation
(%)
Test
(mm)
Model
(mm)
Deviation
(%)
JP-F07.98.6−8.918.018.8−4.441.442.2−1.9
JP-F17.88.7−11.518.017.52.839.840.2−1.0
JP-F38.07.56.324.022.37.139.438.23.0
JP-F58.38.03.630.026.611.341.640.23.4
JP-A0.2257.06.57.118.021.3−18.338.940.32−3.7
JP-A0.37.66.810.518.019.8−10.032.836.1−10.1
JP-L126.46.5−1.618.019.3−7.238.640.3−4.4
JP-L168.18.10.030.026.312.344.540.39.4
JP-J1008.68.07.018.020.4−13.337.736.24.0
JP-J508.38.03.630.032.1−7.045.443.24.8
Δy is the displacement at the yield point. Δm is the displacement at the peak point. Δu is the displacement at the ultimate point.
Disclaimer/Publisher’s Note: The statements, opinions and data contained in all publications are solely those of the individual author(s) and contributor(s) and not of MDPI and/or the editor(s). MDPI and/or the editor(s) disclaim responsibility for any injury to people or property resulting from any ideas, methods, instructions or products referred to in the content.

