1. Introduction
Prestressed concrete cylinder pipes (PCCPs) are broadly applied in urban water-diversion engineering projects. They have many advantages such as a good ability to bear high internal water pressure, high resistance to earthquakes and outstanding economic values. Their first application was in France, and they were then introduced to America in 1942. Since then, more than 22,000 miles of PCCPs have been in service in North America [
1]. Recently, they have been applied to many water-diversion projects in China such as the Shenyang Dahuofang Water Conveyance Project, the East of Shenzhen Water Supply Project and the South-to-North Water Transfer Project. Four components, concrete, mortar coating, cylinders and pre-stressing wires, make up PCCP pipes. Concrete has high-strength properties and is the main component of the pipes, providing a smooth surface to maintain a low roughness coefficient and reduce hydraulic loss. The steel cylinder mainly plays an anti-seepage role and has a certain load-bearing capacity. The spiral-wound pre-stressing wire is the main load-bearing part, providing uniform pre-compressive stress to withstand the internal water pressure. The mortar coating serves as an essential material to protect the high-strength steel wires from corrosion by groundwater or soil around the pipeline for more than 50 years [
2]. There are two major kinds of PCCPs: Lined-Cylinder Pipes (LCPs) and Embedded-Cylinder Pipes (ECPs) [
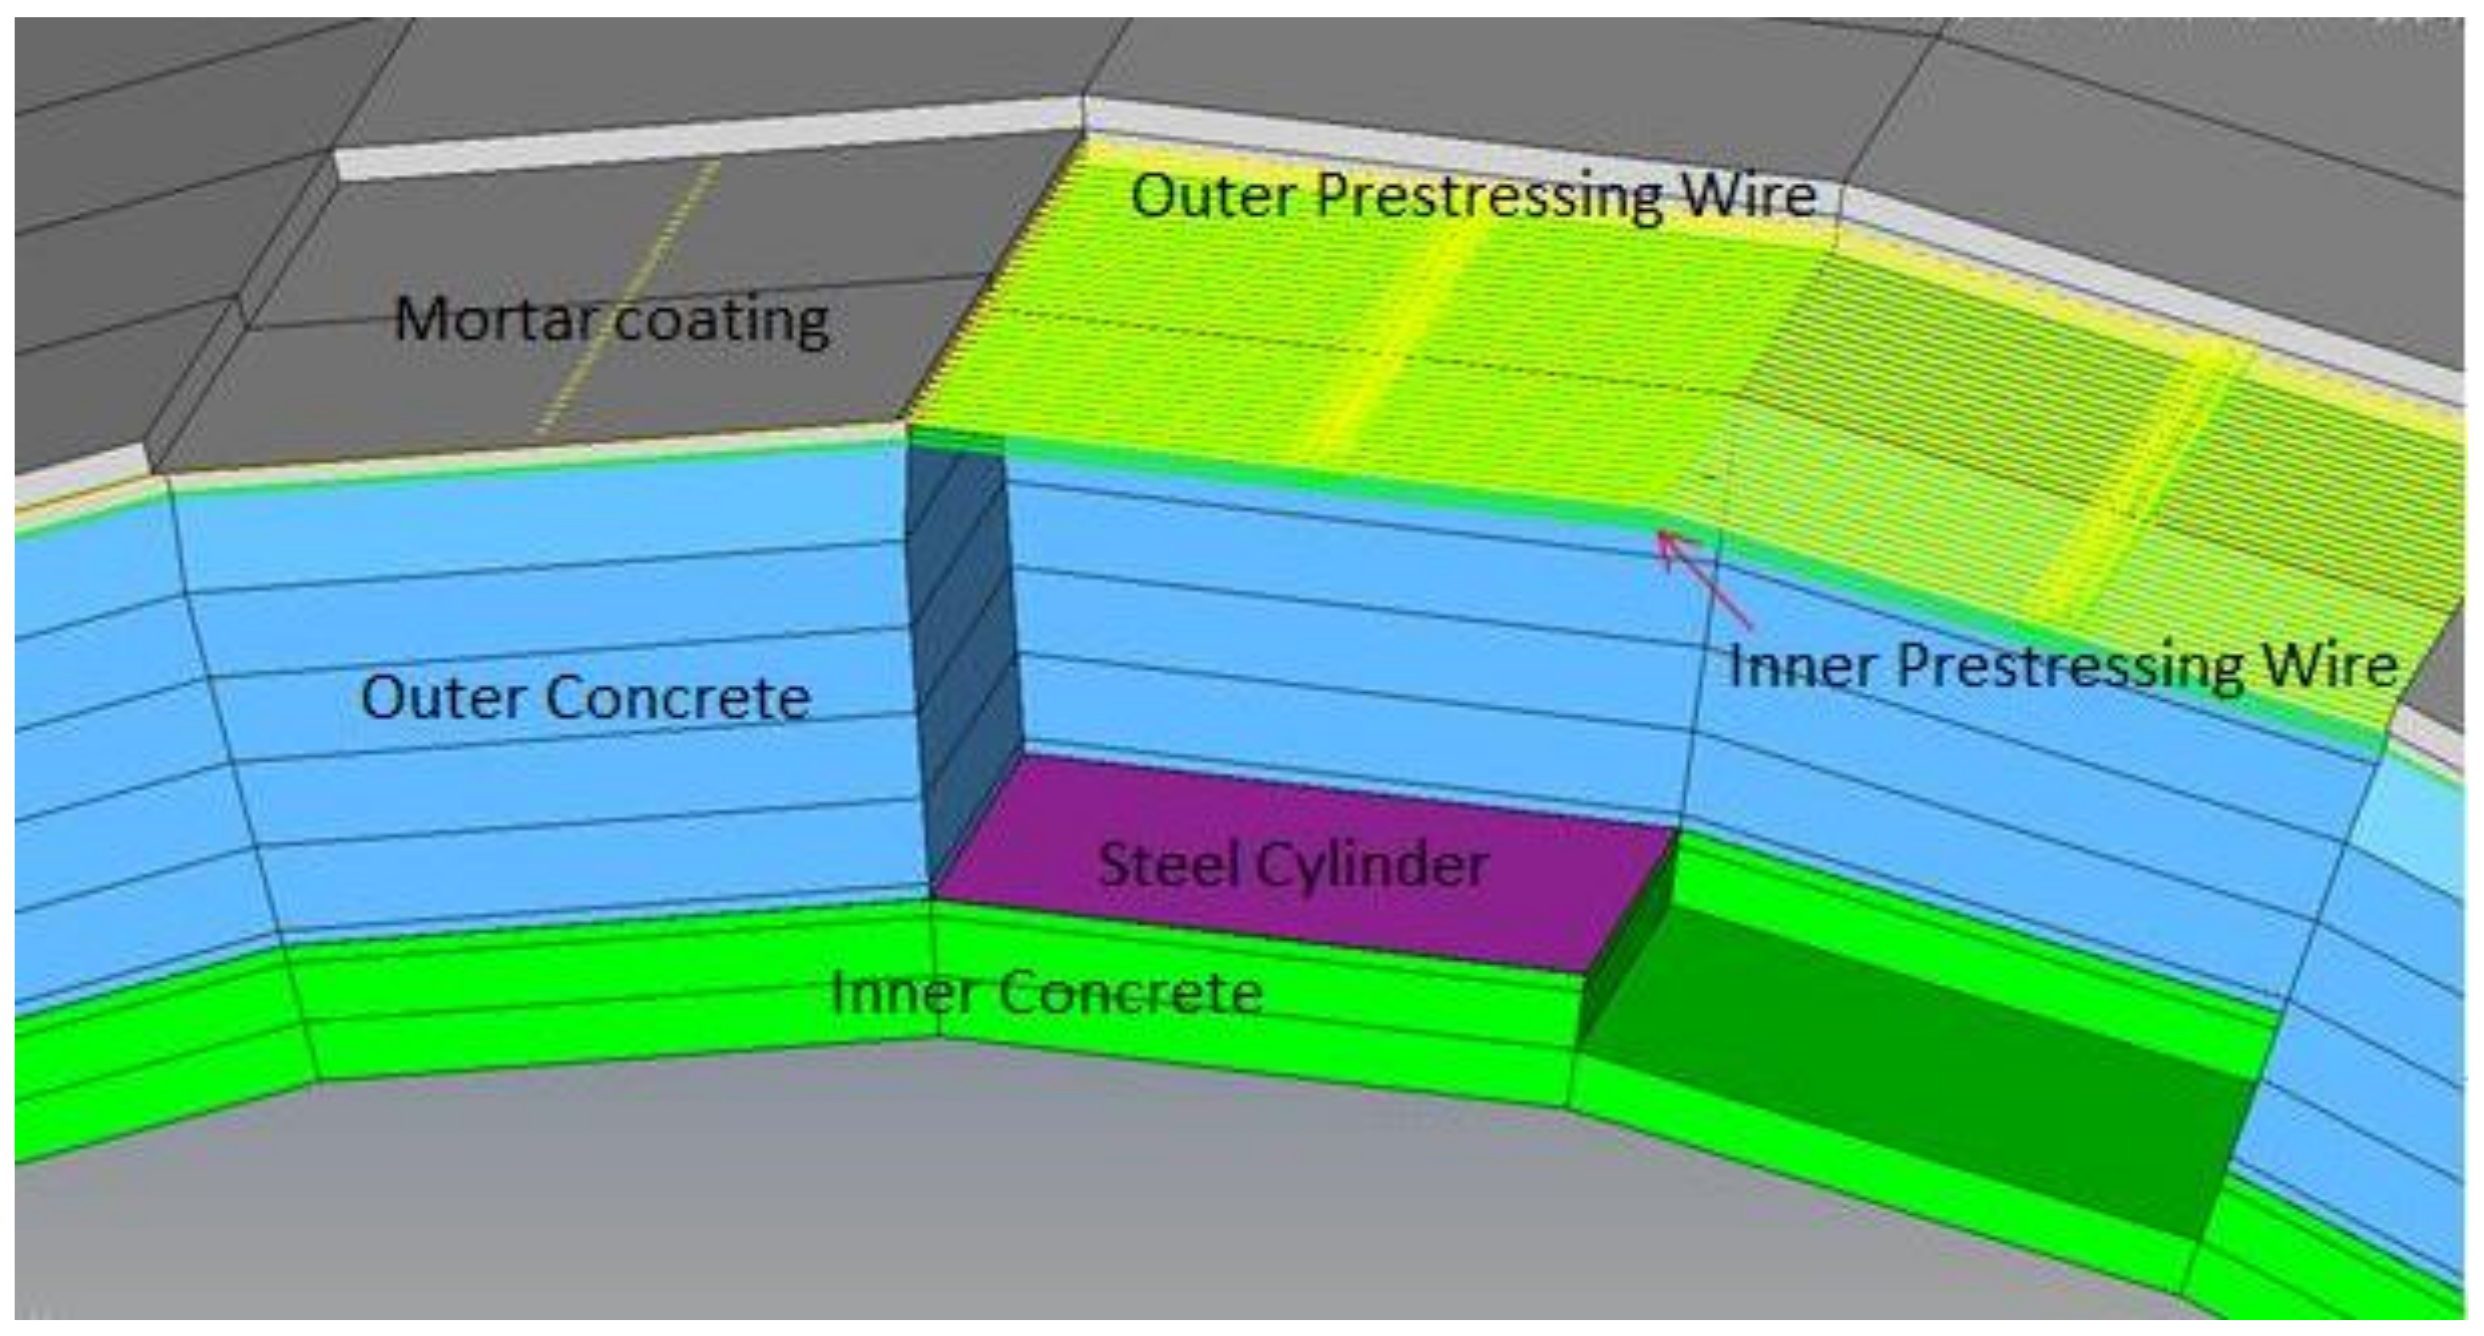
3]. The wires of LCPs spirally wrapped on a steel cylinder. ECPs high-strength steel wires helically wrapping on the outer concrete of a tube core (see
Figure 1), which are put to use in water transmission projects on a large scale at home and abroad with larger internal diameters. The overall mechanical performance of ECPs is very important and has naturally been the focus of special attention from scholars and researchers.
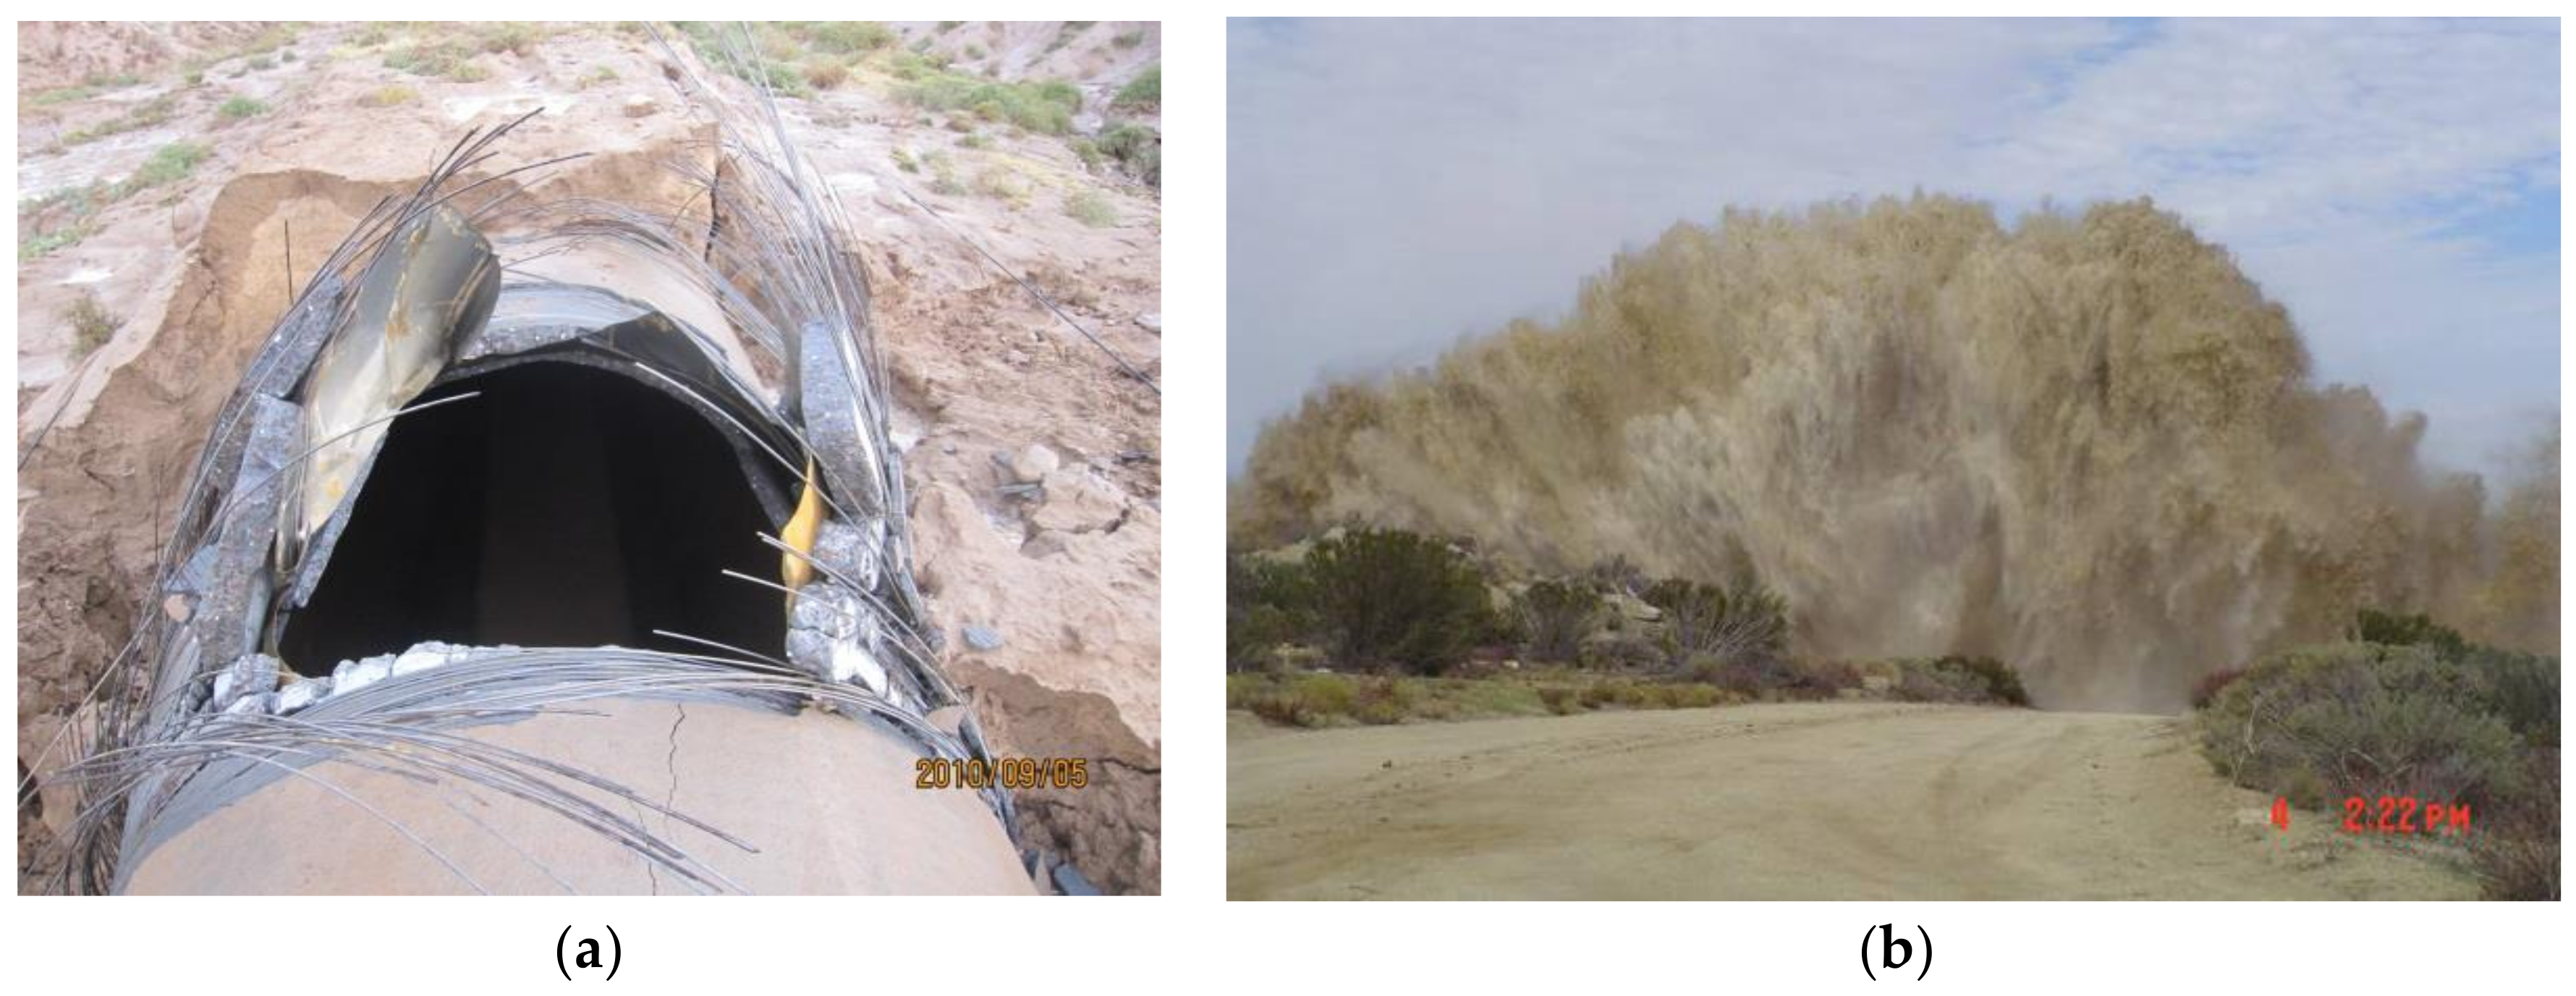
PCCP pipes are buried under the ground, so the surrounding groundwater and soil may corrode the pipes, resulting in the general deterioration of function and reductions in service life [
4]. They are considered reliable and safe, with the low percentage of wire breakages, according to a recent study [
5]. It showed that this percentage was only 3.7%. If they burst, however, this will cause catastrophic ruptures and leaks, resulting in serious losses of life and property. The well-known failure mode of PCCPs is bursting damage (see
Figure 2), which is essentially caused by the corrosion and hydrogen embrittlement of wires [
6,
7,
8]. Currently, wire break-off detection and leak detection methods are broadly used to evaluate the status of PCCPs regularly or in real time. However, it is difficult to determine the accurate number and location of broken wires through the mainstream electromagnetic eddy current inspection methods. In addition, common technologies such as acoustic emissions, which is the only technology applied in long pipelines, fail to detect leaks [
9].
The substitution of an existing partially broken pipe with a whole undamaged pipe is not an economical approach [
10], so it is very essential to assess the residual structure integrity of an ECP with broken wires. Numerical simulations, prototype tests and qualitative decision methods are generally used to assess the condition of pipes with broken wires. Numerical simulations are widely used, which can provide further directions before an ECP fails or bursts. You [
11] developed a simplified structural mechanics model based on the classical theory of cylindrical shells. Zarghamee et al. [
12] calculated the circumferential thrust and bending moment of a tube wall due to broken wires and verified the results via finite element analysis (FEA). Though a simplified model and finite element method (FEM) model could be easily established, because it neglects the stiffness of wires, it does not reflect real life. Zarghamee et al. [
13] considered two different geometries of a pre-stress loss zone. One was axisymmetric, in the form of a band, and the other was rectangular. Afterwards, he simulated the cracking process and the interlocking behavior of a cracked concrete core and investigated the strength of a cracked concrete outer core under the pressure of an expanding steel cylinder using the nonlinear FEA method [
14]. The stiffness of wires, the earth load and pipe loads were calculated using the initial pipe design standard.
Gomez et al. [
15] calculated the stress status of the middle zone of a pipe with different numbers of broken wires. Diab et al. [
16] used both two-dimensional (2D) and three-dimensional (3D) models to present the mechanical behavior of the remaining structure via elastic FEA with three distribution zones. Ge et al. determined the effect of the adhesion quality of the mortar coating on the overall performance of PCCPs by only conducting elastic analysis [
17]. The pipe performance as the water pressure and number of broken wires increased was studied by Alavinasab et al. [
18,
19]. Then, Hajali et al. [
20,
21] compared the effects of broken wire wraps in the middle of a pipe with those at a joint. In addition, Xiong et al. [
22] proposed a new model called the wire-wrapping model to simulate pre-stress. Hu et al. [
23] presented a novel bar-wrapping calculation model under pre-stress conditions for a new type of water conveyance pipe called a bar-wrapped cylinder concrete pressure pipe. Zhai et al. [
24,
25,
26] considered two distributions (removing all of the broken wire and considering the partial loss of pre-stress through simplified contact interactions) in broken pipes and analyzed the strengthening effect via carbon fiber reinforced polymer (CFRP). Dong et al. [
27] defined a cohesive contact interaction to simulate the delamination of the mortar coating in broken pipes.
Four methods are generally used to simulate the pre-stress of steel wires in FEA: the equivalent load method, the initial strain method, the equivalent cooling method, and the wire-wrapping model. Most researchers adopted the equivalent load method [
11,
12,
13,
14,
15,
16,
17,
18,
19,
20], which regards the pre-stress of steel wires as a form of radial load. The simulation is simple and direct, without consideration of the location of steel wires, and it is easy to converge. However, the stiffness of wires is neglected, causing distortion of the simulation results. In the initial strain method conducted by Lin [
28], pre-stress was applied to steel wire by applying an initial strain to the wire. In this method, the pre-stress loss usually cannot be considered since it is represented by stress. Most researchers [
24,
25,
26,
29,
30] used the equivalent cooling method. This method constructed wire elements to apply pre-stress and take the wire stiffness into account by increasing the temperature field and equalizing the initial pre-stress to the cooling temperature of the wire. However, cooling the wire keeps it in a compressed state, which is contrary to the initial tensile state seen in practice. In addition, if the nonlinear behavior of the material and contact is considered in the nonlinear FEA, adding the temperature field undoubtedly makes it a more complex nonlinear coupled problem, which increases the solution difficulty and reduces convergence. Xiong et al. [
22] put forward the wire-wrapping model, which is very complex and inconvenient to apply.
A few scholars have carried out experimental analysis studies on pipes with broken wires. Hu [
29] and Shen [
31] conducted a three-edge bearing test under an external load test with a 4 m-diameter, single-layer, wire-wrapped pipe. Dou et al. [
32] carried out an internal hydraulic test on a PCCP with an inner diameter of 2.6 m and compared the repairing effect with a PCCP reinforced with restoration materials.
Hu et al. [
33] developed an internal pressure test for a full-scale, single-layer PCCP with an inner diameter of 2.8 m and a broken wire percentage of 0% (intact), 5% and 10%. Luo et al. [
34] established the mathematical evaluation model of safety risk for PCCP pipelines by adopting the analytic hierarchy process (AHP) method.
However, due to the complexity of ECPs, it is difficult to further simulate the mechanical behavior of pipes with broken wires by considering construction process simulation, nonlinear constitutive models of materials and contact interaction. Due to the test costs and technical difficulty, it is difficult to carry out prototype field tests on large-diameter pipes with broken wires in actual operational status. Therefore, the most practical method is to evaluate the mechanical behavior of a broken pipe under actual operating conditions by using the numerical simulation method. In this paper, a location hypothesis of broken wires is presented, and a random broken case induced by congenital manufacturing defects, such as hydrogen embrittlement, is considered for the first time. Meanwhile, to avoid the shortcomings of modeling the pre-stress of wires, a pre-stress simulating method called the initial stress method, based on a novel single-spring joint element method, is proposed. By considering material nonlinearity, contact nonlinearity and the bond–slip relationship in reinforced concrete (RC) structures, and by choosing a proper pre-stress simulation method, we used the FEM method to model two large-diameter ECP pipes with different bar-wrapping layers. The results achieved from nonlinear FEA are analyzed and compared.
3. Pre-Stress Simulating Methods
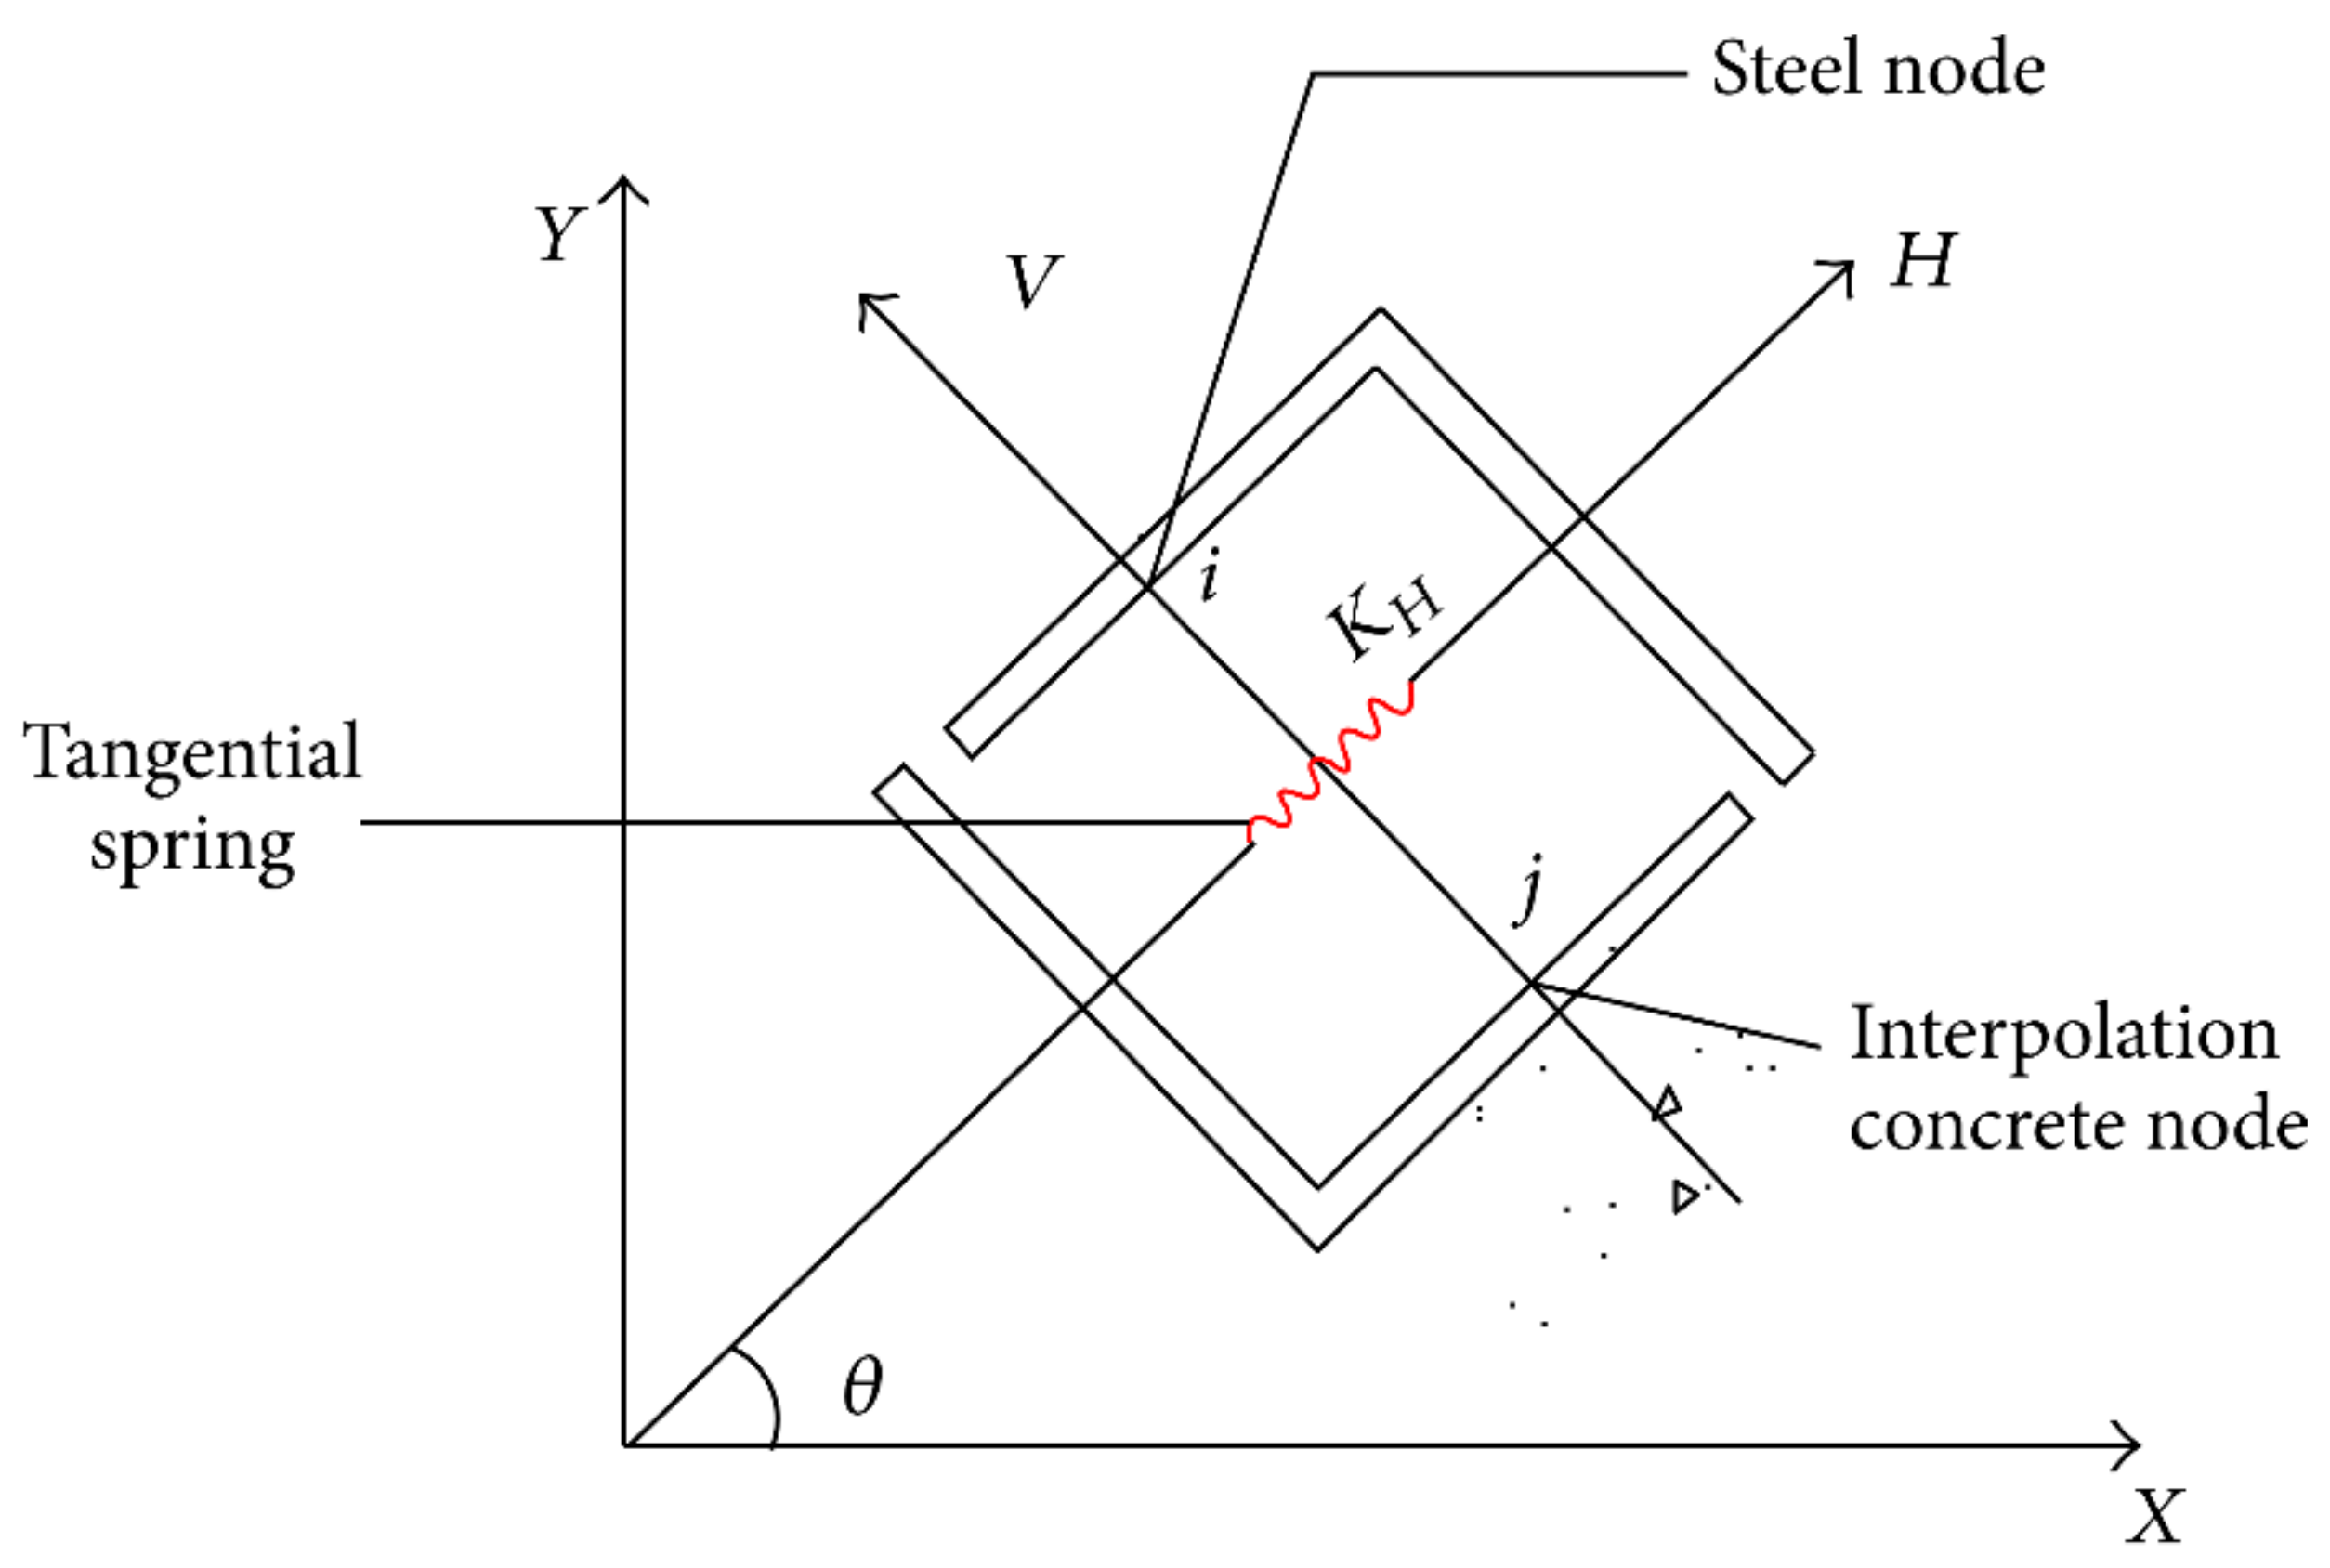
To avoid shortcomings when modeling the pre-stress of wires, a new pre-stress simulating method called the initial stress method, based on a novel single-spring joint element method, is proposed. In the novel single-spring joint element method, the tangential action between bars and concrete is modeled by the tangential spring, and the normal direction degree is compelled to be equal (see
Figure 5). The related principles and derivation arrangements can be seen in the literature [
35].
The incremental equilibrium equation for the novel single-spring joint element method is as follows:
where
,
,
,
,
,
are the stiffness matrix and the displacement and load vector in the global and the nodal local coordinate system, respectively.
is the tangential stiffness matrix, where
and
, and
D and
l are the diameter and length of the reinforcement, respectively.
represents the coordinate conversion matrix between the global and the local coordinate system of the reinforcement node, and
represents the bond–slip curve obtained from experiments.
When solving the initial stress field of a PCCP from the initial stress of prestressed wire, Equation (1) can be rewritten as follows:
where
,
is the strain matrix of wire elements,
is the initial stress vector of the wire elements and
.
Because the wire-wrapping process is completed at once, Equation (2) is not solved by the increment method, but by the total iterative method. The simulating method is easy and direct with good convergence. Most importantly, the pre-stress loss can be readily considered.
5. FEA Results
In practice, a pipe is produced, then placed for a long time in an outdoor space and finally installed. After a series of water pressure tests, the pipe is applied in normal use; then, wires start to break. Combining the analyzing accuracy and calculation efficiency, based on the birth–death method, the FEA considering manufacturing, installation and operation was divided into eight steps:
(1) The tube core and inner layer wires are involved in the calculation, and the initial stress of inner layer wires is applied.
(2) The outer layer of wires is added to the calculation, and the initial stress is applied.
(3) The concrete shrinkage and creep factors are calculated according to the specification [
3] and taken into account in FEA due to the long-time storage in outdoor space.
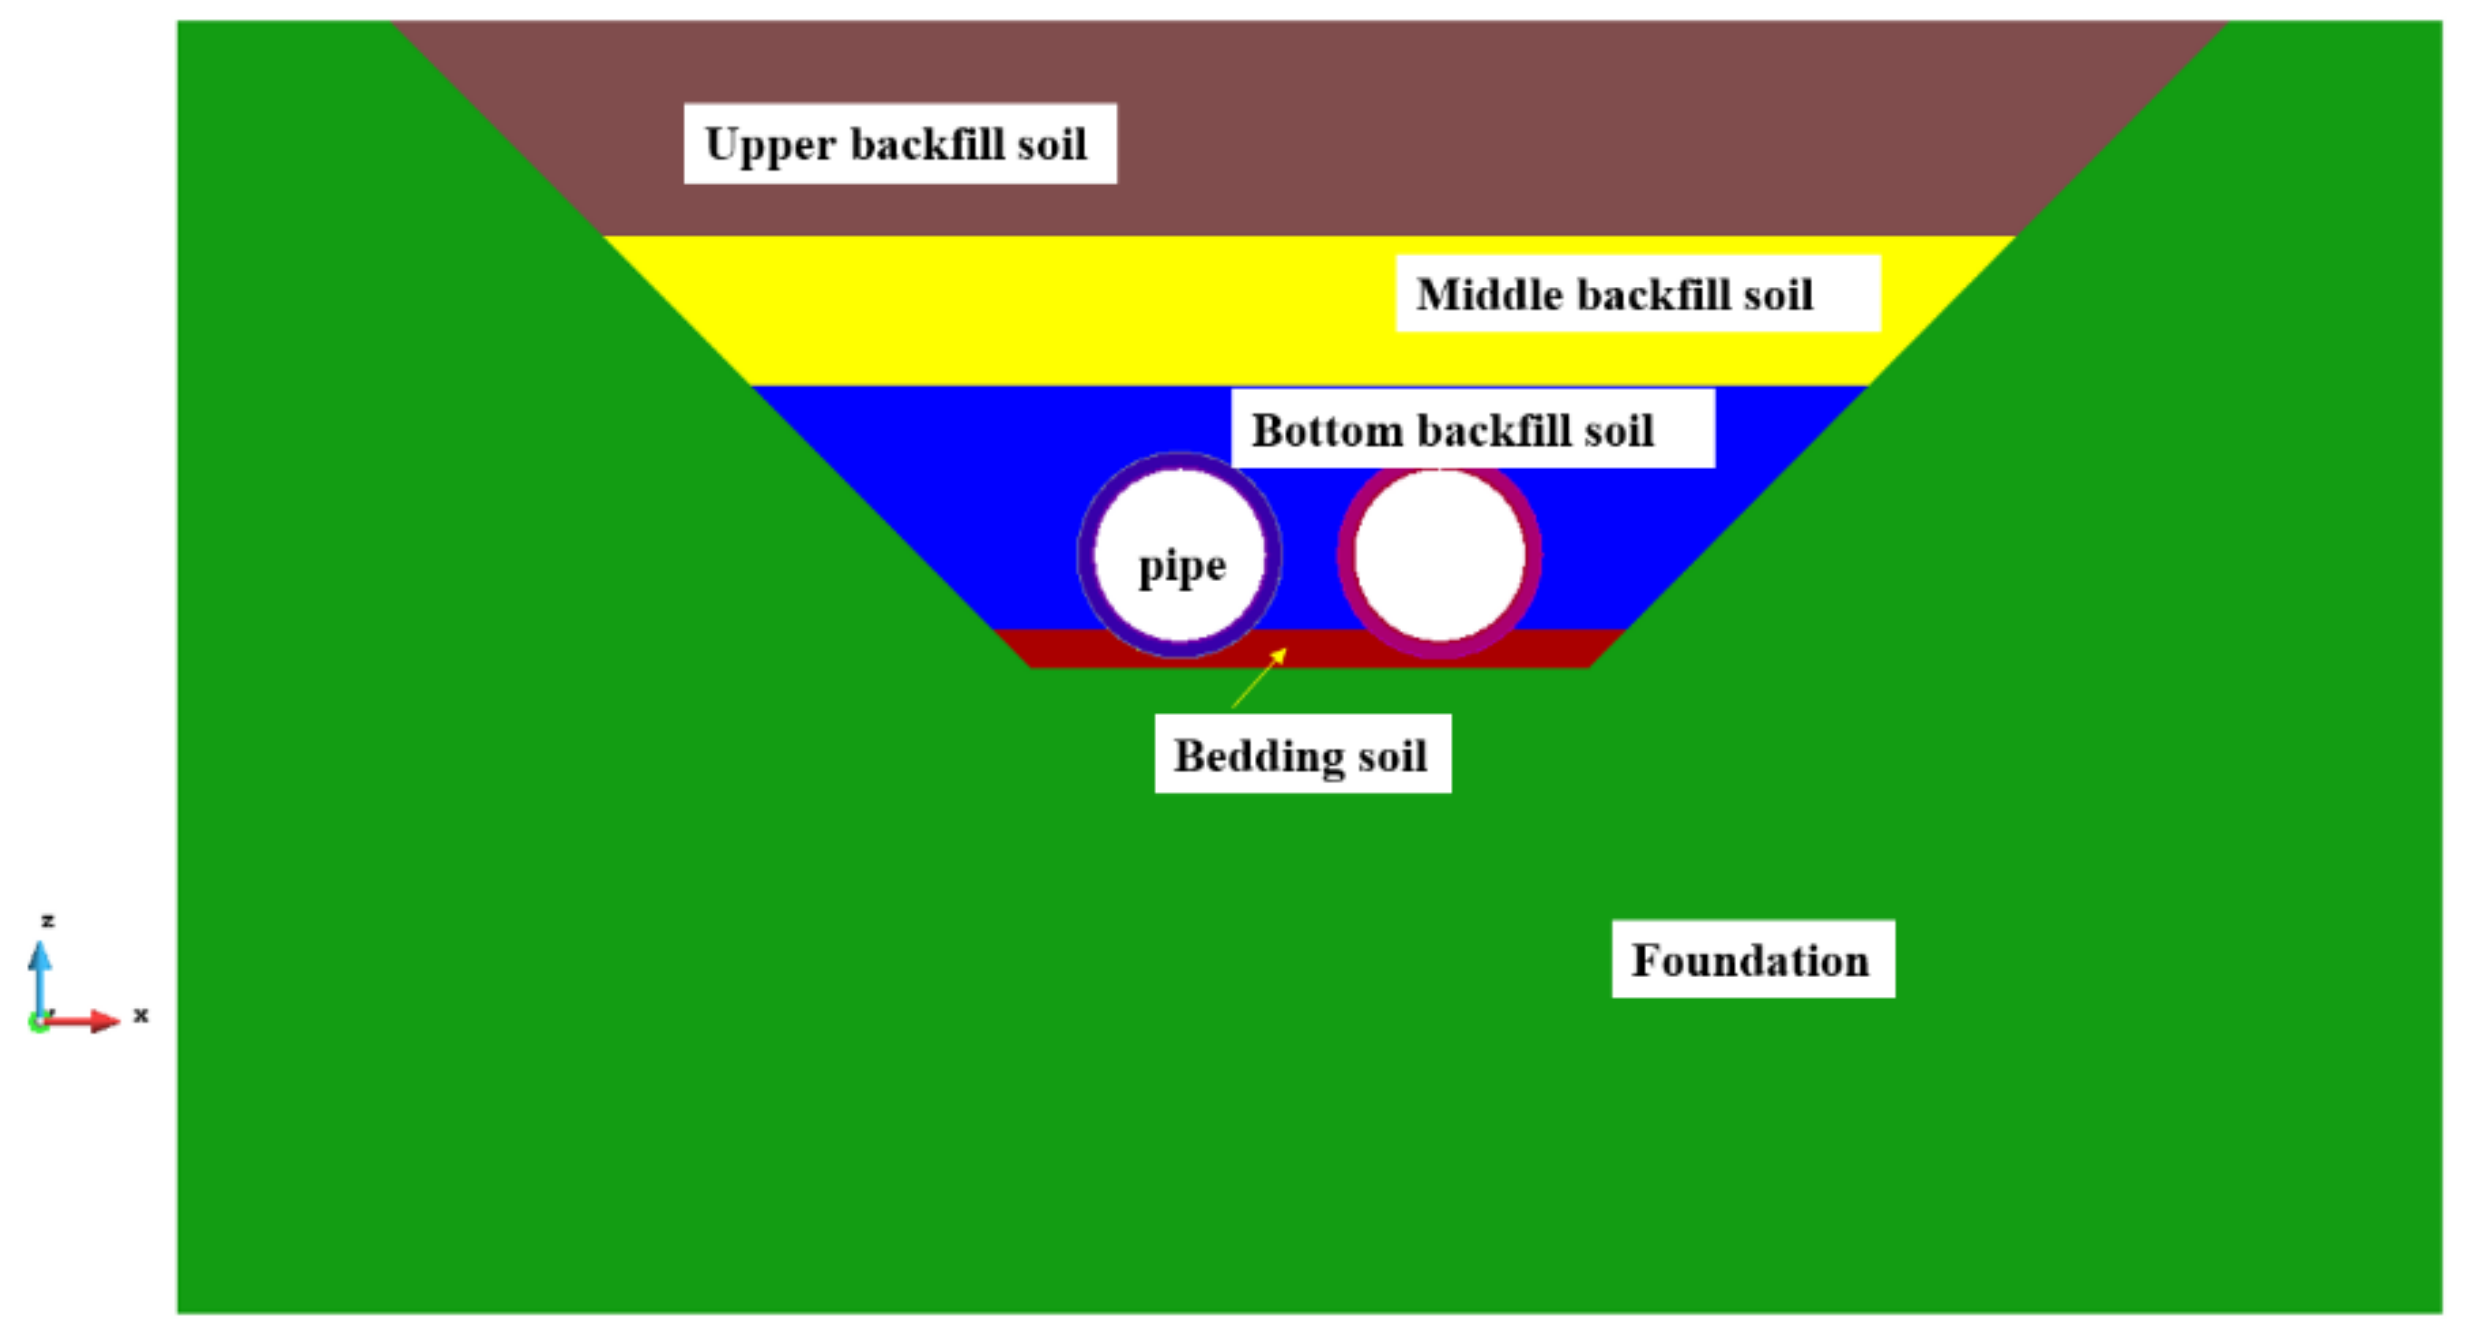
(4) Bedding soil and bottom backfill soil are added to the calculation, and meanwhile, the pipe weight is applied.
(5) Middle backfill soil is added to the calculation.
(6) The remaining backfill soil is added to the calculation.
(7) Apply internal water pressure.
(8) Broken wires are removed from the calculation based on different breakage hypotheses.
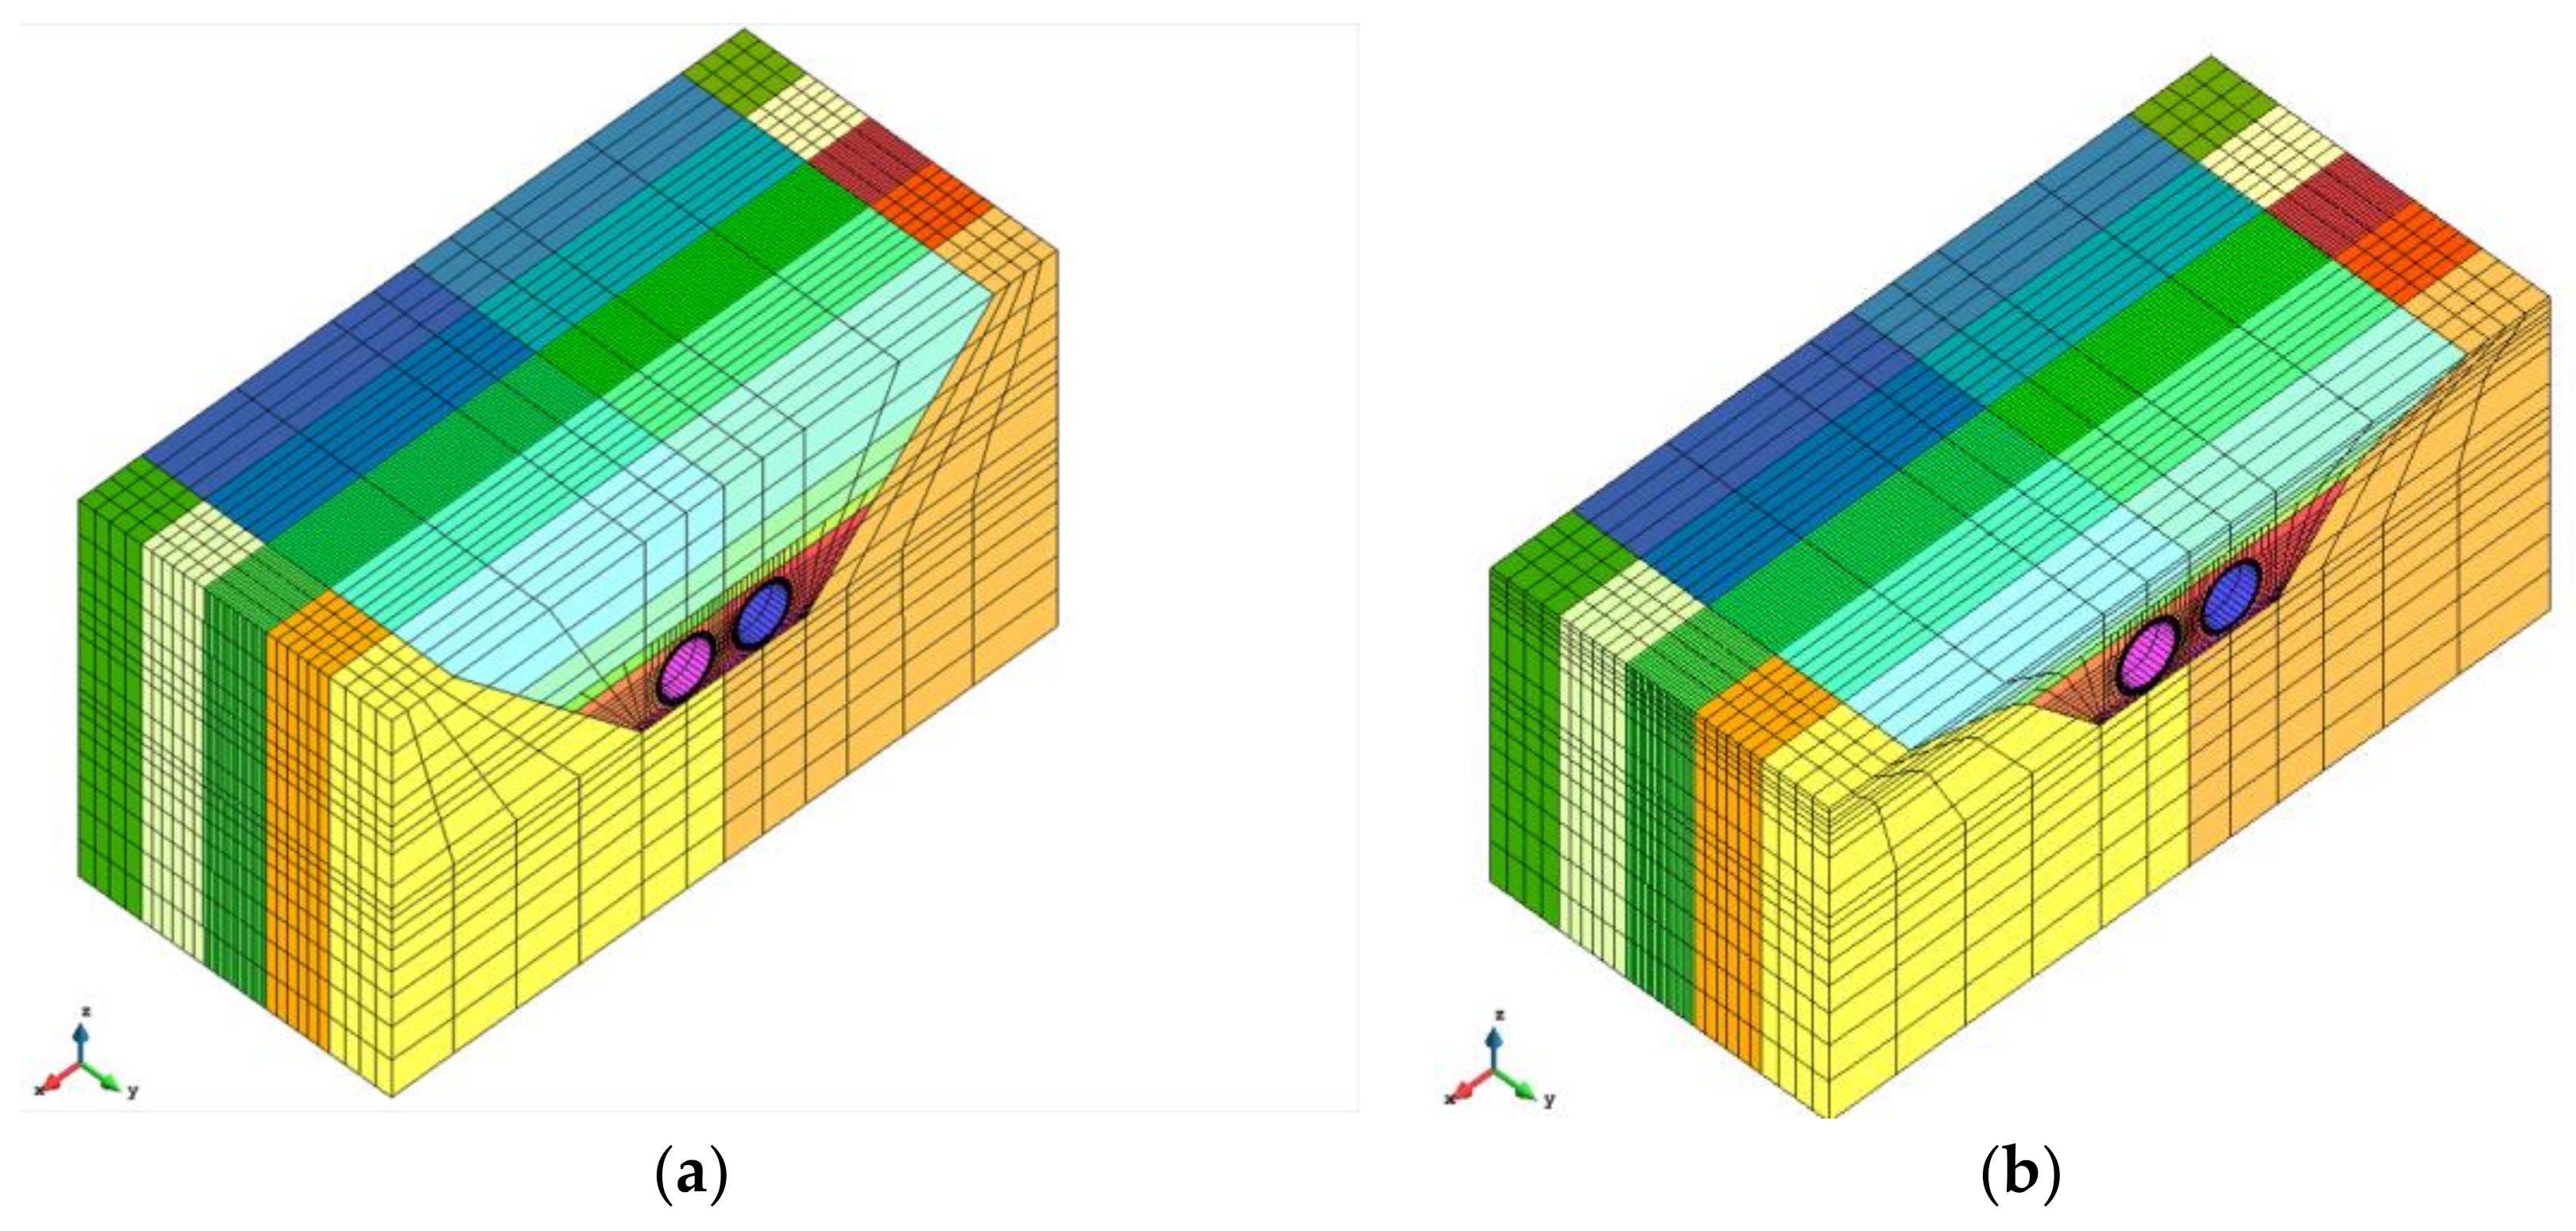
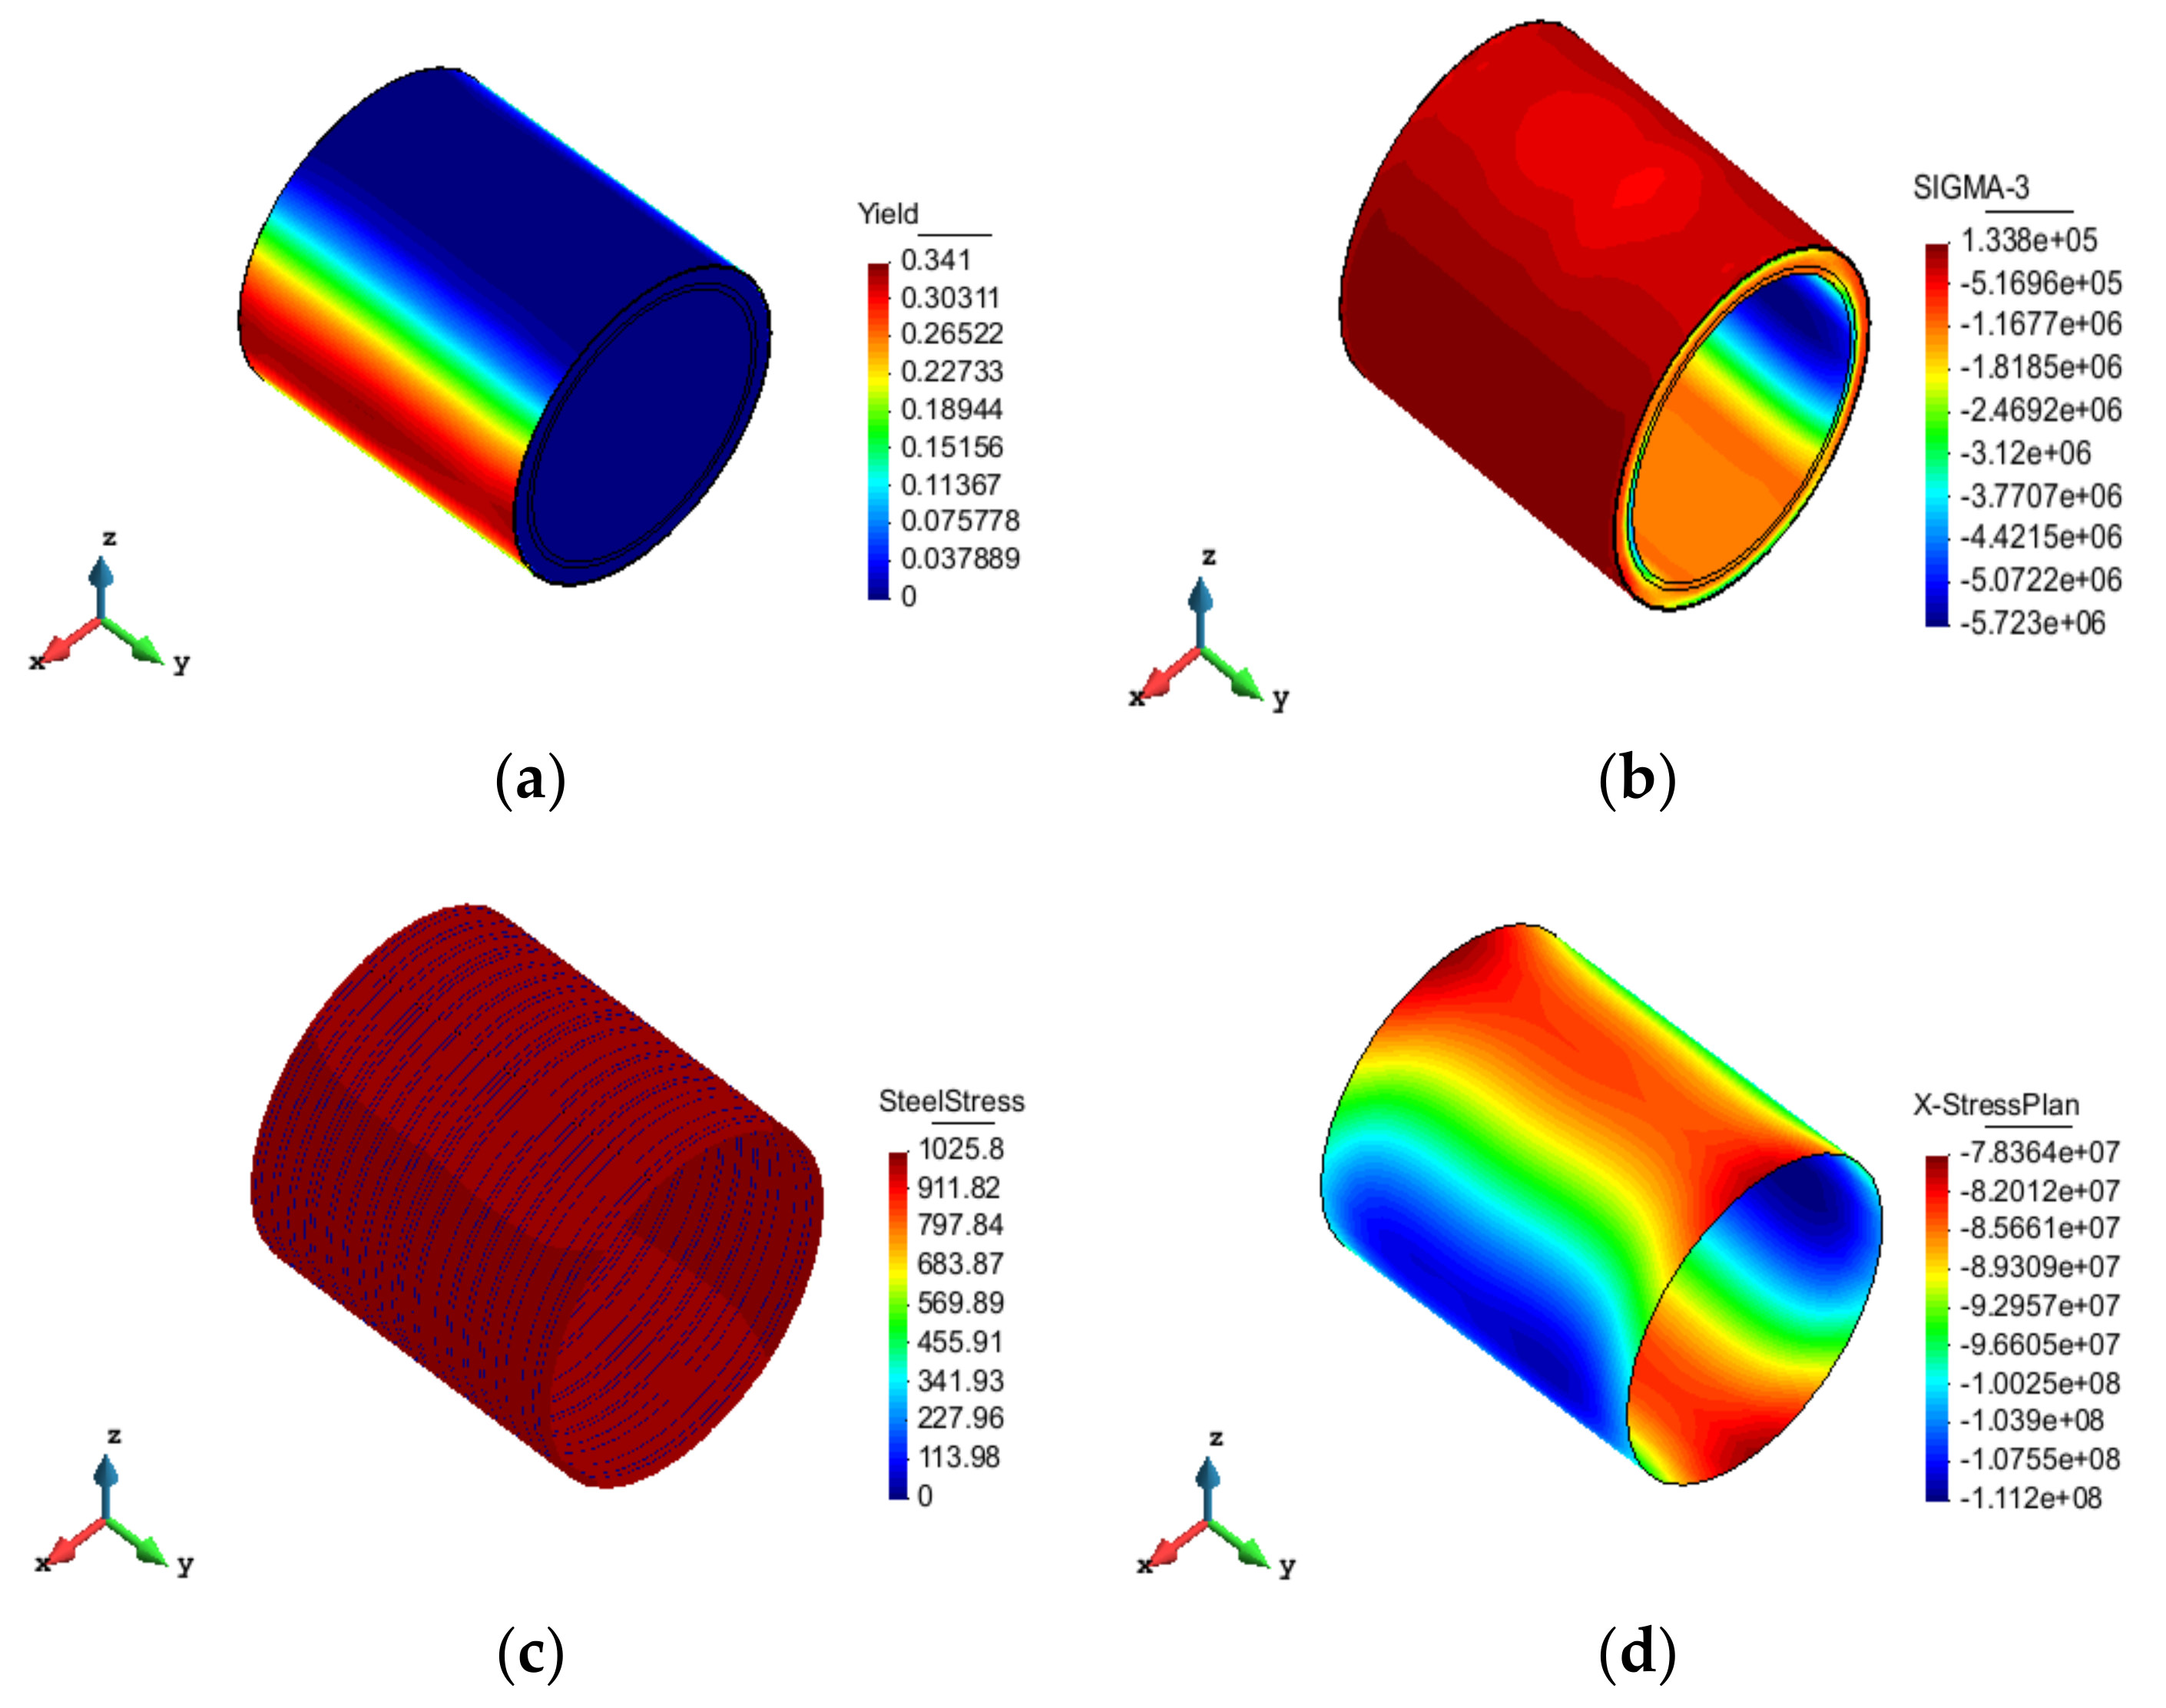
The backfill image of the FEA model for pipe No.1 is presented in
Figure 7.
For pipe No.2, step (2) and step (5) were neglected, since there was only a single layer and a low embedment depth.
The factors of creep, shrinkage and wire relaxation were determined by the specification [
3] and are shown in
Table 5.
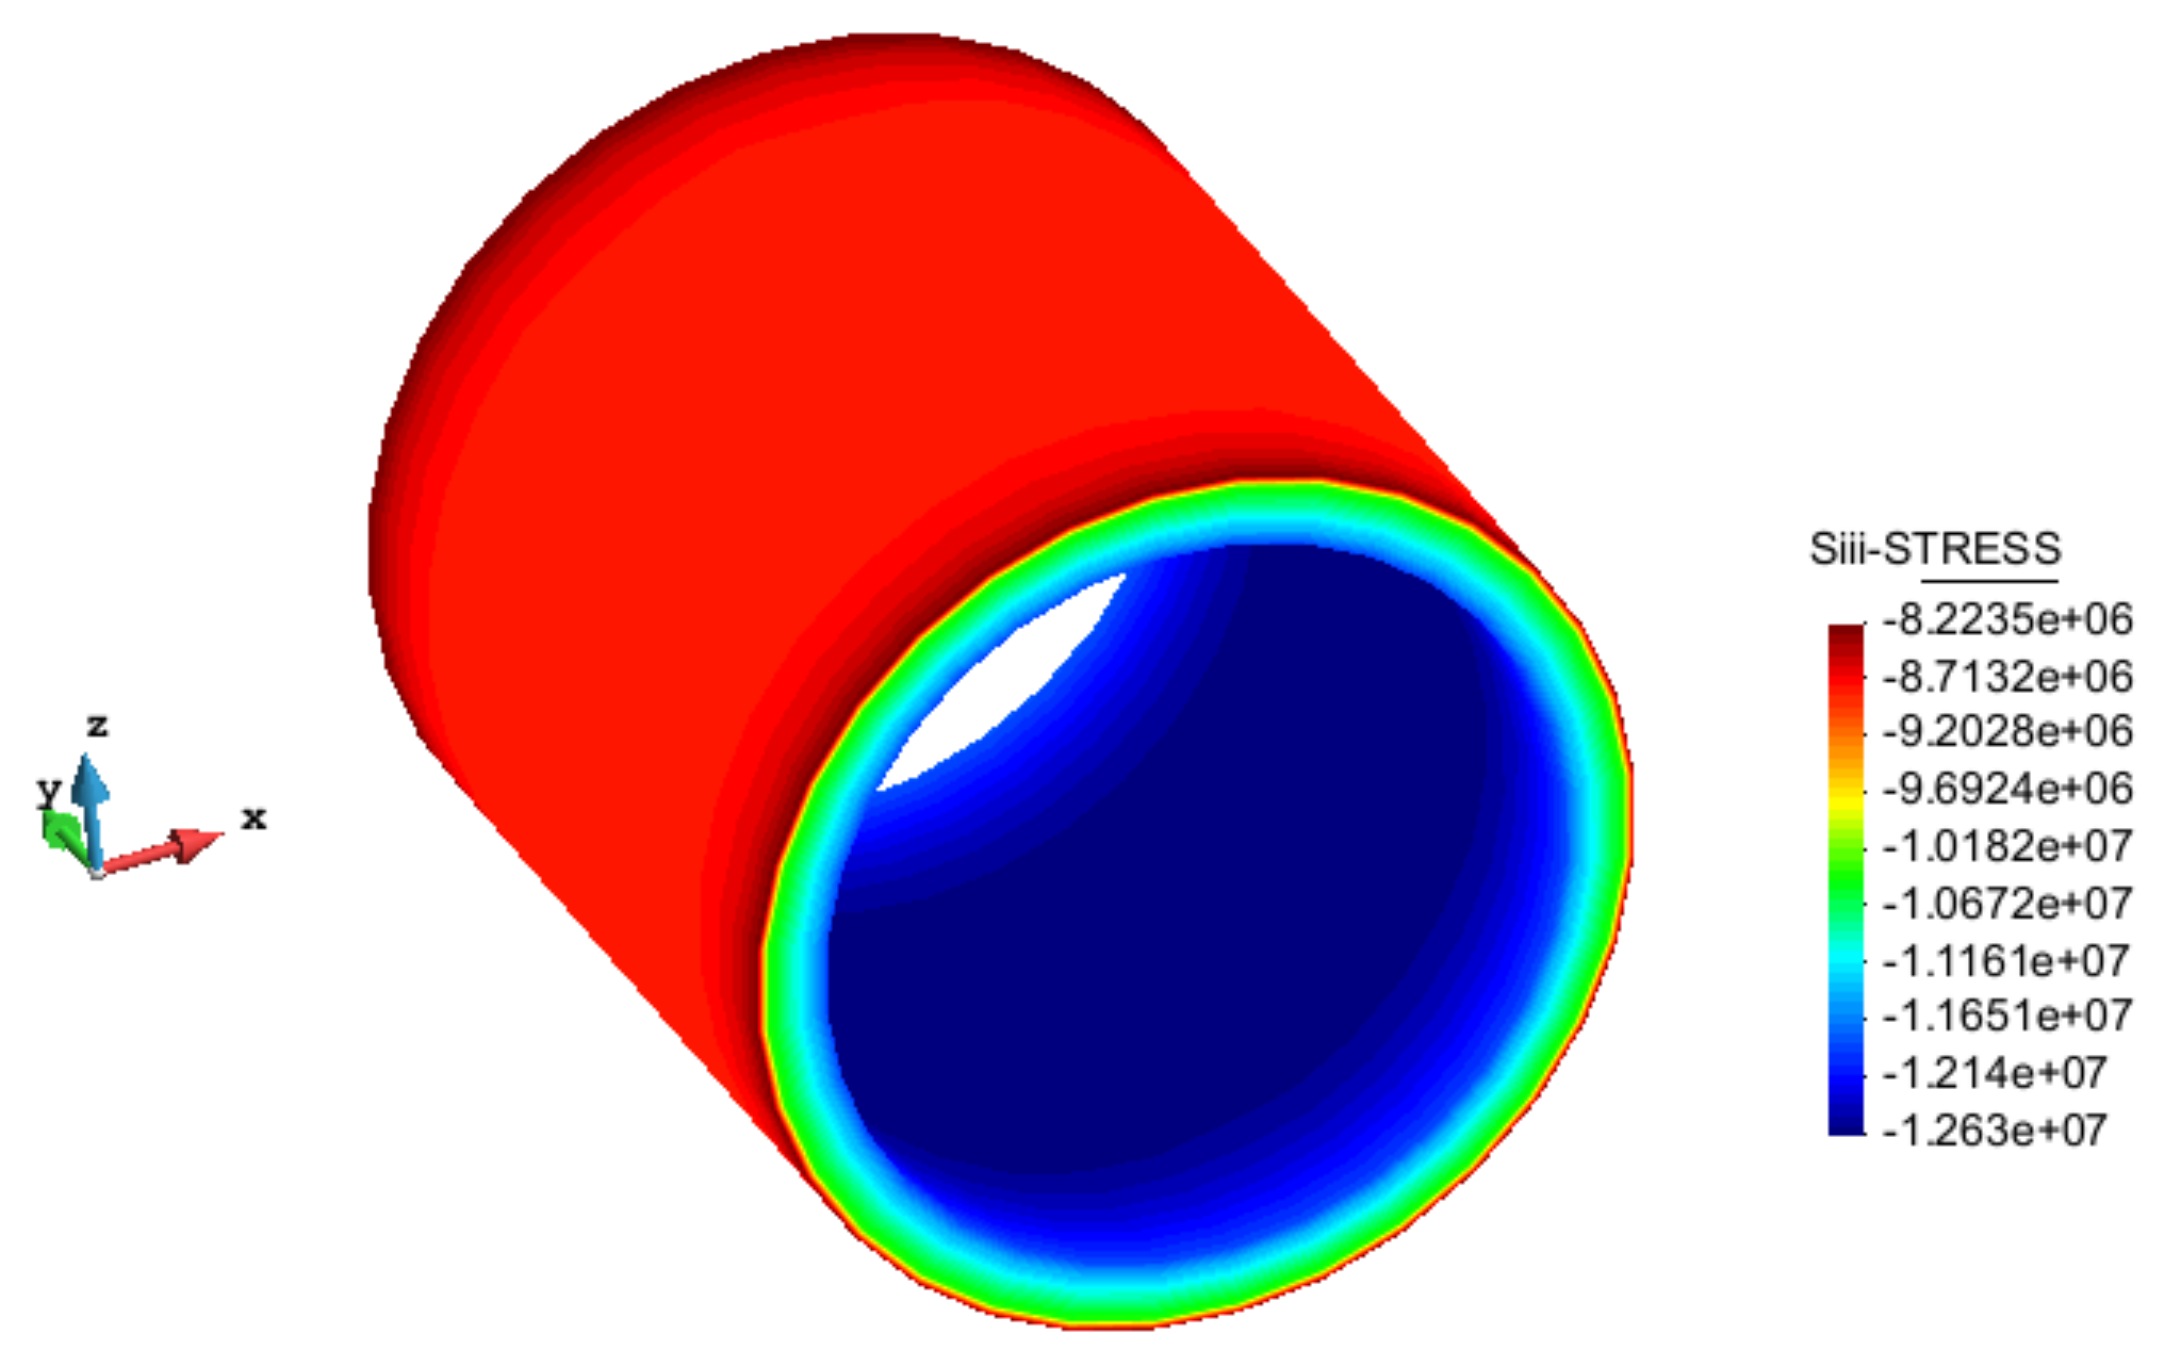
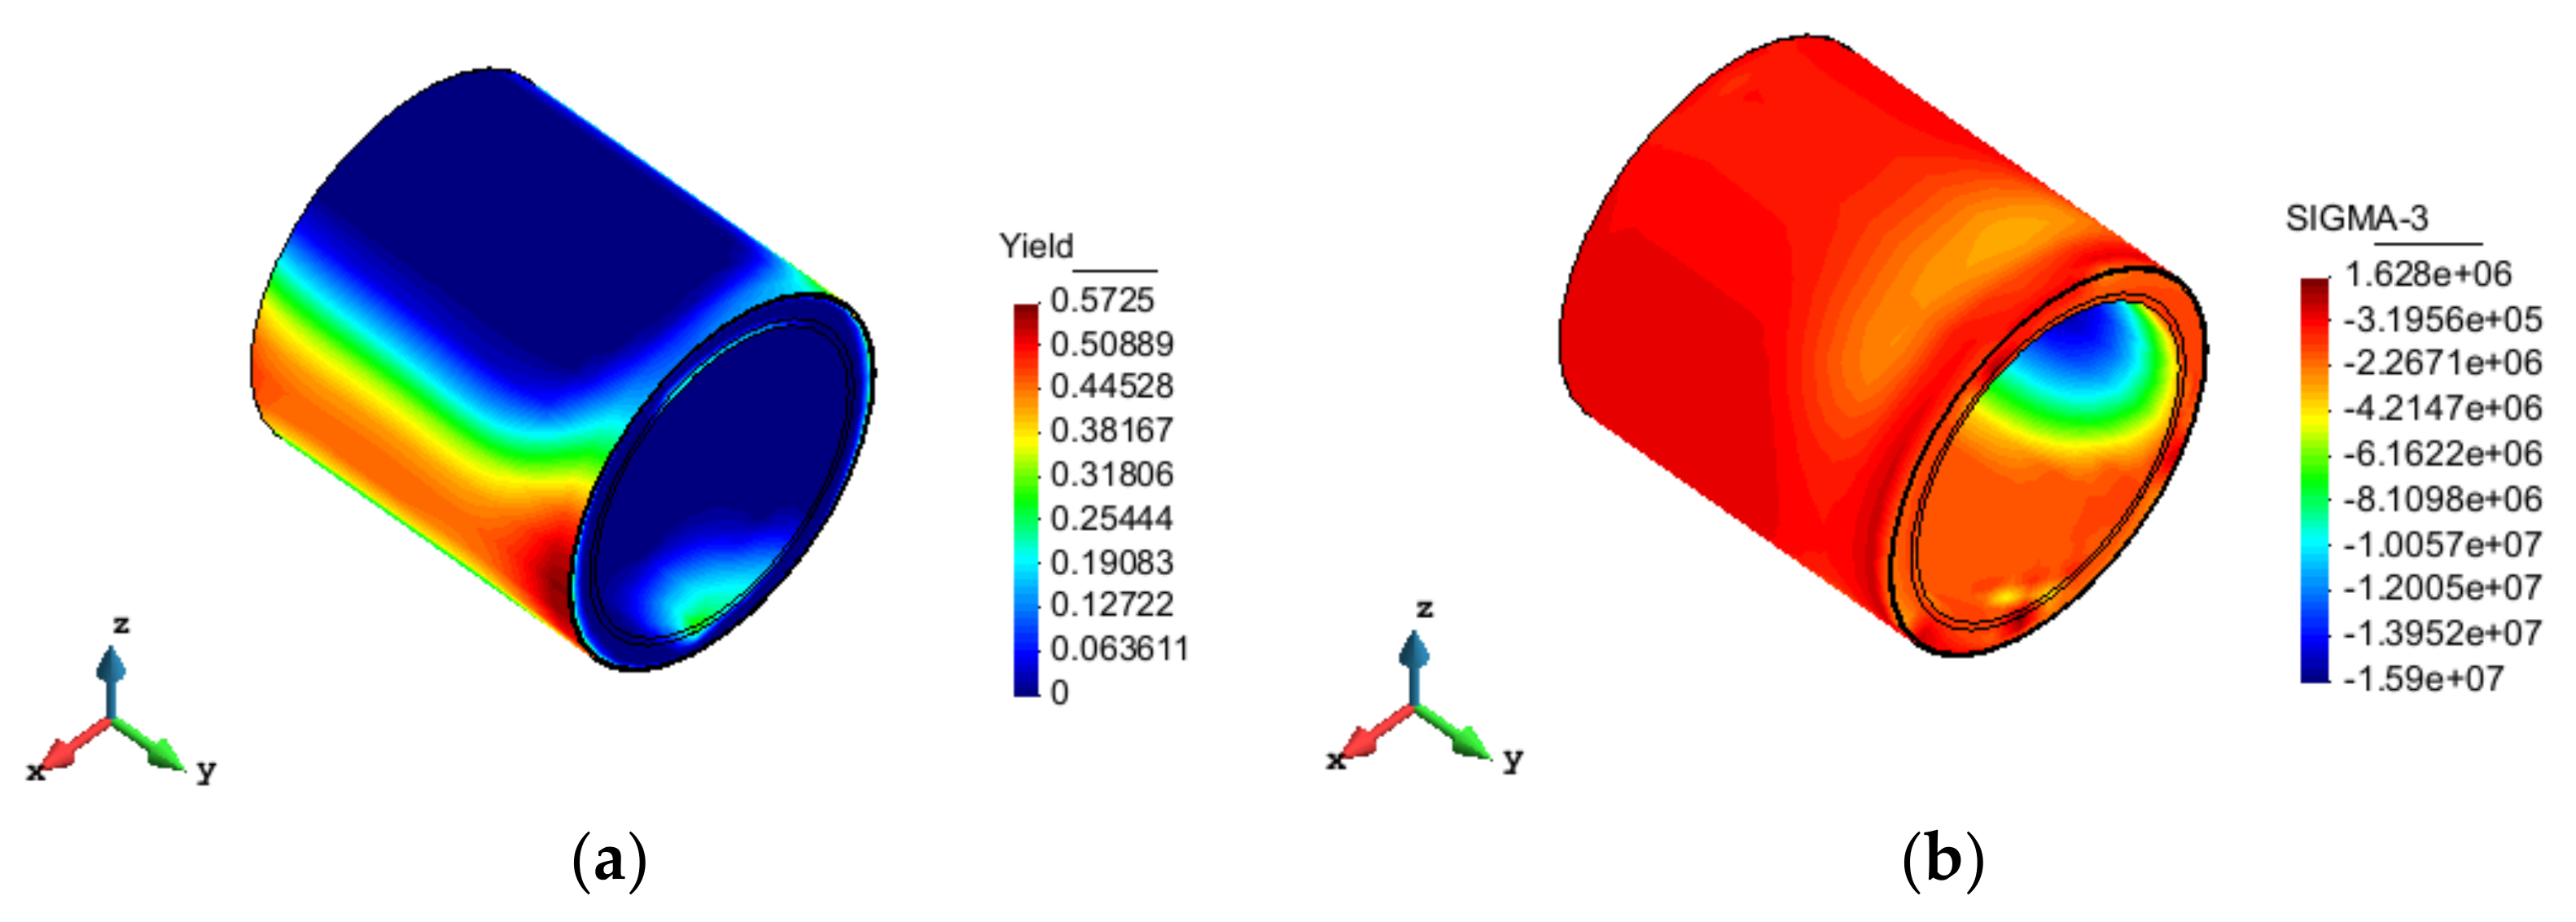
The circumferential stress range of concrete for pipe No.1 in step (3) was 10.82 MPa to 12.63 MPa with even distribution, displayed in
Figure 8. However, the specification [
3] assumes that the cross-sectional stress of the entire tube core is 12.09 MPa. We present the results of pipe No.1 by the standard method and FEA in
Table 6 to verify the accuracy of the finite element calculation before wires are broken. The results indicate that various indexes are basically consistent for both methods. Altogether, based on the proposed pre-stress simulation method, the 3D nonlinear FEA shows great consistency with the standard method in simulating ECPs before wires are broken, so the proposed FEA model is suitable for use to evaluate the overall performance of ECPs.
5.1. Finite Element Results of Pipe No.1 after Breaking Wires
Various scenarios combine the breakage ratios with distributional locations. Several results regarding the 10% broken wire ratio were selected to describe the state of pipes with broken wires.
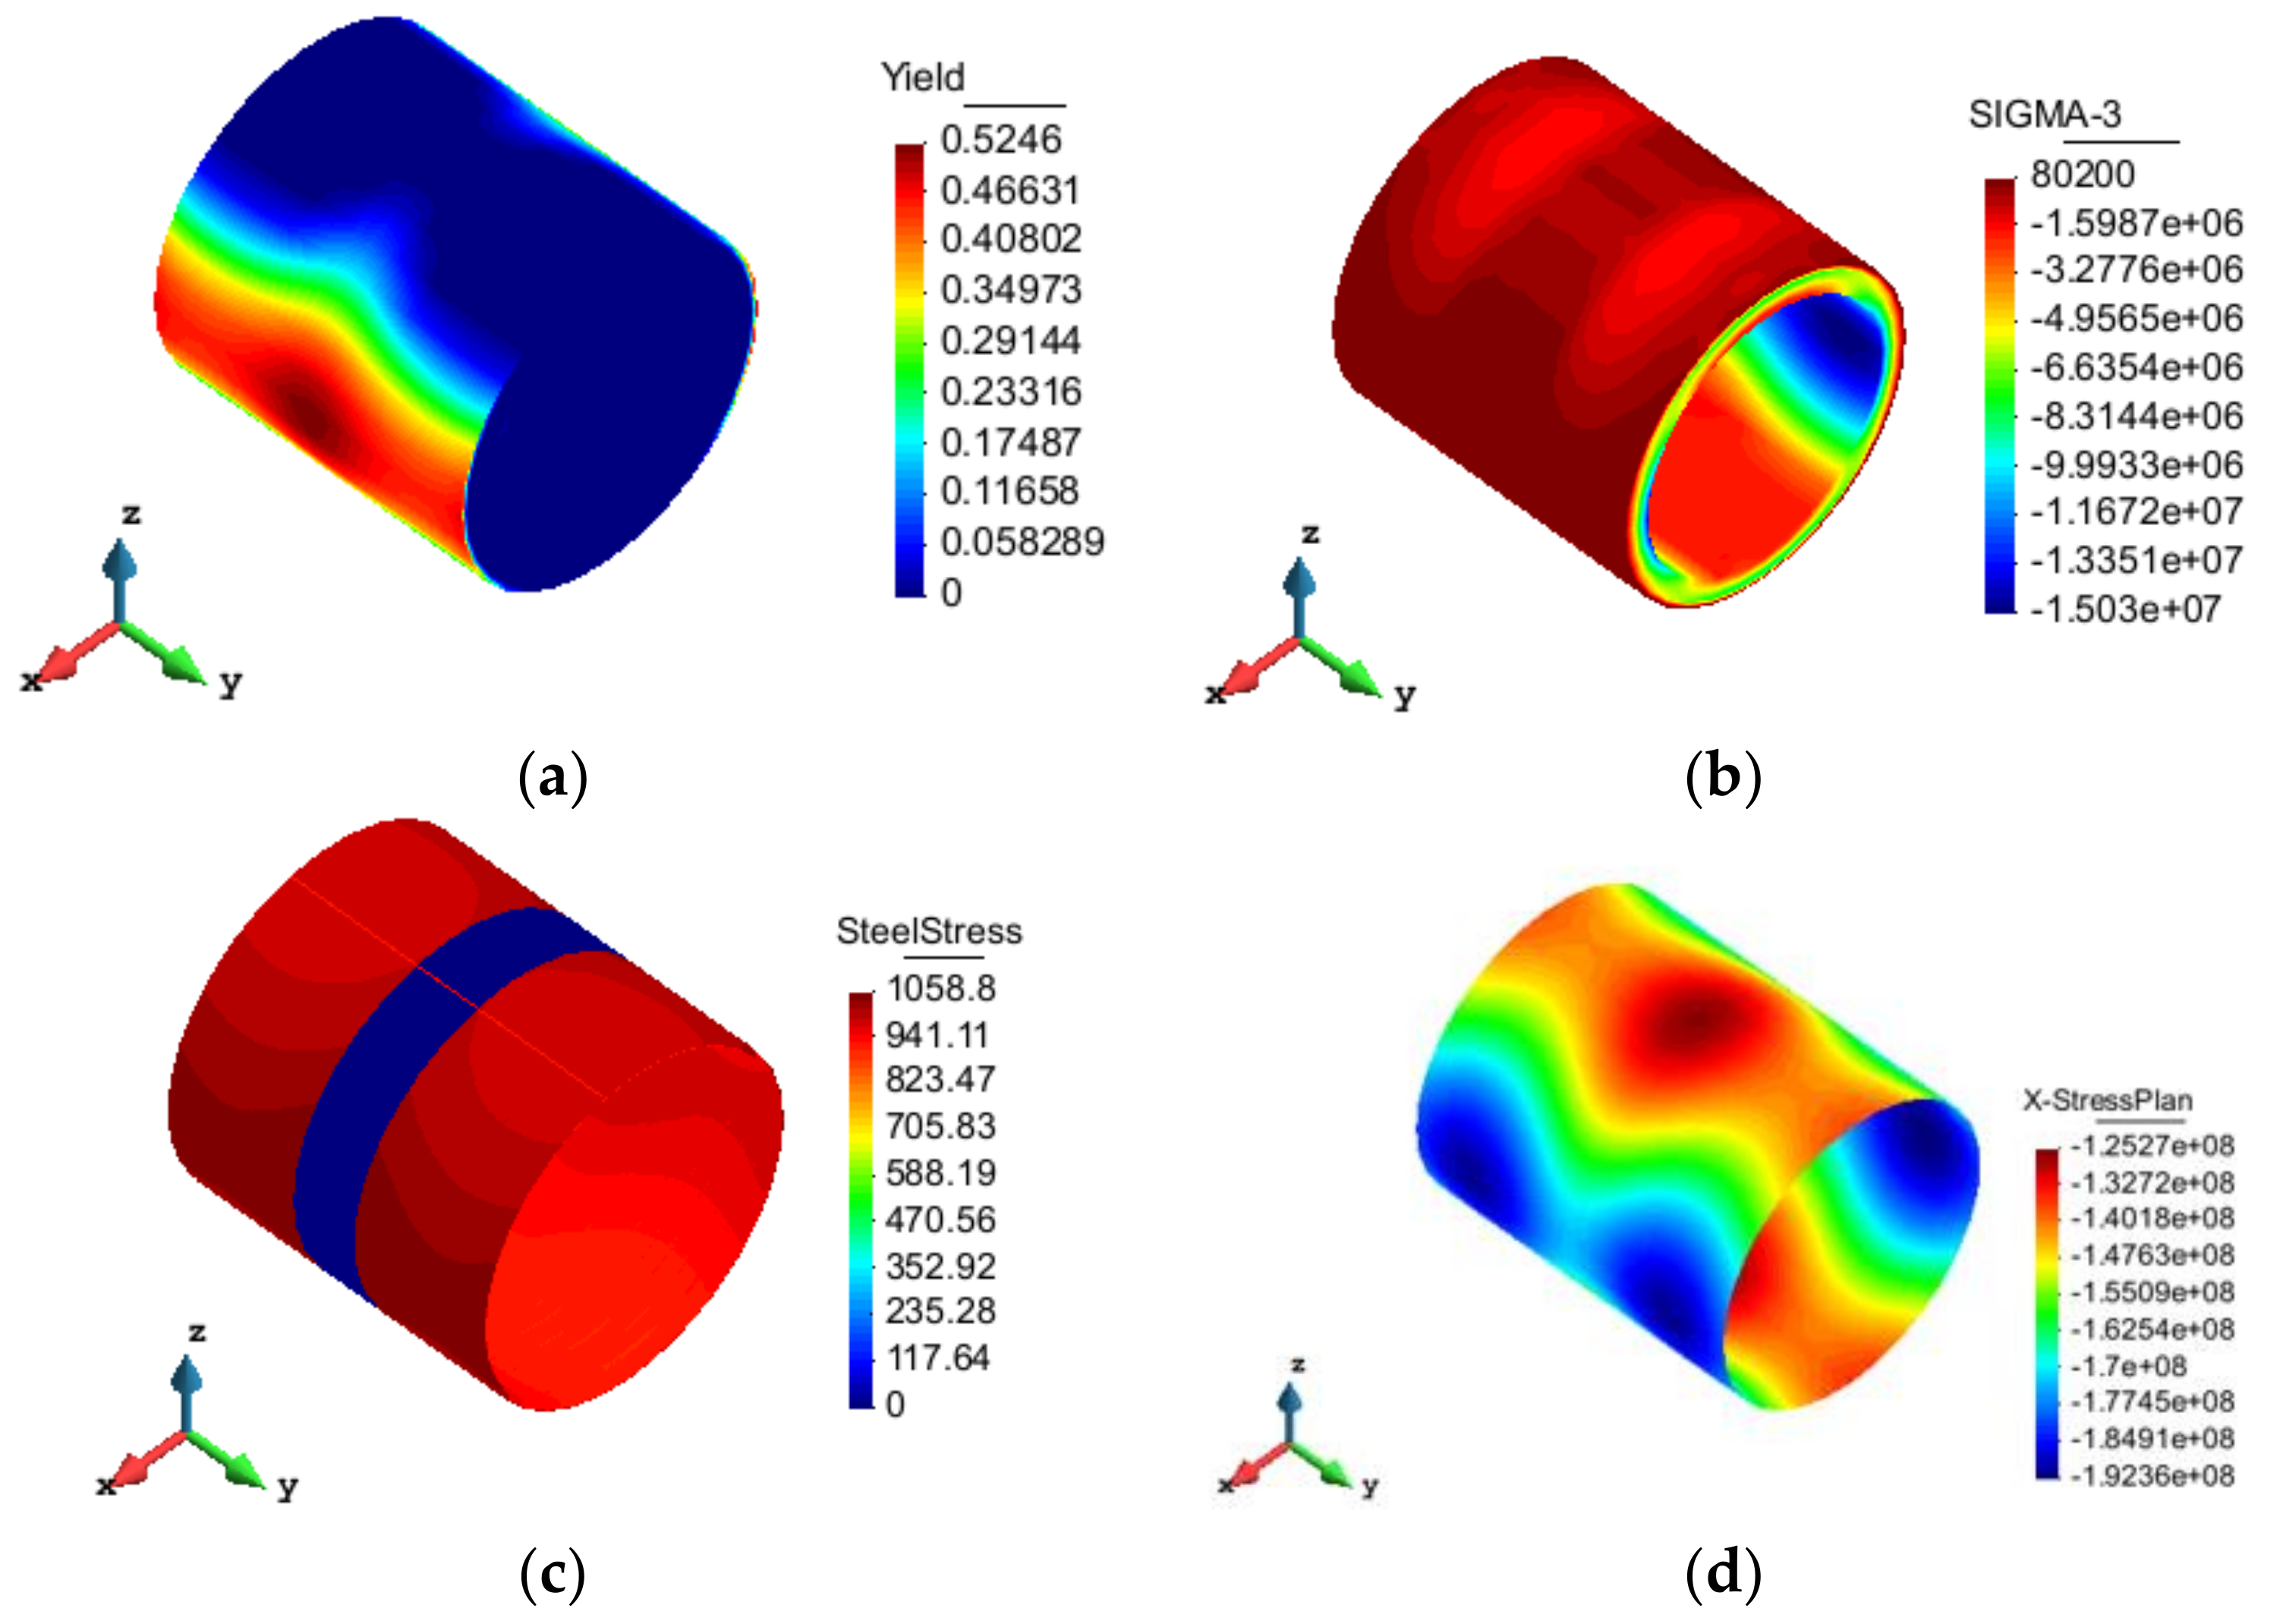
5.1.1. Case 1: 10% Breakage Ratio and Breaking at the Outer Pre-stressing Layer in the Middle of Pipe
The resulting nephogram is shown in
Figure 9.
The maximum damage value of the mortar is 0.52, which increases by 0.16 compared with the pre-breaking stage. The damage to the outer concrete starts growing at the springline in the broken area, with the maximum value of 0.24. The maximum stress in the outer-layer wires increases to 1058.8 MPa, with the increment of 19 MPa compared with the pre-breaking stage. Meanwhile, the stress in the inner wires near the pre-stressing loss zone also increases, which increases to around 11.0 MPa at the springline. Once the outer-layer wire in the middle of pipe is broken, the stress in the unbroken and inner wire on the side of the broken area will increase, and the stress in the cylinder will rise. The damage on the outer concrete will expand but not penetrate along the whole circumferential direction, and the inner concrete will not be damaged temporarily. The internal water load borne by the broken wire will be redistributed to the above materials.
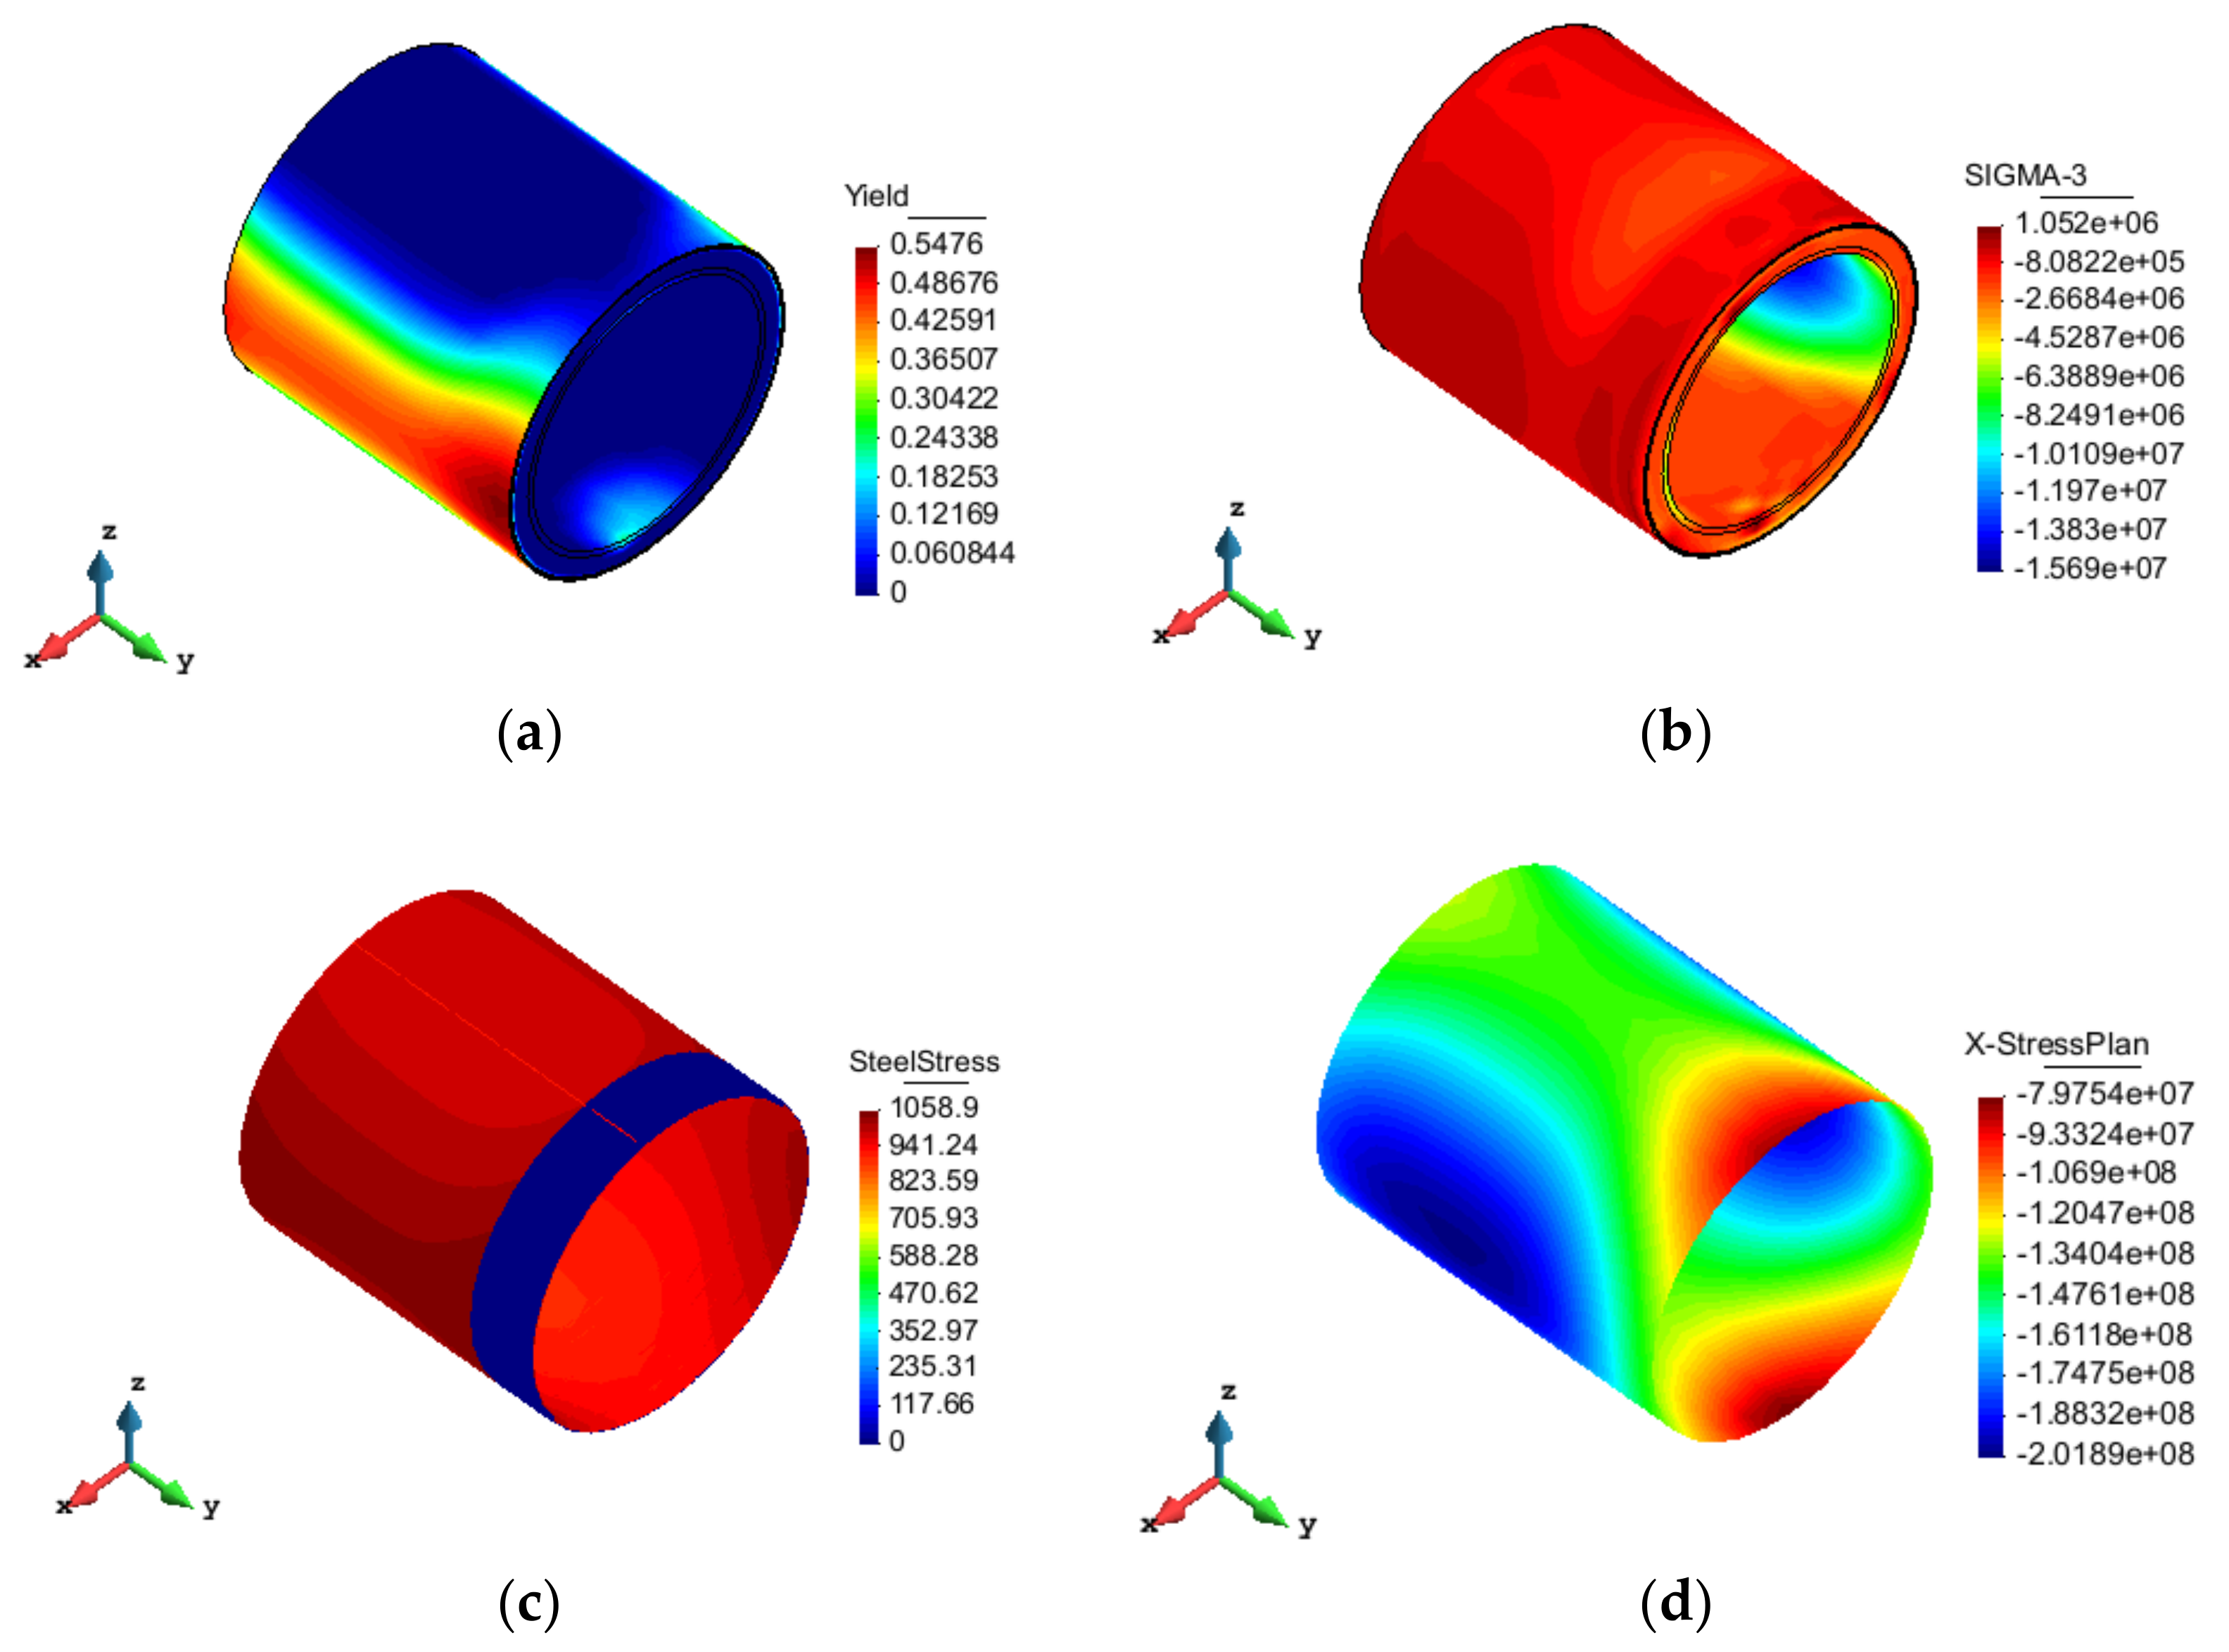
5.1.2. Case 2: 10% Breakage Ratio and Breaking at the Outer Pre-stressing Layer at the Joint of Pipe
The resulting nephogram is shown in
Figure 10. It shows that the maximum damage value of mortar is 0.55, which increases by 0.19 compared to the pre-breaking stage. At the springline in the broken area, the damage to the outer concrete starts growing, showing the maximum value of 0.30. The maximum stress in the outer-layer wires reaches 1058.9 MPa with the increment of about 19 MPa. At the same time, the stress in the inner wires and the stress in the cylinder around the pre-stressing loss zone increase. The damage to the outer concrete will not only expand but also penetrate along the whole circumferential direction, and the inner concrete is also damaged.
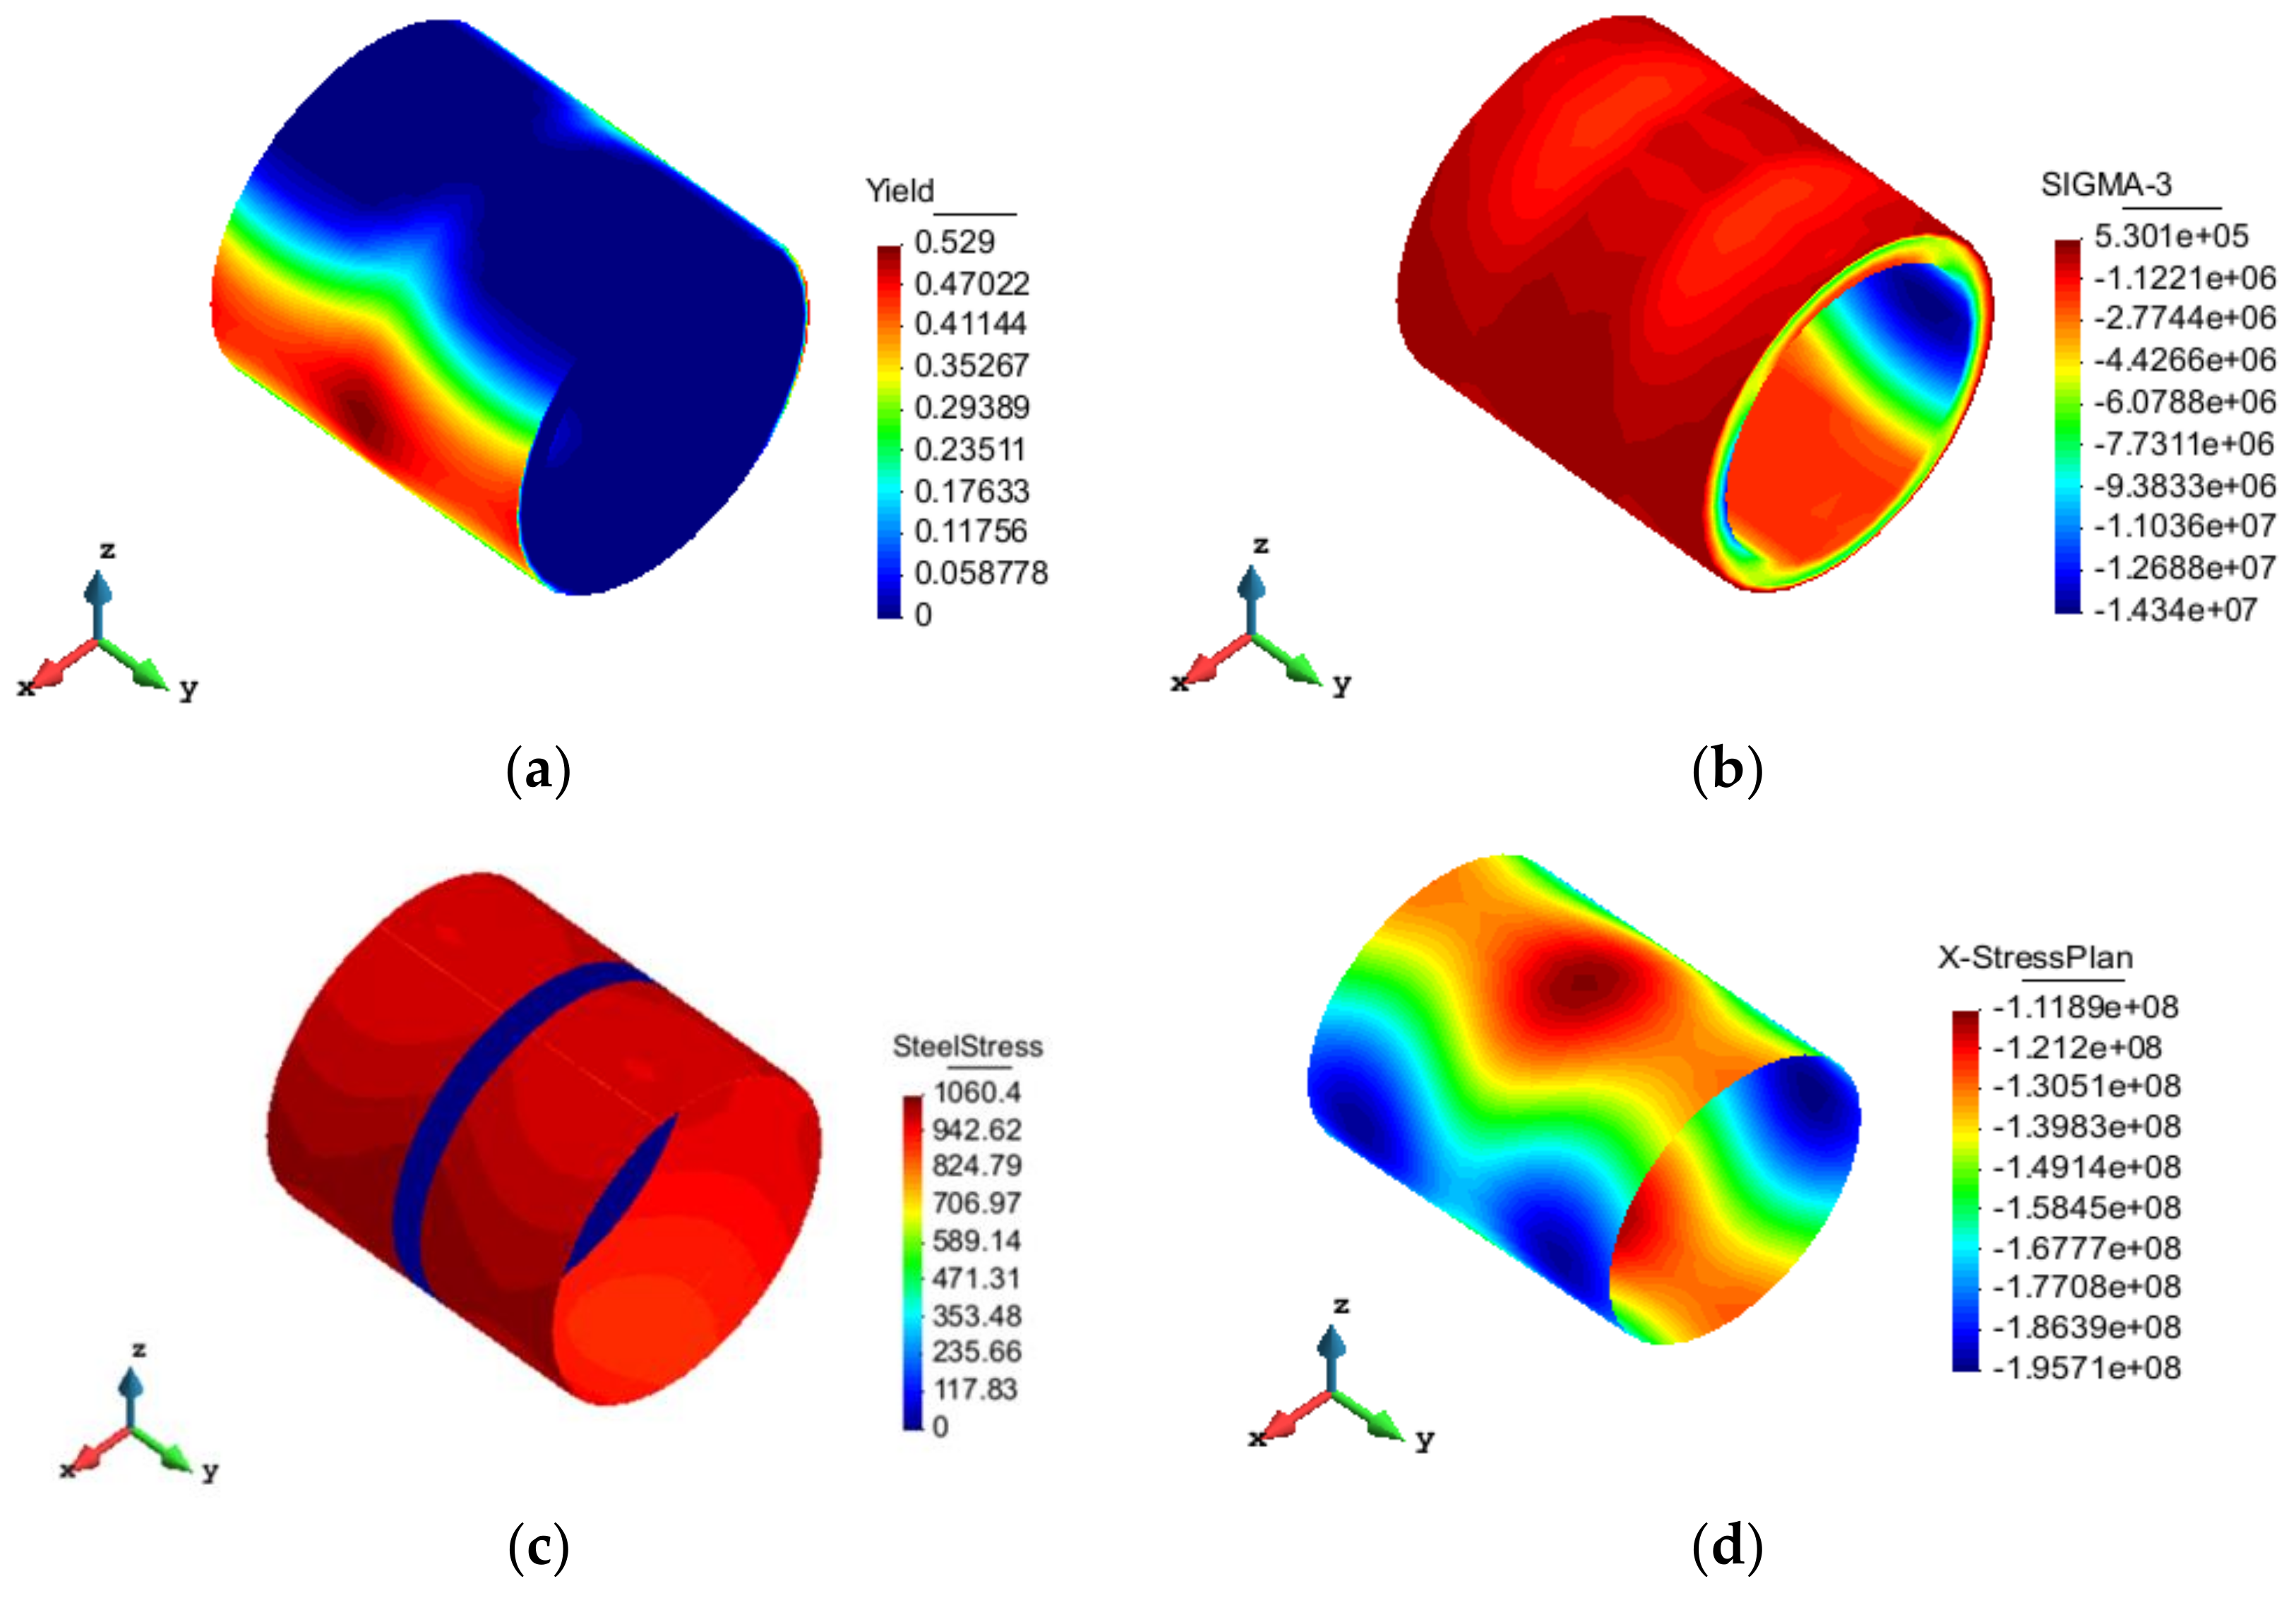
5.1.3. Case 3: 10% Breakage Ratio and Breaking at Both Outer and Inner Layer in the Middle of Pipe
The obtained nephogram is shown in
Figure 11. The maximum damage value of the mortar is 0.53. The damage to the outer concrete emerges at the springline in the broken area but does not penetrate along the whole circumferential direction, with the maximum value of 0.29. Damage also occurs at the invert and crown inside the pipe in the pre-stressing loss zone. The maximum stress in the outer wires approaches 1060.4 MPa. Meanwhile, the stress in the inner wires and the stress in the cylinder around the pre-stressing loss zone increase as well.
5.1.4. Case 4: 10% Breakage Ratio and Breaking at Both Outer and Inner Layer at the Joint of Pipe
The resulting nephogram is presented in
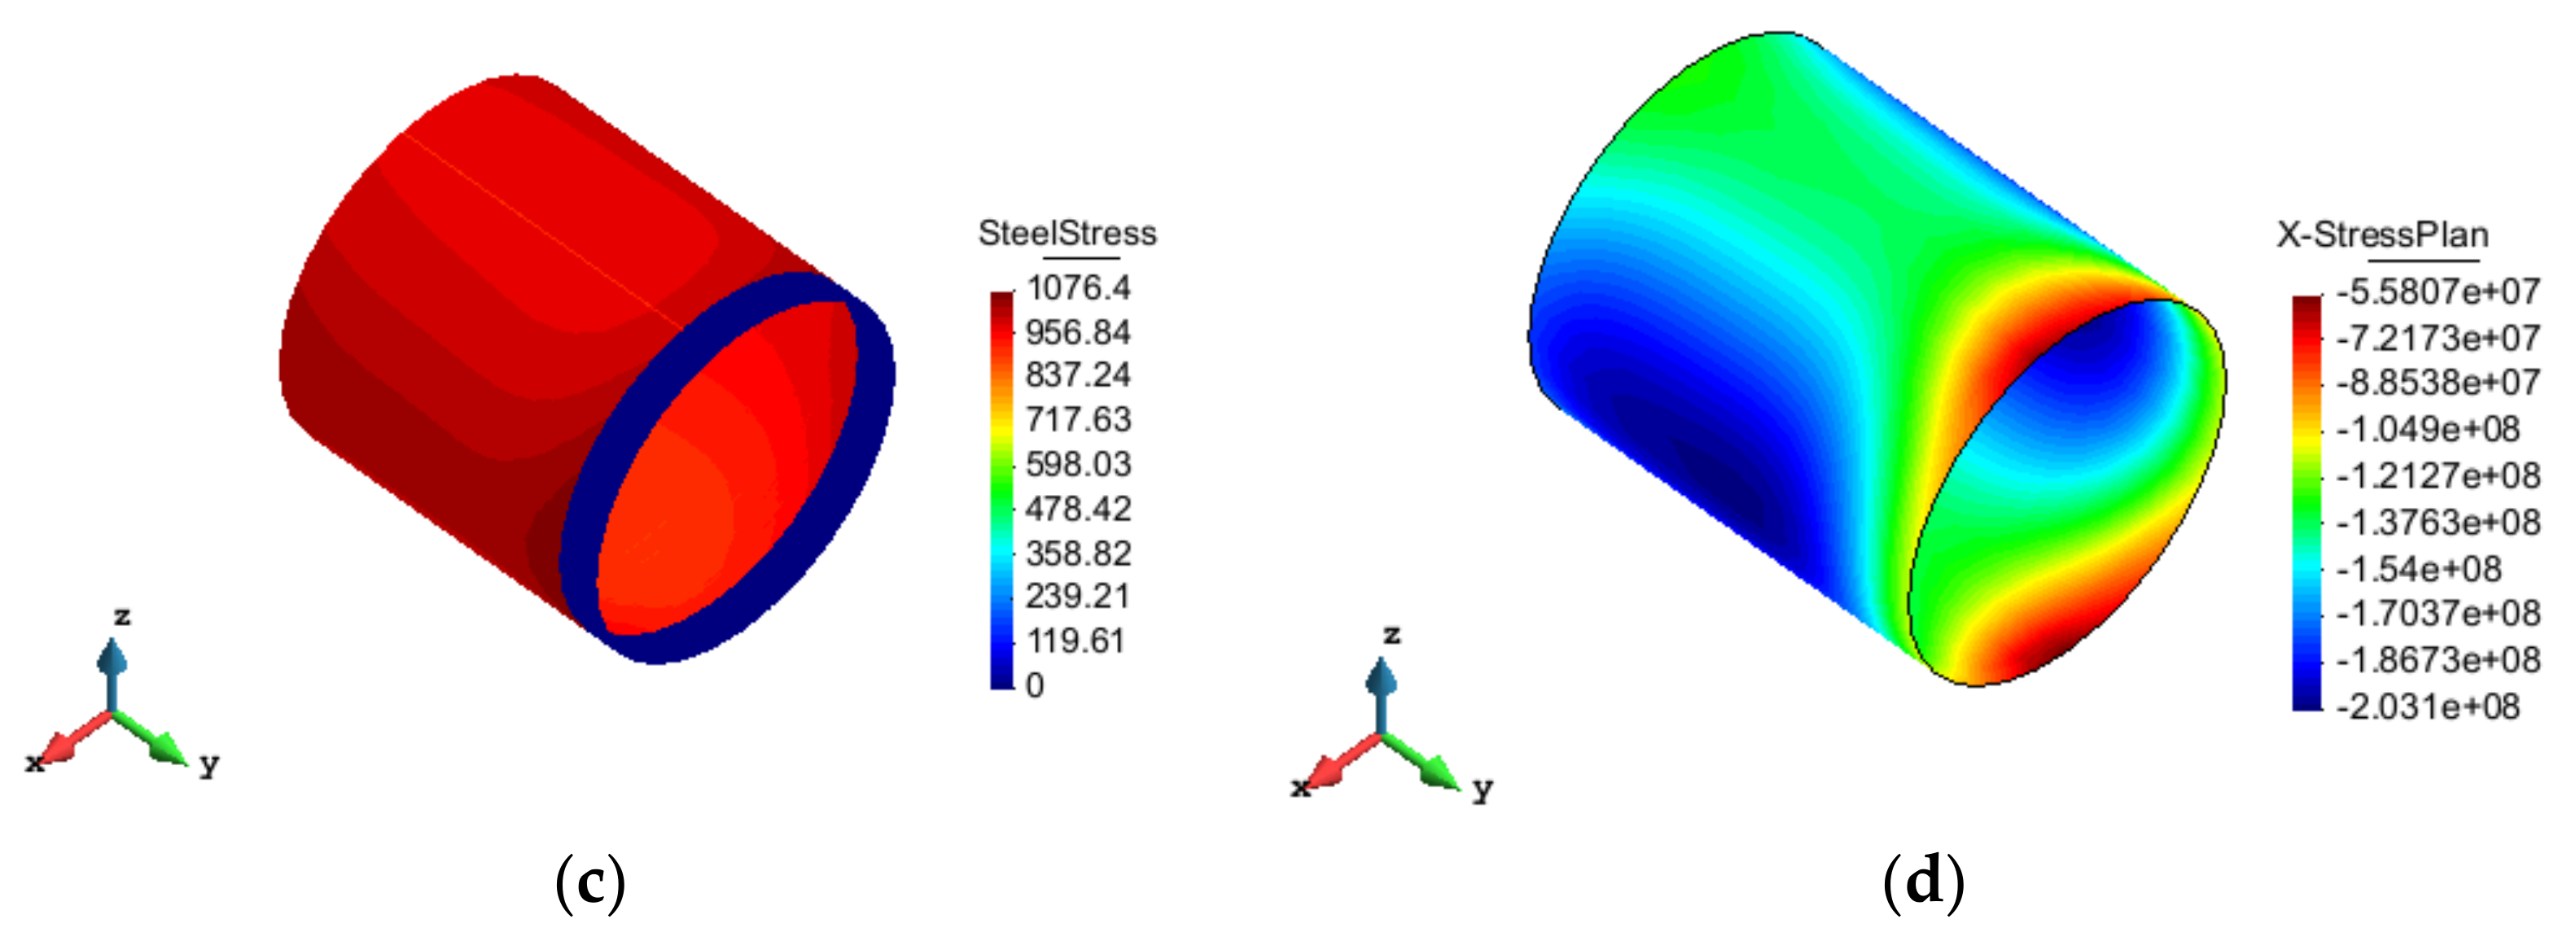
Figure 12. The maximum damage value of the mortar is 0.57. At the springline in the broken area, the damage to the outer concrete emerges, exhibiting the maximum value of 0.36. Damage occurs at the invert and crown inside the pipe in the pre-stressing loss zone. The maximum stress in the outer wires reaches 1076.4 MPa. In addition, the stress in the inner wires and the cylinder around the pre-stressing loss zone also increases.
5.1.5. Case 5: 10% Breakage Ratio and Breaking at Random Location
The obtained nephogram is illustrated in
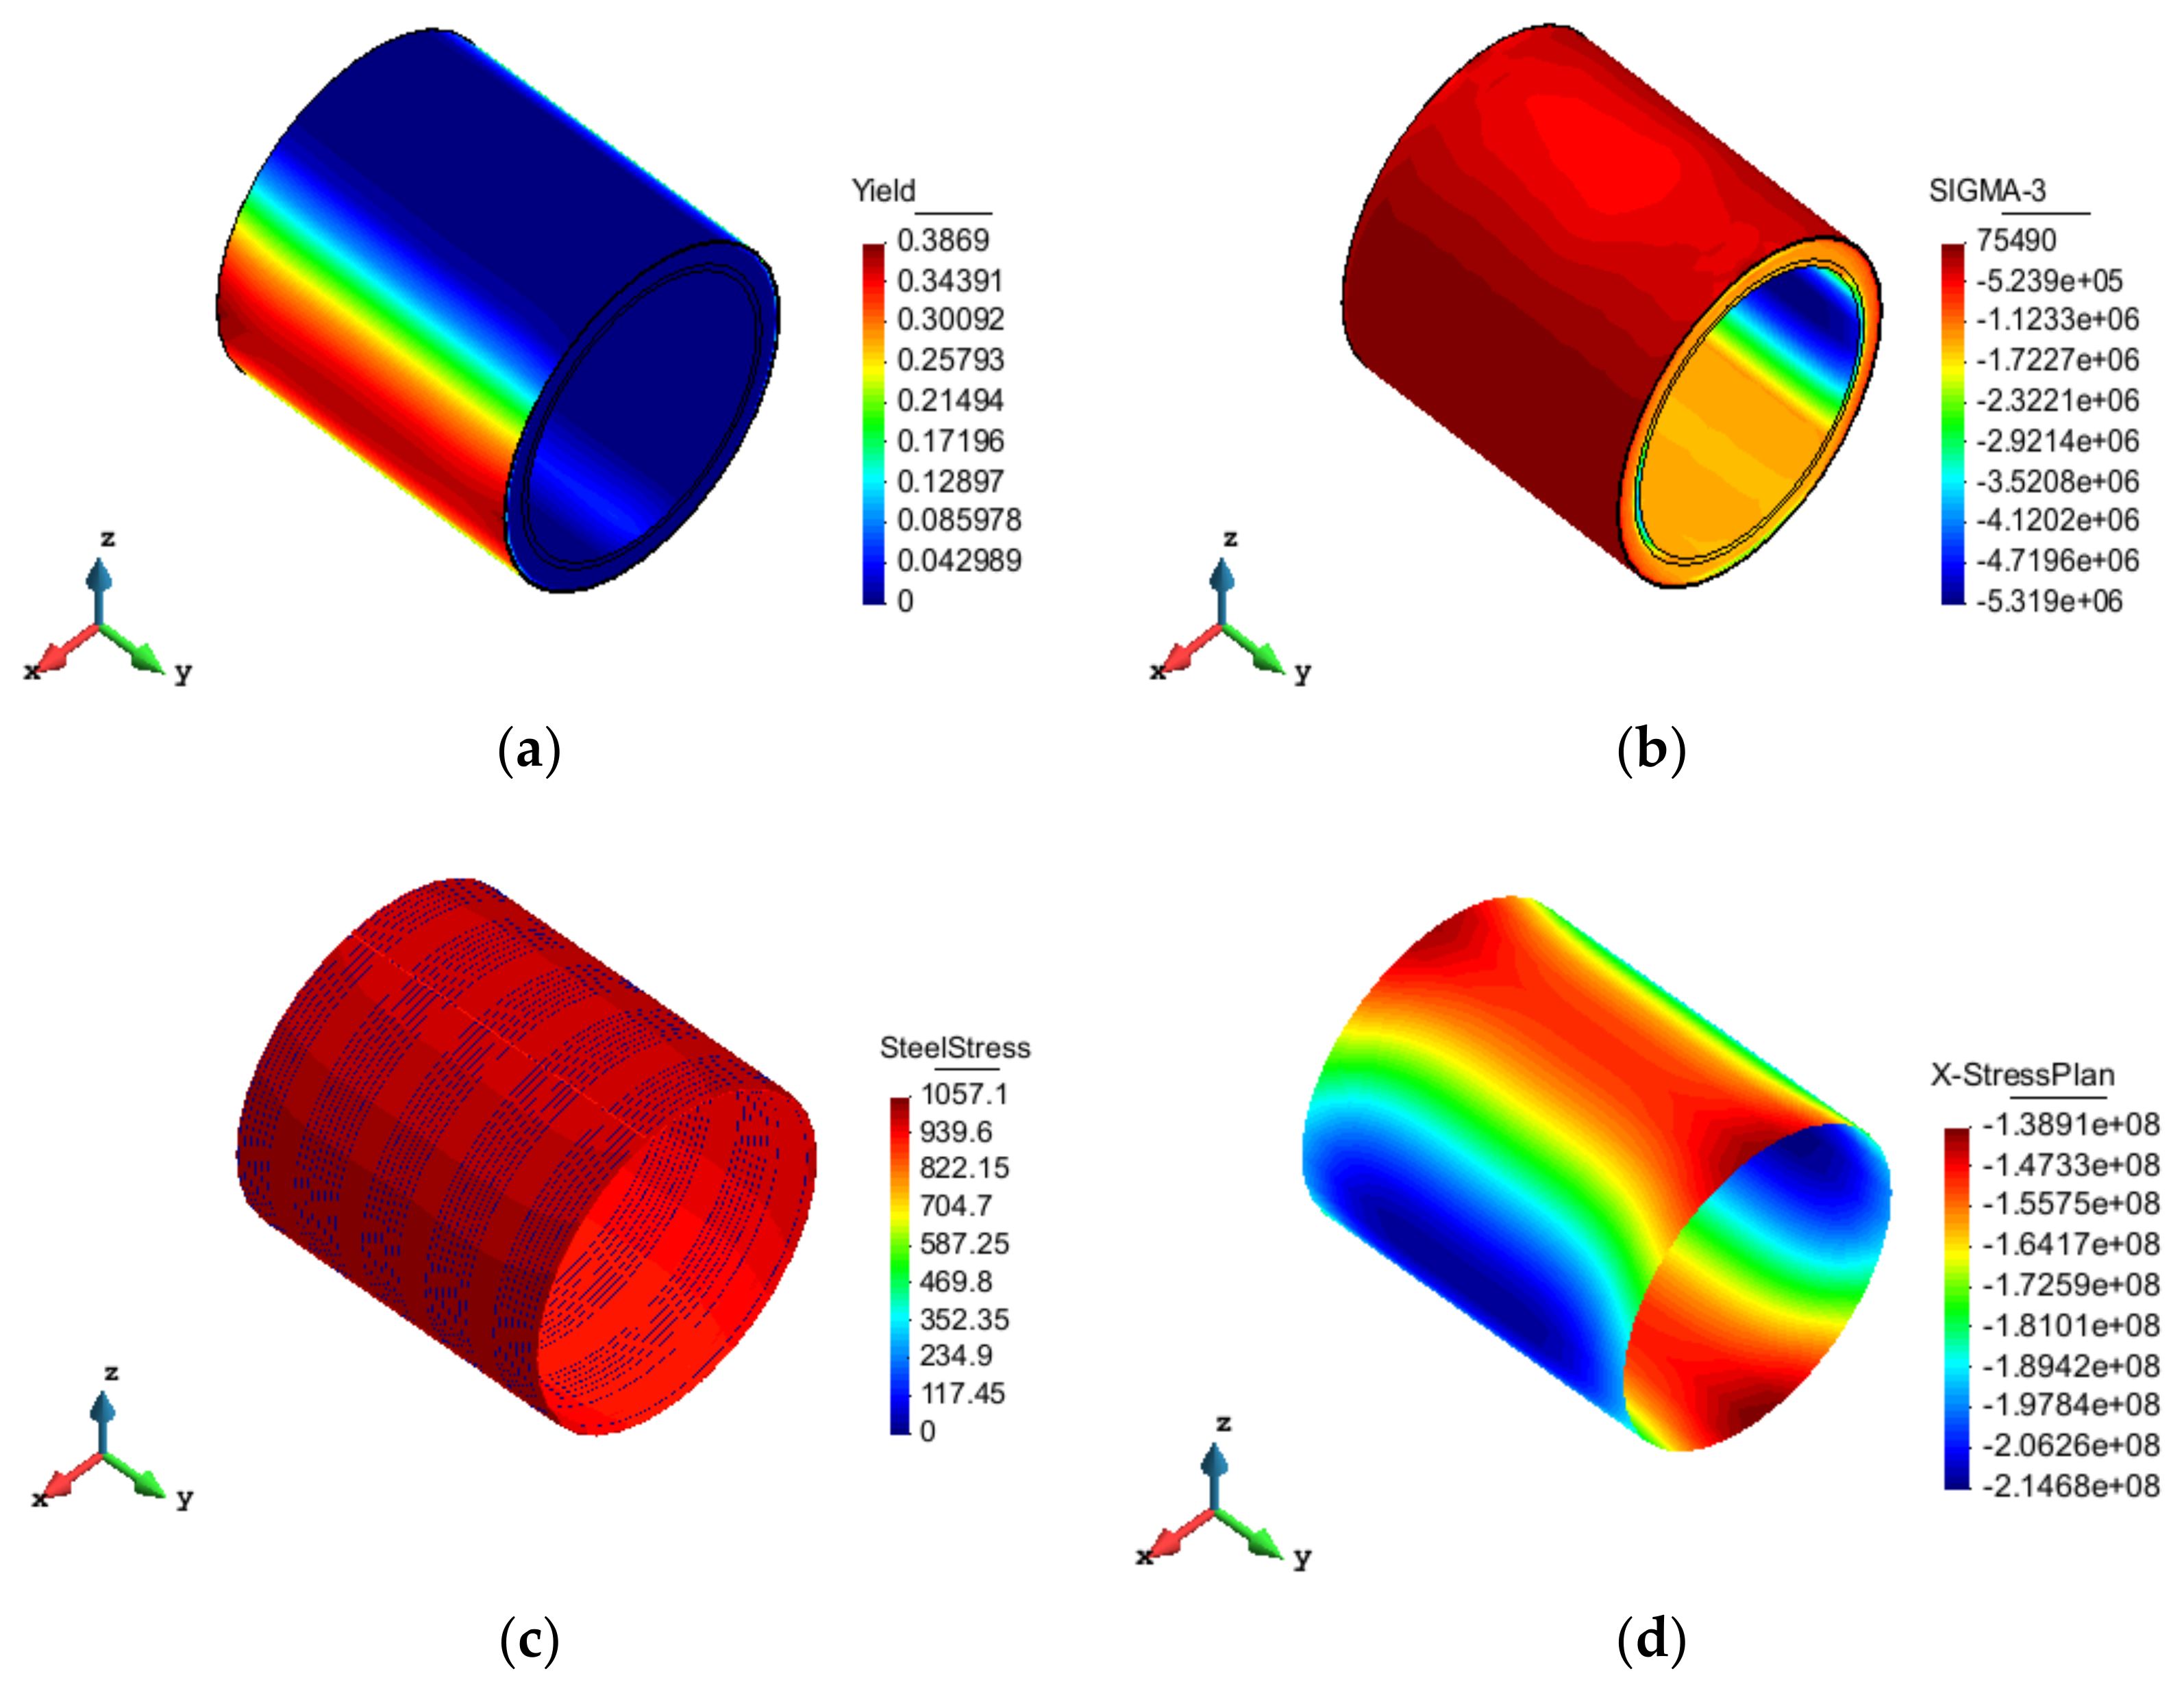
Figure 13. The mortar presents a maximum damage value of 0.39 with a small increment compared with the pre-breaking stage. The damage to the outer concrete emerges at the springline and penetrates along the whole circumferential direction, with the maximum value of 0.22. A small amount of damage to the inner concrete occurs at the invert and crown. The damage distribution in concrete and mortar is uniform along the axial direction. The maximum stress in the outer wires reaches 1057.1 MPa with the increment of 17.4 MPa. In addition, the stress in the cylinder also rises. Because the breakage ratio is small with a relatively scattered broken area, when the random broken situation occurs once, the stress in the wires next to the broken area increases, and the cylinder stress changes a little.
5.2. Finite Element Results of Pipe No.2 after Breaking Wires
5.2.1. Case 6: 10% Breakage Ratio and Breaking in the Middle of Pipe
It can be seen from
Figure 14 that the maximum damage value of mortar is 0.39, with an increment of 0.22 compared with the pre-breaking stage. At the springline in the broken area, the damage to the outer concrete emerges and penetrates along the whole circumferential direction, exhibiting the maximum value of 0.20. Damage occurs at the invert and crown inside the pipe around the pre-stressing loss zone with the value of 0.10. The maximum stress in the outer-layer wires grows to 1031.1 MPa. Meanwhile, the stress in the inner wires and the stress in the cylinder around the pre-stressing loss zone are also enhanced. The damage to the outer concrete will not only expand but also penetrate along the whole circumferential direction, and the inner concrete is also damaged.
5.2.2. Case 7: 10% Breakage Ratio and Breaking at the Joint of Pipe
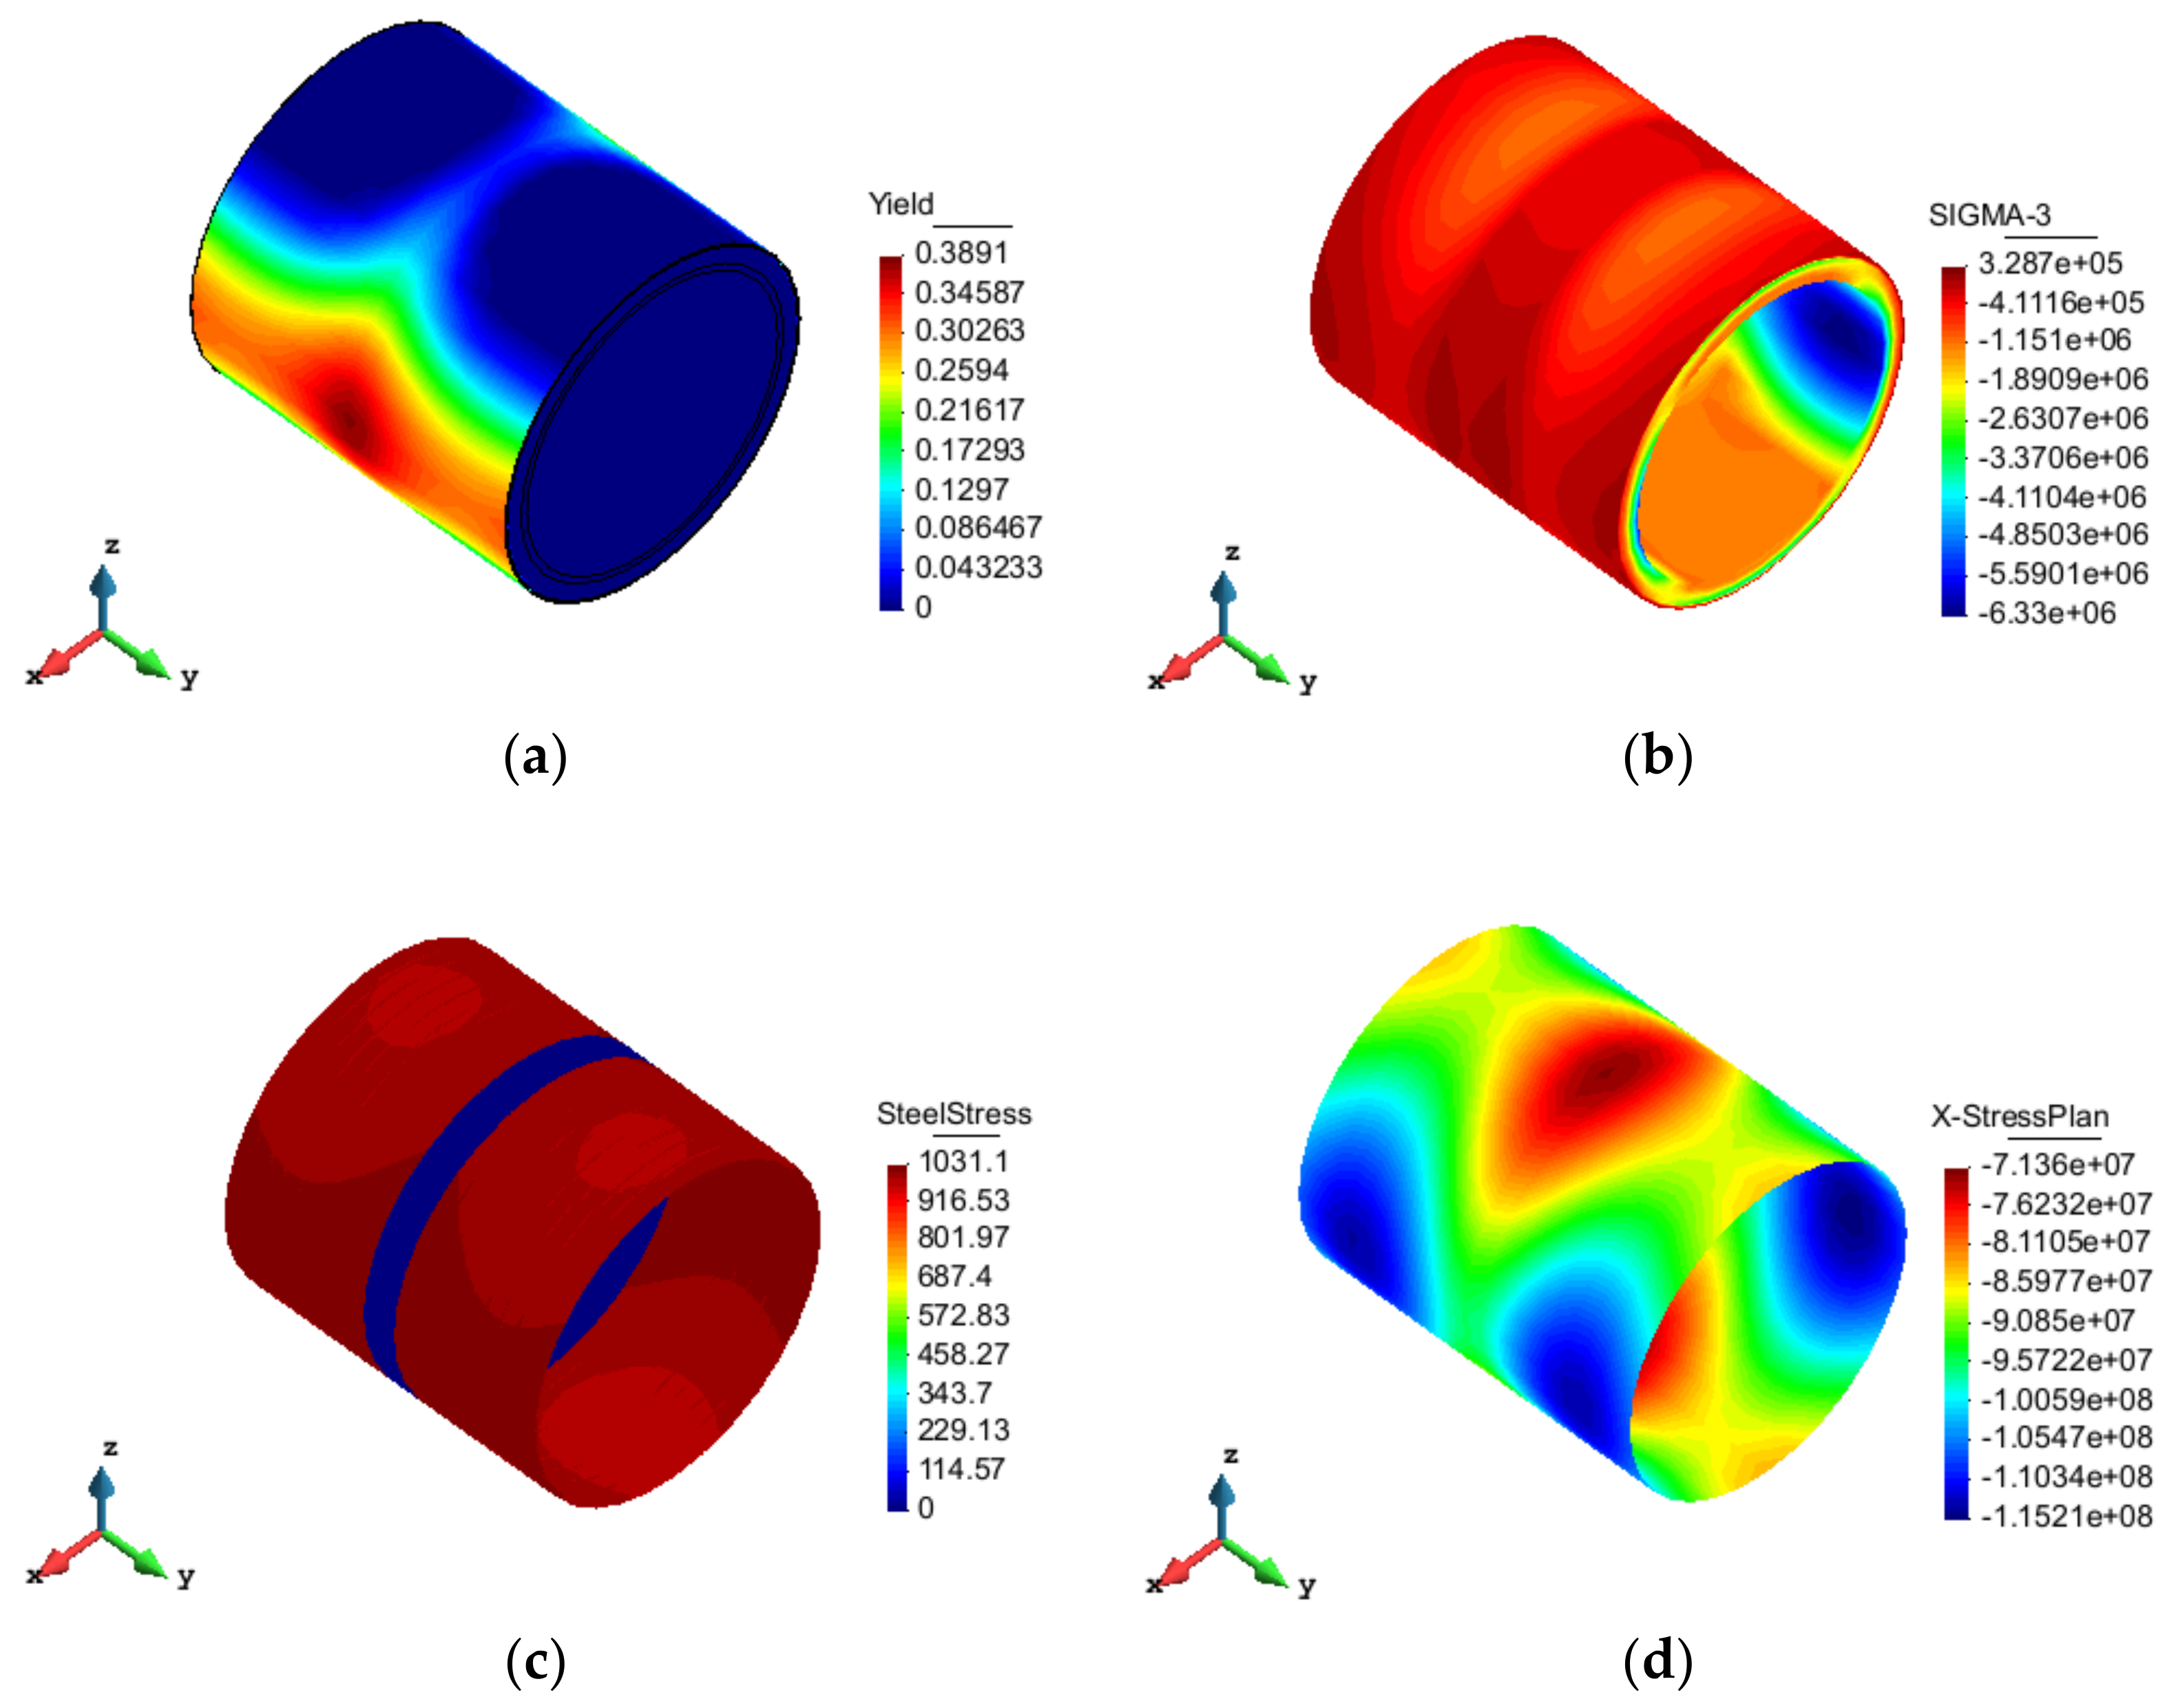
The resulting nephogram is displayed as
Figure 15. The maximum damage value of mortar is 0.42, with an increase in value of 0.25 compared with the pre-breaking stage. The damage to the outer concrete emerges at the springline in the broken area and penetrates along the whole circumferential direction, presenting the maximum value of 0.28. Damage can be observed in the invert and crown inside the pipe around the pre-stressing loss zone with the value of 0.12. The maximum stress in the outer-layer wires increases to 1037.4 MPa, along with the increased stress in the inner wires, the third principal stress in the inner concrete and the stress in the cylinder around the pre-stressing loss zone. The damage to the outer concrete will not only expand but also penetrate along the whole circumferential direction, and the inner concrete is also damaged.
5.2.3. Case 8: 10% Breakage Ratio and Breaking at Random Location
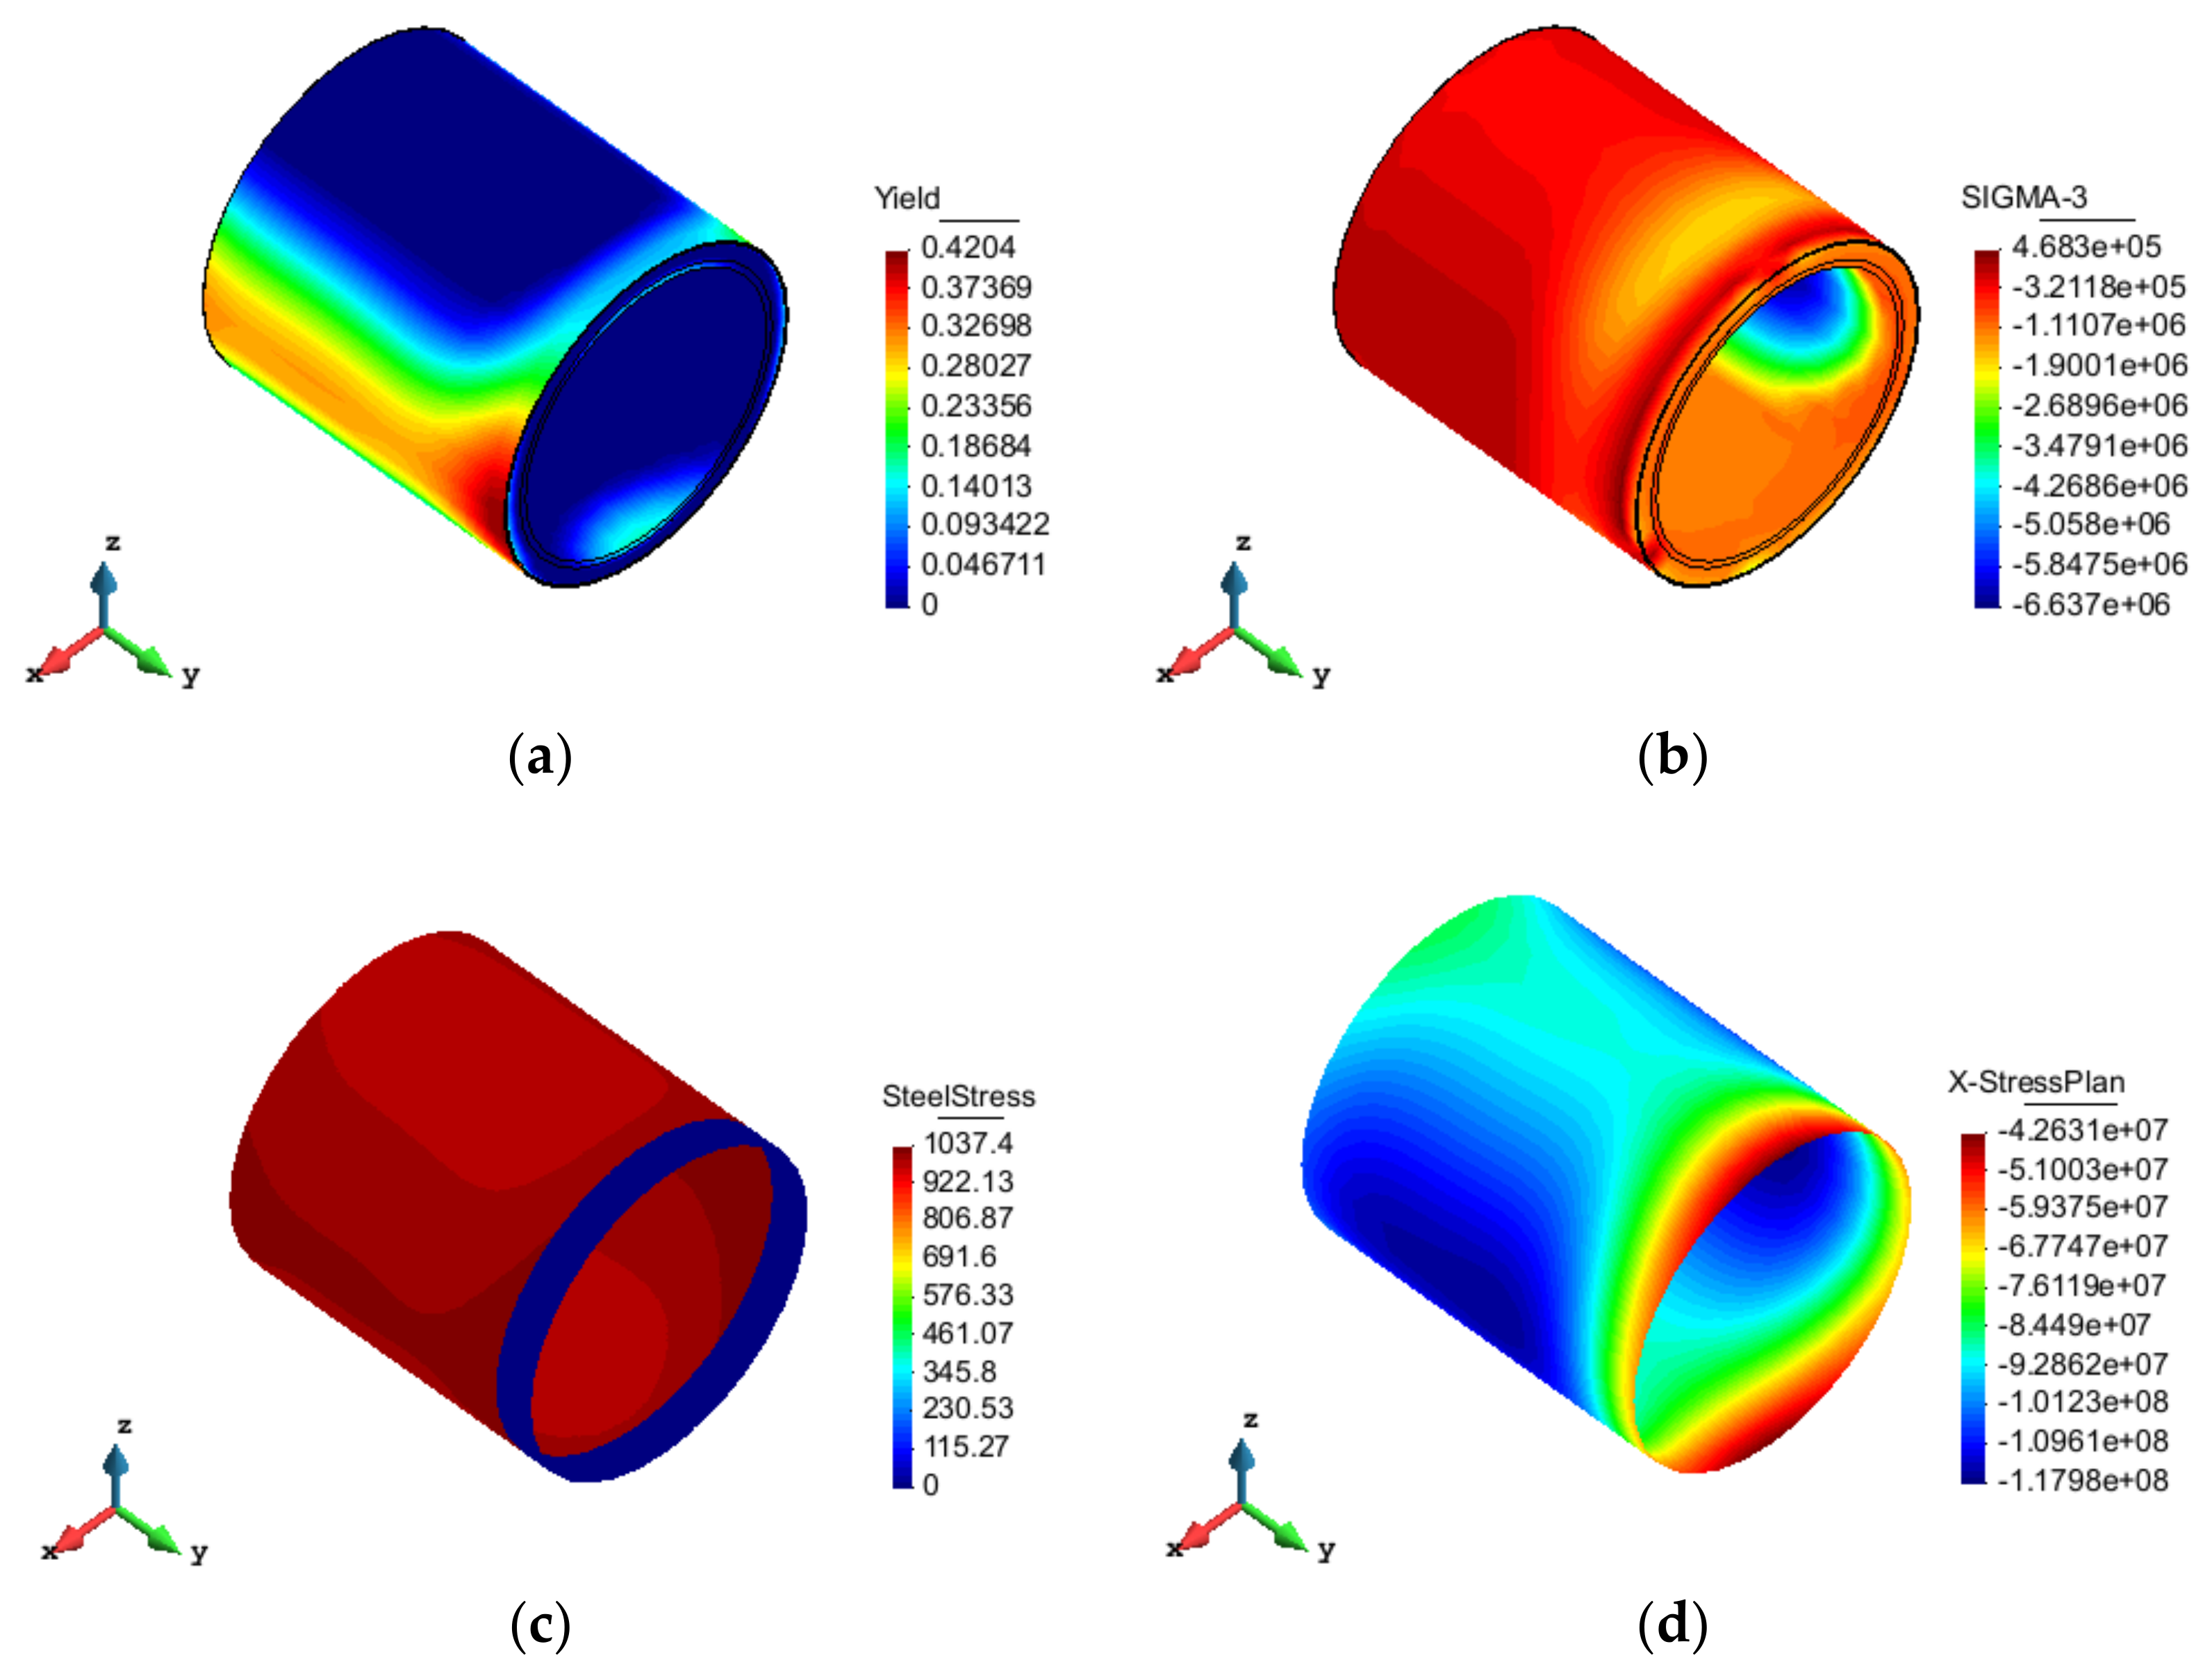
The obtained nephogram is shown in
Figure 16.
As illustrated in
Figure 16, the maximum damage value of mortar is 0.34, with an increment of 0.14 compared with the pre-breaking stage. At the springline, the damage to the outer concrete emerges and does not penetrate along the whole circumferential direction, exhibiting the maximum value of 0.16. A small amount of damage occurs at the invert and crown inside the pipe. The damage distribution in concrete and mortar is uniform along the axial direction. The maximum stress in the outer-layer wires approaches 1025.8 MPa with the increment of 11.0 MPa. At the same time, the third principal stress in the inner concrete and the stress in the cylinder increase. The damage to the outer concrete only expands, and the inner concrete is not damaged.
5.3. Summary of FEA Results
The FEA results of two pipes with 10% broken wire ratios are presented above. The other results are listed in the tables, with the results of pipe No.1 listed in
Table 7, and those of pipe No.2 listed in
Table 8. From the table, it can be seen that when the same number of wires are removed from the joint and middle of the pipe with the same breakage ratio, the area without pre-stressing wires at the joint is larger, so breaking at joint is more dangerous than that in the middle of the pipe [
21]. For the double-layer broken pipe with a 10% breakage ratio, the outer concrete is circumferentially penetrated along the broken area in both assumptions of the outer layer or both layers at the joint, and the inner concrete also shows damage at the crown and invert, which does not occur in the middle breakage. As the ratio of wire breakage increases, the damage value and area of the outer concrete expands, penetration also occurs in the central wire breakage and damage occurs in the inner concrete. For the single-layer broken pipe with three wire break ratios, whether the wire is broken at the joint or in the middle, the outer concrete shows damage and circumferential penetration along the broken area, and the inner concrete also shows damage. Additionally, as the wire break rate increases, the concrete damage value and damage area further expand but still do not exceed their respective strength limits. Regardless of the single-layer or double-layer broken pipe, when breaks occur consistently in the middle or joint location, the wire stress and cylinder stress near the broken area further increase after the wire break, and the unevenness of the cylinder stress also worsens with the increase in the wire break rate, which may lead to the radial detachment of the cylinder and concrete, further leading to the deterioration of the overall service performance of the pipe.
Under the three random wire breakage rates, for the double-layer pipe, the damage value of the outer concrete expands but does not penetrate, and the inner concrete does not show damage, but its tensile stress increases. The stress in the wire and cylinder do not increase much, and the overall stress uniformity of the cylinder is excellent. For the single-layer pipe, the outer layer of concrete damage does not penetrate along the circumferential direction, and the inner concrete does not develop damage in the 10% and 20% of the broken wire ratio scenario, but it occurs in the 30% ratio scenario.
The results of continuous and random breakage calculations are compared under three breakage ratios. For one pipe, the material damage values and area distribution, wire stress and cylinder stress under the random breakage assumption are smaller than the statistical values of the corresponding parameters under continuous breakage with the same breakage ratio. In addition, under the low breakage ratio, the outer concrete damage under continuous breakage basically penetrates along the circumferential direction, and the concrete and cylinder stress are more uniformly distributed. Since the distribution of random breakage locations is more discrete, the consequences caused by wire breakage are lesser than those under the assumption of continuous breakage. The bearing resistance of the double-layer pipe in the random and outer breakage assumptions is better than that of the single-layer pipe, while in the case of both double-layer breakage it is worse than that of the single-layer pipe. Although the double-layer pipe suffers more inner design water pressure, its integrity is stronger, because the double-layer wire is similar to the double insurance action.
6. Conclusions
A nonlinear FEA was developed to investigate the mechanical behavior of two typical ECPs with broken wires. We considered the actual production, installation and operation stages by dividing the analysis process into six or eight steps. The results were obtained under the hypothesis of broken wires with three ratios and different distributions when suffering under working water pressure and other loads. The main conclusions are summarized as below:
(1) We summarized the advantages and shortcomings of various pre-stressing simulation methods and then proposed an initial stress method based on a novel single-spring joint element method for FEA. The structural response results before wire breakage based on the specification method and the FEA model are basically consistent.
(2) The damage to the outer concrete increases and penetrates along the entire circumferential direction as the percentage of wire breakage grows at continuous wire breakage. Damage to the inner concrete begins to occur, and indicators such as wire stress, cylinder stress and distribution also deteriorate. The risk of breakage is higher in the joint than that in the middle location, and the breakage that occurs with continuous centralized distribution is more dangerous than breakage with random distribution. The double-layer pipe has better overall destruction resistance than that of the single-layer pipe under random breakage and outer continuous breakage conditions.
(3) A cylinder can be used as both an anti-seepage body to prevent seepage and safety reserve under wire breakage. If the tearing cylinder is regarded as the pipe burst indicator, the pipe will not immediately burst in the drafted broken ratios and assumptions. However, micro-cracks in concrete will lead to corrosive groundwater or chemical substances to further corrode intact wires and cylinder. At the same time, the unevenness of the cylinder will potentially lead to radial detachment with concrete. The combined effect will further result in the deterioration of the overall service performance.
Existing prototype tests of broken pipes are only performed for individual internal water load or three-edge bearing tests, and it is still very difficult to conduct test simulations of broken pipes in service states due to technical and economic reasons. At the same time, this paper does not further discuss more breakage ratio sensitivity analysis and ultimate internal water pressure calculation but focuses on research into the mechanical effects of the breakage location of two different pipe types. If we consider the mechanical behavior of a broken pipe after concrete cracking, it will be related to the fine structure of concrete and crack path development problems, which will be further investigated in follow-up research.


