
Influence of Contact Interface Friction on Plastic Deformation of Stretch-Bend Forming


Abstract
:1. Introduction
2. Theoretical Analysis of Plastic Deformation in Stretch-Bend Forming
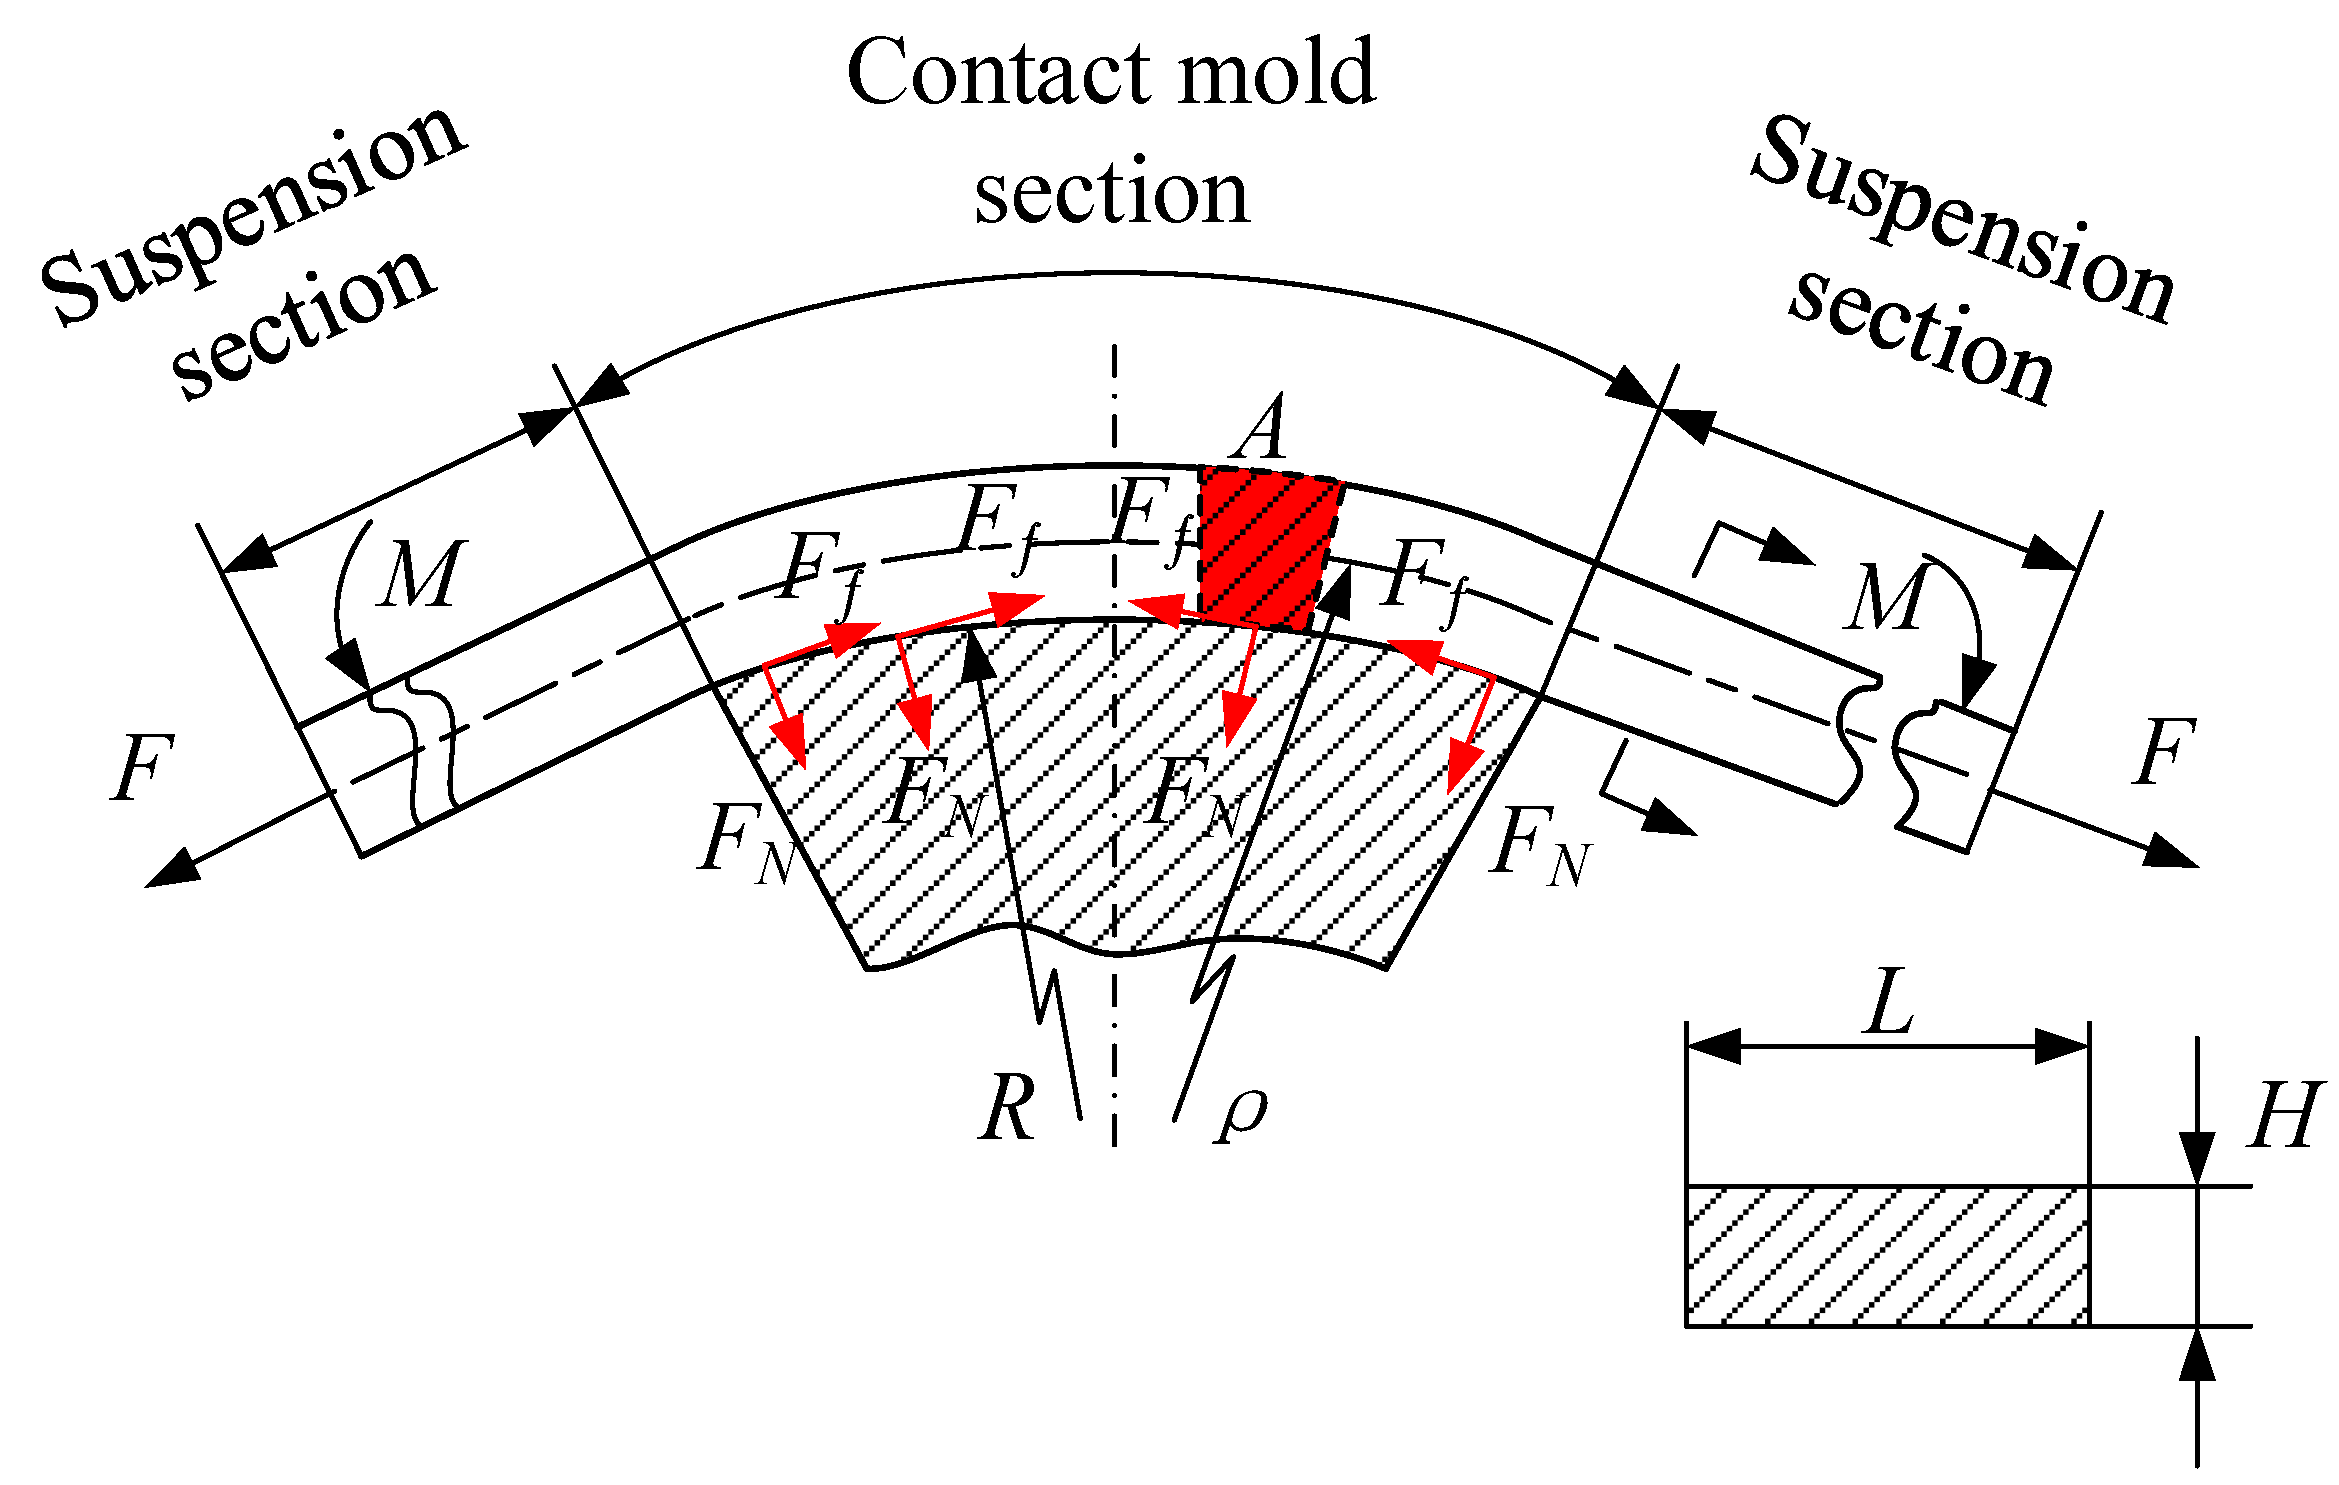
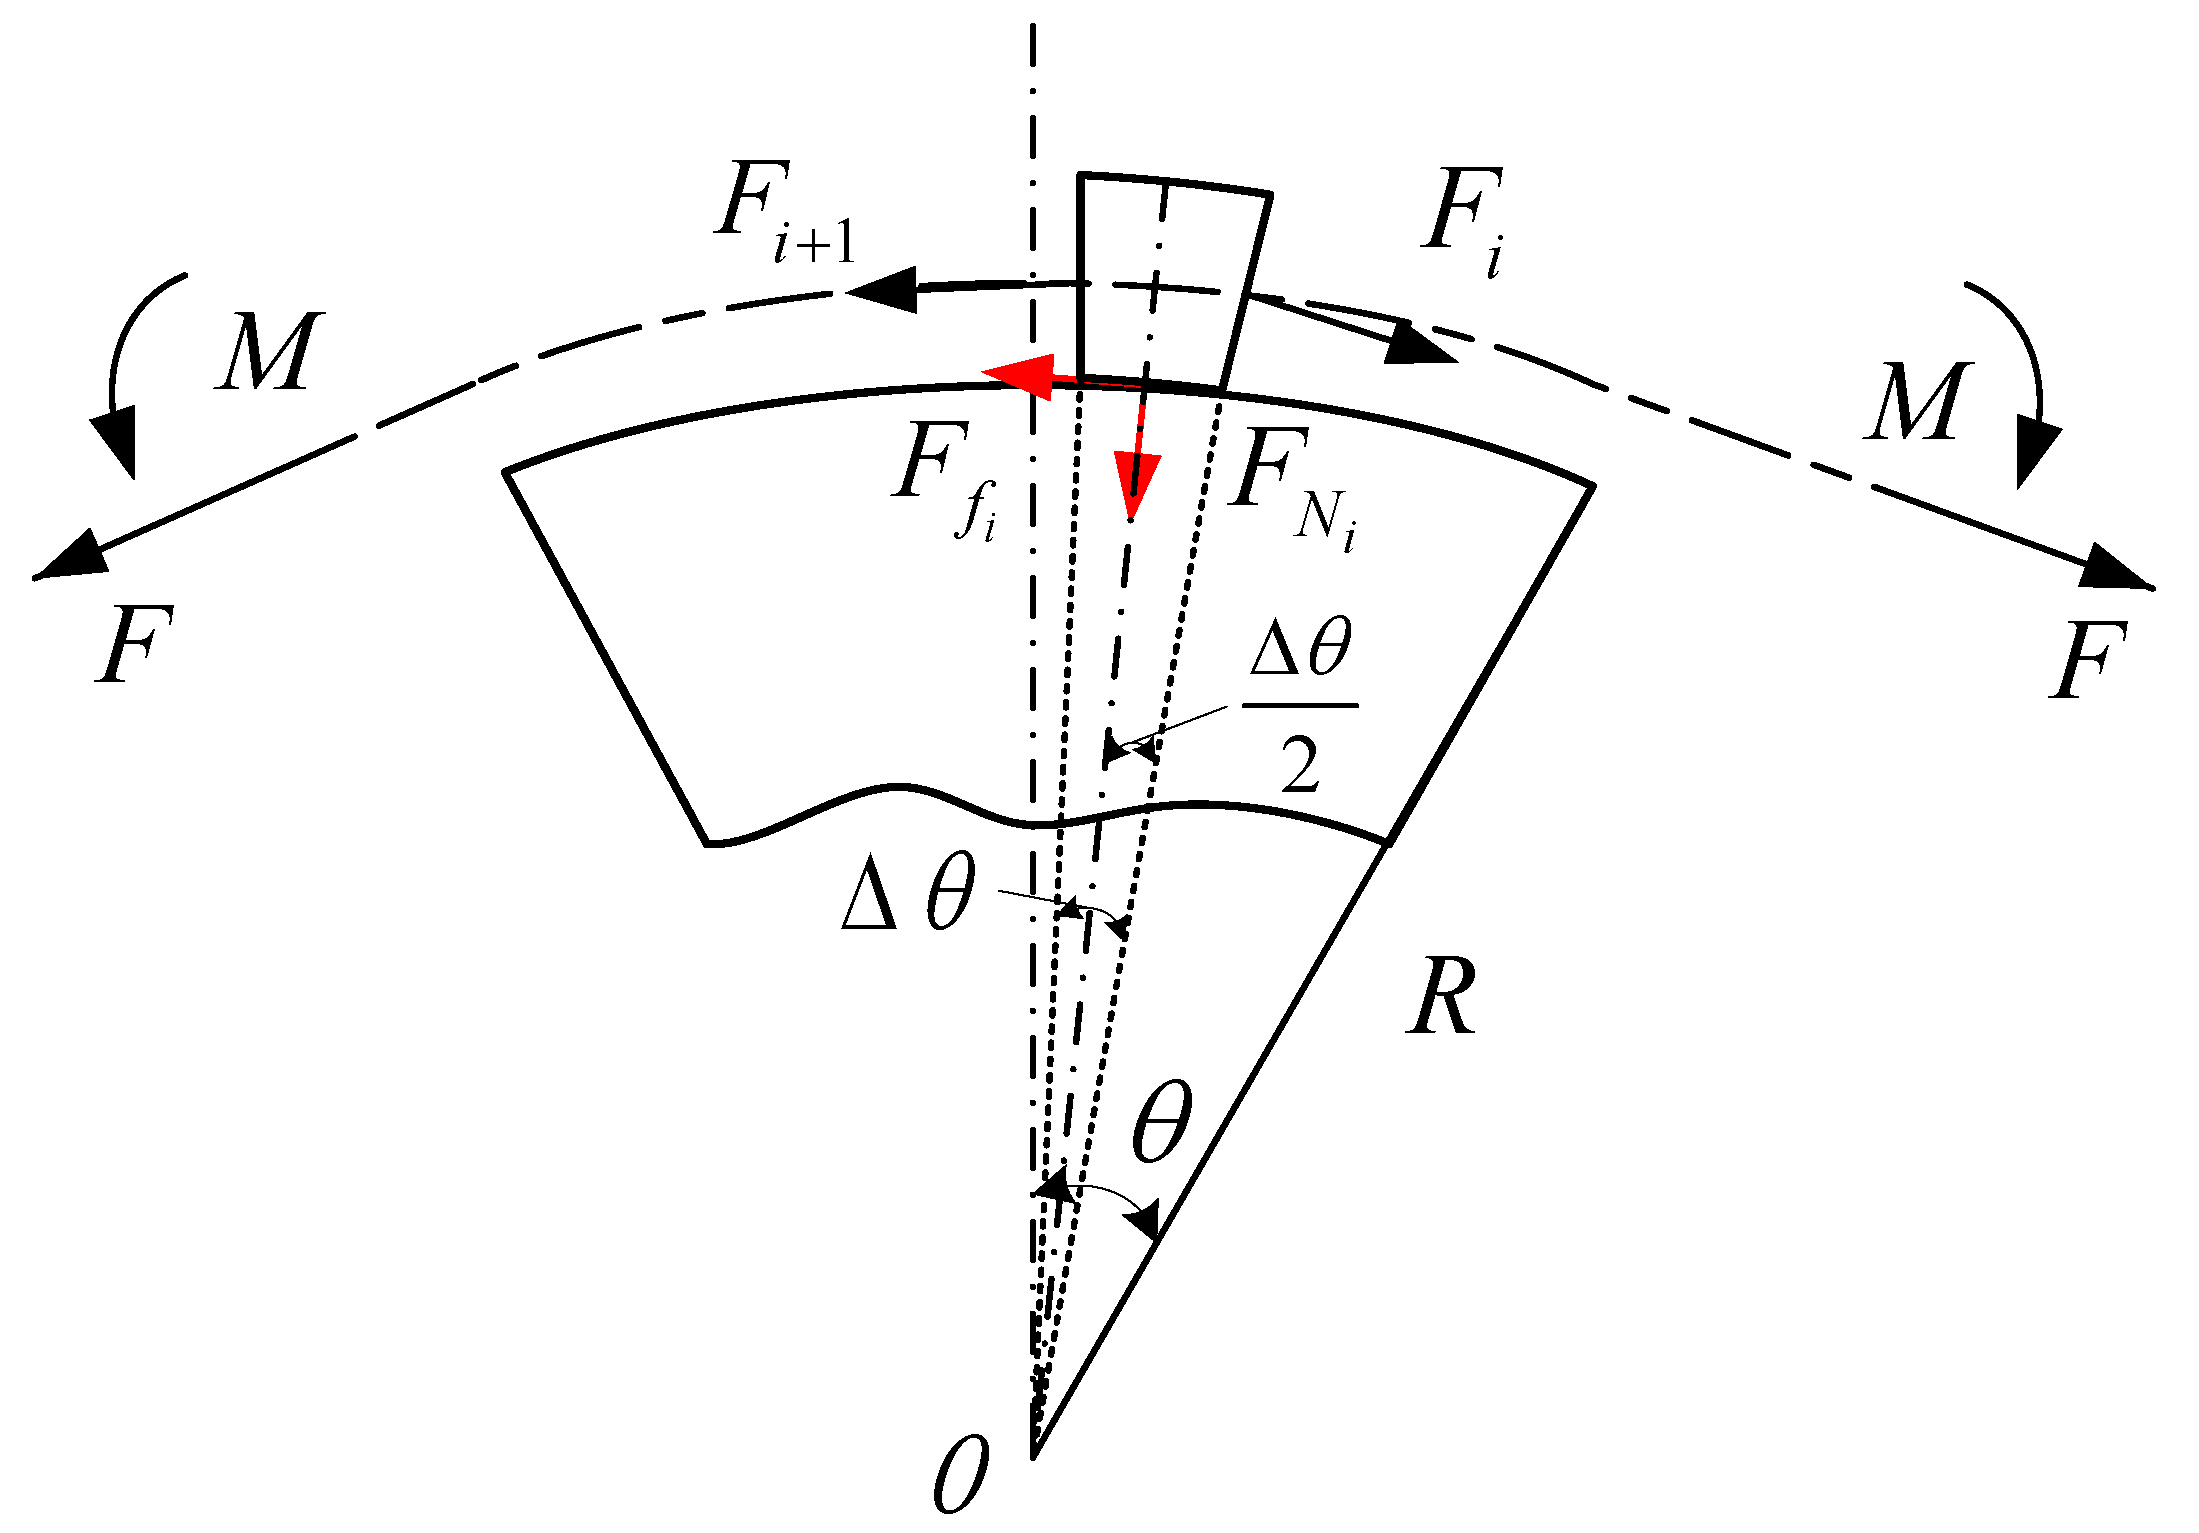
2.1. Force Analysis of Stretch-Bend Forming
- (1)
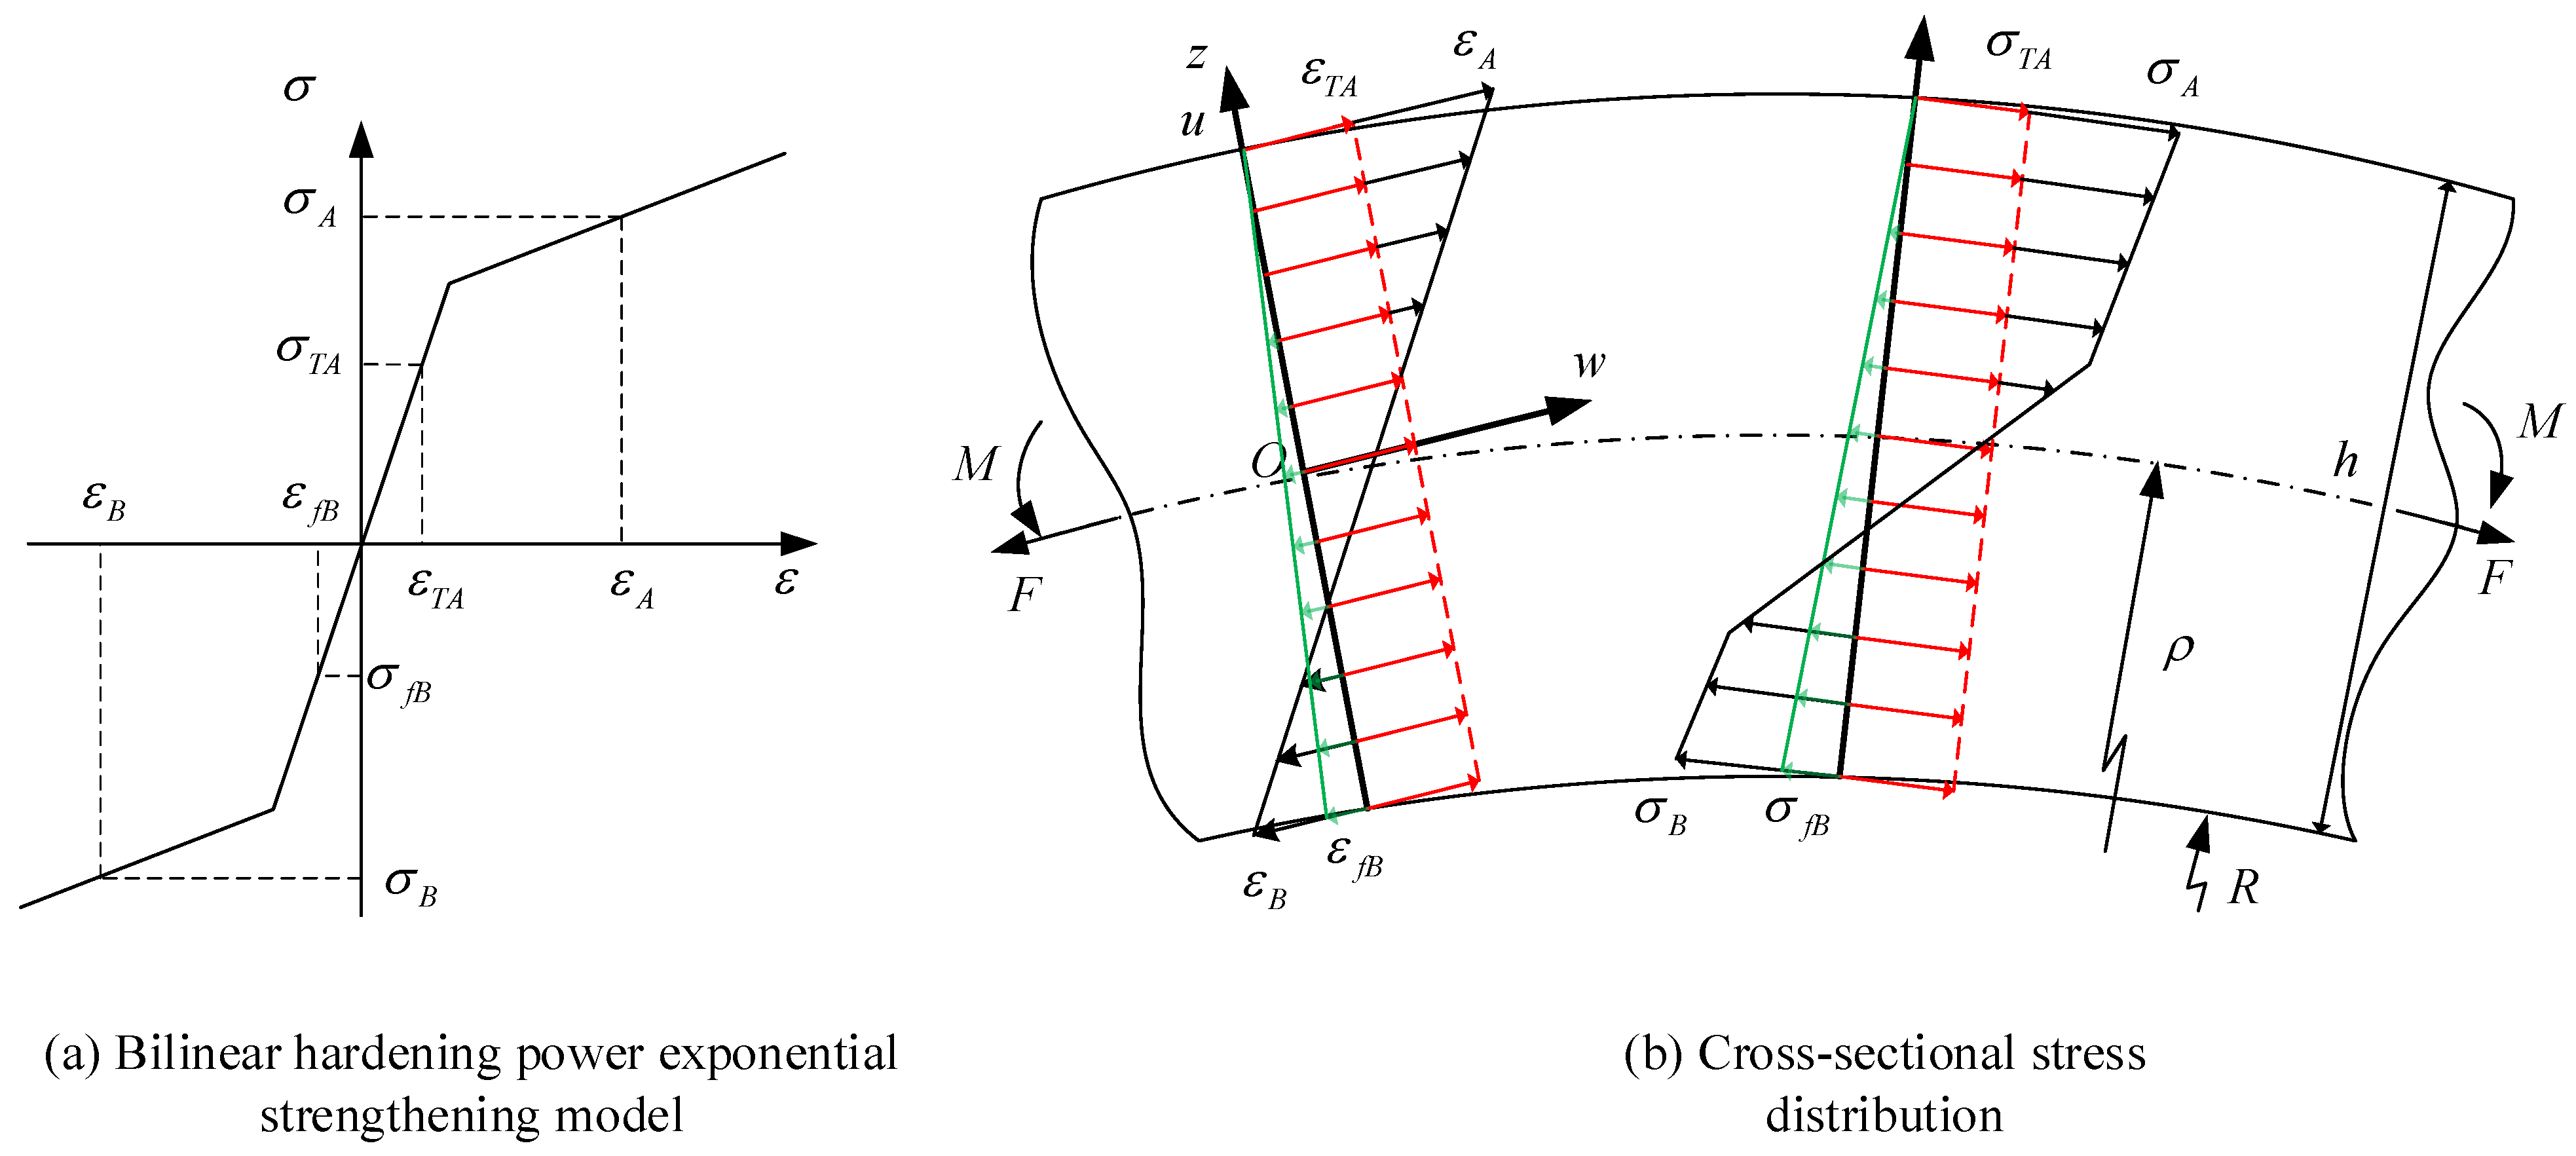
- Section assumption: It is assumed that the sections before and after stretch-bend are flat, the section before stretch-bend is perpendicular to the axis of the profile, and the section after stretch-bend is perpendicular to the tangent of the neutral axis;
- (2)
- Stress assumption: It is assumed that each element of the specimen is in a state of uniaxial tension or uniaxial compression during the stretch-bend forming process;
- (3)
- Material elastic-plasticity assumption: It is assumed that the material is a homogeneous, continuous, and isotropic elastic–plastic deformation body. The elastic–plastic deformation conforms to the loading and unloading deformation law of classical elastic–plastic theory.
2.2. Strain Distribution of Stretch-Bend Forming
3. Aluminum Alloy Profile Simulated Stretch-Bend Experiment
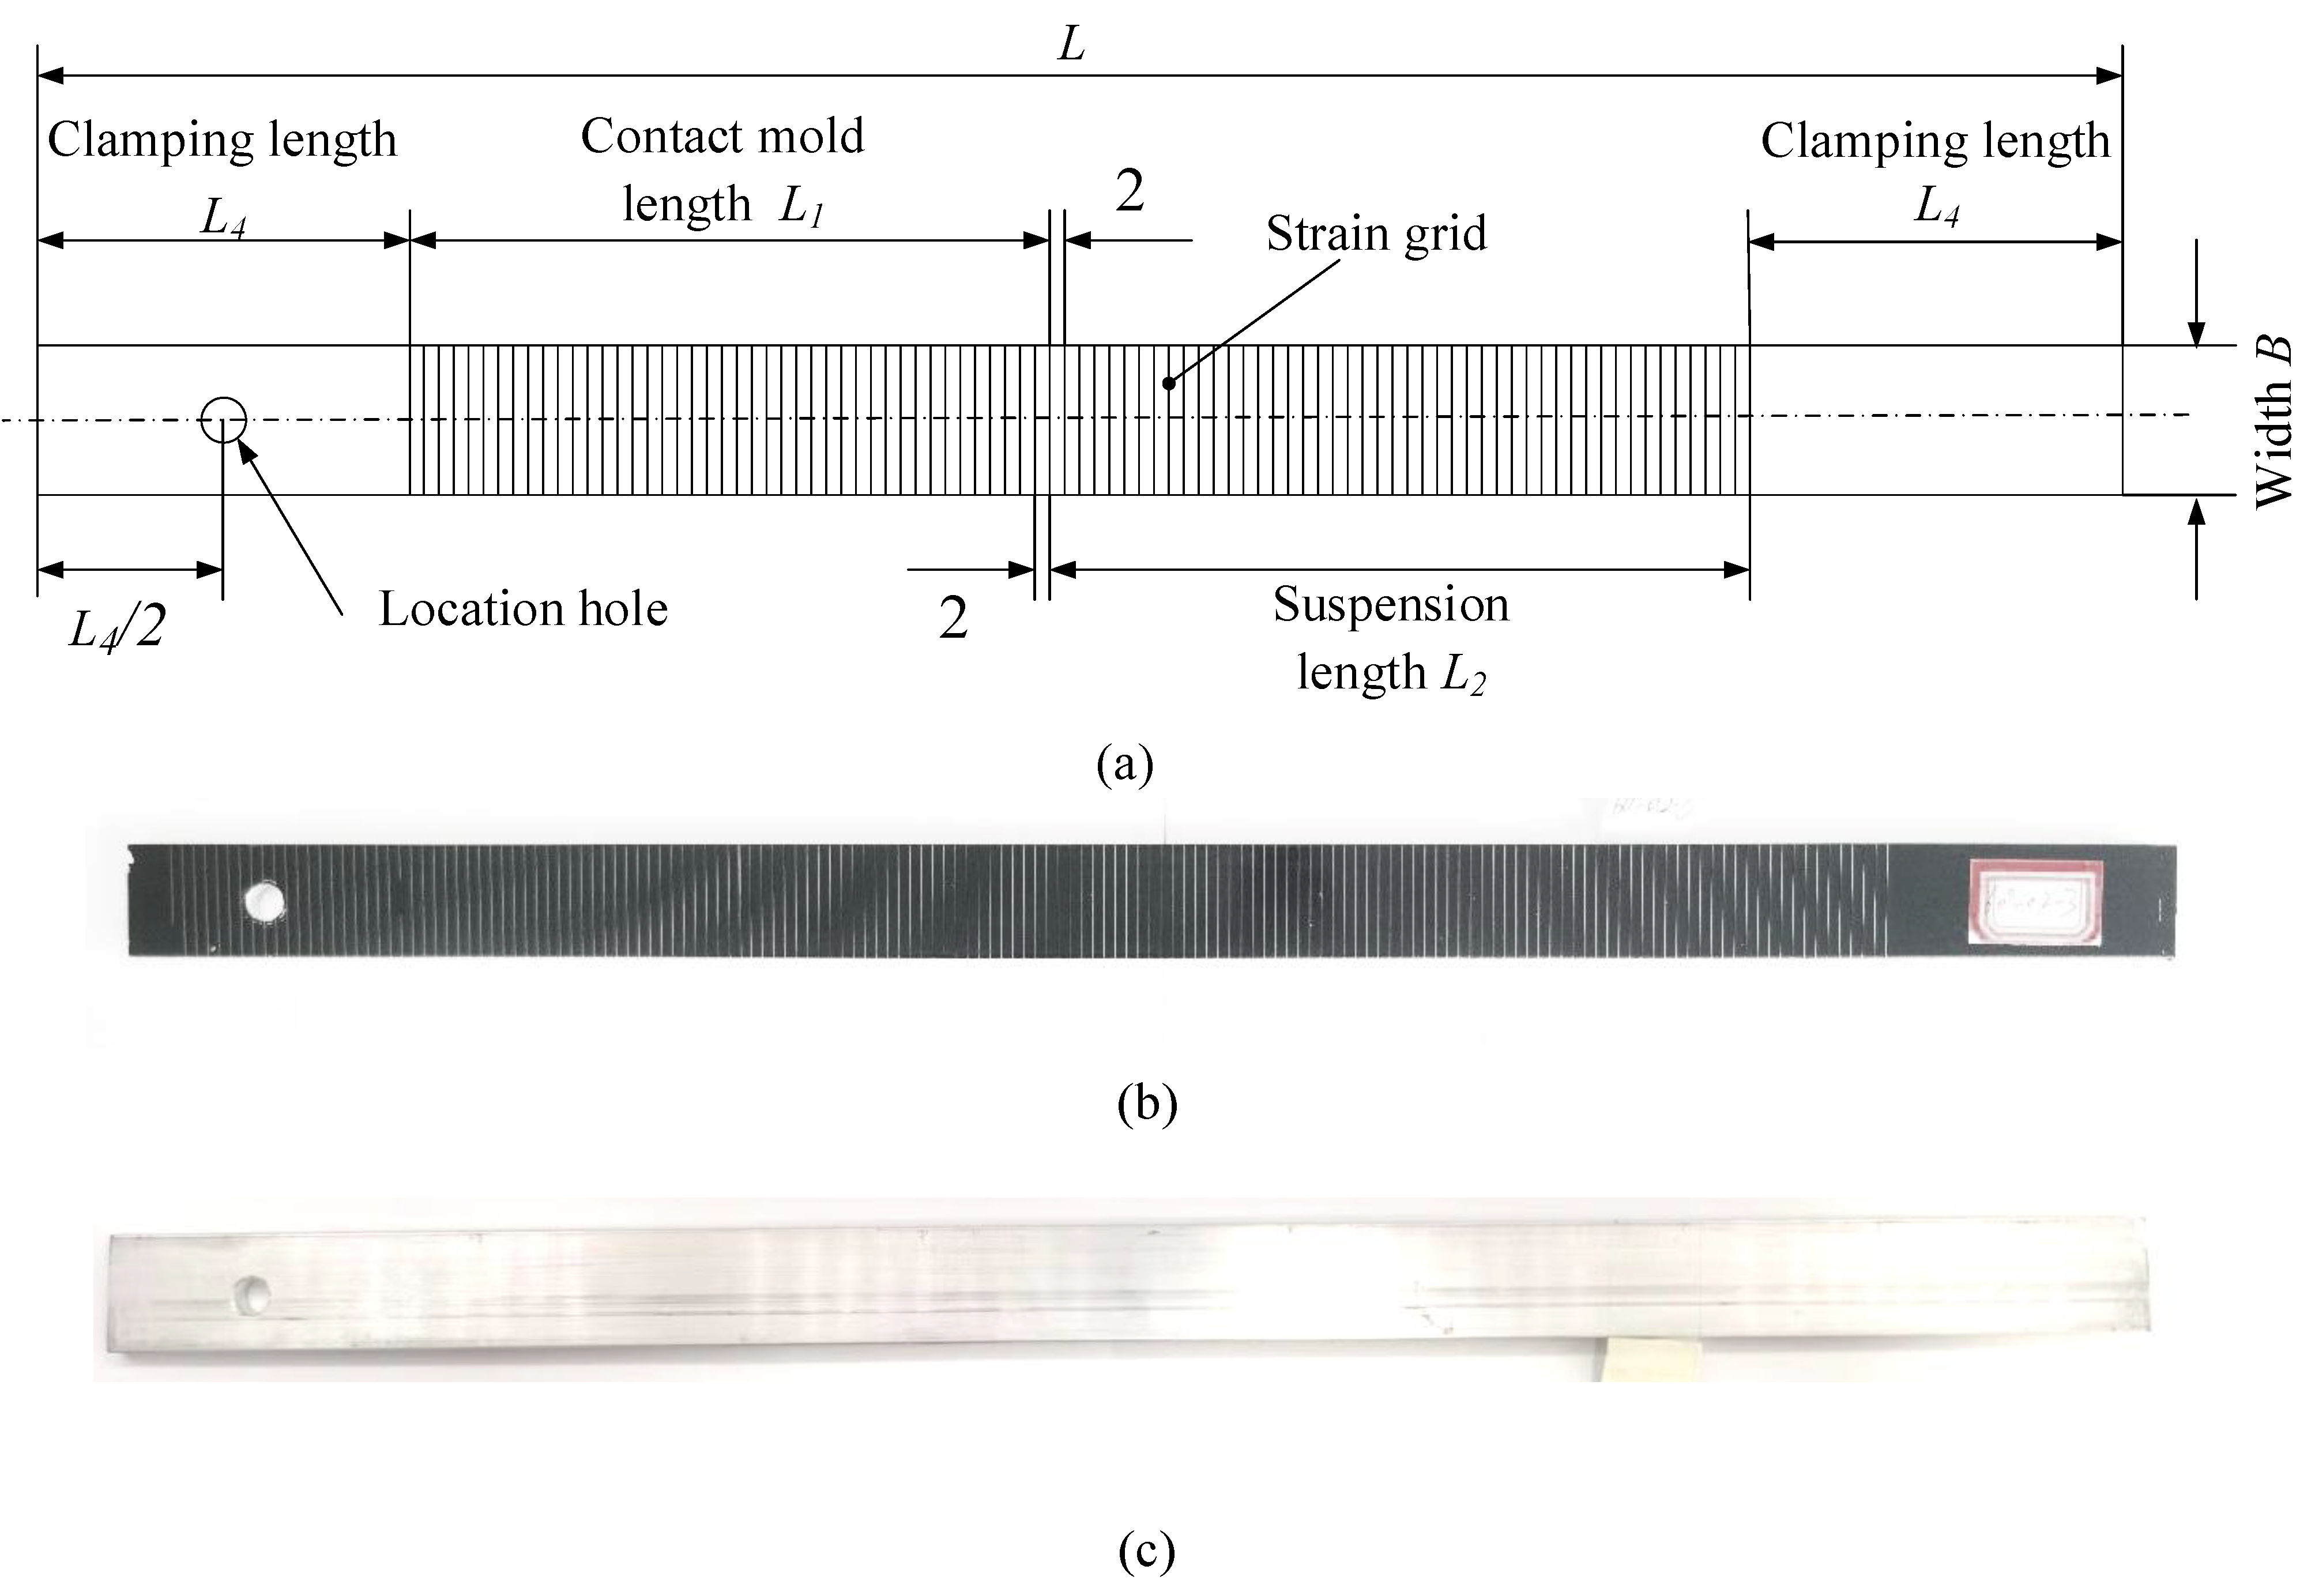
3.1. Experiment Specimen
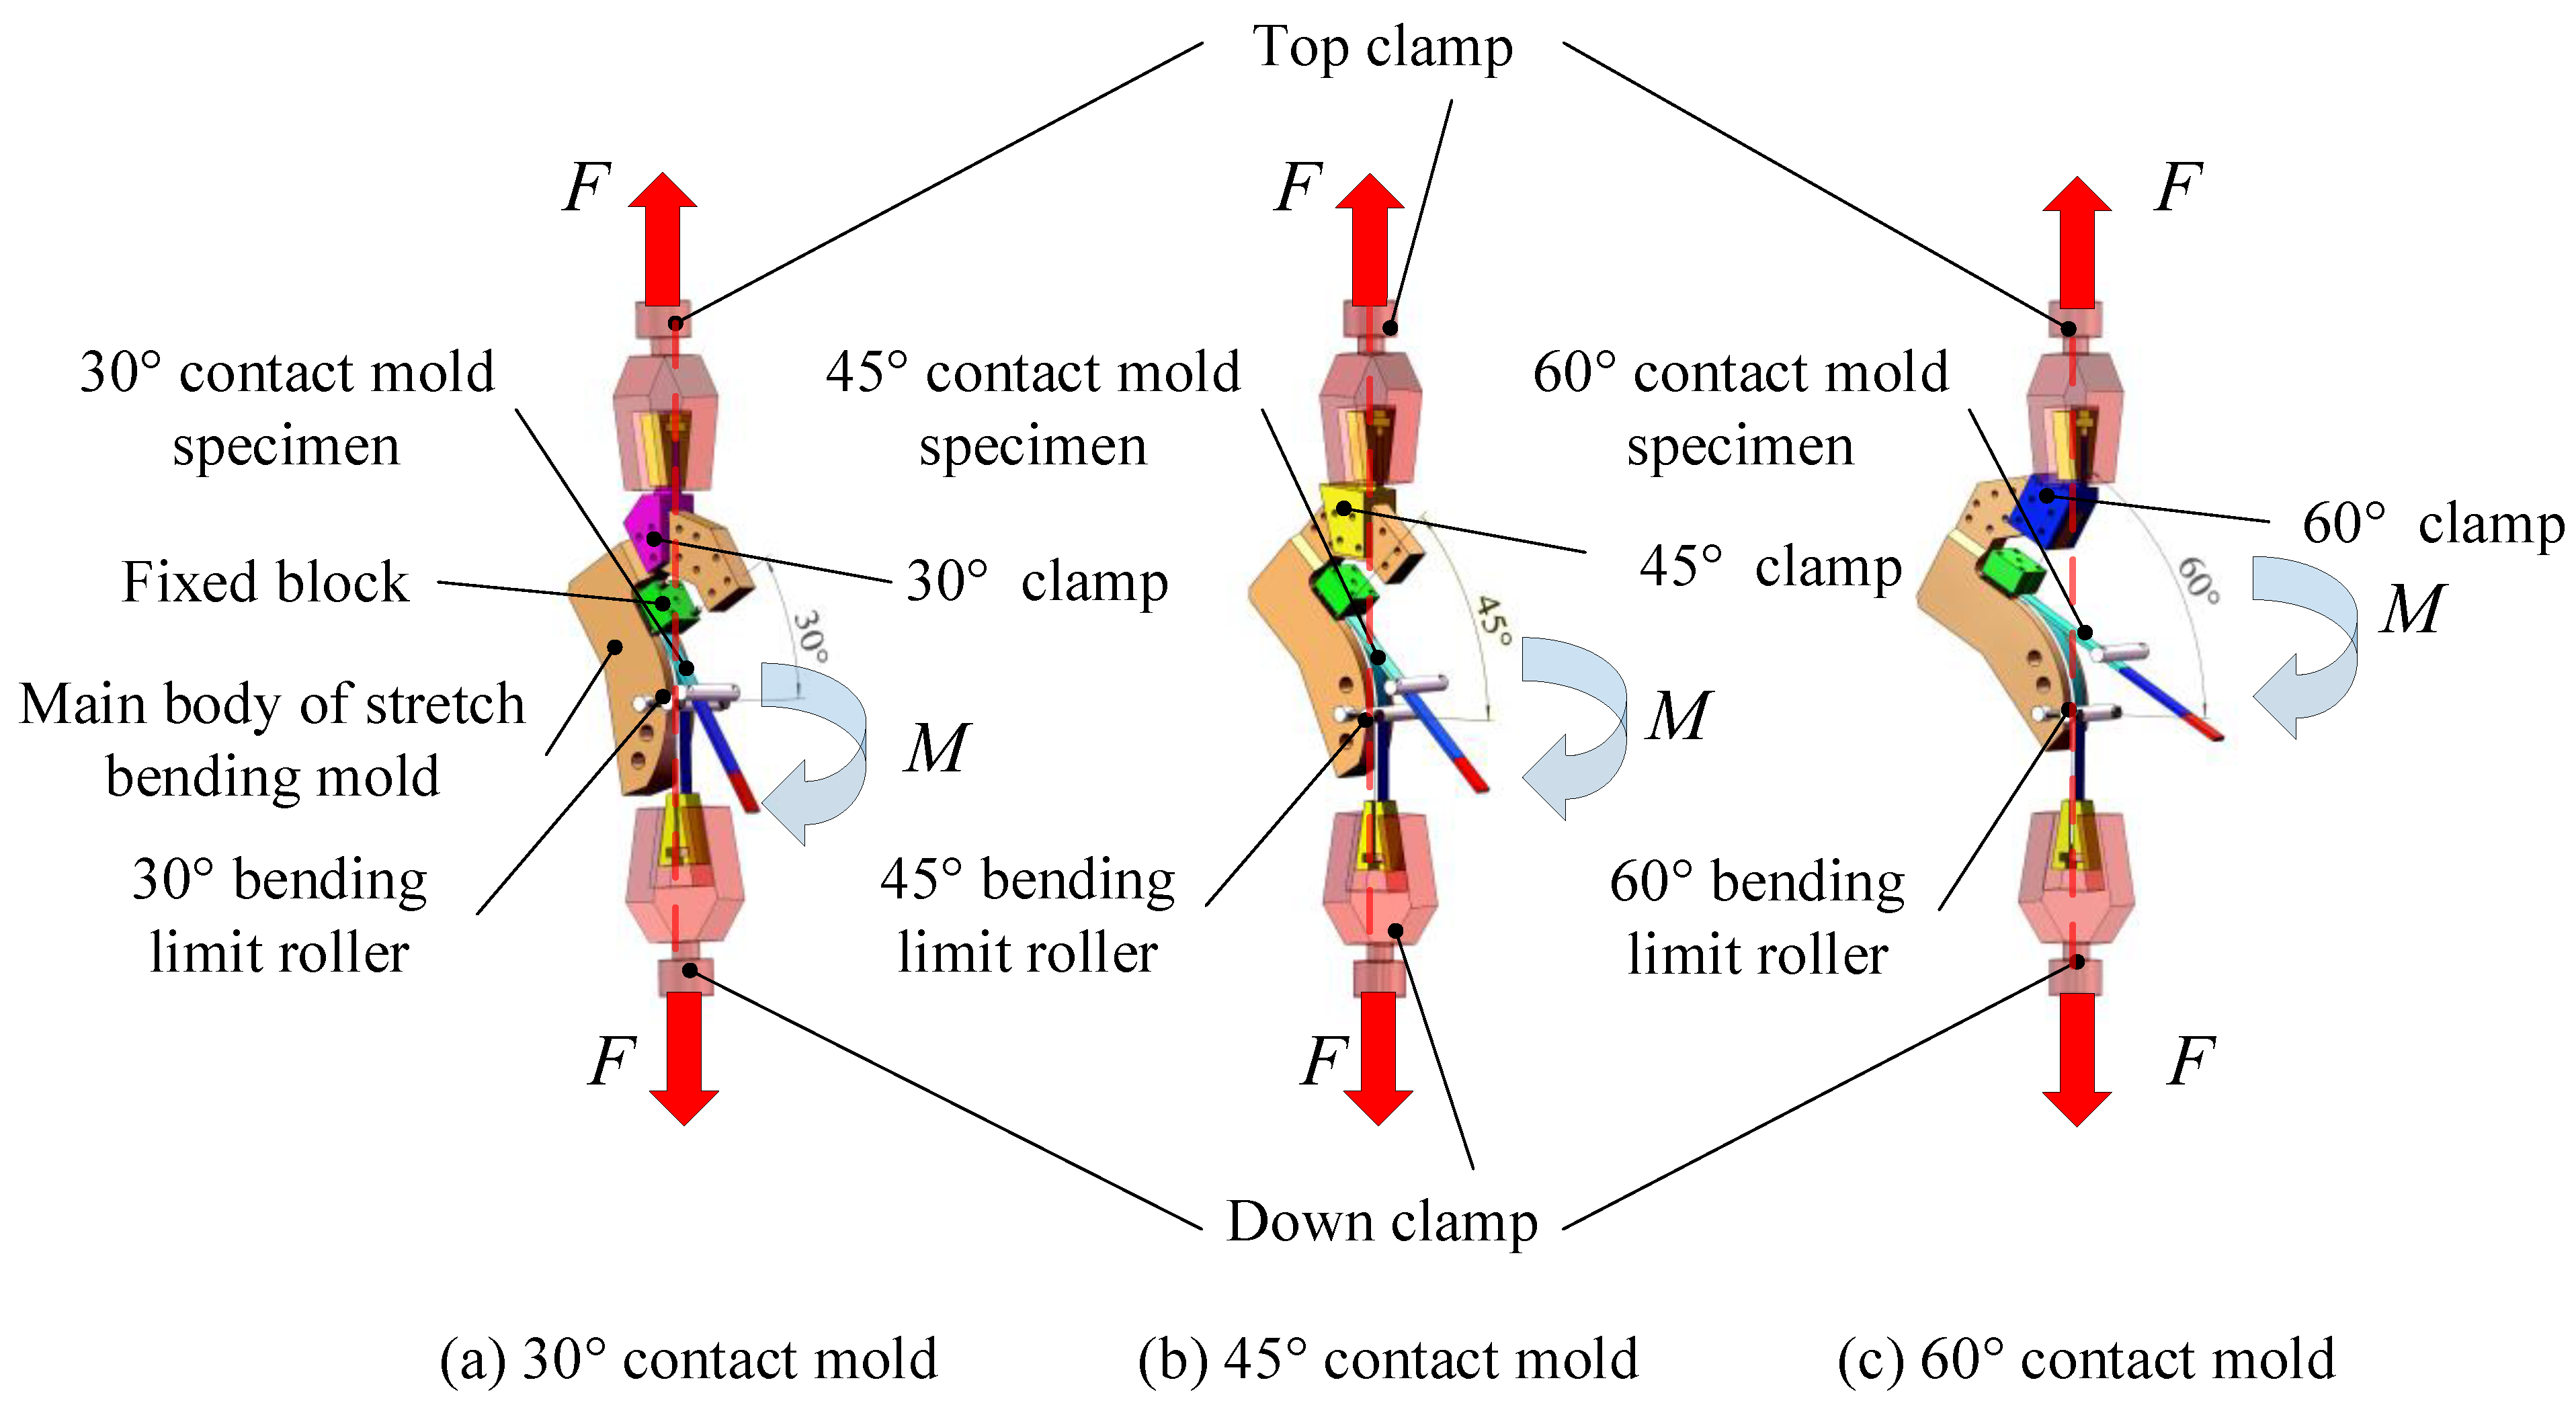
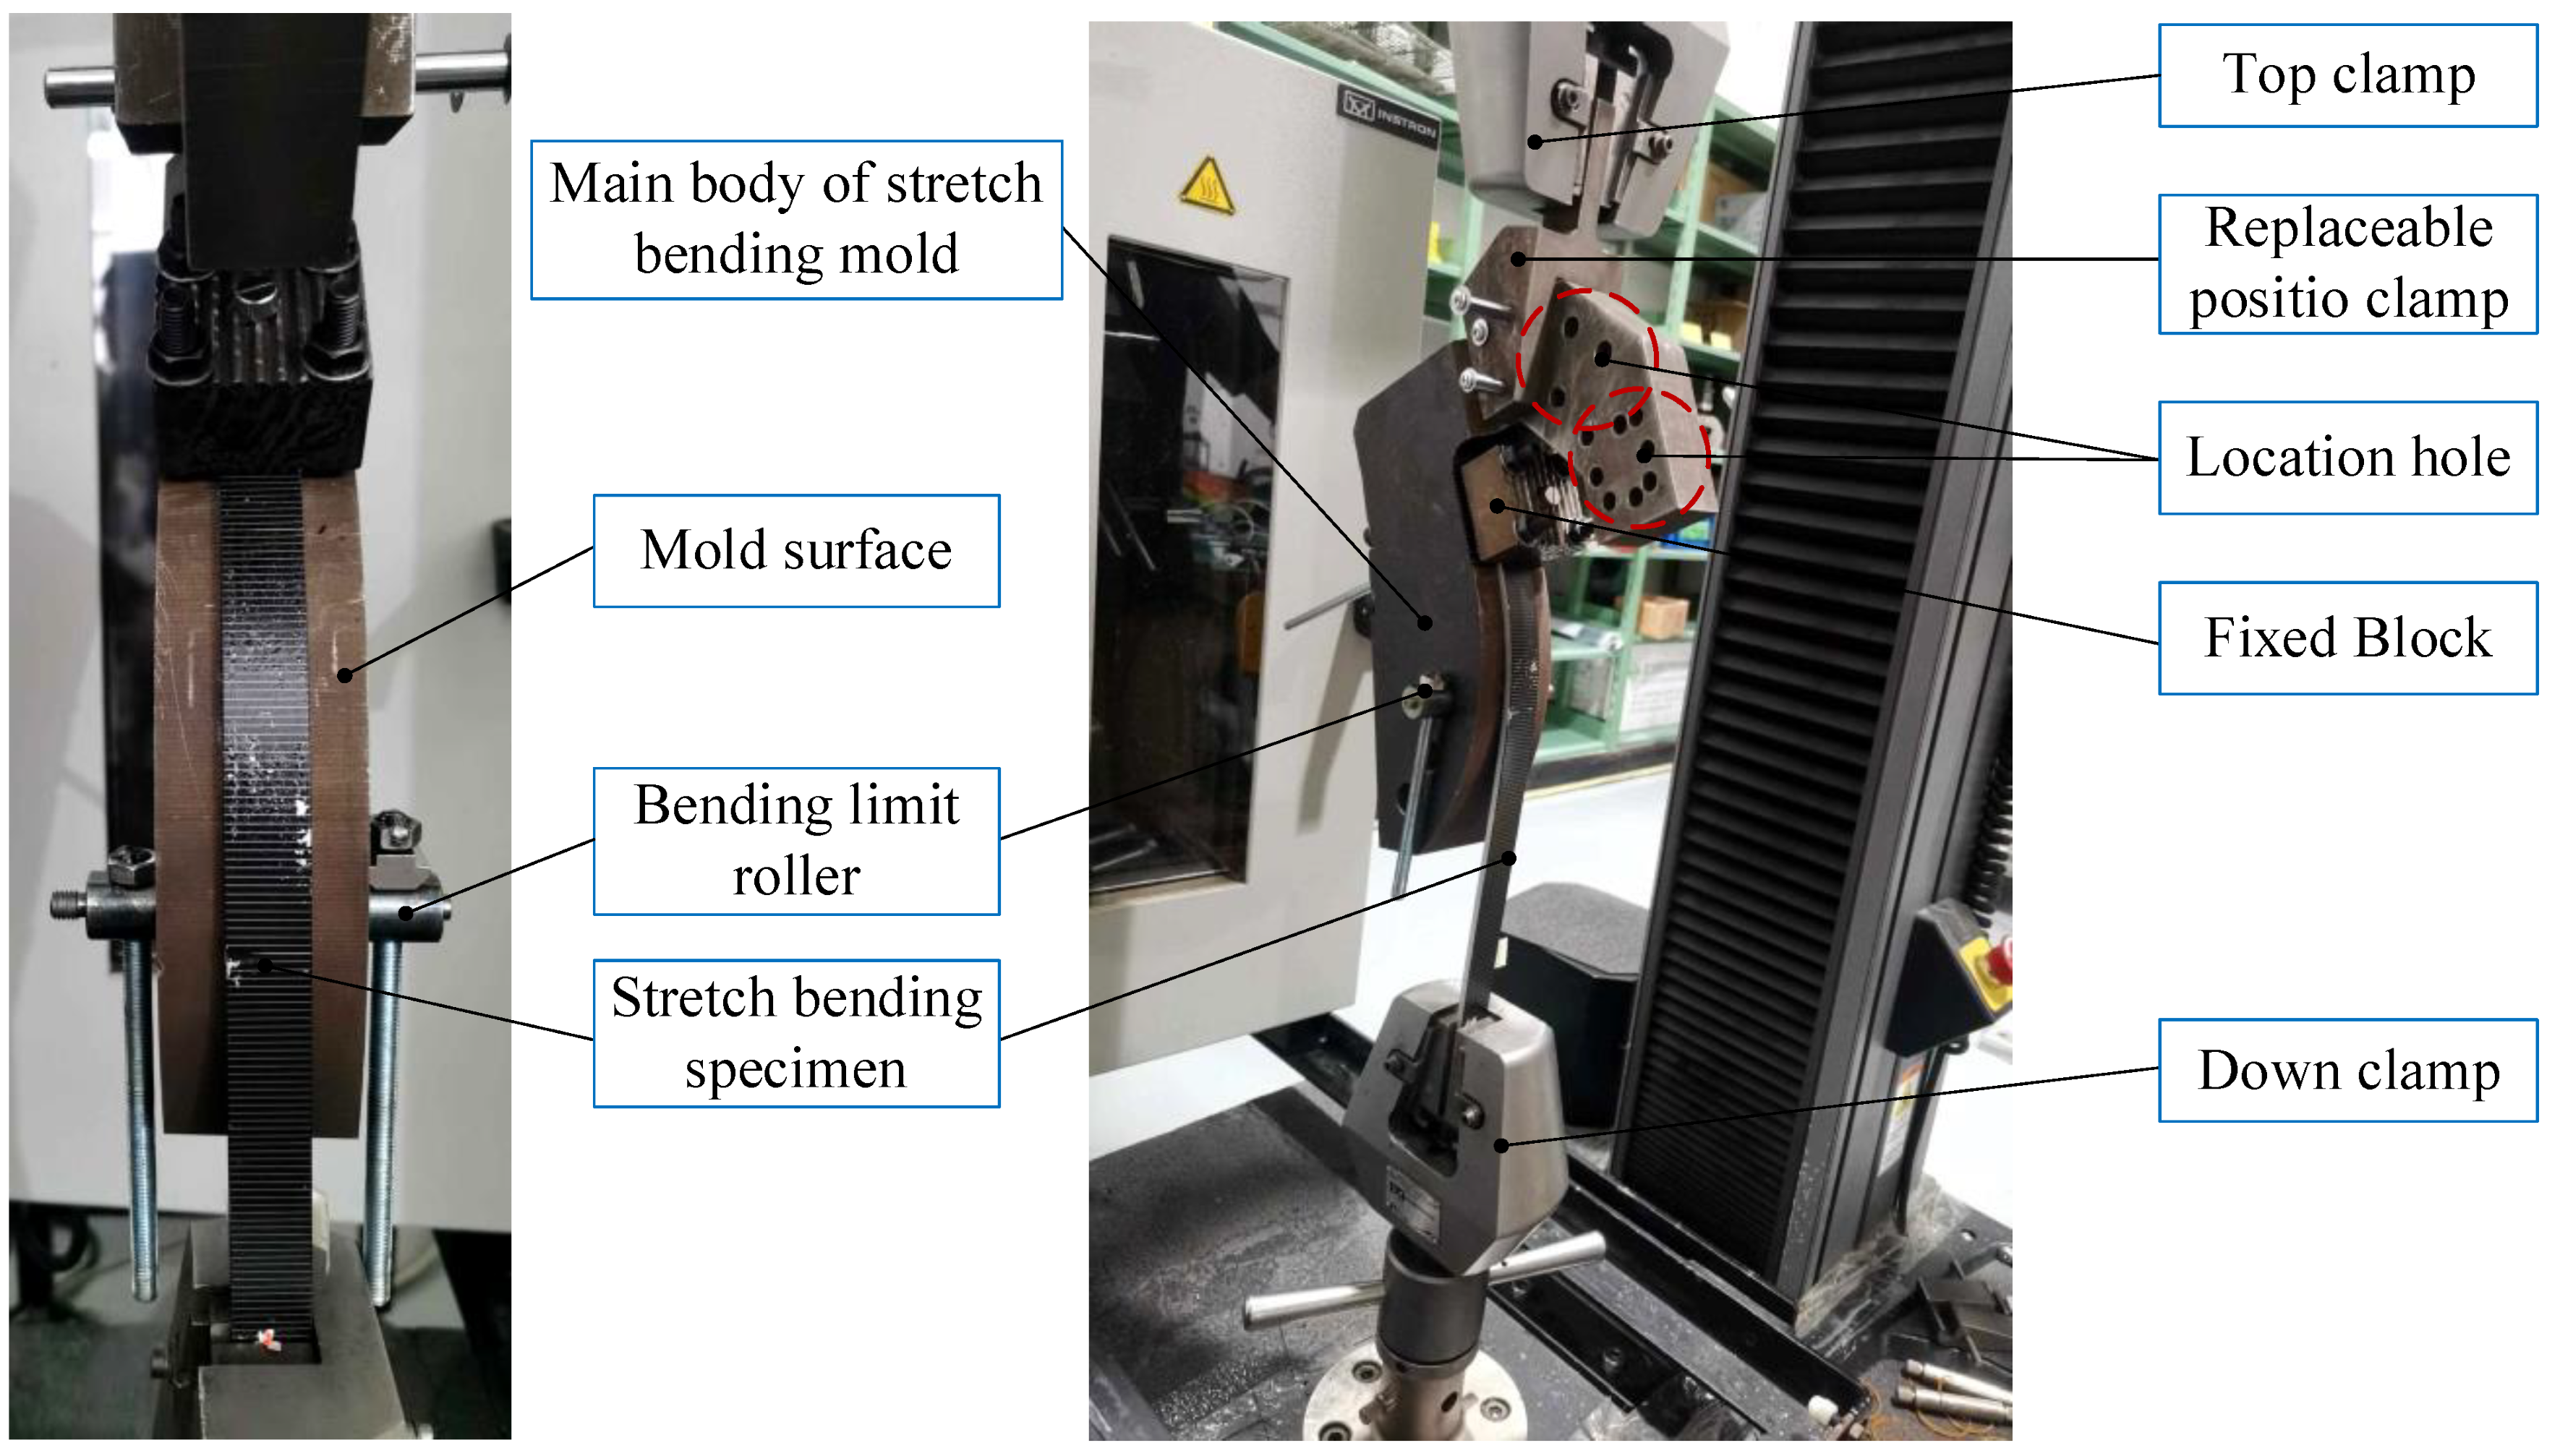
3.2. Equipment and Methods of the Equivalent Stretch-Bend Experiment
4. Experiment Results and Analysis
4.1. Effect of Contact Interface Friction and Contact Mold Angle on Shrinkage Deformation of the Cross-Section
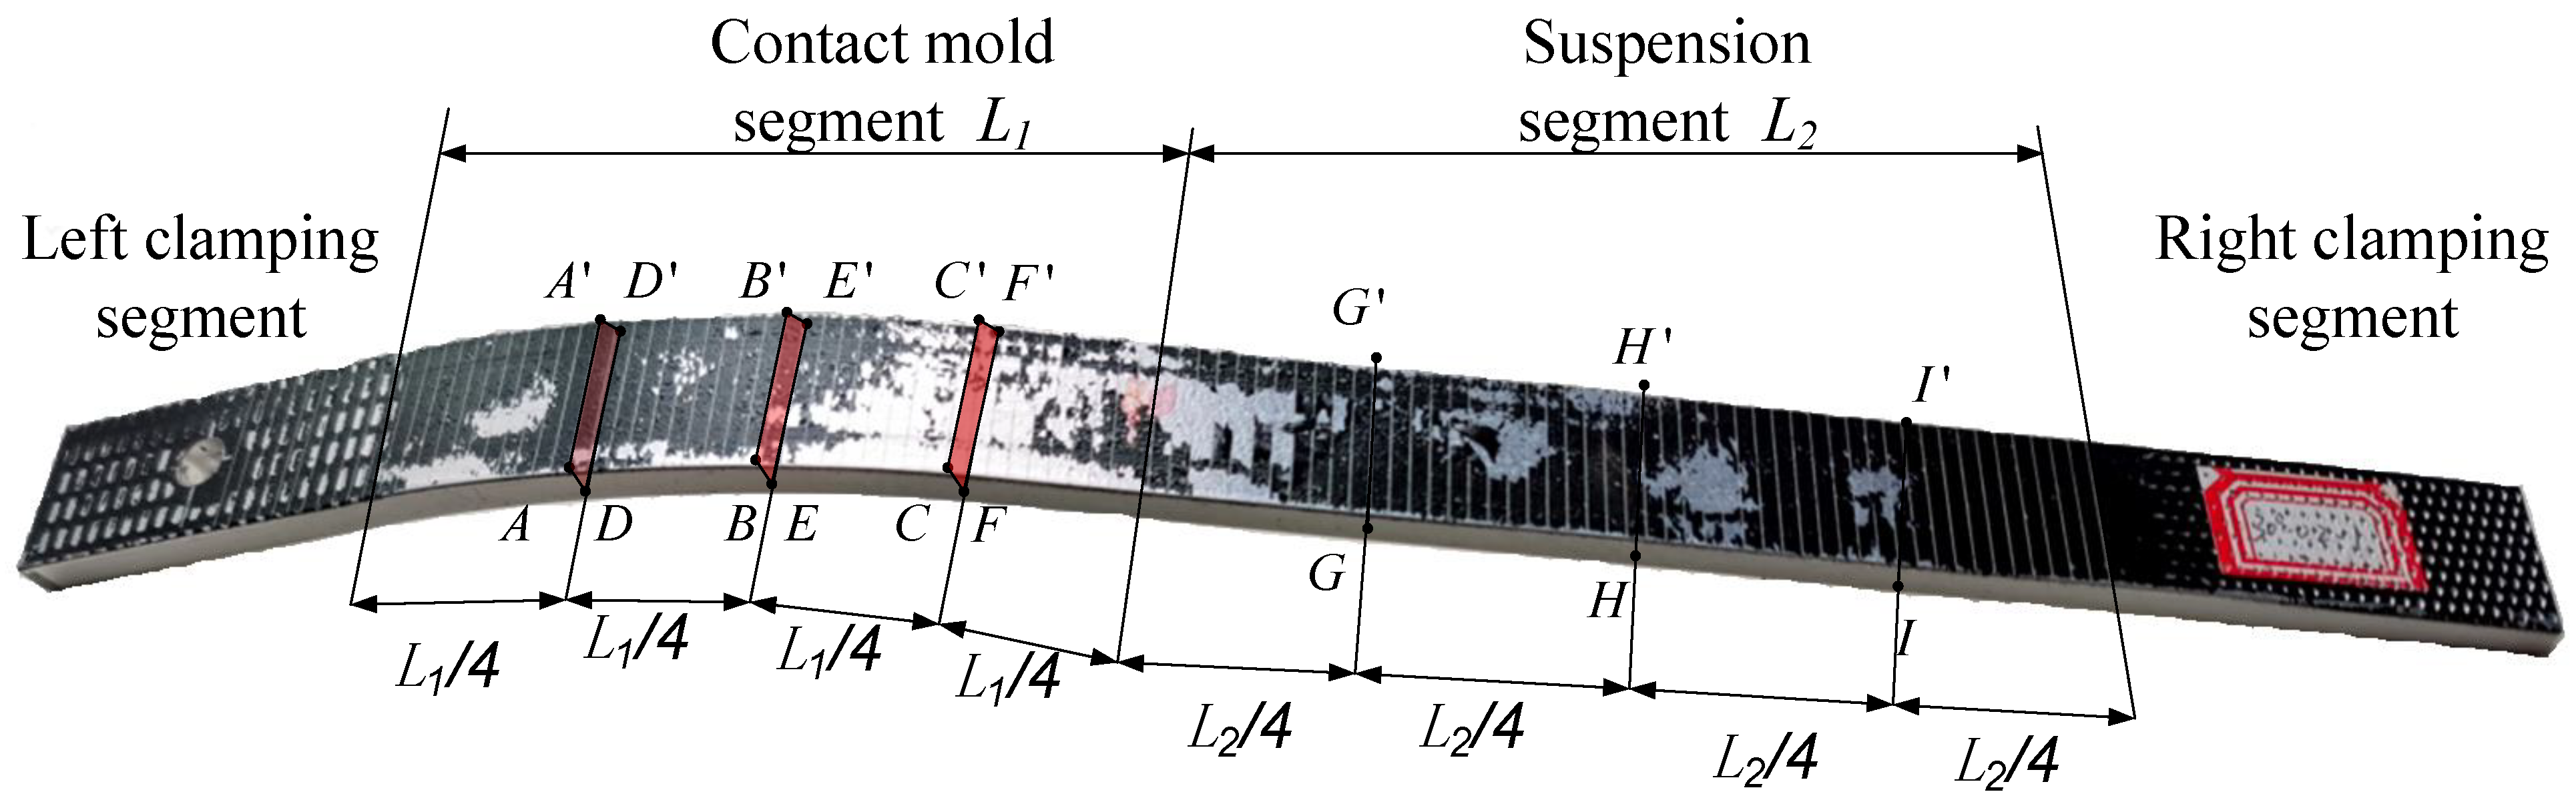
4.1.1. Cross-Section Shrinkage Deformation Analysis
4.1.2. Effect of Contact Interface Friction on Cross-Sectional Shrinkage Rate
4.1.3. Effect of Contact Mold Angle on Cross-Sectional Shrinkage Rate
4.2. Effect of Contact Interface Friction and Contact Mold Angle on Tensile Deformation of the Cross-Section
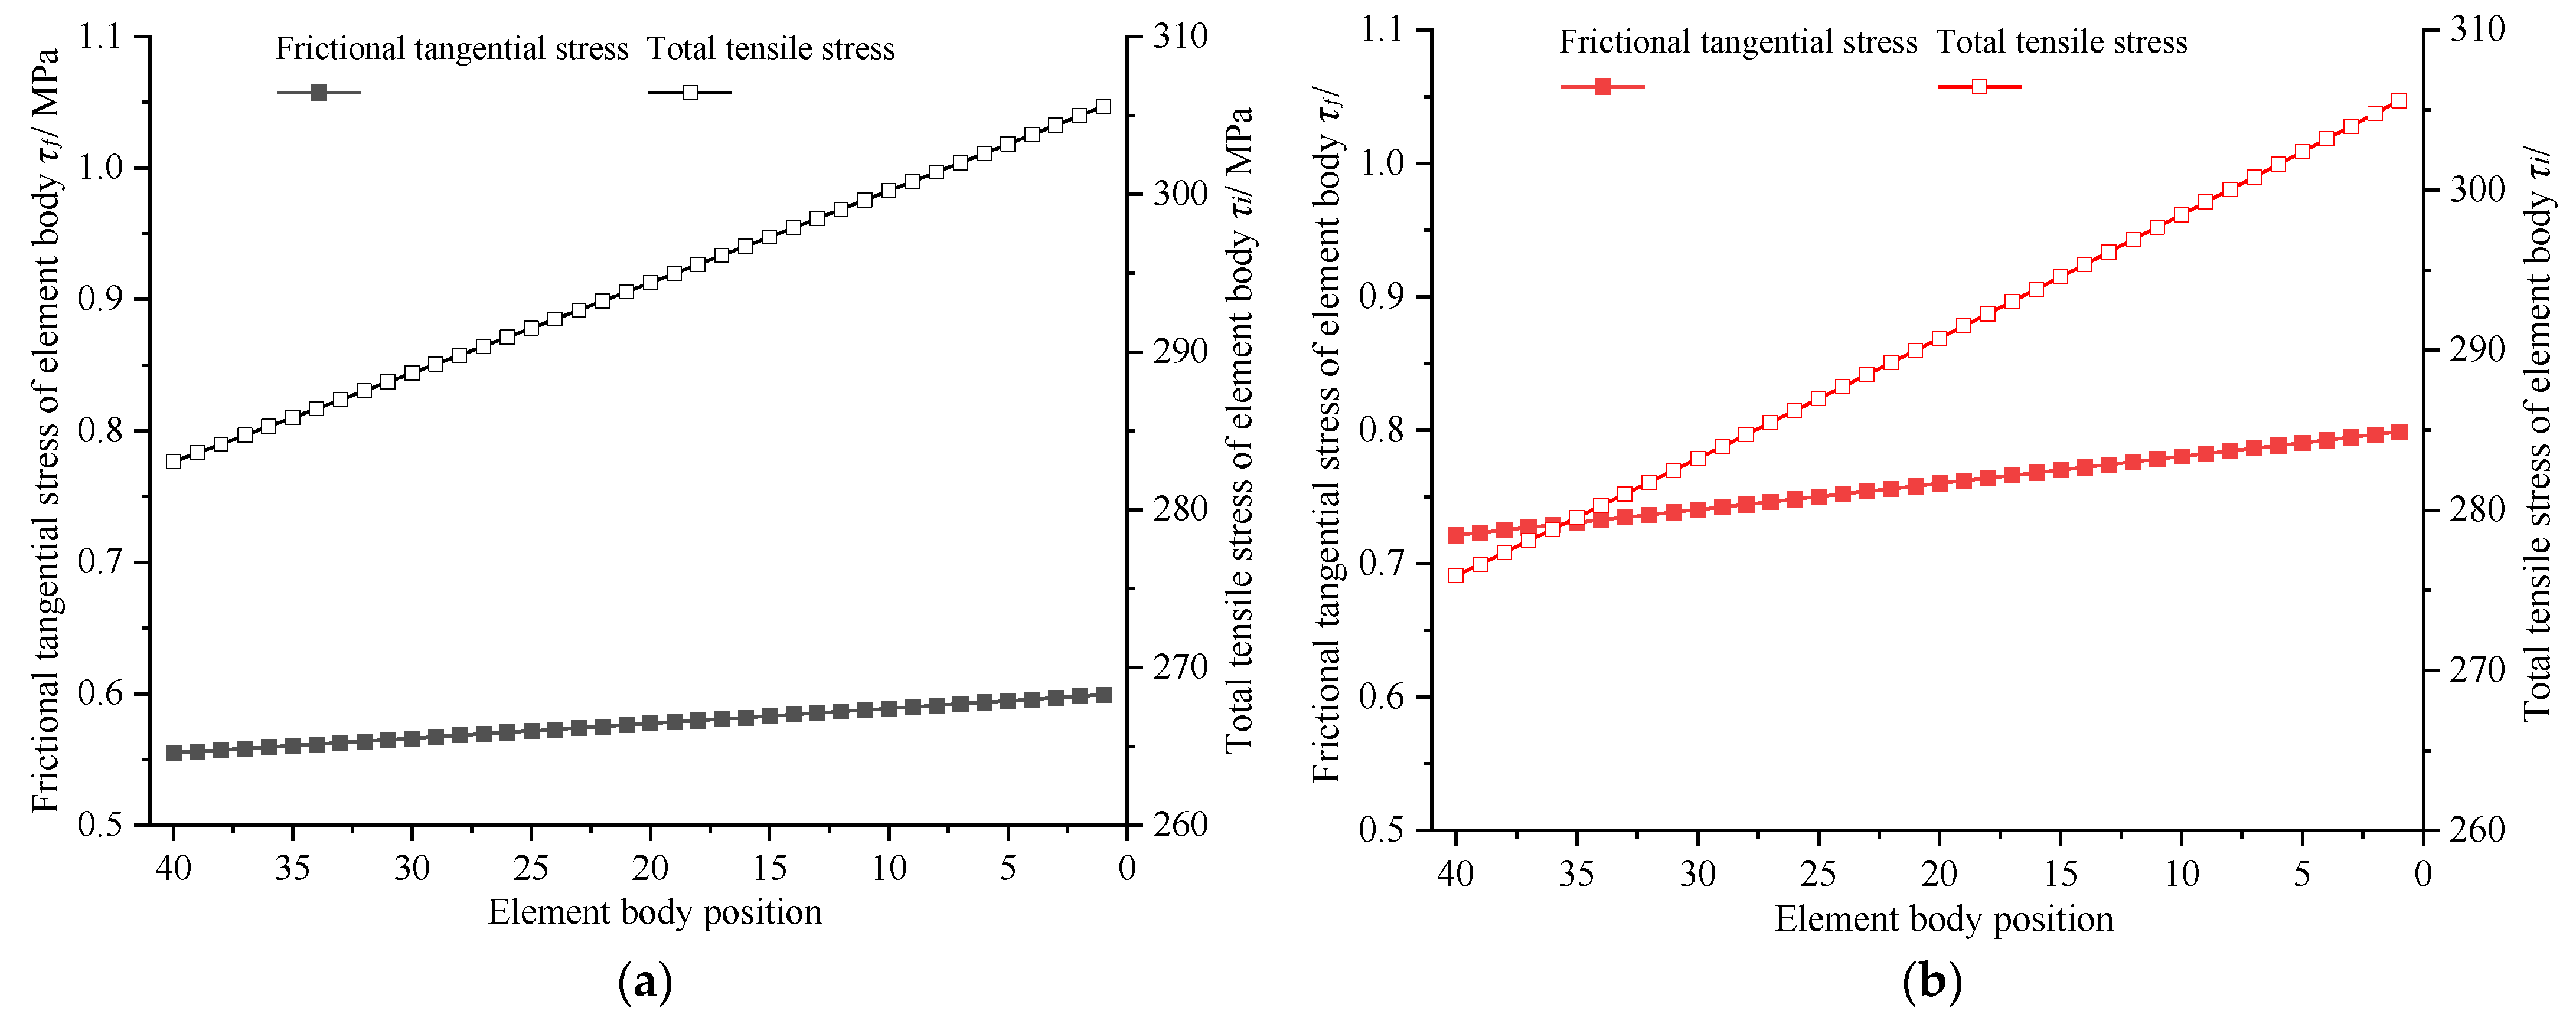
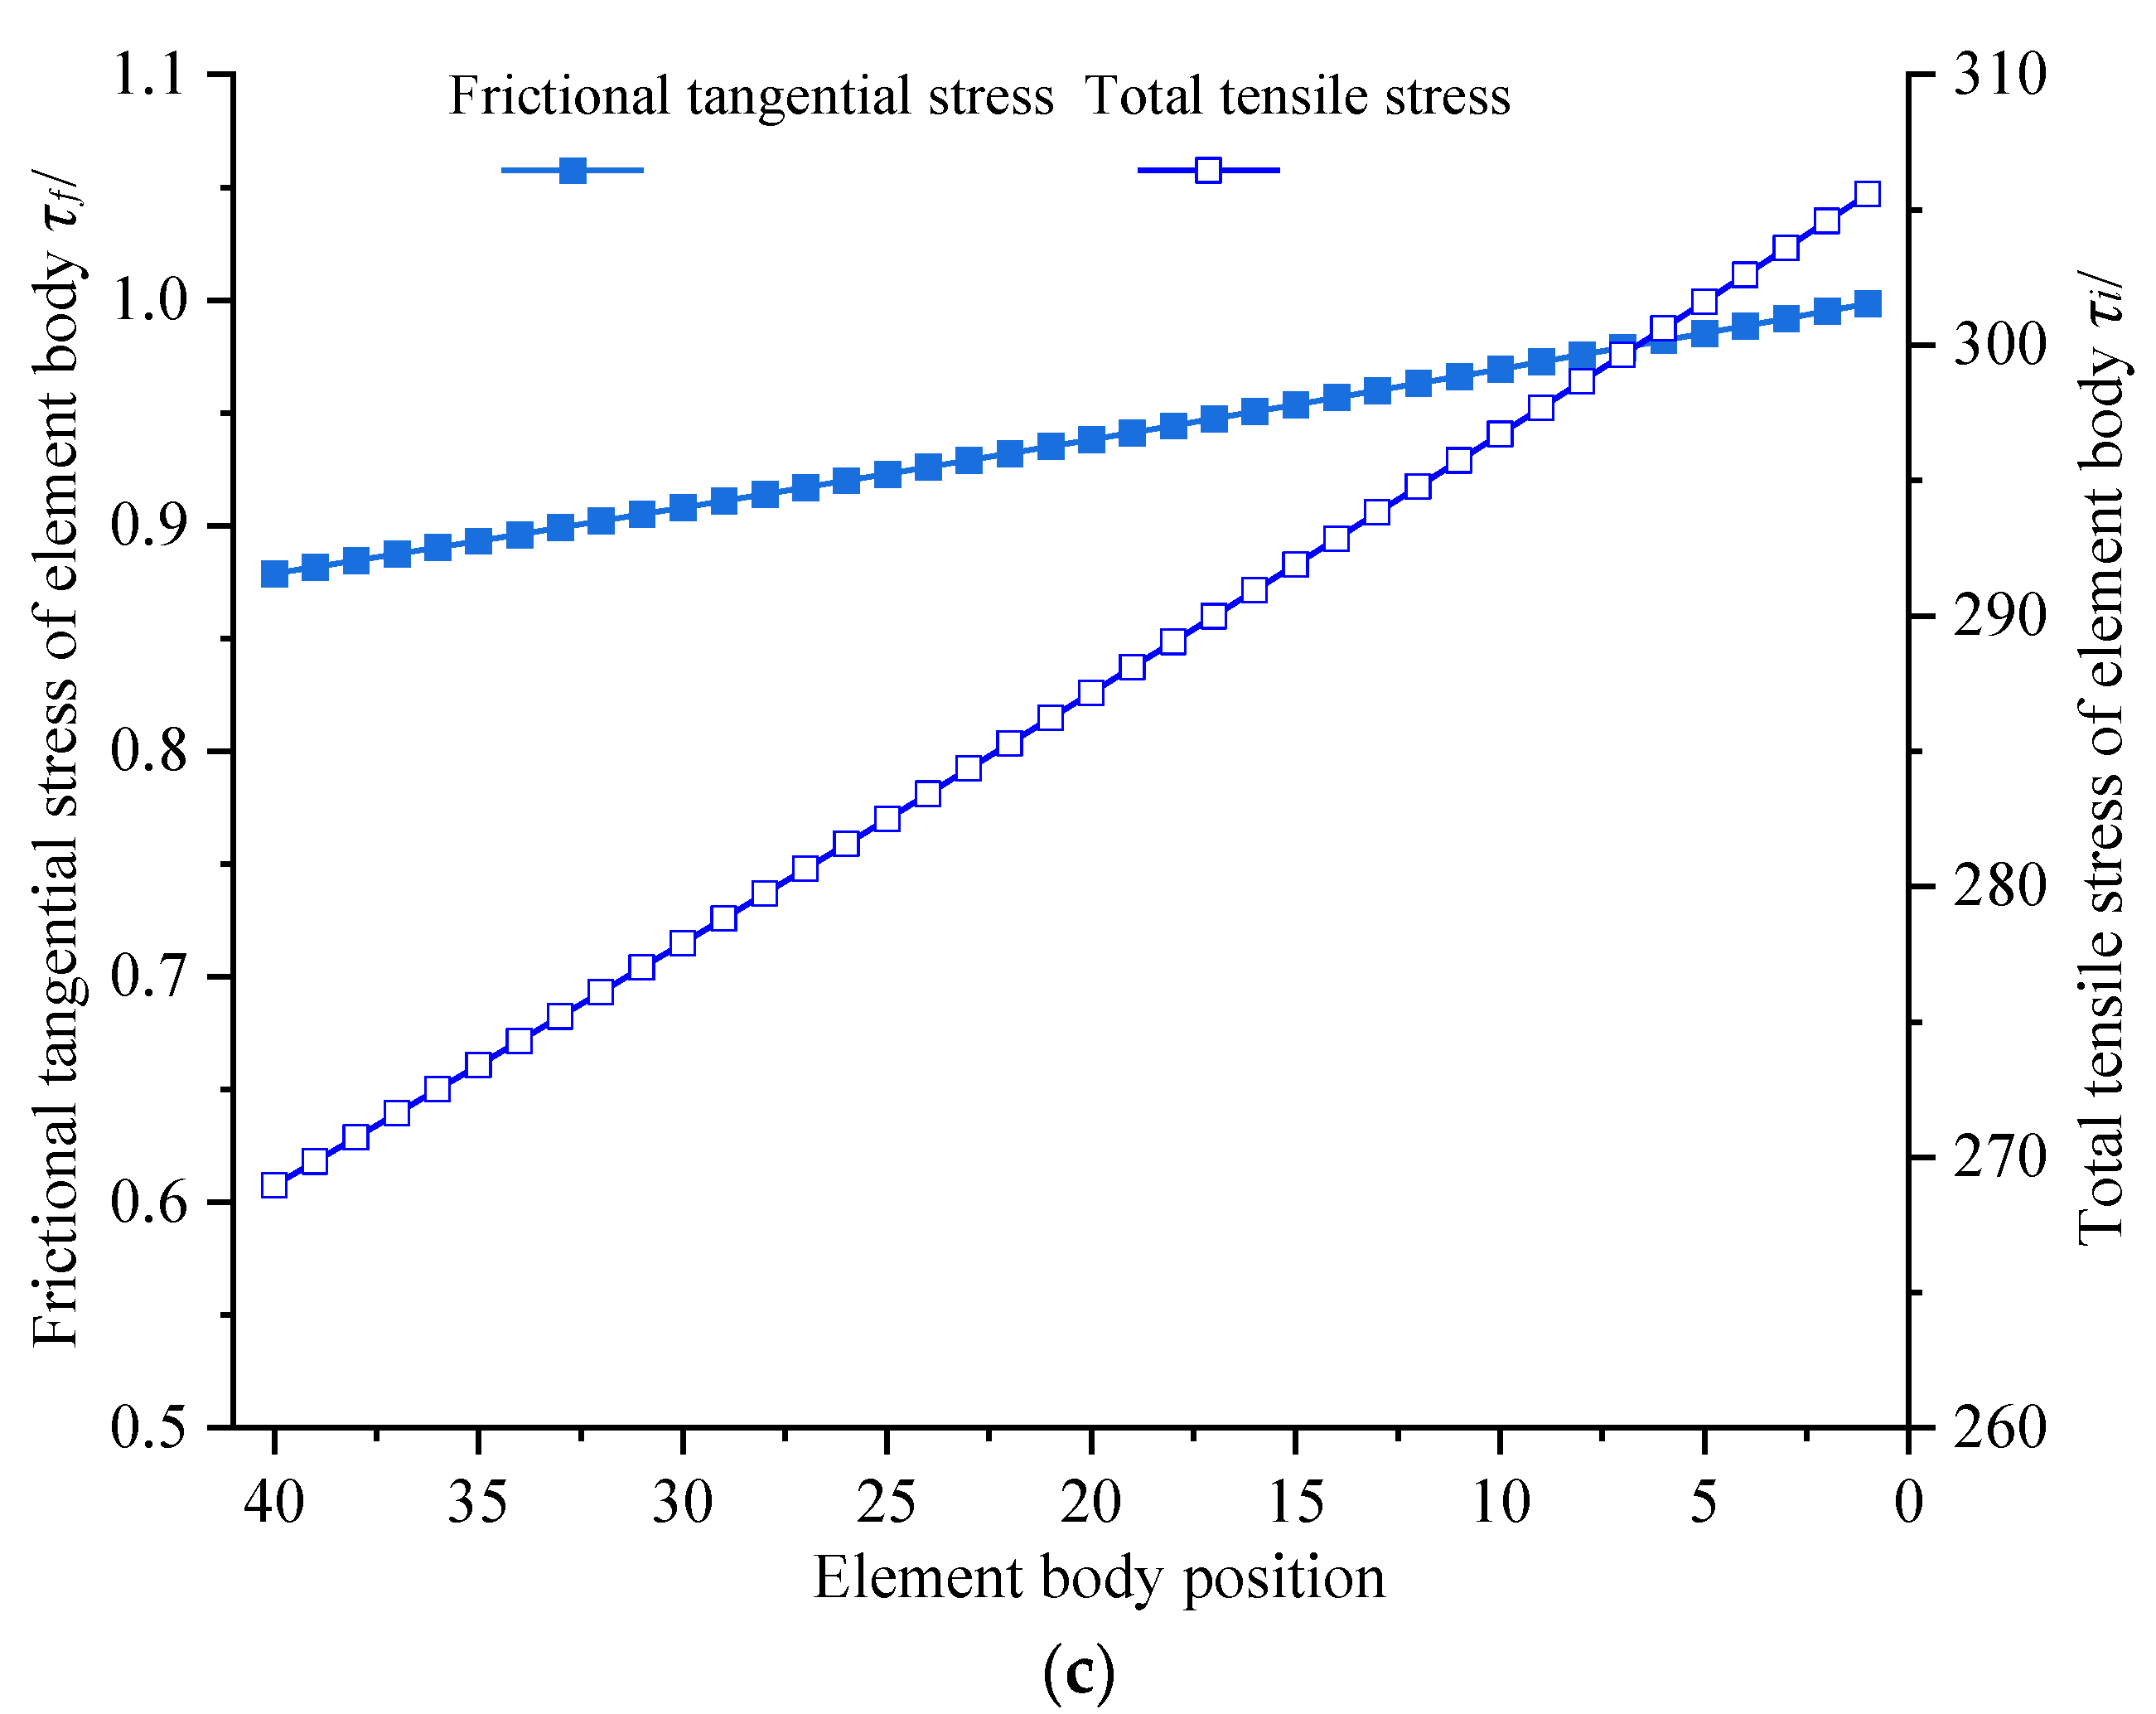
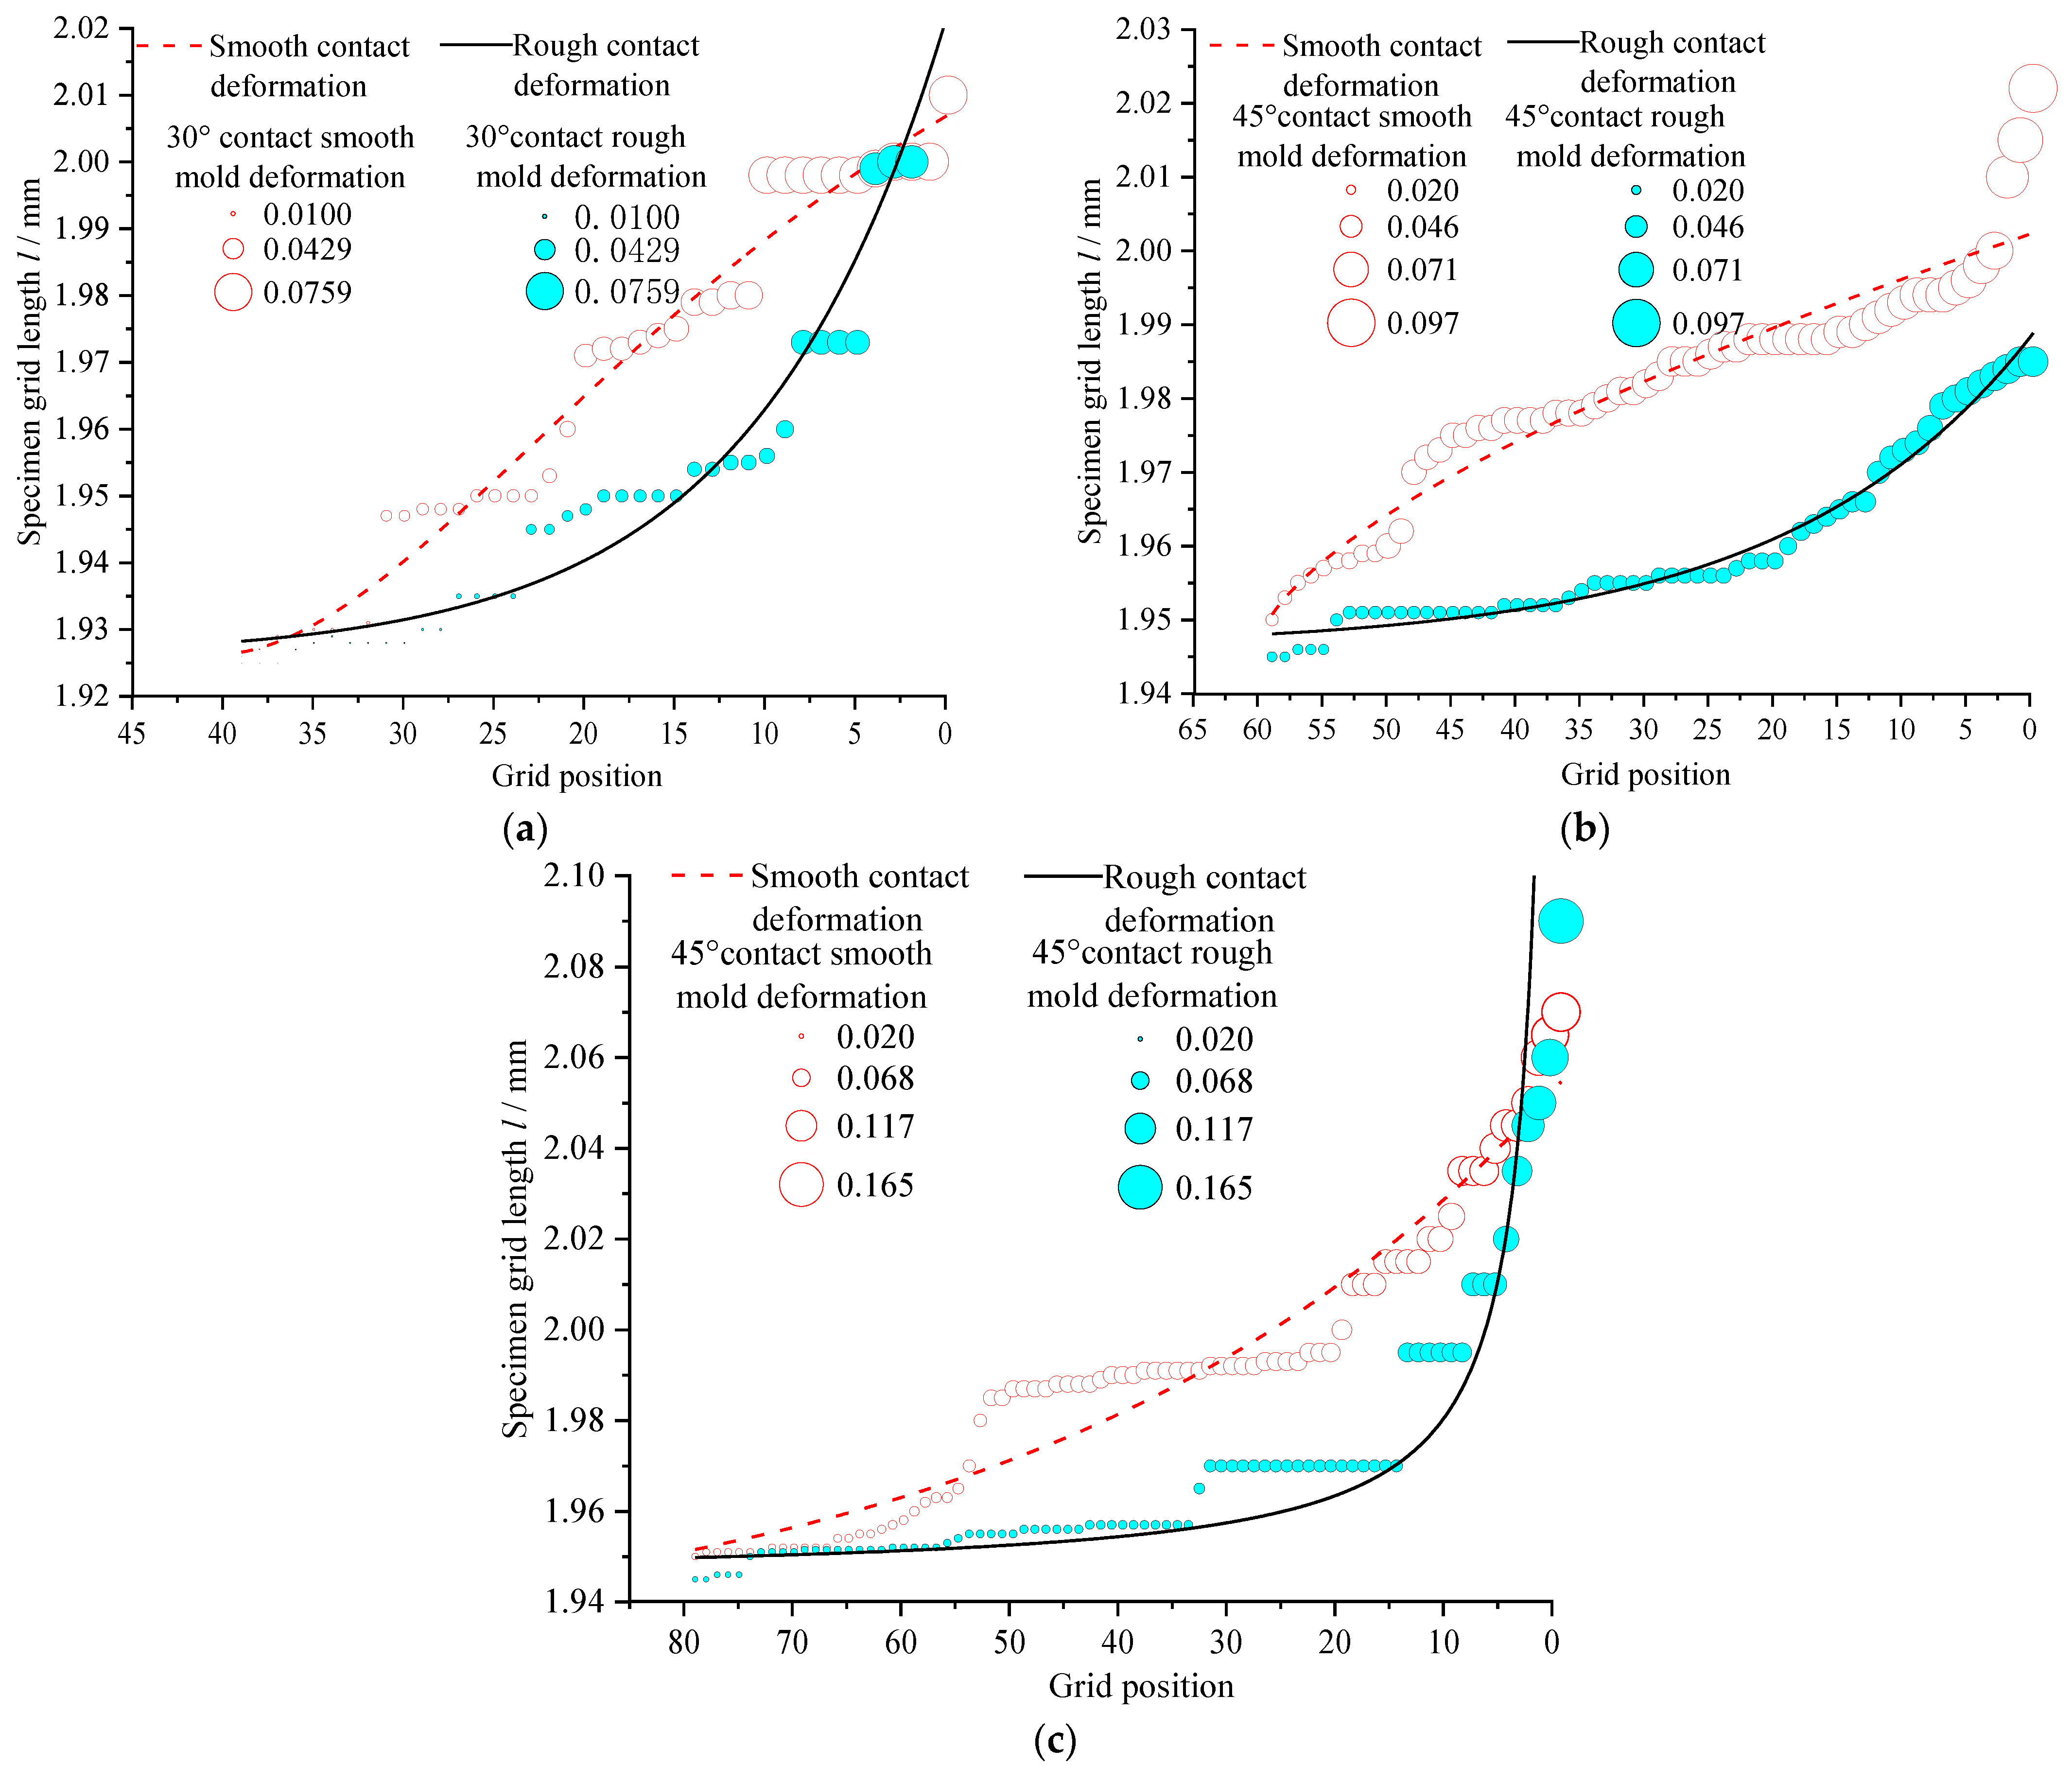
4.2.1. Effect of Contact Interface Friction on Tensile Deformation of Contact Mold Segment
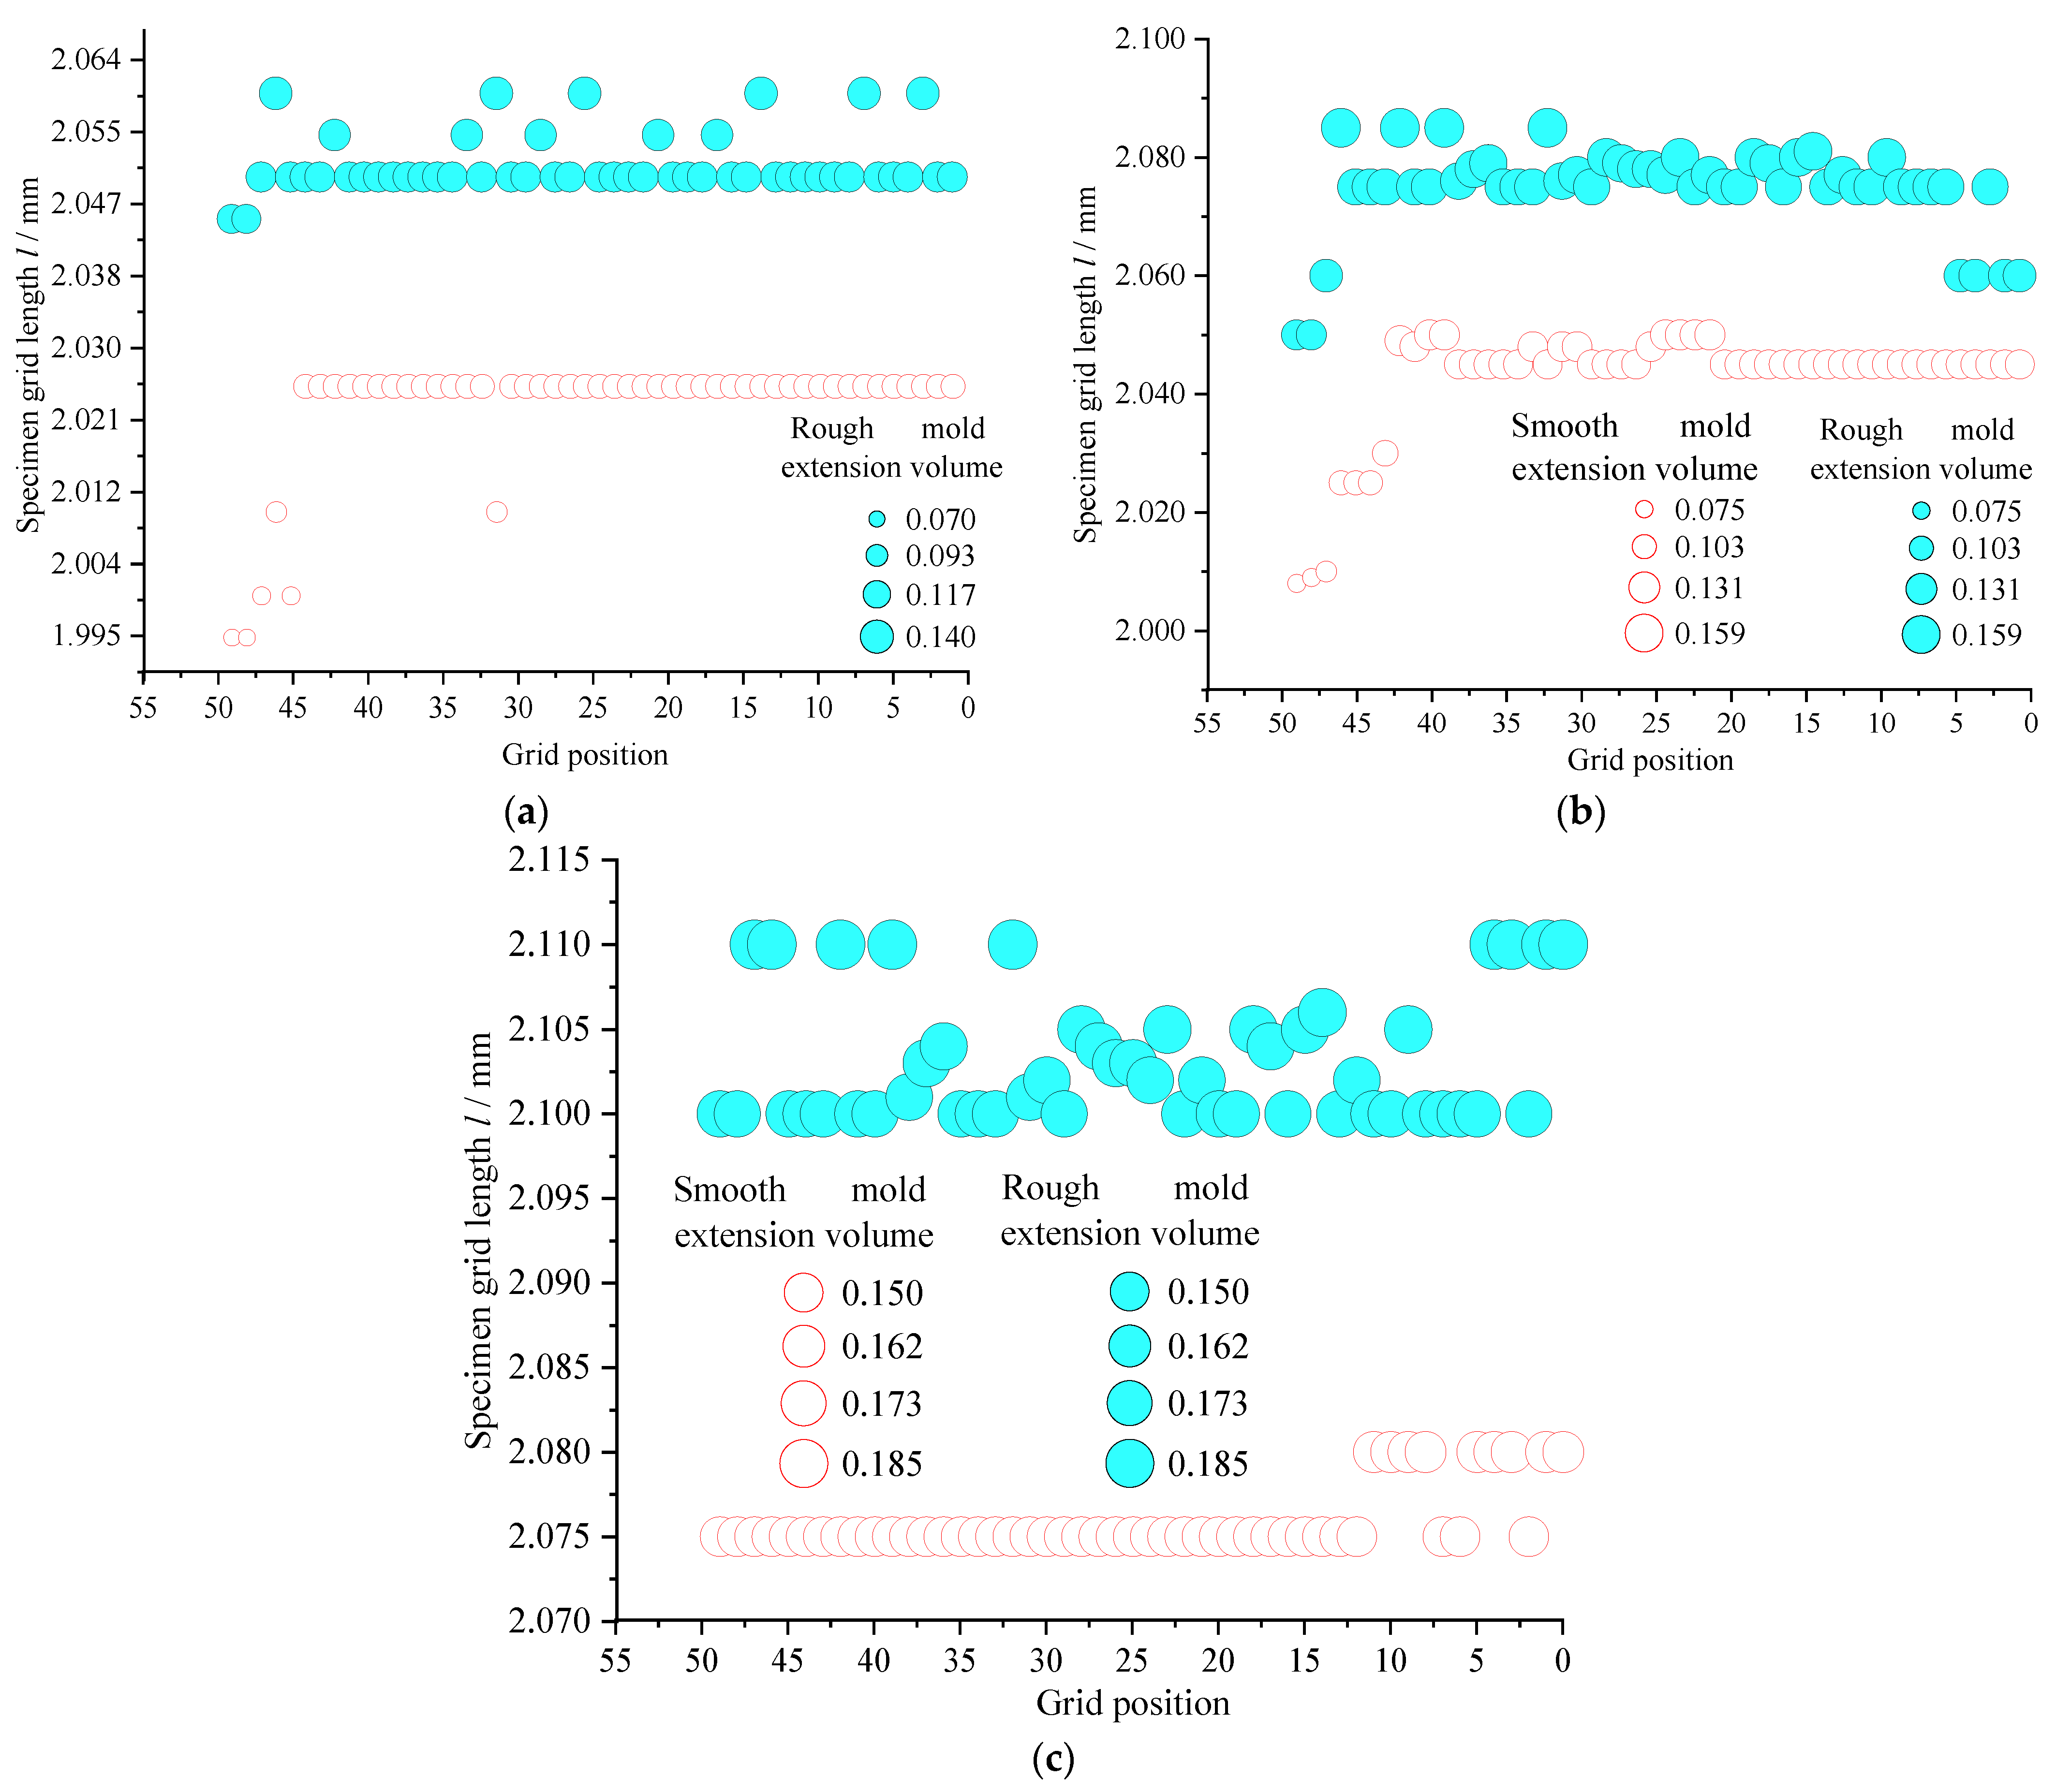
4.2.2. Effect of Contact Interface Friction on Tensile Deformation of the Suspension Segment
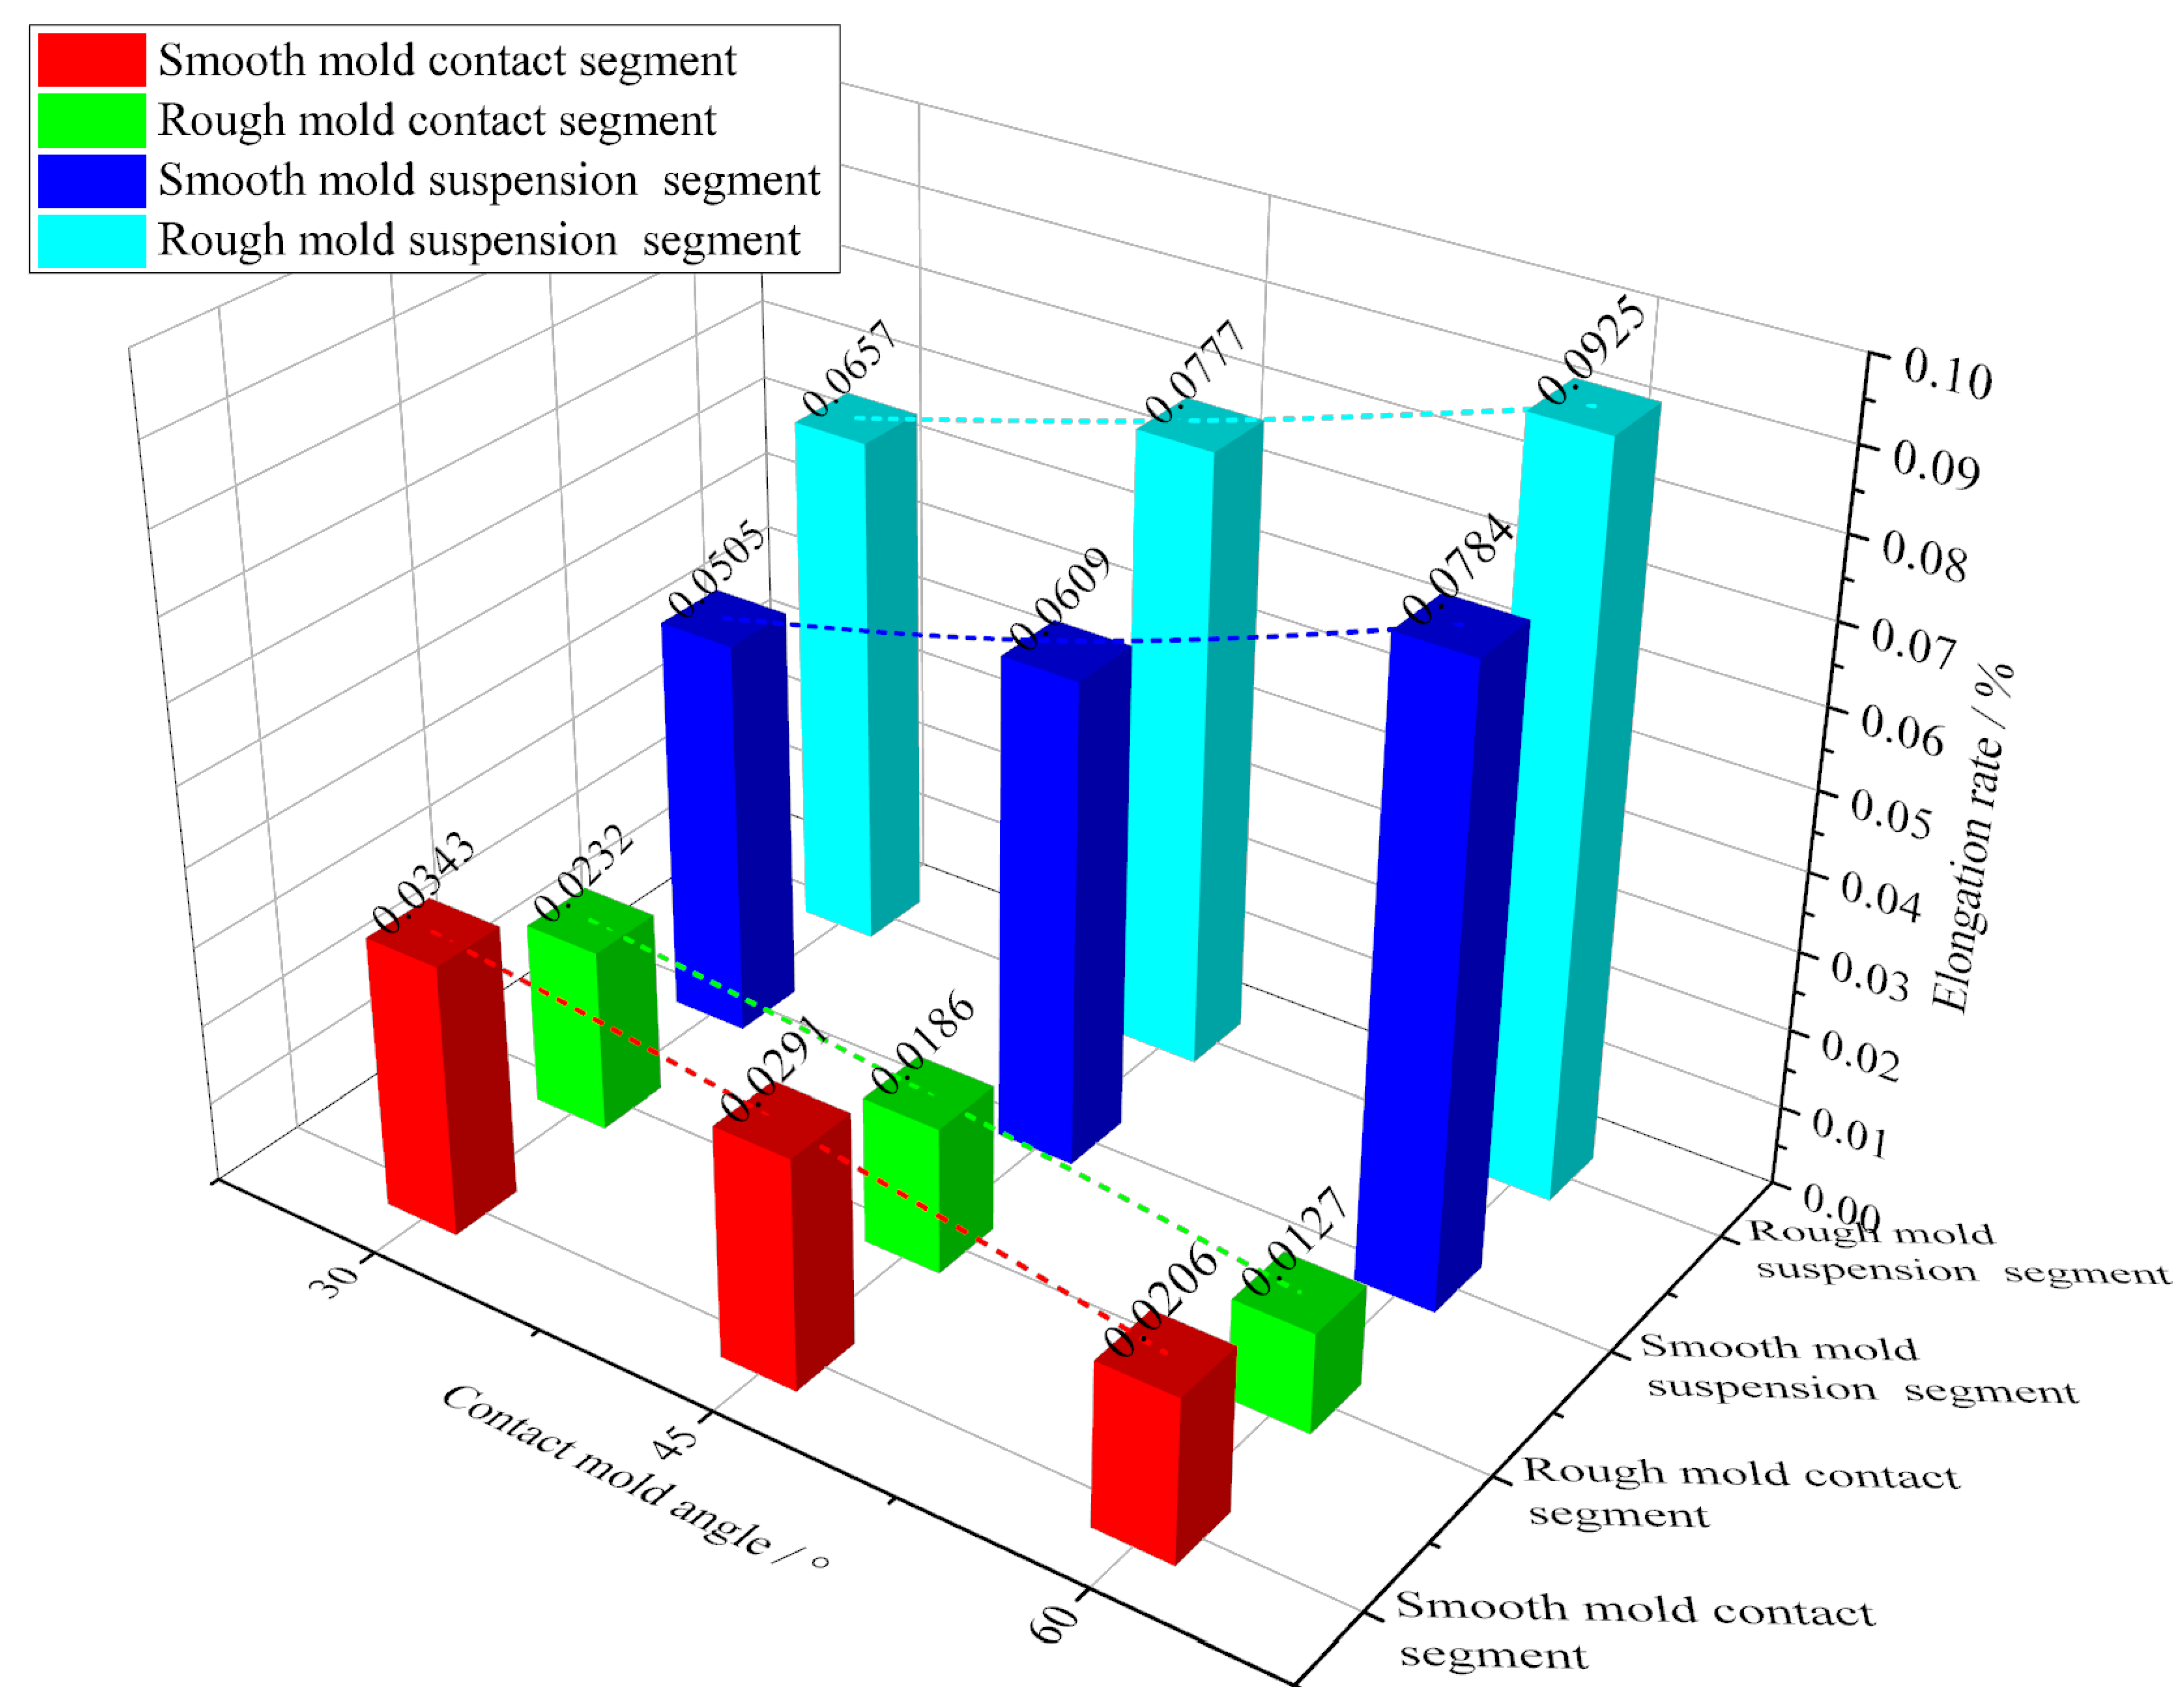
4.2.3. Effect of Contact Mold Angle on Tensile Elongation
5. Conclusions
- (1)
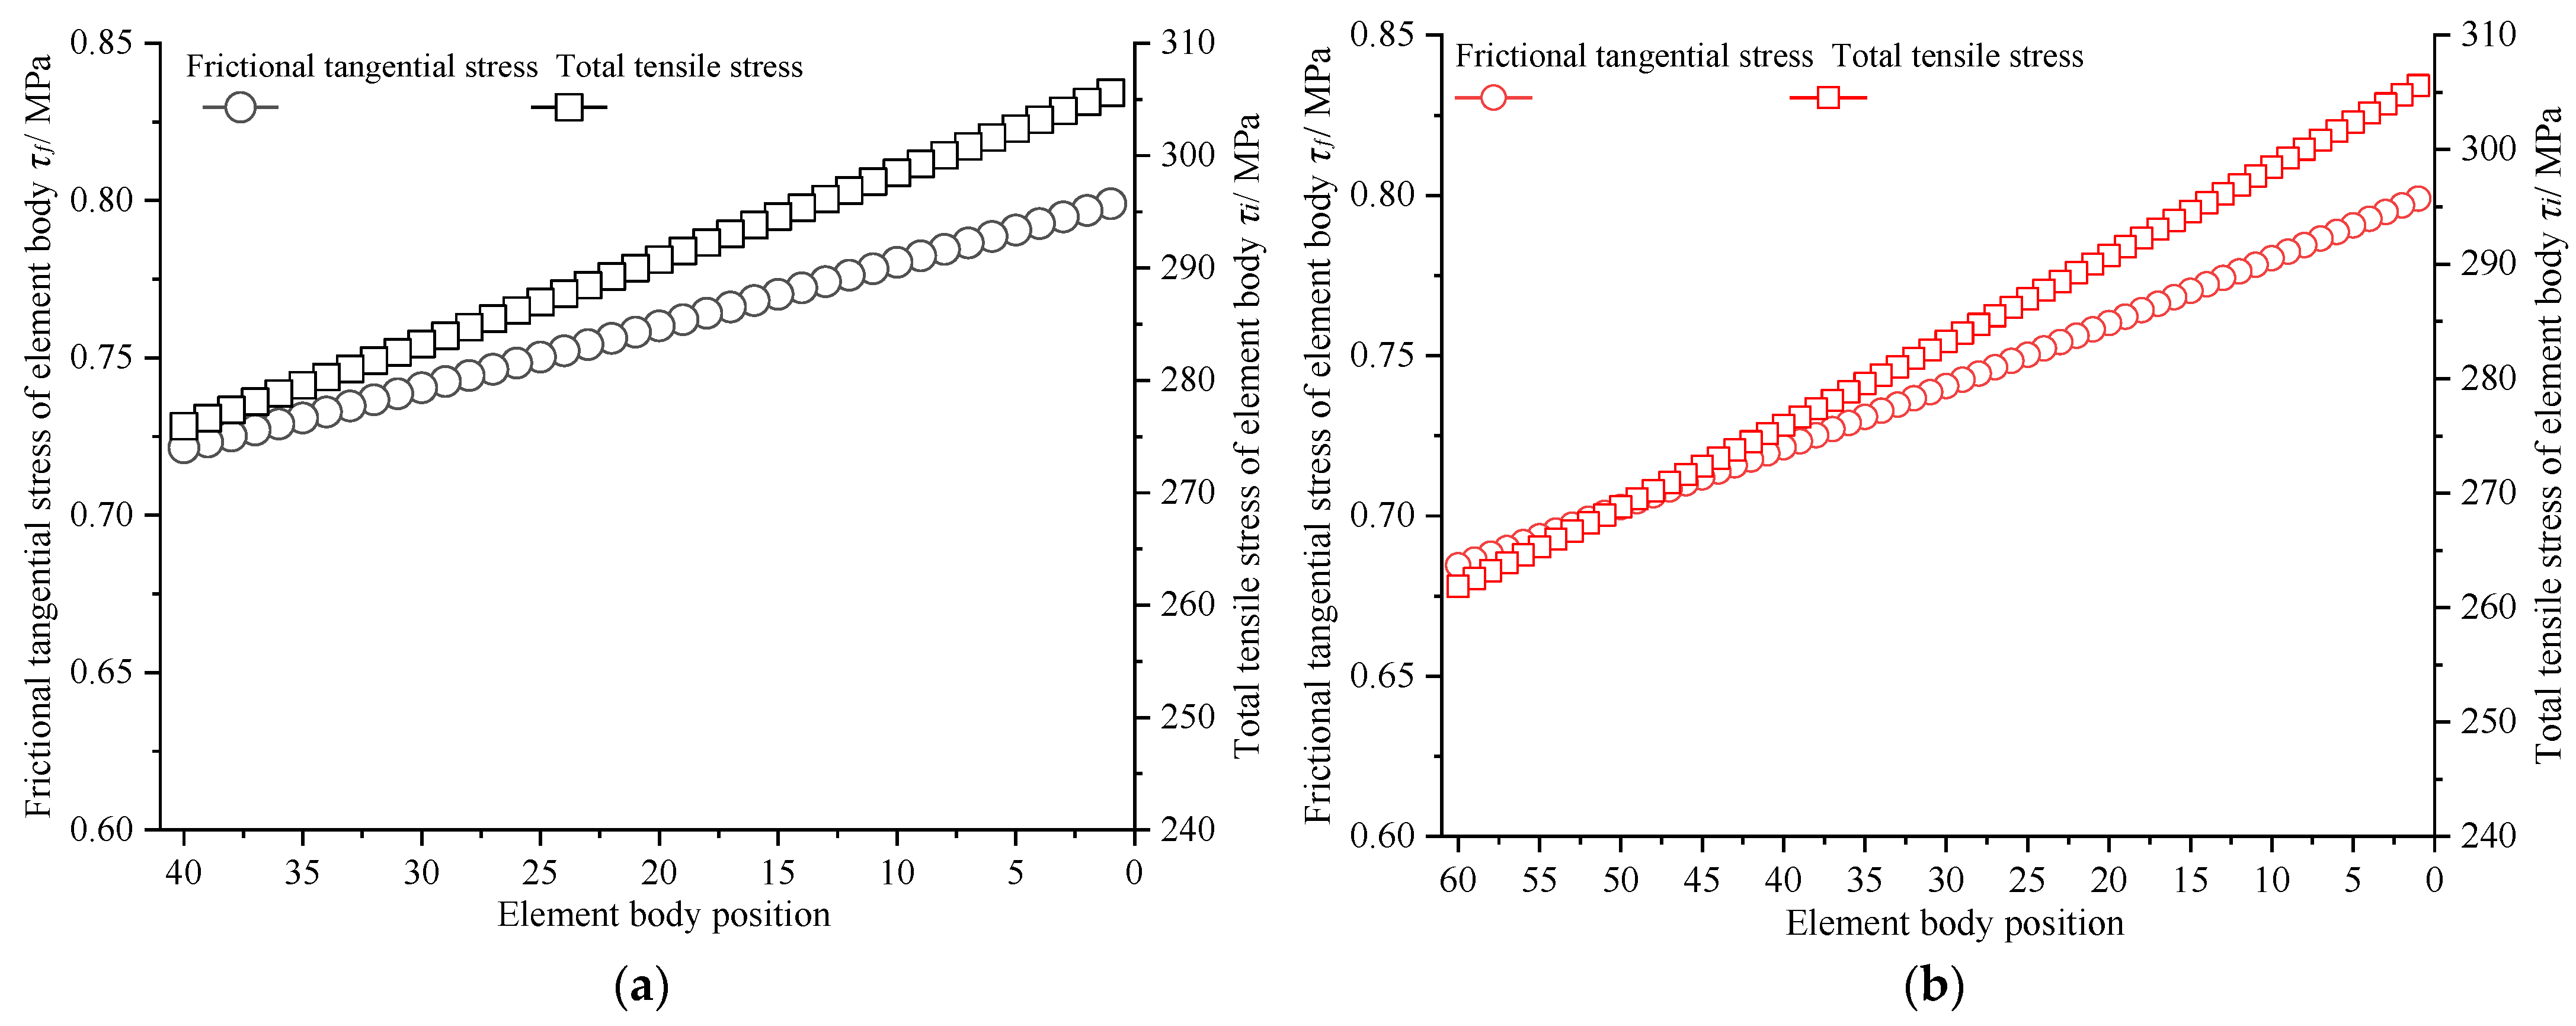
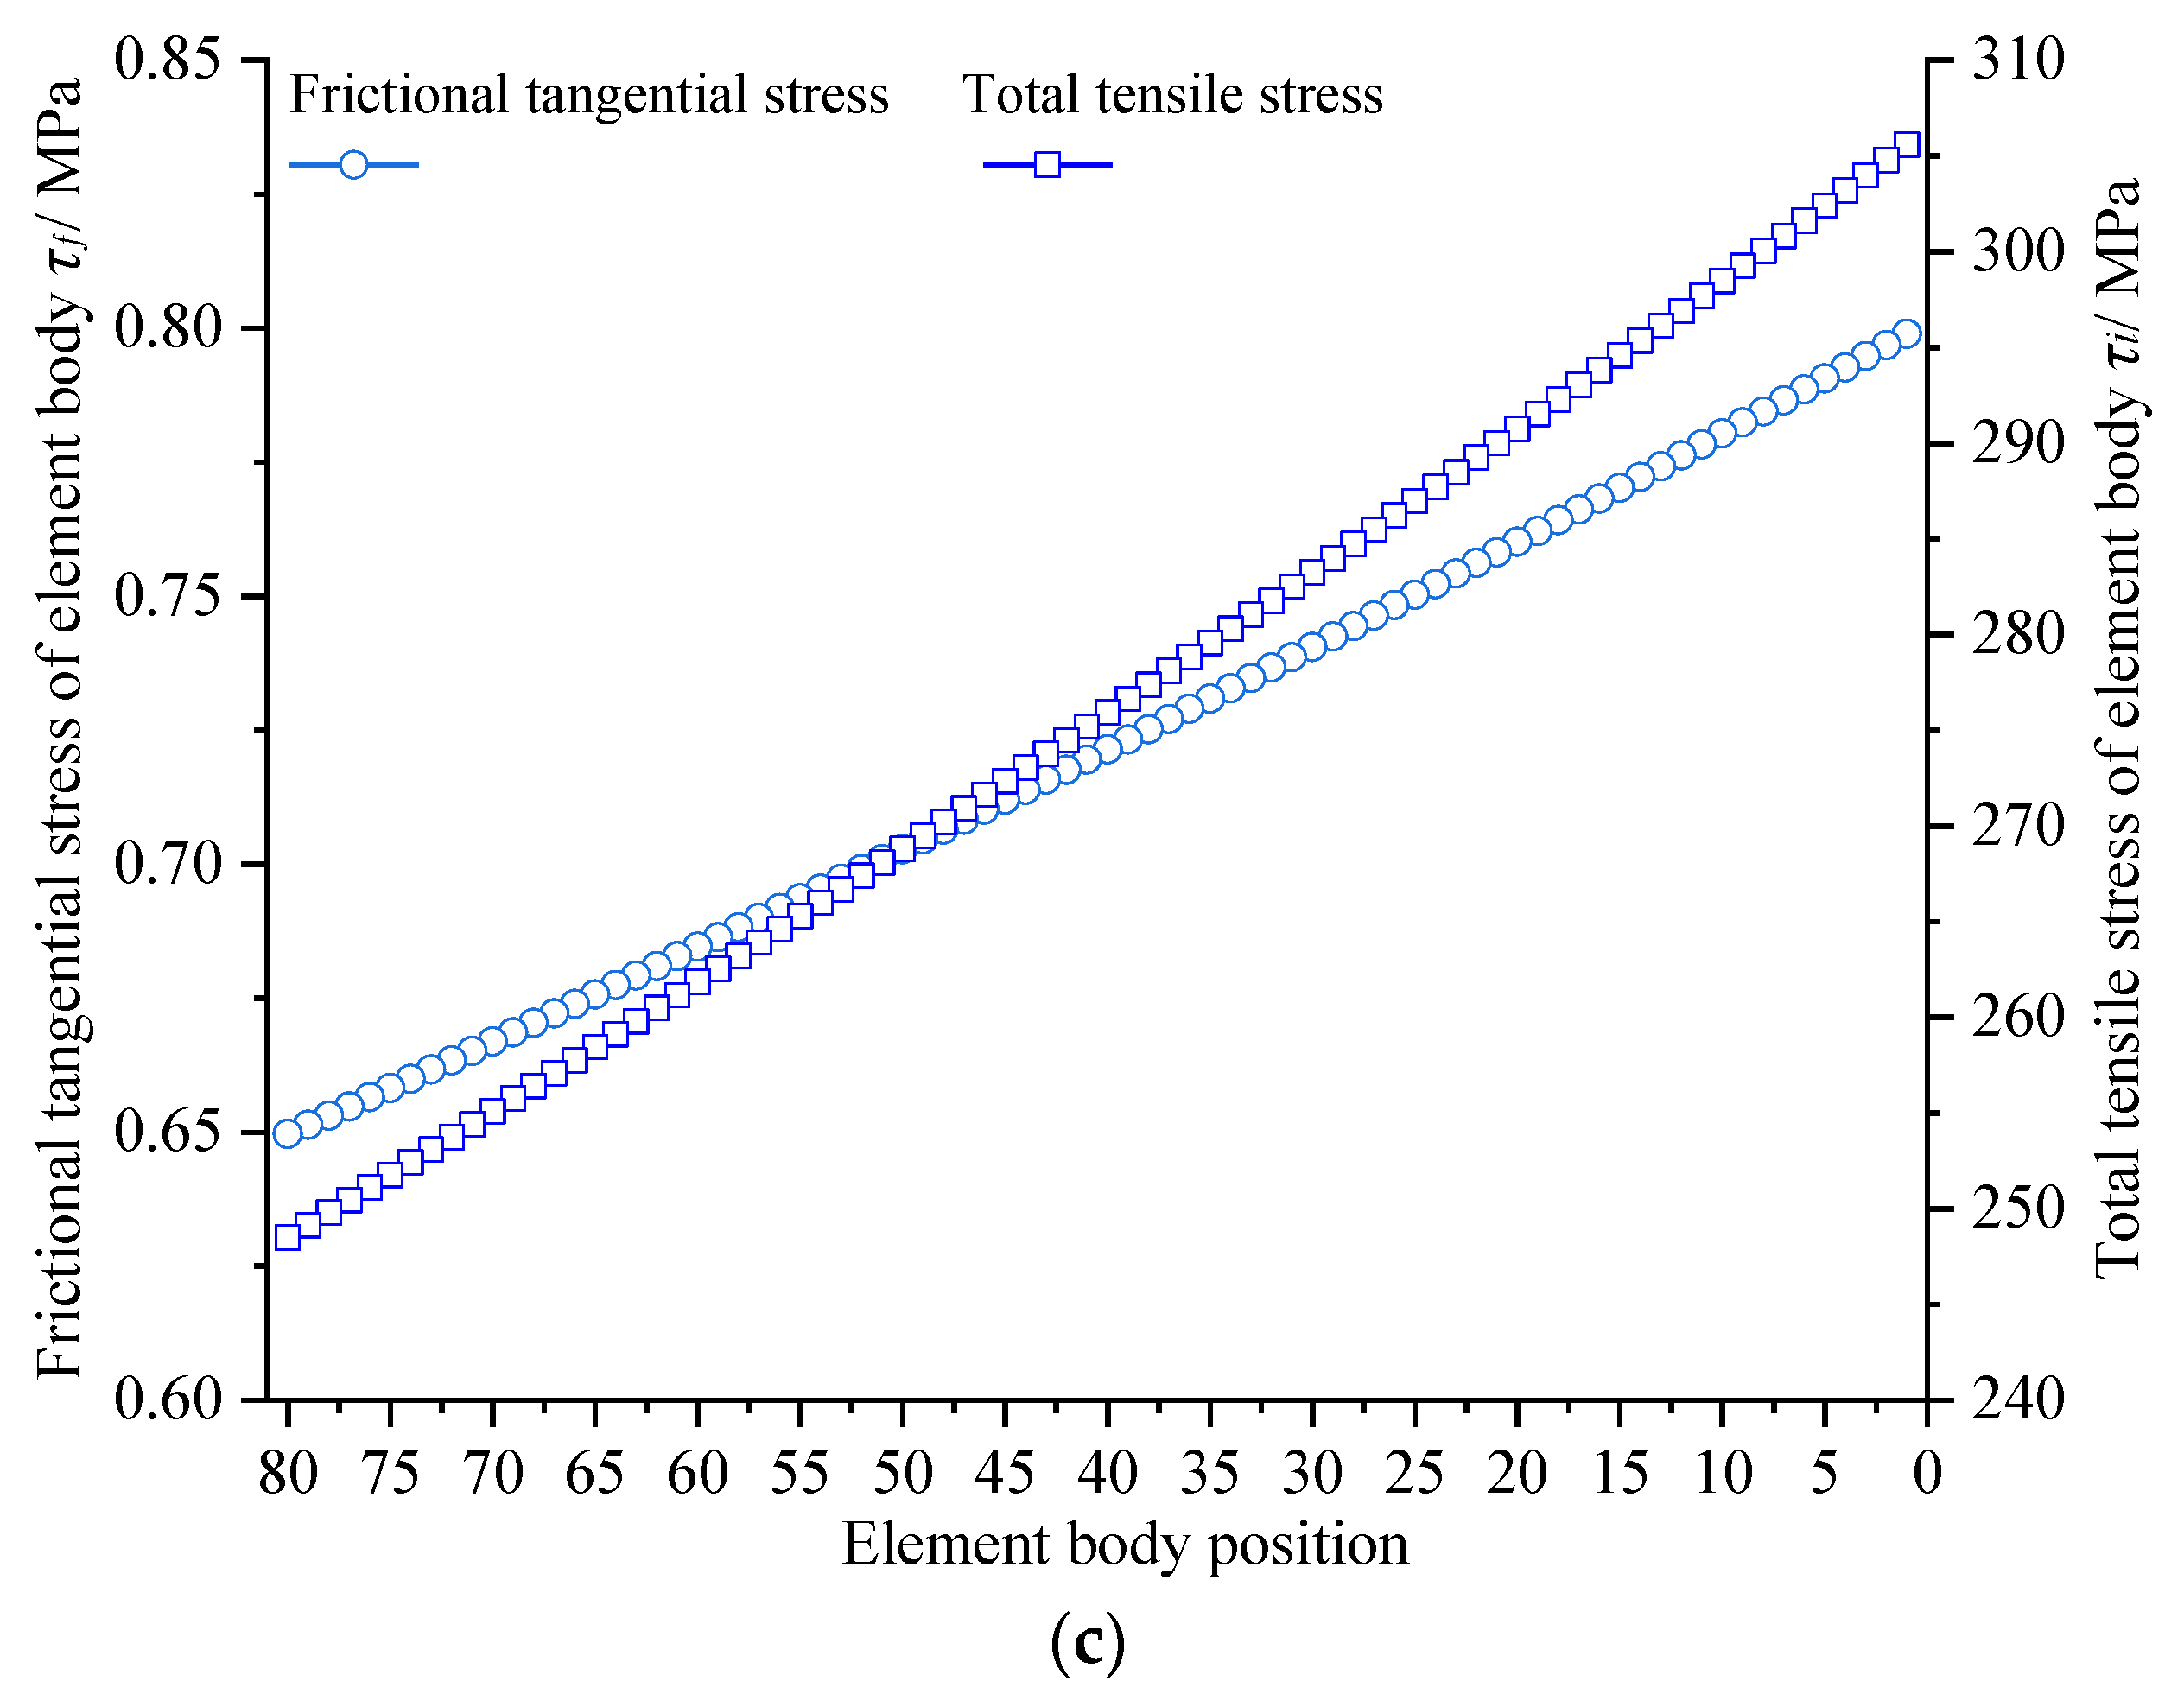
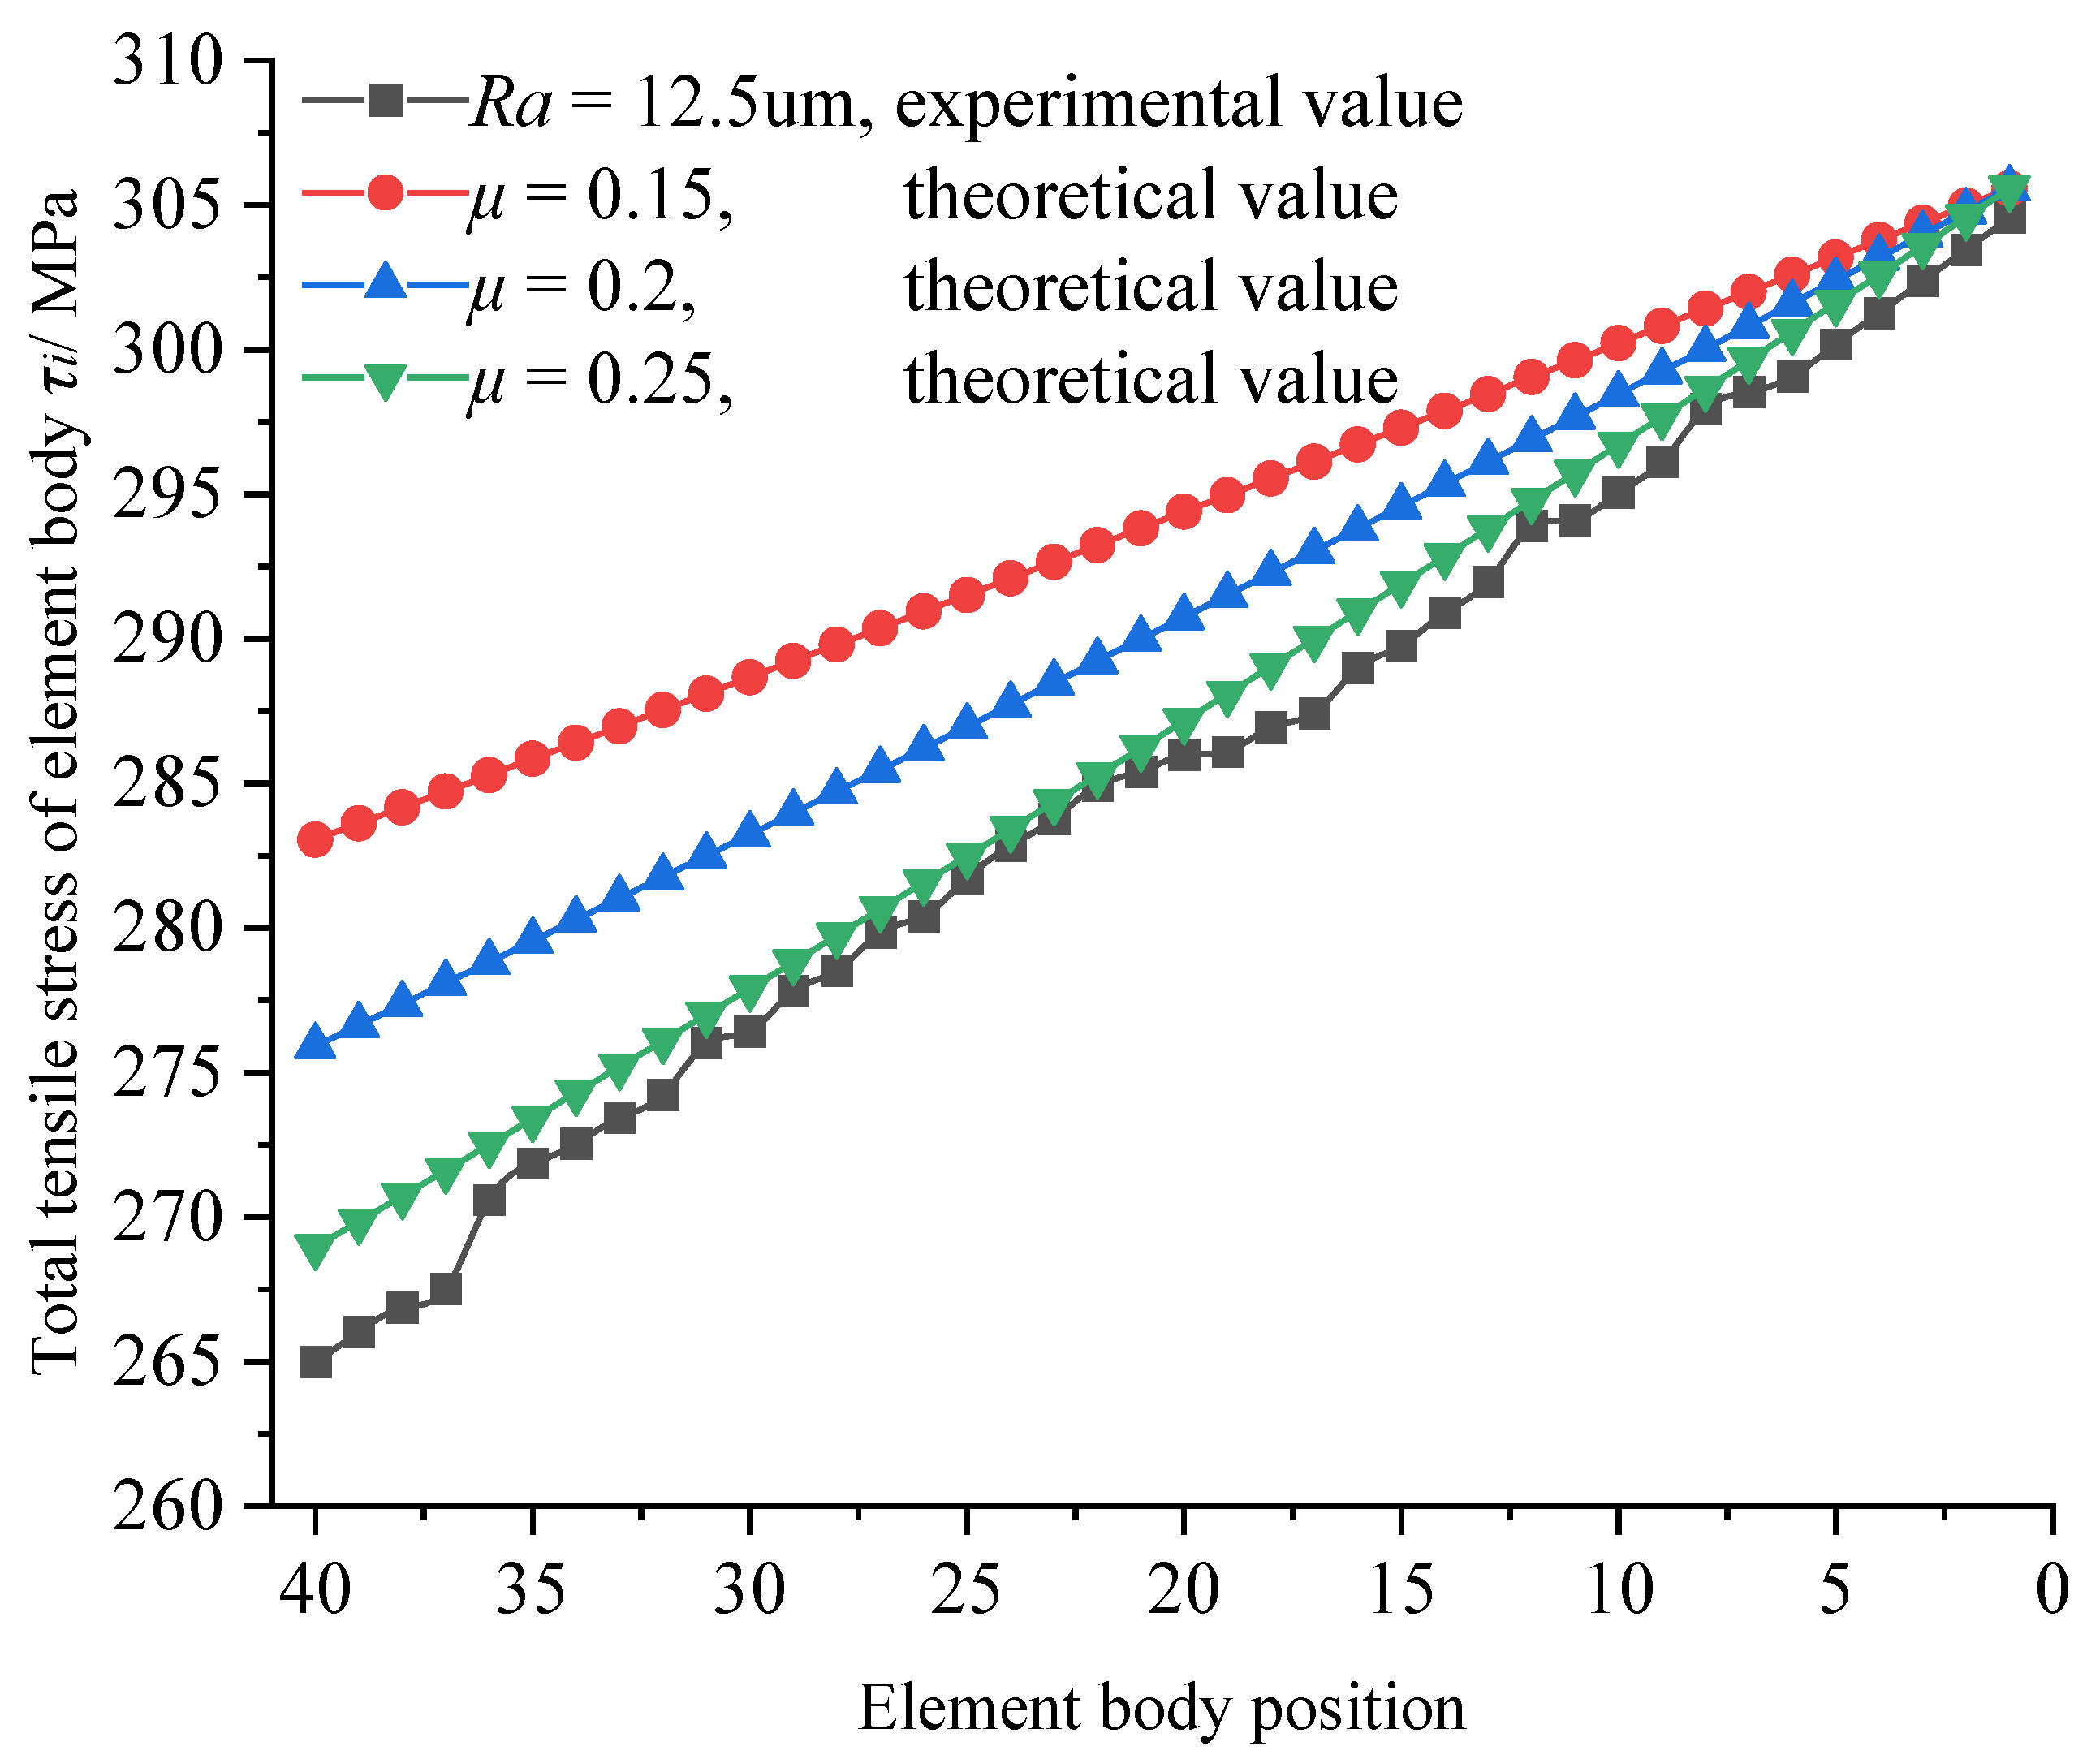
- The frictional shear stress of the discrete units in the contact mold segment was opposite to the tensile stress, and the cumulative superposition in the length direction of the specimen caused the uneven distribution of tensile stress. Generally, the larger the friction coefficient, the farther the micro-unit is away from the action point and the smaller the tensile stress on the micro-unit.
- (2)
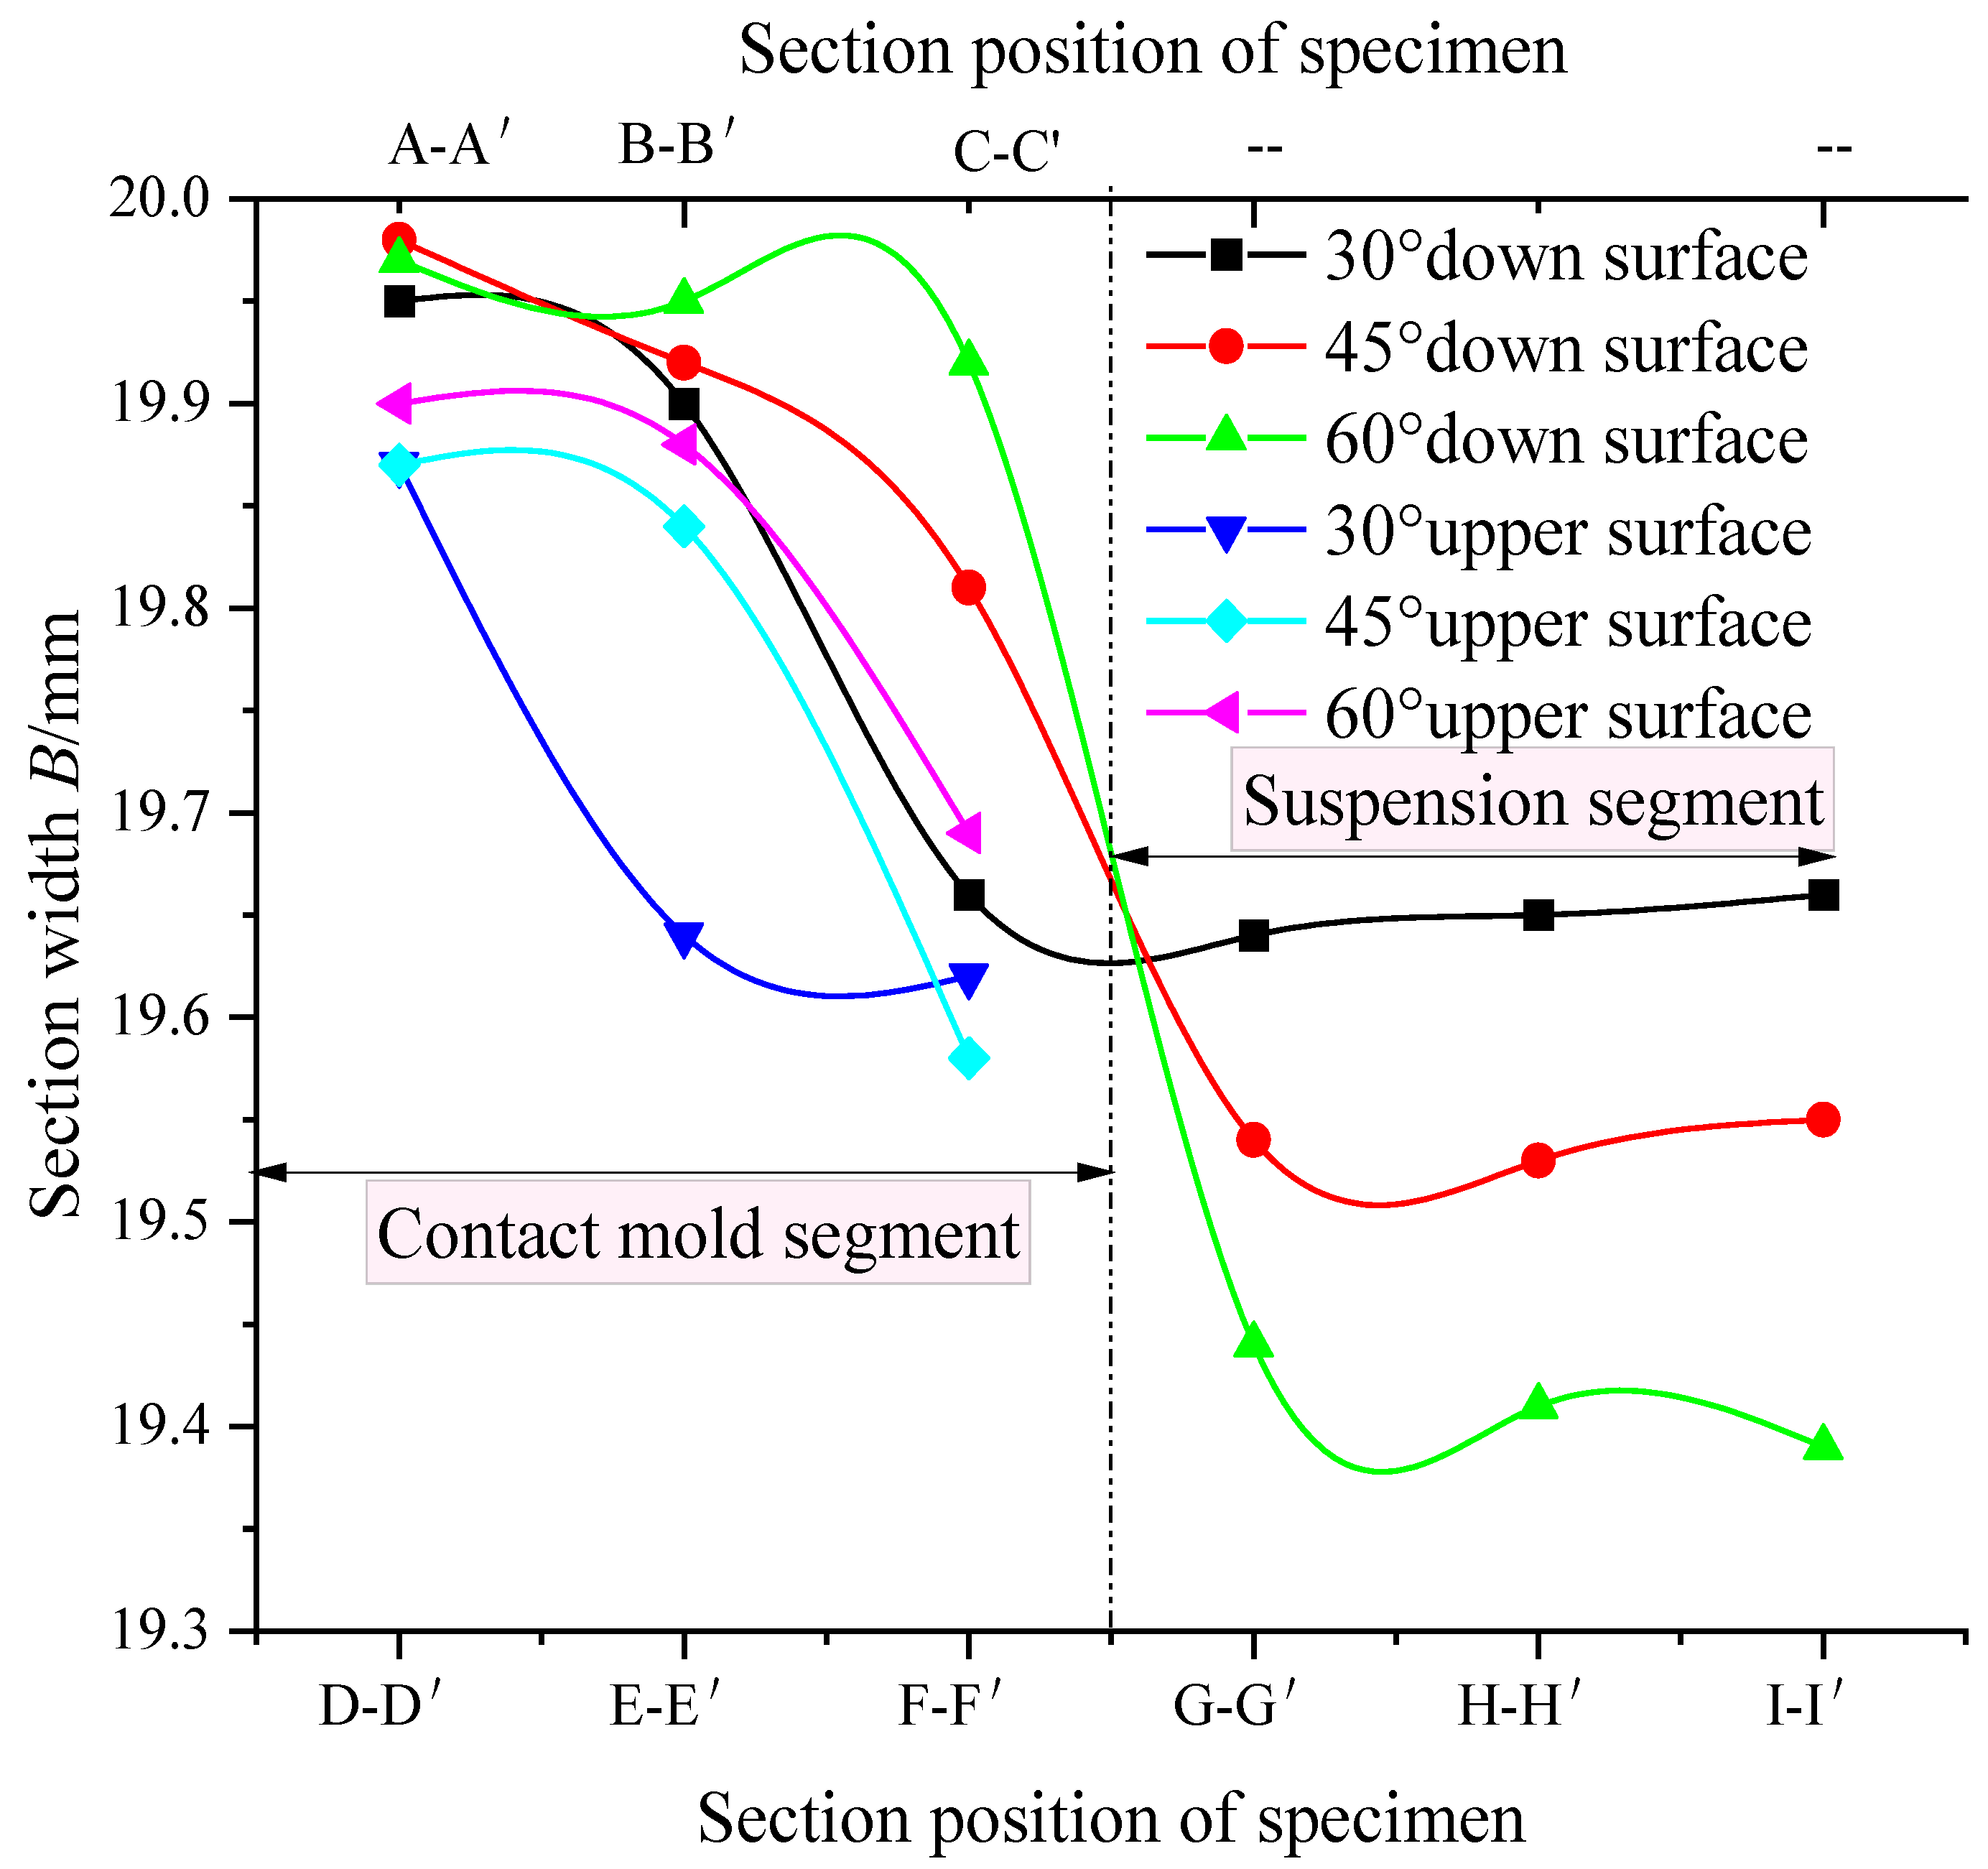
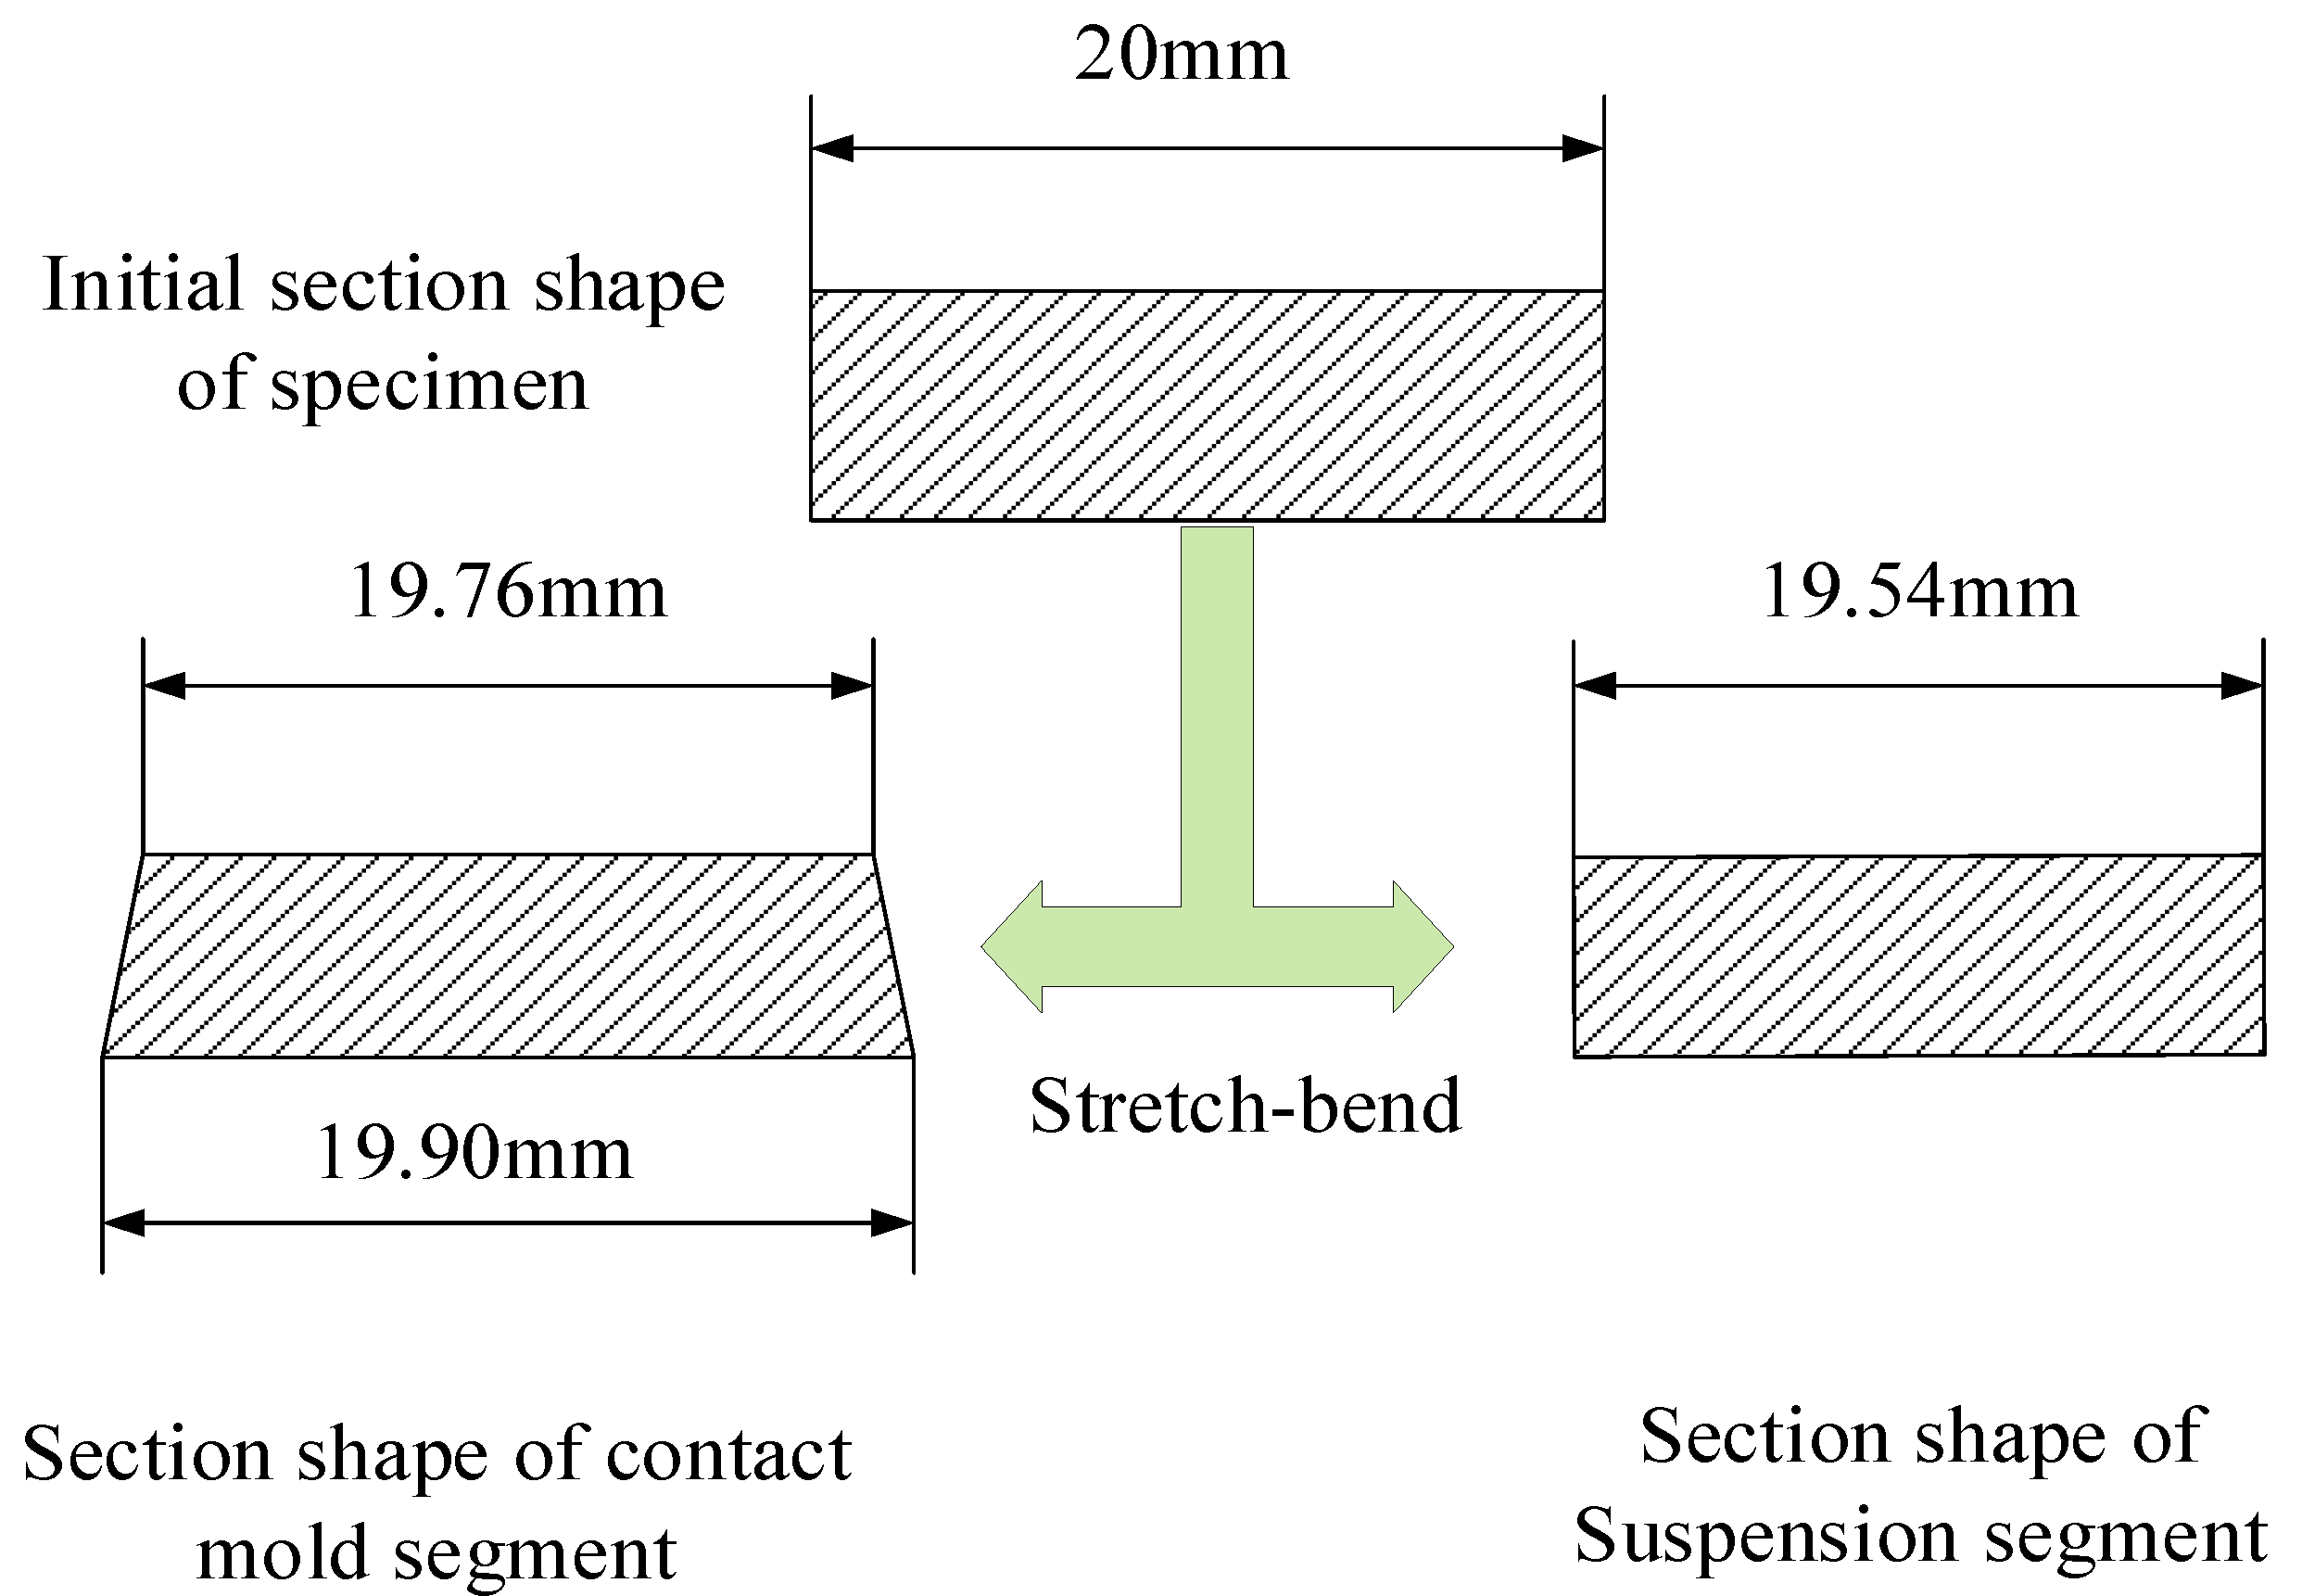
- The tensile stress of the contact mold segment gradually decreased from top to bottom along the thickness direction. The plastic deformation of the upper surface was greater than that of the lower surface, and the cross-section shape of the contact mold segment after stretch-bend forming was a trapezoid. The tensile stress and strain in the cross-section of the contact mold segment of the stretch-bend specimen were distributed in a trapezoid shape the cross-section, and the plastic deformation of the upper surface of the section was larger than that on the lower surface. As a result, the cross-section shape of the contact mold segment was trapezoidal after stretch-bend forming.
- (3)
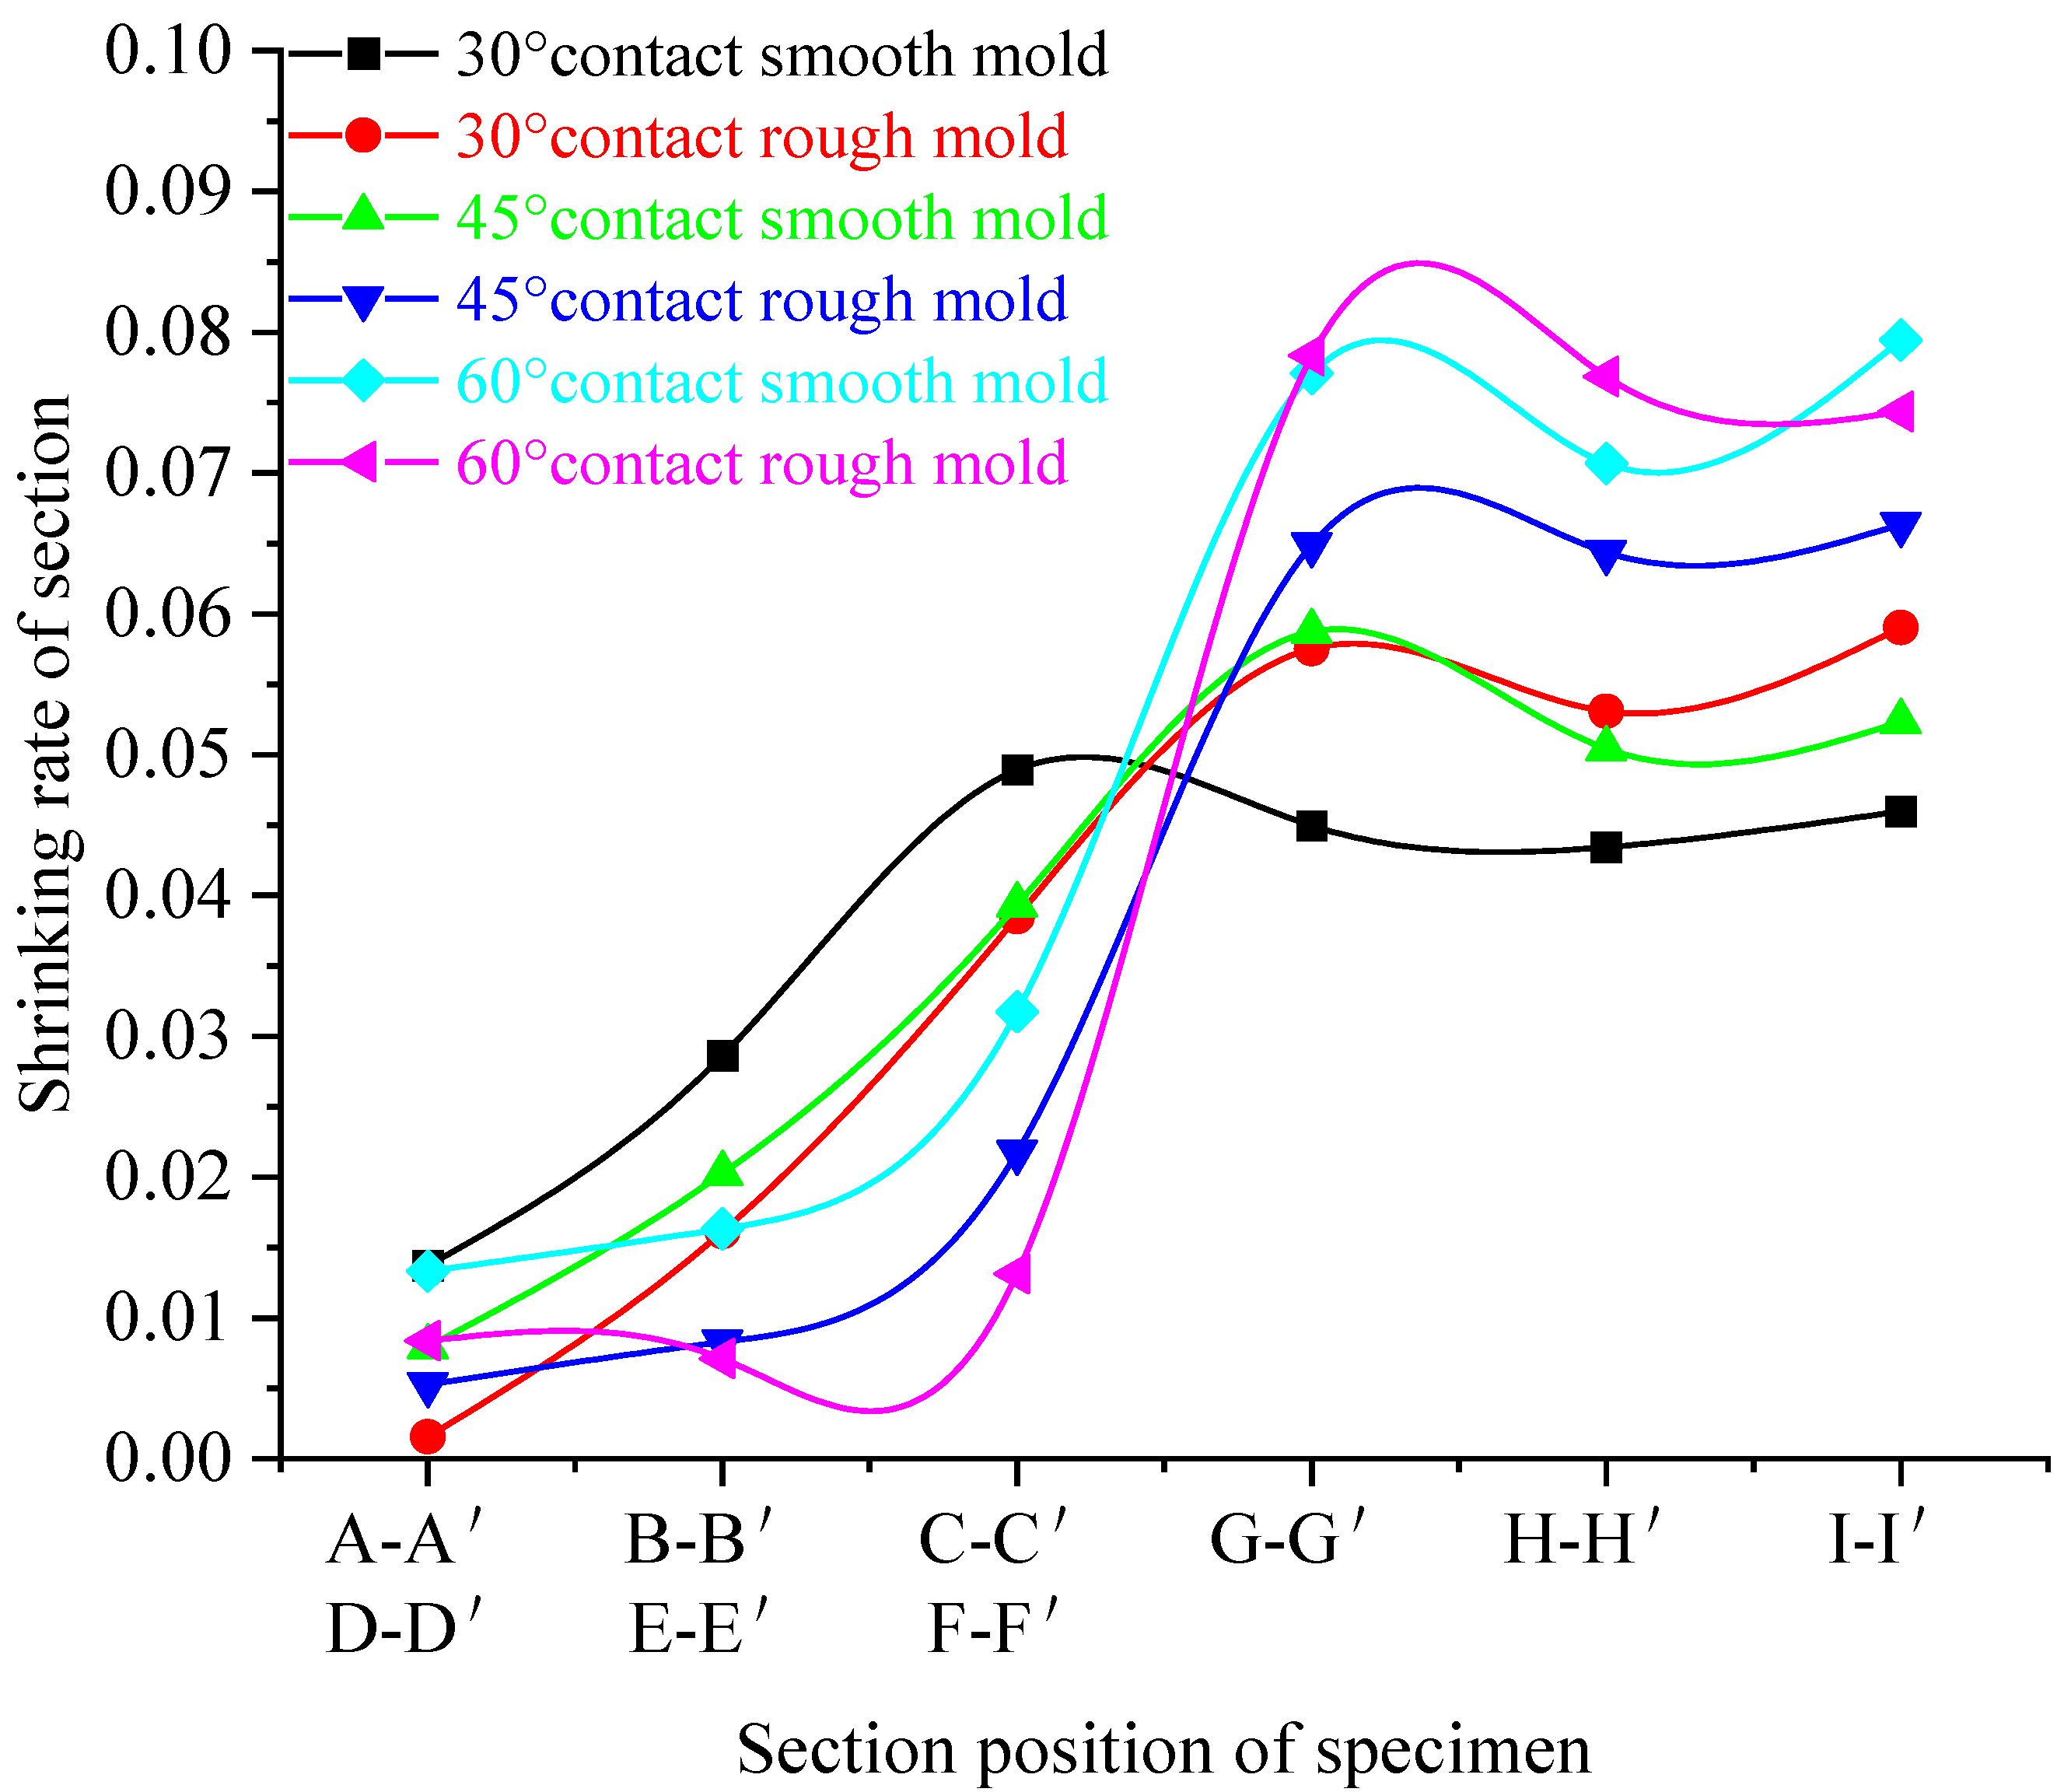
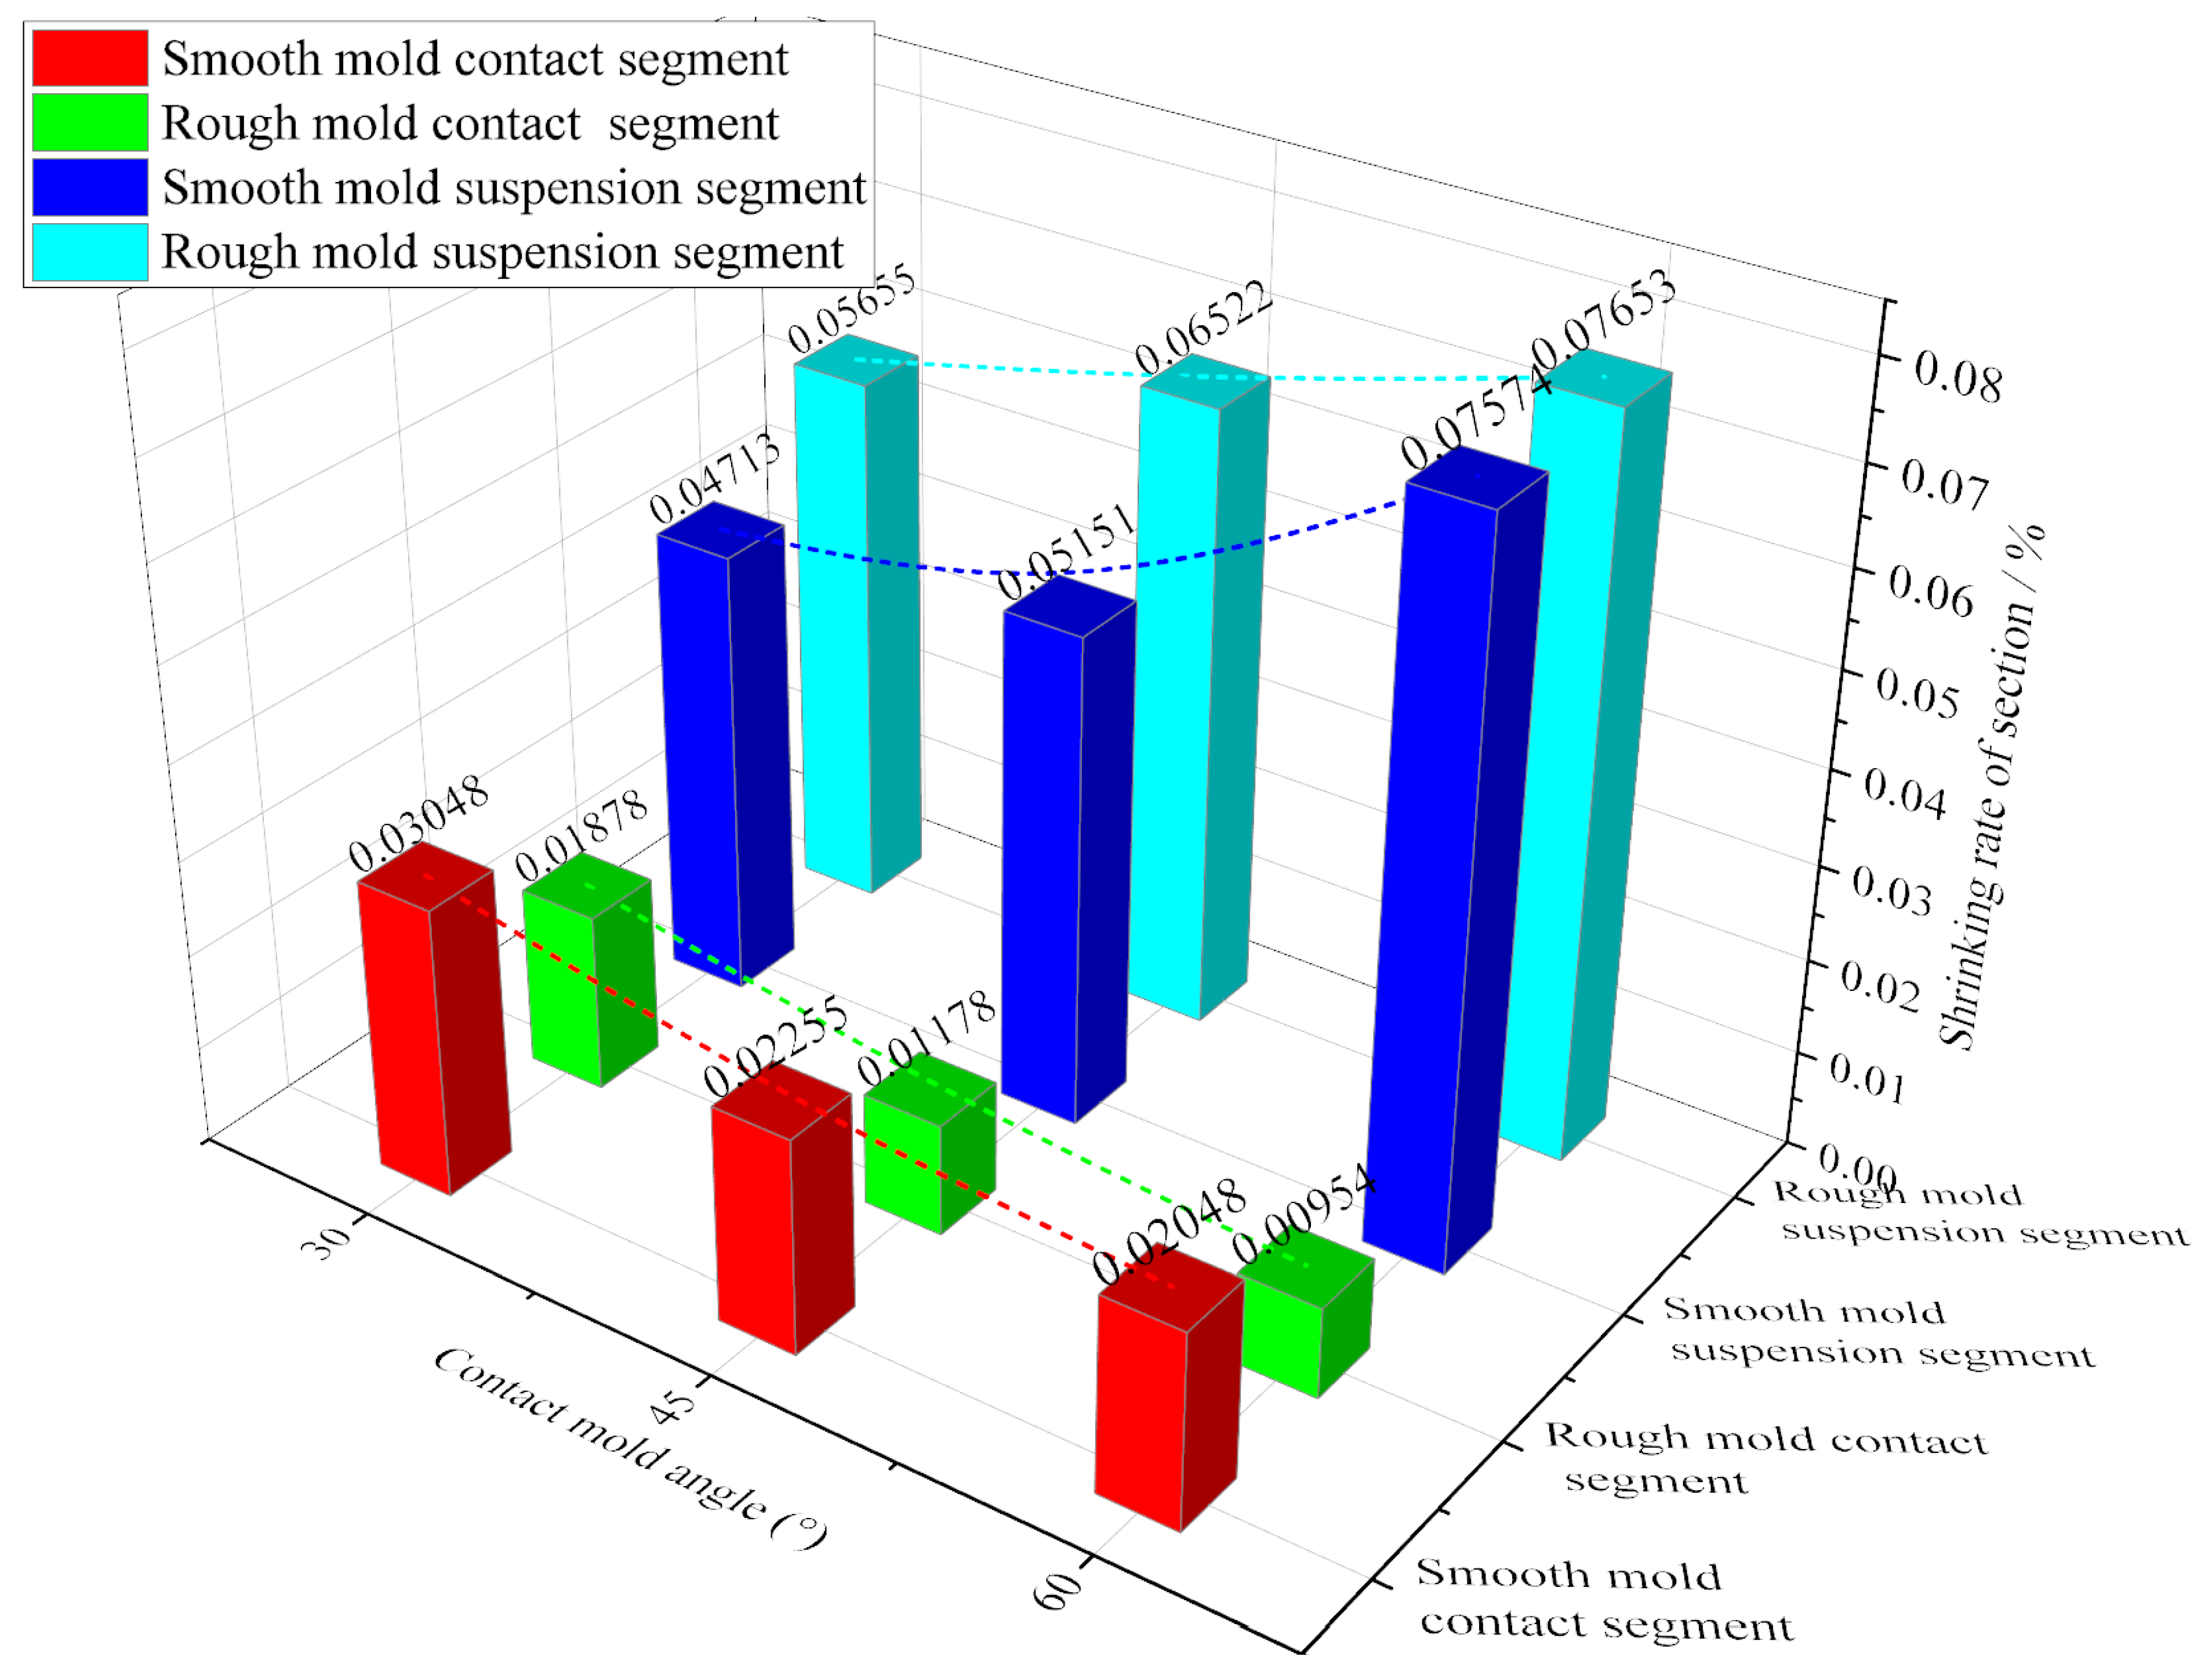
- In terms of the stretch-bend of the smooth mold compared with the rough mold, the cross-section shrinkage of the contact mold segment increased by more than 38.2%, and the elongation of the contact mold segment increased by more than 32.3%. The greatest effective factor of the specimen plastic deformation is the friction state of the contact interface. Generally, the better the friction state of the contact interface, the higher the cross-sectional shrinkage and elongation of the contact mold segment, and the smaller the tensile deformation gradient, and the smaller the cross-section shrinkage and elongation of the suspension segment. In order to improve the plastic deformation uniformity of the contact mold segment, the mold surface can be properly treated to reduce the friction coefficient.
- (4)
- When the contact mold angle increased from 30° to 60°, the cross-section shrinkage of the contact mold segment decreased by more than 32.8%, and the elongation of the contact mold segment decreased by more than 39.9%. With the increase of the contact mold angle, the total amount of frictional shear stress and the tensile stress difference of both sides increased, the cross-section shrinkage and elongation of the contact mold segment decreased, and the cross-section shrinkage and elongation of the suspension segment increased. Therefore, reducing the angle of the contact mold can effectively control the influence of friction shear stress on plastic deformation.
Author Contributions
Funding
Institutional Review Board Statement
Informed Consent Statement
Data Availability Statement
Conflicts of Interest
References
- Xiong, J.; Shen, Z. Rise and future development of Chinese high-speed railway. J. Traffic Transp. Eng. 2021, 21, 6–29. [Google Scholar] [CrossRef]
- Ding, S.; Chen, D.; Liu, J. Research development and prospect of China high-speed train. Chin. J. Theor. Appl. Mech. 2021, 53, 35–50. [Google Scholar] [CrossRef]
- Xu, H.; Liu, M.; Guo, Z.; Zou, Y.; Lu, R.; Gu, Z.; Cheng, X. Accuracy control of stretch bending for variable curvature L-section aluminum alloy door column of EMU. J. Harbin Inst. Technol. 2021, 53, 77–83. [Google Scholar] [CrossRef]
- Zhai, R.; Ding, X.; Yu, S.; Wang, C. Stretch bending and springback of profile in the loading method of prebending and tension. Int. J. Mech. Sci. 2018, 144, 746–764. [Google Scholar] [CrossRef]
- Xiang, N.; Shu, Y.; Wang, P.; Huang, T.; Guo, X.; Guo, J.; Chen, X.; Chen, F. Improved forming accuracy through controlling localized sheet metal deformation in the friction-assisted stretch bending process. Int. J. Adv. Manuf. Technol. 2021, 116, 3635–3650. [Google Scholar] [CrossRef]
- Ma, J.; Welo, T.; Blindheim, J.; Ha, T. Effect of Stretching on Springback in Rotary Stretch Bending of Aluminium Alloy Profiles. Key Eng. Mater. 2021, 883, 175–180. [Google Scholar] [CrossRef]
- Welo, T.; Ma, J.; Blindheim, J.; Ha, T.; Ringen, G. Flexible 3D stretch bending of aluminium alloy profiles: An experimental and numerical study. Procedia Manuf. 2020, 50, 37–44. [Google Scholar] [CrossRef]
- Liang, J.; Liao, Y.; Li, Y.; Liang, C. Study on the Influence of Bending Angle of Multipoint Stretch-Bending of Profiles on Section Distortion of Parts. Math. Probl. Eng. 2020, 2020, 1975805. [Google Scholar] [CrossRef] [Green Version]
- Chen, C.; Liang, J.; Li, Y.; Liang, C.; Jin, W. Springback Analysis of Flexible Stretch Bending of Multi-Point Roller Dies Process for Y-Profile under Different Process Parameters. Metals 2021, 11, 646. [Google Scholar] [CrossRef]
- Liu, T.; Wang, Y.; Wu, J.; Xia, X.; Wang, J.; Wang, W.; Wang, S. Springback analysis of Z & T-section 2196-T8511 and 2099-T83 Al–Li alloys extrusions in displacement controlled cold stretch bending. J. Mater. Process. Technol. 2015, 225, 295–309. [Google Scholar] [CrossRef]
- Liu, C.-G.; Zhang, X.-G.; Wu, X.-T.; Zheng, Y. Optimization of post-stretching elongation in stretch bending of aluminum hollow profile. Int. J. Adv. Manuf. Technol. 2015, 82, 1737–1746. [Google Scholar] [CrossRef]
- Liu, B.; Cao, F.; Zeng, Y.; Wu, W. Numerical and experimental study on temperature and springback control of U-shape titanium extrusion hot stretch bending. Int. J. Light. Mater. Manuf. 2022, 5, 453–469. [Google Scholar] [CrossRef]
- Ma, J.; Welo, T. Analytical springback assessment in flexible stretch bending of complex shapes. Int. J. Mach. Tools Manuf. 2020, 160, 103653. [Google Scholar] [CrossRef]
- Maati, A.; Tabourot, L.; Balland, P.; Ouakdi, E.; Vautrot, M.; Ksiksi, N. Constitutive modelling effect on the numerical prediction of springback due to a stretch-bending test applied on titanium T40 alloy. Arch. Civ. Mech. Eng. 2015, 15, 836–846. [Google Scholar] [CrossRef]
- Uemori, T.; Naka, T.; Tada, N.; Yoshimura, H.; Katahira, T.; Yoshida, F. Theoretical predictions of fracture and springback for high tensile strength steel sheets under stretch bending. Procedia Eng. 2017, 207, 1594–1598. [Google Scholar] [CrossRef]
- Gu, Z.; Lv, M.; Li, X.; Xu, H. Stretch bending defects control of L-section aluminum components with variable curvatures. Int. J. Adv. Manuf. Technol. 2015, 85, 1053–1061. [Google Scholar] [CrossRef]
- Han, S. Influence of Frictional Behavior Depending on Contact Pressure on Springback at U Draw Bending. Trans. Mater. Process. 2011, 20, 344–349. [Google Scholar] [CrossRef] [Green Version]
- Fox, R.T.; Maniatty, A.M.; Lee, D. Determination of friction coefficient for sheet materials under stretch-forming conditions. Met. Mater. Trans. A 1989, 20, 2179–2182. [Google Scholar] [CrossRef]
- Liu, K.X.; Liu, Y.L.; Yang, H. An analytical model for the collapsing deformation of thin-walled rectangular tube in rotary draw bending. Int. J. Adv. Manuf. Technol. 2013, 69, 627–636. [Google Scholar] [CrossRef]
- Liu, K.; Liu, Y.; Yang, H. Experimental and FE simulation study on cross-section distortion of rectangular tube under multi-die constraints in rotary draw bending process. Int. J. Precis. Eng. Manuf. 2014, 15, 633–641. [Google Scholar] [CrossRef]
- Liu, K.; Liu, Y.; Yang, H. Experimental study on the effect of dies on wall thickness distribution in NC bending of thin-walled rectangular 3A21 aluminum alloy tube. Int. J. Adv. Manuf. Technol. 2013, 68, 1867–1874. [Google Scholar] [CrossRef]
- Guan, Y.; Zhao, J.; Wang, F.; Ma, L. Influence of friction on springback of plate tension-bending. J. Plast. Eng. 2003, 10, 43–45. [Google Scholar] [CrossRef]
- Yang, H.; Li, H.; Zhan, M. Friction role in bending behaviors of thin-walled tube in rotary-draw-bending under small bending radii. J. Mater. Process. Technol. 2010, 210, 2273–2284. [Google Scholar] [CrossRef]
- Zhang, Z.; Yang, Y.; Li, L.; Yin, J. Distribution of residual stress in an asymmetric T-section beam by stretch-bending. Int. J. Mech. Sci. 2019, 164, 105184. [Google Scholar] [CrossRef]
- Muranaka, T.; Fujita, Y.; Otsu, M.; Haraguchi, O. Development of rubber-assisted stretch bending method for improving shape accuracy. Procedia Manuf. 2018, 15, 709–715. [Google Scholar] [CrossRef]
- Liang, J.; Han, C.; Li, Y.; Yu, K.; Liang, C. Study on deformation difference between the contact zone and the non-contact zone of the flexible 3D stretch bending profile and roller dies based on pre-stretching amount. Int. J. Adv. Manuf. Technol. 2020, 108, 3579–3589. [Google Scholar] [CrossRef]
- Hambleton, J.; Drescher, A. On modeling a rolling wheel in the presence of plastic deformation as a three- or two-dimensional process. Int. J. Mech. Sci. 2009, 51, 846–855. [Google Scholar] [CrossRef]
- Bobrovskij, I.; Khaimovich, A.; Bobrovskij, N.; Travieso-Rodriguez, J.A.; Grechnikov, F. Derivation of the Coefficients in the Coulomb Constant Shear Friction Law from Experimental Data on the Extrusion of a Material into V-Shaped Channels with Different Convergence Angles: New Method and Algorithm. Metals 2022, 12, 239. [Google Scholar] [CrossRef]
- Song, P.; Li, W.; Wang, X. A Study on Dynamic Plastic Deformation Behavior of 5052 Aluminum Alloy. Key Eng. Mater. 2019, 812, 45–52. [Google Scholar] [CrossRef]
- TS EN ISO 6892-1-2019; Metallic Materials. Tensile Testing. Part 1: Method of Test at Room Temperature (ISO 6892-1-2019). ISO: Geneva, Switzerland, 2019. Available online: https://www.iso.org/standard/78322.html (accessed on 29 June 2022).
- Bachchhav, B.; Bagchi, H. Effect of surface roughness on friction and lubrication regimes. Mater. Today Proc. 2020, 38, 169–173. [Google Scholar] [CrossRef]
- Zhang, S.; Lv, G.; Ma, F.; Wang, Z.; Liu, Y. Influence of low-frequency vibration on friction coefficient of contact interface in bend-stretch forming. Int. J. Light. Mater. Manuf. 2022, 5, 306–314. [Google Scholar] [CrossRef]


| Tension F/kN | Bend Angle θ/° | Friction Coefficients μ | Bending Radius R/mm | Section Width L/mm |
|---|---|---|---|---|
| 30 | 30 | 0.15, 0.2, 0.25 | 150 | 20 |
| 30 | 30, 45, 60 | 0.2 | 150 | 20 |
| Si | Mg | Fe | Cu | Mn | Cr | Ti | Zn |
|---|---|---|---|---|---|---|---|
| 0.5–0.9 | 0.4–0.7 | 0.35 | 0.3 | 0.5 | 0.3 | 0.1 | 0.2 |
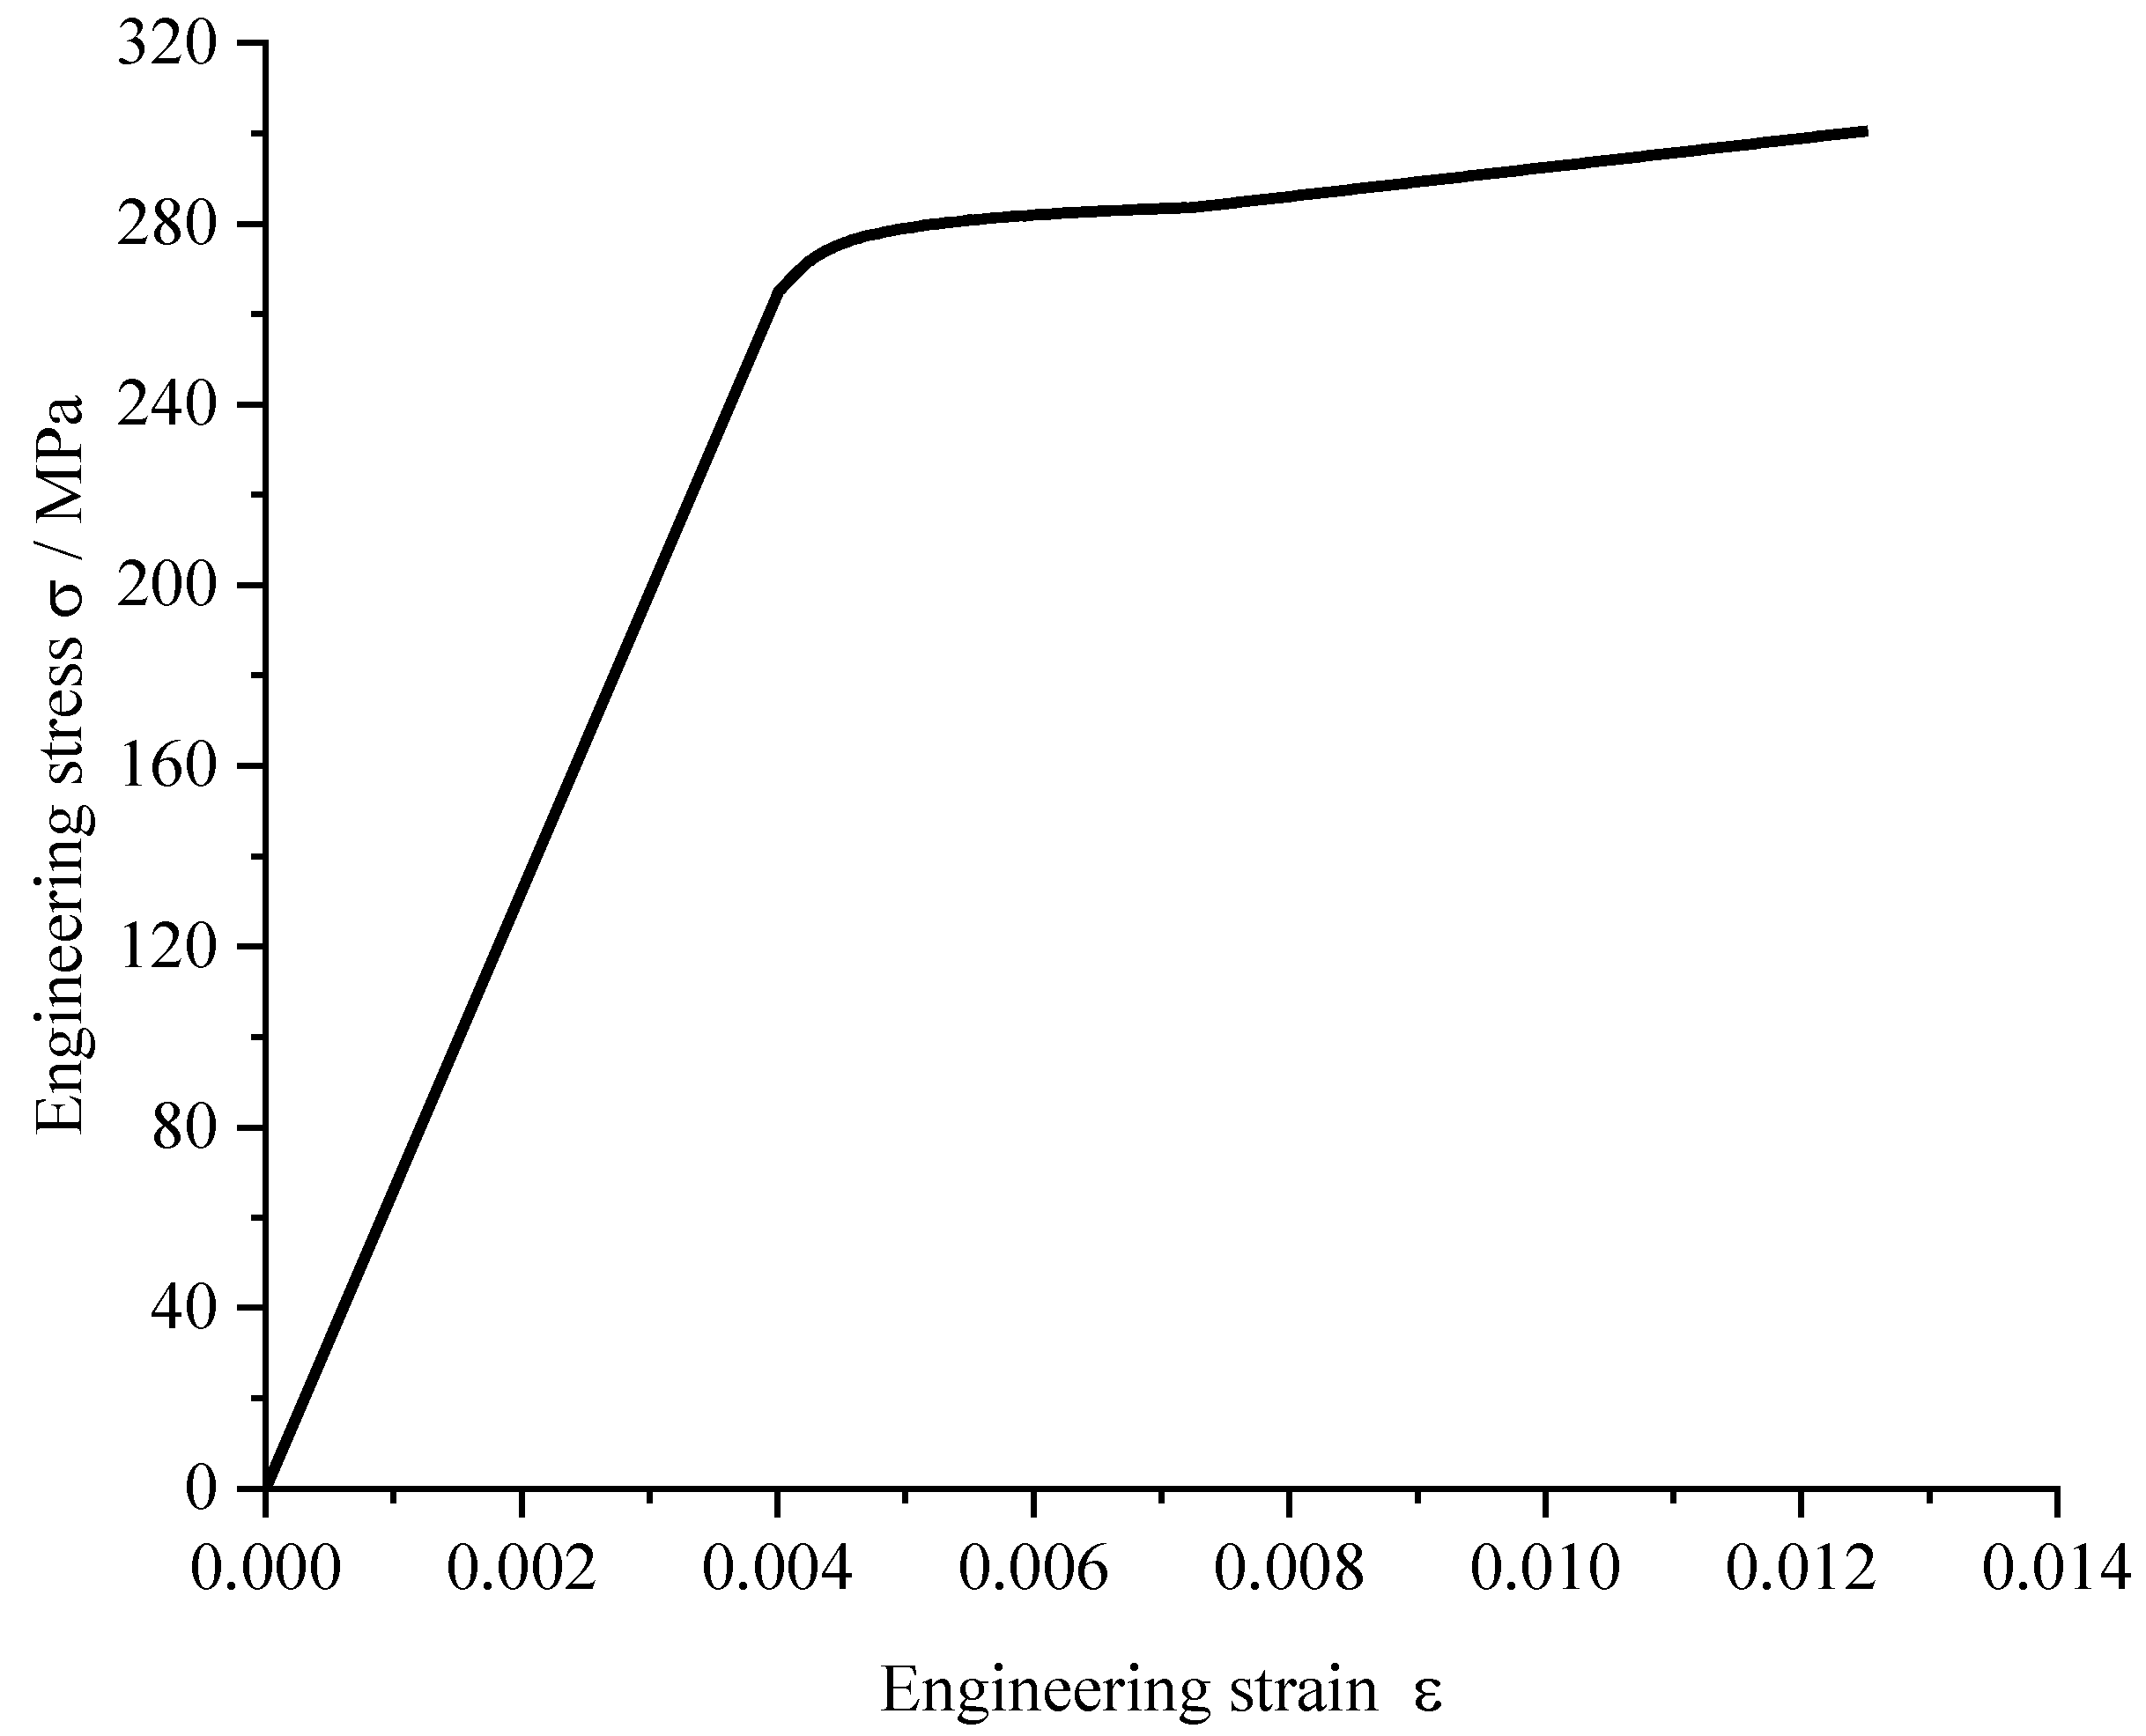
| Extension Percentage/% | Yield Strength/MPa | Tensile Strength/MPa | Elastic Modulus/GPa | Poisson Ratio | Tension Rupture/kN |
|---|---|---|---|---|---|
| 17 | 282.2 ± 1.1288 | 300.5 ± 1.202 | 66.77 ± 0.26708 | 0.3 | 29.53 ± 0.11812 |
| Contact Mold Angle θ/° | Specimen Length L/mm | Contact Mold Length L1/mm | Suspension Length L2/mm | Clamping Length L4/mm | Section Width B/mm | Section Thickness H/mm |
|---|---|---|---|---|---|---|
| 30 | 280 ± 0.01 | 80 | 100 | 100 | 20 ± 0.01 | 5 ± 0.01 |
| 45 | 320 ± 0.01 | 120 | 100 | 100 | 20 ± 0.01 | 5 ± 0.01 |
| 60 | 360 ± 0.01 | 160 | 100 | 100 | 20 ± 0.01 | 5 ± 0.01 |
| Condition | Mold Surface Roughness Ra/um | Contact Angle θ/° | Specimen Length L/mm | Stretching Value ∆L/mm |
|---|---|---|---|---|
| 1 | 6.3 | 30 | 280 ± 0.01 | 12 ± 0.0001 |
| 2 | 12.5 | 30 | 280 ± 0.01 | 12 ± 0.0001 |
| 3 | 6.3 | 45 | 320 ± 0.01 | 14 ± 0.0001 |
| 4 | 12.5 | 45 | 320 ± 0.01 | 14 ± 0.0001 |
| 5 | 6.3 | 60 | 360 ± 0.01 | 16 ± 0.0001 |
| 6 | 12.5 | 60 | 360 ± 0.01 | 16 ± 0.0001 |
Publisher’s Note: MDPI stays neutral with regard to jurisdictional claims in published maps and institutional affiliations. |
© 2022 by the authors. Licensee MDPI, Basel, Switzerland. This article is an open access article distributed under the terms and conditions of the Creative Commons Attribution (CC BY) license (https://creativecommons.org/licenses/by/4.0/).
Share and Cite
Zhang, S.; Lv, G.; Ma, F.; Wang, Z.; Liu, Y. Influence of Contact Interface Friction on Plastic Deformation of Stretch-Bend Forming. Coatings 2022, 12, 1043. https://doi.org/10.3390/coatings12081043
Zhang S, Lv G, Ma F, Wang Z, Liu Y. Influence of Contact Interface Friction on Plastic Deformation of Stretch-Bend Forming. Coatings. 2022; 12(8):1043. https://doi.org/10.3390/coatings12081043
Chicago/Turabian StyleZhang, Shengfang, Guangming Lv, Fujian Ma, Ziguang Wang, and Yu Liu. 2022. "Influence of Contact Interface Friction on Plastic Deformation of Stretch-Bend Forming" Coatings 12, no. 8: 1043. https://doi.org/10.3390/coatings12081043