Article

Corrosion Behavior and Sacrificial Properties of Zn and Zn-Al Coatings in Conditions Simulating Deep Geological Disposal of Radioactive Waste at 80 °C

1
LaSIE, UMR 7356 CNRS—La Rochelle Université, Bâtiment Marie Curie, Avenue Michel Crépeau, 17000 La Rochelle, France
2
Andra, Parc de la Croix Blanche, 1/7 Rue Jean Monnet, F-92298 Châtenay-Malabry, France
*
Author to whom correspondence should be addressed.
Coatings 2022, 12(8), 1044; https://doi.org/10.3390/coatings12081044
Submission received: 7 June 2022 / Revised: 1 July 2022 / Accepted: 20 July 2022 / Published: 23 July 2022
(This article belongs to the Section Corrosion, Wear and Erosion)

Abstract

:
In France, it is planned to manage high-level radioactive waste via deep geological disposal. The carbon steel overpacks containing the waste will face corrosion processes specific to the unusual environment of the disposal. To protect these overpacks against corrosion, the use of metallic sacrificial coatings was considered as a possible solution. Therefore, the corrosion behavior of thermally sprayed Zn and Zn-15wt.%Al coatings (500 µm thick) was studied in a solution simulating the specific environment of the disposal. Galvanic corrosion experiments were performed with a coated steel electrode connected to a bare steel one, which simulated a coating defect. First, it was observed that the Zn coating had lost its sacrificial properties after ~2 months of coupling. XRD and µ-Raman analysis carried out after the experiment demonstrated that the coating was covered with a protective hemimorphite (Zn4Si2O7(OH)2·H2O)-rich layer. In contrast, the Zn-15wt.%Al coating kept its sacrificial properties all along the 6-month experiment. It proved to be covered with a layer mainly composed of Zn and Zn-Al hydroxysulfates, which did not contain hemimorphite. However, SEM cross-sectional observations showed that the electrolyte had seeped into the coating and had even reached the steel surface. This infiltration led to the oxidation of the splats inside the coating, even close to the steel surface, and induced a large swelling of the coating. Its thickness was increased by 50%.

1. Introduction

For high-level waste mainly originating from the nuclear industry and especially from the reprocessing of the nuclear spent fuel, the French National Radioactive Waste Management Agency (Andra) plans on using a deep geological disposal site [1]. The corresponding project, called Cigéo, involves the drilling of horizontal tunnels in a Callovo-Oxfordian claystone formation (~500 m deep). To allow future possible recovery of the waste, a carbon steel casing is to be inserted inside these tunnels. A cement grout will be injected between the casing and the claystone to counter the effects of the expected acidification of the surrounding claystone pore water. Stainless steel containers filled with vitrified waste will be set in carbon steel overpacks, and the overpacks will be finally stacked in the carbon steel casing. A high temperature (max. 90 °C) is expected at the overpacks surface due to the intense radioactivity of the waste. The overpacks must prevent any contact between the glass matrix and the surrounding pore water as long as the temperature has not decreased down to ~50 °C [2].
Various anticorrosion methods are currently considered to protect the carbon steel overpacks (or at least critical parts), among which is the use of sacrificial metallic coatings. Such coatings, mainly Zn, Al, or Zn-Al alloys, were already extensively studied with respect to atmospheric corrosion or marine corrosion. According to various works, the Zn-15 wt.%Al alloy is in most cases more efficient than pure Zn or Al [3,4,5,6]. However, the corrosion behavior of Zn, Al, or Zn-Al alloys was never studied in the conditions of radioactive waste management described above. Given the composition of the cement grout envisaged by Andra at the beginning of the present study, the electrolyte in contact with the carbon steel overpacks of Cigéo would be alkaline with a pH of about 10–10.5. The geochemical modelling of the interactions between cement grout and pore water of surrounding claystone led to the composition given in Table 1. The corresponding electrolyte is referred to as “solution 15”. The chloride and sulfate concentrations are higher than 10−2 mol L−1 while the carbonate and silicate concentrations are higher than 10−3 mol L−1. “Solution 15” moreover contains sulfide species as well as Ca2+ and Al3+ cations (in addition to Na+).
Literature data can give some hints about the possible behavior of Zn-based coatings in the conditions considered here. Zinc corrosion in pure water is expected to lead to ZnO and/or ε-Zn(OH)2 [7]. Anions such as SO42−, Cl, or HCO3/CO32− can lead to the formation of other compounds and in particular to Zn(II)-hydroxysalts [8,9,10,11,12] that may be more or less protective. At temperatures above 60 °C, the carbonate species present in “solution 15” could lead to the formation of a protective layer of zinc corrosion products (mainly zinc hydroxycarbonates [11]), a well-known phenomenon often called “passivation” of zinc (e.g. [5,11,13,14]). In the case of Zn/steel galvanic couples, this phenomenon can lead to a change of polarity [11,14] because “passivated” Zn has a higher potential than carbon steel [15]. In contrast, the sulfate and chloride species present in “solution 15” could promote a uniform corrosion of zinc [14,16,17], avoiding its “passivation”.
ZnxAl1-x coatings are often used as sacrificial coatings because they combine the cathodic protection due to the presence of reactive Zn and Al elements with high corrosion resistance due to the formation of protective Al-Zn-based corrosion products [18]. The aluminum content was widely studied to determine the optimal coating composition. It was shown that the Al content should be limited at around 20 wt.% to keep the cathodic protection of the coating [19]. This result applies to atmospheric corrosion whatever the kind of atmosphere (rural, industrial, and marine), for marine corrosion (in immersion, tidal, and splash zones), and corrosion in soil environments. The optimal Al content is in any case between 15% and 22% [4]. ZnxAl1-x coatings are however two-phase (Zn + Al) alloys due to the low solubility of aluminum in zinc [20] and may be sensitive to selective dissolution. Aluminum, less noble than zinc, is expected to be preferentially oxidized. However, the selective corrosion process may depend on the properties of the corrosion products forming on each phase [21]. It may also depend on pH and composition of the corrosive environment. In acidic media, for galvanized Zn-5wt.%Al and Zn-55wt.%Al coatings, Vu et al. [22] observed preferential dissolution of the Zn phase. In contrast, at alkaline pH, preferential dissolution of the Al phase was observed while the dissolution of both phases proved similar at neutral pH.
This preliminary analysis shows that Zn and Zn-15wt.%Al alloy can indeed be considered as possible sacrificial coatings in the specific conditions of the Cigéo project. According to Andra, in view of the currently envisioned industrial process associated with the Cigéo project, thermal spraying can be considered as a possible method for the elaboration of protective coatings. Amongst the various thermal spray processes, wire arc spraying is the most used owing to its low cost and high efficiency (~80%) [23]. As evidence, numerous recent studies were, for instance, devoted to the corrosion behavior of wire-arc-sprayed Zn-Al coatings (e.g., [24,25,26,27,28,29,30]). Though these works deal with various corrosive media, it appears that such thermal-sprayed coatings have never been applied to protect carbon steel for the storage of radioactive waste.
The present study was then designed to assess the possibility to protect the carbon steel overpacks with pure Zn or Zn-15wt.%Al coatings deposited by wire arc spray. Carbon steel electrodes were coated with 500 µm thick Zn or Zn-15wt.%Al layers. The mechanical (adhesion) and physicochemical properties (oxide content, porosity) of the coatings were studied before corrosion experiments were carried out in aerated “solution 15” at 80 °C. First, voltammetry was used to study the electrochemical behavior of coated steel electrodes. Secondly, 6-month galvanic corrosion experiments were performed using a coated steel electrode connected to a bare steel electrode, which simulates a coating defect. After these experiments, the surface of both electrodes was characterized by X-ray diffraction (XRD) and µ-Raman spectroscopy (µ-RS). Surface and cross-sections of the coated electrodes were also characterized by scanning electron microscopy (SEM) coupled with energy-dispersive spectrometry (EDS).

2. Materials and Methods

2.1. Materials

P285NH carbon steel is envisaged for the overpacks of the Cigéo project. Its nominal composition is (wt.%): <0.18% C, <0.4% Si, 0.6–1.4% Mn, <0.025% P, <0.015% S, <0.3% Cr, <0.08% Mo, <0.3% Ni, <0.2% Cu and Fe for the rest [31]. Previous study of this material showed that it had a ferrito-pearlitic microstructure with 30% pearlite and 70% ferrite, a homogeneous composition, and low content of inclusions [2].
For the present study, two types of samples, coated and bare steel ones, were prepared. The coated ones were 40 mm × 40 mm square coupons that were sandblasted with alumina particles (Corindon F16) to improve the adhesion of the coating. They were subsequently cleaned with ethanol before the Zn or Zn-15wt.%Al coating was thermally sprayed on one side of each coupon. A hole was then tapped and threaded in an edge of each coupon. A screw holding a welded copper wire was mounted in it, thus allowing the electrical connection of the sample. This procedure omitted any welding of the coated coupon to avoid excessive heating of the Zn-based coating. Finally, the uncoated side, the edges, and the periphery of the coated side were embedded in resin so that only a planar active area (Sa = 12.25 cm2) remained. Covering the periphery of the coated side is necessary to limit edge and corner effects. The bare steel samples were 12 mm × 12 mm square coupons. The copper wire used for connection to the potentiostat was in this case welded directly to the steel surface before the coupon was embedded in resin, except for the side to be used for corrosion experiments. This side (active area Sc = 1.44 cm2) was classically abraded with SiC papers, a procedure that ended with grade 1000 paper (particle size 18 µm). For both types of samples, the resin used for embedding the coupons was the Sicomin resin 1700 with hardener 7820 (Sicomin Epoxy Systems, Châteauneuf les Martigues, France). A thermal treatment (24 h at 25 °C then followed with 8 h at 50 °C) was finally carried out to promote the reticulation of the resin so that the embedded electrodes could endure temperatures as high as 120 °C.
According to the technical specifications given by Andra for a possible application in the frame of the Cigéo project, the wire arc spray process was considered. In this process, an electric arc is generated between two wires to melt the metal constituting the wires. A gas jet atomizes the molten metal and propels the fine particles toward the substrate. The successive spreading of these droplets on the substrate leads to the accumulation of particles, the so-called “splats”, which finally constitute the coating [23,32]. As a result, the wire arc spray process does not induce diffusion phenomena between the substrate and the coating and only provides mechanical adhesion of the coating to the substrate. The various parameters of the process must be selected according to the coating composition. Such parameters, e.g., voltage and amperage applied to create the electric arc, pressure of the propelling gas, distance between substrate and projection gun, etc., can be optimized to improve the quality of coating [33]. The optimization of the process was not achieved for this preliminary study.
Compressed air was used as the propelling gas in any case. The pressure of primary gas was 50 psi and that of secondary gas was 40 psi. The relative speed displacement of the torch vs. the substrate was 2.6 m s−1, and the operating distance (between torch and substrate) was 150 mm. Note that displacement of torch and operating distance are the parameters that define the total mass of particles reaching the substrate. Voltage and amperage were set at different values depending on the coating composition, i.e., 20 V and 170 A for Zn, 29 V and 100 A for Zn-15wt.%Al. The considered coating thickness of 500 µm was obtained after five passes.

2.2. Characterization of the Coatings before Corrosion Experiments

The composition of the coatings was studied by micro-X-ray fluorescence spectroscopy (µ-XRF). The analysis was performed with an M4 Tornado (Bruker AXS GmbH, Karlsruhe, Germany) µ-XRF spectrometer operating at 35 kV and 300 µA with a rhodium filament.
The thickness of the coating was controlled with a DeFelsko Positector 6000 (DeFelsko Corporation, Ogdensburg, NY, USA). Sixteen measurements, evenly distributed on the surface, were performed on each sample.
The surface roughness of the coatings was characterized with a micro-combi tester MCT3 (Anton Paar GmbH, Graz, Austria) with a diamond tip (R = 0.1 mm and tape angle 120◦).
SEM/EDS analysis and XRD were used to study the microstructure and determine the phase composition of the coatings. Both methods, associated procedures, and experimental parameters are described in Section 2.4.
The oxide content of the coating was indirectly determined via the measurement of oxygen content using temperature-programmed desorption (TPD). To determine the overall oxygen content, the temperature was set up to the melting point of Zn (419 °C) or up to the complete fusion of the Zn-15wt.%Al alloy (440 °C, [20]). This analysis was carried out using an EMGA-621W oxygen/nitrogen/hydrogen analyzer (Horiba, Tokyo, Japan).
Finally, pull-off experiments were carried out according to the ASTM C633 standard [34] to characterize the adhesion of the coatings to the substrate. The experiment consists of the fixation of a coated sample between two tensile test specimens with glue. The FM100 (Solvay, Brussels, Belgium) modified polyamide-epoxy adhesive film was used to ensure bond strength of 80 MPa. The load was applied at a constant elongation speed of 1 mm/min with a tensile testing machine ZwickRoell Z050 (ZwickRoell GmbH & Co.KG, Ulm, Germany).

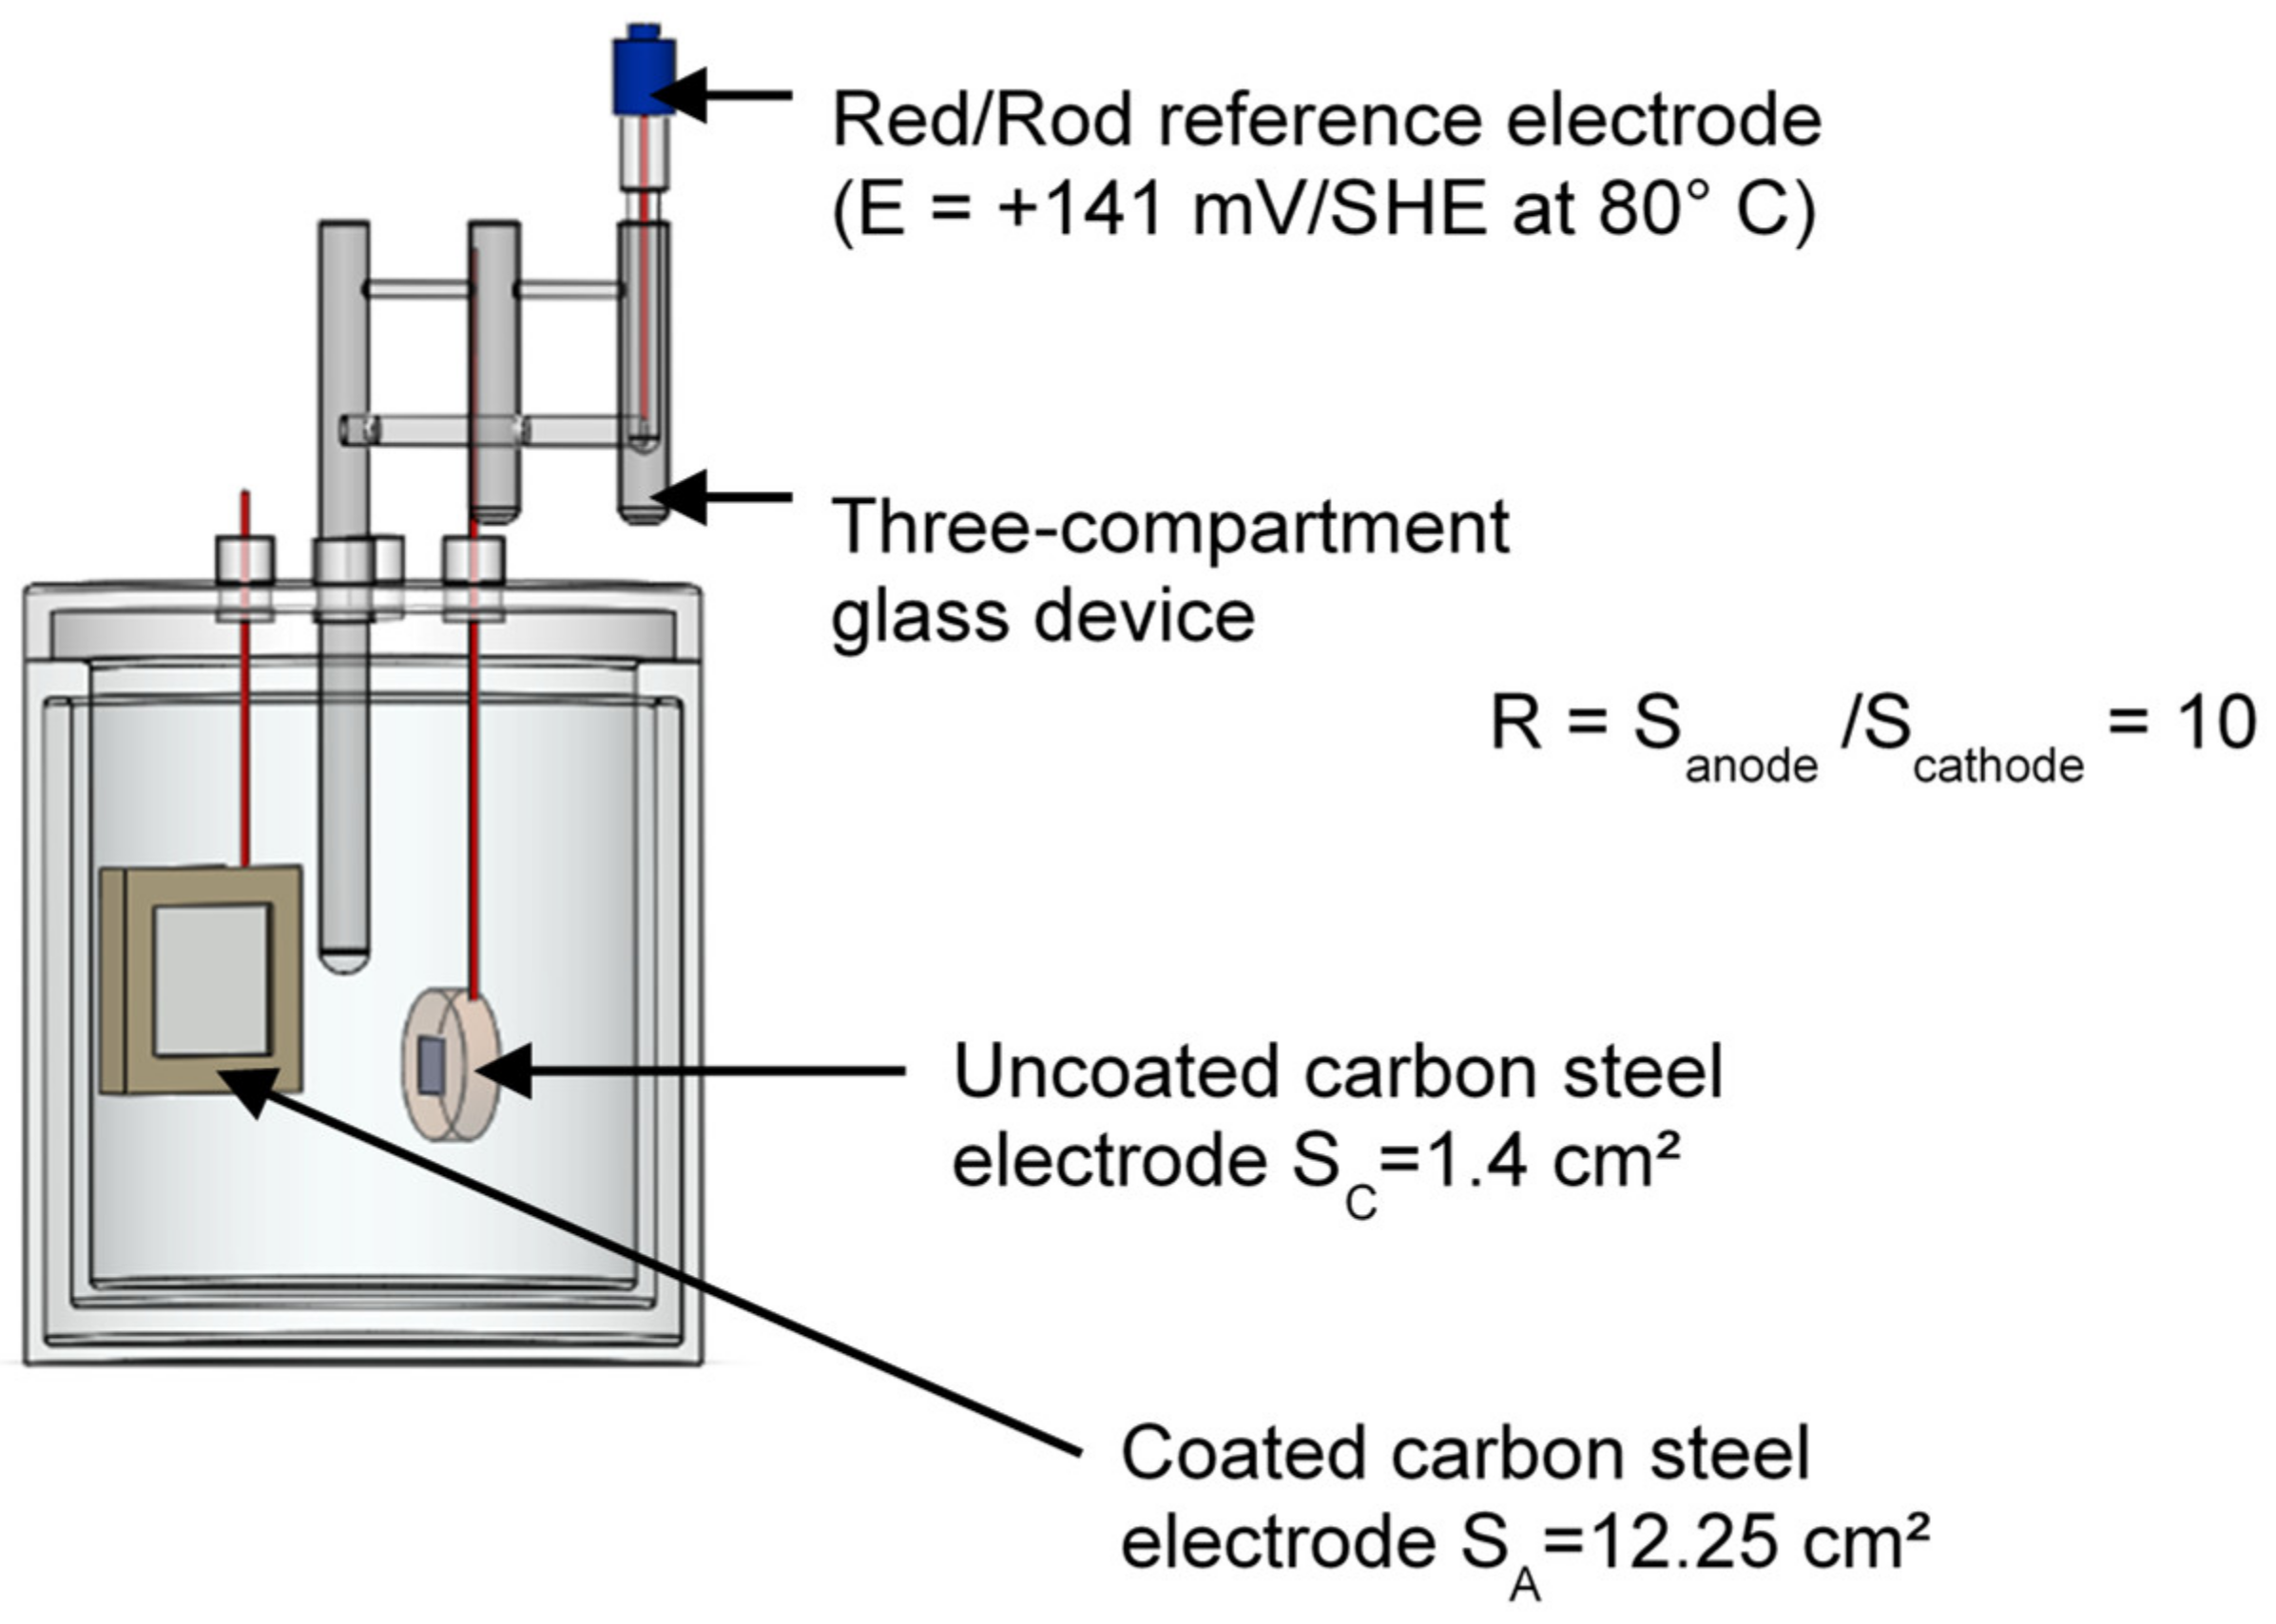
2.3. Electrochemical Set-Up and Methods

The pore water coming from the claystone formation will interact with the cement grout injected between the rock and the steel casing before dripping inside the casing and reaching the overpacks. The composition of this electrolyte, denoted as “solution 15” and used for all experiments, was given by Andra (Châtenay-Malabry, France) and is reported in Table 1. The pH of the solution was initially adjusted to 10.5 at 25 °C, before the solution was heated up to 50 °C for 24 h. The resulting pH, checked before each corrosion experiment, was equal to 10.0 ± 0.1 at 50 °C.
Electrochemical measurements were carried out with a VSP potentiostat (BioLogic, Seyssinet-Pariset, France) using a platinum grid as counter electrode, and the Red/Rod reference electrode designed for high-temperature measurements (Radiometer Analytical SAS, Lyon, France), characterized by a potential Eref = +0.141 V/SHE at 80 °C. In the following, the potential is given in any case with respect to the standard hydrogen electrode (V/SHE). All measurements were performed at a controlled temperature of 80 ± 2 °C in a double-wall glass cell.
First, voltammetry was used to study the electrochemical behavior and estimate the corrosion rate of the coatings. For this set of experiments, the open circuit potential (OCP) of the coated steel electrode (Sa = 12.25 cm2) was monitored for 1 h. Linear polarization resistance (LPR) measurements were then carried out at dE/dt = 0.1 mV s−1 in a potential range of OCP ± 10 mV. Finally, a polarization curve was acquired with the same scan rate, from a cathodic potential Ei = −0.150 V vs. OCP, up to an anodic potential corresponding to a maximum current density jlimit = 32.65 µA/cm2 (i.e., maximum current Ilimit = 400 µA).
Secondly, 6-month galvanic corrosion experiments were performed to study the influence of coating defects. The corrosion system consisted of a bare steel electrode (Sc = 1.44 cm²) connected to a coated steel electrode (Sa = 12.25 cm2), both set in the double-wall glass cell as displayed in Figure 1.
The bare steel electrode was connected to the potentiostat as the working electrode and the coated steel electrode was connected as the counter electrode. For these long-time experiments, the cell was kept in an oven at a controlled temperature of 80 ± 1 °C. After the first week and at the end of each month, the cell was removed from the oven to carry out electrochemical measurements on the coupled electrodes and on the coated steel electrode alone. Once out of the oven, the cell was rapidly connected to a thermostatic bath set at 80 °C. The mixed potential of the galvanic couple was first monitored for 10 min and the average measured value was recorded. Then the electrodes were disconnected, and the bare steel electrode was set as rapidly as possible in a second thermostatic glass cell filled with “solution 15”. To maintain the cathodic protection previously provided by the galvanic coupling with the coated steel electrode, the bare steel electrode was immediately polarized at the value measured for the mixed potential of the couple. Meanwhile, the coated steel electrode remained at OCP in the first glass cell. The OCP was monitored for 1 h, and the value reached after stabilization of the potential was recorded. LPR measurements were then carried out as described earlier. Finally, electrochemical impedance spectroscopy (EIS) measurements were performed on the coated steel electrode at OCP. The frequency of the 10 mV amplitude voltage sinusoidal perturbation was varied from 200 kHz to 10 mHz, with 10 points per decade. The bare steel and the coated steel electrodes were then reconnected, and the cell was set back in the oven until the next measurement.

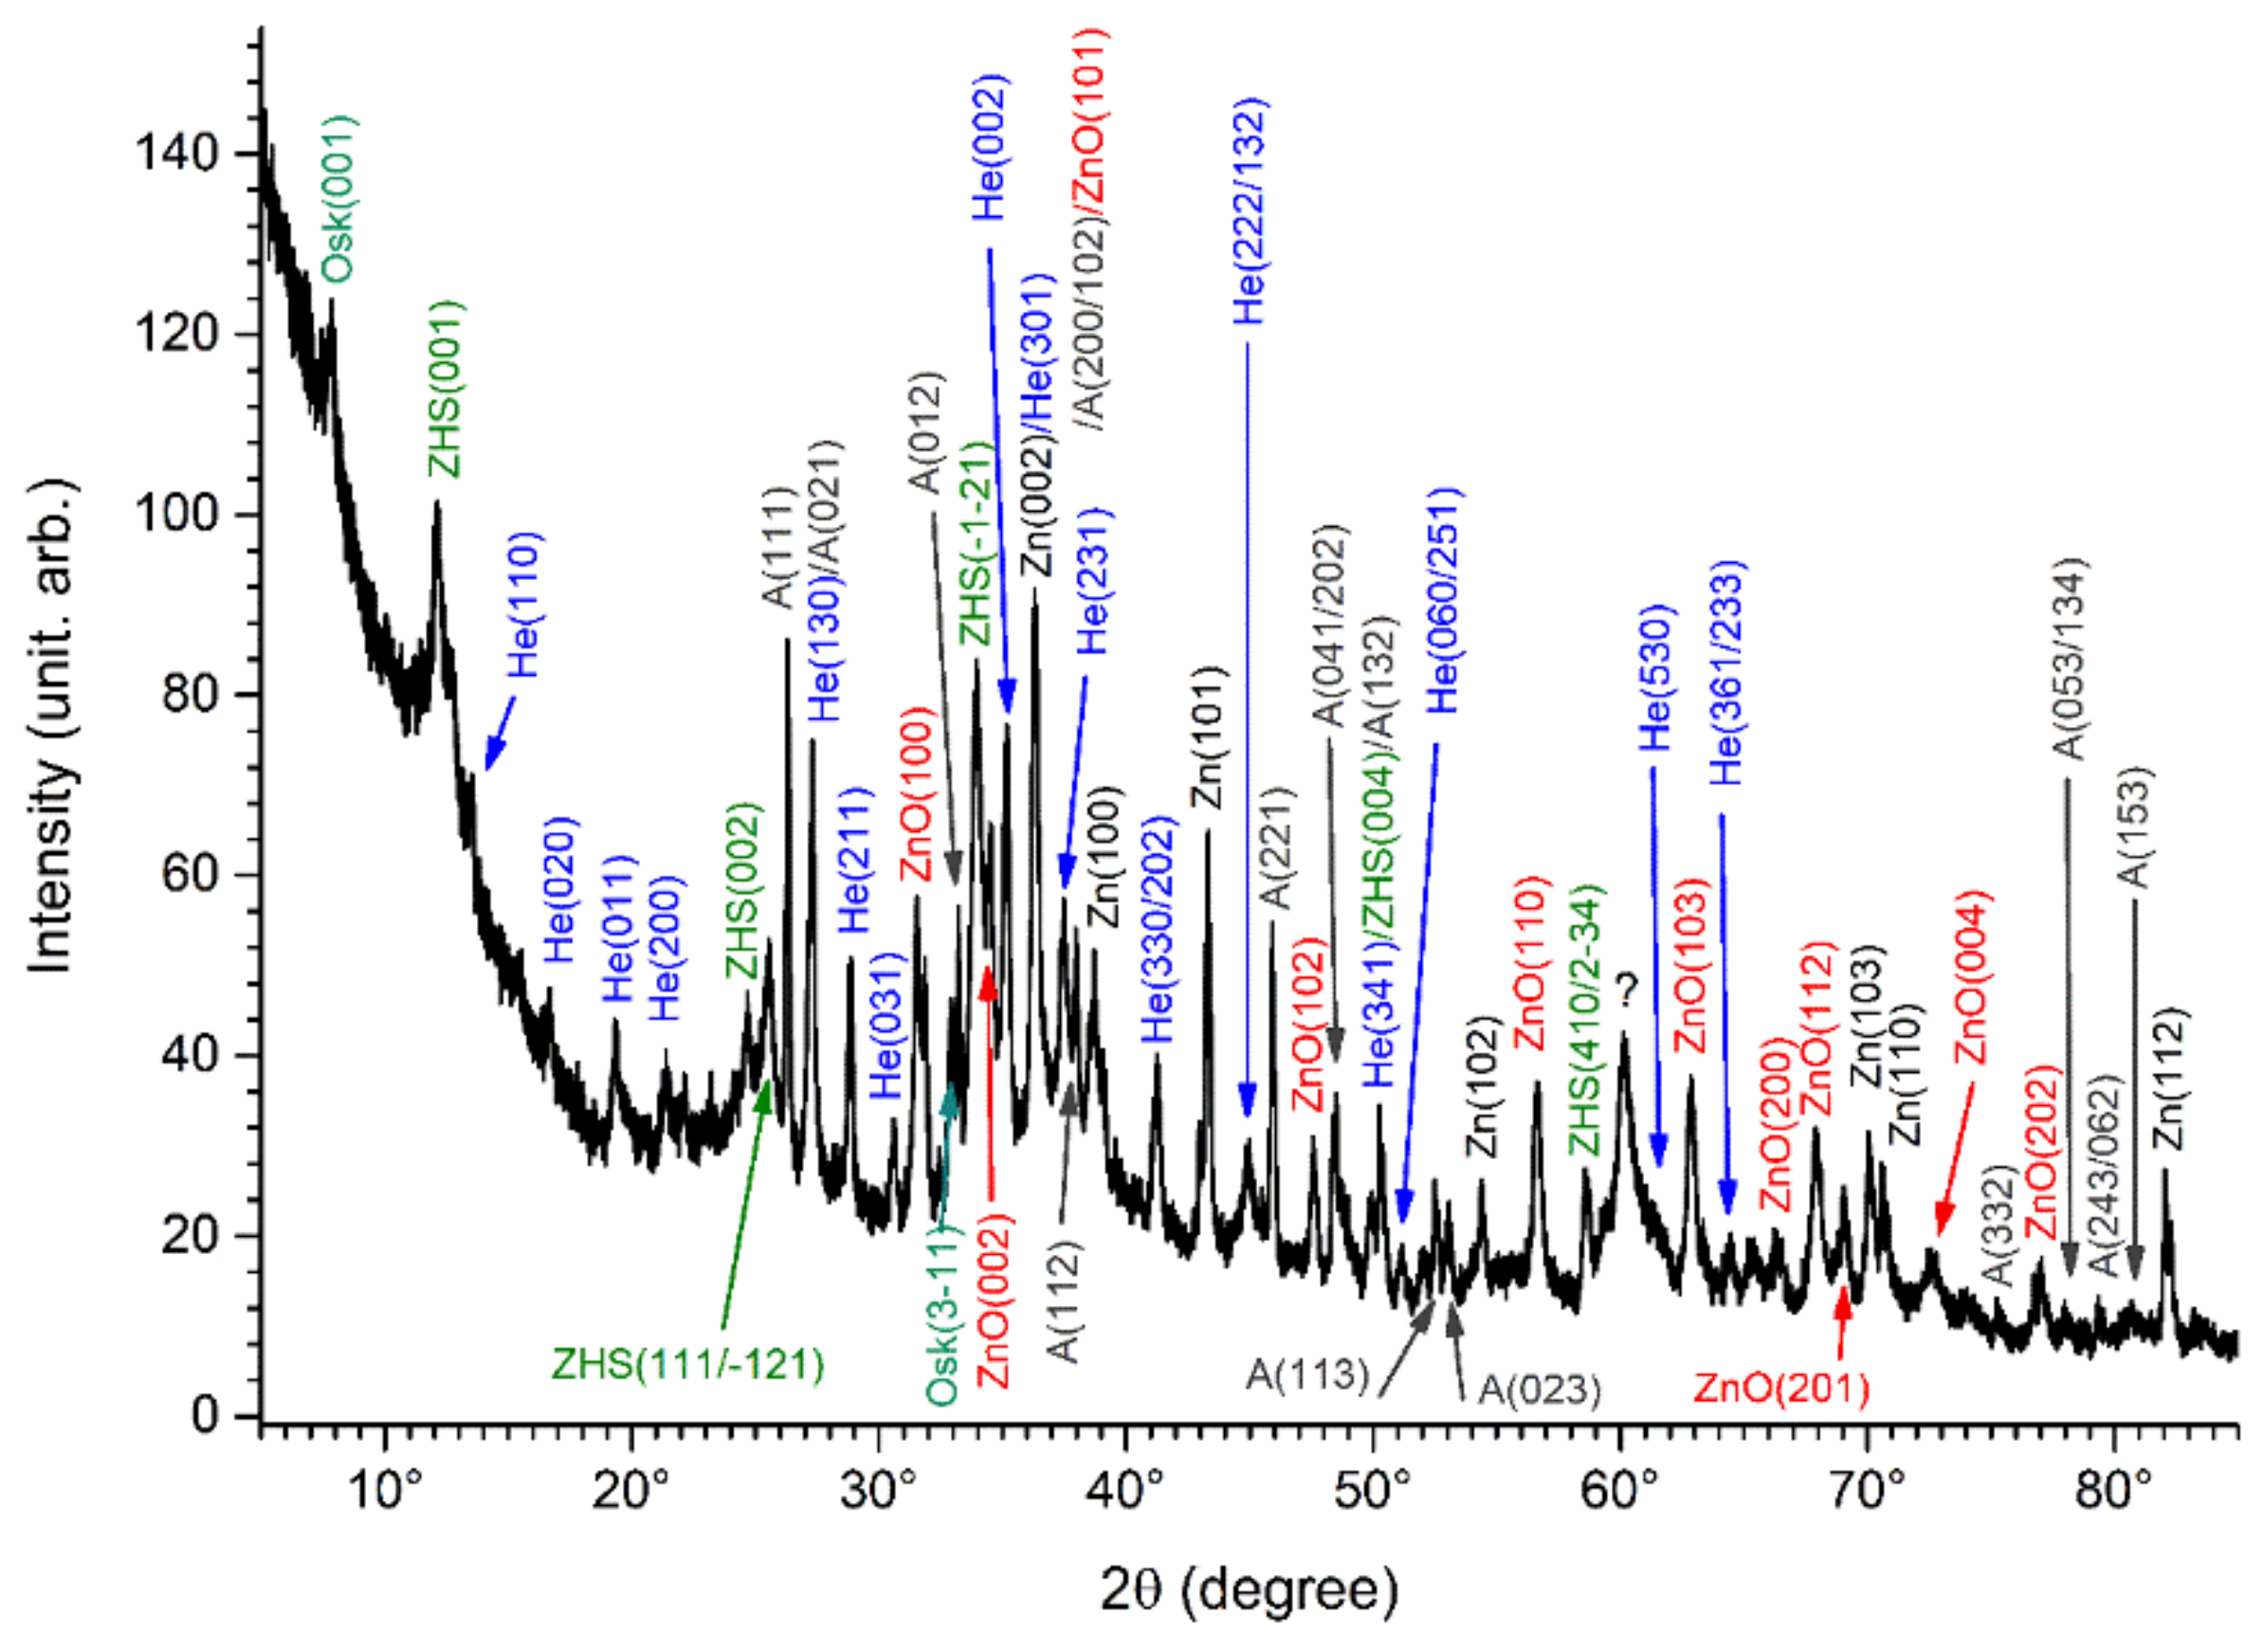
2.4. Characterization of the Mineral Layers Formed on the Electrodes Surface

After the 6-month corrosion experiments, the mineral layers covering the surface of both bare and coated steel electrodes were characterized by XRD, µ-RS, and SEM/EDS analysis.
XRD analysis was carried out with a D8 Advance diffractometer (Bruker AXS GmbH, Karlsruhe, Germany) using the CuKα radiation (λ = 0.15418 nm), with Bragg–Brentano geometry in the 2θ range of 5° to 105°. The 2θ angle was varied by steps of 0.01° each 0.1 s. The diffracted signal was acquired using the LYNXEYE XE-T silicon strip detector. The crystalline phases were identified via the ICDD-JCPDS-PDF-2 database (ICDD, Newtown Square, PA, USA), and the peaks were indexed according to the corresponding file.
µ-RS analysis was performed with a LabRAM HR High-Resolution Raman spectrometer (Horiba, Tokyo, Japan) equipped with a microscope (Olympus BX 41, Olympus, Tokyo, Japan) and a Peltier-based cooled charge coupled device (CCD) detector. The analyzed zones (diameter of ~6 µm) were observed at a magnification of ×50. Spectra were acquired at room temperature via the LabSpec software with a resolution of 0.4 cm−1. For the bare steel electrodes, the excitation was provided by a He-Ne laser (λ = 632.8 nm). Its power was 0.9 mW (10% of the maximal power) in order to prevent excessive heating of the analyzed compounds. This wavelength is not suitable for Zn compounds [27] and consequently, for the coated steel electrodes, the excitation was provided by a near-IR (λ = 785 nm) laser diode at 100% of its power. In both cases, the acquisition time was equal to 180 s. As µ-RS provides a local analysis, various zones must be analyzed, and the number of acquired spectra for a given sample was then ≥15.
SEM/EDS observation/analysis was carried out with an FEI Quanta 200 Field Emission Gun (FEG) Environmental Scanning Electron Microscope (ESEM) equipped with an EDAX detector for chemical analysis (FEI Company, Hillsboro, OR, USA). The observation and analysis were performed at 20 kV in low vacuum (0.9 and 1.1 mbar). For surface observation of the samples, no specific preparation was carried out. For observation of cross-sections, the samples were first cut with a diamond wire saw using a water-free cooling fluid. The obtained cross-sections were then abraded using SiC papers until grade 4000 (particle size 5 µm) with heptane as the cooling liquid, and mirror-polished using water-free diamond pastes (3 µm and 1 µm).
To investigate the possible influence of cutting with the diamond wire saw, a freeze-fracturing method was also used to obtain cross-sections of the coated steel electrodes. A pre-cut was first made on the uncoated side of the steel coupon until the coating/substrate interface was reached. The coupon was then immerged in liquid nitrogen for a few minutes. The uncoated side was then hit with a hammer, which fractured the coating at the pre-cut localization. The obtained freeze-fracture cross-sections were finally prepared and characterized by SEM/EDS the same way other cross-sections were.

3. Results

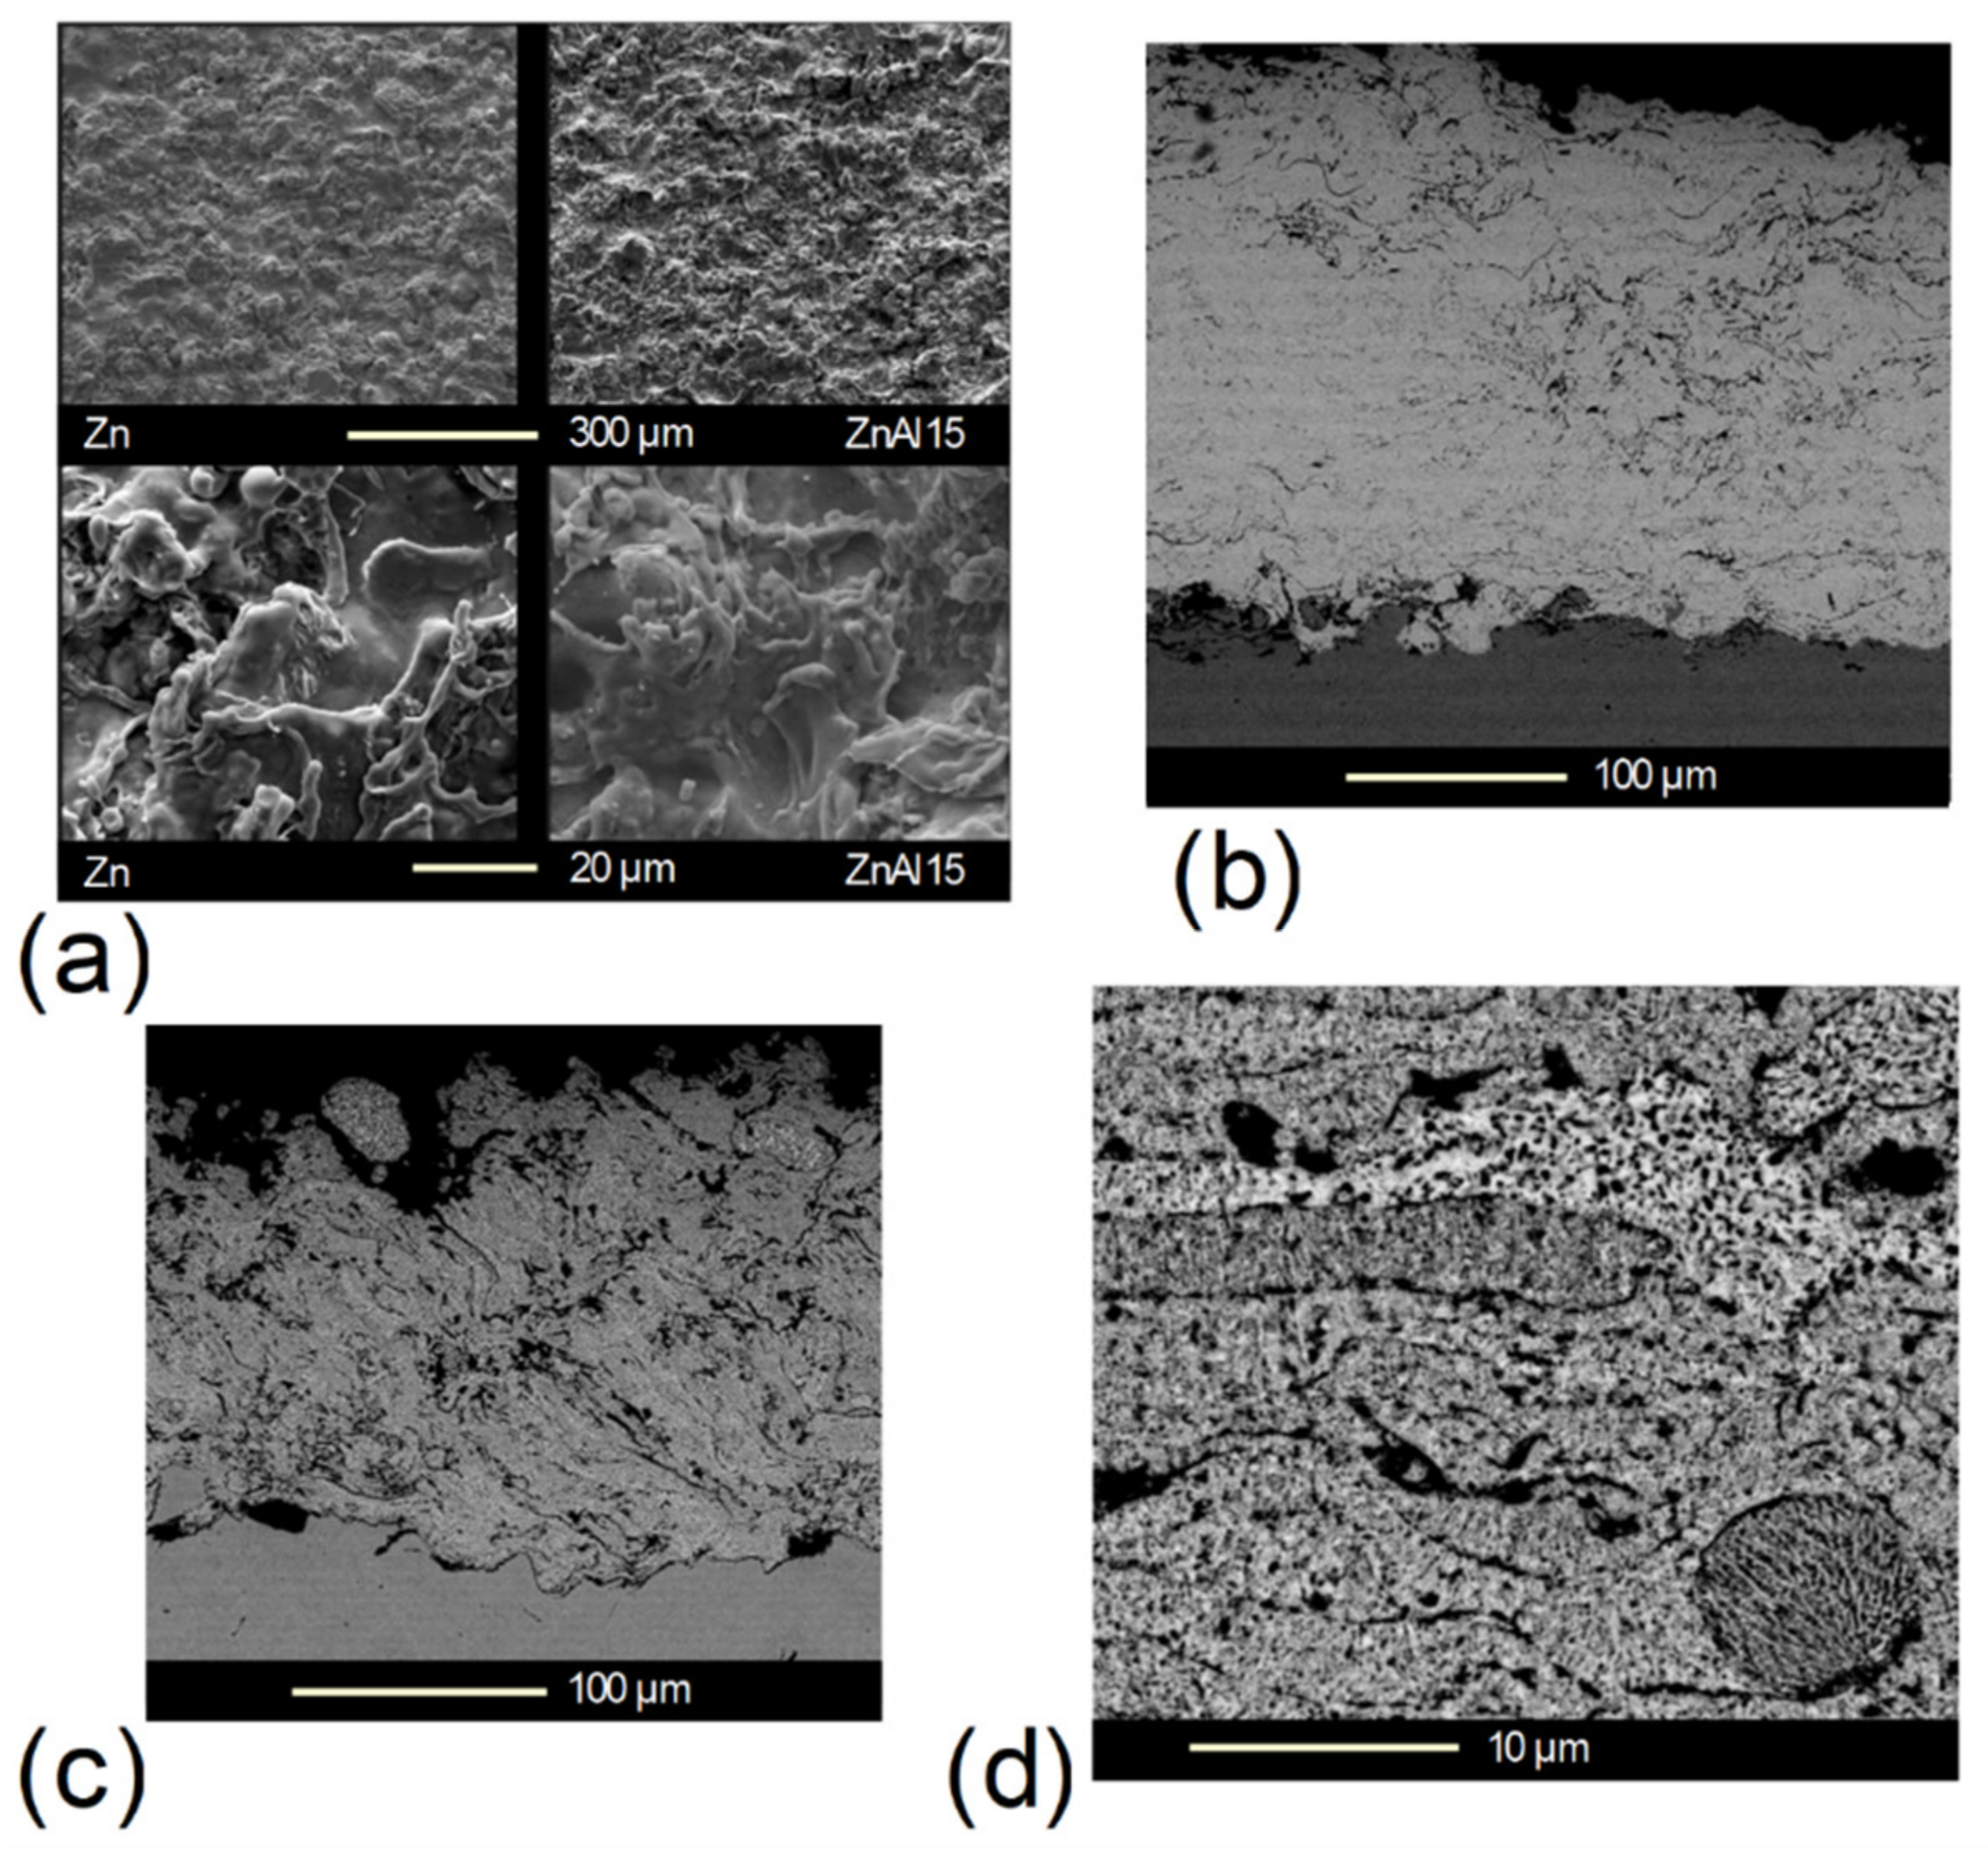
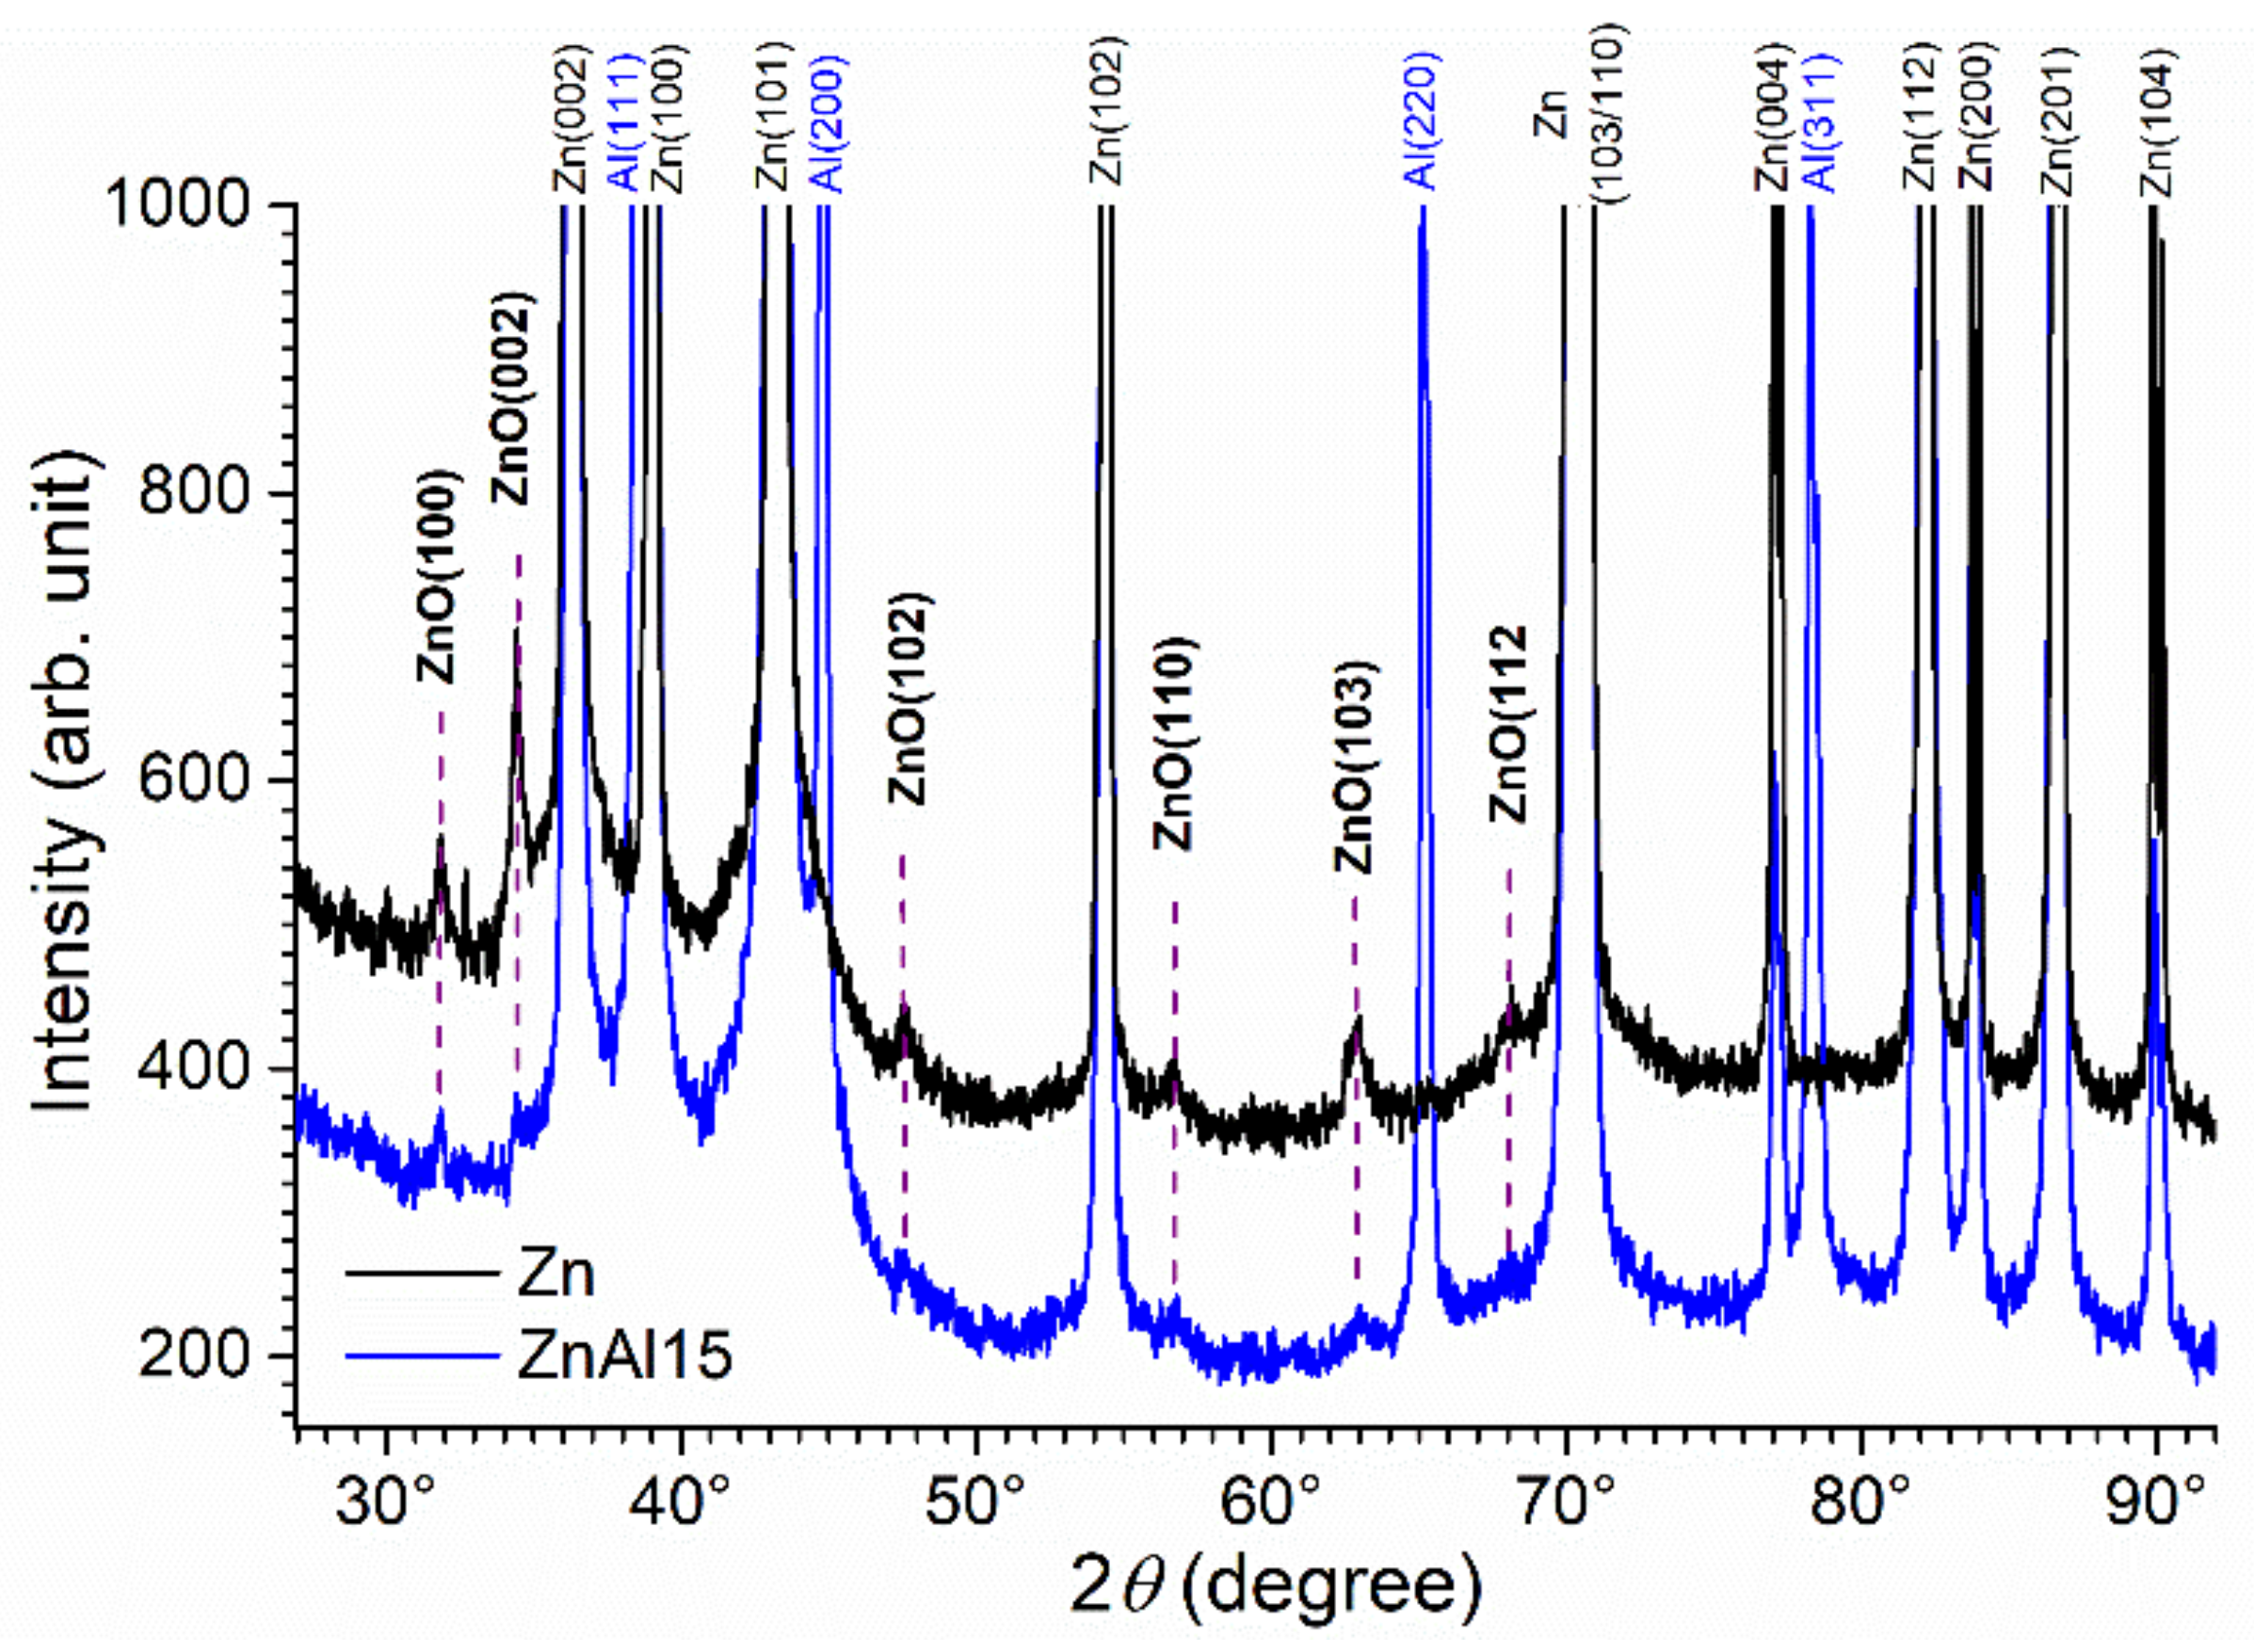
3.1. Characterization of the Coatings before Corrosion Experiments

First, µ-XRF analysis revealed the very low content of impurities. Only Fe was detected in the case of the Zn-15wt.%Al coatings, at the very low weight fraction of 0.03%. An analysis of the wires used for the arc spraying demonstrated that Fe was already present as an impurity in the wires. Only Zn was detected in the Zn coatings, while the average composition of the Zn-15wt.%Al coatings was determined at 87 wt.% Zn and 13 wt.% Al.
Measurements of the surface roughness led to maximum height Ry values of 74 ± 6 µm and 76 ± 2 µm, and arithmetical mean roughness Ra values of 6 ± 1 µm and 9 ± 3 µm for Zn and Zn-15wt.%Al coatings, respectively.
SEM pictures of the coatings are displayed in Figure 2. The surface observation (Figure 2a) reveals the distorted molten particles that constitute the coatings. Though they are bound to each other, most of them can be distinguished individually, which can be associated with the notable roughness of the coatings. The cross-section views reveal the lamellar structure of the coatings (Figure 2b,c). Moreover, the detailed view of the Zn-15wt.%Al cross-section (Figure 2d) shows that the splats are characterized by different shades of grey. The EDS analysis revealed that the lightest splats contained less aluminum (10–11 wt.%) whereas the darkest splats contained more aluminum (18–19 wt.%) than the average 13 wt.%. Processing of the SEM cross-section images was performed with the ImageJ software to determine the porosity of the coatings. All black areas inside the coatings were considered as pores, the lighter regions being considered as the metal. Five areas were processed for each coating, and the porosity was found to be between 4 and 9% for both coatings, i.e., values consistent with those usually reported for wire-arc-sprayed coatings [32].
The XRD patterns of both coatings are displayed in Figure 3. The intensity scale was restricted to values < 1000 to reveal diffraction peaks of very minor phases. For the Zn coating, the main diffraction peaks are of course those of Zn, but other small peaks are clearly visible. These peaks can be unambiguously attributed to zincite (ZnO). The presence of ZnO results from an oxidation process that may have taken place at the surface of the molten Zn particles before they hit the substrate surface. The subsequent oxidation in air of the coating surface could also have led to the formation of additional ZnO. For the Zn-15wt.%Al coating, the diffraction peaks of both Al and Zn are present, which indicates that the coating is made of two phases in accordance with the Zn-Al equilibrium diagram [20]. As for the Zn coating, ZnO is identified, but its diffraction peaks are much less intense and hardly visible. Finally, in both cases, the XRD pattern of the Zn phase did not reveal any preferential orientation.
TPD measurements demonstrated that both coatings contained a small amount of oxygen, determined at 0.67 ± 0.03 wt.% and 0.70 ± 0.04 wt.% for Zn and Zn-15wt.%Al coatings, respectively. These amounts are much lower than those reported in previous data [23]. It can then be put forth that ZnO, identified via XRD, is mainly present on the surface of the coatings.
Table 2 presents the results obtained with pull-off experiments. For two of the four Zn coatings tested, the fracture took place at the steel/coating interface. In this case, the ultimate tensile strength (UTS) was associated with the adhesion strength of the coating, which could then be determined at 21 ± 5 MPa. For the other two Zn coatings, the fracture took place only partially at the steel/coating interface, i.e., it also took place inside the coating itself. This shows that the bond strength between the various layers of splats in the coating may be smaller than the bond strength between the steel surface and the splats. As a result, the measured UTS was smaller in this case, with an average value of 15.9 ± 0.3 MPa. In contrast, the fracture was localized at the substrate/coating interface for all Zn-15wt.%Al-coated samples. Moreover, the adhesion strength proved slightly higher than that measured for Zn coatings, with a mean value of 23.5 ± 2.5 MPa. Finally, it must be noted that the measured values, ranging between 16 and 26 MPa, are consistent with those usually reported for wire-arc-sprayed coatings [23].

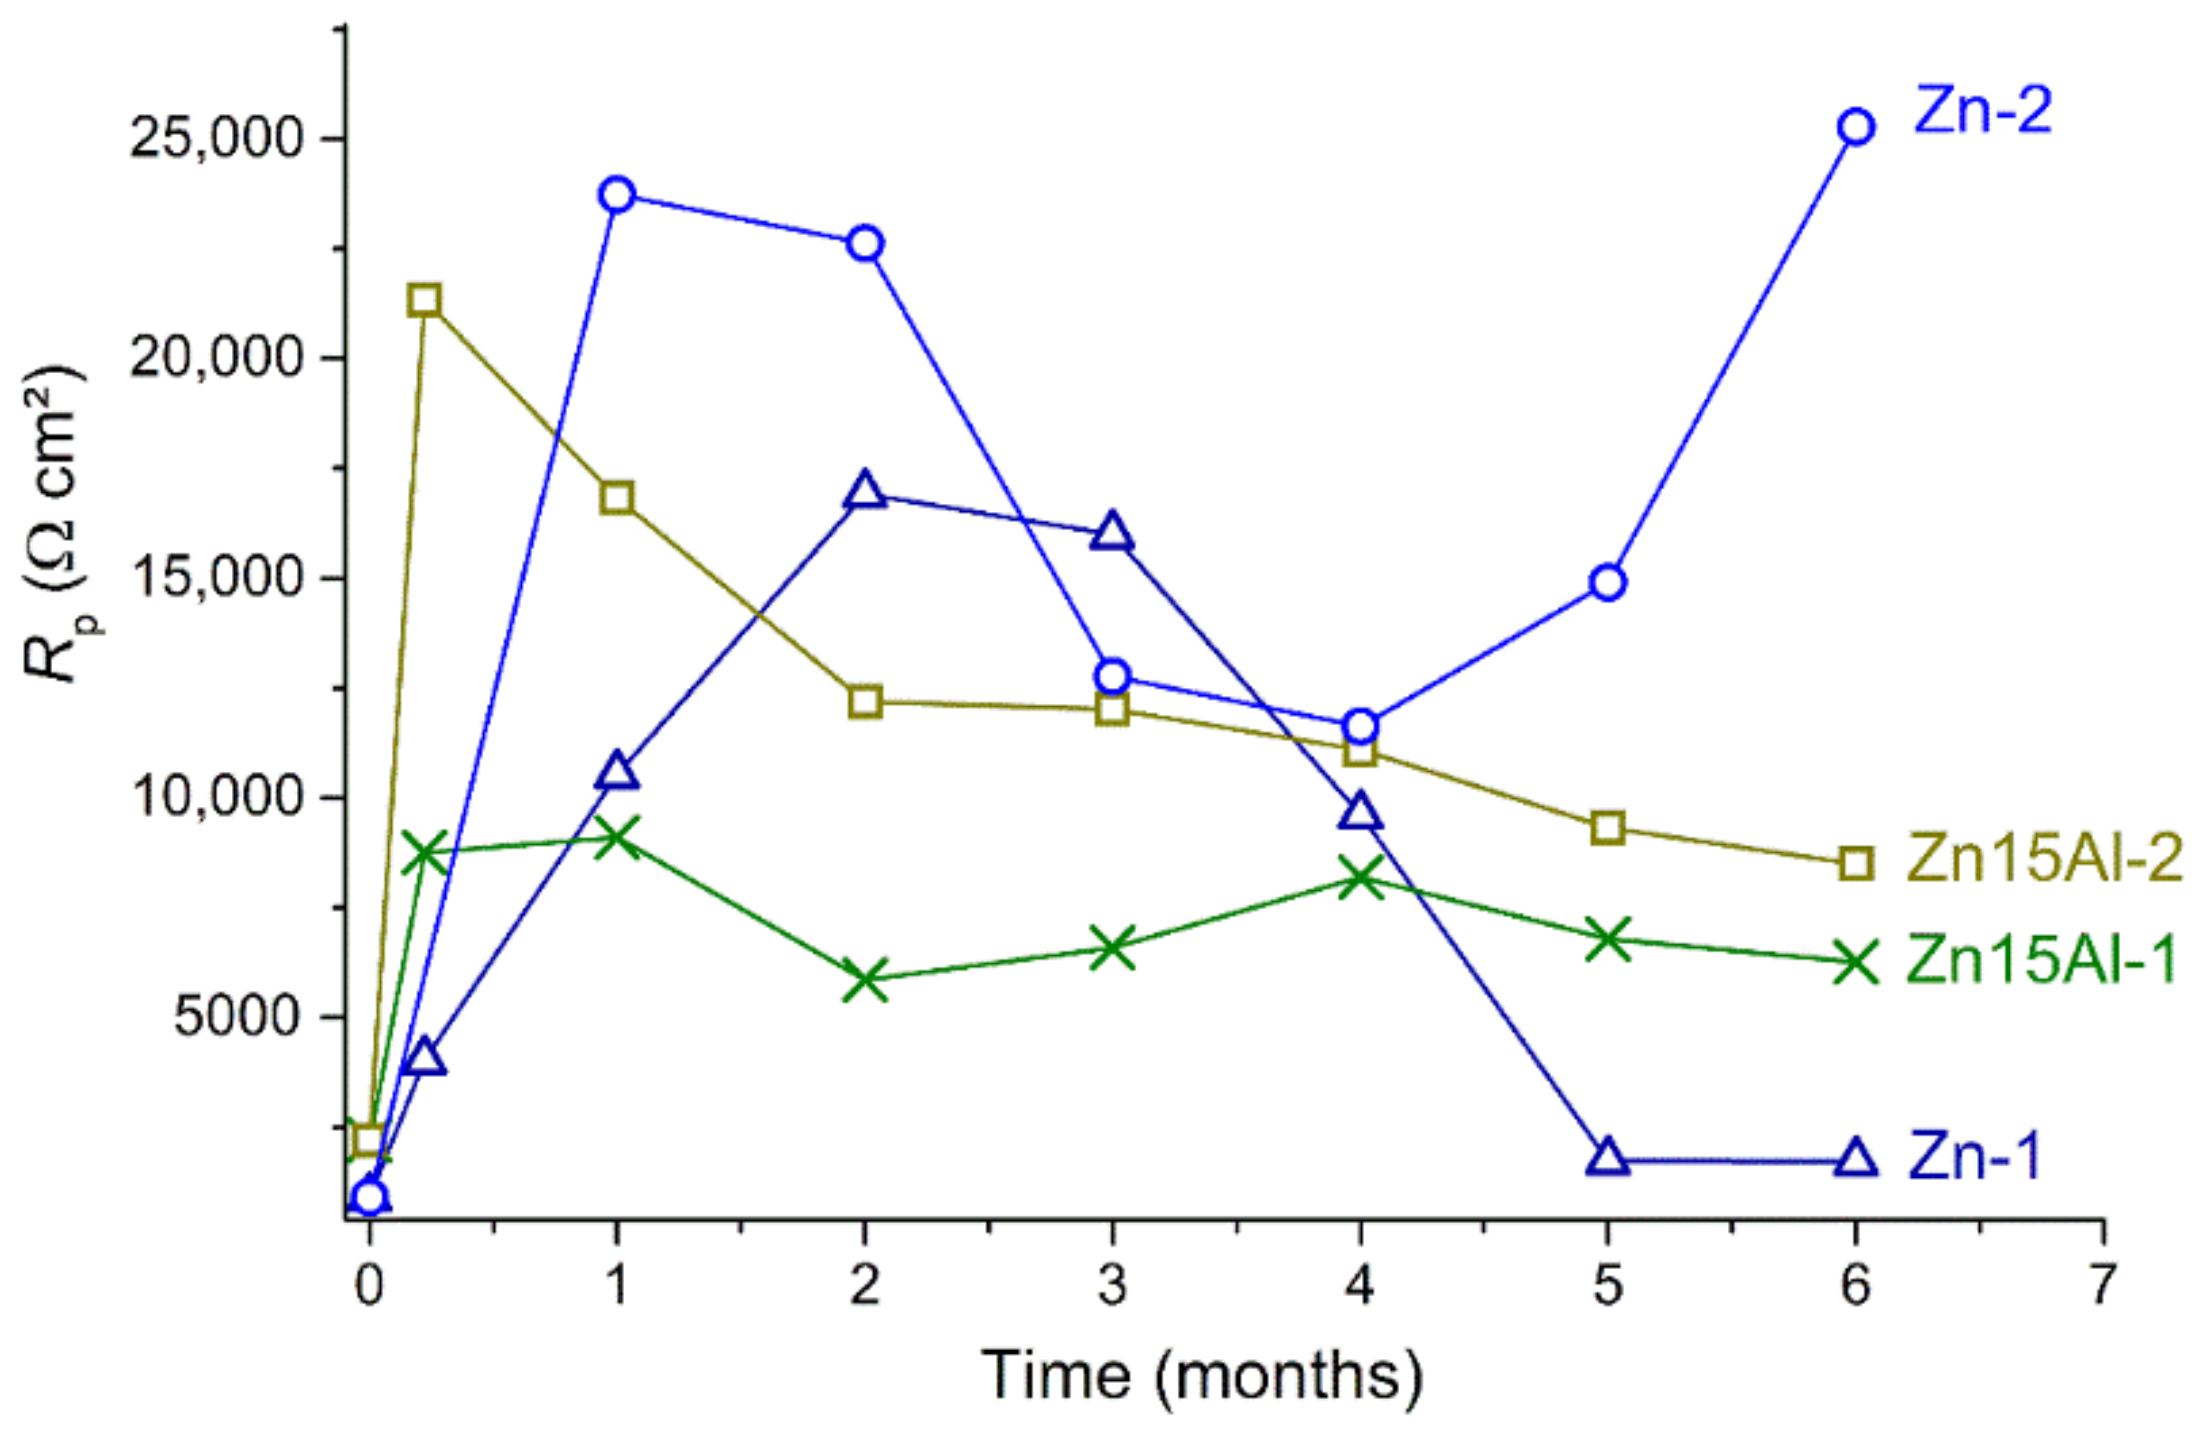
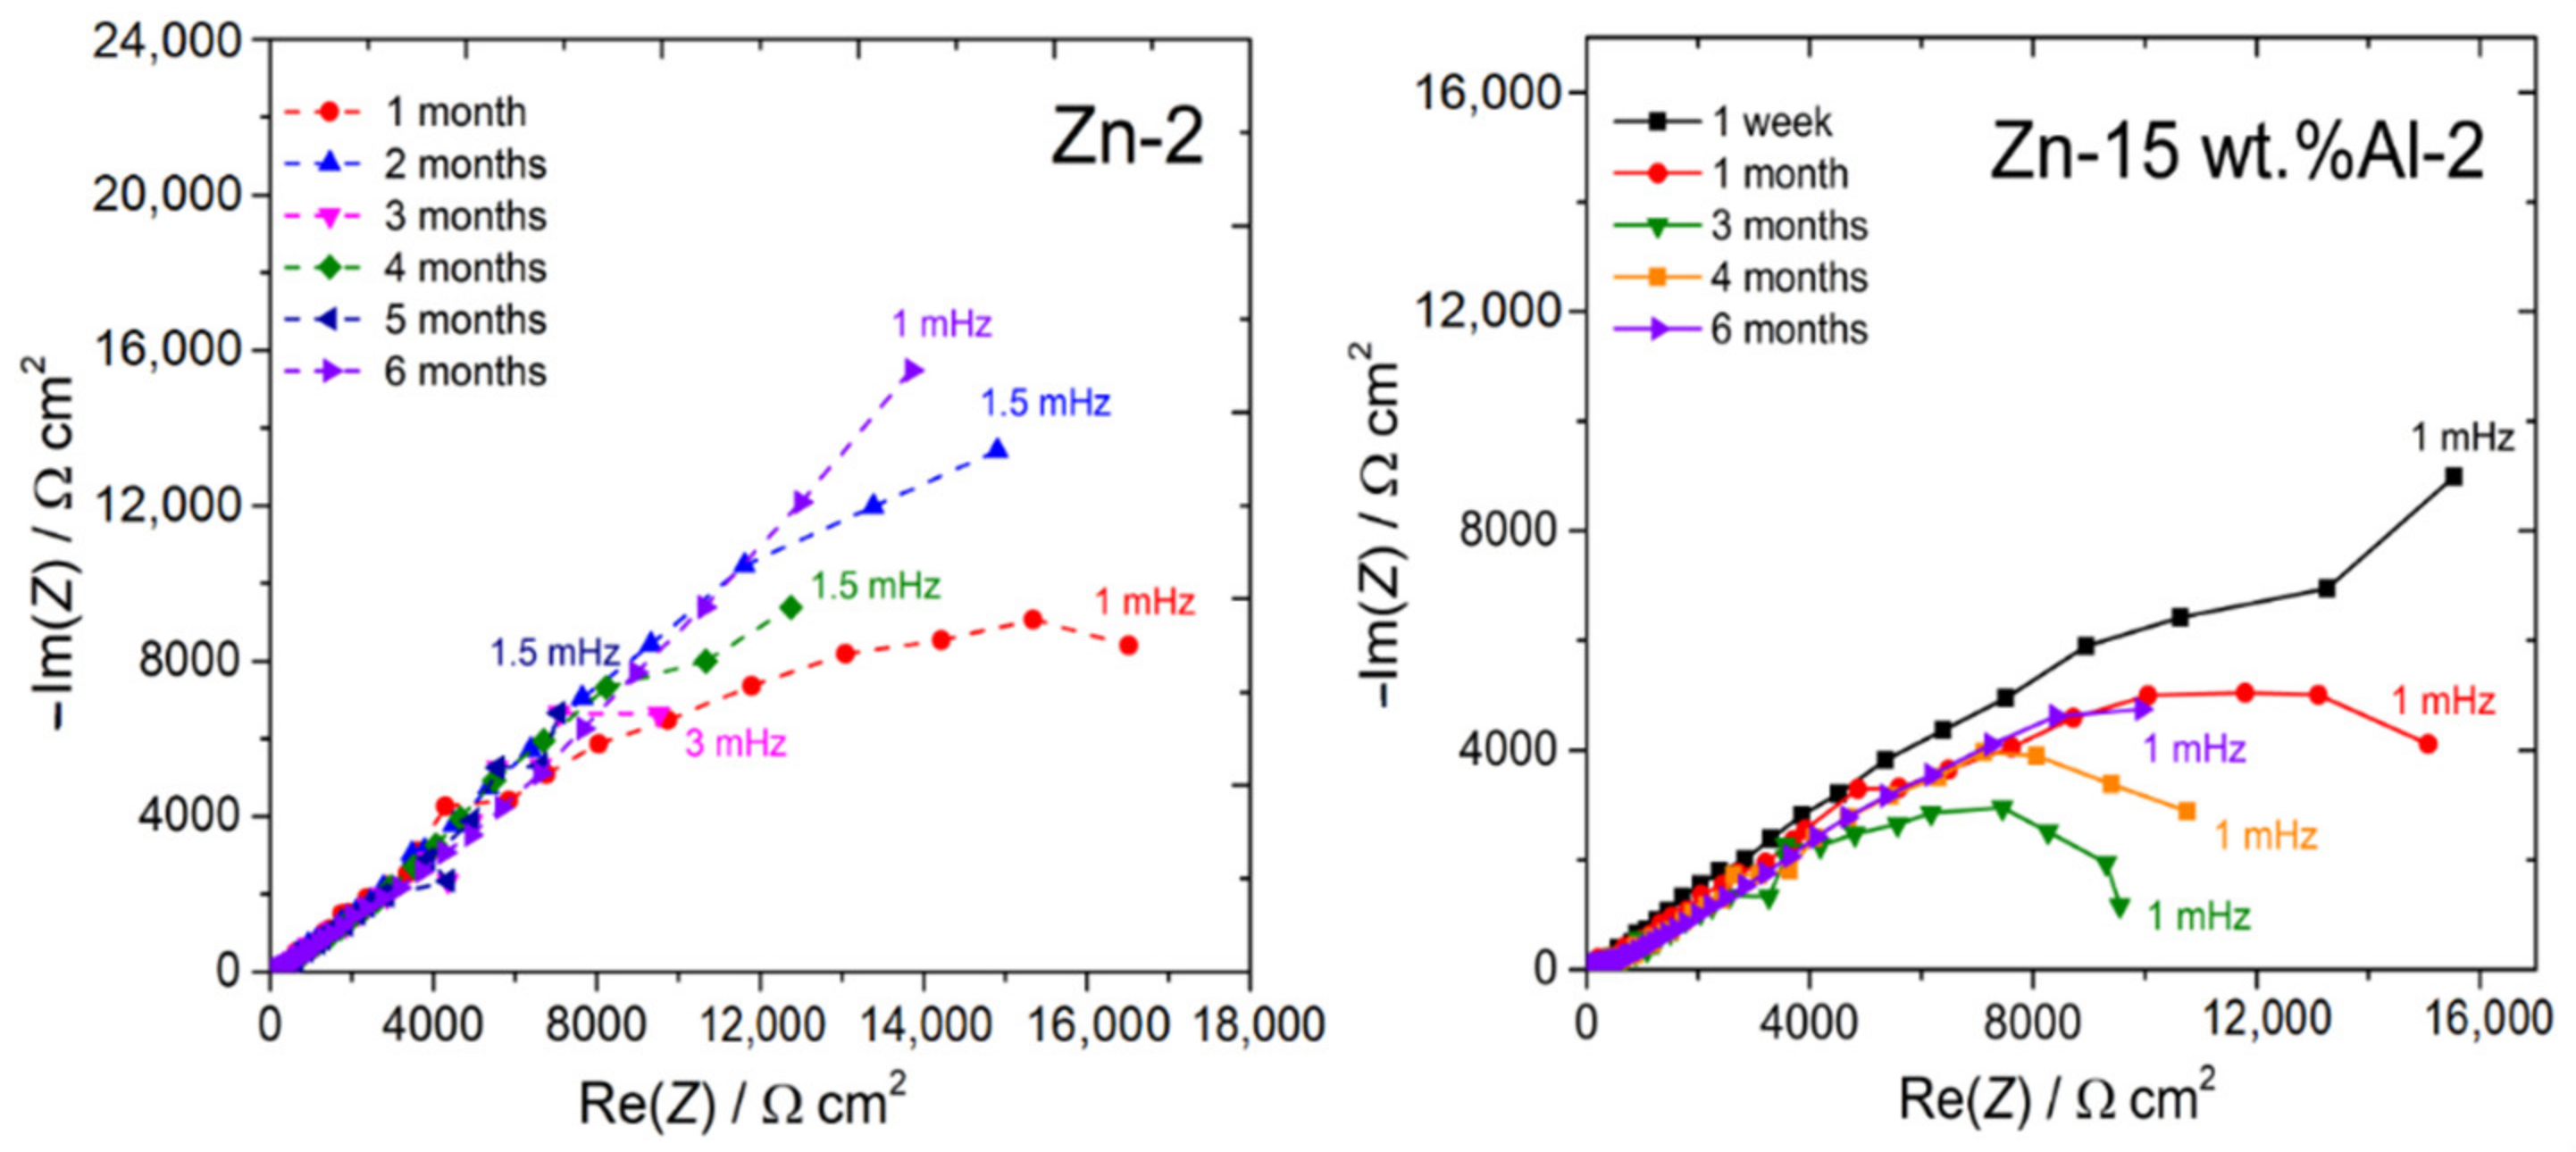
3.2. Corrosion Behavior of Coated Electrodes in “Solution 15” at 80 °C

The OCP of the coated electrodes proved rather stable during the initial one-hour immersion period. The OCP of the Zn coating stabilized after a few minutes at an average value of −0.78 ± 0.01 V/SHE. The OCP of the Zn-15 wt.% Al coating also rapidly became stable at an average value of −0.81 ± 0.03 V/SHE. The OCP of bare steel electrodes was also measured for comparison. It reached an average value of −0.54 ± 0.02 V/SHE after 1 h but was still increasing at that time. OCP measurements of a bare steel electrode were then carried out for one month; the OCP only reached a steady state after 15 days, where it remained constant at an average value of −0.40 ± 0.02 V/SHE. In any case, these results show that both coatings are less noble than the substrate.
After the initial one-hour immersion at OCP, LPR measurements were performed on the coated electrodes. For Zn coatings, the Rp values were all measured between 700 Ω cm² and 1100 Ω cm², for an average value of 900 Ω cm². The polarization resistance of the Zn-15wt.%Al-coated electrodes proved significantly larger, with values between 1600 Ω cm² and 2800 Ω cm² and an average of 2200 Ω cm². This indicates that the Zn-15wt.%Al coating corrodes initially half as fast as the Zn coating.
Polarization curves of coated steel electrodes were acquired after the LPR measurements were performed. One example is displayed for each coating in Figure 4. Both curves are similar, with that of the Zn-15wt.%Al coating located at lower potential and lower current density, in agreement with the obtained OCP and Rp values. The corrosion potential was determined at Ecor = −0.72 ± 0.03 V/SHE for the Zn coating and at Ecor = −0.816 ± 0.004 V/SHE for the Zn-15wt.%Al coating, which confirms that the Zn-Al alloy has lower corrosion potential in these experimental conditions. In both cases, a large plateau is observed in the cathodic domain. It more likely corresponds to the dioxygen reduction process controlled by mass transport. Thanks to this diffusion plateau, the corrosion current density jcor can be estimated with the assumption that the cathodic current density jc at Ecor, i.e., |jc(Ecor)| = jcor, corresponds to the cathodic current density at the diffusion plateau. This leads to average values jcor = 20 µA/cm² and 8 µA/cm² for Zn-coated and Zn-15wt.%Al-coated electrodes, respectively. This result confirms the ratio of ~2 between the corrosion rate of Zn and that of Zn-15wt.%Al in these experimental conditions.
The dissolution in the anodic domain is very active in both cases, associated with a sharp increase of current density with increasing potential. After the reversion of the scan direction, it is observed that the anodic current density is, for the same potential, higher during the reverse scan. The hysteresis effect is more important for the Zn-15wt.%Al coating. This phenomenon can be attributed to modifications of the coating surface induced by the active dissolution of the metal in the anodic domain. An increase of the active area can, for instance, explain the increase of anodic current density. This increase of active area could be due to an increase of surface roughness. Moreover, the coatings are porous and the dissolution of the splats in contact with the electrolyte can increase the pore diameter, favoring the infiltration of the electrolyte deeper inside the coating. This assumption is thoroughly discussed in Section 4.

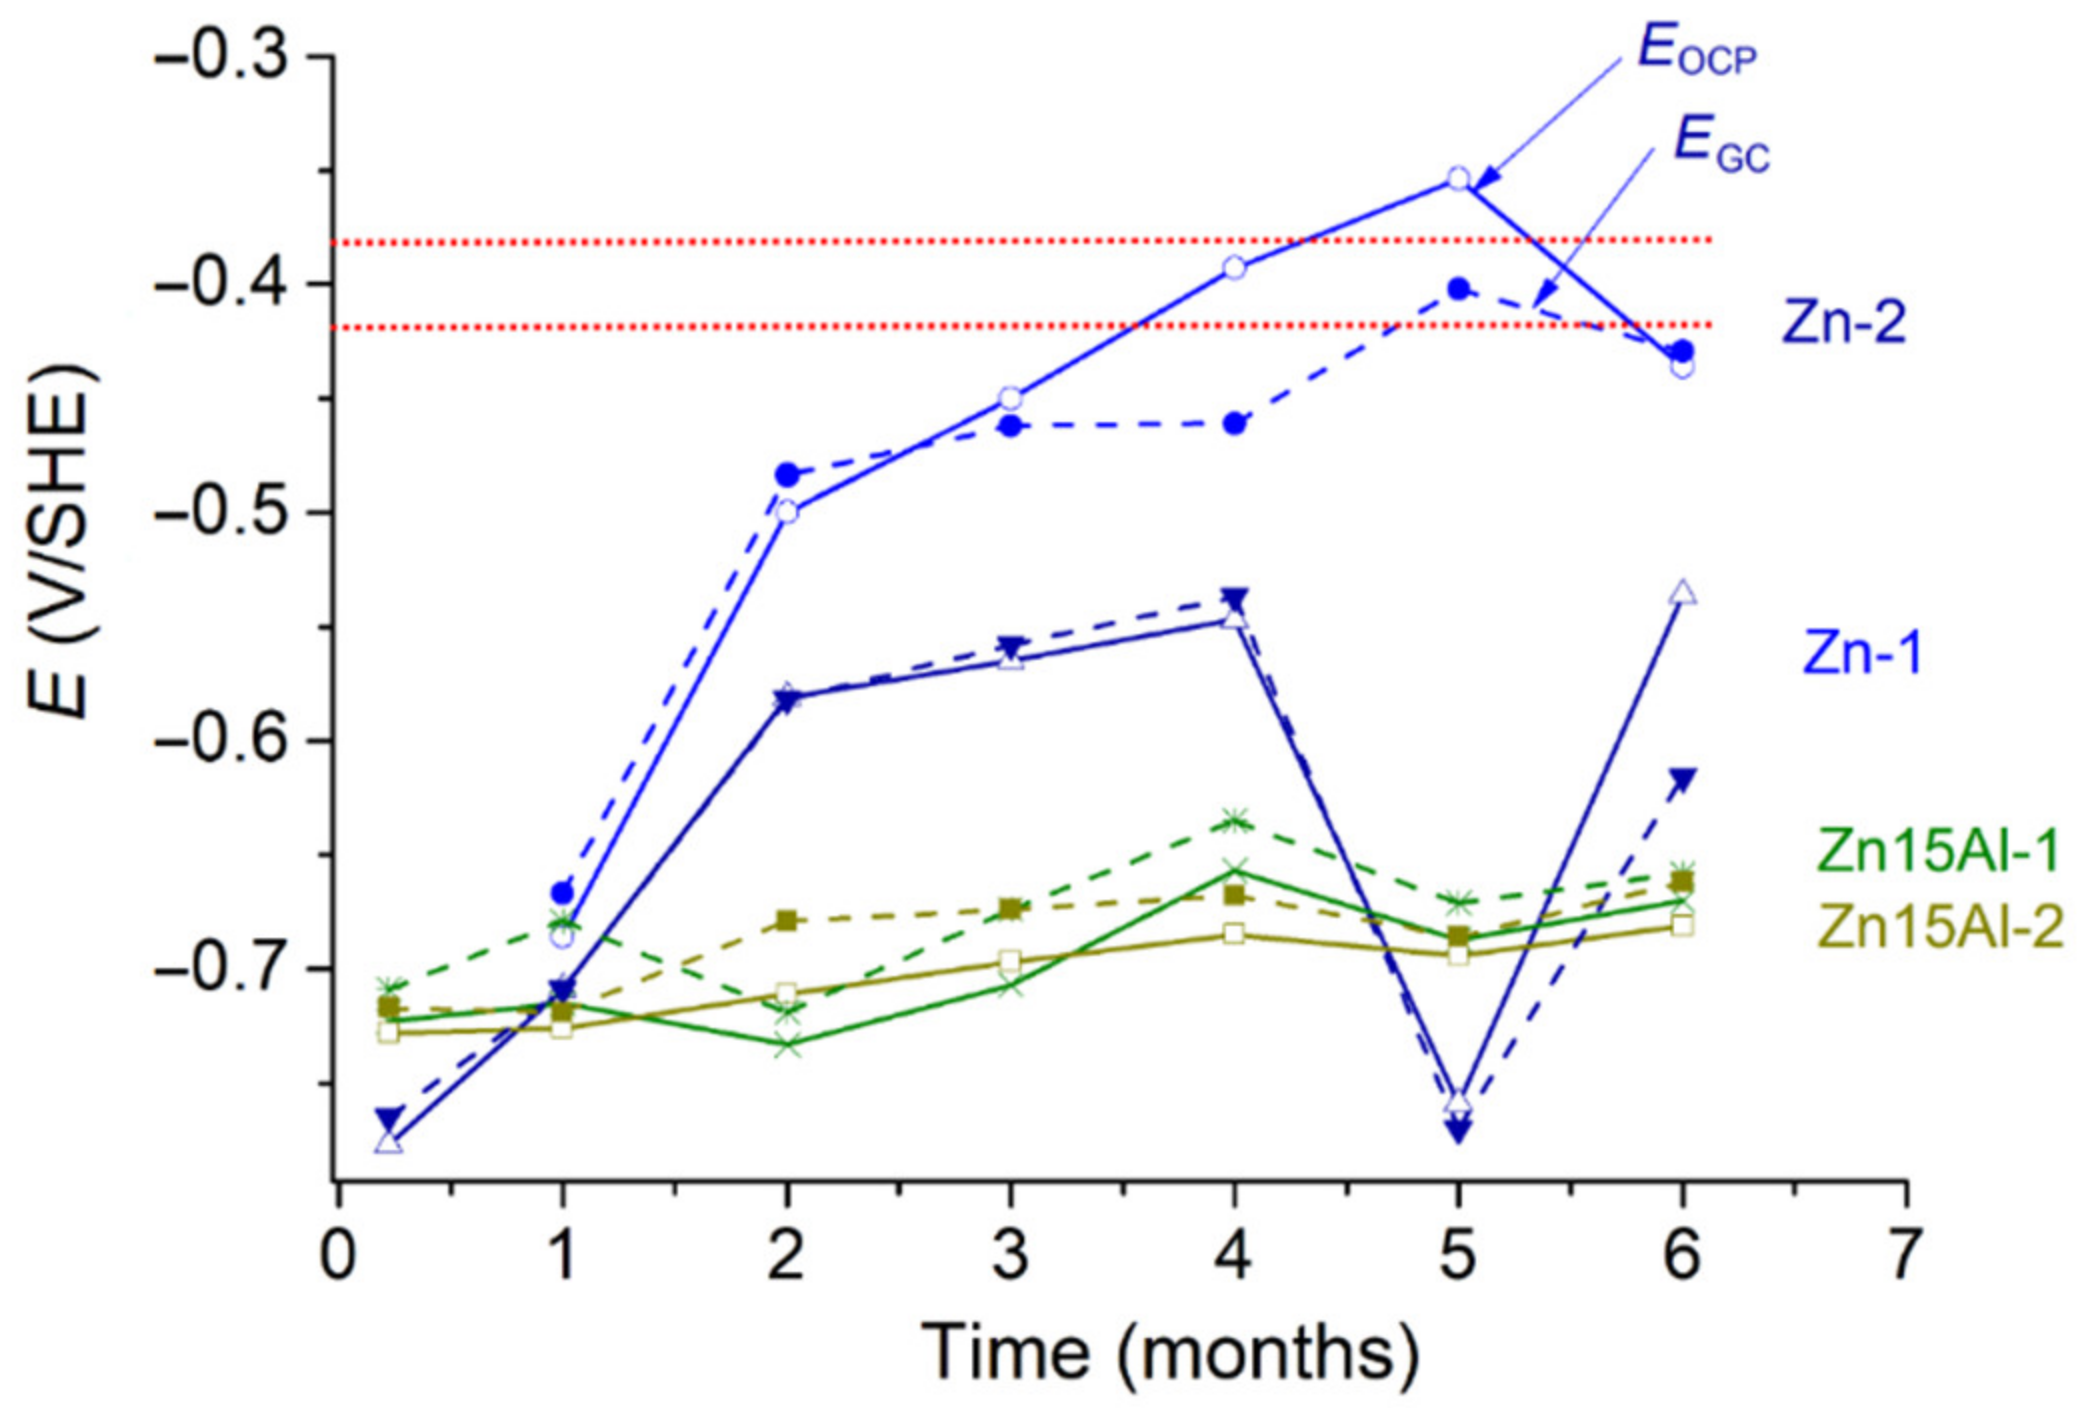
3.3. Galvanic Corrosion Experiments: Electrochemical Study

The evolution over time of the mixed potential for both galvanic couples is compared in Figure 5 with the evolution of the OCP of the coated electrodes. Two cases are shown for each galvanic couple. As described in Section 2.3, the mixed potential EGC was measured at the end of the first week and at the end of each month. Once EGC was measured, the two electrodes were disconnected, and measurements were performed on the coated electrode left at OCP.
The mixed potential of the Zn coating/bare steel couples increased rapidly during the first two months. For the first couple (denoted Zn-1 in Figure 5), EGC thus reached −0.58 V/SHE. It increased more slowly afterwards, up to −0.54 V/SHE at the end of the 4th month. It decreased drastically during the 5th month, down to its initial value. It was measured at −0.62 V/SHE at the end of the experiment. For the second couple (Zn-2), EGC increased even more rapidly during the first two months, and still increased during the following three months, reaching the OCP value of carbon steel, i.e., −0.40 ± 0.02 V/SHE, after five months. EGC decreased slightly afterwards. As revealed by the OCP of the Zn-coated electrodes that is in most cases close to EGC, the evolution over time of the mixed potential is due to that of the potential of the Zn-coated electrode. In the case of the Zn-2 couple, the ennoblement of the Zn coating may have led to an inversion of polarity in the galvanic couple. This is suggested not only by the increase of EGC up to the potential of carbon steel, but also by the comparison between EGC and the OCP of the Zn-coated electrode. After 4 and 5 months, the OCP of the Zn-coated electrode 2 was significantly higher than EGC (difference equal to 70 mV and 50 mV), which indicates that it was also higher than the OCP of the bare steel electrode. The behavior of the Zn-1 couple is more complex; it is thoroughly discussed in Section 3.4.1.
The mixed potential of the Zn-15wt.%Al-coated/bare steel couples remained almost constant, increasing only slightly, from −0.71 V/SHE to −0.66 V/SHE for the Zn-15Al-1 couple, from −0.72 V/SHE to −0.66 V/SHE for the Zn-15Al-2 couple. The OCP values of the corresponding coated electrodes followed the same trend. Consequently, the Zn-15wt.%Al coating provided, in both cases, cathodic protection to the bare steel electrode all along the experiment.
LPR measurements were performed on the coated electrodes while they were still at OCP, disconnected from their paired bare steel electrode. The evolution over time of the obtained Rp values is displayed in Figure 6, with the same two examples as above for each coating. The average values obtained after 1 h of immersion for Zn and Zn-15wt.%Al-coated electrodes (Section 3.2) were added to the graph to illustrate the rapid initial increase of Rp due to the coupling with the bare steel electrode. In any case, the first Rp value measured during the galvanic corrosion experiment, i.e., after 1 week of coupling (1 month for Zn-2) is significantly higher than the initial value. This can be attributed to the rapid formation of a protective layer of corrosion products. Because of the galvanic coupling with the bare steel electrode, the corrosion of the coated electrode is accelerated, and corrosion products are formed massively at the beginning of the process.
In agreement with EGC and OCP measurements, it can be noted that the two Zn-coated electrodes behaved differently. The polarization resistance of Zn-1 increased more slowly; it reached its maximum after two months and remained stable for one more month. It decreased strongly after that, almost down to its initial value, and remained low (~1700 Ω cm2) until the end. For this electrode, the decrease of Rp is simultaneous with the decrease of the OCP down to its initial value. This indicates that the Zn coating has somehow been “reactivated”; electrolyte and dissolved O2 are easily able to reach the metal surface despite the presence of the protective layer of corrosion products. This point is thoroughly discussed in Section 3.4.1.
In contrast, the polarization resistance of coated electrode Zn-2 remained high. After reaching a first maximum of 23,700 Ω cm2 after 1 month, Rp decreased down to a minimum of 11,600 Ω cm2 after 4 months and finally increased again to end at 25,300 Ω cm2. This behavior can be associated with the growth of the corrosion product layer, which induces stress and cracks in the layer, somehow reducing its protective ability but ultimately increasing the protectiveness of the layer. The growth of this layer is more likely to be the origin of the ennoblement of the Zn-coated electrode and the inversion of polarity in the galvanic couple.
After the initial increase, the polarization resistance of both Zn-15wt.%Al-coated electrodes decreased (Zn15Al-2) or remained approximately constant (Zn15Al-1) until the end. The final Rp value of 8500 Ω cm2 measured for Zn15Al-2 was then similar to that measured for Zn15Al-1 that oscillated between 5800 Ω cm2 and 8200 Ω cm2 after its initial increase. These moderate Rp values correspond to moderate corrosion rates, ensuring that (1) the coating remains sufficiently active to provide cathodic protection to bare steel (in agreement with EGC and OCP measurements) and (2) there is a moderate consumption rate of the coating.
EIS measurements were performed on the coated electrodes at OCP, before the reconnection with the paired bare steel electrode. In Figure 7, the Nyquist plots obtained for the Zn-coated electrode 2 are compared with those obtained for the Zn-15wt.%Al-coated electrode 2. The data (not shown) obtained for Zn-15wt.%Al-coated electrode 1 are qualitatively similar and confirmed that both Zn-15wt.%Al-coated electrodes behaved similarly. Those obtained for Zn-coated electrode 1 (not shown) confirmed the “reactivation” of the coating after 4 months, a phenomenon to be discussed later (Section 3.4.1).
For the Zn-15wt.%Al-coated electrode 2, the Nyquist diagrams are mainly constituted of a linear part at high frequency, followed by a capacitive loop at low frequency. The linear part makes an angle with the Re(Z) axis that decreases from 35° after 1 week to 30° after 6 months. This angle value, significantly smaller than 45°, suggests that the Zn-15wt.%Al-coated electrode 2 behaved like a semi-infinite porous electrode [35,36]. This would mean that dissolved O2 diffuses in the pores of a conductive electrode, i.e., the Zn-15wt.%Al coating, and is reduced at the walls of these pores. This point is discussed in Section 4. The extrapolation of the capacitive loop at low frequency can lead to an estimation of the Rp value. Qualitatively, it can be seen that this value decreases continuously from 1 week to 3 months, before it increases again. This is rather consistent with LPR measurements (Figure 6). The extrapolation of the Nyquist curves leads, for instance, to roughly estimated Rp values of 18,000 Ω cm2 after 1 month, 10,000 Ω cm2 after 3 months, and 13,000 Ω cm2 after 4 months. For comparison, LPR measurements led respectively to 16,800 Ω cm2, 12,000 Ω cm2, and 11,000 Ω cm2.
For the Zn-coated electrode 2, the Nyquist diagrams mainly show a straight line that extends from high to low frequency. This line makes an angle measured between 40° and 43° with the Re(Z) axis. This is a typical feature of diffusion impedance and shows that the corrosion process is controlled by the diffusion of dissolved O2. The angle is close to 45°, which is characteristic of the behavior of a planar electrode. This means that, in this second case, the diffusion impedance would describe the diffusion of dissolved O2 inside the pores of a non-conductive layer, which hinders the transport of the O2 molecules towards the coating surface where their reduction takes place. This non-conductive layer more likely corresponds to the protective corrosion product layer that forms on the Zn-coated electrodes and leads to high Rp values. The Nyquist diagrams cannot be reliably extrapolated at very low frequency to estimate an Rp value because the linear part, in most cases, does not show any trend to curve in the considered frequency domain. It can however be seen that this extrapolation would lead to high Rp values, in agreement with LPR measurements.

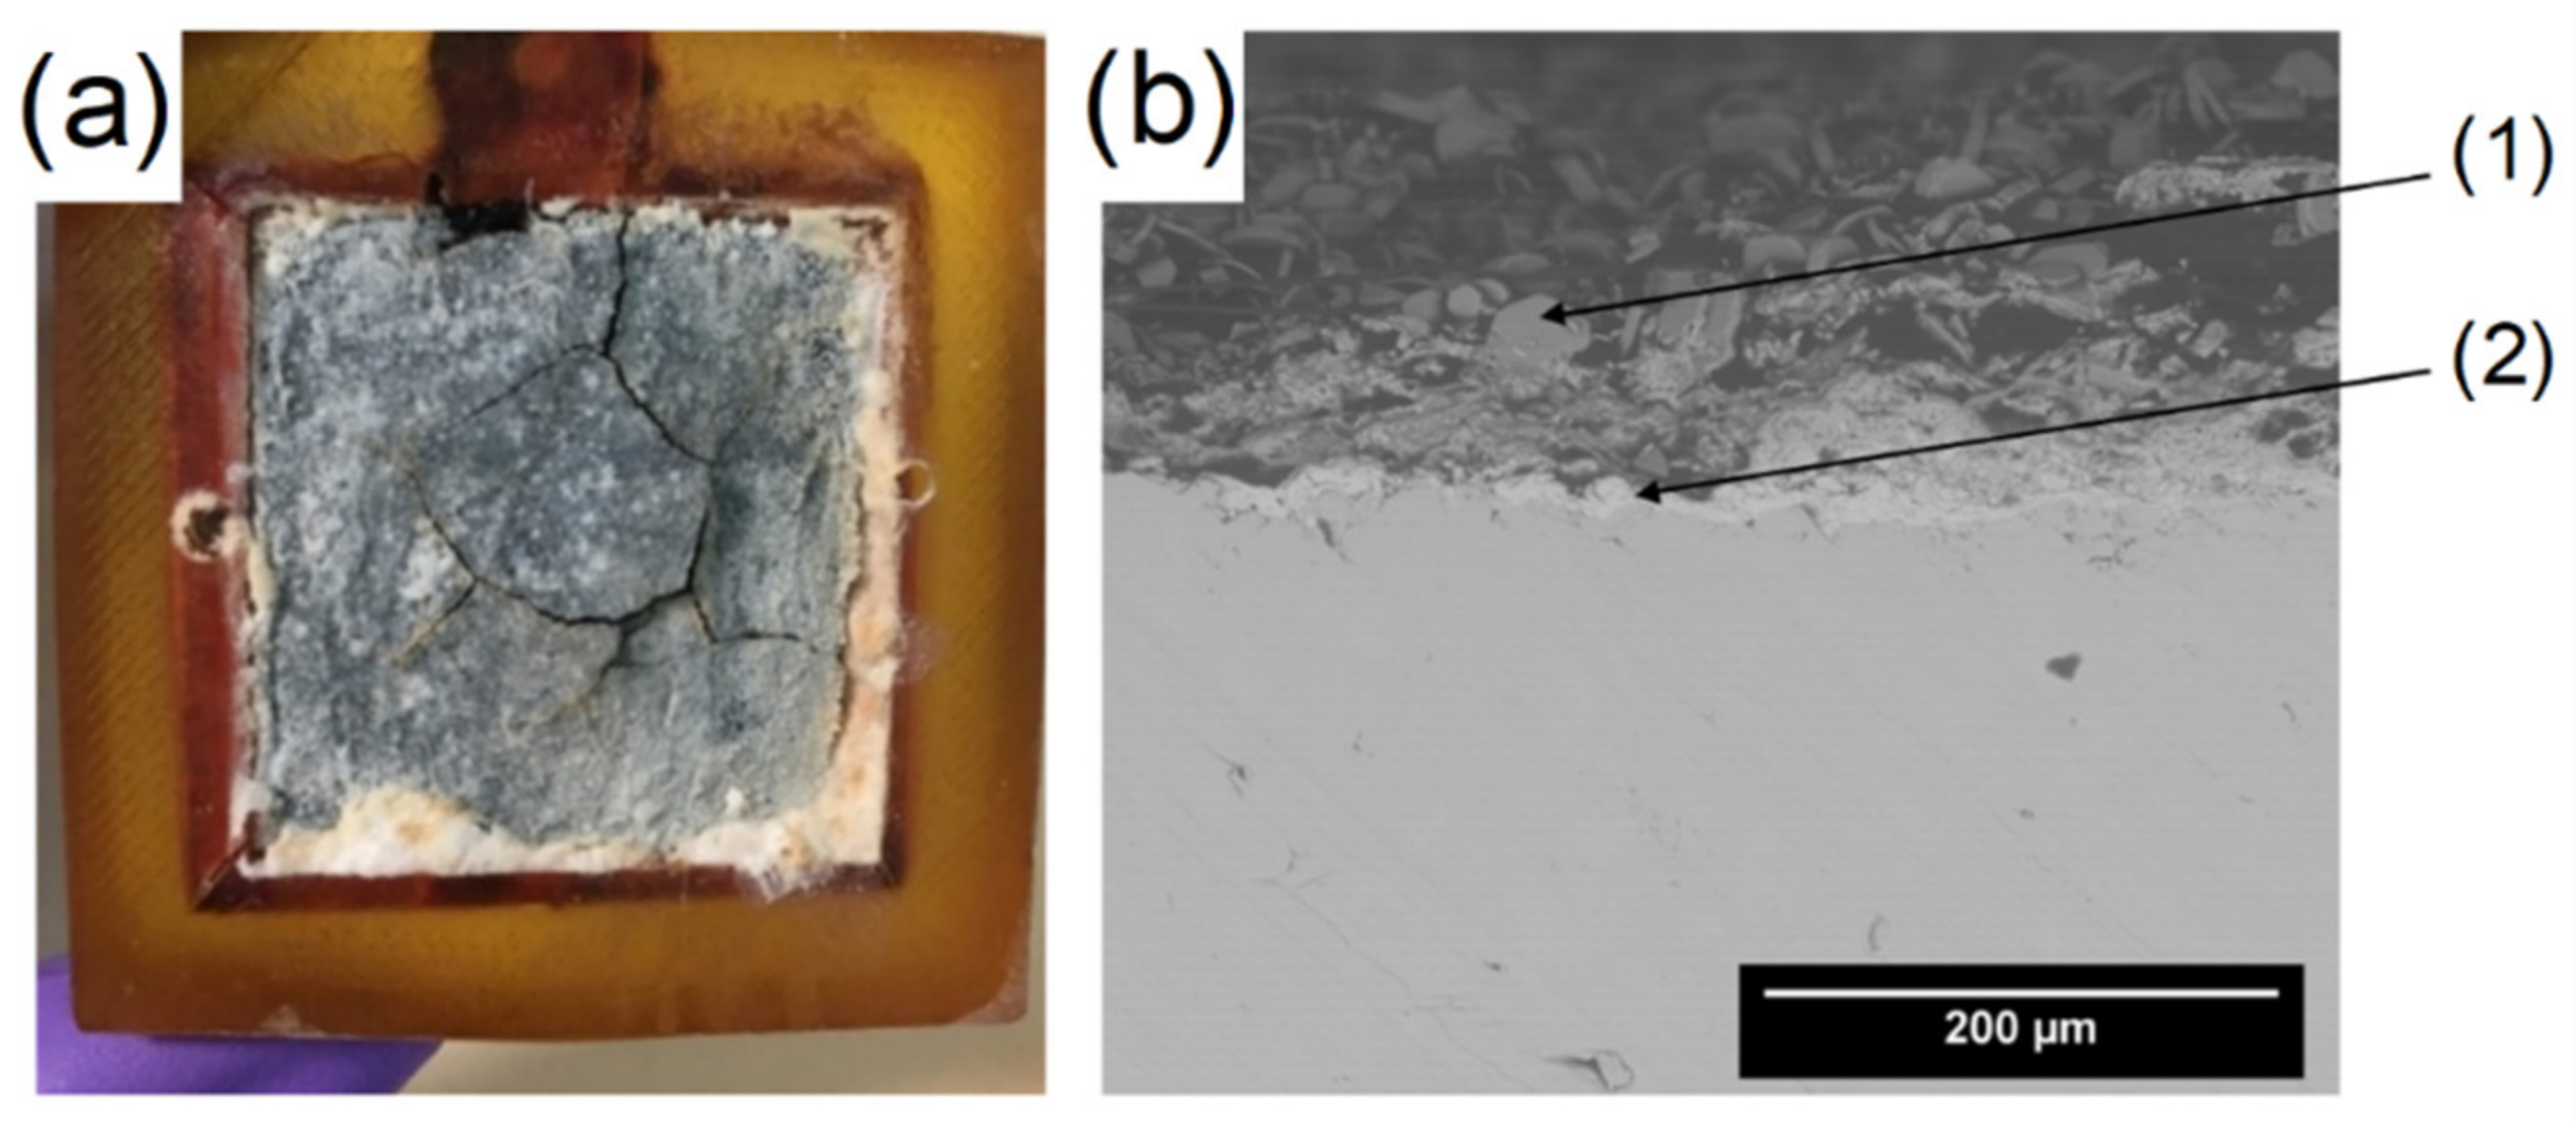
3.4. Characterization of the Electrodes after the Galvanic Corrosion Experiment

3.4.1. Zn Coatings

First, a visual observation of Zn-coated electrode 1 revealed the presence of deep cracks in the coating (Figure 8a). Cross-sections were observed by SEM to determine whether these cracks were associated with a loss of adhesion of the coating onto the steel substrate (Figure 8b). A large non-adherent fragment of the coating was peeled off and it could then be observed that a thin layer of the Zn coating remained on the substrate (zone 2). The EDS analysis confirmed that this thin layer was only composed of Zn, with a small amount of oxygen (4 at.%). It must be recalled that the pull-off experiments carried out before the corrosion experiments (Section 3.1) revealed that the Zn coatings were prone to an internal loss of cohesion. The weakness of the Zn coatings explains the cracking and delamination observed for Zn-1 after the galvanic corrosion experiment.
The remaining thin Zn layer was itself covered with Zn corrosion products (zone 1), which demonstrated that the electrolyte had seeped through the cracks between the non-adherent large coating fragment and the thin layer remaining in contact with the substrate. The EDS analysis of zone 1 revealed that in the corrosion products, Zn was mainly associated with oxygen (O/Zn atomic ratio = 2.3), sulfur (Zn/S atomic ratio = 7), and silicon (Zn/Si atomic ratio = 12).
For Zn-coated electrode 2, such cracks were not observed. This explains why the electrochemical behavior of the two Zn-coated electrodes was different. For Zn-2, the main effect was that of the protective corrosion product layer. This layer hindered the transport of O2, leading to an ennoblement of the electrode and to an inversion of polarity (Figure 5). For Zn-coated electrode 1, the loss of cohesion inside the coating allowed the infiltration of the electrolyte. This phenomenon more likely took place between the 4th and the 5th month of the experiment and led to the decrease of both OCP and Rp down to their initial values (Figure 5 and Figure 6); it explains the “reactivation” of the Zn-coated electrode. Finally, the following re-increase of OCP and Rp between the 5th and the 6th month could be due to the formation of protective corrosion products on the thin inner remaining layer of Zn (and more likely on the back of the delaminated fragment of the coating).
Zn-coated electrode 2 was in fact completely covered with a white layer of corrosion products. Its thickness was, as that of the layer covering the first Zn-coated electrode, very heterogeneous, with mounds of fluffy materials on various parts of the surface, mostly at the periphery of the electrode (see Figure 8a, example of Zn-1 coating). The regions covered with these fluffy materials most likely remained anodic for a longer time, presumably the consequence of edge effects at the coating/resin boundary. This fluffy material did not adhere to the surface and was removed during the preparation of the cross-sections (when sawing).
The adherent part of the corrosion product layer was characterized by XRD (Figure 9). The obtained pattern displays the main diffraction peaks of Zn (the coating), zincite (ZnO), hemimorphite (Zn4Si2O7(OH)2·H2O), and those of two hydrated Zn(II) hydroxysulfates (Zn4SO4(OH)6·H2O and Zn4SO4(OH)6·5H2O, also known as osakaite). This result is consistent with the EDS analysis of the corrosion products formed “inside” the coating of the Zn-1 electrode, which revealed the presence of S, present in the hydroxysulfates, and Si, present in hemimorphite. A calcium carbonate (CaCO3) phase, namely aragonite, was also identified. SEM observations of the Zn-2 electrode (not shown) confirmed that aragonite needles were mixed with corrosion products in the mineral layer covering the surface.
Finally, µ-RS analysis (Figure 10) confirmed the formation of hemimorphite, clearly identified by Raman peaks at 112 cm−1, 136 cm−1, 170 cm−1, 211 cm−1, 332 cm−1, 405 cm−1, 452 cm−1, 676 cm−1, and 963 cm−1 [37].
After the observation and analysis were achieved, the corrosion product layer was scraped from the electrode surface. The obtained powder was compacted to form a solid pastille, which was analyzed by µ-XRF. The average Si content was determined at 14 wt.%, demonstrating that hemimorphite was one of the main components of the protective corrosion product layer formed on the Zn-coated electrode 2.

3.4.2. Zn-15wt.%Al Coatings

The Zn-15wt.%Al coatings were both covered with a white corrosion product layer that adhered loosely to the metal surface in various areas. This simple fact explains why this layer was less protective than that formed on the Zn coatings, which appeared to be more compact and adherent. Moreover, its composition was different too, as shown by the XRD pattern and the Raman spectrum displayed in Figure 11.
The XRD pattern is composed of the diffraction peaks of Zn and Al (i.e., the coating), zincite (ZnO), Zn4SO4(OH)6·H2O (one of the two Zn(II)-hydroxysulfates also identified on the Zn-coated electrode 2), and a Zn(II)-Al(III) hydroxysulfate (with a composition that can be expressed as 5ZnOAl2O3ZnSO4·15H2O according to the ICDD-JCPDS file). Hemimorphite could not be identified, more likely because Al(III) favored the formation of the Zn(II)-Al(III) hydroxysulfate. Raman analysis did not reveal hemimorphite either, which shows that this compound was only a minor component or did not form at all. The typical spectrum displayed in Figure 11b is mainly composed of Raman bands associated with sulfate vibration modes. The intense sharp peak at 964 cm−1 is attributed to the ν1 mode, the peak at 447 cm−1 to the ν2 mode, and those at 605 cm−1 and 674 cm−1 to the ν4 mode of the sulfate ion [38]. This spectrum could not be entirely interpreted but it confirms that the corrosion products contain sulfate ions, i.e., are mainly hydroxysulfates as demonstrated by XRD.
The results of the SEM/EDS analysis of the Zn-15wt.%Al coatings are summarized in Figure 12. First, aragonite needles are seen amongst the Zn and Al corrosion products (Figure 12a). However, aragonite was only found locally in this case and could not be identified by XRD (see Figure 11). The EDS analysis led to the detection of Si, but in a very small amount, its weight fraction being comprised between 0.61% and 0.85%. This definitively confirms that hemimorphite remained in this case a minor component. It is even possible that the Si atoms detected here correspond to adsorbed silicate ions, i.e., that hemimorphite did not form at all.
The cross-section observations (Figure 12b,c) of the Zn-15wt.%Al coatings revealed that all the splats were oxidized, even deep inside the coating. Moreover, the thickness of the coating increased from 500 µm to 745 ± 25 µm, a “swelling” corresponding to an increase of the coating thickness by 50%. The detailed view presented in Figure 12c, obtained with back-scattered electrons, clearly shows the metal (light grey, 1) and the oxidized zones, mainly corresponding to the periphery of the splats (dark grey, 2). The EDS analysis of the dark grey zones (2) revealed 38 wt.% of oxygen, a weight fraction like that measured in the corrosion product layer formed at the surface of the electrode. Finally, a freeze-fracturing method was used to obtain cross-sections of the coated steel electrodes, as explained in Section 2.4. The aim of this additional analysis was to ascertain that the oxidation process did not take place during the preparation of the cross-sections in air at room temperature with a wire saw. The resulting SEM image is presented in Figure 12d. The oxidation of the periphery of the splats is once again clearly seen.
The average thickness of the layer covering the Zn-15wt.%Al coatings was about 130 µm, as observed in some SEM cross-section images. Because of the infiltration of solution inside the coatings and the resulting corrosion of the splats, the thickness of the corrosion product layer is however not representative of the degradation. The main concern is the swelling of the coating, addressed in Section 4.

3.4.3. Bare Steel Electrodes

The surface of the bare steel electrodes connected to the coated electrodes during the galvanic corrosion experiment was carefully studied. Three of them, those connected to the two Zn-15wt.%Al coatings and the one connected to the Zn-1 electrode, were covered with a thick white mineral layer. XRD analysis (Figure 13a) demonstrated that the white mineral was aragonite CaCO3. The formation of this mineral in calcium- and carbonate-containing media on surfaces protected by cathodic protection (CP) is a well-known phenomenon known as “calcareous deposition” [39,40]. It results from the increase of interfacial pH associated with the reduction of dissolved O2, a reaction that produces OH ions. It thus takes place at the defects in sacrificial coatings and can even take place in cathodic areas of steel surfaces at OCP [41,42].
The steel surface under the aragonite layer was visually undamaged. These results confirm that both Zn-15wt.%Al-coated electrodes provided cathodic protection to the bare steel electrode, as already indicated by the electrochemical study. The Zn-coated electrode 1 also provided sufficient protection, owing to the “reactivation” of the Zn surface associated with the delamination of the coating.
In contrast, the surface of the bare steel electrode connected to the Zn-coated electrode 2 suffered a significant corrosion process, as clearly revealed by visual observation (Figure 13b). Two-thirds of the surface of this electrode was covered with a white layer of aragonite but one-third of the surface was covered with a dark-brown corrosion product layer. The Raman spectrum of Figure 13b is typical of the main compound identified in this layer. This spectrum is mainly composed of one peak, located at 673 cm−1, and is characteristic of magnetite (Fe3O4). This finding is consistent with a previous study dealing with the behavior of carbon steel in the specific conditions of the Cigéo waste management project [43]. Magnetite was observed as the main corrosion product of steel in these conditions, because its formation was favored by the alkaline conditions induced by the cementitious material to be injected between the steel casing and the claystone. “Solution 15” has a pH of 10 (at 50 °C) for this reason. In agreement with the electrochemical study, the Zn-coated electrode 2 did not provide cathodic protection all along the 6-month experiment.

4. Discussion

According to the preliminary results obtained via the present study, thermally sprayed sacrificial metallic coatings could indeed be considered to protect some strategic parts of the carbon steel overpacks containing vitrified radioactive waste as planned in the French Cigéo project managed by Andra. However, composition of coating and elaboration process will have to be optimized. In this work, wire-arc-sprayed Zn and Zn-15wt.%Al coatings were tested.
The main results were obtained with 6-month galvanic corrosion experiments performed at 80 °C in an electrolyte that simulates the solution expected to reach the overpacks. They showed that Zn coatings tended to be rapidly covered with a protective layer of corrosion products. This process led to an ennoblement of the Zn coating, inducing after 3–4 months the loss of the galvanic protection. The formation of a protective layer of Zn corrosion products at temperatures above 60 °C is a well-known phenomenon (“passivation” of zinc), which may lead to an inversion of polarity [11,14,15]. This was also observed here (see Figure 5: OCP of Zn-coated electrode > OCP of bare steel electrode). “Passivation” of zinc is generally associated with the formation of carbonated zinc corrosion products. Such compounds were not detected here, which implies that another phase induced, in the experimental conditions considered here, the passivation and the subsequent loss of sacrificial properties.
Aragonite CaCO3 was observed to be one of the main components of the mineral layer covering the Zn-2 electrode surface. This result is consistent with the assumption of an inversion of polarity. As demonstrated by the analysis of the layer covering the bare steel electrodes connected to the Zn-15 wt.%Al electrodes, which remained cathodes in the galvanic couple, aragonite results from the cathodic polarization that induces an increase of the interfacial pH. Its formation in large amounts on the Zn-2-coated electrode would have then mainly occurred after the inversion of polarity, when the Zn-2-coated electrode became the cathode.
Aragonite is a metastable form of CaCO3, calcite being the stable polymorph at room temperature. In seawater, it is however the main component of the calcareous deposit that results from cathodic protection because the Mg2+ ions present in seawater favor aragonite over calcite, an effect that increases with temperature [44]. The electrolyte used for the current study, i.e., “solution 15”, does not contain Mg2+ ions but aragonite is favored by various divalent cations [45]. Some of them, in particular Fe2+ and Zn2+, have stronger effects than Mg2+ [45]. Consequently, it can be proposed that the dissolved Zn(II) species produced by the corrosion of the coatings, associated with the high temperature, are responsible for the inhibition of calcite and the formation of aragonite instead.
The inversion of polarity is generally attributed to the formation of a protective corrosion product layer that hinders the dissolution of the Zn coating (“passivation” of Zn). In the experimental conditions considered here, the protective behavior of the corrosion product layer is more likely due to the formation of hemimorphite, Zn4Si2O7(OH)2·H2O, because this compound was (i) one of the main components of the Zn corrosion product layer, and was (ii) specific to Zn-coated electrodes, i.e., did not form on Zn-15wt.%Al-coated electrodes.
Hemimorphite is not a common corrosion product of zinc. It was however identified previously on zinc coatings covering water service steel pipes [46]. This non-conductive product, typical of silicate-containing media, forms via a three-step process. The first step is the precipitation of Zn(OH)2. The second step is the adsorption of silicate ions on the surface of Zn(OH)2, which induces a breakdown of the zinc hydroxide structure, leading to an amorphous compound. The third and last step is a reorganization of atoms that finally leads to the body-centered orthorhombic structure of hemimorphite. Nagata et al. [46,47] suggested that the formation of a hemimorphite layer on Zn limited the galvanic protection of steel. This non-conductive compound is indeed likely to hinder the diffusion of dissolved O2, as observed here by EIS (Section 3.3).
Note that if hemimorphite indeed limits the cathodic reaction rate on the Zn surface, the observed inversion of polarity (OCP of Zn-coated electrode > OCP of bare steel electrode) may not significantly increase the corrosion rate of the bare steel.
In contrast, the Zn-15wt.%Al coatings provided cathodic protection all along the 6-month experiments and thus proved to be efficient at that time scale. Hemimorphite was not identified among the corrosion products, more likely because Al(III) ions favored the formation of a Zn(II)-Al(III) hydroxysulfate instead. Assuming, as explained above, that hemimorphite is the corrosion product responsible for the loss of the galvanic protection for the Zn-coated electrodes, it can be proposed conversely that the absence of hemimorphite on Zn-15wt.%Al coatings is the key point that ensured the galvanic protection all along the 6-month galvanic corrosion experiment. The local identification of some aragonite only indicates the presence of micrometric cathodic sites in this case.
However, the electrolyte rapidly seeped into the coating via the network of interconnected pores running through the splats, and infiltrated its entire thickness after the 6-month experiment. Associated with the formation of corrosion products at the periphery of the splats, this infiltration induced a notable swelling of the coating, whose thickness increased by 50%. This phenomenon is the reason why the EIS results indicated that the Zn-15wt.%Al coating behaved as a porous electrode. Dissolved O2 indeed diffused inside the pores between the splats, and its reduction could take place at any place inside the coating at the available surface of the splats. This infiltration phenomenon in wire-arc-sprayed Zn-Al coatings was already reported. For instance, Katayama et al. [6] observed it for a Zn-30wt.%Al coating during long-term atmospheric corrosion experiments (32 years).
To determine how the infiltration of the electrolyte in the coating progressed with time, an additional 3-day immersion experiment was carried out. The cross-section SEM image of the coating after this experiment is shown in Figure 14. It reveals that approximately 40% of the coating thickness was affected by the infiltration of the electrolyte, which induced the oxidation of the periphery of the splats. In this part of the coating, the EDS analysis led to oxygen content of 24 at.%. In the inner part of the coating, this content was only 7 at.%, confirming that the splats were not corroded, i.e., that the solution did not seep in this deep. The infiltration of electrolyte already induced a significant swelling of the coating; its thickness was 570 ± 20 µm after the 3-day immersion period, i.e., had increased by 13%.
The important swelling observed after 6 months is more likely due to the accumulation of electrolyte and corrosion products in the pores between the splats, which induces internal stress and tends to separate the splats. However, both Zn-15wt.%Al coatings remained cohesive and adherent to the steel substrate after the 6-month galvanic corrosion experiment. Nevertheless, it is questionable whether the mechanical integrity of the coating can persist for longer times.

5. Conclusions

The main conclusion to retain from this preliminary study is that none of the considered wire-arc-sprayed coatings could actually be used for the Cigéo project. First, the Zn coating led to an inversion of polarity and can be discarded. Secondly, the important swelling of the Zn-15wt.%Al coating should be considered as a risk for the envisioned long-term application. Nevertheless, the Zn-15wt.%Al coating gave satisfactory results in these 6-month experiments, which validates the possibility to use Zn-Al coatings in the specific conditions of the current radioactive waste management concept. Further work is now required (i) to optimize the coating elaboration process and (ii) to optimize the composition of the coating (i.e., the Al wt.%).

Author Contributions

Conceptualization, J.C., R.S., N.T.-M. and P.R.; methodology, J.C., R.S., N.T.-M. and P.R.; validation, J.C., R.S., N.T.-M., D.C. and P.R.; formal analysis, A.M., J.C., R.S., N.T.-M. and P.R.; investigation, A.M., J.C., R.S. and P.R.; writing—original draft preparation, A.M. and P.R.; writing—review and editing, J.C., R.S., N.T.-M. and P.R.; visualization, A.M. and P.R.; supervision, J.C., N.T.-M., R.S. and P.R.; project administration, P.R., J.C. and N.T.-M.; funding acquisition, N.T.-M. and D.C. All authors have read and agreed to the published version of the manuscript.

Funding

This research received no external funding.

Institutional Review Board Statement

Not applicable.

Informed Consent Statement

Not applicable.

Data Availability Statement

The data presented in this study are available on request from the corresponding author.

Acknowledgments

This study was financially supported by the French National Radioactive Waste Management Agency (Andra) as part of the PhD of Alice Martin. The authors also acknowledge the technical/scientific support of CITRA (Régis Aumaître and Aurélie Dard) for the elaboration of the wire arc coatings, Christelle Rébéré for the µ-XRF analysis, Egle Conforto and Guillaume Lotte for SEM/EDS characterization, Cyril Berziou for TDS analysis, Valérie Maillot for fruitful discussion, and Bodycote (Ambazac) for the pull-off experiments.

Conflicts of Interest

The authors declare no conflict of interest.

References

  1. Dupuis, M.C.; Gonnot, F.M. [The Cigéo Project]: Meuse/Haute-Marne Reversible Geological Disposal Facility for Radioactive Waste; Reference 504va; Andra: Châtenay-Malabry, France, 2013. [Google Scholar]
  2. Necib, S.; Bumbieler, F.; Duret-Thual, C.; Bulidon, N.; Crusset, D.; Combrade, P. Assessment of the resistance to environmentally assisted cracking (EAC) of C-steel casing and overpack in the COx claystone. Corros. Eng. Sci. Technol. 2017, 52, 95–100. [Google Scholar] [CrossRef]
  3. Rincón, O.T.; Rincón, A.; Sánchez, M.; Romero, N.; Salas, O.; Delgado, R.; López, B.; Uruchurtu, J.; Marroco, M.; Panossian, Z. Evaluating Zn, Al and Al–Zn coatings on carbon steel in a special atmosphere. Construct. Buil. Mater. 2009, 23, 1465–1471. [Google Scholar] [CrossRef]
  4. Büteführ, M. Zinc-Aluminium-Coatings as Corrosion Protection for Steel. Mater. Corros. 2007, 58, 721–726. [Google Scholar] [CrossRef]
  5. Kaewmaneekul, T.; Lothongkum, G. Effect of aluminium on the passivation of zinc–aluminium alloys in artificial seawater at 80 °C. Corros. Sci. 2013, 66, 67–77. [Google Scholar] [CrossRef]
  6. Katayama, H.; Kuroda, S. Long-term atmospheric corrosion properties of thermally sprayed Zn, Al and Zn–Al coatings exposed in a coastal area. Corros. Sci. 2013, 76, 35–41. [Google Scholar] [CrossRef]
  7. Beverskog, B.; Puigdomenech, I. Revised Pourbaix diagrams for zinc at 25–300 °C. Corros. Sci. 1997, 39, 107–114. [Google Scholar] [CrossRef]
  8. Yoo, J.D.; Volovitch, P.; Abdel Aal, A.; Allely, C.; Ogle, K. The effect of an artificially synthesized simonkolleite layer on the corrosion of electrogalvanized steel. Corros. Sci. 2013, 70, 1–10. [Google Scholar] [CrossRef]
  9. Ligier, V.; Wery, M.; Hihn, J.-Y.; Faucheu, J.; Tachez, M. Formation of the main atmospheric zinc end products: NaZn4Cl(OH)6SO4·6H2O, Zn4SO4(OH)6·nH2O and Zn4Cl2(OH)4SO4·5H2O in [Cl] [SO42−] [HCO3] [H2O2] electrolytes. Corros. Sci. 1999, 41, 1139–1164. [Google Scholar] [CrossRef]
  10. Odnevall, I.; Leygraf, C. The formation of Zn4SO4(OH)6·4H2O in a rural atmosphere. Corros. Sci. 1994, 36, 1077–1091. [Google Scholar] [CrossRef]
  11. Glass, G.K.; Ashworth, V. The corrosion behavior of the zinc-mild steel galvanic cell in hot sodium bicarbonate solution. Corros. Sci. 1985, 25, 971–983. [Google Scholar] [CrossRef]
  12. Yoo, J.D.; Ogle, K.; Volovitch, P. The effect of synthetic zinc corrosion products on corrosion of electrogalvanized steel: I Cathodic reactivity under zinc corrosion products. Corros. Sci. 2014, 81, 11–20. [Google Scholar]
  13. Kaesche, H. The passivity of zinc in aqueous solutions of sodium carbonate and sodium bicarbonate. Electrochim. Acta 1964, 9, 383–394. [Google Scholar] [CrossRef]
  14. Fraunhofer, J.A.; Lubinski, A.T. Polarity reversal in the zinc-mild steel couple. Corros. Sci. 1974, 14, 225–232. [Google Scholar] [CrossRef]
  15. Fontana, M.G. Corrosion Engineering, 3rd ed.; McGraw-Hill: Singapore, 1987. [Google Scholar]
  16. Gouda, V.K.; Khedr, M.G.A.; Shams El Din, A.M. Role of anions in the corrosion and corrosion-inhibition of zinc in aqueous solutions. Corros. Sci. 1967, 7, 221–230. [Google Scholar] [CrossRef]
  17. Baugh, L.M. Corrosion and polarization characteristics of zinc in neutral—Acid media—I. Pure zinc in solutions of various sodium salts. Electrochim. Acta 1979, 24, 657–667. [Google Scholar] [CrossRef]
  18. G’ulec, A.; Cevher, O.; Turk, A.; Ustel, F.; Yilmaz, F. Accelerated corrosion behaviors of Zn, Al and Zn/15Al coatings on a steel surface. Mater. Tehnol. 2011, 45, 477–482. [Google Scholar]
  19. Panossian, Z.; Mariaca, L.; Morcillo, M.; Flores, S.; Rocha, J.; Peña, J.J.; Herrera, F.; Corvo, F.; Sanchez, M.; Rincon, O.T.; et al. Steel cathodic protection afforded by zinc, aluminium and zinc/aluminium alloy coatings in the atmosphere. Surf. Coat. Technol. 2005, 190, 244–248. [Google Scholar] [CrossRef]
  20. Hansen, P.M. Constitution of binary alloys, 2nd ed.; Mc Graw-Hill Book Co.: New York, NY, USA, 1958; pp. 962–963. [Google Scholar]
  21. Vu, T.N.; Mokaddem, M.; Volovitch, P.; Ogle, K. The anodic dissolution of zinc and zinc alloys in alkaline solution. II. Al and Zn partial dissolution from 5% Al–Zn coatings. Electrochim. Acta 2012, 74, 130–138. [Google Scholar] [CrossRef]
  22. Vu, T.N.; Volovitch, P.; Ogle, K. The effect of pH on the selective dissolution of Zn and Al from Zn–Al coatings on steel. Corros. Sci. 2013, 67, 42–49. [Google Scholar] [CrossRef]
  23. Proner, A. Revêtements Par Projection Thermique; Techniques de l’Ingénieur: Saint-Denis, France, 1999; M1645 V2. (In French) [Google Scholar]
  24. Chen, T.-C.; Chou, C.-C.; Yung, T.-Y.; Tsai, K.-C.; Huang, J.-Y. Wear behavior of thermally sprayed Zn/15Al, Al and Inconel 625 coatings on carbon steel. Surf. Coat. Technol. 2016, 303, 78–85. [Google Scholar] [CrossRef]
  25. Bonabi, S.F.; Ashrafizadeh, F.; Sanati, A.; Nahvi, S.M. Structure and Corrosion Behavior of Arc-Sprayed Zn-Al Coatings on Ductile Iron Substrate. J. Therm. Spray Technol. 1998, 27, 524–537. [Google Scholar] [CrossRef]
  26. Tailor, S.; Modi, A.; Modi, S.C. Synthesis, microstructural, corrosion and antimicrobial properties of Zn and Zn–Al coatings. Surf. Eng. 2009, 35, 736–742. [Google Scholar] [CrossRef]
  27. Lee, H.-S.; Singh, J.K.; Ismail, M.A.; Bhattacharya, C.; Seikh, A.H.; Alharthi, N.; Hussain, R.R. Corrosion mechanism and kinetics of Al-Zn coating deposited by arc thermal spraying process in saline solution at prolong exposure periods. Sci. Rep. 2019, 9, 3399. [Google Scholar] [CrossRef]
  28. Nakano, A.; Oshikawa, W.; Yonezawa, N. Evaluation of corrosion properties of steel with Zn30 mass% Al thermal-spray coating using accelerated atmospheric exposure test. Mater. Trans. 2021, 62, 1001–1008. [Google Scholar] [CrossRef]
  29. Griñon-Echaniz, R.; Paul, S.; Thornton, R.; Refait, P.; Jeannin, M.; Rodriguez, A. Prediction of Thermal Spray Coatings Performance in Marine Environments by Combination of Laboratory and Field Tests. Coatings 2021, 11, 320. [Google Scholar] [CrossRef]
  30. Chen, W.; Wang, Z.; Xu, G.; Song, W.; Xie, Y.; Zhao, L.; Xia, M.-H.; Li, W. Friction and anti-corrosion characteristics of arc sprayed Al-Zn coatings on steel structures prepared in atmospheric environment. J. Mater. Res. Technol. 2021, 15, 6562–6573. [Google Scholar] [CrossRef]
  31. BS EN 10222-4; 1999 Standard: Steel forgings for Pressure Purposes. Weldable Fine-Grain Steels with High Proof Strength. The British Standards Institution: London, UK, 2017.
  32. Azarmi, F.; Sevostianov, I. Comparative micromechanical analysis of alloy 625 coatings deposited by air plasma spraying, wire arc spraying, and cold spraying technologies. Mech. Mater. 2020, 144, 103345. [Google Scholar] [CrossRef]
  33. Steffens, H.-D.; Nassenstein, K. Influence of the Spray Velocity on Arc-Sprayed Coating Structures. J. Thermal Spray Technol. 1999, 8, 454–460. [Google Scholar] [CrossRef]
  34. ASTM C633-01; Standard Test Method for Adhesion or Cohesion Strength of Thermal Spray Coatings. ASTM International: West Conshohocken, PA, USA, 2008.
  35. Barcia, O.E.; D’Elia, E.; Frateur, I.; Mattos, O.R.; Pébère, N.; Tribollet, B. Application of the impedance model of de Levie for the characterization of porous electrodes. Electrochim. Acta 2002, 47, 2109–2116. [Google Scholar] [CrossRef]
  36. Sancy, M.; Gourbeyre, Y.; Sutter, E.M.M.; Tribollet, B. Mechanism of corrosion of cast iron covered by aged corrosion products: Application of electrochemical impedance spectrometry. Corros. Sci. 2010, 52, 1222–1227. [Google Scholar] [CrossRef]
  37. Frost, R.L.M.; Bouzaid, J.M.; Reddy, B.J. Vibrational spectroscopy of the sorosilicate mineral hemimorphite Zn4(OH)2Si2O7·H2O. Polyhedron 2007, 26, 2405–2412. [Google Scholar] [CrossRef]
  38. Berenblut, B.J.; Dawson, P.; Wilkinson, G.R. The Raman spectrum of gypsum. Spectrochim. Acta 1971, 27, 1849–1863. [Google Scholar] [CrossRef]
  39. Hartt, W.H.; Culberson, C.H.; Smith, S.W. Calcareous deposits on metal surfaces in seawater- A critical review. Corrosion 1984, 40, 609–618. [Google Scholar] [CrossRef]
  40. Lee, R.U.; Ambrose, J.R. Influence of cathodic protection parameters on calcareous deposit formation. Corrosion 1986, 44, 887–891. [Google Scholar] [CrossRef]
  41. Refait, P.; Grolleau, A.-M.; Jeannin, M.; François, E.; Sabot, R. Localized corrosion of carbon steel in marine media: Galvanic coupling and heterogeneity of the corrosion product layer. Corros. Sci. 2016, 111, 583–595. [Google Scholar] [CrossRef]
  42. Duboscq, J.; Sabot, R.; Jeannin, M.; Refait, P. Localized corrosion of carbon steel in seawater: Processes occurring in cathodic zones. Mater. Corros. 2019, 70, 973–984. [Google Scholar] [CrossRef]
  43. Robineau, M.; Sabot, R.; Jeannin, M.; Deydier, V.; Crusset, D.; Refait, P. Mechanisms of localized corrosion of carbon steel associated with magnetite/mackinawite layers in a cement grout. Mater. Corros. 2021, 72, 194–210. [Google Scholar]
  44. Morse, J.W.; Arvidson, R.S.; Lüttge, A. Calcium Carbonate Formation and Dissolution, Chem. Rev. 2007, 107, 342–381. [Google Scholar]
  45. Meyer, H.J. The influence of impurities on title growth rate of calcite. J. Cryst. Growth 1984, 66, 6639–6646. [Google Scholar] [CrossRef]
  46. Nagata, H.; Matsunaga, M.; Hosokawa, K. Analytical Study of the Formation Process of Hemimorphite-Part I. Corros. Engineer. 1993, 42, 225–233. [Google Scholar] [CrossRef]
  47. Nagata, H.; Matsunaga, M.; Hosokawa, K. Analytical Study of the Formation Process of Hemimorphite-Part II. Corros. Engineer. 1993, 42, 377–383. [Google Scholar] [CrossRef]
Figure 1. Schematic view of the electrochemical set-up used for galvanic corrosion experiments.
Coatings 12 01044 g001
Figure 2. SEM images of the wire-arc-sprayed coatings. (a) Surface observations at two magnitudes, (b) cross-section observation of the Zn coating, (c) of the Zn-15wt.%Al coating, and (d) detailed view of the Zn-15wt.%Al coating cross-section.
Coatings 12 01044 g002
Figure 3. X-ray diffraction patterns of the Zn and Zn-15wt.% Al coatings before the corrosion experiments. Al(hkl) = aluminum, Zn(hkl) = zinc, and ZnO(hkl) = zincite, with the corresponding Miller index.
Coatings 12 01044 g003
Figure 4. Polarization curves obtained with Zn- and Zn-15wt.%Al-coated carbon steel electrodes after 1.5 h of immersion in “solution 15” at 80 °C.
Coatings 12 01044 g004
Figure 5. Evolution over time of mixed potential EGC (dotted line) and OCP of coated electrodes (full line) during the 6-month galvanic corrosion experiment. For galvanic couple Zn-2, the initial values were not measured. The horizontal dotted lines at −0.38 V/SHE and −0.42 V/SHE correspond to the average OCP value measured for carbon steel after 1 month, i.e., −0.40 ± 0.02 V/SHE.
Coatings 12 01044 g005
Figure 6. Evolution over time of the polarization resistance of the coated electrodes during the 6-month galvanic corrosion experiment. LPR measurements were performed with the electrode at OCP, i.e., disconnected from its paired bare steel electrode.
Coatings 12 01044 g006
Figure 7. EIS study of the coated electrodes: evolution of the Nyquist plots for Zn-2 and Zn-15wt.% Al-2 during the 6-month galvanic corrosion experiment. EIS measurements were performed with the electrode at OCP, i.e., disconnected from its paired bare steel electrode.
Coatings 12 01044 g007
Figure 8. Photograph (a) and SEM cross-section view (b) of the Zn-1-coated electrode after the 6-month galvanic corrosion experiment. (1) and (2) = zones analyzed by EDS (see text).
Coatings 12 01044 g008
Figure 9. XRD analysis of the Zn-2-coated electrode surface after the 6-month galvanic corrosion experiment. Osk(hkl) = osakaite, ZHS(hkl) = zinc hydroxysulfate, He(hkl) = hemimorphite, A(hkl) = aragonite, Zn(hkl) = zinc, and ZnO(hkl) = zincite, with the corresponding Miller index.
Coatings 12 01044 g009
Figure 10. µ-RS analysis of the Zn-2-coated electrode surface after the 6-month galvanic corrosion experiment.
Coatings 12 01044 g010
Figure 11. XRD (a) and µ-RS (b) analysis of a Zn-15wt.%Al coating surface after the 6-month galvanic corrosion experiment. ZHS(hkl) = zinc hydroxysulfate, ZAHS(hkl) = zinc aluminum hydroxysulfate, Al(hkl) = aluminum, Zn(hkl) = zinc, and ZnO(hkl) = zincite, with the corresponding Miller index.
Coatings 12 01044 g011
Figure 12. SEM observations of surface (a) and cross-section obtained by wire sawing (b,c) or freeze-fracturing (d) of a Zn-15wt.%Al coating after the 6-month galvanic corrosion experiment. (1) and (2) = zones analyzed by EDS (see text).
Coatings 12 01044 g012
Figure 13. XRD analysis of a bare steel electrode connected to a Zn-15wt.% Al-coated electrode (a) and Raman spectrum obtained during the analysis of the bare steel sample connected to the Zn-2-coated electrode (b). In both (a,b), the additional image displays the surface of the paired steel electrode.
Coatings 12 01044 g013
Figure 14. Cross-section SEM image of a Zn-15wt.%Al coating immersed 3 days in “solution 15” at 80 °C.
Coatings 12 01044 g014
Table 1. Composition of the electrolyte (“solution 15”) used for all corrosion experiments.
ComponentConcentration
(mol L−1)
ComponentConcentration
(mol L−1)
CaSO4·2H2O8.5 × 10−3NaHCO31.1 × 10−3
NaCl3.5 × 10−2Al2(SO4)3·18H2O8.0 × 10−4
Na2SO45.4 × 10−4Na2S3.1 × 10−5
Na2SiO3·5H2O1.7 × 10−3
Table 2. Pull-off experiments: results obtained for four Zn and four Zn-15wt.%Al-coated steel P285NH samples. UTS = ultimate tensile strength.
Zn CoatingsZn-15wt.%Al Coatings
UTS (MPa)Rupture AreaUTS (MPa)Rupture Area
16.2100% interface21.7100% interface
15.660% interface/40% coating25.4100% interface
16.260% interface/40% coating24.5100% interface
25.6100% interface21100% interface
Average:
21 ± 5
-Average:
23.5 ± 2.5
-
Publisher’s Note: MDPI stays neutral with regard to jurisdictional claims in published maps and institutional affiliations.

