Article

Facile Fabrication of F-Doped SnO2 Nanomaterials for Improved Photocatalytic Activity

1
School of Materials Science and Engineering, Jingdezhen Ceramic University, Jingdezhen 333403, China
2
School of Chemistry, Biology Engineering, Suzhou University of Science and Technology, Suzhou 215009, China
*
Authors to whom correspondence should be addressed.
Coatings 2022, 12(6), 795; https://doi.org/10.3390/coatings12060795
Submission received: 28 April 2022 / Revised: 2 June 2022 / Accepted: 5 June 2022 / Published: 8 June 2022

Abstract

:
Non-metal doping introduces structural defects, which alter the metal oxide band gap, resulting in high photocatalytic performance. Herein, a F doped SnO2 was synthesized via a simple solvothermal method. Through adjusting the solvothermal time, surfactants and F doping ratio, the optimal sample was prepared. In addition, the as-prepared nano-powder was characterized and analyzed by X-Ray-Diffraction (XRD), Scanning Electron Microscope (SEM), Energy Disperse Spectroscopy (EDS) and Fourier Transform Infrared Spectrum (FT-IR). Interestingly, the results of photocatalytic degradation showed that the degradation rate of rhodamine B (Rh B) reached 92.9% in 25 min after a 5-hour solvent heat treatment with polyethylene glycol (PEG) surfactant and F doping ratio of n(F):n(Sn) = 1:15. Through the study of photocatalytic performance, we found that F-doped SnO2 has high photocatalytic activity during a short time and its development potential in the field of photocatalysis, which provides a strong support for our further study of its practical application.

1. Introduction

In today’s era, facing the increasingly serious environmental crisis and energy shortage, solar photocatalytic technology based on semiconductor has attracted strong research interest all over the world [1]. Currently, it is mainly applied in photocatalytic hydrogen production [2], photocatalytic CO2 conversion [3], and photocatalytic degradation of environmental pollution [4]. Up to now, it is a key scientific problem to broaden the light response range and improve the quantum efficiency of semiconductor photocatalysts that increase its practical application [3]. Therefore, it is urgent to explore novel efficient photocatalysts with high light performance, economy and good stability to further promote the development of photocatalytic degradation technology [5].
SnO2 is an economical and non-toxic oxide semiconductor material [6]. At present, it is widely applied in the field of sodium ion or lithium ion batteries [7], solar cells [8], sensors [9] and photocatalysis [10] due to its excellent stability, excellent electrical properties and high photosensitivity [11]. Many studies have been carried out during the last years to improve the photocatalytic performance of SnO2, such as the preparation of structures with special morphology and doping of other substances. Lu et al. [12] synthesized flower-like SnO2 with a simple template-free hydrothermal method. After the photocatalytic degradation process of methyl orange (MB) and rhodamine B (Rh B), the flower-like SnO2 showed better performance than commercial SnO2 particles. SnO2 nanorods was synthesized by Hou et al. [13] via an interfacial hydrothermal method. For the degradation of methyl orange, the photocatalytic efficiency reached 99.3% of SnO2 nanorods and only spent 60 min under UV light irradiation.
At present, SnO2 was modified with non-metallic elements to improve their photocatalytic activity. Generally, doping non-metal (C, B, I, F, S, and P) will introduce structural defects, altering the band gap of metal oxide and resulting in higher absorption [14,15]. Tuan et al. [16] modified SnO2 using reduced graphene oxide. The photocatalytic activity for MB has been improved because of the raised specific surface area. Vitiello et al. [17] prepared effective photocatalysts using low F doped ZnO, thus making the catalyst safer and more environmentally sustainable. In addition, these ZnO: F catalysts showed better photocatalytic properties and had shorter Diclofenac (DCF) degradation and mineralization times when compared to other ZnO-based materials. Chen et al. [18] improved visible light photocatalytic activity through modified SnO2 composites with N-doped carbon quantum dots. Comparing with pure SnO2, the SnO2/NCQDs showed enhanced photocatalytic performance, which increased from 20.1% to 99.0% within 120-minute degradation of Rh B. The enhanced photocatalytic performance may be due to the addition of quantum dots—it can interact with SnO2 to increasing the response of the composite under visible light by reducing the band gap.
Inspired by the F-doped ZnO and N-doped SnO2, in this paper, we fabricated optimally F-doped SnO2 nanomaterials via a simple Solvothermal method, and the photocatalytic activity for degradation of Rh B was investigated. At the same time as photocatalytic Rh B, the structural and functional relations of different proportions of F-doped SnO2 samples were studied, such as XRD, SEM, EDS and FTIR, in order to evaluate the influence of F doping on the structure and photocatalytic effect of SnO2.

2. Experimental Part

2.1. Instruments and Reagents

Experimental instruments and equipment include: Electronic balance (JJ224BC, Changshu Shuangjie Test Instrument Factory, Changshu, China), electric constant temperature air blowing drying oven (101A-2, Shanghai Experimental Instrument Co. Ltd., Shanghai, China), centrifuge (TDZ5-WS, Hunan Xiangyi Instrument Development Co. Ltd., Changsha, China), UV-Visible spectrophotometer (UV-5100, Shanghai Yuanxi Instrument Co. Ltd., Shanghai, China), digital display heat collection stirrer (DF101B, Jintan Dadi Automatic Instrument Factory, Jintan, China), ultrasonic cleaning machine (KQ3201B, Kunshan Ultrasonic Instrument Co. Ltd., Suzhou, China) and magnetic heating stirrer (CJJ78-1, Jintan Baita Xinbao Instrument Factory, Jintan, China). Experimental reagents mainly included: stannic chloride pentahydrate (SnCl4·5H2O), polyethylene glycol (HO(CH2CH2O)nH, PEG), sodium fluoride (NaF), anhydrous ethanol, sodium dodecyl sulfate (C12H25NaO4S, SDS), sodium dodecyl benzene sulfonate (C18H29NaO3S, SDBS), polyvinyl pyrrolidone ((C6H9NO)n, PVP), lauryl amine and oleic acid, all of the drugs were analytical pure (AR).

2.2. Preparation of F-doped SnO2

SnO2 with different conditional parameters were prepared by solvothermal method. Mixed the oleic acid and lauryl amine in a 250-milliliter beaker and heat to 80 °C. Then, weigh 1.4 g SnCl4·5H2O dissolve in the above mixture and stir until it dissolves. Then, transferred to a high-pressure reactor and solve-heated at 200 °C for 5, 10, 15 and 20 h, respectively. After the reaction, the product was washed several times with anhydrous ethanol and deionized water. Finally, the product was dried at 90 °C. On the other hand, SnO2 was prepared by adding different surfactants (1 mmol PEG (6000), 1 mmol PVP, 1 mmol SDBS and 1 mmol SDS, respectively) under the same conditions (as shown in Table 1).
The preparation method of F-doped SnO2 nano-powders is basically the same as SnO2; the key is to add different qualities of NaF and, finally, get different ratios of F-doped SnO2 nano-powders. The n(F)/n(Sn) = 0:1 was named S0, n(F)/n(Sn) = 1:1 was named S1, n(F)/n(Sn) = 1:5 was named S2, n(F)/n(Sn) = 1:10 was named S3 and n(F)/n(Sn) = 1:15 was named S4, respectively. Related conditions and parameters are shown in Table 2.

2.3. Characterization

The crystal phase structure of the samples was analyzed by X-Ray Diffractometer (XRD, D8 Advance, Bruker AXS GmbH, Karlsruhe, Germany). The sample morphology was observed by Scanning Electron Microscope (SEM, SU-8010, HITACHI, Tokyo, Japan). The SEM-based Energy Disperse Spectroscopy (EDS, American IXRF Model 550I, Austin, TX, USA) was used to study the elemental composition of the samples. Fourier Transform Infrared Spectroscopy (FTIR, Nicolet 5700, American Thermoelectric, Chicago, IL, USA) was used to reflect the molecular structure characteristics of nanomaterials.

2.4. Photocatalytic Study

The specific method of photocatalytic experiment is as follows: weigh 50 mg samples prepared under different conditions, transfer into 50 mL photocatalytic quartz tube, add 40 mg/L Rh B 6.25 mL to constant volume to 50 mL by deionized water and put them into the photocatalytic reactor. In the light reaction instrument, the magnetic stirring lasted 30 min at first; the SnO2 nano-powders was dispersed evenly in Rh B solution, keeping the balance between adsorption and desorption.
Transfer 5 mL of solution from quartz tube to centrifugal tube, take supernatant after centrifugation and use UV-visible spectrophotometer to measure absorbance. 1000 W high-pressure mercury lamp (λ Max = 365 nm) was selected as the light source, and magnetic stirring was continued during the irradiation. Take a sample every 5 min as an observation point and determine the degree of photocatalytic degradation of Rh B by referring to the standard curve of Rh B.
The calculation of degradation % for Rh B as following:
η = C C 0 C 0 × 100 %
In this formula, η- degradation % for Rh B, C-concentrations after degradation, C0-Initial concentration of Rh B.
In order to explore the photocatalytic mechanism of F-doped SnO2 photocatalyst for degradation of Rh B, different trapping agents were added to the reaction system to capture different active substances. The same amount of photocatalyst was added with KI to capture hole (h+ and ·OH), Isopropyl alcohol (IPA) to capture hydroxyl radical (·OH) and P-benzoquinone (BQ) to capture superoxide anion (·O2), and the experiment was compared with that without trapping agent [19,20].

3. Results and Discussion

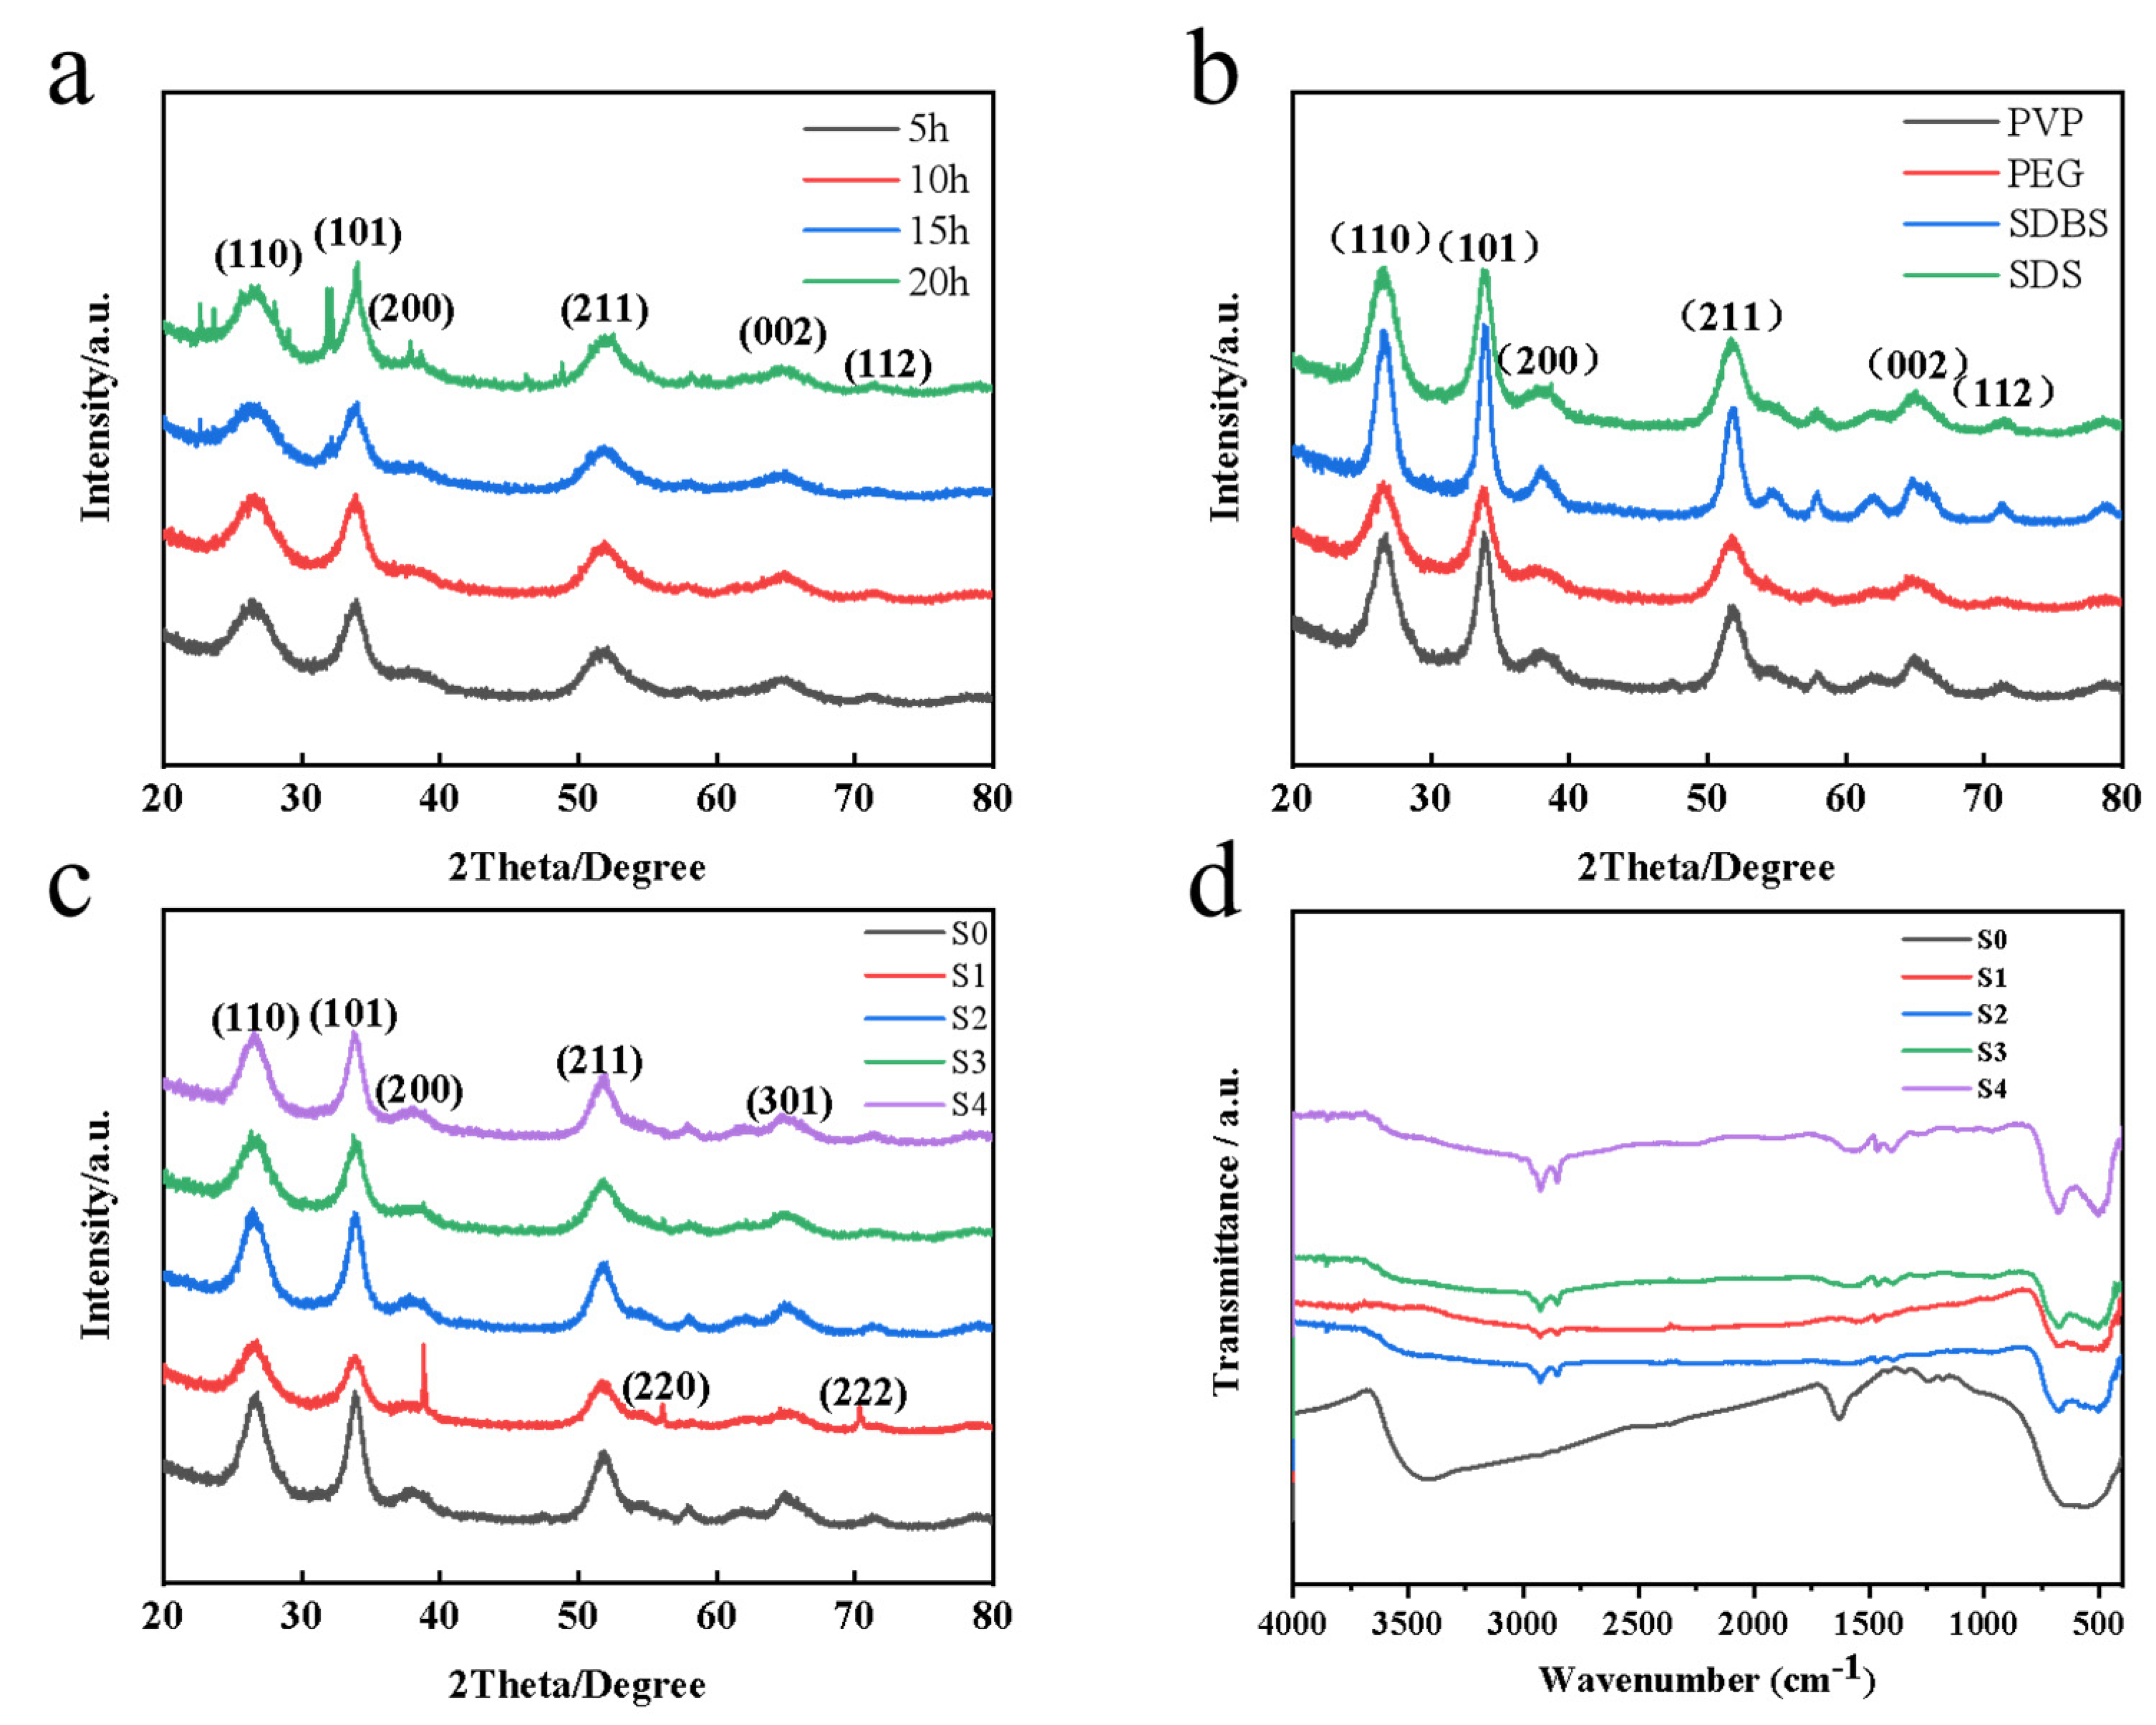
3.1. Crystal Structure

XRD patterns of samples prepared at different reaction times are shown in Figure 1a. The patterns of as-prepared samples were well-matched with JCPDS 77-0452, the strong peaks at 26.5°, 33.8°, and 51.6° belonged to the (110), (101), and (211) planes of SnO2. When the solvothermal time is 5 h, the half peak width of the diffraction peak is narrow and the intensity is relatively high, indicating good crystallization. Due to the long time reaction with 20 h, the product may have formed some complex peaks which at ~25° and ~33°. The crystallite sizes of the products were 14, 12.2, 10.8 and 9.2 nm at solvothermal times of 5, 10, 15 and 20 h, respectively, according to the Scherrer equation.
Figure 1b shows the XRD patterns of different surfactants at 5 h of solvothermal. Through comparative analysis, the XRD patterns of as-prepared samples with the addition of SDBS and SDS showed some miscellaneous peaks, indicating that other substances may appear in the prepared powder. Compared with the XRD patterns as-prepared samples by adding PEG and PVP, the powder diffraction peak of as-prepared sample by PEG as dispersant was stronger.
From the XRD patterns of S0 and S1, S2, S3, and S4 samples (Figure 1c), it could be found that the F-doped sample is consistent with the standard card of pure SnO2, indicating that the obtained particles have the structure of SnO2. The crystallite sizes of the samples were calculated by Scherrer equation: S0, S1, S2, S3 and S4 was 18.8, 20.1, 22.2, 23 and 23.2 nm, respectively. Compared with S0, the XRD peaks have shifted to left at 26.5°, 33.8°, and 51.6° of S1, S2, S3 and S4. It is proven that the F has incorporated into the SnO2 structure. When the proportion of F exceeds 1.7%, the crystal size of SnO2 increases gradually. When the doping ratio of F less than 1.7%, the crystallite size of SnO2 does not change significantly. When n(F)/n(Sn) = 1:1(S1), the amount of F may be too high, causing F to compound with SnO2 rather than doping, resulting in the formation of hybrid peaks in Figure 1c-S1.

3.2. Functional Group Analysis

The FTIR spectra of as-prepared nanoparticles are illustrated in Figure 1d. All samples showed a characteristic peak between 400 and 650 cm−1, which was assigned to the O-Sn-O bridge of the SnO2 nanoparticles [21]. The O-H stretching vibration peak appears at about 1600 cm−1, which may be caused by the adsorption of water molecules or -OH groups on the sample surface [22]. The peak at 2919 and 2848 cm−1 was ascribed to the C-H stretching and bending vibrations. The absorption peak in 400–700 cm−1 region has a higher intensity when n(F)/n(Sn) = 1:15(S4), indicating that the crystal structure of SnO2 has been synthesized.

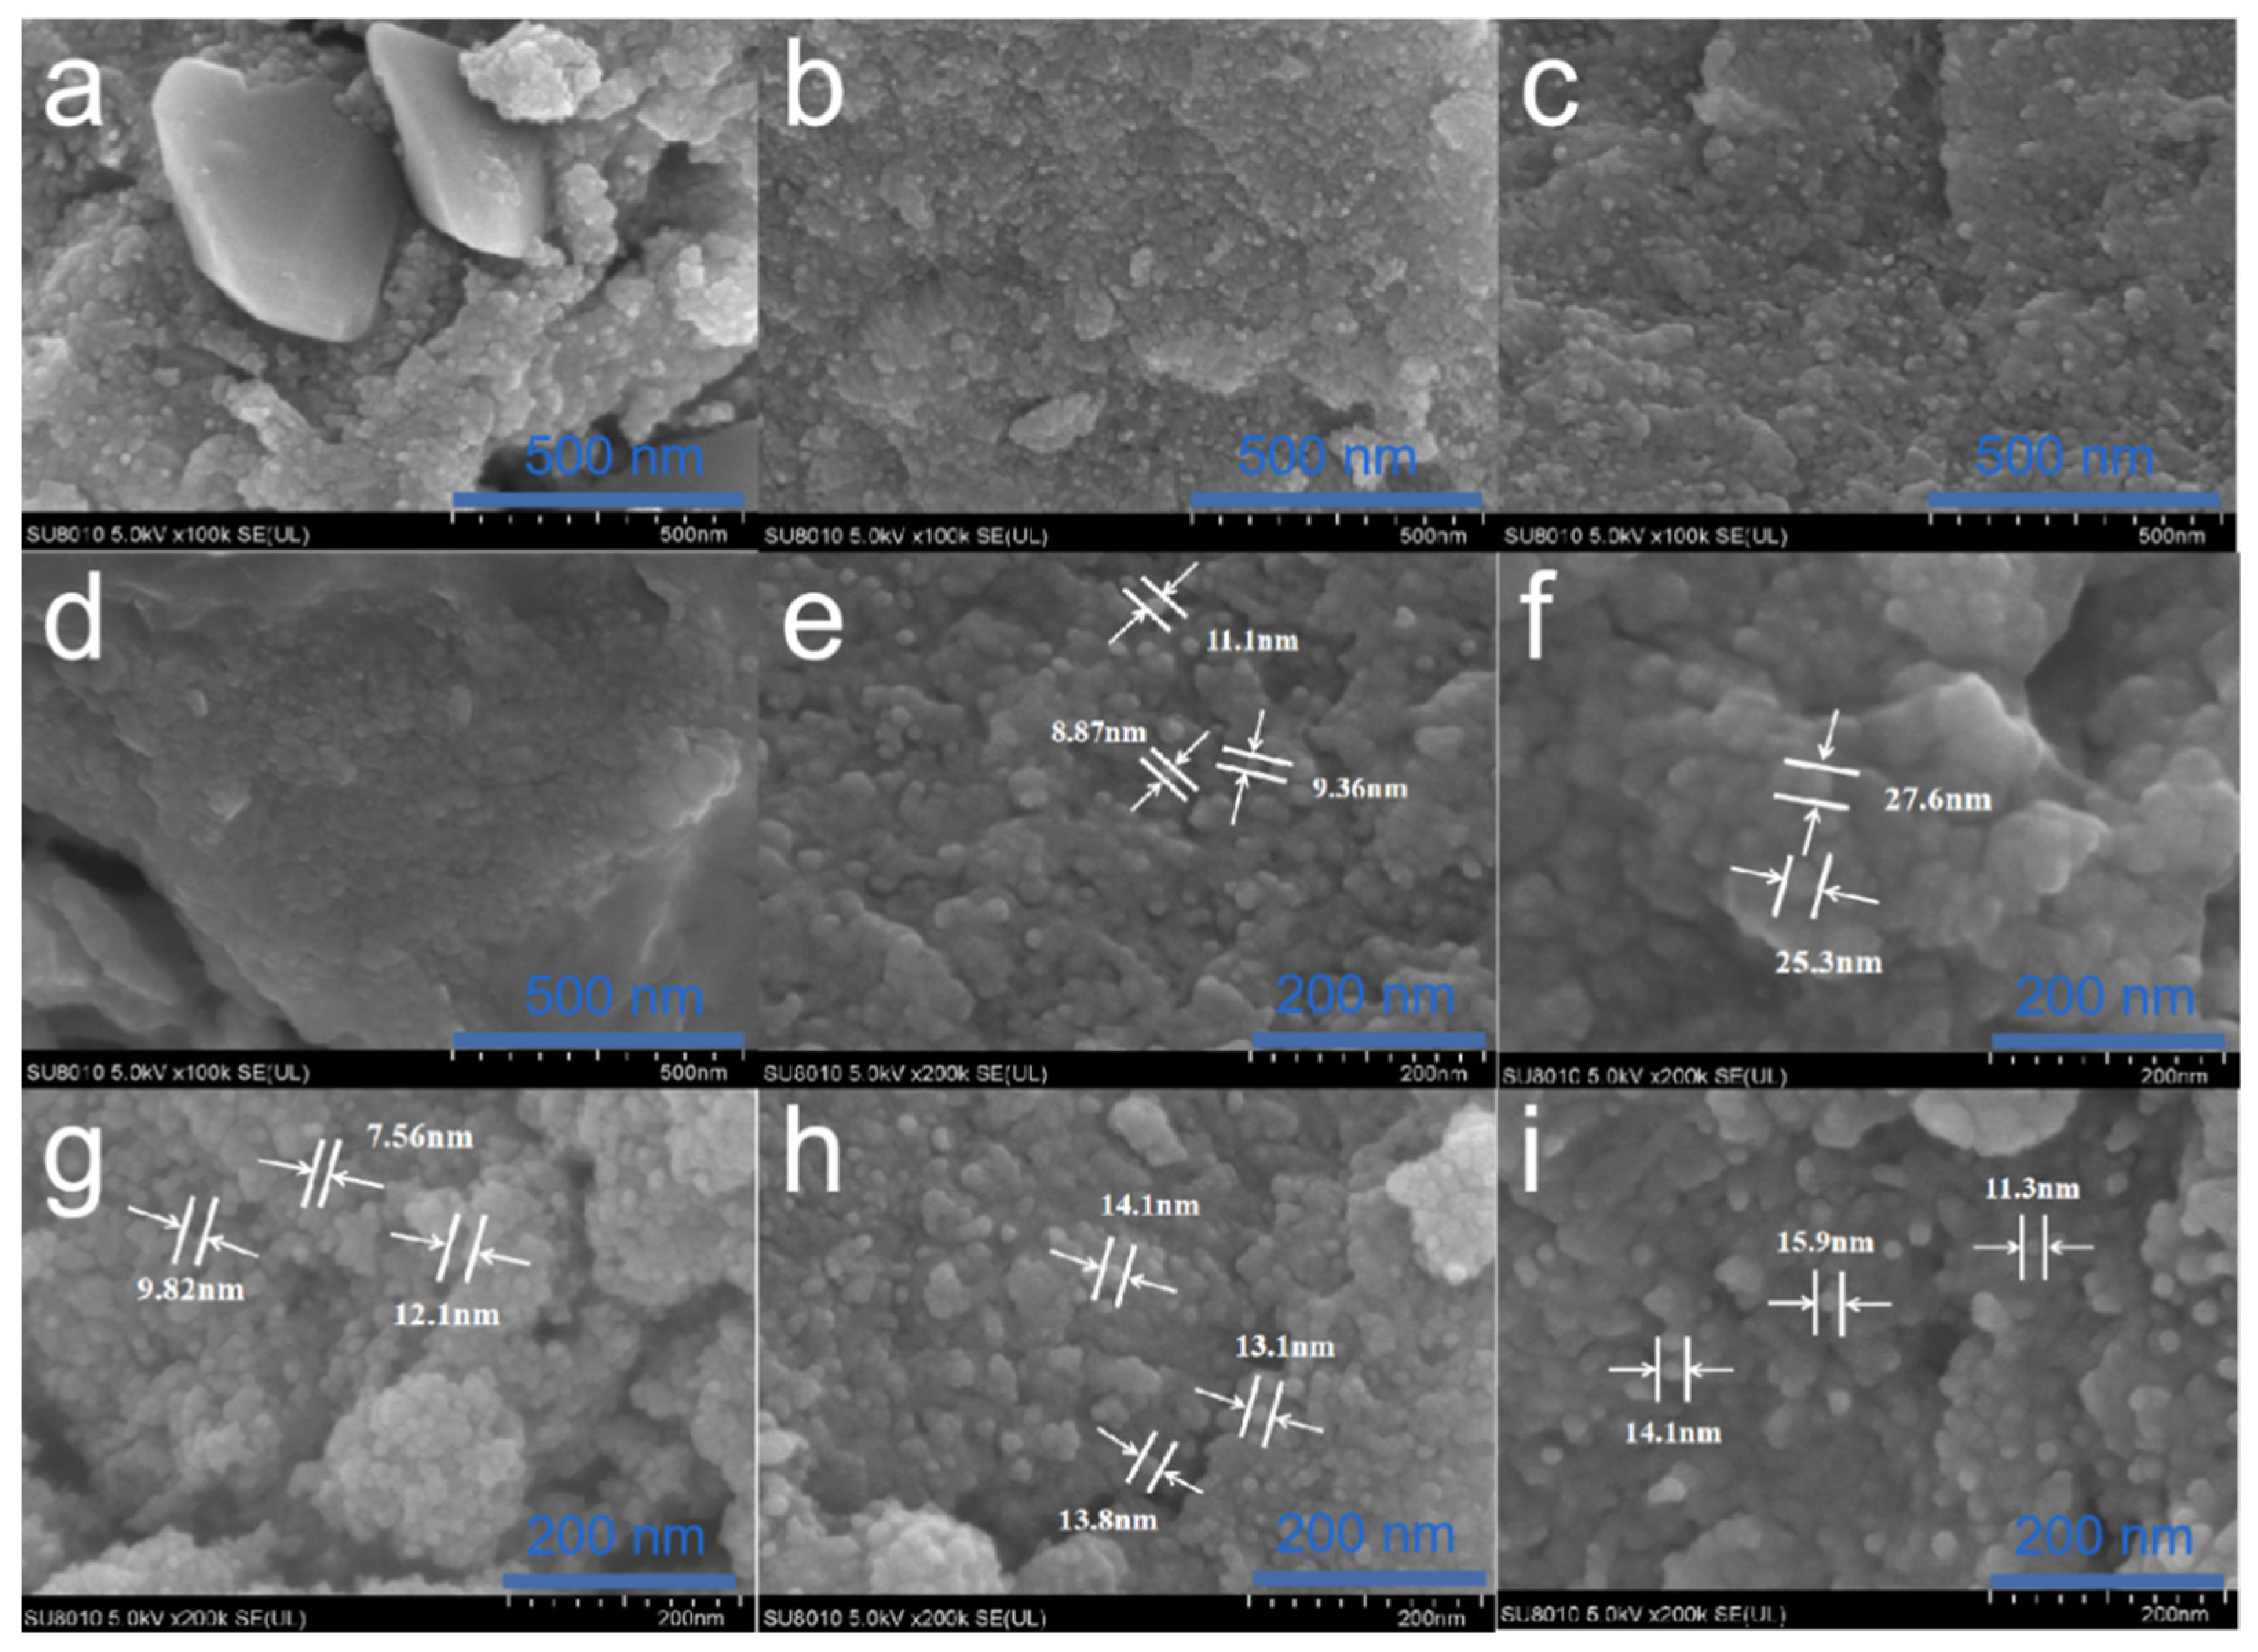
3.3. Morphology Analysis

Scanning electron microscope (SEM) images of SnO2 samples prepared by adding different surfactants are shown in Figure 2a–d. According to the SEM micrographs, all the materials prepared with surfactants (SDS, PVP, PEG, and SDBS) does not have much difference for particle size and dispersion.
The SEM of SnO2 samples prepared with different F doping ratios are shown in Figure 2e–i. From Figure 2e, pure SnO2 products have uniform morphology and small particle size distribution, and the average particles diameter of SnO2 is 9–12 nm. The morphology of the SnO2 sample after F doping was mainly showed spherical. When n(F)/n(Sn) = 1:1(S1), it can be seen from Figure 2f that the product is partially condensed into particles of larger diameter. The average diameter is about 26 nm with poor dispersion and a small amount of slag on the surface of the microsphere. When n(F)/n(Sn) = 1:1(S1), the product may reach the composite state. When n(F)/n(Sn) = 1:5(S2), it can be seen from Figure 2g that the product is spherical, with an average particle diameter about 10 nm. A small number of microspheres are damaged on the surface and the product contains a large number of aggregation spheres. When n(F)/n(Sn) = 1:10(S3), it can be seen from Figure 2h that when the number of the microsphere increases, the average particles diameter of the microsphere changes little, and the products are mostly small particles that gather and adsorb on the surface of the microsphere. When n(F)/n(Sn) = 1:15(S4), it can be seen from Figure 2i that the sample contains a large number of microspheres with a small average particle diameter of about 14 nm, among which many particles are clustered together, and the average particles diameter of microspheres is small.
In summary, it indicates that F doping promotes the particle growth of SnO2 in a certain sense, which is consistent with the XRD analysis in Figure 1c. As the amount of F doping decreased, the morphology of the microspheres did not change significantly, but the surface of S4 sample was a small aggregate without overall assembly structure, which was larger than other F-doped SnO2 samples. Therefore, the specific surface area was increased and the active sites of photocatalytic reaction were increased, which promoted the photocatalytic degradation of Rh B.

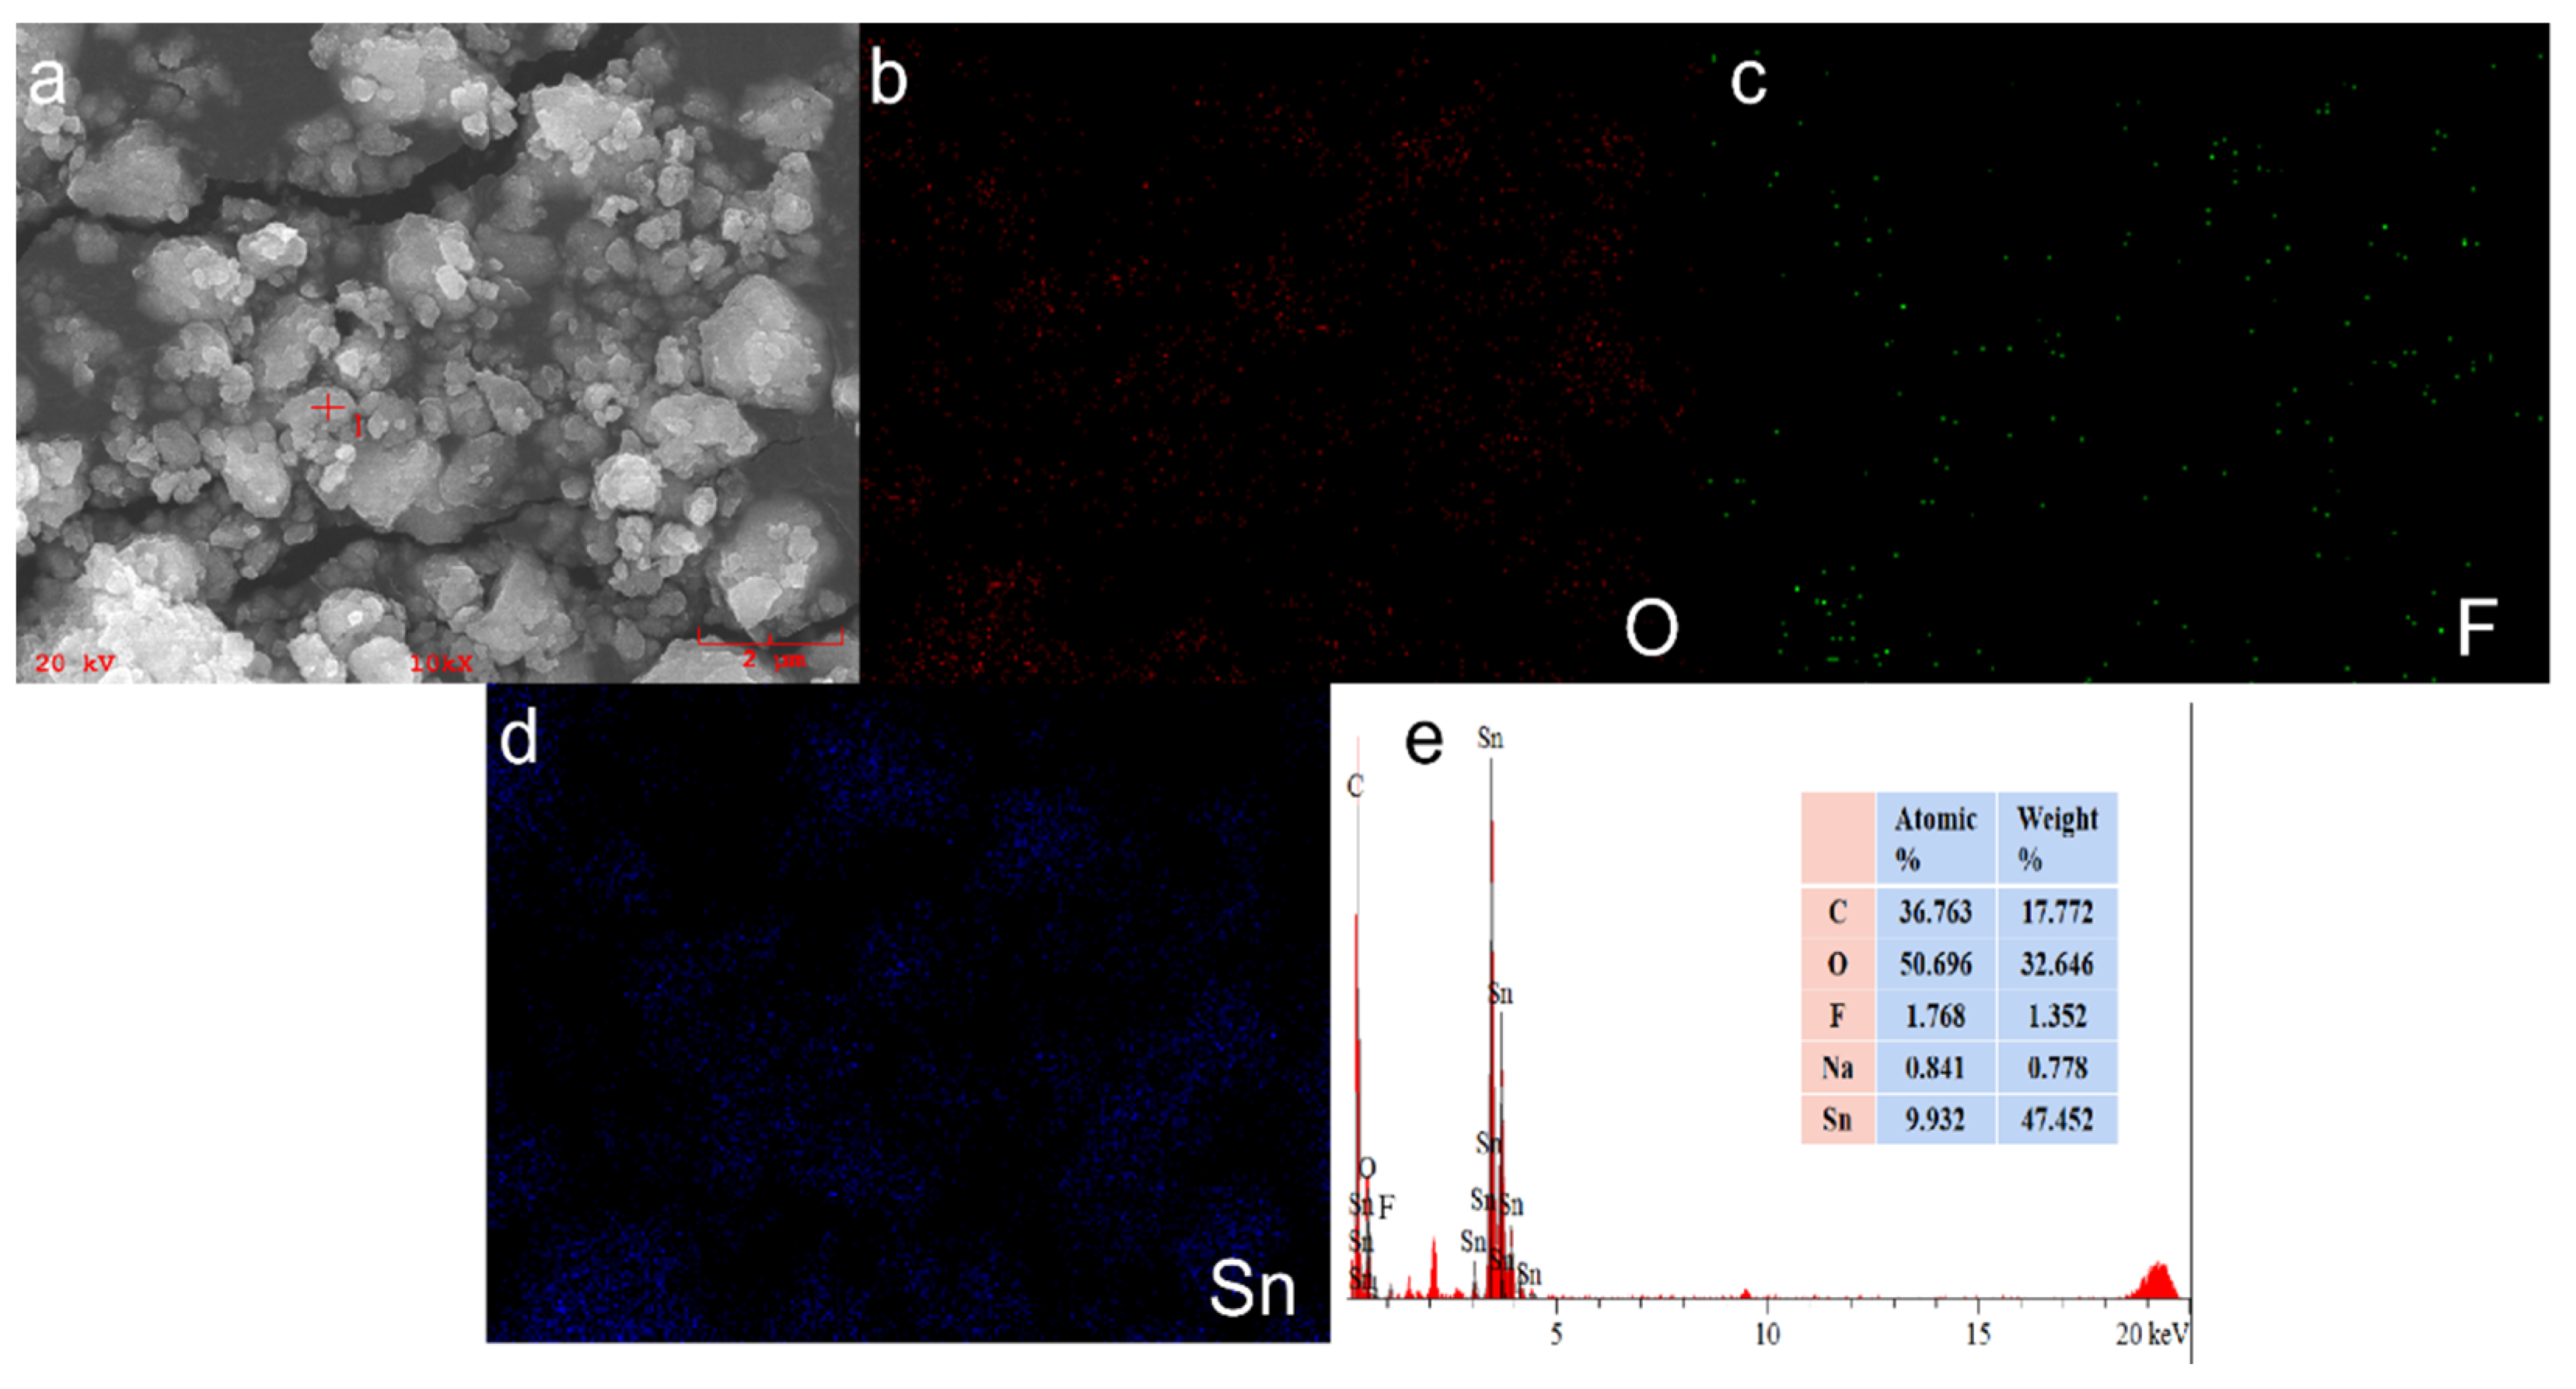
3.4. Elemental Analysis

The mapping points diagram of elements in Figure 3a–c effectively reflects the approximate proportion of elements and proves the successful doping of F element. The energy line used for O, F, and Sn element map, such as O-Kα, F-Kα, and Sn-Lβ.
EDS spectrum of S2 sample is shown in Figure 3d. The characteristic peak of F element is shown in the energy spectrum, indicating that F ion has been doped into SnO2 particles. Among them, the occurrence of C peak may be caused by the substance containing C was plated to increase the conductivity of the conductive film during EDS detection. The quantitative analysis of the content ratio diagram of S2 sample shows that the molar ratio of n(F)/n(Sn) = 1:5.6 is similar to that of n(F)/n(Sn) = 1:5(S2).

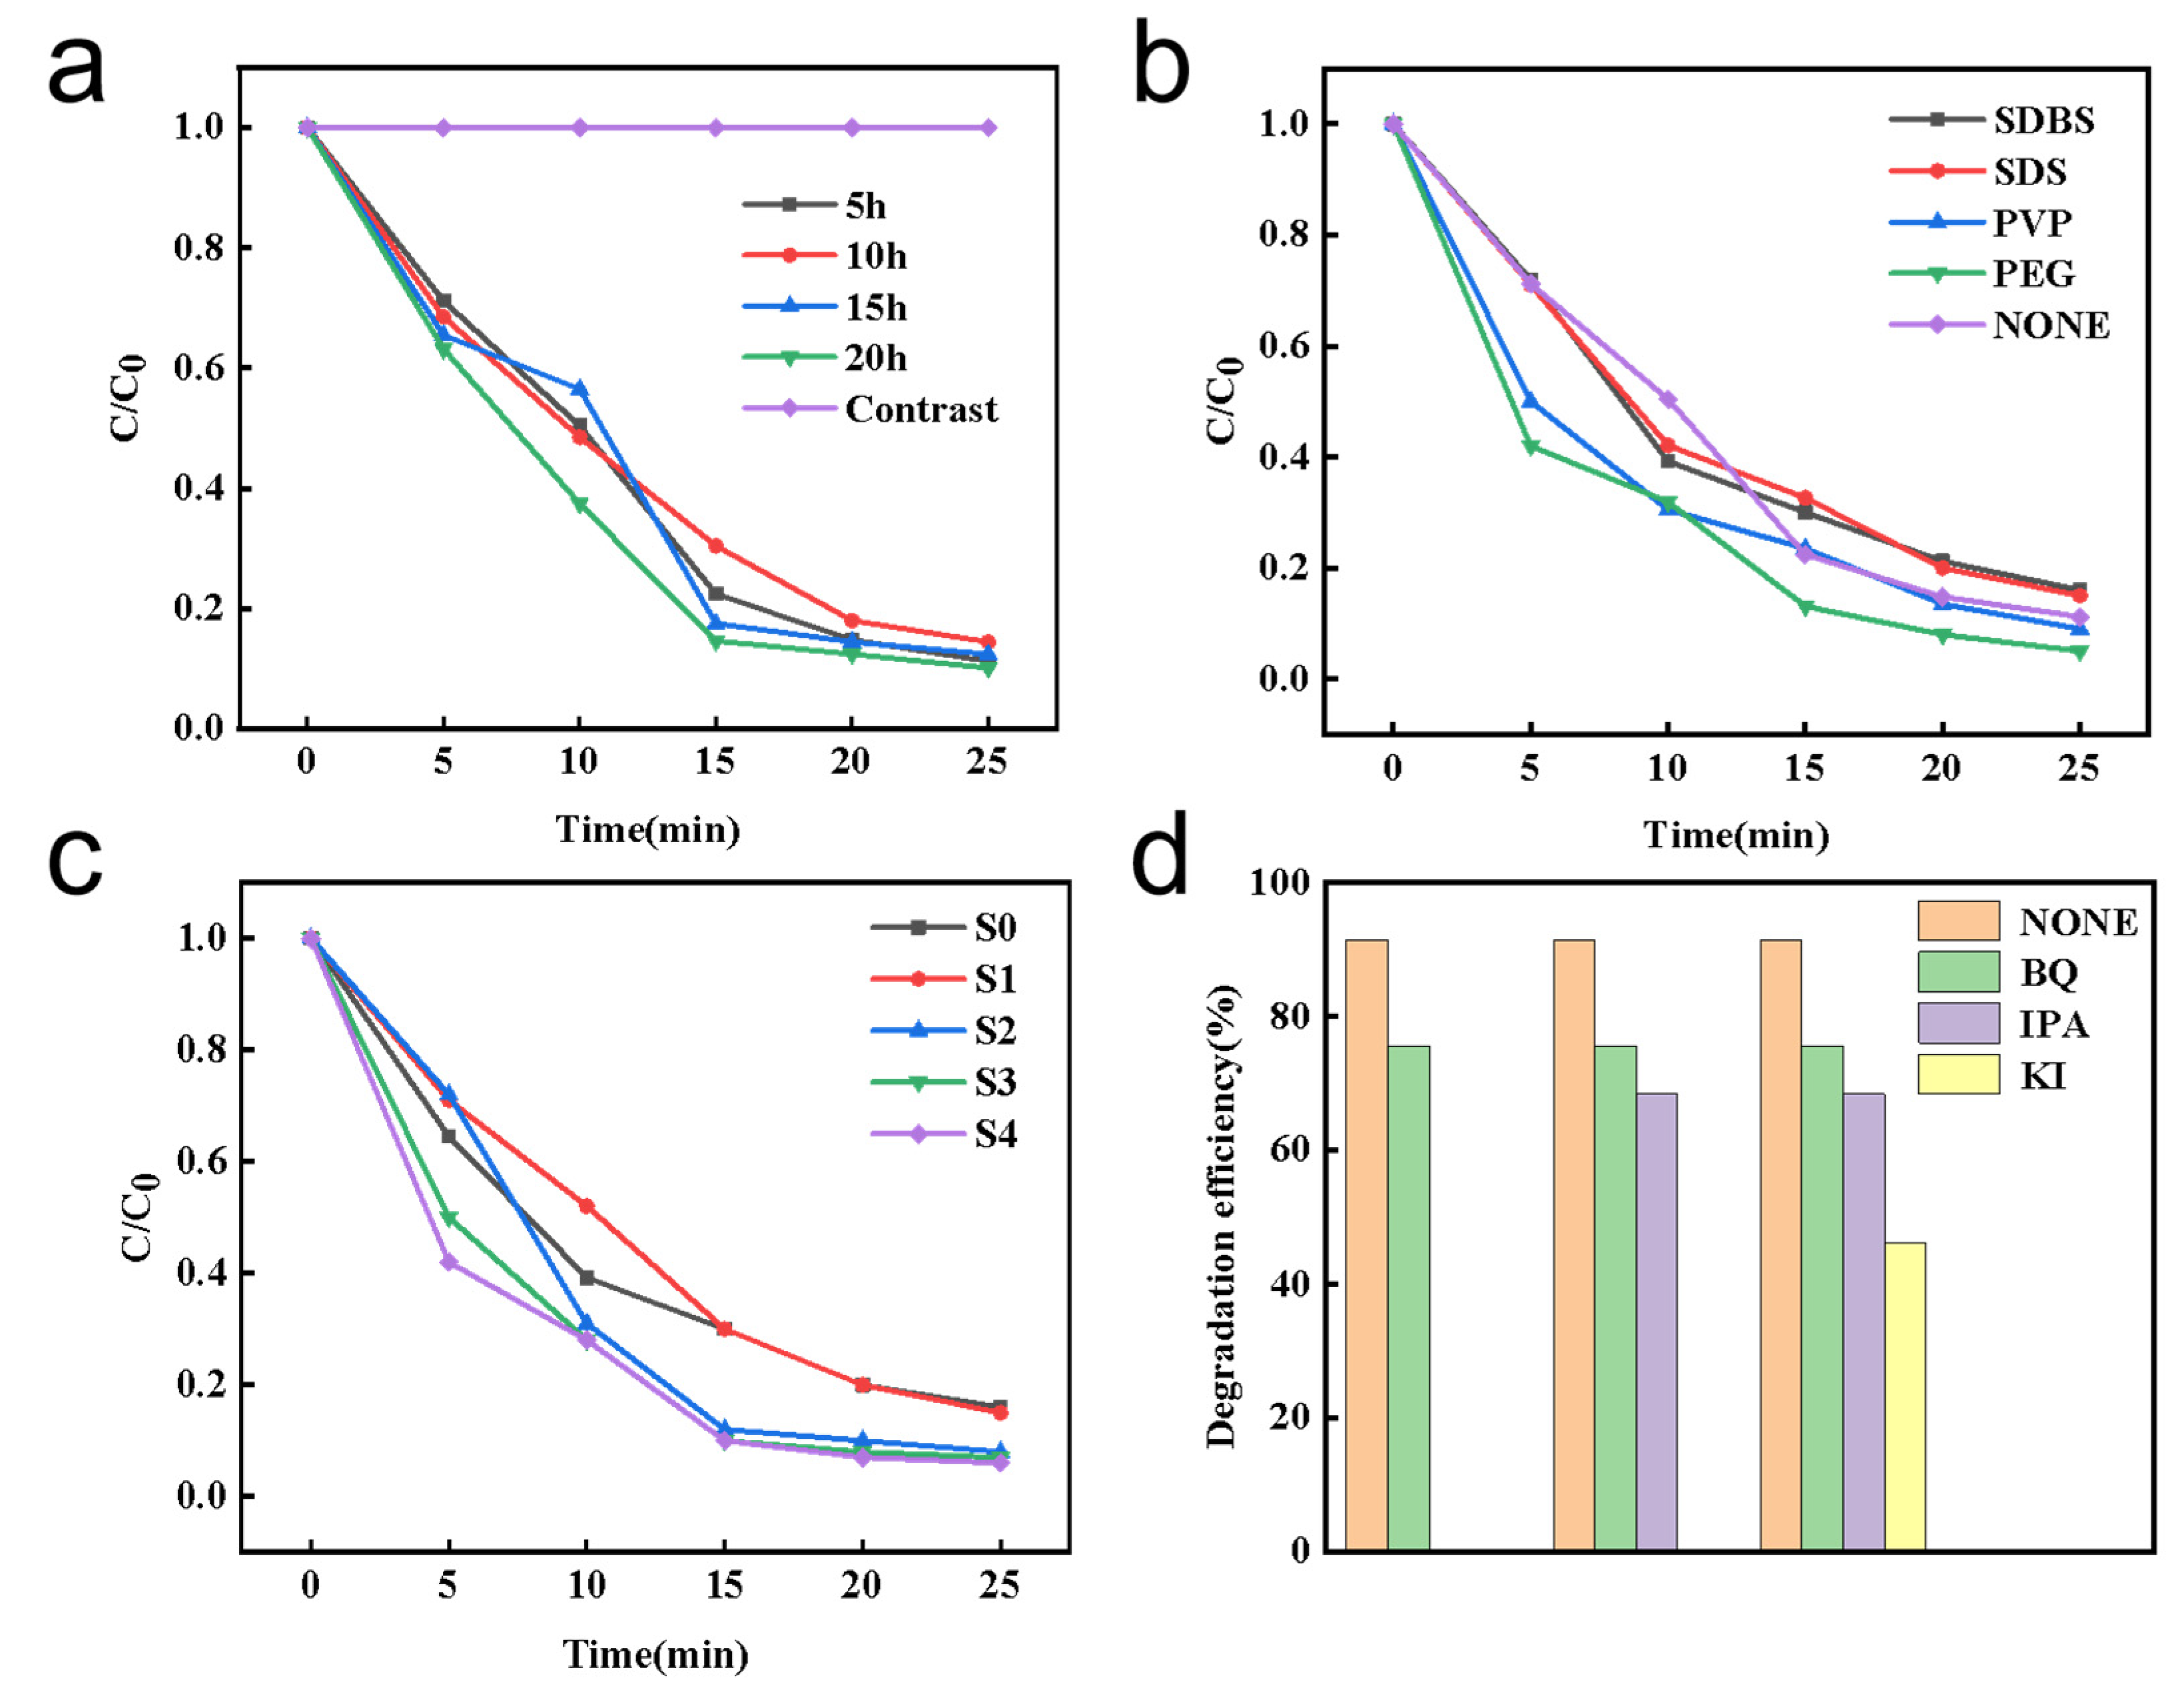
3.5. Photocatalytic Activity

Figure 4a shows the photocatalytic degradation effect of Rh B on SnO2 samples under different solvothermal time control. As can be seen from the figure, the content of Rh B solution is still about 99% without catalyst after 25 min under ultraviolet light. After the addition of SnO2 powder, the concentration of Rh B decreased gradually with the increase in time. After UV irradiation for 25 min, the degradation rate of Rh B in the sample (solvothermal for 20 h) was close to 90%. It can be clearly seen from the figure that the (solvothermal for 20 h) has the highest photocatalytic activity. Other photocatalytic activities and degradation rate are basically similar. Solvothermal time affects the photocatalytic activity under certain conditions and can promote photocatalysis.
Figure 4b shows the photocatalytic effect of the sample on Rh B obtained by adding different surfactants and reacting at 200 °C for 5 h. As shown in the figure, the PEG photocatalytic effect is better than other surfactants and the photocatalytic degradation rate is exceeded 90%. According to the above phase and appearance analysis, the as-prepared sample which added PEG with high crystallinity, small particle size and good dispersion effect can be obtained. The analysis was verified by photocatalytic test.
Figure 4c shows the photocatalytic effect of SnO2 samples on Rh B at 200 °C for 5 h after adding polyethylene glycol with different F doping ratios. As can be seen clearly from the comparison in the figure, Rh B concentration in the glass tube with SnO2 powder gradually decreases with the extension of time, that is, Rh B gradually degrades into colorless. The degradation rate of Rh B in S4 samples reached 92.9% after 25 min of UV irradiation. As can be seen from the comparative analysis in the figure, the photocatalytic performance of samples treated with F doping is significantly better than that of pure SnO2 powder; it is possible that the F doped increased the concentration of oxygen vacancy and improved the oxidation ability. Compared with other samples, S4 sample has the highest photocatalytic activity, followed by S3, S2, S1 and S0 samples.
The pseudo-first-order kinetics reaction concerning Rh B degradation were showed in supplementary Figure S1, and the fitted curves were introduced in Tables S1–S3. According to the result of first-order kinetics reaction, under light conditions, the S4 sample had a higher reaction rate (0.11234 min−1) than the samples with different solvothermal times and different surfactants, which means that the degradation rate of Rh B in S4 sample was higher than that in S0, S1, S2 and S3.
For the study of repeatability, we conducted 5 repeatability tests on S4 in the same conditions. With the increase of photocatalytic times, the degradation effect of F-doped SnO2 on Rh B also decreased from 92.9% to 83.9% (Figure S2). This indicates that the catalyst is relatively stable.

3.6. Free Radical Capture Experiment

Figure 4d shows the influence of different trapping agents on degradation of Rh B. After 1 h of photocatalysis, the photocatalytic activity was suppressed to varying degrees compared with that without trapping agents. The degradation of Rh B for BQ, IPA, and KI was 75.6%, 68.34%, and 46.2%, respectively. KI influence was the strongest among them, shown that hole is the main active substances; this is due to the redox reaction of Rh B, which adsorbed on the SnO2 surface and can be directly oxidized by h+ into degradation products. On the other hand, the optical holes migrated to the surface of the catalyst can oxidize and degrade the pollutants attached to the surface of the catalyst or react with the water on the semiconductor surface to generate a relatively high activity of ·OH. Hydroxyl radical was the secondary active substance. O2 is reduced to superoxide radical (·O2) by e, and BQ has little effect on superoxide anion. Therefore, it is clear that the free radicals affecting the degradation rate of Rh B in the experiment of F-doped SnO2 photocatalytic degradation are h+, ·OH and ·O2 in sequence.

3.7. The Mechanism of the Rh B Degradation

The degradation mechanism of Rh B is shown in Figure 5. Through free radical capture experiments, it was confirmed that hydroxyl radicals and holes were the main active substances in photocatalytic degradation of Rh B. When the organic dye Rh B is exposed to light, it eventually forms non-toxic small molecular products such as H2O and CO2.

3.8. Comparison of the Photocatalytic Degradation Efficiency of SnO2 Nanoparticles

In the literature, there are many studies using SnO2 nanoparticles as catalysts for photodegradation of different dyes. This study the prepared F-doped SnO2 nano-powder on the degradation of Rh B. We compiled earlier work on degradation of Rh B and other dyes using different SnO2 methods in UV, visible and sunlight and compared it with the current work in Table 3. Although the degradation rate and reaction time were lower than/higher than in earlier studies. The catalyst synthesis method used in the present study is very simple and inexpensive as compared to the other methods.

4. Conclusions

Using solvothermal method to control different solvothermal time, F doped SnO2 nano-powder was prepared by adding different kinds of surfactants and using sodium fluoride as fluorine source. Through the analysis and characterization of the prepared samples and the photocatalytic performance experiment. The results showed that with the increase of solvothermal time, the grain size of the product changed and the grain size of SnO2 became smaller, but the prolongation of solvothermal time did not affect the chemical reaction process. SnO2 powder was prepared by adding different surfactants. It was found that the SnO2 powder prepared by adding PEG had uniform distribution, better dispersibility and smaller particle size. The XRD peaks have shifted to left of other samples which doped F with different ratios, it is suggested that the F has incorporated into the SnO2 structure. The EDS mapping image can also confirm that F element has been successfully incorporated into the structure of SnO2. In the experiment of F doped SnO2, the addition of F promoted the growth of SnO2 particles, increased the concentration of oxygen vacancy and improved the photocatalytic performance of SnO2 powder. When n(F)/n(Sn) = 1:15(S4), the crystal structure of the obtained sample was more complete and the photocatalytic activity of Rh B was the highest, reaching 92.9%. The influence of different trapping agents on degradation of Rh B showed that electron hole is the main active substances, the reduction of electron holes directly affects the photocatalytic performance. After the study of photocatalytic performance, it is proven that F-doped SnO2 has high photocatalytic activity during a short time and its development potential in the field of photocatalysis, which provides a strong support for our further study of its practical application.

Supplementary Materials

The following supporting information can be downloaded at: https://www.mdpi.com/article/10.3390/coatings12060795/s1, Figure S1: pseudo-first-order kinetics of Rh B, (a) different solvothermal time (h); (b) different surfactants; (c) F/Sn; Figure S2: The reusability of the S4; Table S1: First-order kinetics fitting Equation and correlation coefficient (R2) for Different Sol-vothermal times; Table S2: First-order kinetics fitting Equation and correlation coefficient (R2) for different sur-factants; Table S3: First-order kinetics fitting Equation and correlation coefficient (R2) for different F/Sn ratio.

Author Contributions

Conceptualization, L.X. and R.L.; methodology, L.X. and R.L.; software, L.X. and R.L.; validation, L.X., R.L. and Z.X.; formal analysis, S.Y. and Y.Q.; investigation, M.W. and Z.Z.; resources, R.L.; data curation, L.X.; writing—original draft preparation, L.X.; writing—review and editing, L.X., R.L., J.D. and Z.X.; visualization, L.X.; supervision, R.L.; project administration, R.L. All authors have read and agreed to the published version of the manuscript.

Funding

This research was funded by National Natural Science Foundation of China (No. 51468024), Natural Science Foundation of Jiangxi Province (No. 20202BABL203037), Jiangxi Provincial Education Department Project (No. GJJ201311), Jingdezhen Science and Technology Bureau project (No. 20212GYZD009-09, No. 20192GYZD008-33), Graduate Innovation Program of Jingdezhen Ceramic University (No. JYC202125).

Institutional Review Board Statement

Not applicable.

Informed Consent Statement

Not applicable.

Data Availability Statement

The data presented in this study are available on request from the corresponding authors. Correspondence: 001072@jcu.edu.cn (R.L.); xiezhixiang@usts.edu.cn (Z.X.).

Acknowledgments

We are very grateful to the National Natural Science Foundation of China, Jiangxi Provincial Department of Education, Jingdezhen Science and Technology Bureau and Jingdezhen Ceramic University for their support. At the same time, Thanks to the help of colleagues in the environmental Laboratory, it is with the support and help of all parties that our research can be successfully completed.

Conflicts of Interest

The authors declare no conflict of interest. The funders had no role in the design of the study; in the collection, analyses, or interpretation of data; in the writing of the manuscript, or in the decision to publish the results.

References

  1. Zhang, Y.; Gao, J.; Chen, Z. A solid-state chemical reduction approach to synthesize graphitic carbon nitride with tunable nitrogen defects for efficient visible-light photocatalytic hydrogen evolution. J. Colloid Interface Sci. 2018, 535, 331–340. [Google Scholar] [CrossRef] [PubMed]
  2. Arif, M.; Min, Z.; Luo, Y.; Yin, H.; Liu, X. A Bi2WO6-based hybrid heterostructures photocatalyst with enhanced photodecomposition and photocatalytic hydrogen evolution through Z-scheme process–ScienceDirect. J. Ind. Eng. Chem. 2019, 69, 345–357. [Google Scholar] [CrossRef]
  3. Humayun, M.; Lei, X.; Ling, Z.; Zheng, Z.; Fu, Q.; Wei, L. Exceptional co-catalyst free photocatalytic activities of B and Fe co-doped SrTiO3 for CO2 conversion and H2 evolution. Nano Res. 2018, 11, 6391–6404. [Google Scholar] [CrossRef]
  4. Zheng, X.; Wang, J.; Liu, J.; Wang, Z.; Chen, S.; Fu, X. Photocatalytic degradation of benzene over different morphology BiPO4: Revealing the significant contribution of high–energy facets and oxygen vacancies. Appl. Catalysis. B Environ. 2019, 243, 780–789. [Google Scholar] [CrossRef]
  5. Yang, L.; Huang, J.; Shi, L.; Cao, L.; Zhou, W.; Chang, K.; Ye, J. Efficient hydrogen evolution over Sb doped SnO2 photocatalyst sensitized by Eosin Y under visible light irradiation. Nano Energy 2017, 36, 331–340. [Google Scholar] [CrossRef]
  6. Lu, C.; Wang, J.; Xu, F.; Wang, A.; Meng, D. Zn-doped SnO2 hierarchical structures formed by a hydrothermal route with remarkably enhanced photocatalytic performance. Ceram. Int. 2018, 44, 15145–15152. [Google Scholar] [CrossRef]
  7. Cong, H.-P.; Xin, S.; Yu, S.-H. Flexible nitrogen-doped graphene/SnO2 foams promise kinetically stable lithium storage. Nano Energy 2015, 13, 482–490. [Google Scholar] [CrossRef]
  8. Zhu, Z.; Bai, Y.; Liu, X.; Chueh, C.-C.; Yang, S.; Jen, A.K.-Y. Enhanced efficiency and stability of inverted perovskite solar cells using highly crystalline SnO2 nanocrystals as the robust electron-transporting layer. Adv. Mater. 2016, 28, 6478–6484. [Google Scholar] [CrossRef]
  9. Singkammo, S.; Wisitsoraat, A.; Sriprachuabwong, C.; Tuantranont, A.; Phanichphant, S.; Liewhiran, C. Electrolytically exfoliated graphene-loaded flame-made Ni-doped SnO2 composite film for acetone sensing. ACS Appl. Mater. Interfaces 2015, 7, 3077–3092. [Google Scholar] [CrossRef]
  10. Chen, X.; Zhang, F.; Wang, Q.; Han, X.; Li, X.; Liu, J.; Lin, H.; Qu, F. The synthesis of ZnO/SnO2 porous nanofibers for dye adsorption and degradation. Dalton Trans. 2014, 44, 3034–3042. [Google Scholar] [CrossRef] [Green Version]
  11. Babu, B.; Kadam, A.; Ravikumar, R.; Byon, C. Enhanced visible light photocatalytic activity of Cu-doped SnO2 quantum dots by solution combustion synthesis. J. Alloy. Compd. 2017, 703, 330–336. [Google Scholar] [CrossRef]
  12. Lu, Z.; Zhao, Z.; Yang, L.; Wang, S.; Liu, H.; Feng, Y.; Zhao, Y.; Feng, F. A simple method for synthesis of highly efficient flower-like SnO2 photocatalyst nanocomposites. J. Mater. Sci. Mater. Electron. 2018, 30, 50–55. [Google Scholar] [CrossRef]
  13. Hou, L.; Lian, L.; Zhou, L.; Zhang, L.; Yuan, C. Interfacial hydrothermal synthesis of SnO2 nanorods towards photocatalytic degradation of methyl orange. Mater. Res. Bull. 2014, 60, 1–4. [Google Scholar] [CrossRef]
  14. Nouri, A.; Fakhri, A. Synthesis, characterization and photocatalytic applications of N-, S-, and C-doped SnO2 nanoparticles under ultraviolet (UV) light illumination. Spectrochim. Acta Part A Mol. Biomol. Spectrosc. 2015, 138, 563–568. [Google Scholar] [CrossRef] [PubMed]
  15. Ansari, S.A.; Ansari, S.G.; Foaud, H.; Cho, M.H. Facile and sustainable synthesis of carbon-doped ZnO nanostructures towards the superior visible light photocatalytic performance. New J. Chem. 2017, 41, 9314–9320. [Google Scholar] [CrossRef]
  16. Tuan, P.V.; Trung, H.L.; Chu, H.; Hoang, T.B.; Khiem, T.N. Effects of annealing temperature on the structure, morphology, and photocatalytic properties of SnO2/rGO nanocomposites. Nanotechnology 2020, 32, 15201. [Google Scholar] [CrossRef]
  17. Vitiello, G.; Iervolino, G.; Imparato, C.; Rea, I.; Borbone, F.; De Stefano, L.; Vaiano, V. F-doped ZnO nano- and meso-crystals with enhanced photocatalytic activity in diclofenac degradation. Sci. Total Environ. 2021, 762, 143066. [Google Scholar] [CrossRef]
  18. Chen, Y.; Jiang, Y.; Chen, B.; Ye, F.; Duan, H.; Cui, H. Facile fabrication of N-doped carbon quantum dots modified SnO2 composites for improved visible light photocatalytic activity. Vacuum 2021, 191, 110371. [Google Scholar] [CrossRef]
  19. Ramakrishna, D.; Rajkumar, B.; Reddy, G.B.; Veerabhadram, G. Construction of in situ self-assembled FeWO4/g-C3N4 nanosheet heterostructured Z-scheme photocatalysts for enhanced photocatalytic degradation of rhodamine B and tetracycline. Nanoscale Adv. 2019, 1, 10. [Google Scholar]
  20. Janani, R.; Menon, S.S.; Bhalerao, G.; Gupta, B.; Singh, S. Zn1-xGaxO1-yNy—Graphene oxide nanocomposite for enhanced visible—Light photocatalytic activity. Dye. Pigment. 2019, 165, 249–255. [Google Scholar] [CrossRef]
  21. Sudhaparimala, S. Green synthesis of tin based nano medicine: Assessment of microstructure and surface property. Am. J. Nanosci. Nanotechnol. 2014, 2, 75. [Google Scholar] [CrossRef] [Green Version]
  22. Haritha, E.; Roopan, S.M.; Madhavi, G.; Elango, G.; Al-Dhabi, N.A.; Arasu, M.V. Green chemical approach towards the synthesis of SnO2 NPs in argument with photocatalytic degradation of diazo dye and its kinetic studies. J. Photochem. Photobiol. B Biol. 2016, 162, 441–447. [Google Scholar] [CrossRef] [PubMed]
  23. Elango, G.; Kumaran, S.M.; Kumar, S.S.; Muthuraja, S.; Roopan, S.M. Green synthesis of SnO2 nanoparticles and its photocatalytic activity of phenolsulfonphthalein dye. Spectrochim. Acta Part A Mol. Biomol. Spectrosc. 2015, 145, 176–180. [Google Scholar] [CrossRef] [PubMed]
  24. Honarmand, M.; Golmohammadi, M.; Naeimi, A. Biosynthesis of tin oxide (SnO2) nanoparticles using jujube fruit for photocatalytic degradation of organic dyes. Adv. Powder Technol. 2019, 30, 1551–1557. [Google Scholar] [CrossRef]
  25. Chen, X.; Chu, D.; Wang, L.; Hu, W.; Yang, H.; Sun, J.; Zhu, S.; Wang, G.; Tao, J.; Zhang, S. One-step synthesis of novel hierarchical flower-like SnO2 nanostructures with enhanced photocatalytic activity. J. Alloy. Compd. 2017, 729, 710–715. [Google Scholar] [CrossRef]
  26. Gui-Bing, H.; Chun-Jie, J. Biosynthesis of SnO nanoparticles based on response surface methodology and the study of their dye removal. J. Nanosci. Nanotechnol. 2018, 18, 5020. [Google Scholar]
  27. Zhang, W.-N.; Zuo, H.-J.; Wang, N.-P.; Gao, Y. Preparation and photocatalytic properties of SnO2 nanomicrospheres. Main Group Chem. 2016, 15, 295–299. [Google Scholar] [CrossRef]
  28. Luque, P.; Garrafa-Gálvez, H.; Nava, O.; Olivas, A.; Martínez-Rosas, M.; Vilchis-Nestor, A.; Villegas-Fuentes, A.; Chinchillas-Chinchillas, M. Efficient sunlight and UV photocatalytic degradation of Methyl Orange, Methylene Blue and Rhodamine B, using Citrus×paradisi synthesized SnO2 semiconductor nanoparticles. Ceram. Int. 2021, 47, 23861–23874. [Google Scholar] [CrossRef]
Figure 1. XRD patterns of (a) different reaction times, (b) different surfactants at 5 h of solvothermal and (c) different F ratios. (d) Fourier transform infrared spectrum of SnO2 sample obtained from different fluorine doping ratios.
Coatings 12 00795 g001
Figure 2. SEM images of adding different surfactants: (a) SDS, (b) PVP, (c) PEG, (d) SDBS. SEM images of nano-SnO2 samples prepared by different F doping ratios: (e) n(F)/n(Sn) = 0:1(S0), (f) n(F)/n(Sn) = 1:1(S1), (g) n(F)/n(Sn) = 1:5(S2), (h) n(F)/n(Sn) = 1:10(S3), and (i) n(F)/n(Sn) = 1:15(S4).
Coatings 12 00795 g002
Figure 3. Mapping points of (a) SEM, (b) O, (c) F and (d) Sn elements of S2 sample. EDS spectrum and (e) contents of S2 sample.
Coatings 12 00795 g003
Figure 4. The photocatalytic efficiency of SnO2 samples by (a) different solvothermal time, (b) different surfactants and (c) different F doping ratios. (d) Effects of Rh B degradation by different trapping on F-doped SnO2.
Coatings 12 00795 g004
Figure 5. The degradation mechanism of Rh B.
Coatings 12 00795 g005
Table 1. Different experimental parameters of SnO2 prepared by solvothermal method.
ConditionsReagentTimeSurfactant
Different solvent–thermal times48 mL oleic acid;
32 mL lauryl amine;
1.4 g SnCl4·5H2O
5 hNone
10 h
15 h
20 h
Different surfactants48 mL oleic acid;
32 mL lauryl amine;
1.4 g SnCl4·5H2O
5 h1 mmol PEG (6000)
1 mmol PVP
1 mmol SDBS
1 mmol SDS
Table 2. Preparation of SnO2 powders with different F doping ratios.
SamplesSnCl4·5H2O (g)NaF (g)n(F)/n(Sn)F (wt.%)
S01.40.00000:10.00
S11.40.16801:112.70
S21.40.03361:52.50
S31.40.01681:101.70
S41.40.01121:150.84
Table 3. Comparison of the photocatalytic degradation efficiency of SnO2 nanoparticles.
YearSamplePollutantDegradation/TimeReference
2015SnO2Phenolsulfonphthalein100% (120 min)[23]
2019SnO2Rh B95% (90 min)[12]
2019SnO2MB90% (5 h)[24]
2017SnO2Rh B93.6% (120 min)[25]
2018SnO2Malachite green90% (60 min)[26]
2016SnO2MB97.1% (200 min)[27]
2021SnO2Rh B100% (60 min)[28]
2021SnO2/NCQDsRh B99% (120 min)[18]
2022F doped SnO2Rh B92.9% (25 min)This study
Publisher’s Note: MDPI stays neutral with regard to jurisdictional claims in published maps and institutional affiliations.

