
Impact Analysis of Initial Cracks’ Angle on Fatigue Failure of Flange Shafts


Abstract
:1. Introduction
2. Calculation Principle of Crack Propagation
2.1. Criterion of the Crack Propagation Direction
2.2. Effective Stress Intensity Factor
2.3. Crack Propagation Analysis Model
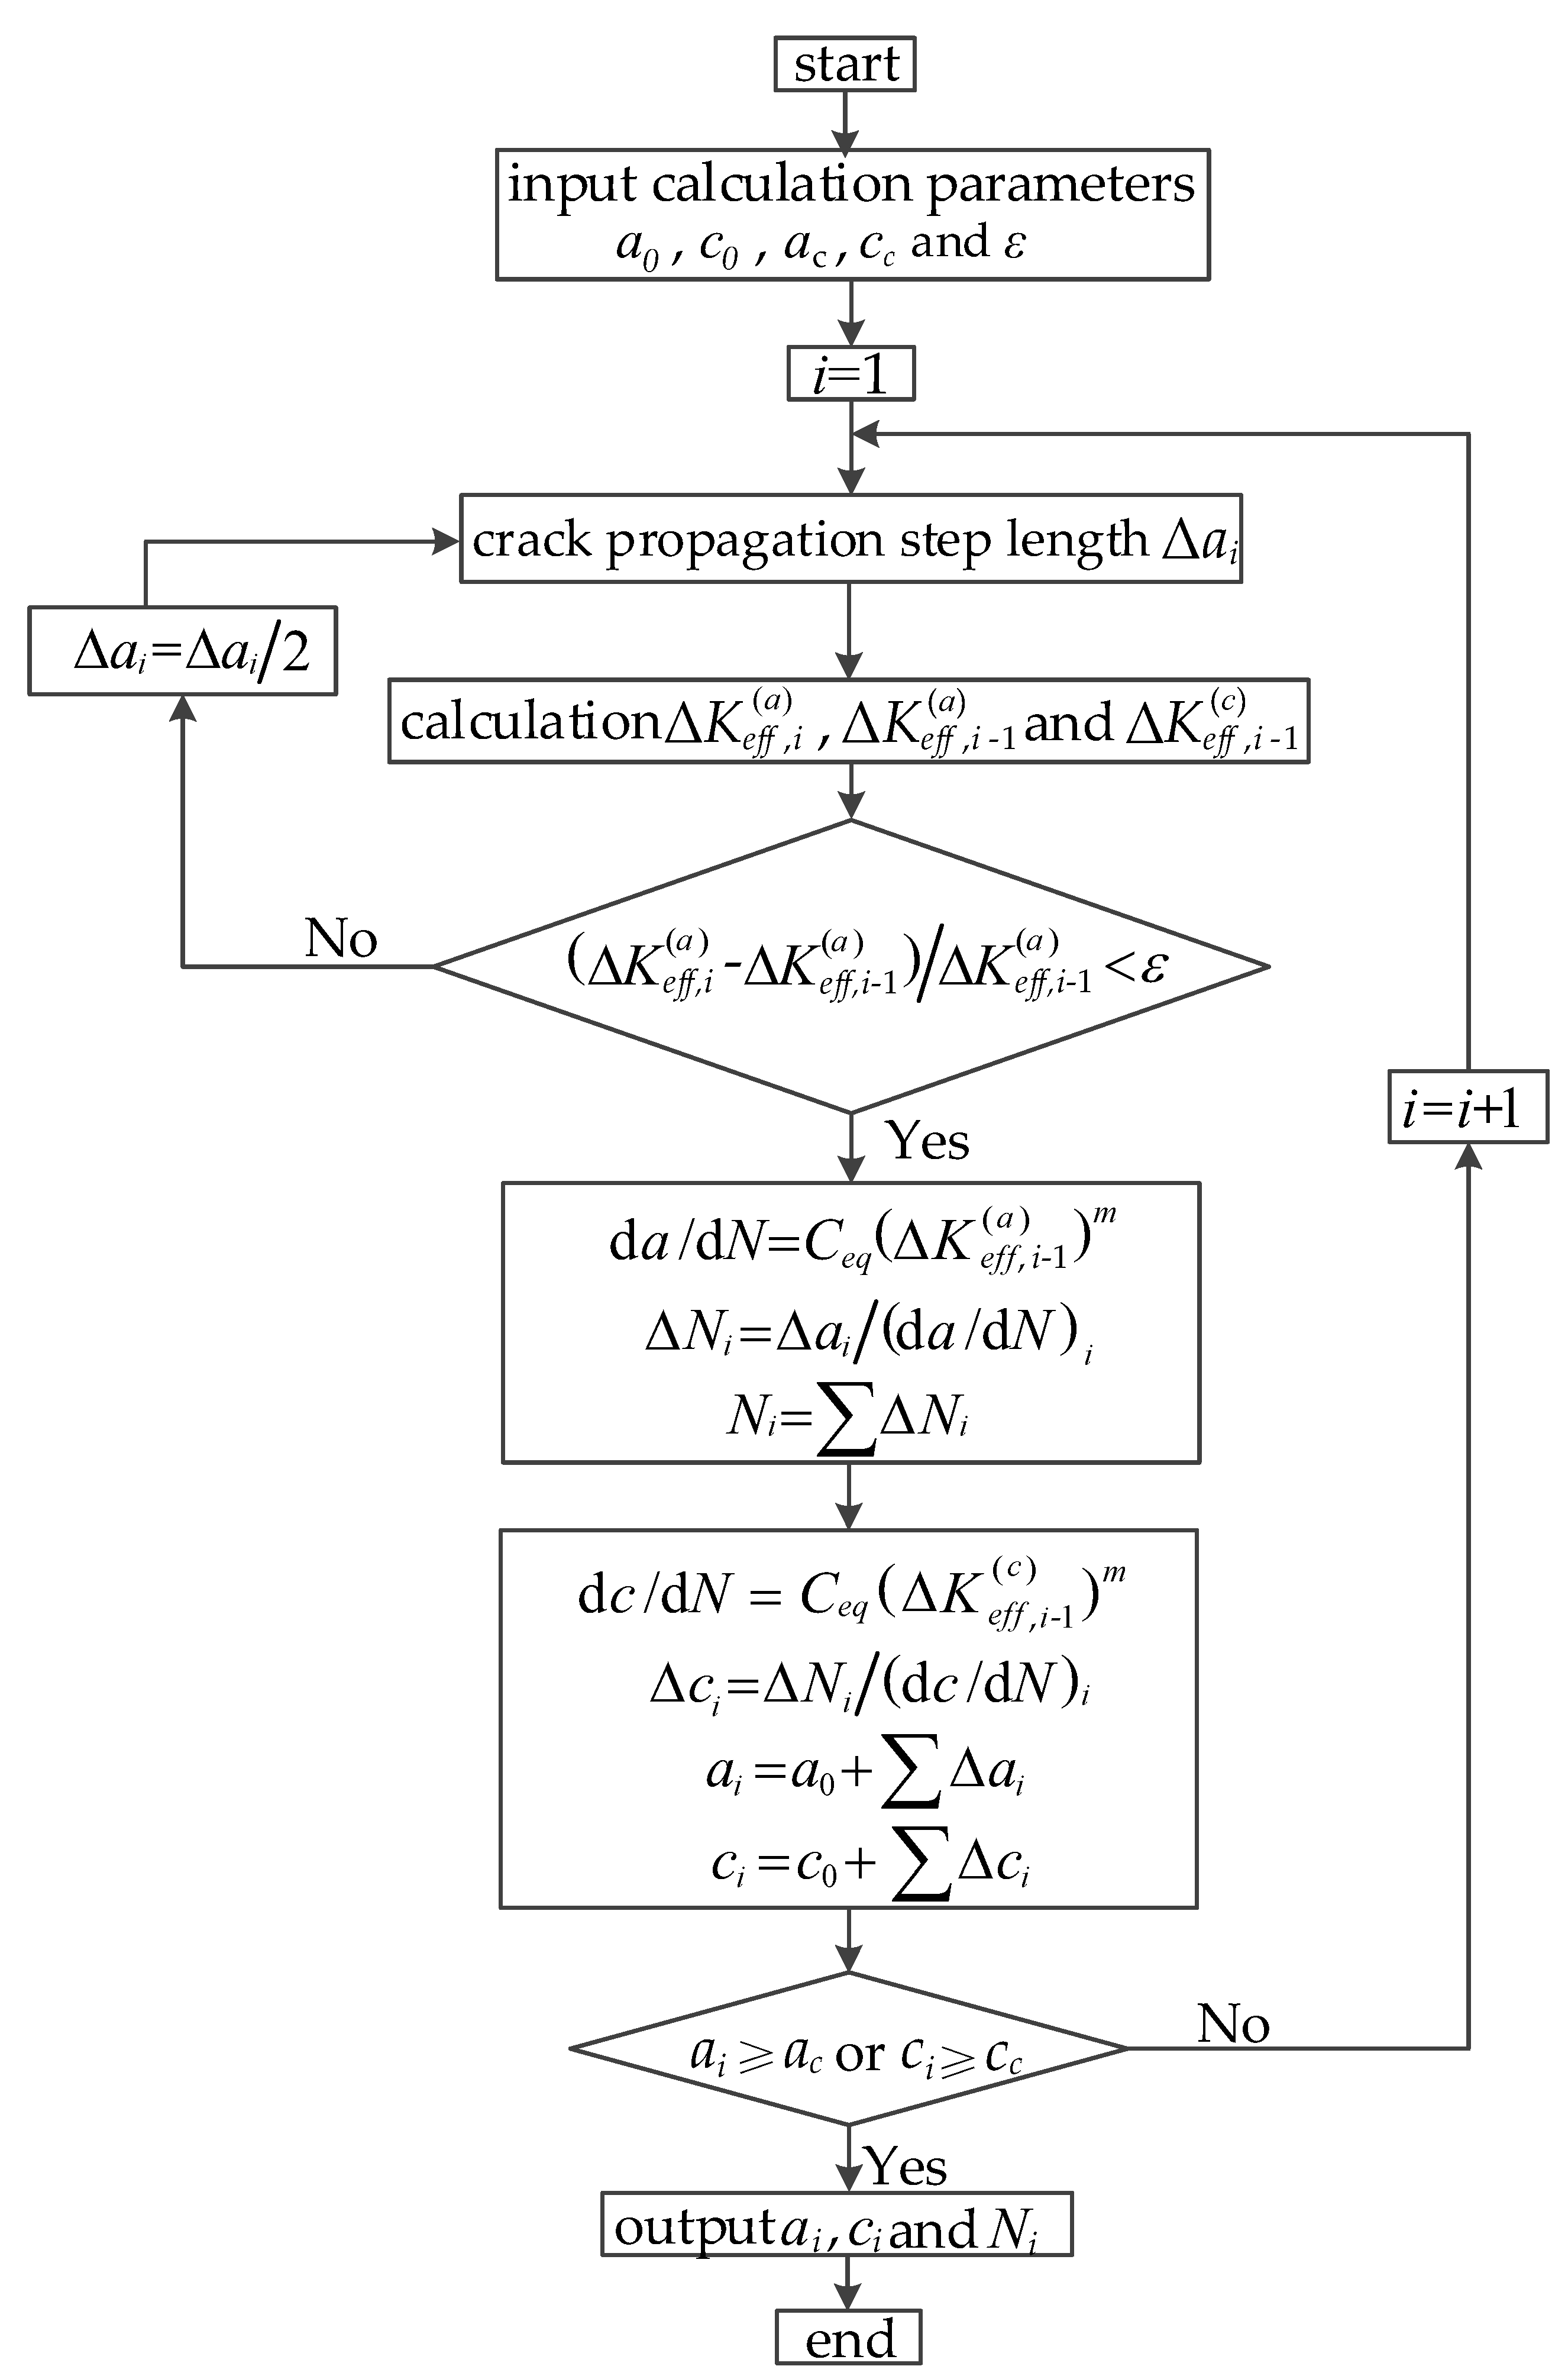
2.4. Calculation Procedures of the Crack Propagation Process
- (1)
- Select an appropriate crack propagation step length as . Generally, the smaller is, the higher the calculation accuracy and the longer the calculation time will become.
- (2)
- The figures to be calculated include: crack depth , crack length , the effective stress intensity factor of the deepest point of crack, crack depth , crack length , effective stress intensity factor of the deepest point of crack, and the effective stress intensity factor of long axis endpoint of the crack. Among them, represents the number of steps for current propagation calculation, and refers to the total number of propagation steps calculation.
- (3)
- With a given tolerance ε, if reaches accuracy, then we proceed to the following steps, otherwise, let and return to step (2).
- (4)
- Suppose that the remained unchanged when the crack propagated from to , and
- (5)
- Calculate the propagation rate and propagation step length of the long axis endpoint of the crack in No. propagation:
- (6)
- Repeat step (1)–step (5), until or .
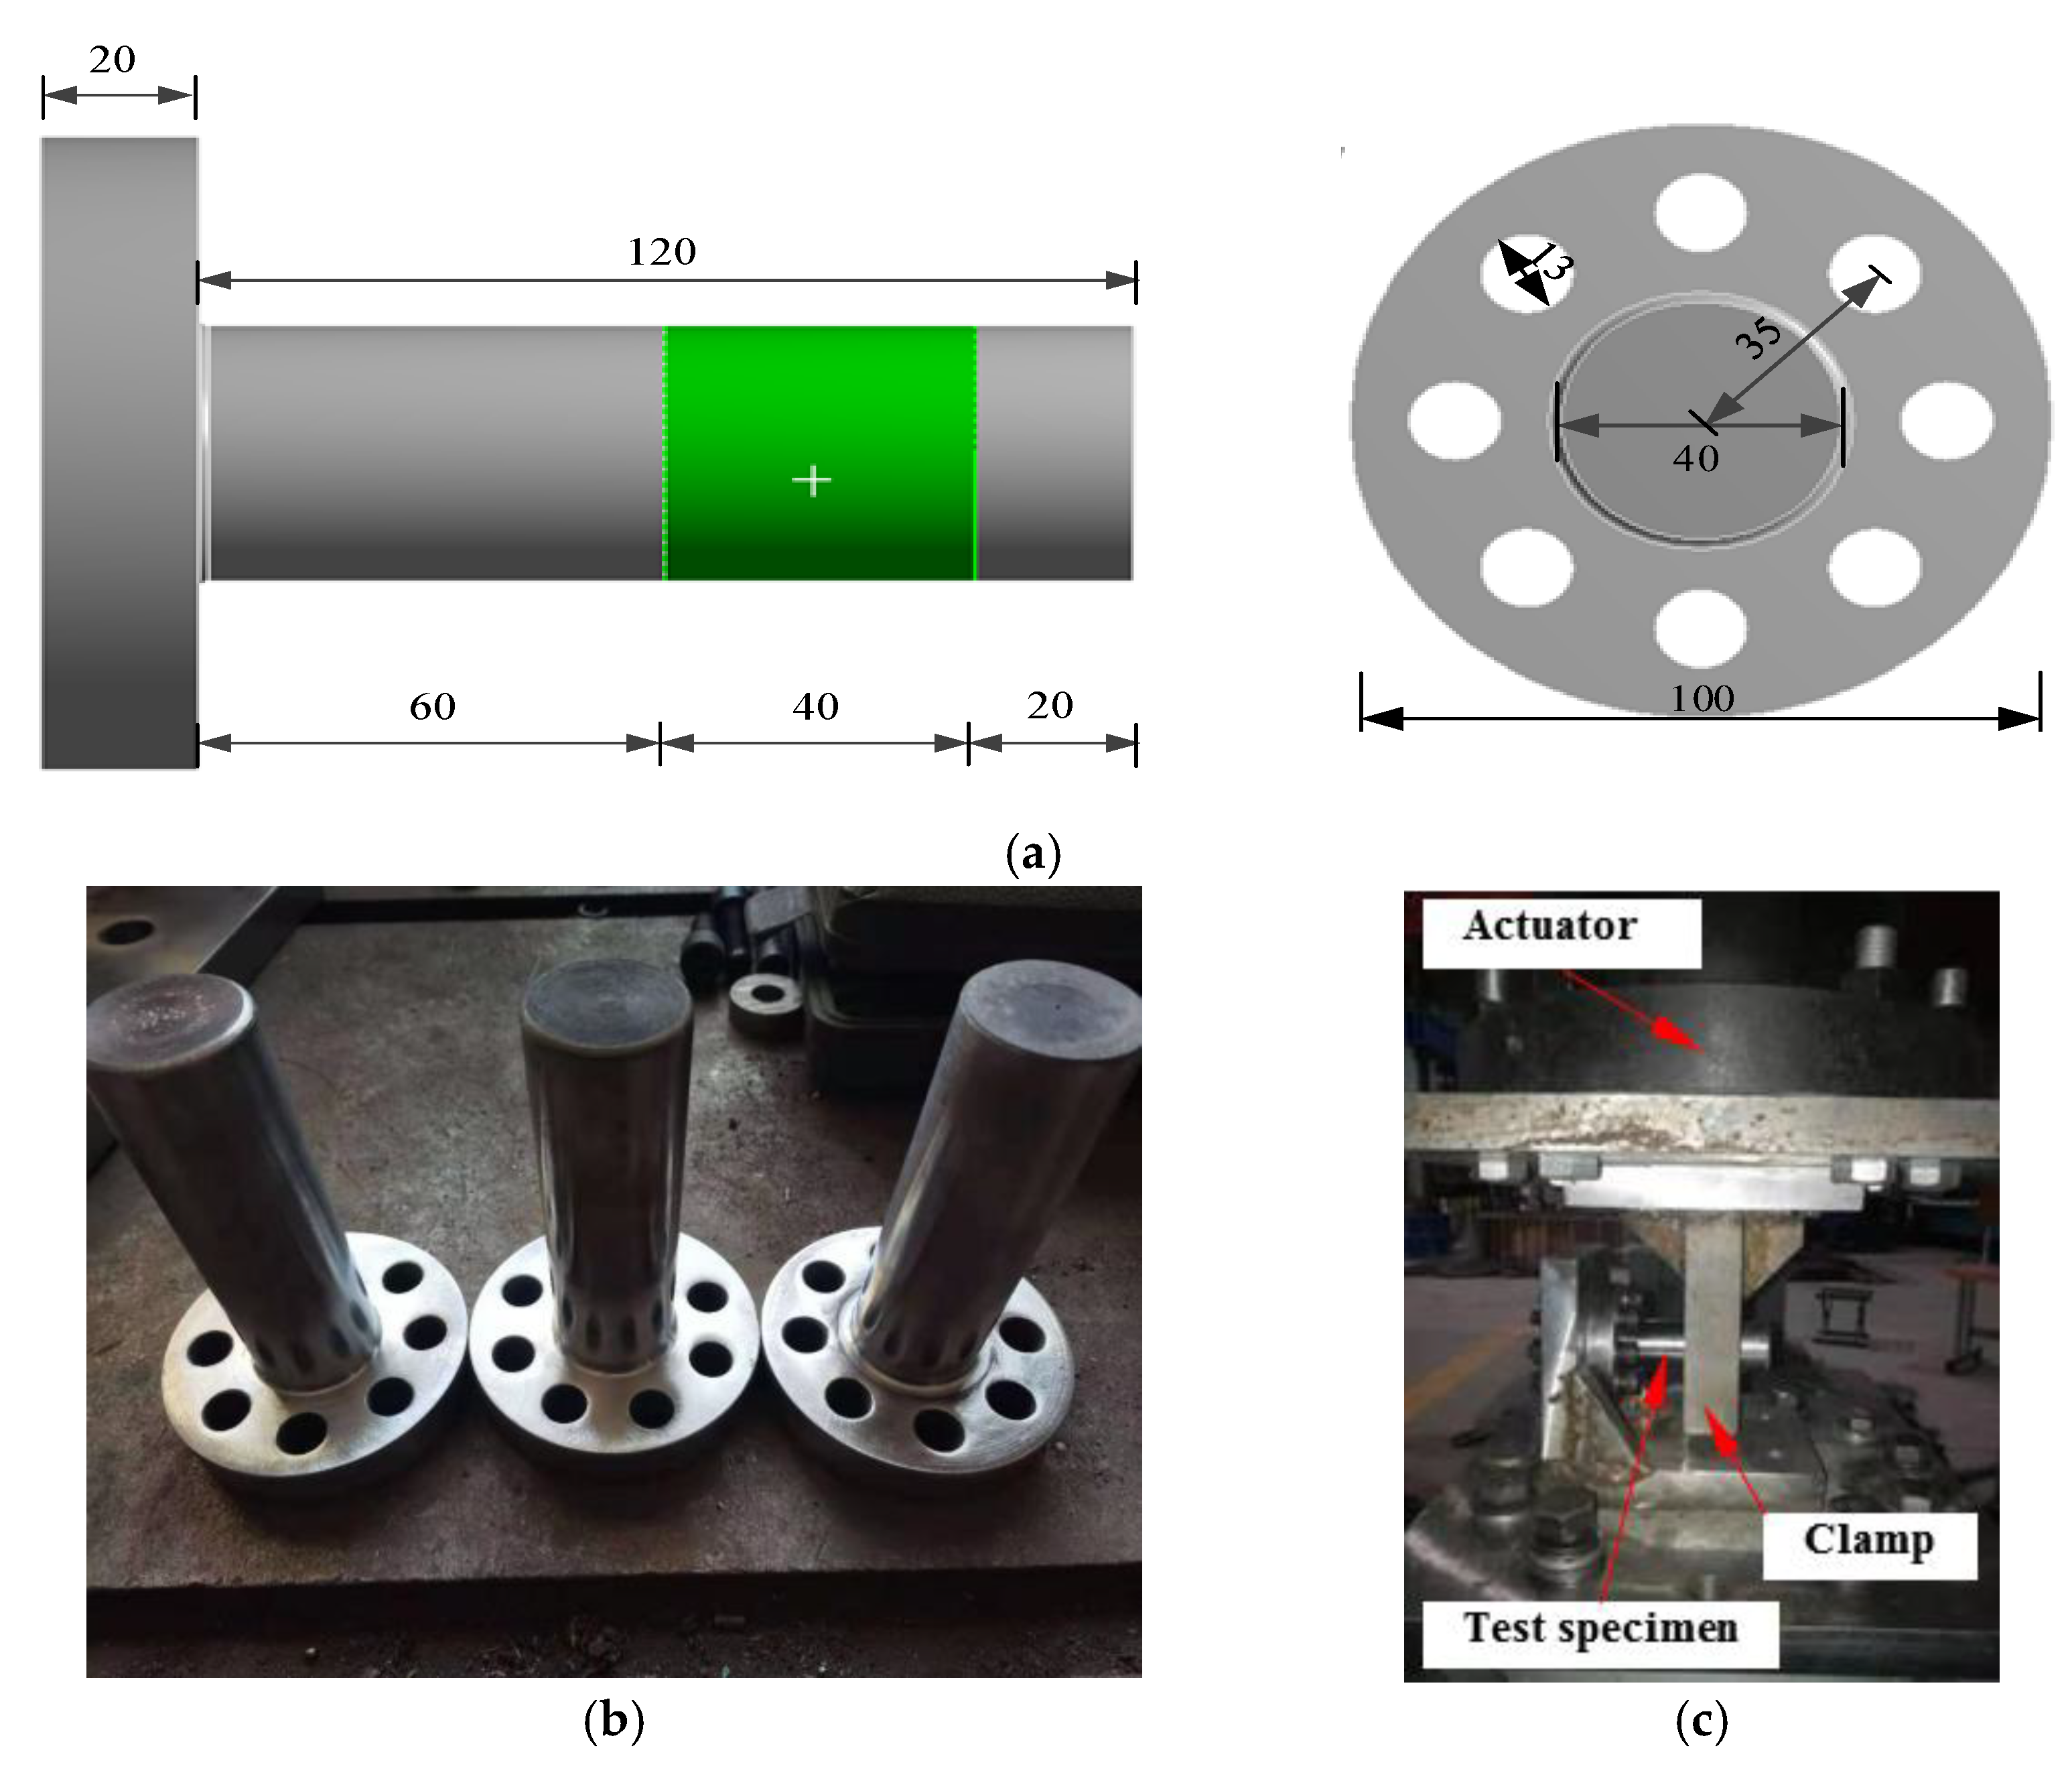
3. Verification of Fatigue Test and Numerical Simulation Method for Flange Shaft
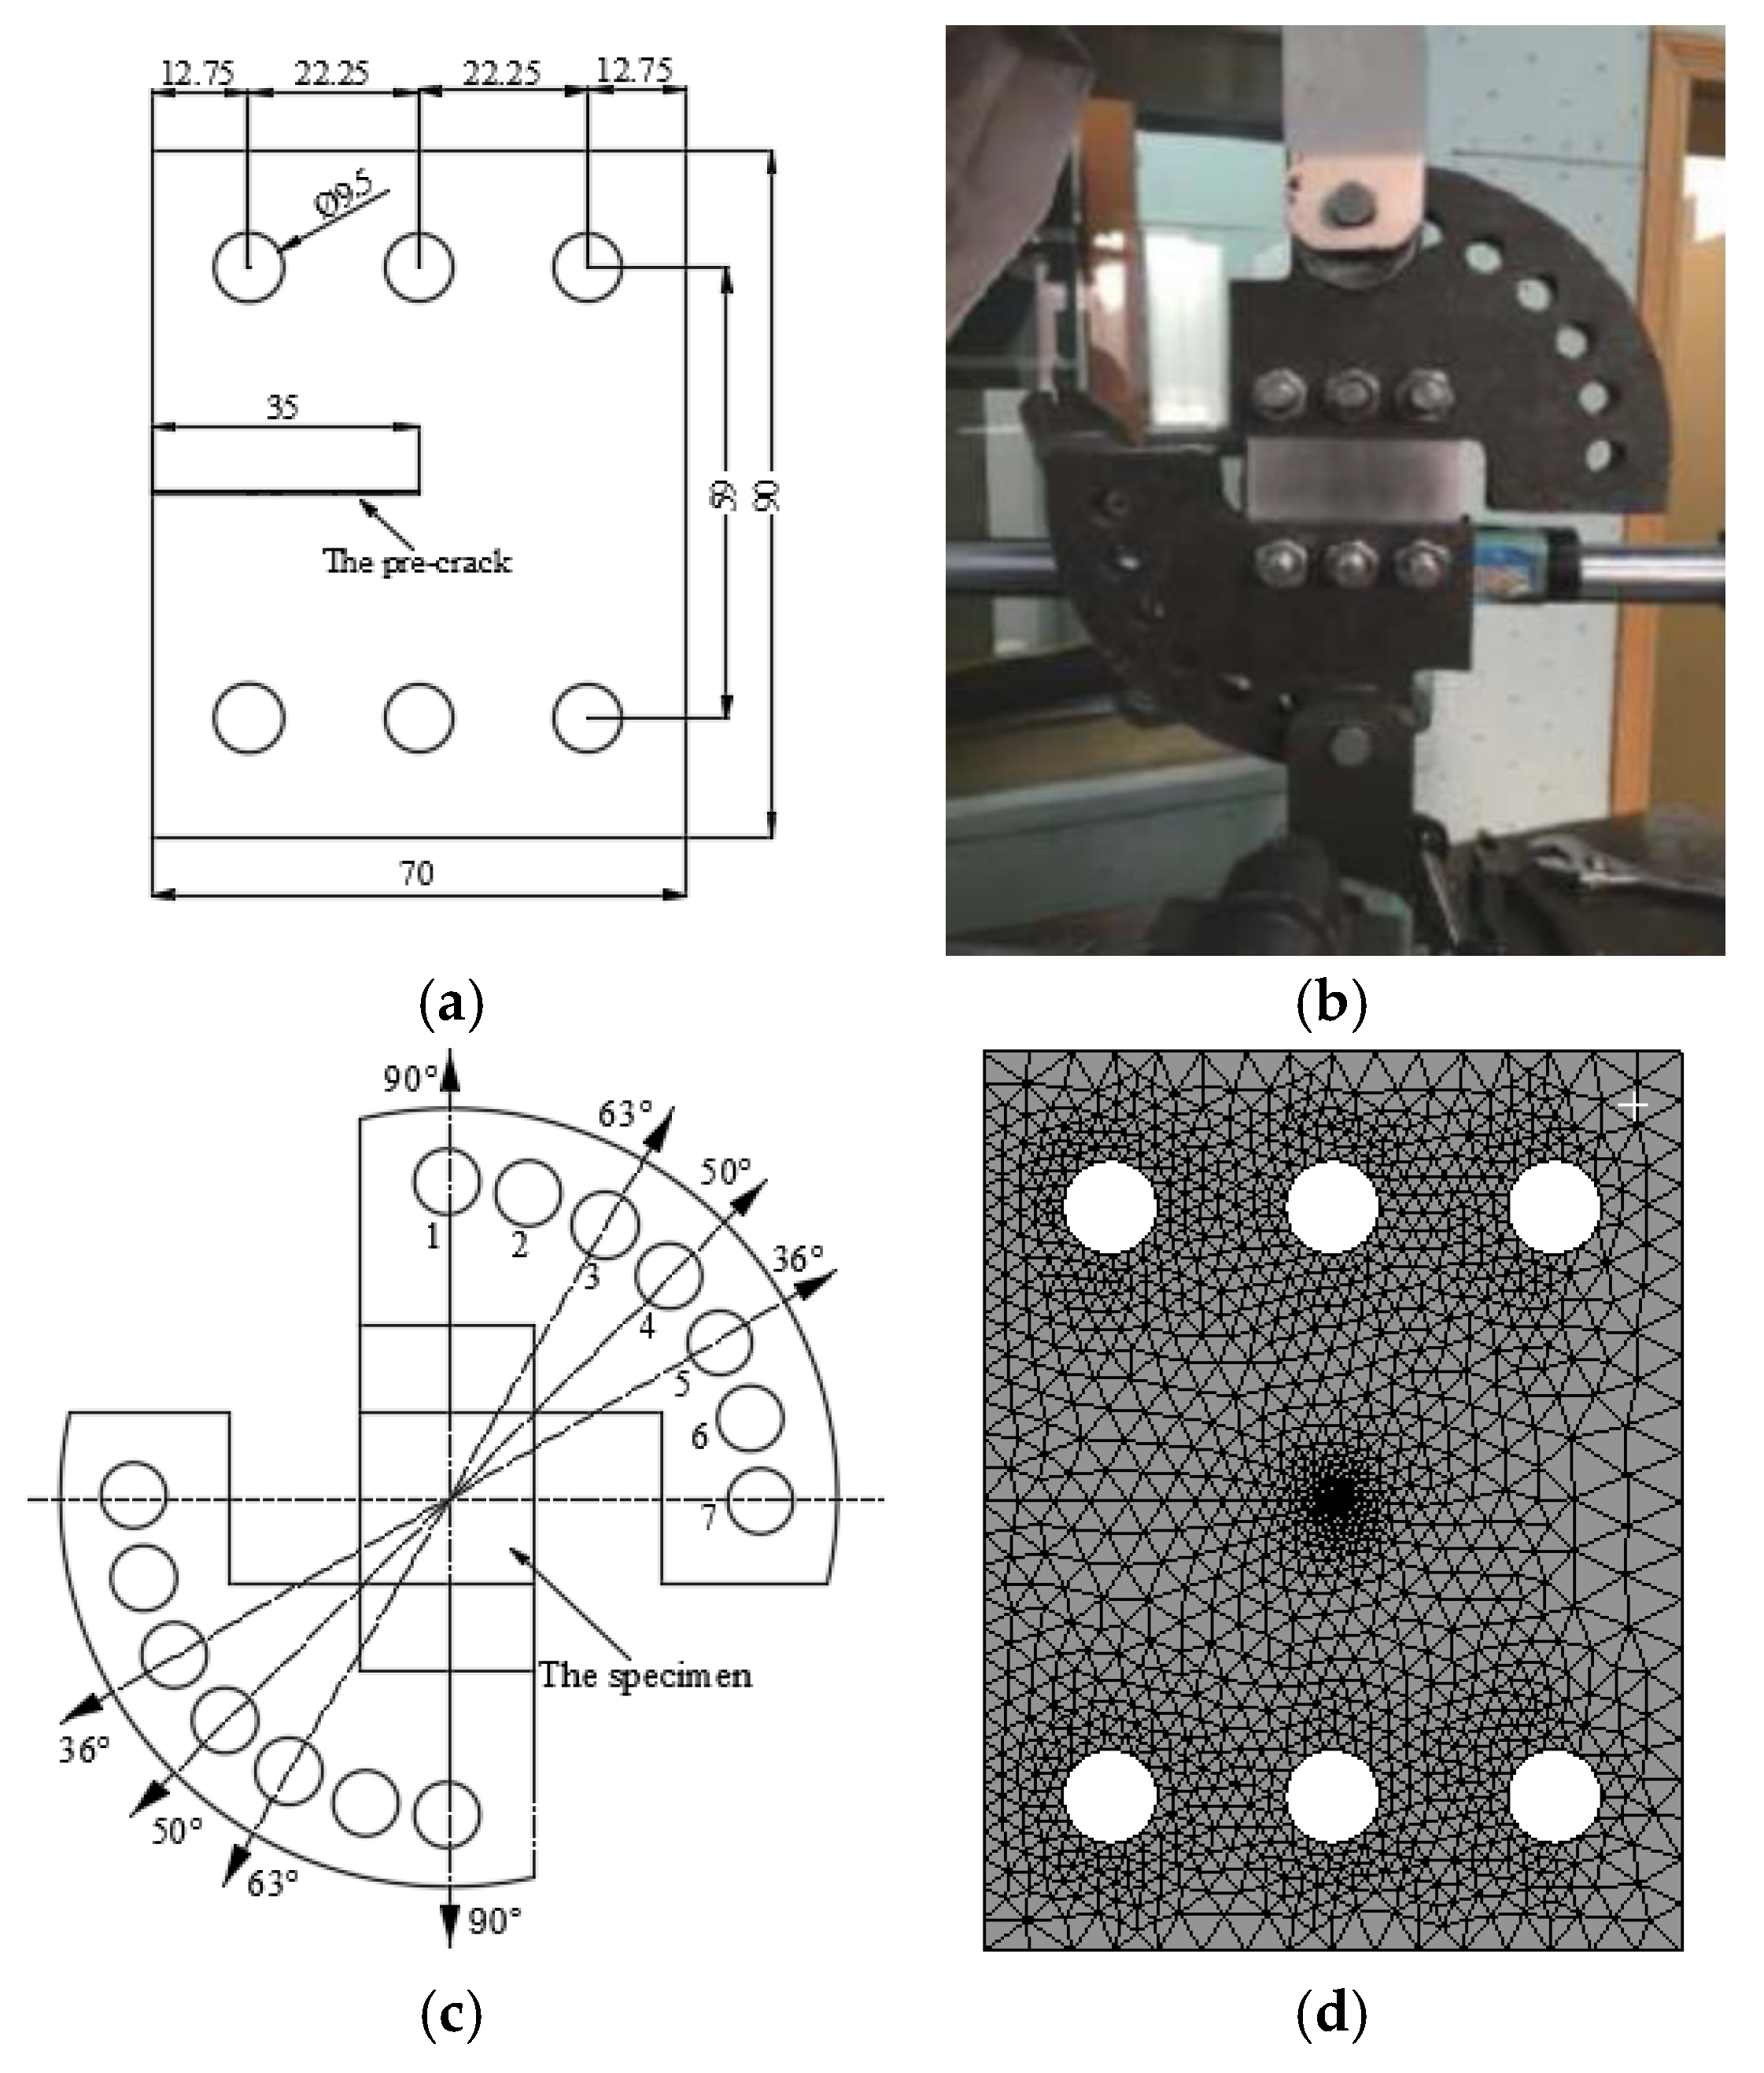
3.1. Test Overview
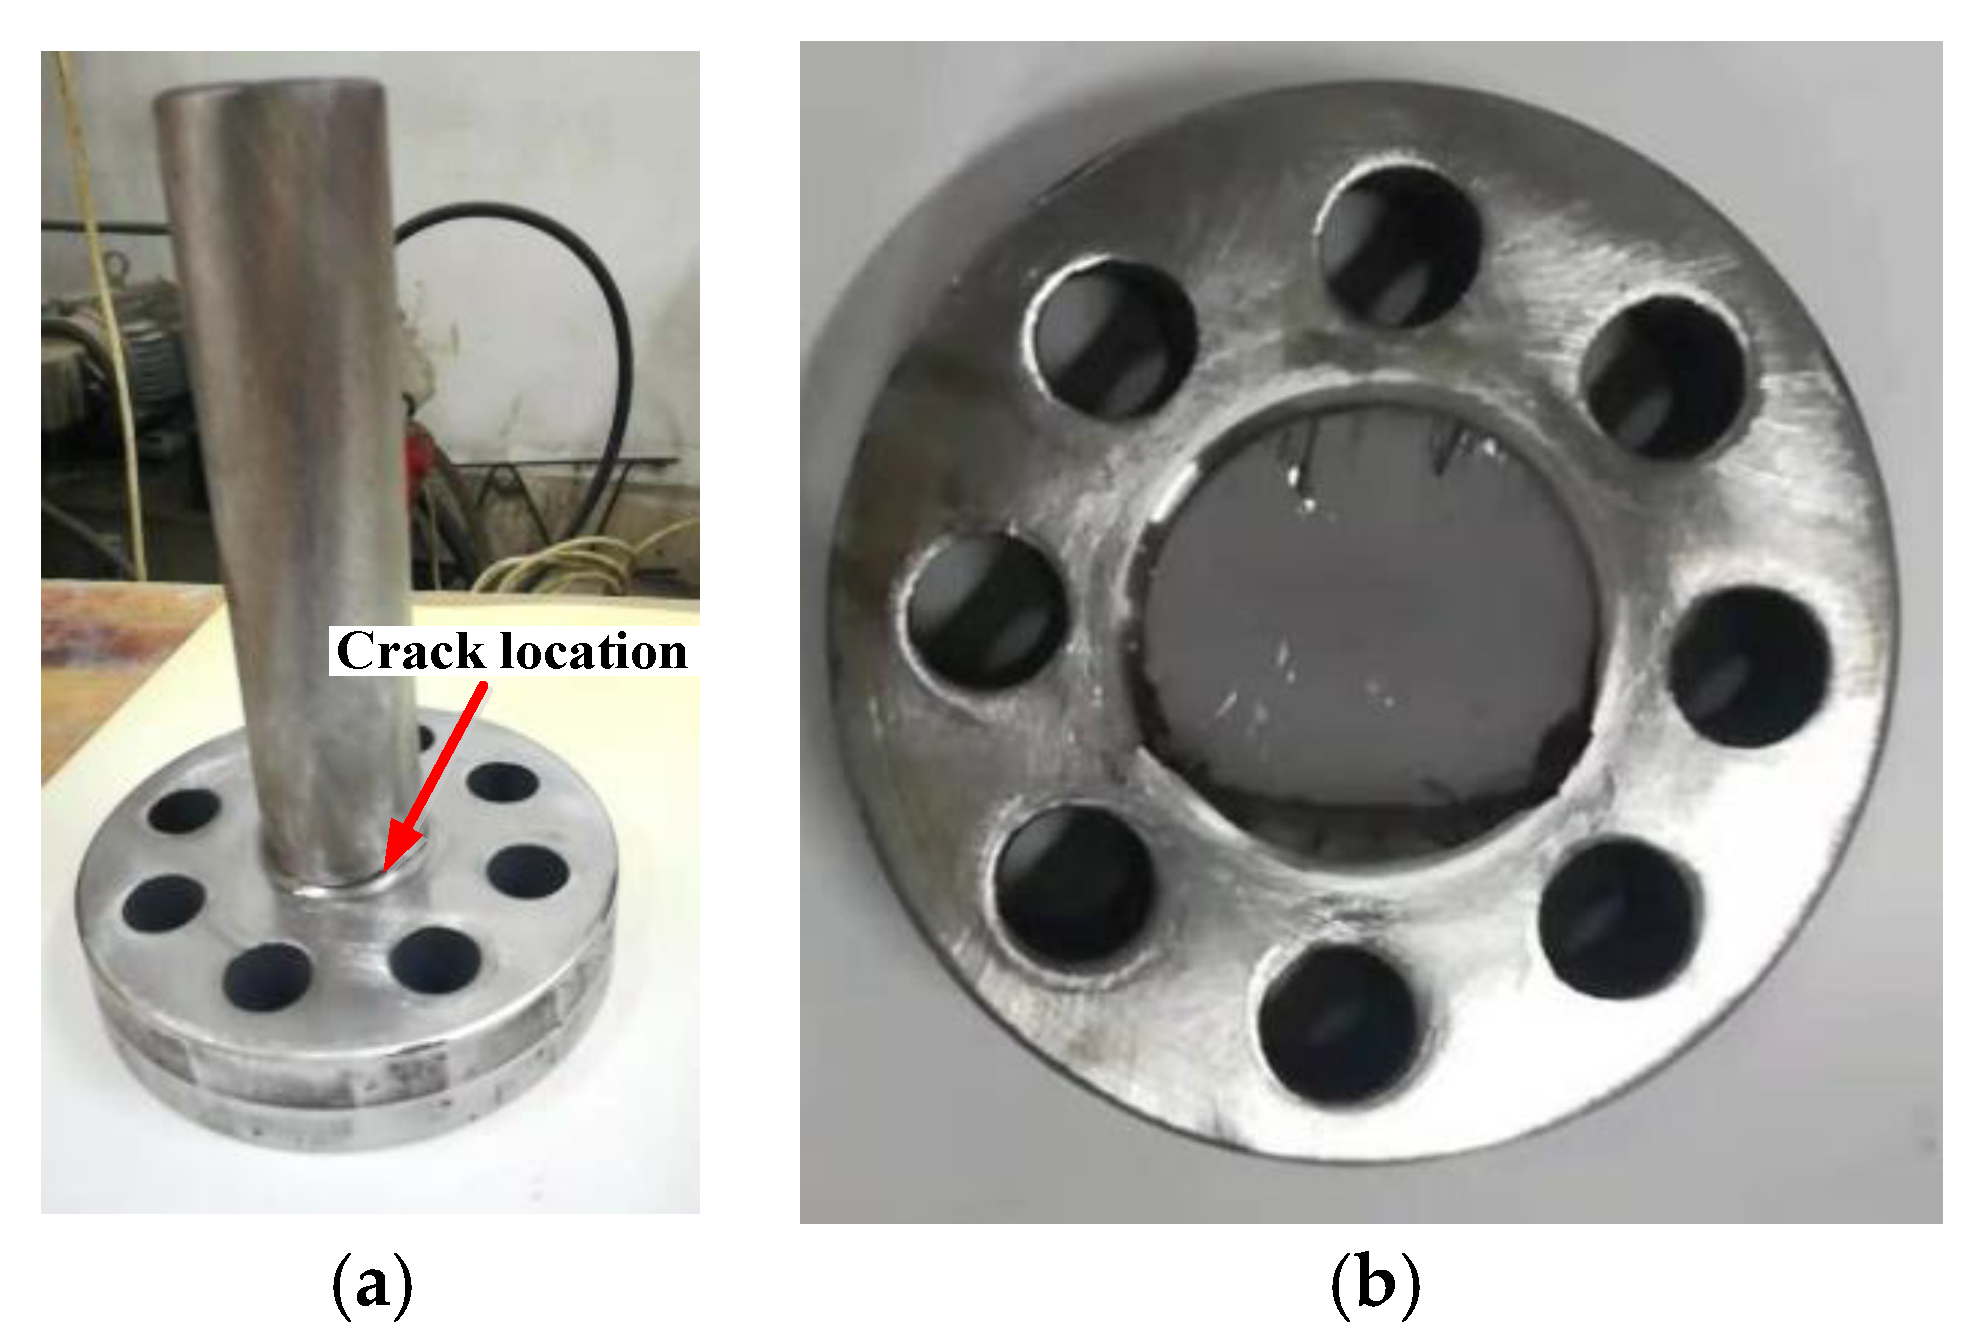
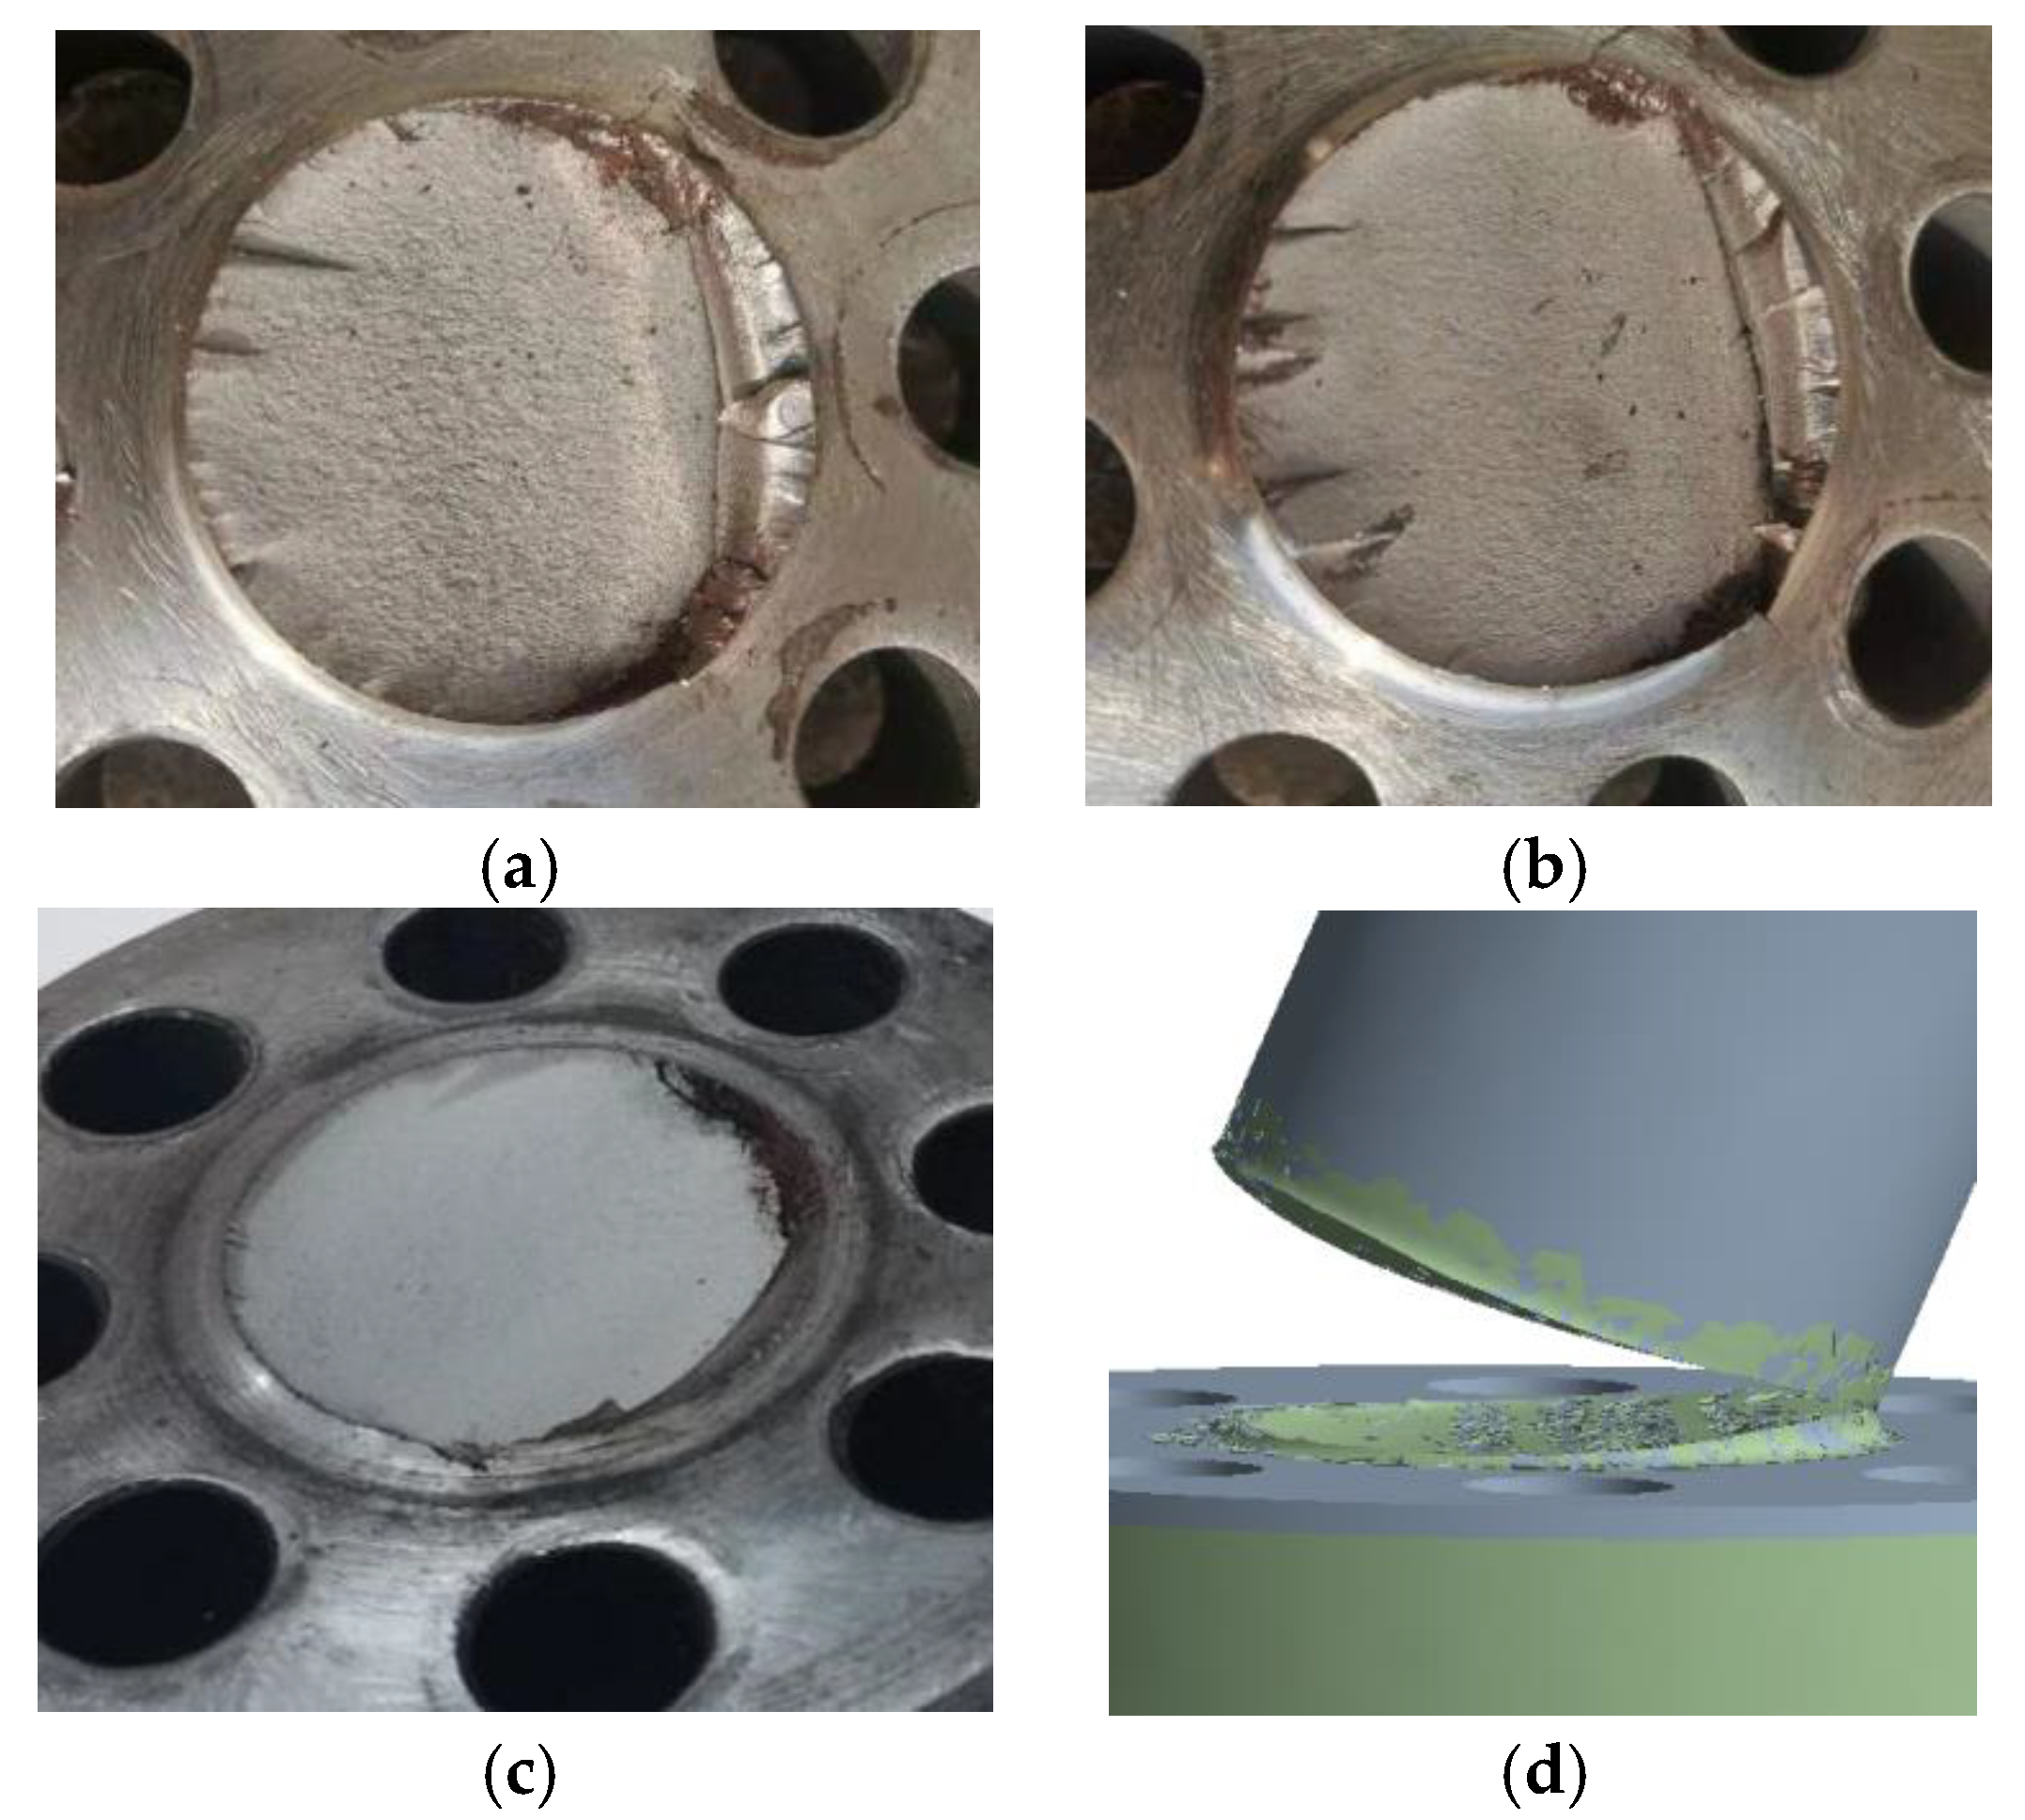
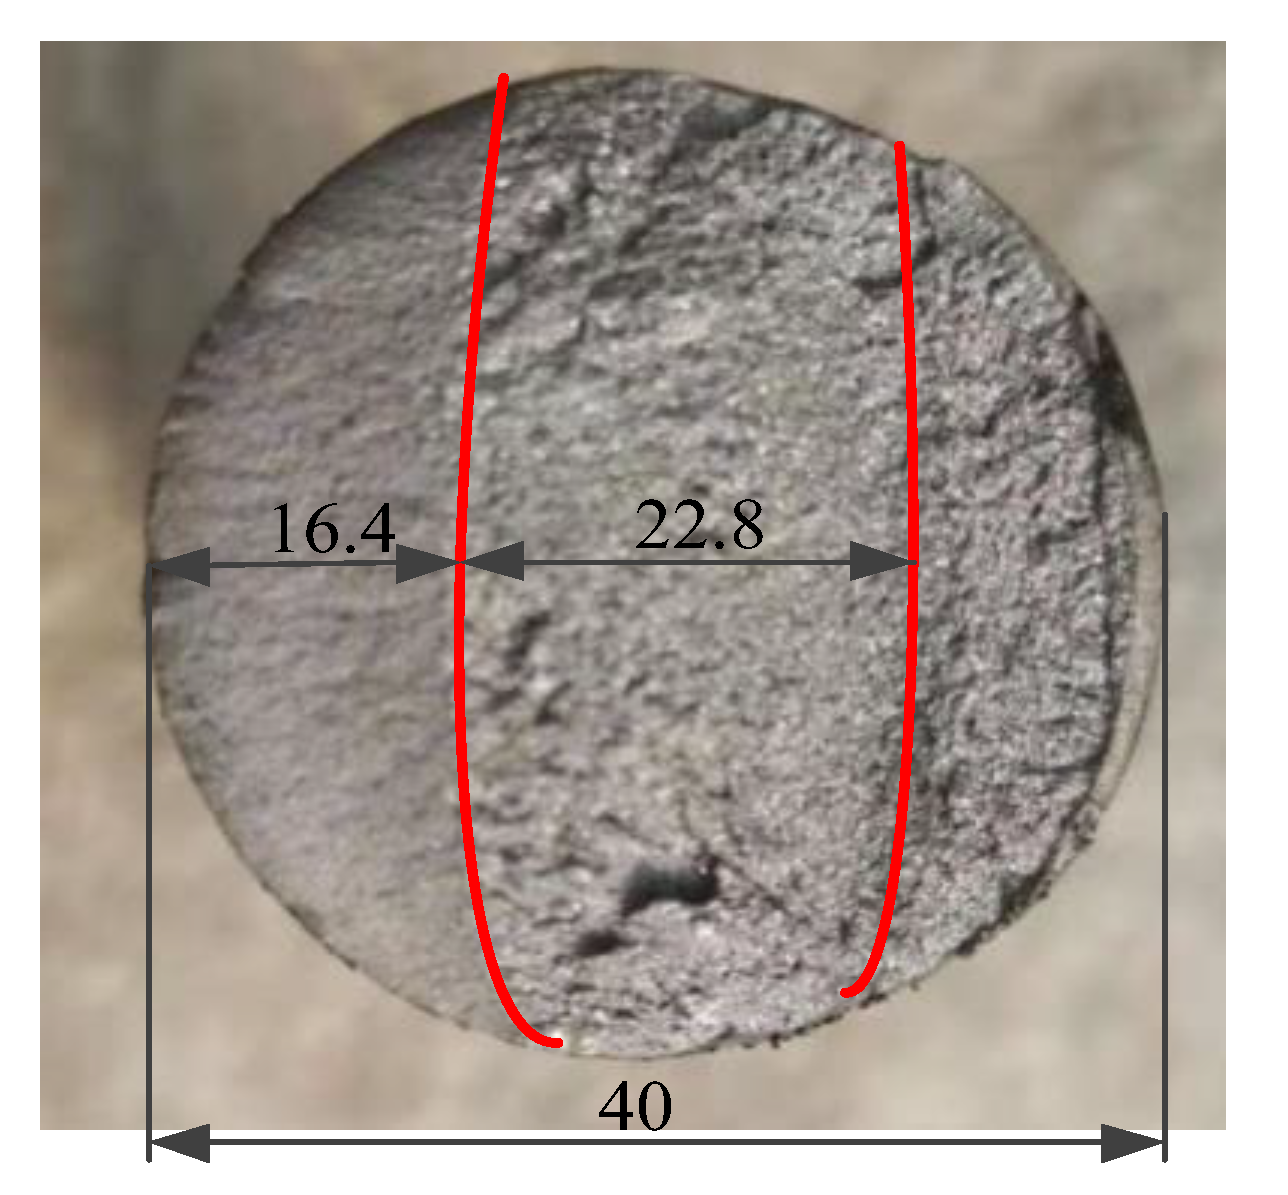
3.2. Fatigue Failure
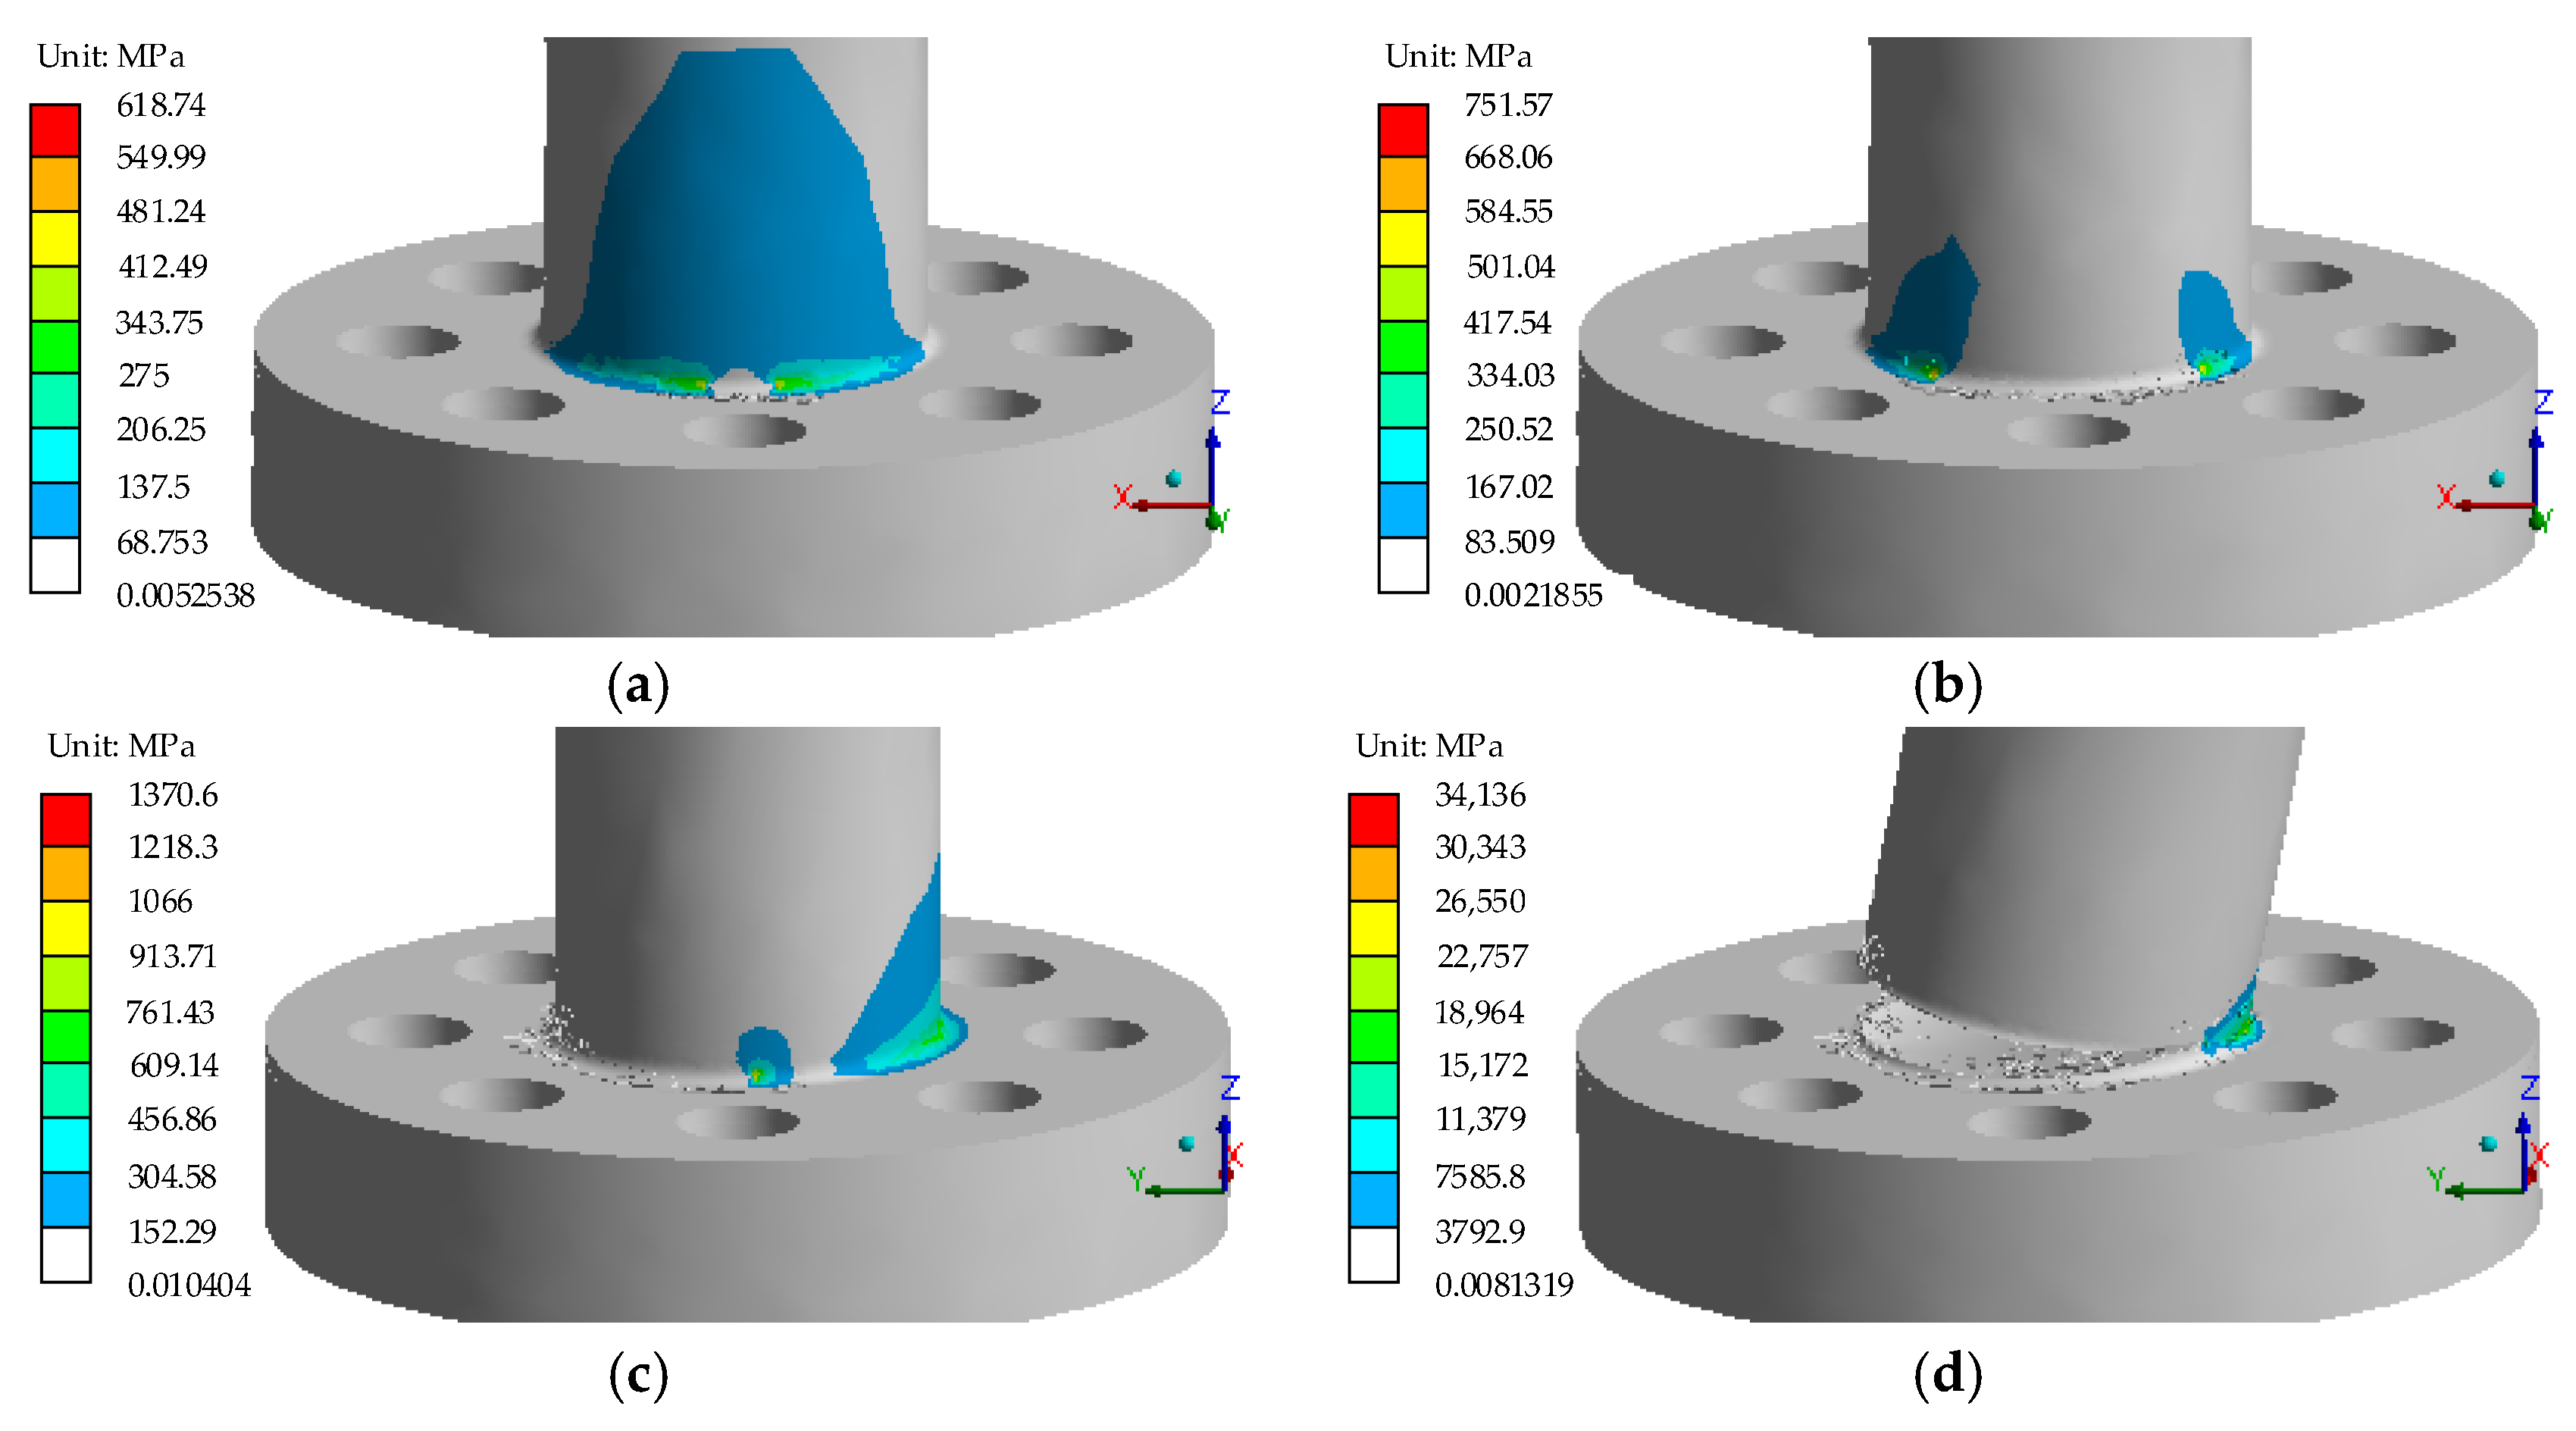
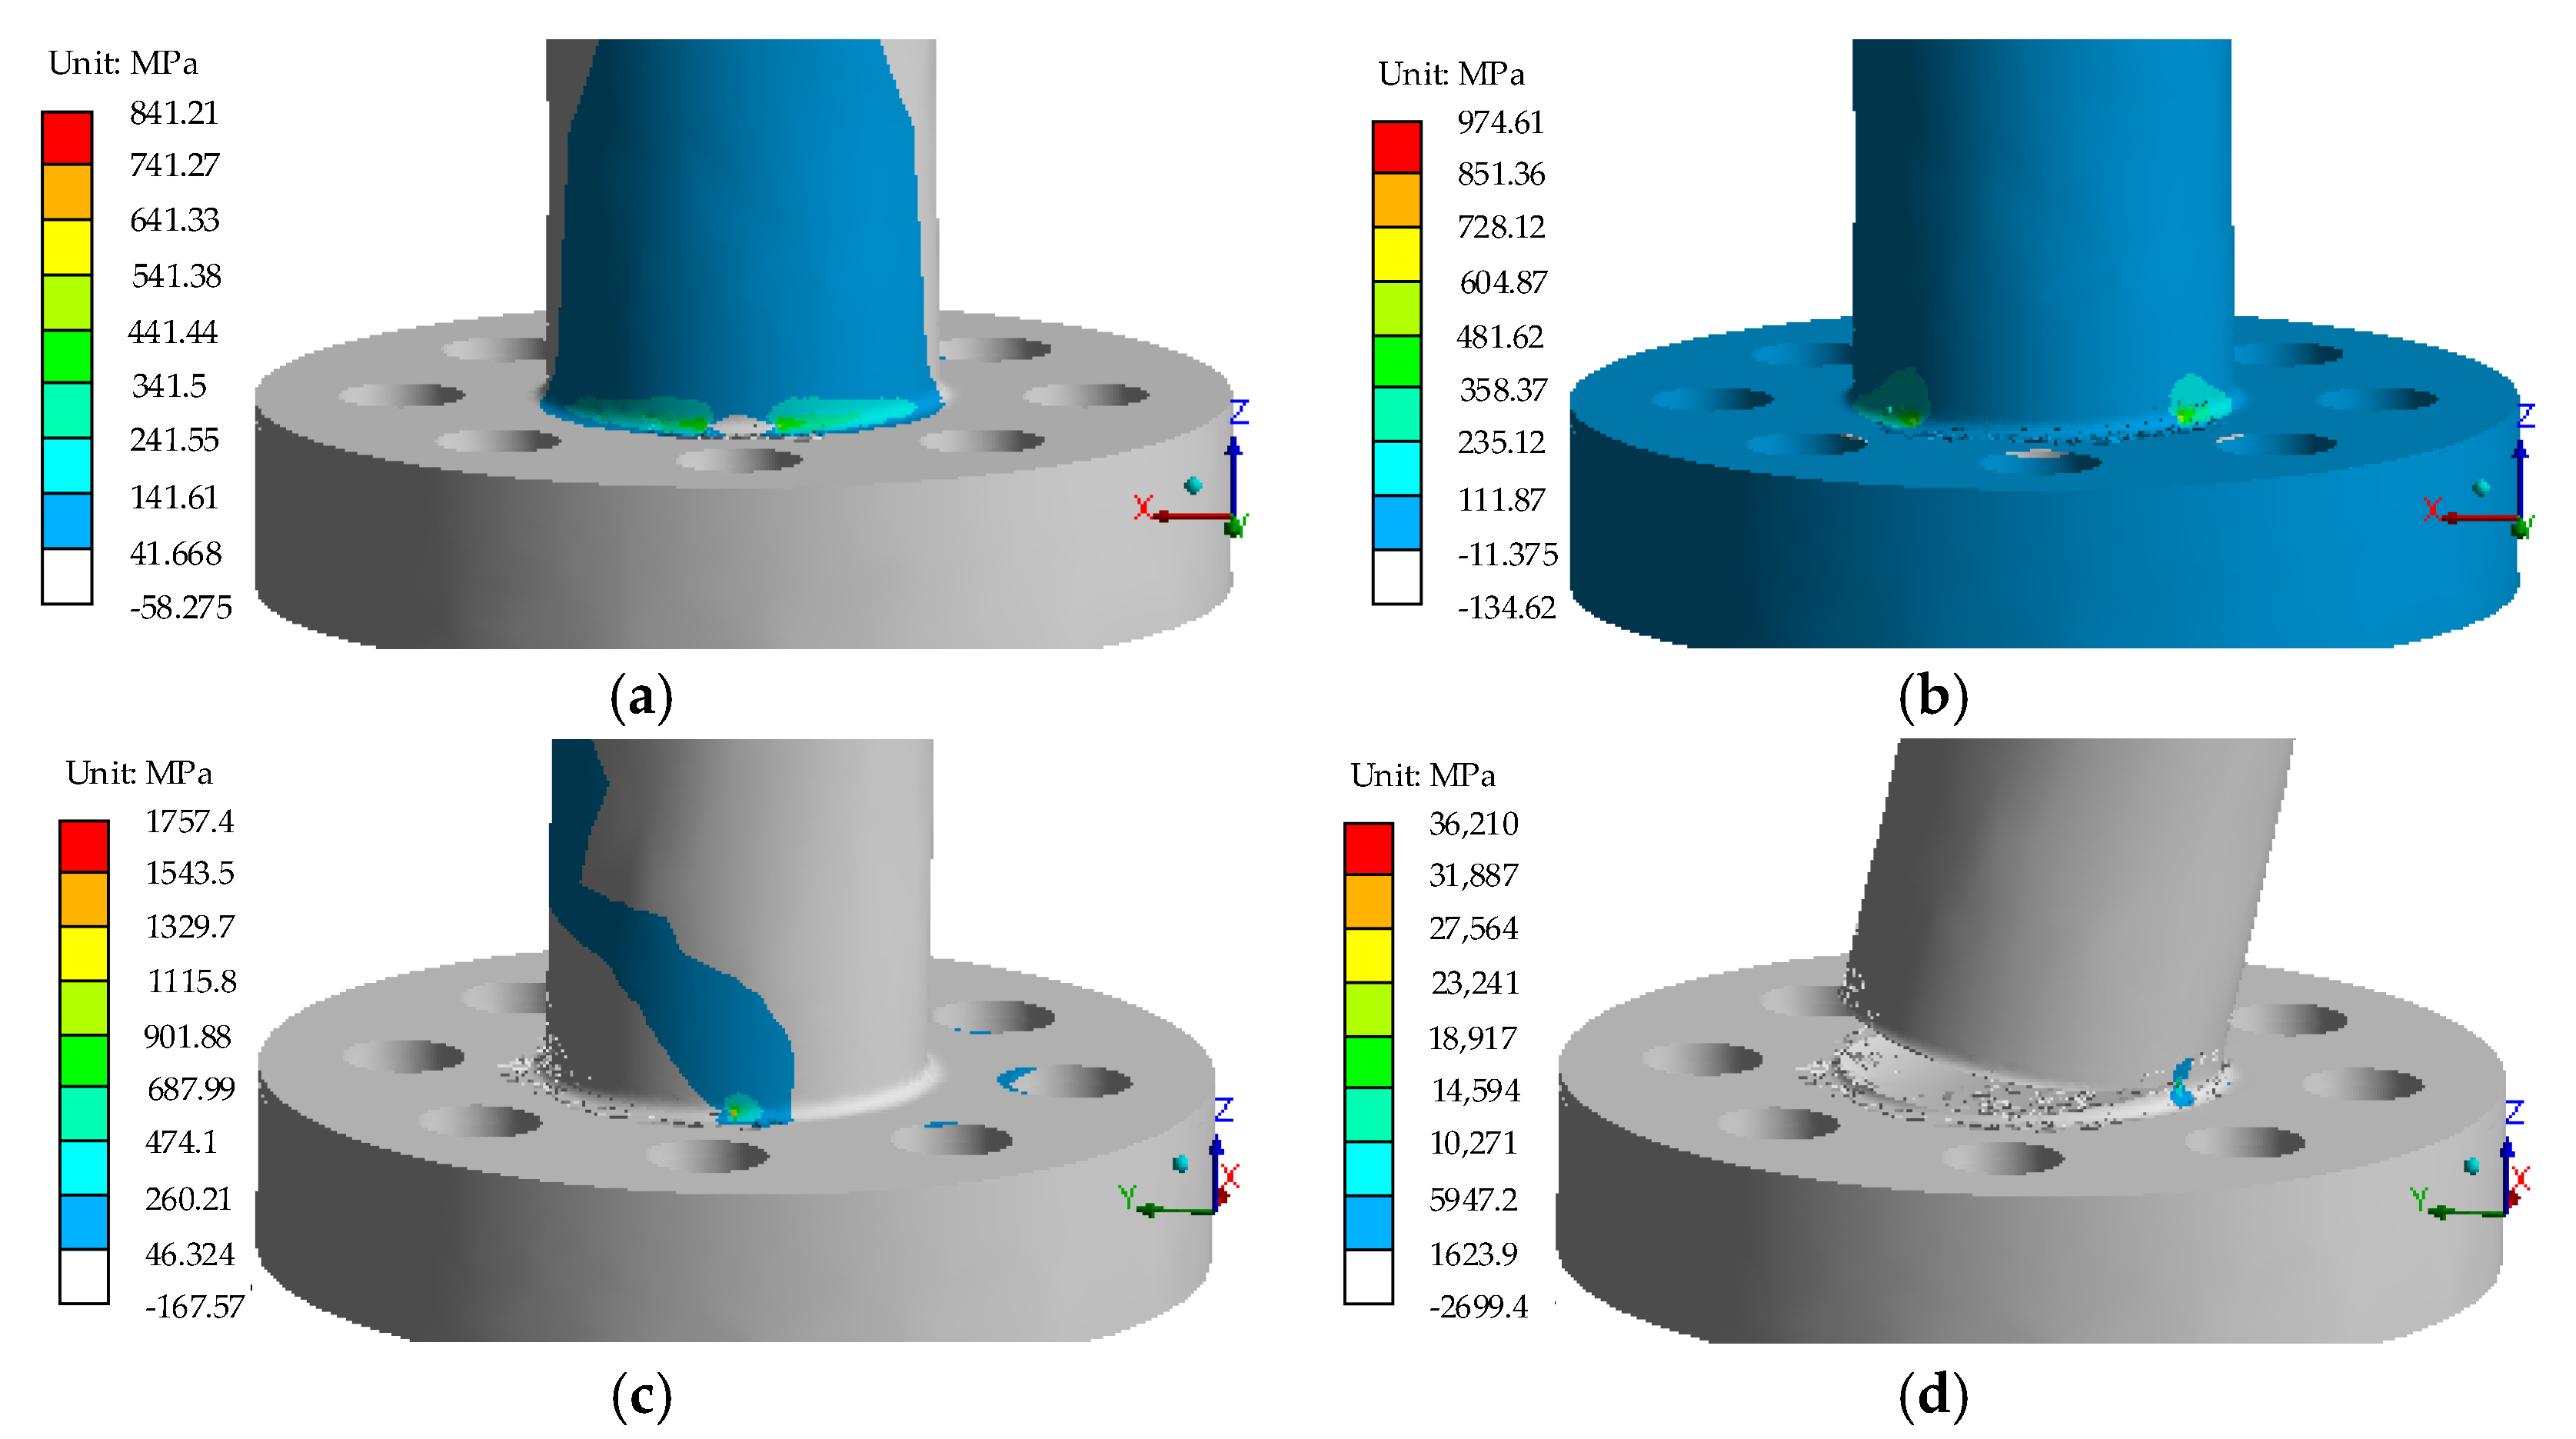
3.3. Verification of Numerical Simulation Method for Fatigue Crack
3.3.1. Verification of Standard Test
3.3.2. Verification of Test in This Paper
4. The Numerical Simulation of Crack Propagation on the Flange Shaft
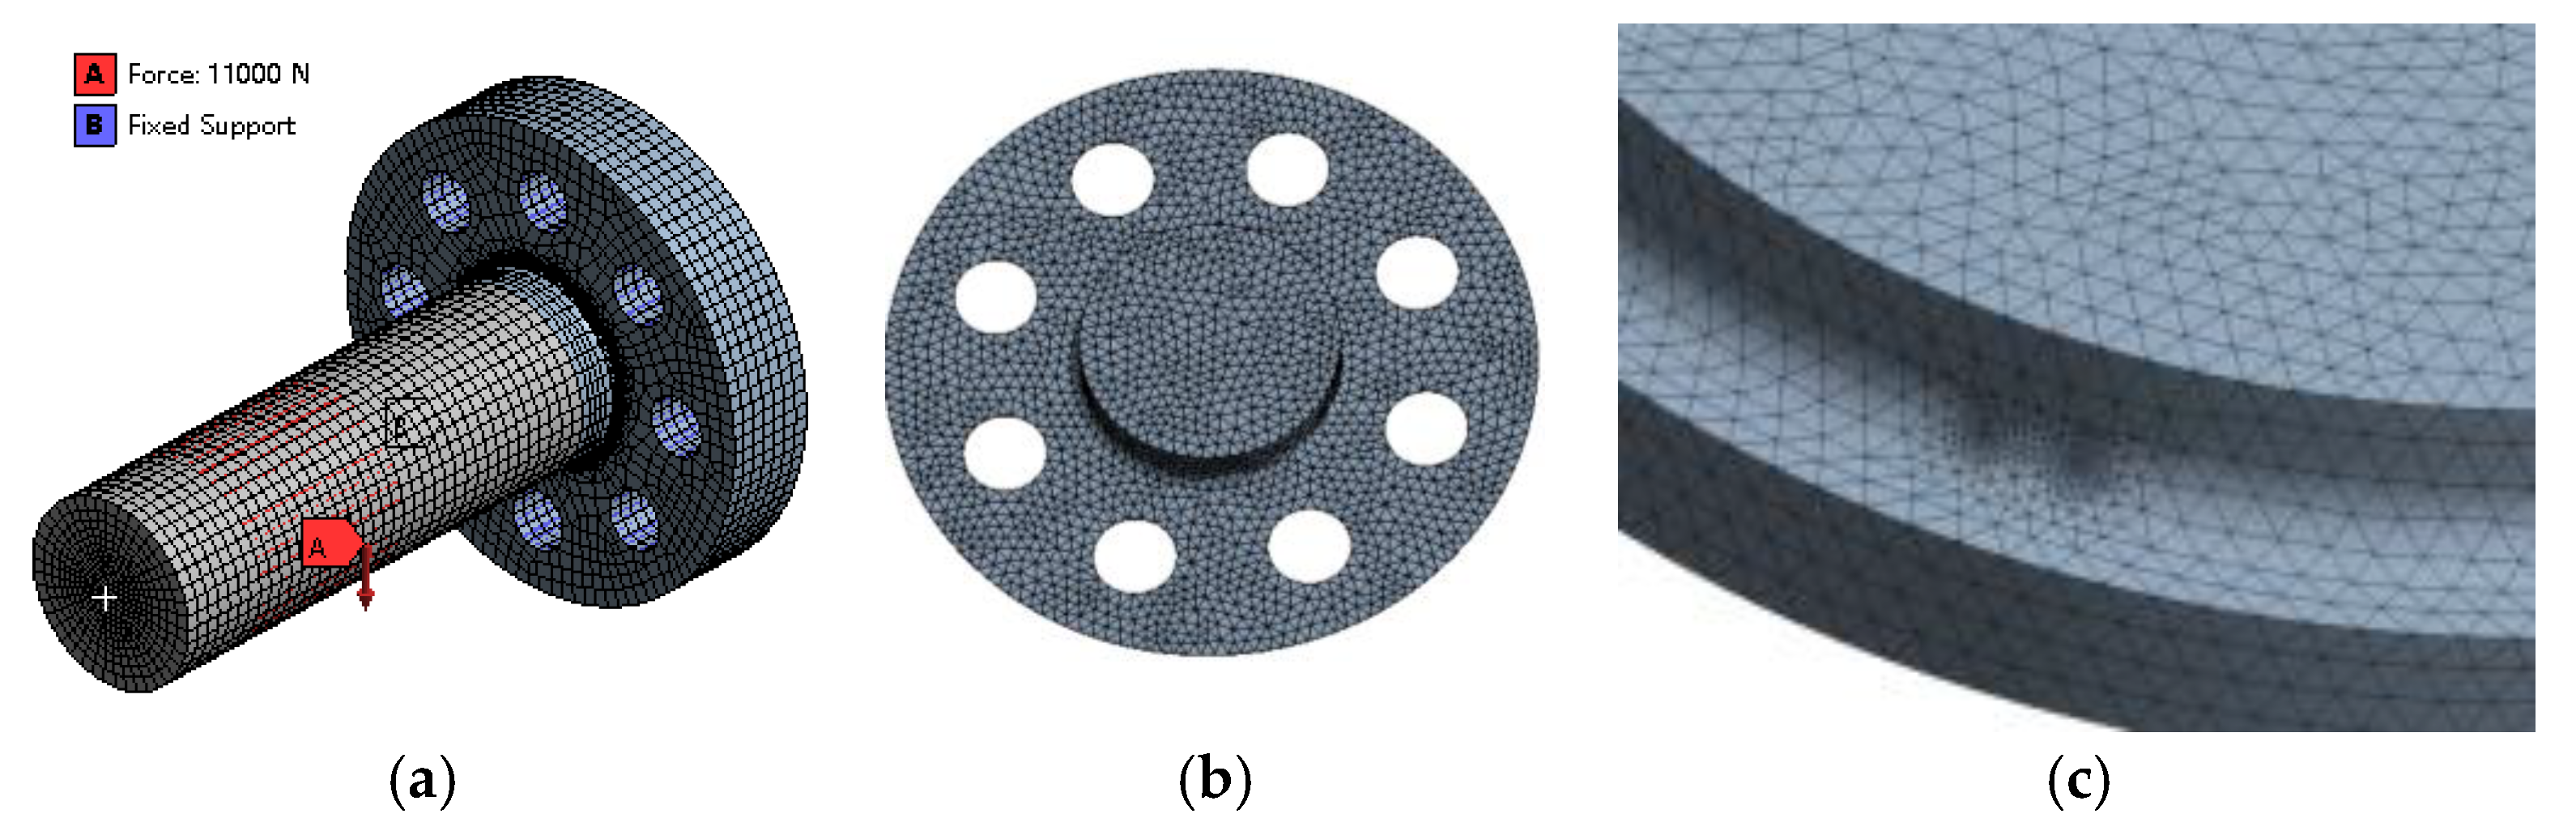
4.1. Numerical Model
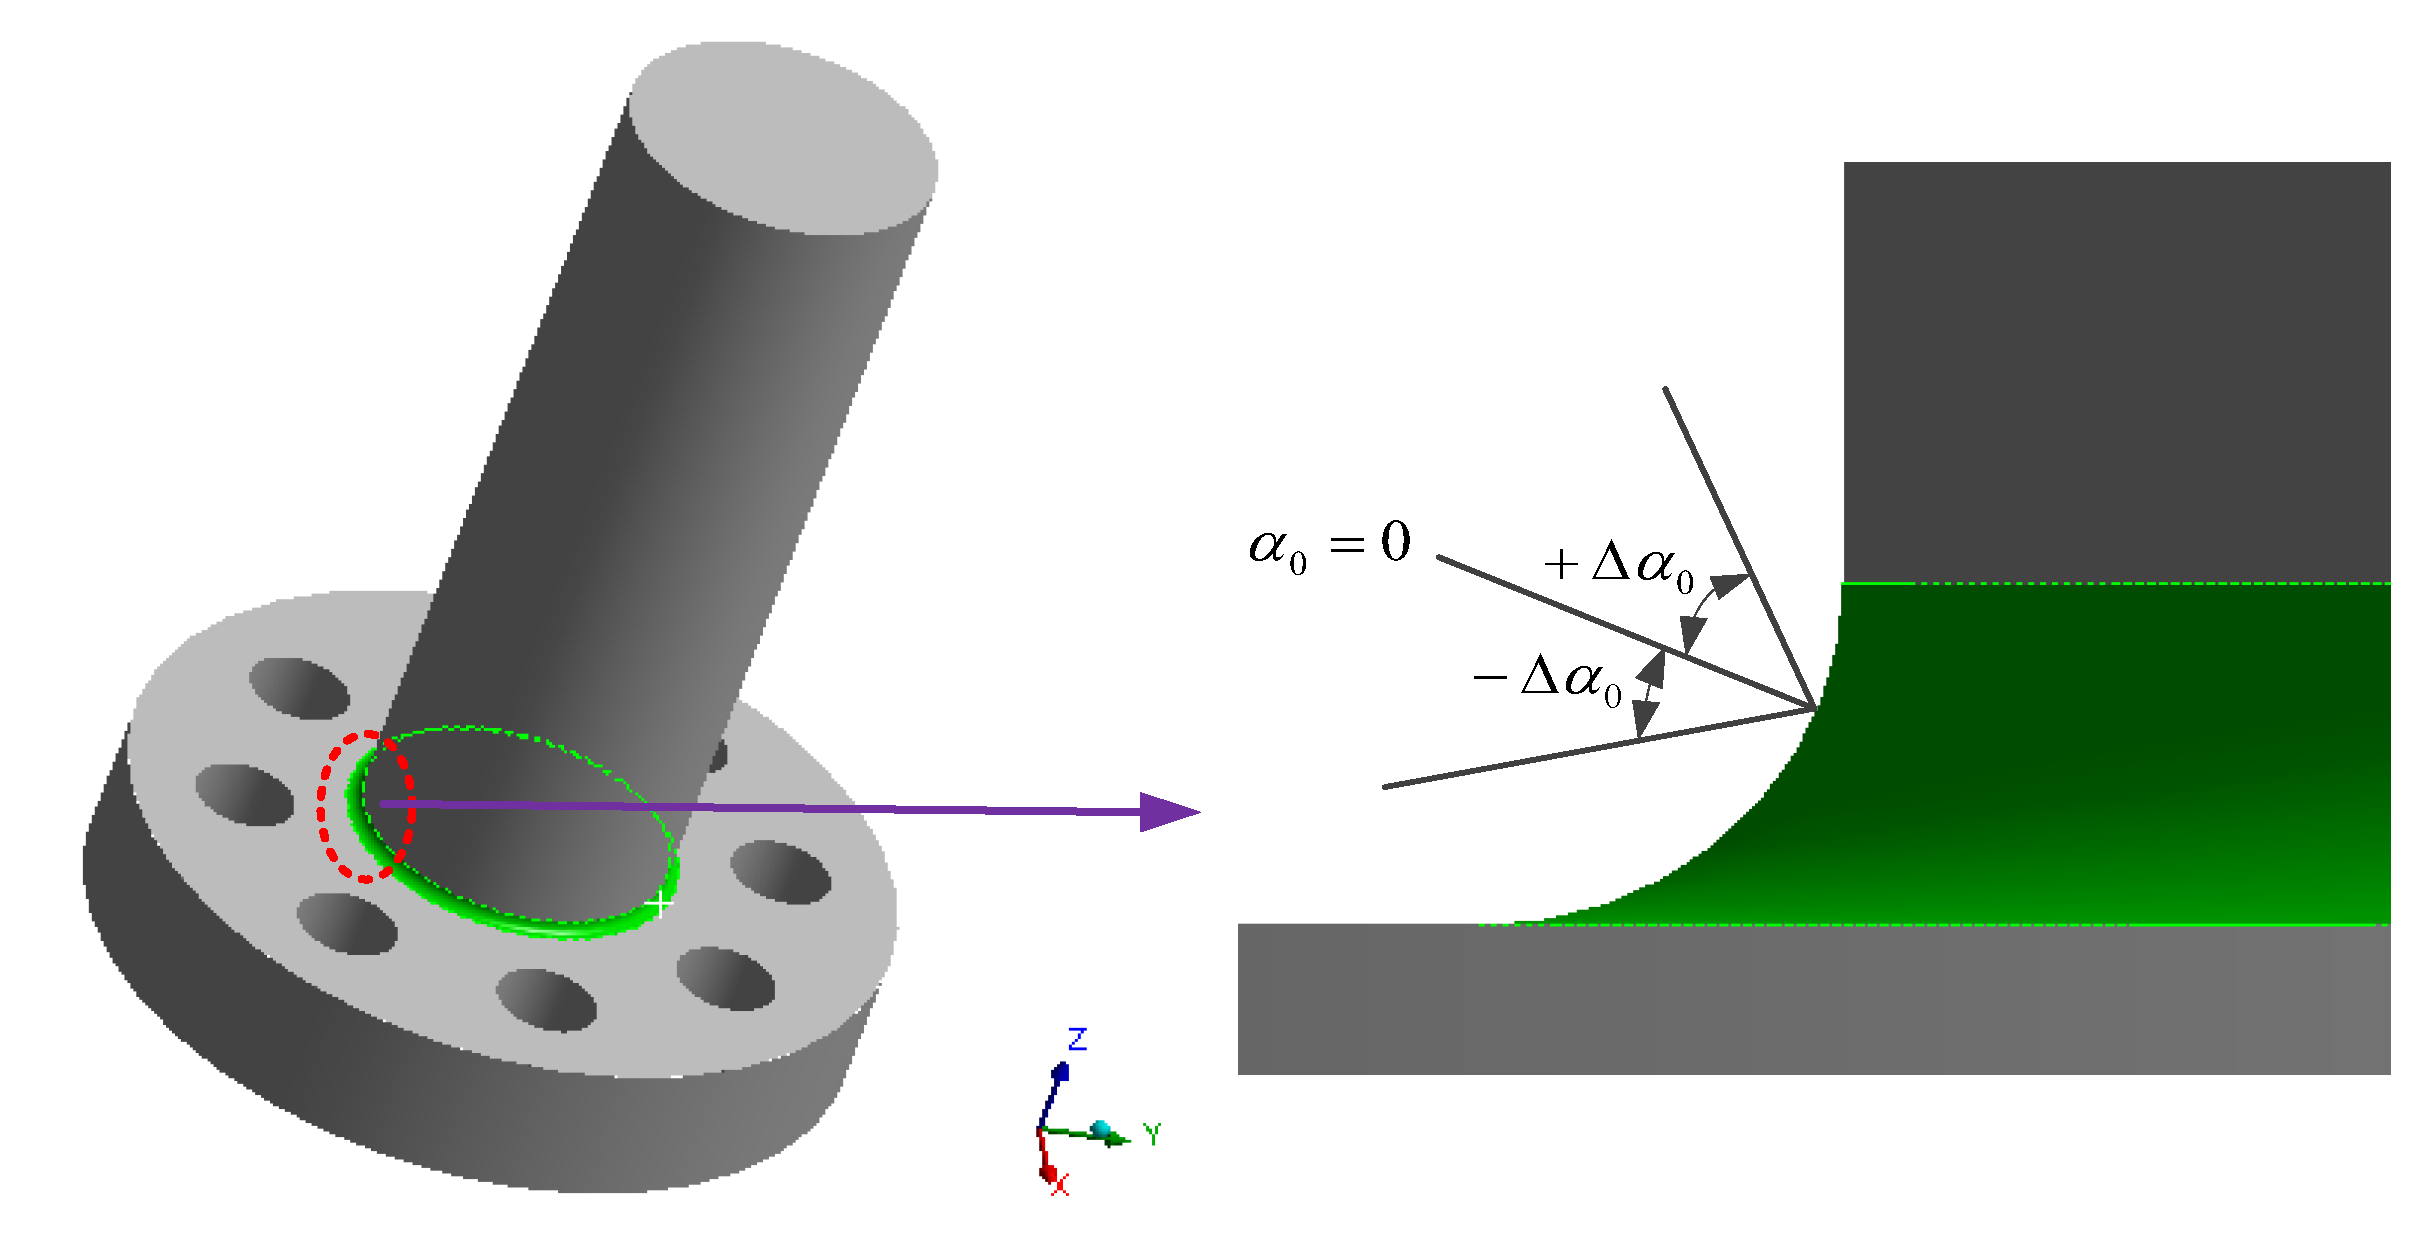
4.2. Geometric Parameters of Initial Crack
5. Crack Propagation Characteristics
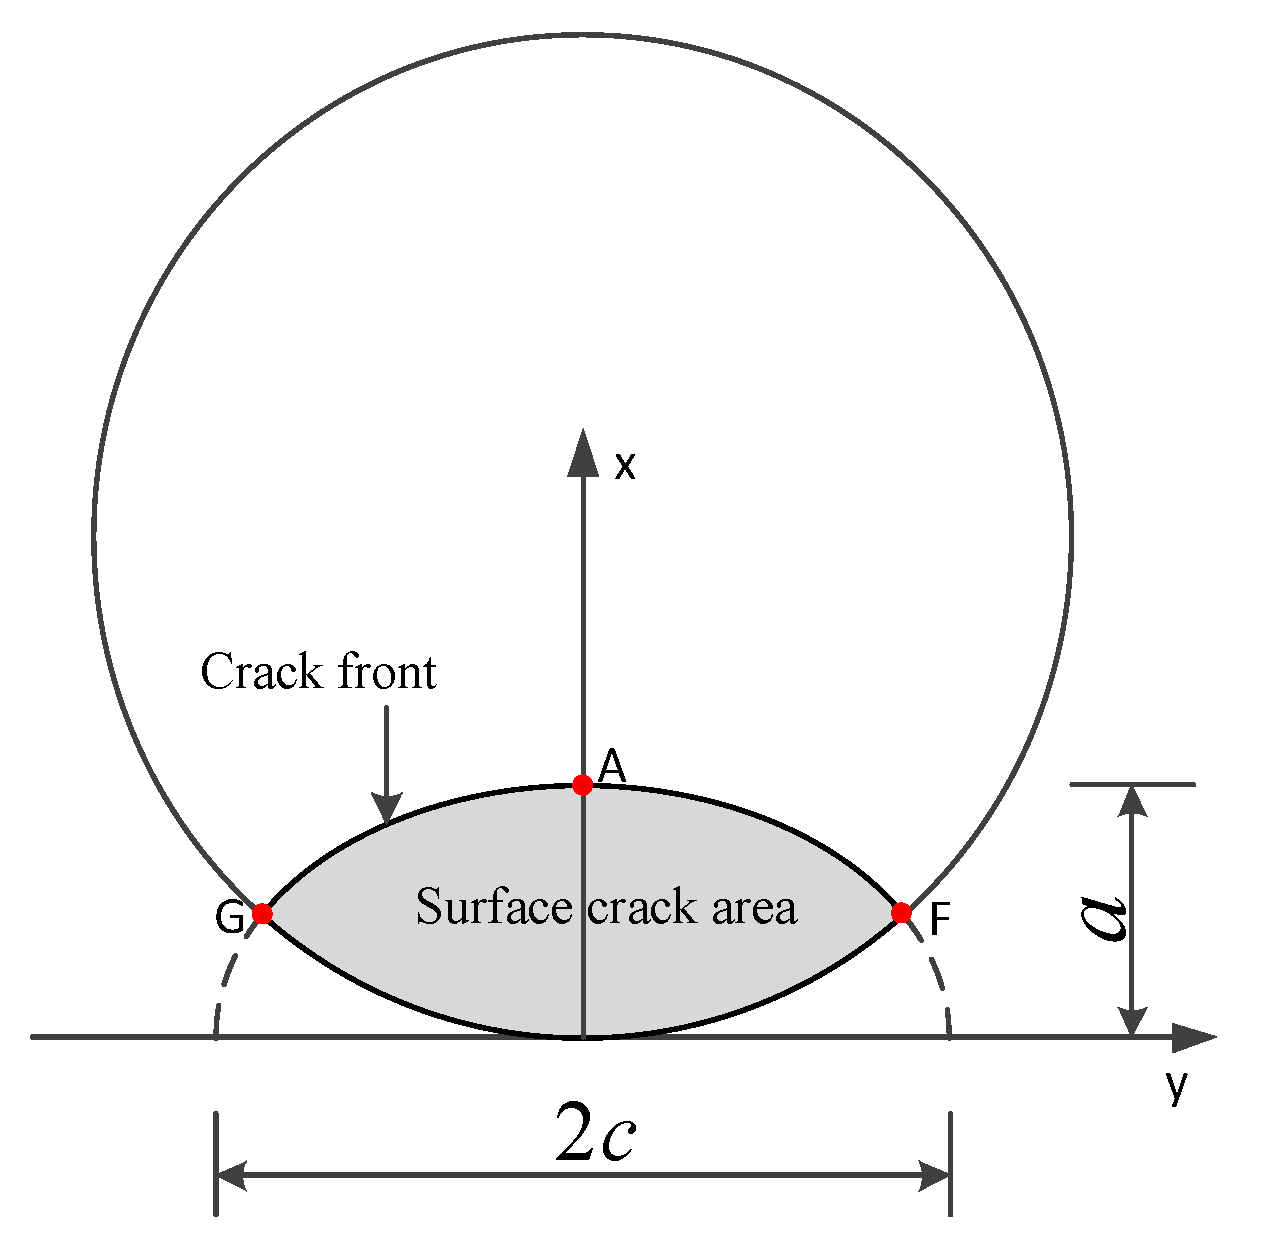
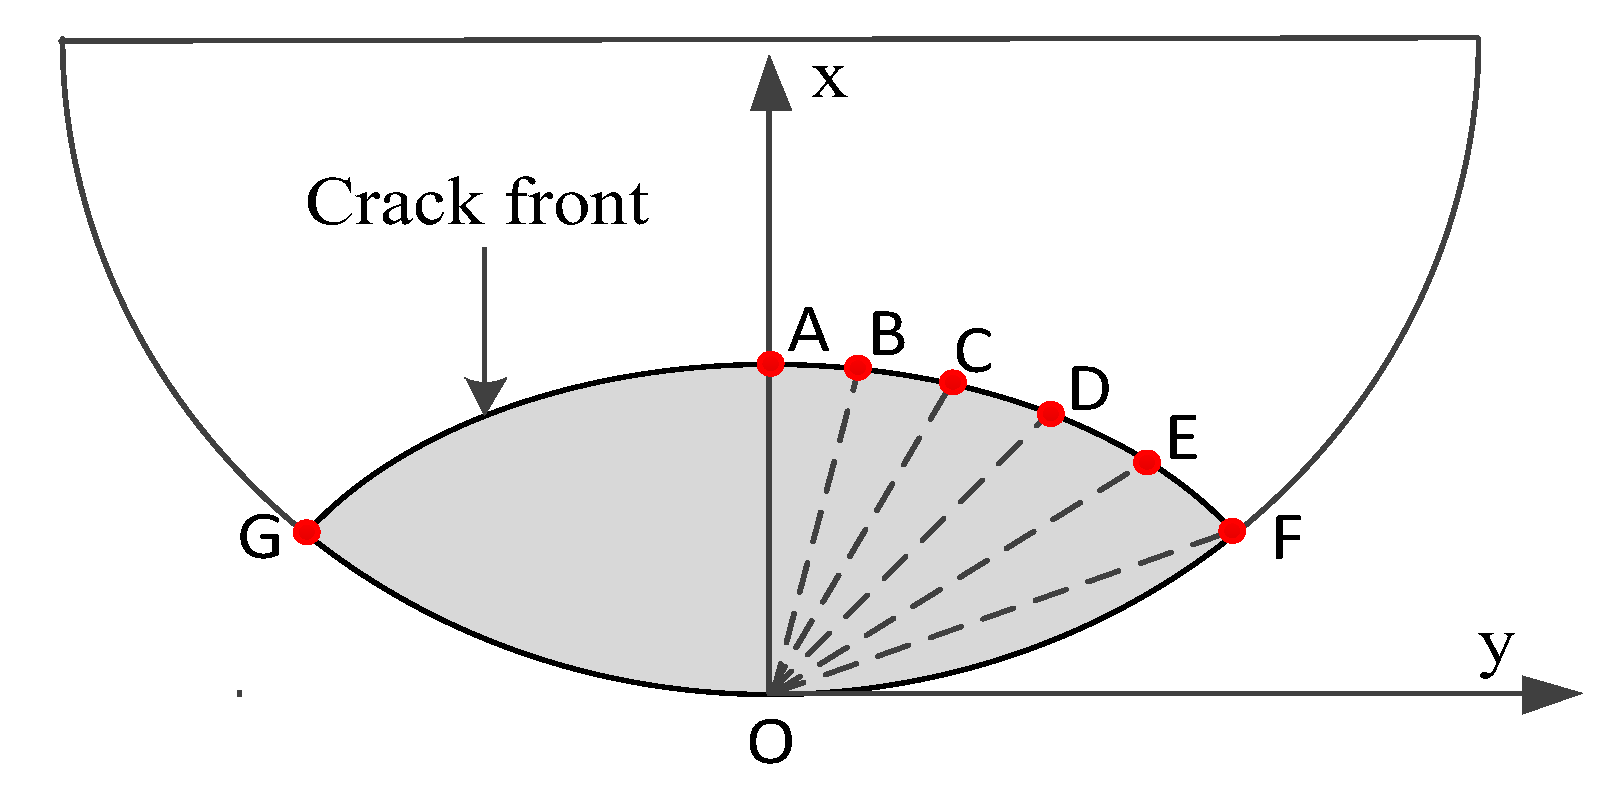
5.1. Description of Calculation Points at the Crack Front
5.2. Impact of Different Angles of the Initial Crack on Fatigue Life
5.2.1. Test Phenomena
5.2.2. The Impact of the Initial Crack Angle on Fatigue Life
5.3. Impact of Initial Crack Angle on Crack Propagation
- (1)
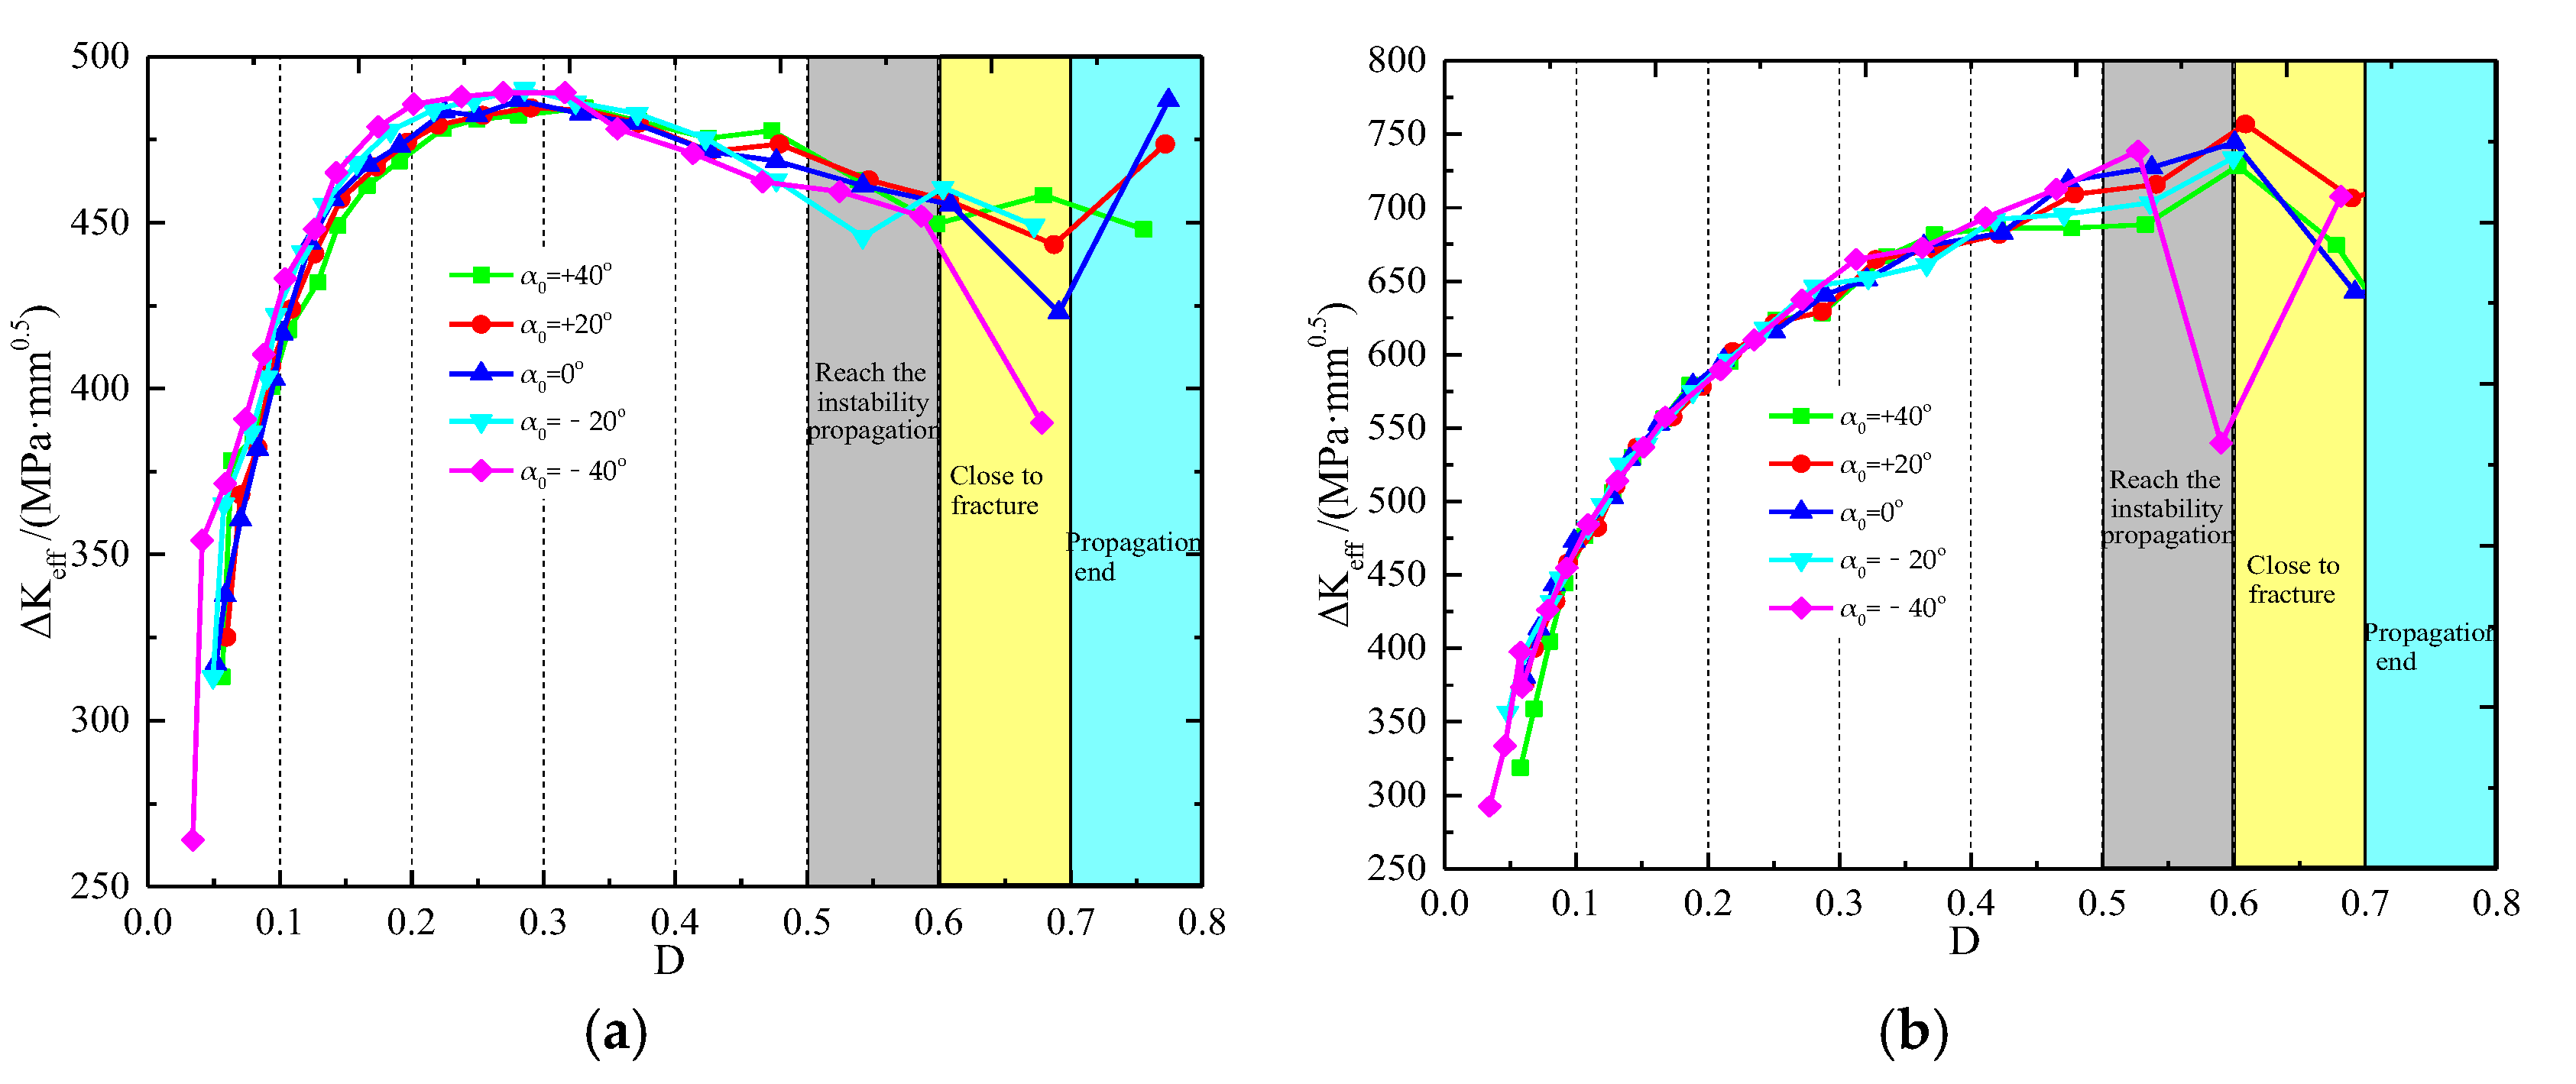
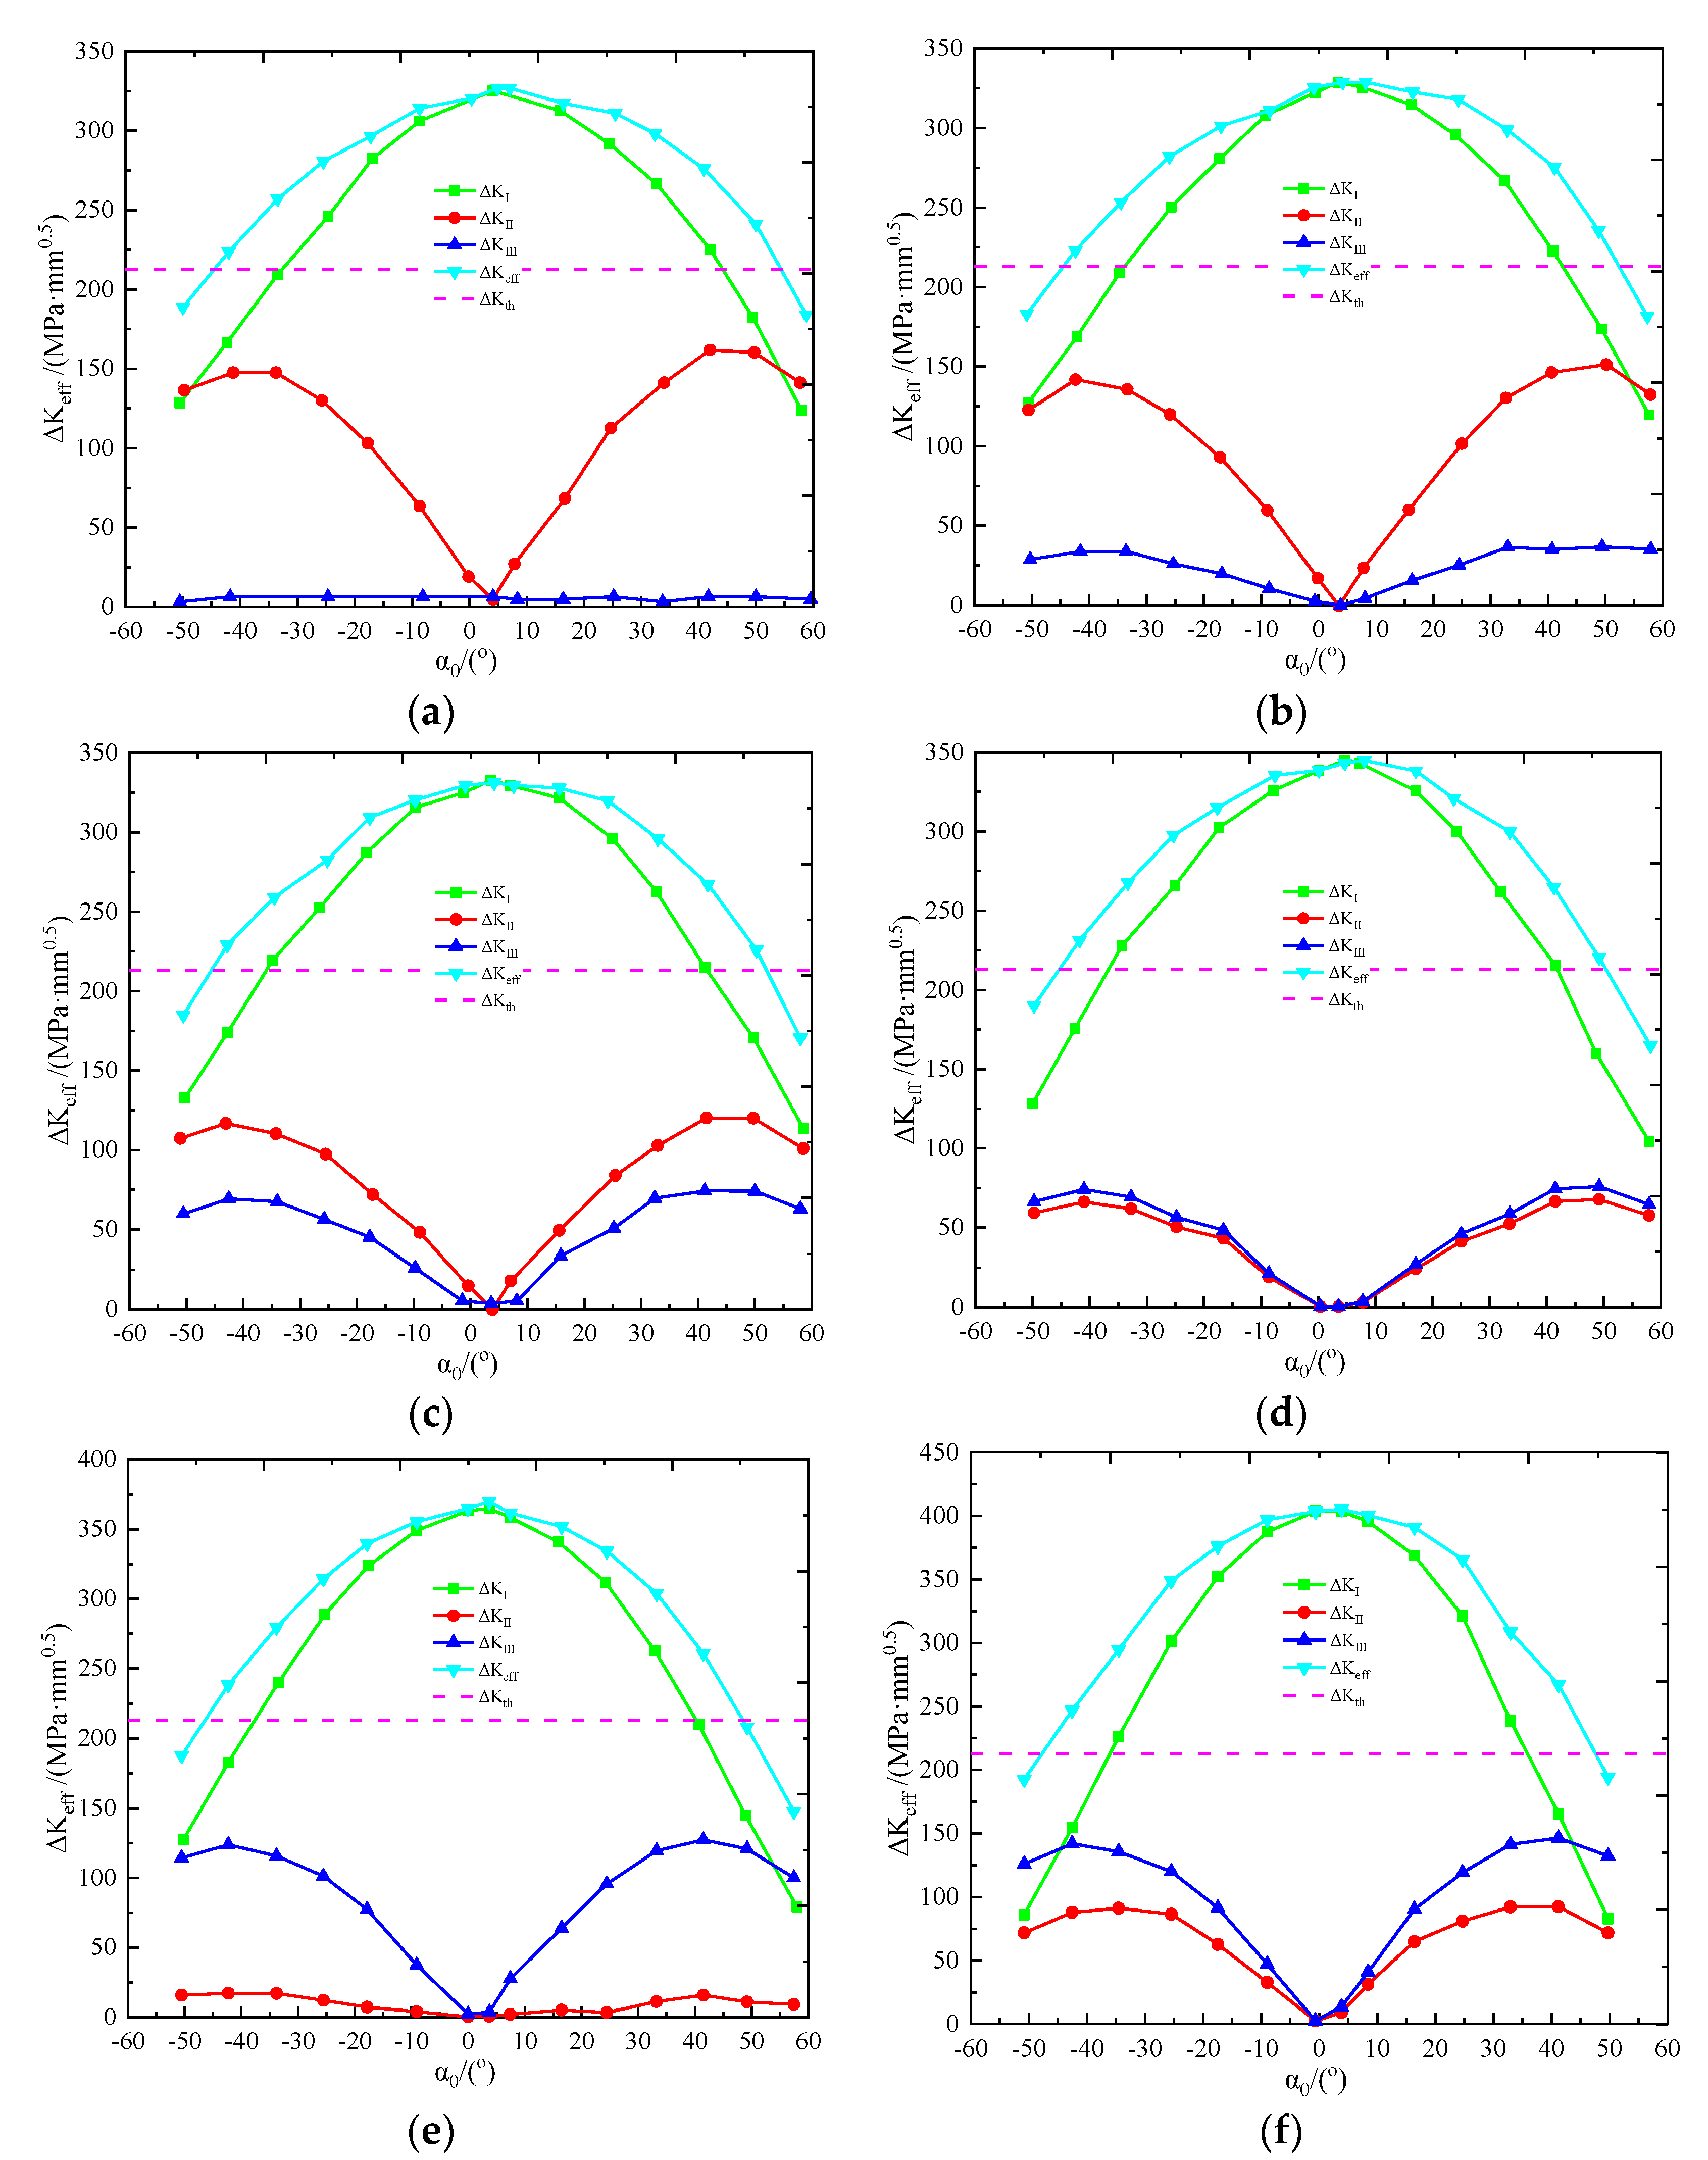
- With as the benchmark, of the crack front decreased with the increase of ; and increased first and then decreased as increased. Both of them were less than . Thus, the propagation of the initial crack at the junction between the shaft and flange resulted from > . and only affected the propagation angle during the initial propagation. When exceeded a certain value, , and were less than and the propagation of the initial crack was not observed.
- (2)
- The changing trend of and was similar. In other words, can reasonably reflect the overall change of stress intensity factors during the crack propagation. However, in cracks with large (including welding cracks and other similar surface cracks), > might still be true. , and were smaller than . Therefore, the amplitude of the effective stress intensity factor cannot be used to assess the crack propagation. In relevant studies, crack propagation should be evaluated by three stress intensity factors and the crack propagation threshold.
- (1)
- The crack was categorized to a mixed I-II-III mode, which was dominated by mode I. At a certain initial angle, it can be considered as the mode I crack. In this example, was about + 4°, and its angle was expressed as .
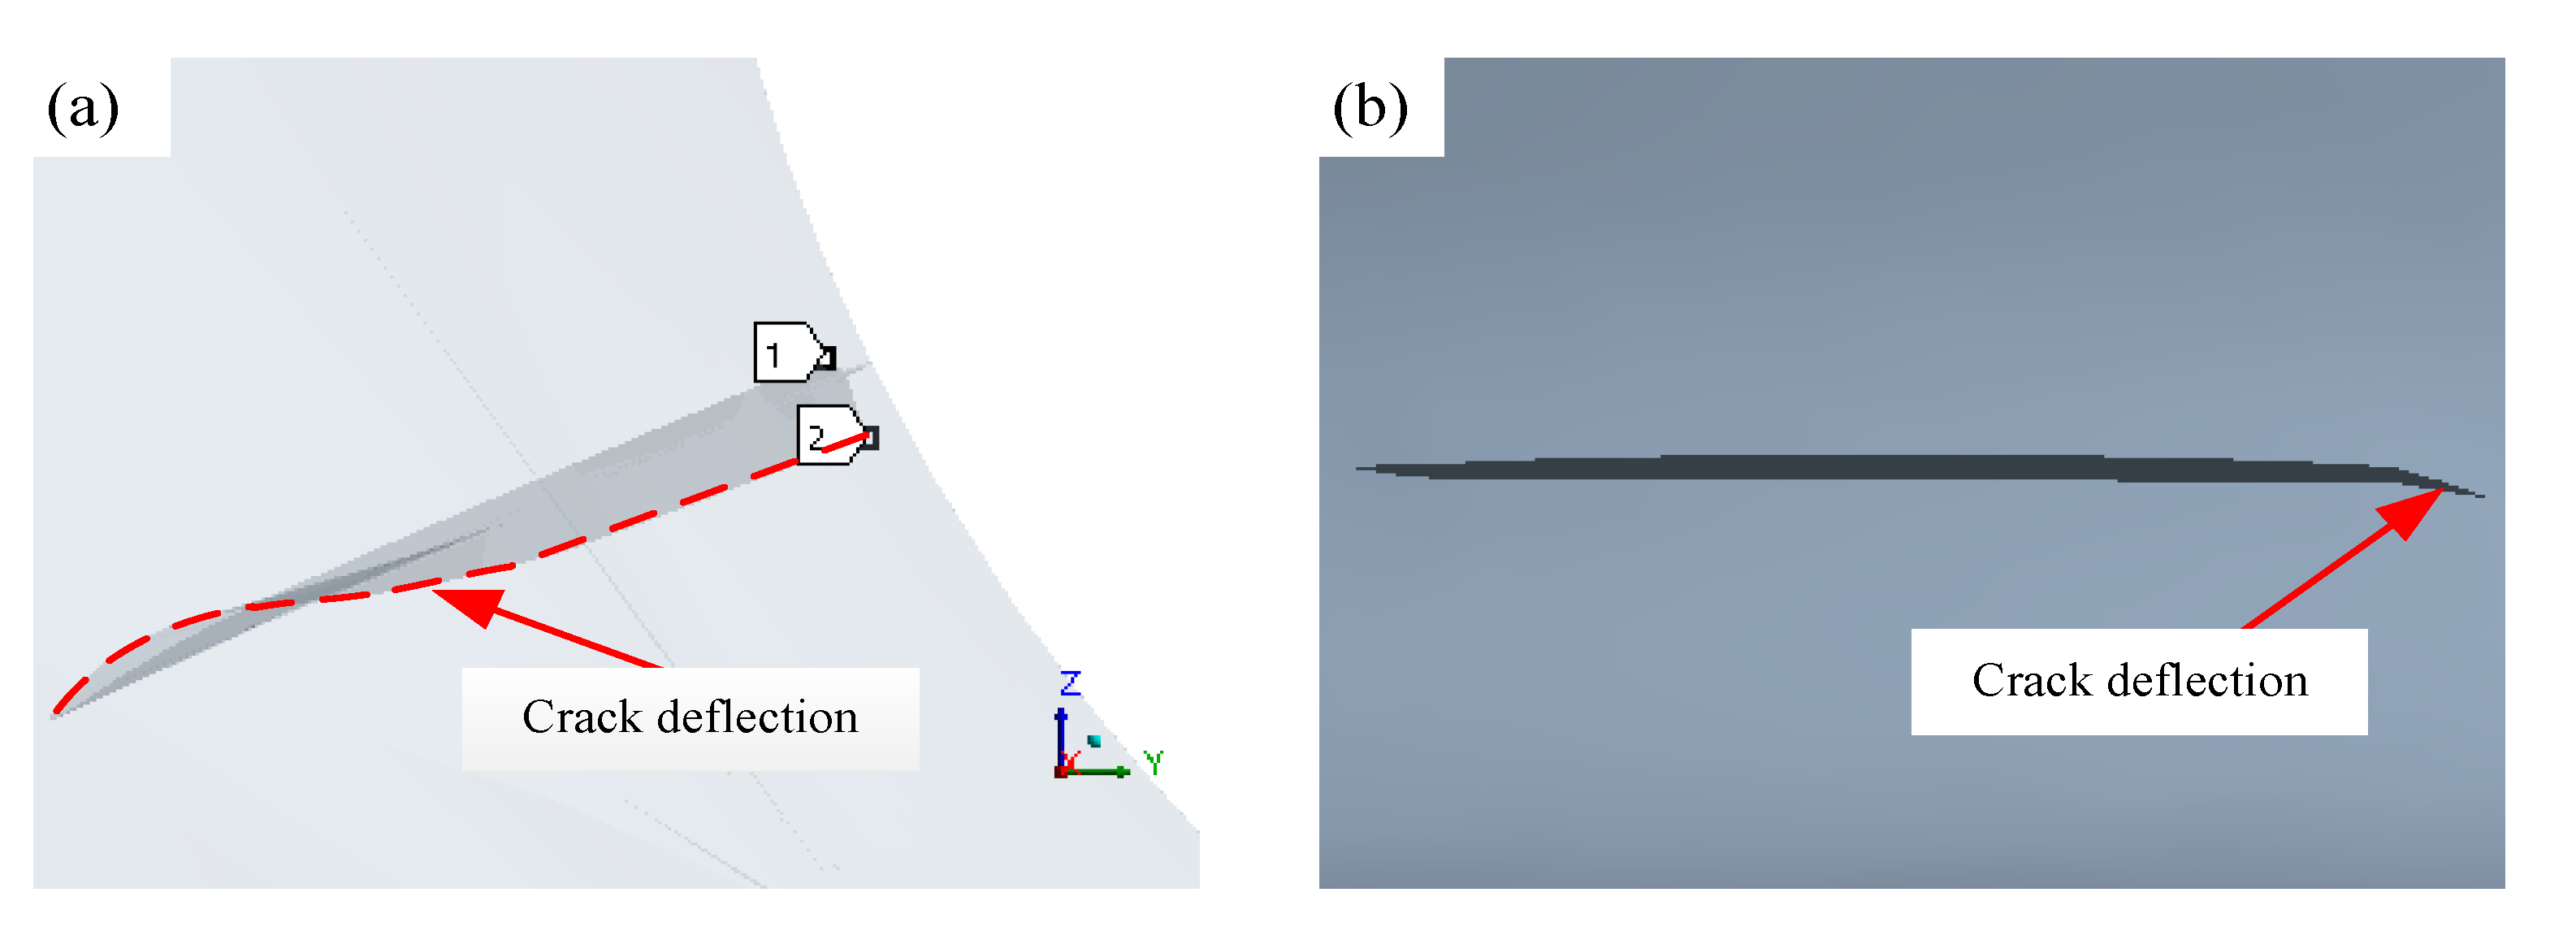
- (2)
- The larger , the stronger modes II-III characteristics would be. When was larger, accounted for a large proportion at both the surface and the deepest point of C3. The stress difference between positions of the crack front was large, but the crack still belonged to mode I; gradually increased from the deepest point towards the surface. Under the dominant action of and , the surface and the deepest point of C3 deflected, as shown in Figure 18.
5.4. Maximum Effective Angle Interval for the Initial Crack Propagation
5.4.1. Shape Ratio
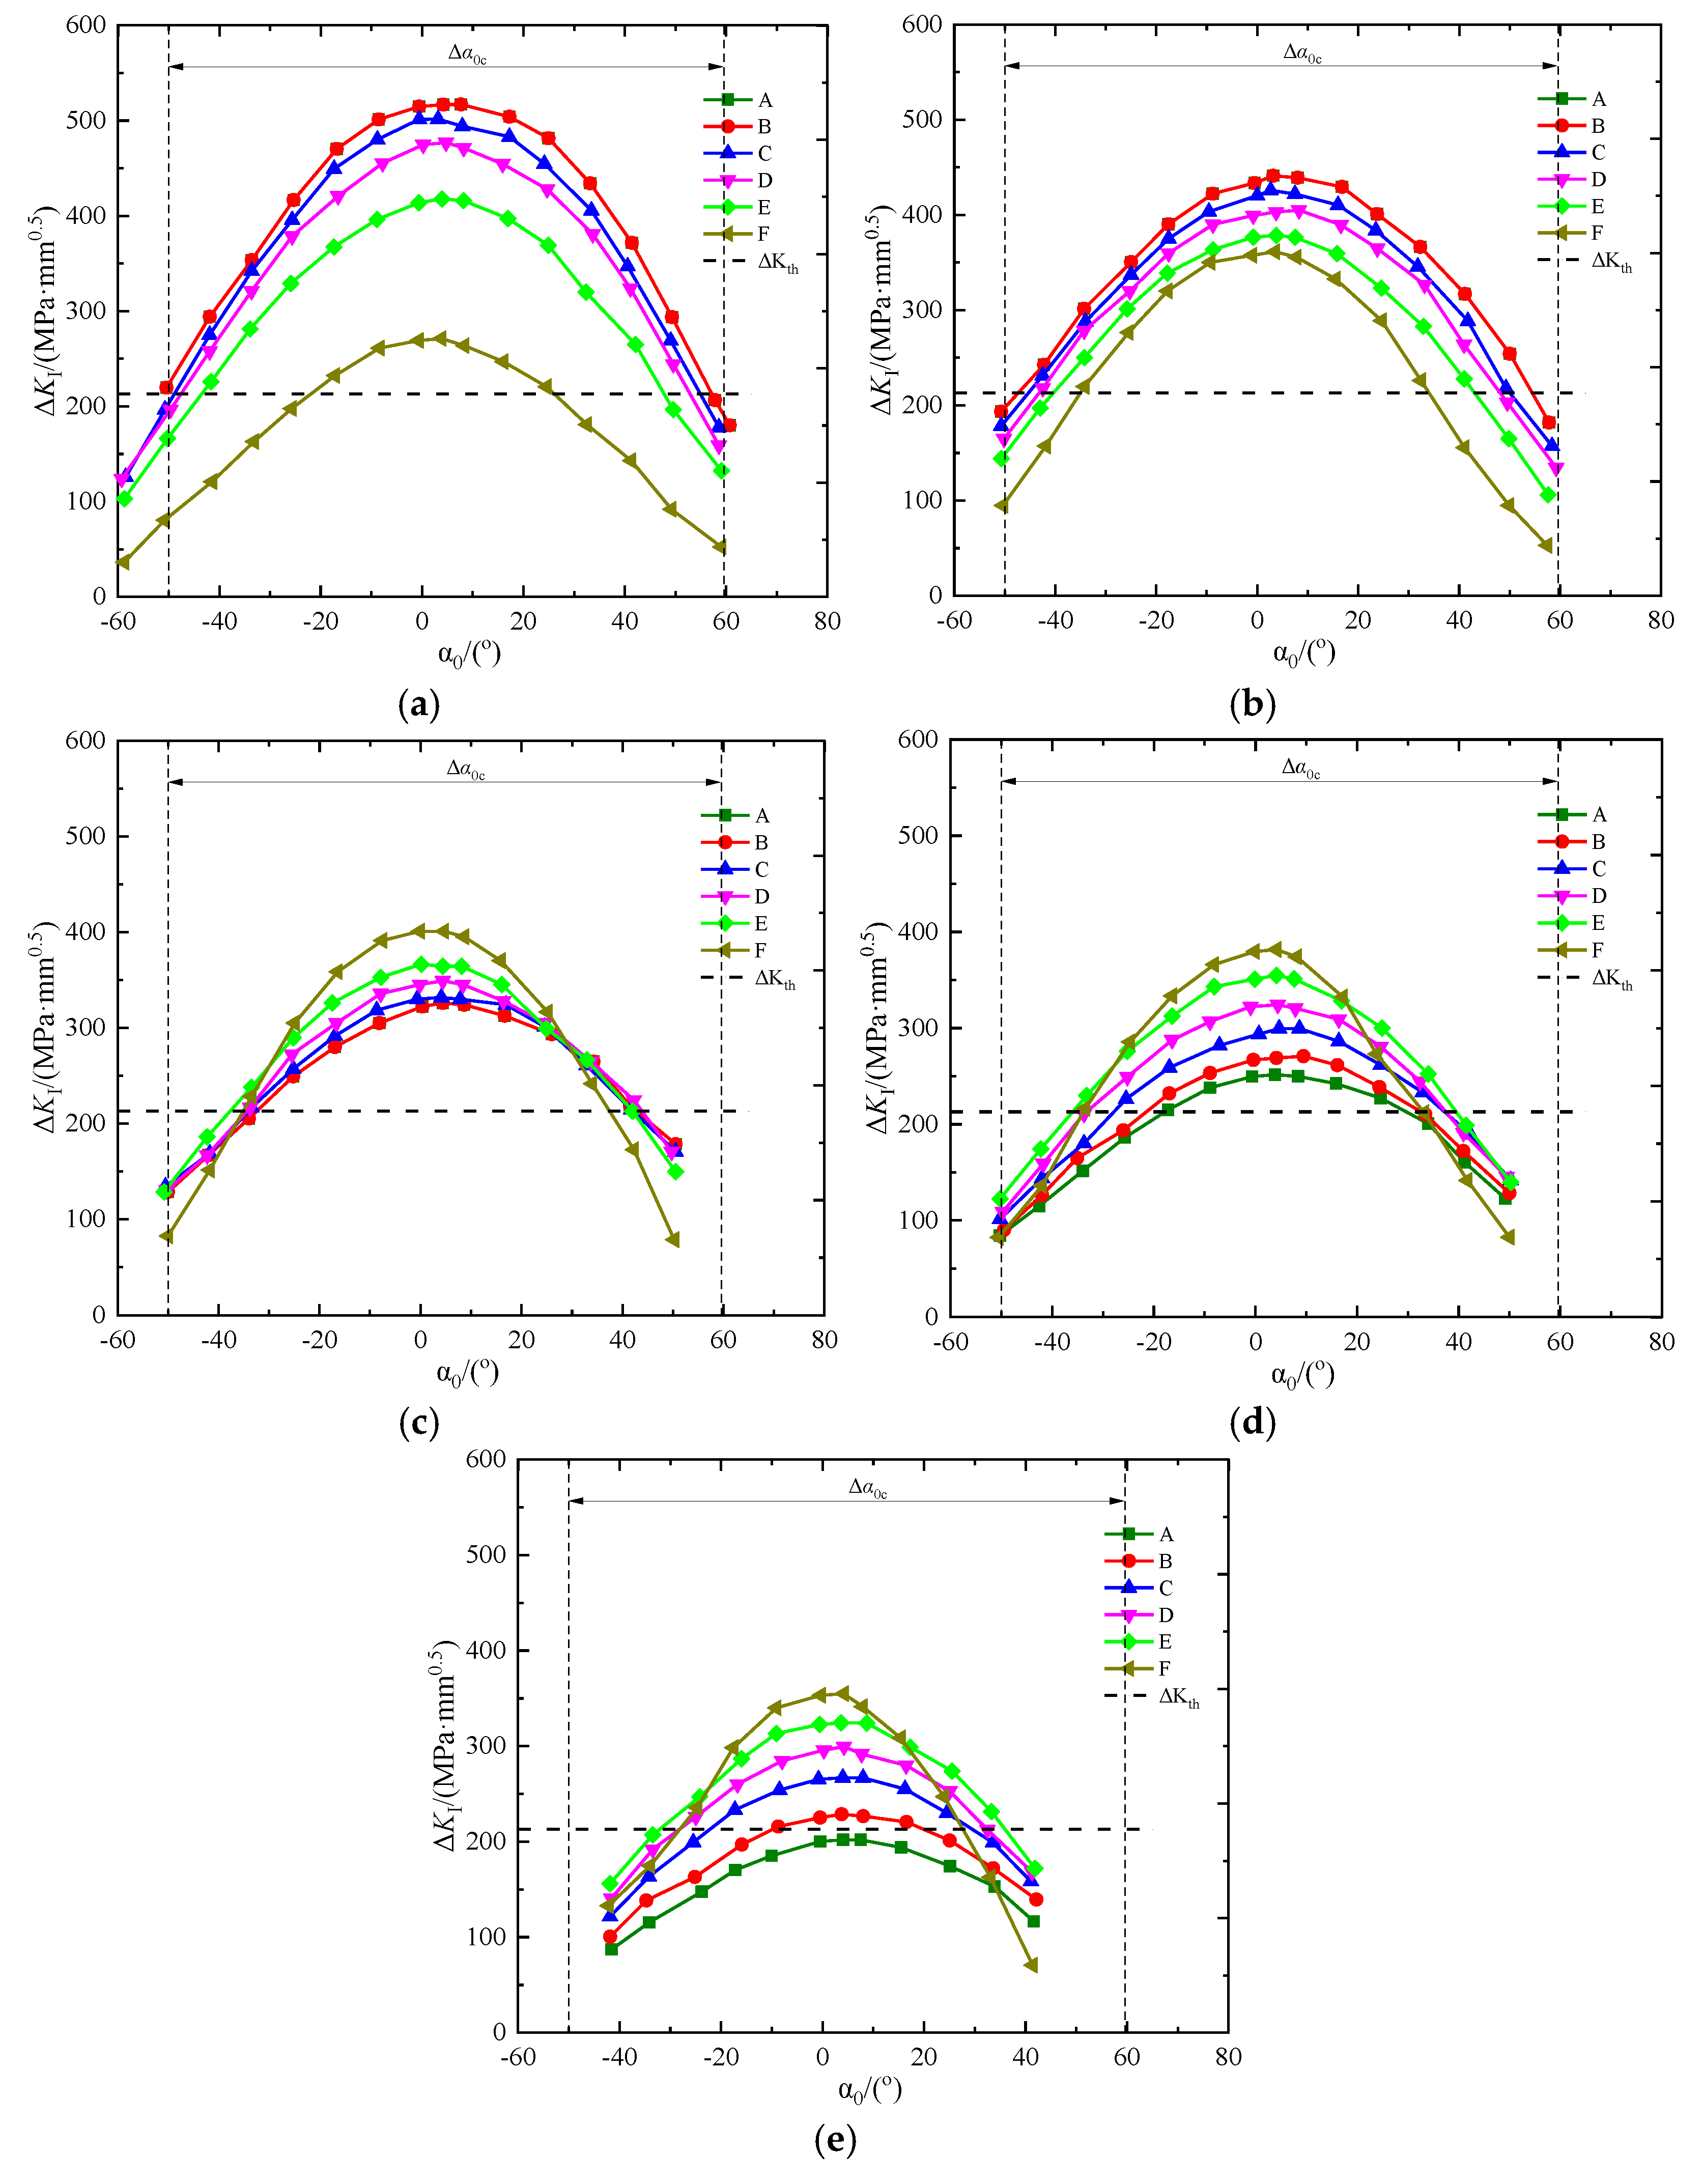
- (1)
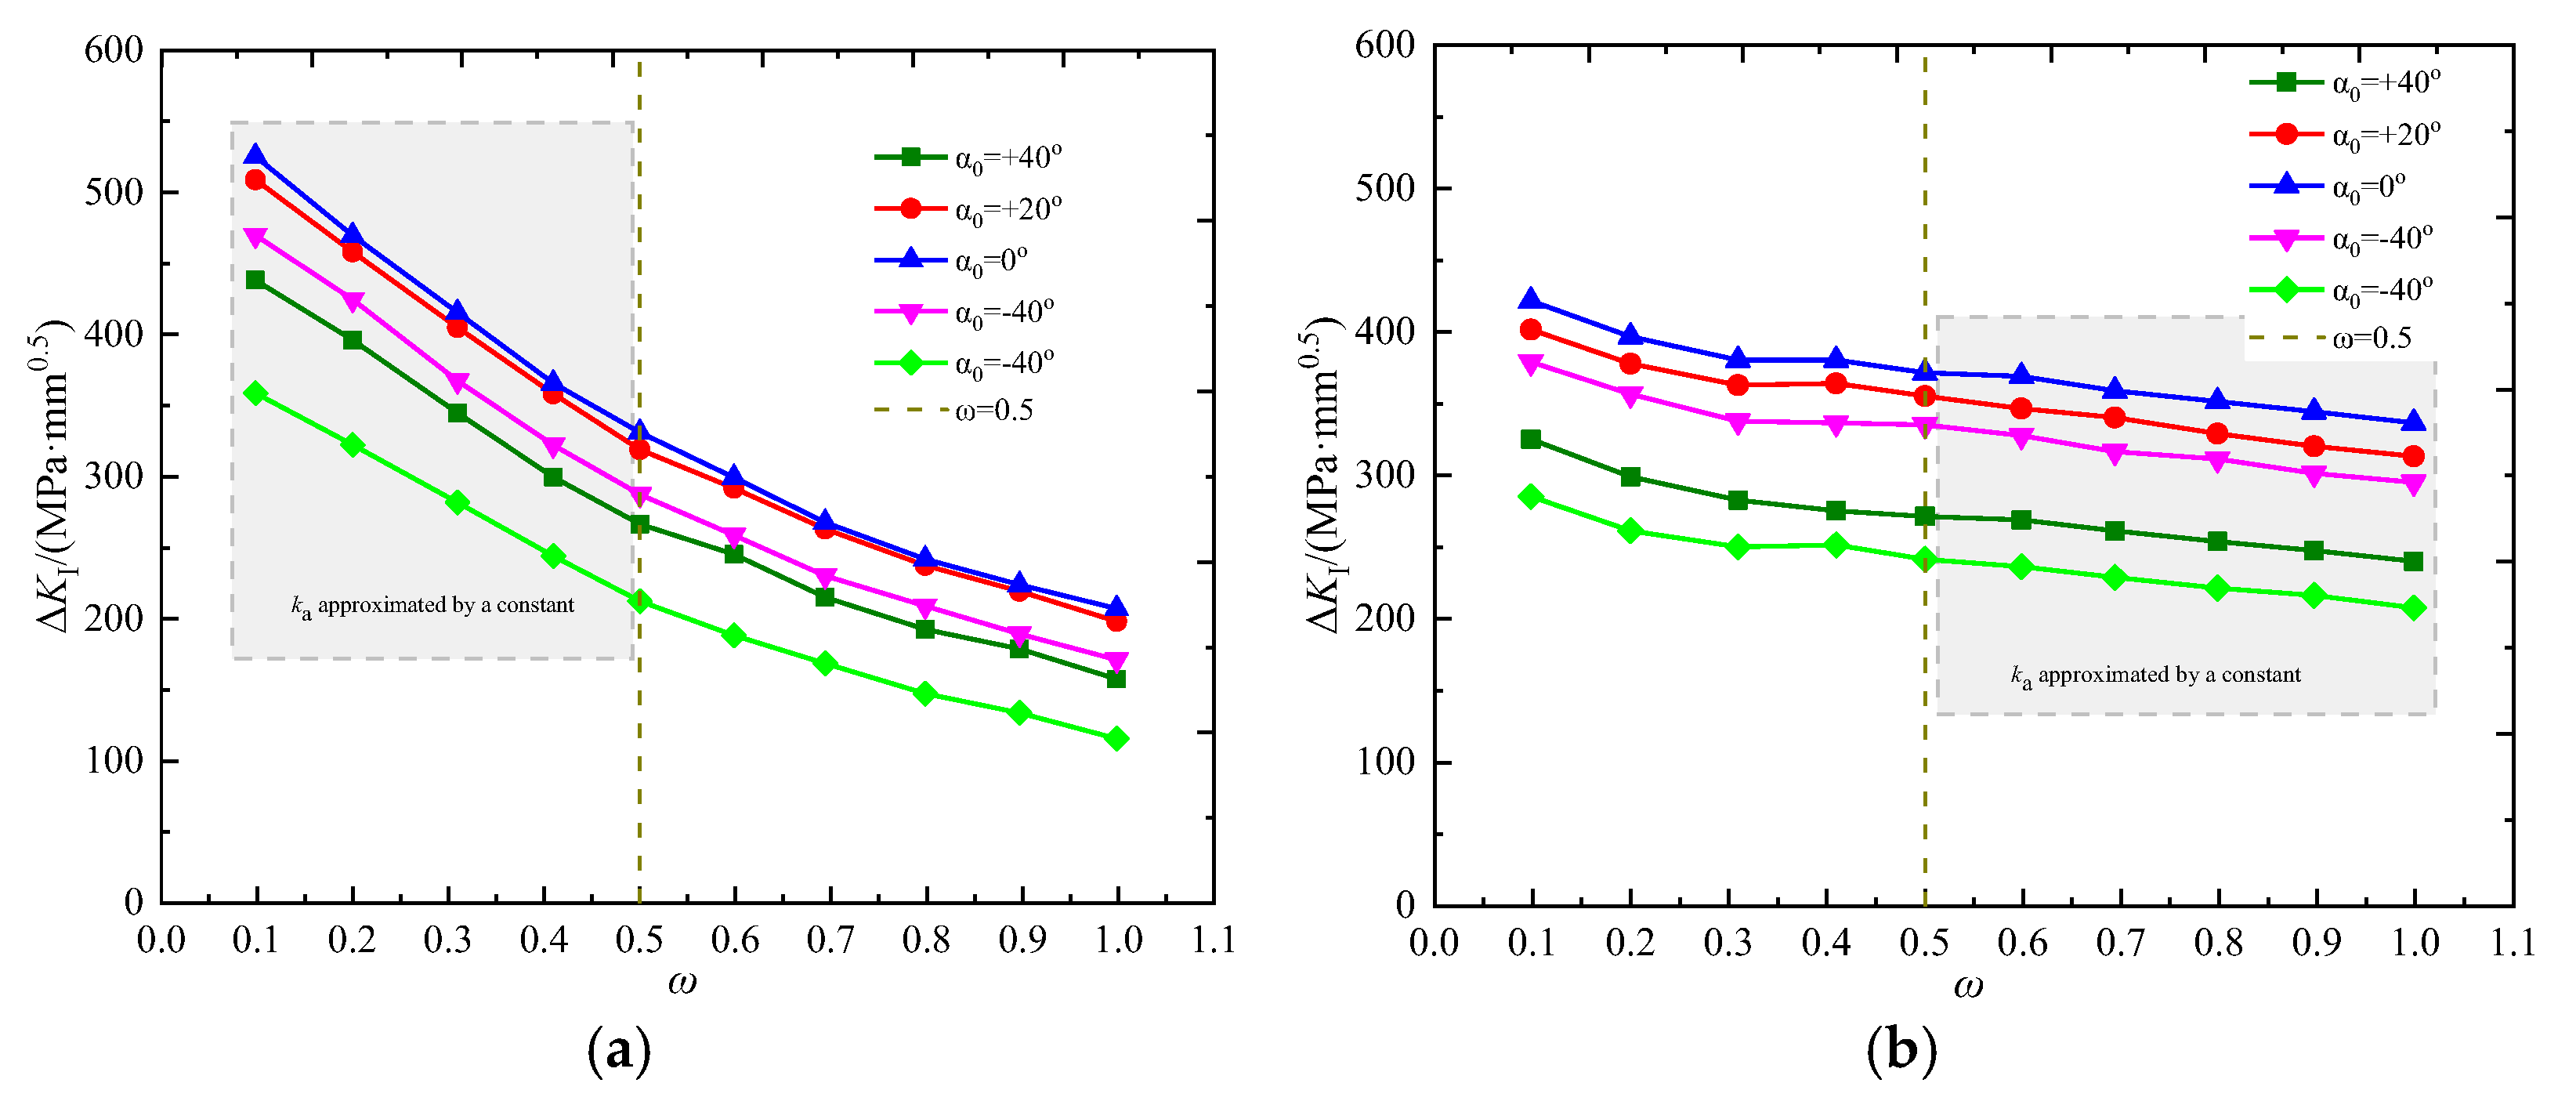
- was used to define the effective angle interval for the propagation of initial cracks at the junction between the shaft and flange. and were the upper and lower limits of the interval’s initial angles. Only the initial cracks with an angle within the interval can propagate. The initial cracks with an angle outside the interval did not propagate in the elastic stage. The interval was determined by the size relation between the of each point at the crack front and the base metal . The of the initial crack did not change with the shape ratio and would decrease as grown under the same stress ratio.
- (2)
- The long flat cracks () did not propagate in the direction of the surface length at a certain initial angle. They only propagated locally in the depth direction. The crack propagation towards the surface was smaller than that in the depth direction. The narrow and deep cracks () experienced the opposite propagation pattern.
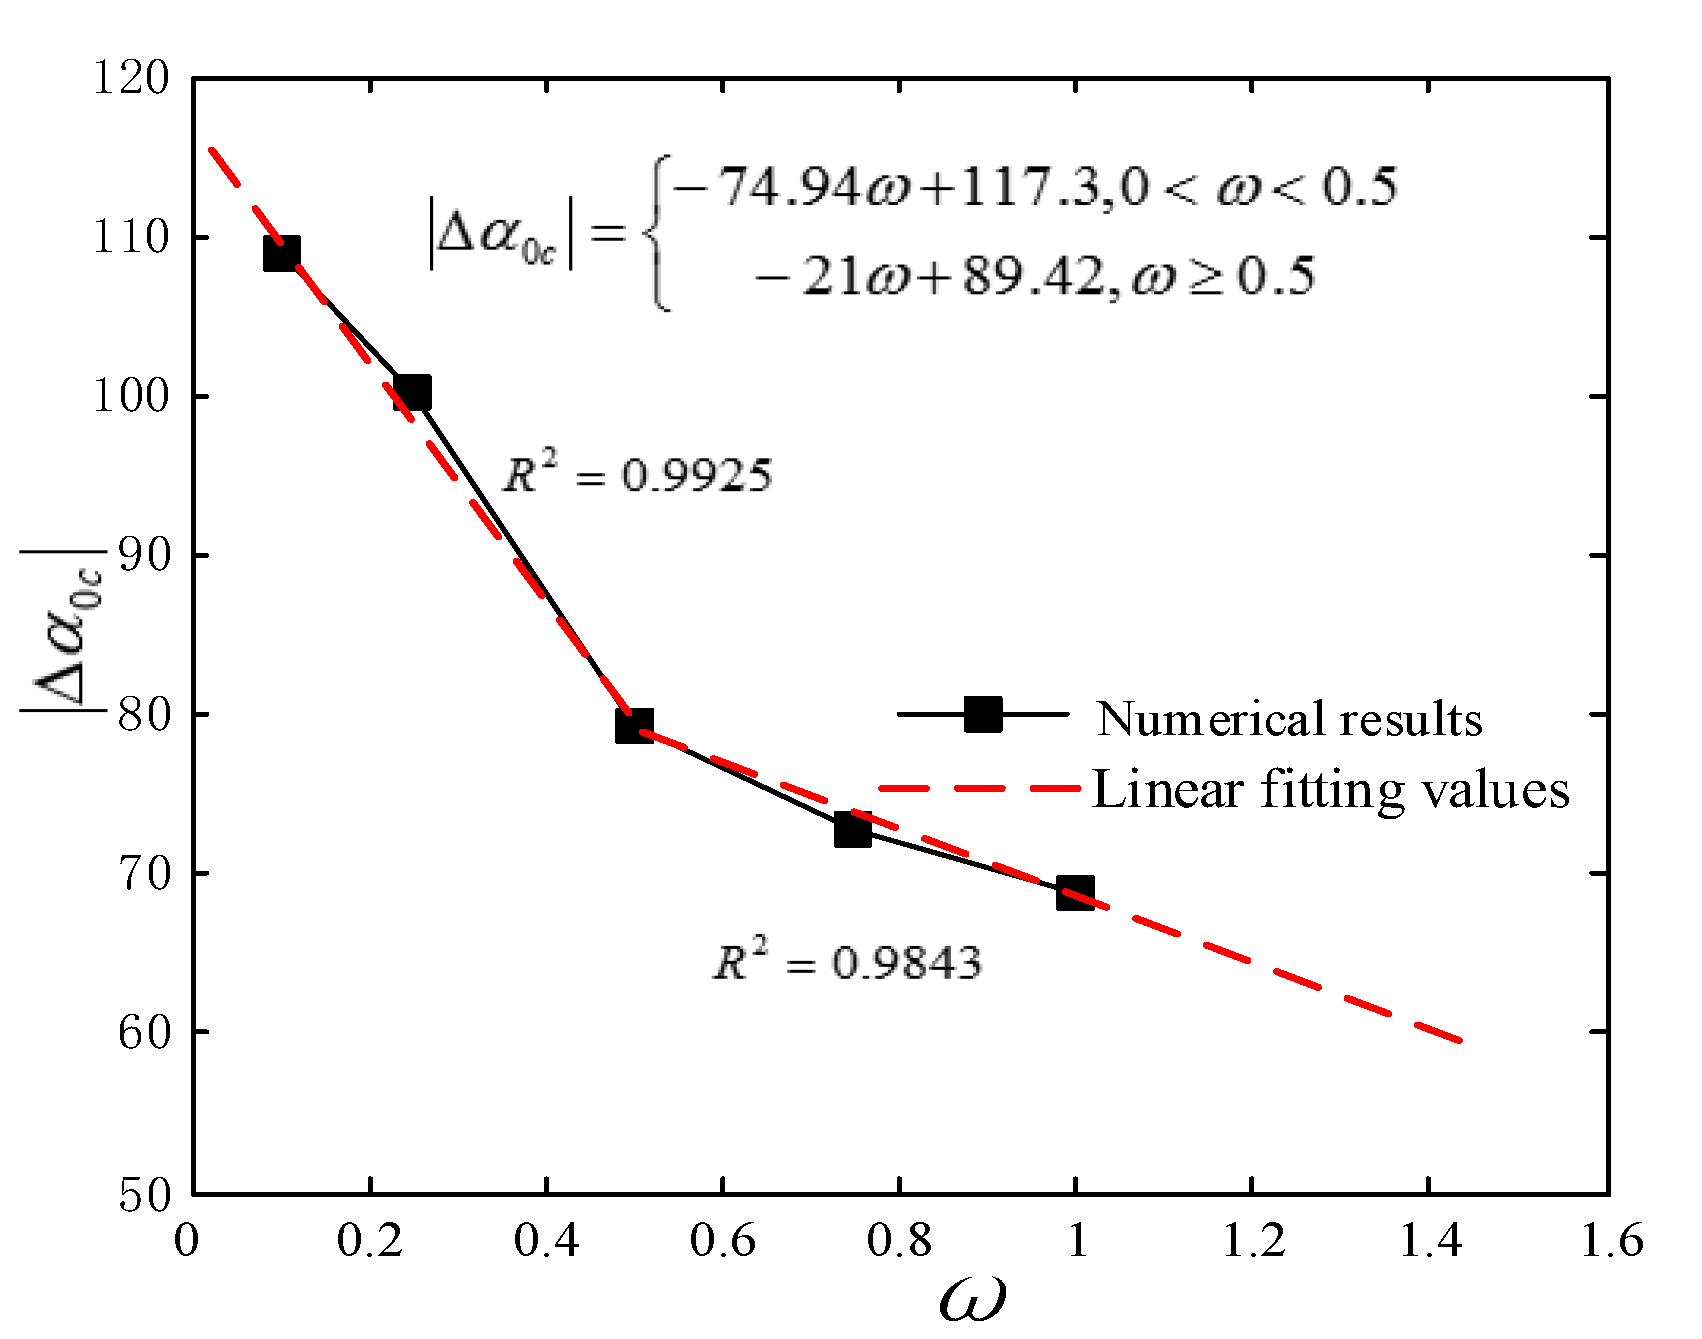
5.4.2. Mathematical Model of Effective Angle Interval
6. Conclusions
- (1)
- The initial crack appeared at the junction between the shaft and flange and propagated in radial and axial directions; the instability propagation of the crack caused an abrupt fracture of the cross-section, resulting in connection failure; the angle of the initial crack was uncertain.
- (2)
- The crack was the mixed I-II-III mode dominated by mode I. Cracks with larger initial angles would have stronger mode II-III characteristics; KII and KIII affected the propagation angle of the crack in radial and axial directions as well as the direction of the structure surface.
- (3)
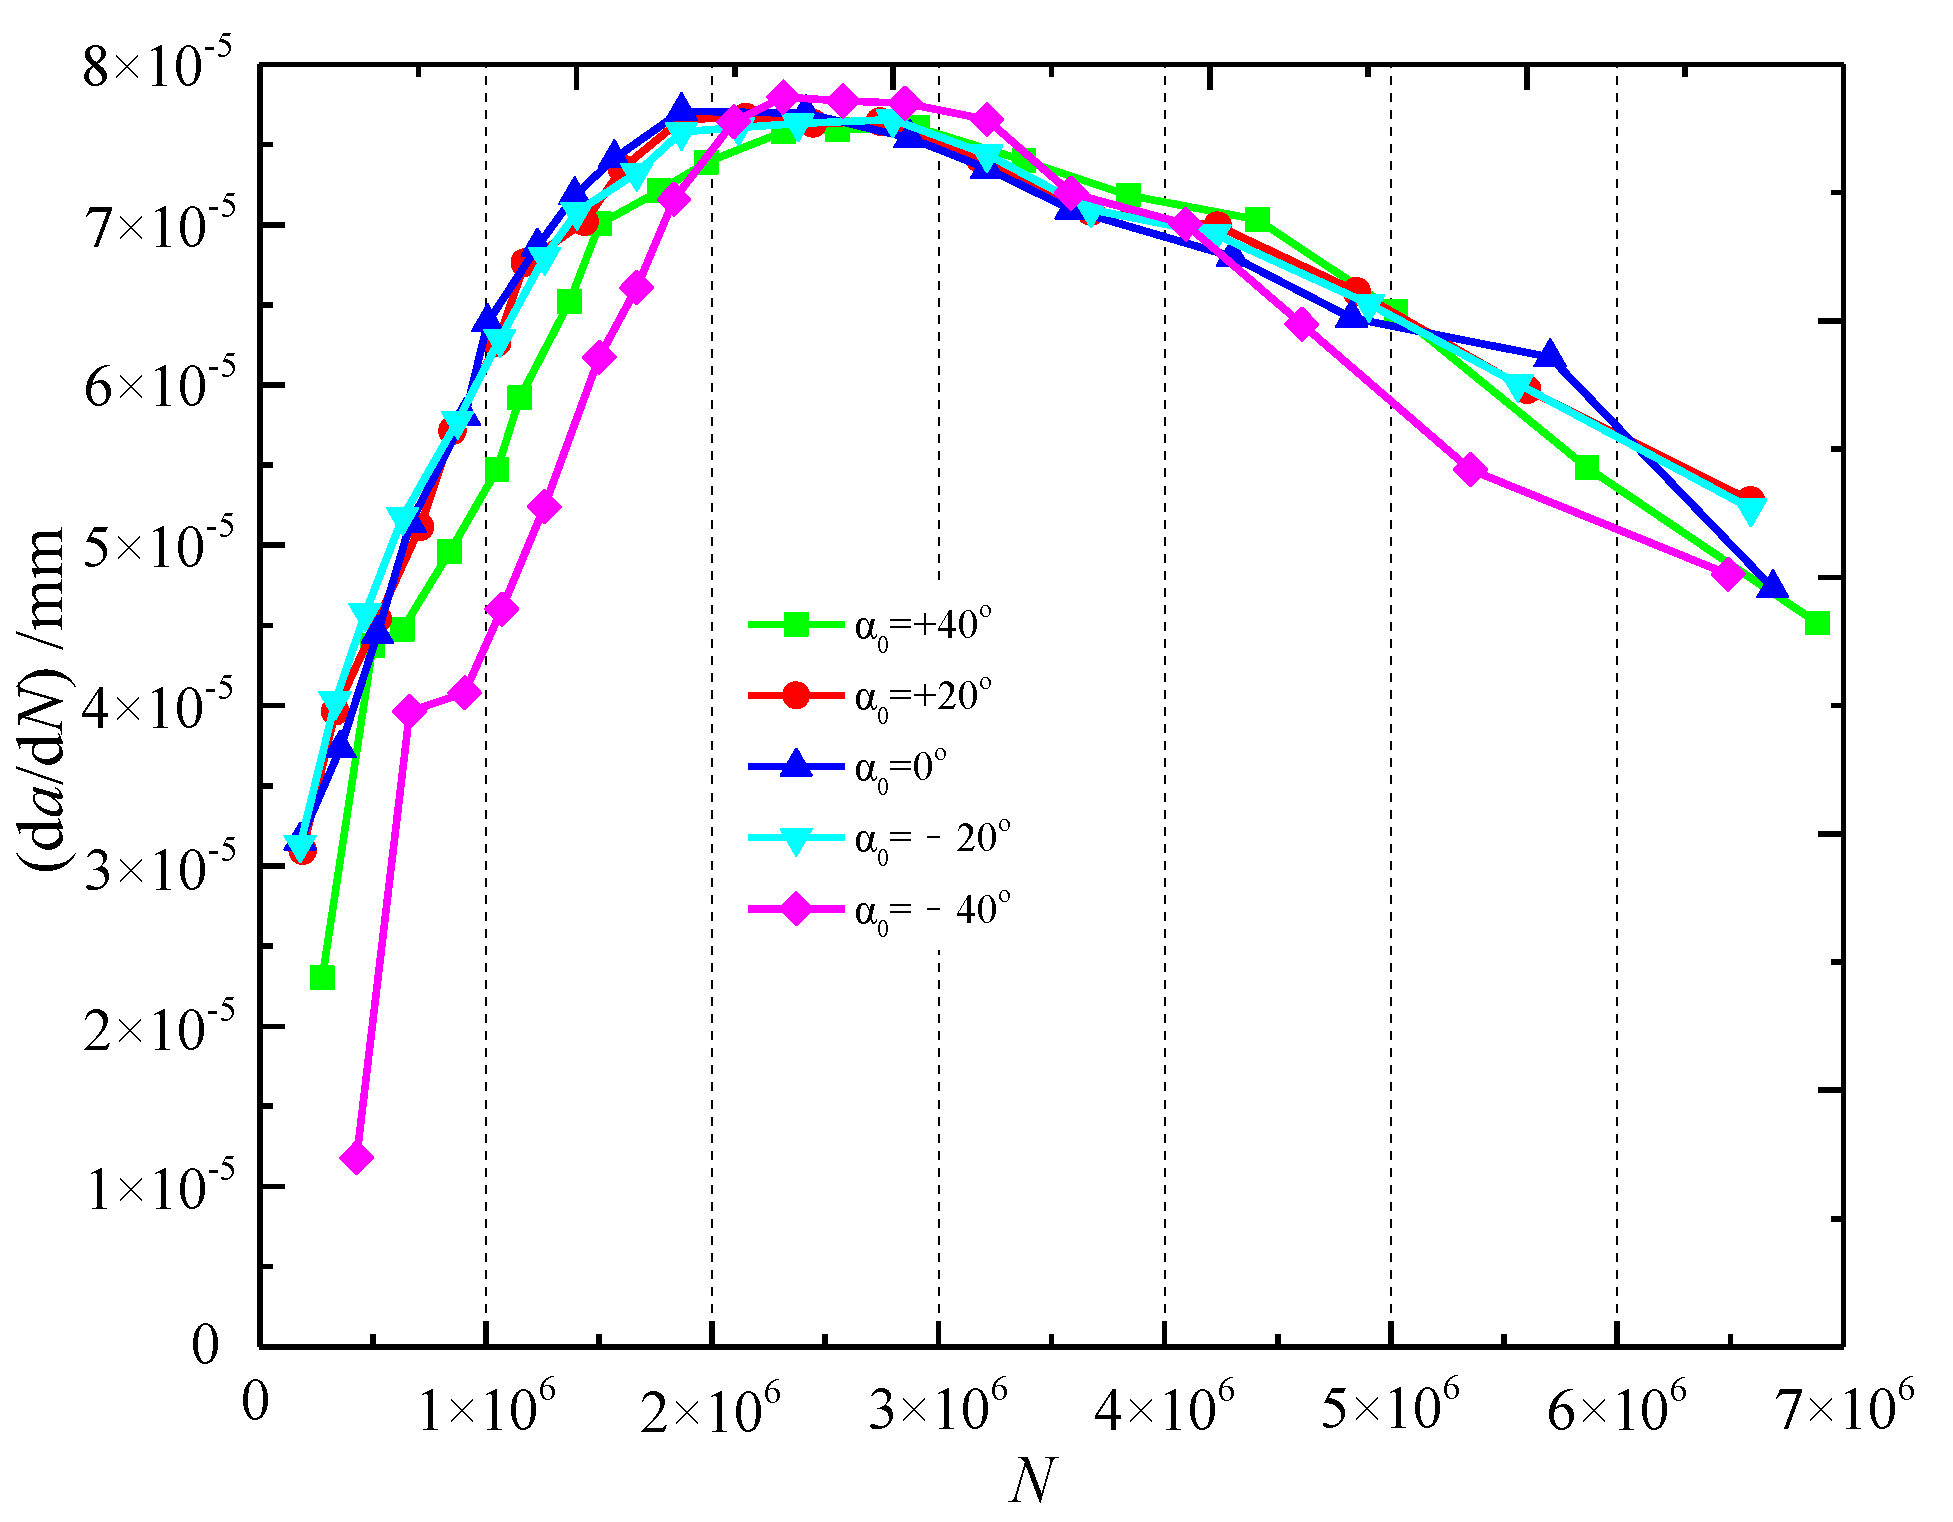
- The propagation of the deepest point A of the crack was at the junction between shaft and flange. It can be divided into three stages: rapid growth (stage 1), steady decline (stage 2, buffer stage), and instability (stage 3). First, the initial crack angle only had a significant effect on the propagation rate of stage 1. Second, the initial crack angle affected the distribution of the fatigue life upon the structure during the propagation stage. The crack with a larger initial crack angle had a smaller proportion of buffer stage in the total fatigue life. After stage 1, a larger crack initial angle accelerated the structure to reach the instability propagation, which led to an abrupt fracture of the cross-section. This was more unfavorable for deciding how regular the crack detection should be carried out or pushing forward maintenance and reinforcement.
- (4)
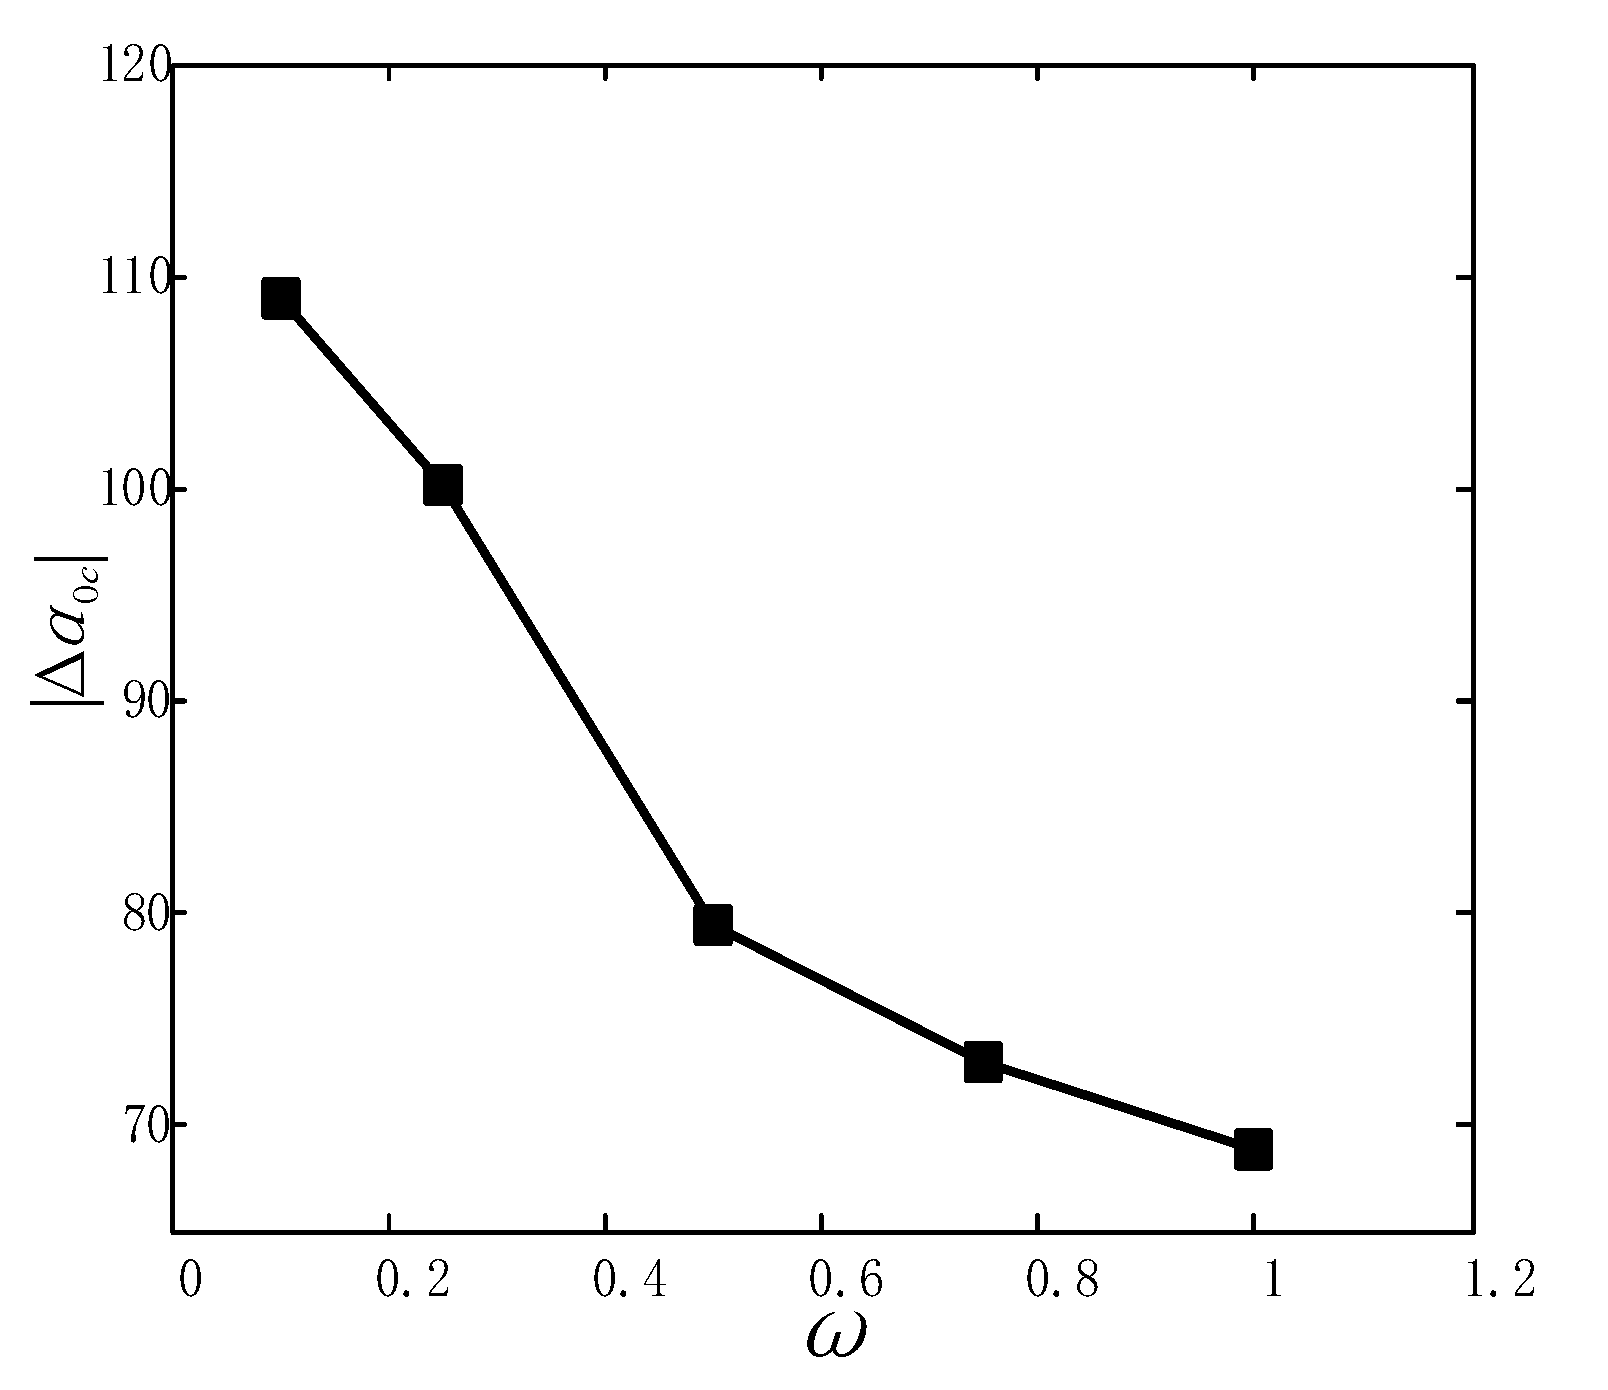
- It was the size relation between ΔKI and ΔKth that determined the crack propagation at the junction between the shaft and the flange. The effective stress intensity factor can partly reflect the law of crack propagation, but cannot serve as a criterion for crack propagation. Moreover, crack propagation can be determined by the effective angle interval, which was negatively correlated with the shape ratio.
- (5)
- The initial crack at the junction between the shaft and the flange only propagated at a certain initial angle. There was a piecewise linear negative correlation between the effective angle interval and the shape ratio. The fitting calculation formula can provide the basis for the crack propagation research and can also be used to judge the propagation of welding cracks or other similar surface cracks. This paper has studied the 45# steel flange and shaft. It obtained the maximum value of effective angle interval for the propagation of the initial crack. The formulas for other types of steels and stress levels and the evaluation method based on reliability need to be further explored.
Author Contributions
Funding
Institutional Review Board Statement
Informed Consent Statement
Data Availability Statement
Conflicts of Interest
References
- Bangchun, W. Mechanical Design Manual; China Machine Press: Beijing, China, 2015. [Google Scholar]
- Li, Y.T.; Duan, H.Y.; Wang, R.F. Effect of Notched Parameters on Low Cycle Fatigue Life of Shaft with Annular Notch under Cantilever Bending. Key Eng. Mater. 2011, 462, 136–141. [Google Scholar] [CrossRef]
- Asi, O. Fatigue failure of a rear axle shaft of an automobile. Eng. Fail. Anal. 2006, 13, 1293–1302. [Google Scholar] [CrossRef]
- Fonseca, L.G.A.; Cantisano, A.; Faria, A.R. Numerical modeling of deep rolling influence over crankshaft bending and correlation with fatigue behavior. Fatigue Fract. Eng. Mater. Struct. 2020, 43, 672–683. [Google Scholar] [CrossRef]
- Gardin, C.; Courtin, S.; Bézine, G.; Bertheau, D.; Hamouda, H.B.H. Numerical simulation of fatigue crack propagation in compressive residual stress fields of notched round bars. Fatigue Fract. Eng. Mater. Struct. 2007, 30, 231–242. [Google Scholar] [CrossRef]
- Jamil, M.; Khan, A.M.; Hegab, H.; Sarfraz, S.; Sharma, N.; Mia, M.; Gupta, M.K.; Zhao, G.; Moustabchir, H.; Pruncu, C.I. Internal Cracks and Non-Metallic Inclusions as Root Causes of Casting Failure in Sugar Mill Roller Shafts. Materials 2019, 12, 2474. [Google Scholar] [CrossRef] [Green Version]
- Ktari, A.; Haddar, N.; Rezai-Aria, F.; Ayedi, H.F. On the assessment of train crankshafts fatigue life based on LCF tests and 2D-FE evaluation of J-integral. Eng. Fail. Anal. 2016, 66, 354–364. [Google Scholar] [CrossRef]
- Atanasovska, I.; Jelić, M.; Mitrović, R.; Momčilović, D. The Influence of Corrosion on Stress Concentration Factor at Shaft to Flange Radius, Power Transmissions; Springer: Berlin/Heidelberg, Germany, 2013; pp. 657–666. [Google Scholar]
- Li, J.; Zhang, P.; Lu, L.; Lv, F.; Miao, X.-T.; Chang, L.; Zhou, B.-B.; He, X.-H.; Zhou, C.-Y. Effect of pre-strain on fatigue crack growth behavior for commercial pure titanium at ambient temperature. Int. J. Fatigue 2018, 117, 27–38. [Google Scholar] [CrossRef]
- Sola, J.F.; Alinejad, F.; Rahimidehgolan, F.; Niazmand, A. Fatigue life assessment of crankshaft with increased horsepower. Int. J. Struct. Integr. 2019, 10, 13–24. [Google Scholar] [CrossRef]
- Pandey, R. Failure of diesel-engine crankshafts. Eng. Fail. Anal. 2003, 10, 165–175. [Google Scholar] [CrossRef]
- Lei, X. Dynamic Modeling of Vibration and Analysis on Crack Fault in I.C.E. Crankshafts. Ph.D. Thesis, Dalian University of Technology, Dalian, China, 2003. [Google Scholar]
- Zhou, X. Theoretical and Experimental Study on Fatigue Behavior and Reliability of Engine Crankshaft. Ph.D. Thesis, Zhejiang University, Hangzhou, China, 2006. [Google Scholar]
- Yang, F.-P.; Chen, T.; Lu, Y.-C. The Effects of Carburization on the Fatigue Crack Growth Behaviors of Local Surface Cracks in Cylindrical Bars. J. Mater. Eng. Perform. 2019, 28, 3423–3429. [Google Scholar] [CrossRef]
- Ye, Z.-Y.; Liu, D.-X.; Zhang, X.-H.; Zhang, X.-M.; Lei, M.-X.; Yang, Z. Corrosion Fatigue Behavior of 7A85 Aluminum Alloy Thick Plate in NaCl Solution. Acta Met. Sin. (Engl. Lett.) 2015, 28, 1047–1054. [Google Scholar] [CrossRef]
- Fonte, M.; Anes, V.; Duarte, P.; Reis, L.; Freitas, M. Crankshaft failure analysis of a boxer diesel motor. Eng. Fail. Anal. 2015, 56, 109–115. [Google Scholar] [CrossRef]
- Fonte, M.; Freitas, M. Semi-elliptical fatigue crack growth under rotating or reversed bending combined with steady torsion. Fatigue Fract. Eng. Mater. Struct. 1997, 20, 895–906. [Google Scholar] [CrossRef]
- Fonte, M.; Freitas, M.; Reis, L. Failure analysis of a damaged diesel motor crankshaft. Eng. Fail. Anal. 2019, 102, 1–6. [Google Scholar] [CrossRef]
- Yang, F.-P.; Kuang, Z.-B. Fatigue crack growth for a surface crack in a round bar under multi-axial loading condition. Fatigue Fract. Eng. Mater. Struct. 2005, 28, 963–970. [Google Scholar] [CrossRef]
- Zangeneh, S.; Ketabchi, M.; Kalaki, A. Fracture failure analysis of AISI 304L stainless steel shaft. Eng. Fail. Anal. 2014, 36, 155–165. [Google Scholar] [CrossRef]
- Azevedo, T.F.; Sampaio, W.R.V.; Câmara, E.C.B.; Lima, G.D.; dos Santos Silva, W.F.; da Silva Ramos, S. Failure analysis of a sugarcane loader rear shaft. Eng. Fail. Anal. 2019, 109, 104326. [Google Scholar] [CrossRef]
- Aliakbari, K.; Nejad, R.M.; Mamaghani, T.A.; Pouryamout, P.; Asiabaraki, H.R. Failure analysis of ductile iron crankshaft in compact pickup truck diesel engine. Structures 2021, 36, 482–492. [Google Scholar] [CrossRef]
- Khameneh, M.J.; Azadi, M. Evaluation of high-cycle bending fatigue and fracture behaviors in EN-GJS700-2 ductile cast iron of crankshafts. Eng. Fail. Anal. 2018, 85, 189–200. [Google Scholar] [CrossRef]
- Alvarez, P.; Vázquez, L.; Ruiz, N.; Rodríguez, P.; Magaña, A.; Niklas, A.; Santos, F. Comparison of Hot Cracking Susceptibility of TIG and Laser Beam Welded Alloy 718 by Varestraint Testing. Metals 2019, 9, 2075–4701. [Google Scholar] [CrossRef] [Green Version]
- Coro, A.; Macareno, L.M.; Aguirrebeitia, J.; De Lacalle, L.N.L. A Methodology to Evaluate the Reliability Impact of the Replacement of Welded Components by Additive Manufacturing Spare Parts. Metals 2019, 9, 932. [Google Scholar] [CrossRef] [Green Version]
- Rodriguez, A.; De Lacalle, L.N.L.; Pereira, O.; Fernandez, A.; Ayesta, I. Isotropic finishing of austempered iron casting cylindrical parts by roller burnishing. Int. J. Adv. Manuf. Technol. 2020, 110, 753–761. [Google Scholar] [CrossRef] [PubMed]
- Liu, Y.; Lian, Z.; Xia, C.; Qian, L.; Liu, S. Fracture failure analysis and research on drive shaft of positive displacement motor. Eng. Fail. Anal. 2019, 106, 104145. [Google Scholar] [CrossRef]
- Erdogan, F.; Sih, G.C. On the crack extension in plates under plane loading and transverse shear. J. Basic Eng. 1963, 85, 519–525. [Google Scholar] [CrossRef]
- Yangfan, Q.; Te, C.; Yiming, C.; Fengpeng, Y. Experimental Study on the I-II Mixed Mode Fatigue Crack Growth in Polyethylene. Chin. Q. Mech. 2021, 42, 87–97. [Google Scholar]
- British Standards Institution. Guide on Methods for Assessing the Acceptability of flaws in Metallic Structures; British Standards Institution: London, UK, 2013. [Google Scholar]
- Paris, P.; Erdogan, F. A Critical Analysis of Crack Propagation Laws. J. Basic Eng. 1963, 85, 528–533. [Google Scholar] [CrossRef]
- Ma, S.; Hu, H. The mixed-mode propagation of fatigue crack in CTS specimen. Chin. J. Theor. Appl. Mech. 2006, 38, 698–704. [Google Scholar]
- Lianqing, W.; Jin, K.; Hongying, W. Investigation on mixed mode I-II fatigue crack of 7050 aluminum alloy. China Meas. Tes 2021, 47, 139–146. [Google Scholar]
- Richard, H.A.; Benitz, K. A loading device for the creation of mixed mode in fracture mechanics. Int. J. Fract. 1983, 22, R55–R58. [Google Scholar] [CrossRef]
- Liu, C.; Wu, D.; Li, Y.; Du, Y. Large-scale pavement roughness measurements with vehicle crowdsourced data using semi-supervised learning. Transp. Res. Part C Emerg. Technol. 2021, 125, 103048. [Google Scholar] [CrossRef]
- Alcázar, J.; Abate, G.; Antunez, N.; Simoncelli, A.; Egea, A.J.S.; Krahmer, D.M.; de Lacalle, N.L. Reduction of Die Wear and Structural Defects of Railway Screw Spike Heads Estimated by FEM. Metals 2021, 11, 1834. [Google Scholar] [CrossRef]
- Alshoaibi, A.M.; Fageehi, Y.A. 3D modelling of fatigue crack growth and life predictions using ANSYS. Ain Shams Eng. J. 2021, 13, 101636. [Google Scholar] [CrossRef]
- Establishment, C.A. Stress Intensity Factor Handbook (Revised Edition); Science Press: Beijing, China, 1993. [Google Scholar]
- Xinhua, Y.; Chuanyao, C. Fatigue and Fracture; Huazhong University of Science and Technology Press: Wuhan, China, 2018. [Google Scholar]


| Loading Angle (°) | 63 | 50 | 36 |
| Load F (kN) | 8 | 9.6 | 11 |
| Loading Angle (°) | The Calculated Value (MPa·m0.5) | Richard Analytical Solution (MPa·m0.5) | Error (%) | |||
|---|---|---|---|---|---|---|
| KI | KII | KII | KII | KII | KII | |
| 36 | 6.10 | 4.01 | 5.85 | 4.20 | 4.3 | −4.5 |
| 50 | 6.49 | 2.75 | 6.64 | 2.91 | −2.3 | −5.5 |
| 63 | 6.29 | 1.61 | 6.45 | 1.71 | −2.5 | −5.9 |
| Simulation Response | Integral Uniform Grid | Local Grid Refinement | |||
|---|---|---|---|---|---|
| Case 1 (3 mm) | Case 2 (2 mm) | Case 3 (1.75 mm) | Case 4 (1.4 mm) | Case 5 (1 mm) | |
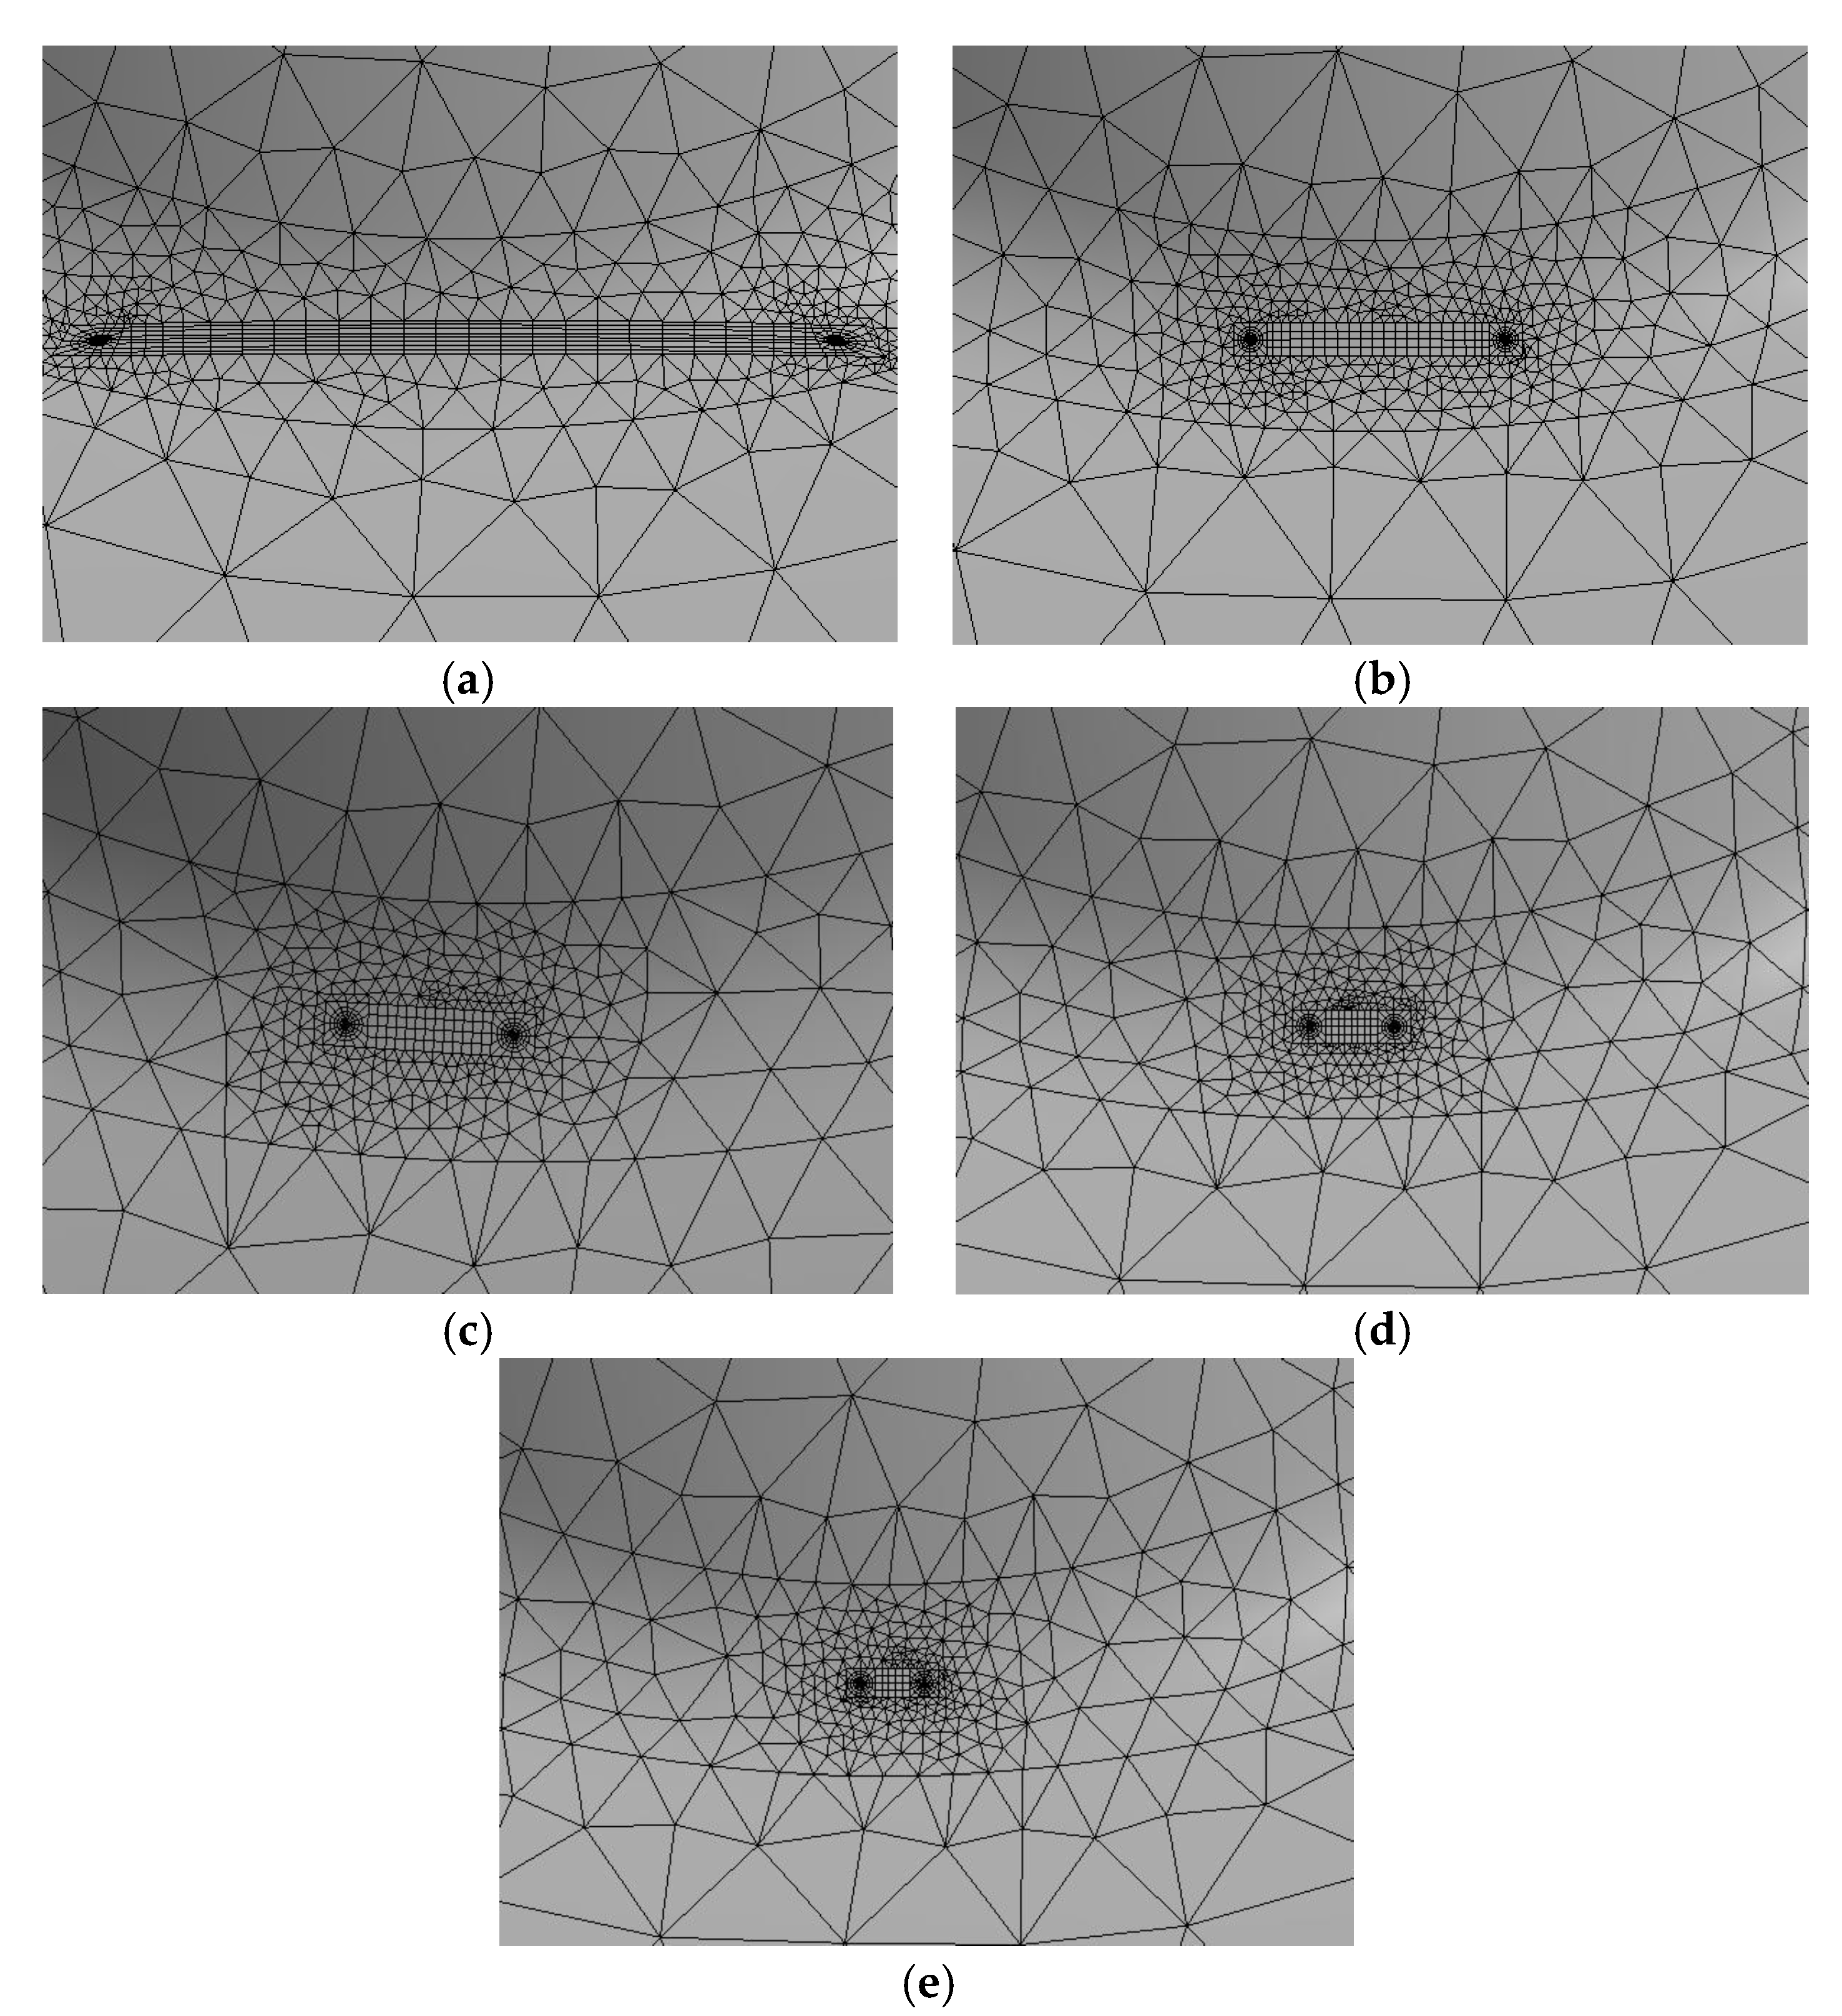
| Configuration |  |  |  |  |  |
| Elements | 100,041 | 316,514 | 59,476 | 106,390 | 212,872 |
| Simulation time (h) | 5.6 | 27.5 | 3.7 | 6.1 | 15.3 |
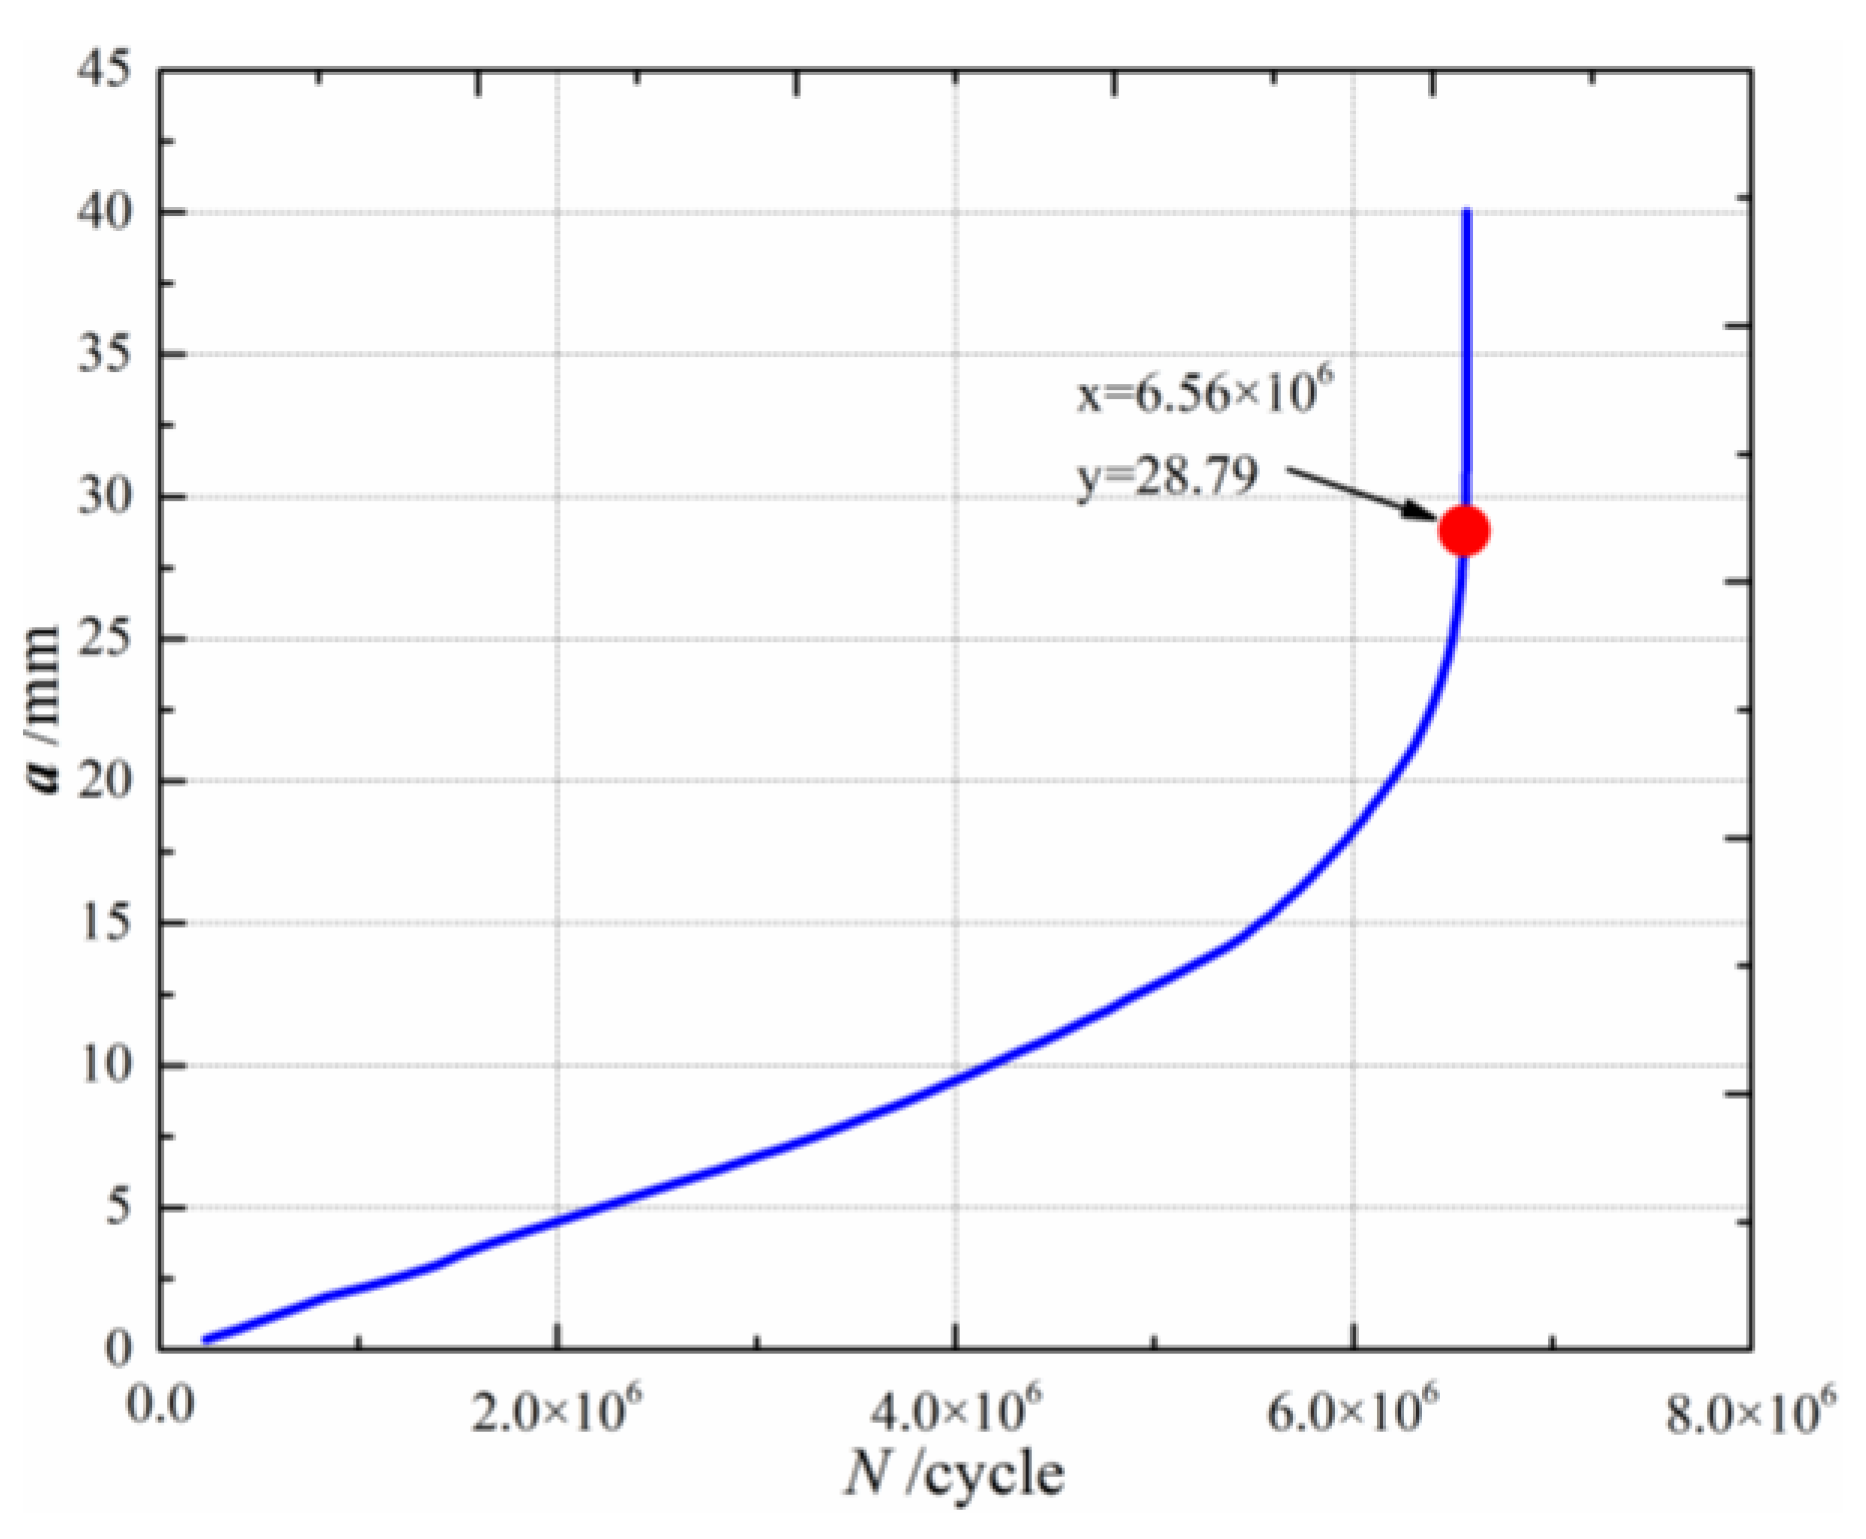
| Computed result (cycle number) | 9.76 × 10⁵ | 4.72 × 10⁶ | 5.16 × 10⁶ | 6.51 × 10⁶ | 6.56 × 10⁶ |
| Experiment Results | Numerical Result | Error (%) | |||
|---|---|---|---|---|---|
| T1 | T2 | T3 | Average Value | ||
| 6.49 × 10⁶ | 7.36 × 10⁶ | 7.64 × 10⁶ | 7.16 × 10⁶ | 6.56 × 10⁶ | 8.4 |
| Numerical Test Number | Geometry Parameters | ||
|---|---|---|---|
| a0 (mm) | c0 (mm) | ω | |
| C1 | 0.5 | 2.5 | 0.1 |
| C2 | 0.5 | 1.0 | 0.25 |
| C3 | 0.5 | 0.5 | 0.5 |
| C4 | 0.5 | 0.335 | 0.75 |
| C5 | 0.5 | 0.25 | 1.0 |
| α0/(°) | (Nu/N) (%) | Propagation Rate (%) | Average Propagation Rate (%) | Ns/N (%) | Propagation Rate (%) | Average Propagation Rate (%) |
|---|---|---|---|---|---|---|
| −40 | 60.3 | +562.1 | +246 | 39.7 | −30.5 | −34.56 |
| −20 | 57.9 | +144.8 | 42.1 | −31.7 | ||
| 0 | 45.7 | +144.0 | 54.3 | −38.7 | ||
| 20 | 60.4 | +148.2 | 39.6 | −31.2 | ||
| 40 | 62.3 | +231.0 | 37.7 | −40.7 |
| Numerical Test Number | a0 (mm) | α0p (°) | ω | |Δα0c| (°) |
|---|---|---|---|---|
| C1 | 0.5 | +4 | 0.1 | 108.9 |
| C2 | 0.5 | +4 | 0.25 | 100.1 |
| C3 | 0.5 | +4 | 0.5 | 79.3 |
| C4 | 0.5 | +4 | 0.75 | 72.9 |
| C5 | 0.5 | +4 | 1.0 | 68.8 |
Publisher’s Note: MDPI stays neutral with regard to jurisdictional claims in published maps and institutional affiliations. |
© 2022 by the authors. Licensee MDPI, Basel, Switzerland. This article is an open access article distributed under the terms and conditions of the Creative Commons Attribution (CC BY) license (https://creativecommons.org/licenses/by/4.0/).
Share and Cite
Xu, Z.; Cui, Y.; Li, B.; Liu, K.; Shi, F.; Cao, P. Impact Analysis of Initial Cracks’ Angle on Fatigue Failure of Flange Shafts. Coatings 2022, 12, 276. https://doi.org/10.3390/coatings12020276
Xu Z, Cui Y, Li B, Liu K, Shi F, Cao P. Impact Analysis of Initial Cracks’ Angle on Fatigue Failure of Flange Shafts. Coatings. 2022; 12(2):276. https://doi.org/10.3390/coatings12020276
Chicago/Turabian StyleXu, Zhiqiang, Yunxian Cui, Baoliang Li, Ketong Liu, Feiting Shi, and Peng Cao. 2022. "Impact Analysis of Initial Cracks’ Angle on Fatigue Failure of Flange Shafts" Coatings 12, no. 2: 276. https://doi.org/10.3390/coatings12020276