Article

Evolution Law and Mechanism of Freeze–Thaw Damage of Cement-Stabilized Weathered Sand

1
School of Transportation Engineering, Shandong Jianzhu University, Jinan 250101, China
2
Jinan Rail Transit Group Co., Ltd., Jinan 250100, China
3
School of Municipal & Environmental Engineering, Shandong Jianzhu University, Jinan 250101, China
*
Author to whom correspondence should be addressed.
Coatings 2022, 12(2), 272; https://doi.org/10.3390/coatings12020272
Submission received: 3 January 2022 / Revised: 8 February 2022 / Accepted: 16 February 2022 / Published: 18 February 2022
(This article belongs to the Special Issue Corrosion and Degradation of Materials)

Abstract

:
To explore the damage evolution law of cement-stabilized weathered sand under the action of freeze–thaw cycles, relevant experimental research was carried out on stabilized weathered sand with a cement content of 3%, including unconfined compressive strength (UCS), scanning electron microscope (SEM), and mercury intrusion porosimetry (MIP) testing. Using the surface appearance, mass, and UCS of the specimen, combined with the changes of microscopic characteristics, the freeze–thaw damage law and microscopic degradation mechanism of cement-stabilized weathered sand were analyzed. The test results showed that with the increase of the number of freeze–thaw cycles, the surface appearance of the specimen continued to deteriorate, the unconfined compressive strength gradually decreased, and the mass of the specimen first increased and then decreased. After nine freeze–thaw cycles, the specimen was seriously damaged, and the strength loss was as high as 55%. From a microscopic point of view, the freeze–thaw cycles caused the pore water inside the specimen to continuously change between ice crystals and liquid. Frost heave and shrinkage weakened the cement bond between the weathered sand particles and made the pores in the specimen develop and expand continuously. With the decrease of the number of micropores and the increase of the number of medium and large pores, the particle skeleton changed from a dense structure to a porous structure, which eventually led to the deterioration of the macroscopic properties of the cement-stabilized weathered sand.

1. Introduction

Weathered sand is widely distributed in mountainous and hilly areas of China. It is the product of rock disintegration under natural conditions, and has the general nature of talus materials, such as loose, large pores; easy compression deformation; and low strength. The physical and mechanical properties of weathered sand are poor, and it is easily destroyed under the action of external forces, so it cannot be directly used in engineering construction in most cases [1]. There are only a few studies on the engineering application of weathered sand, and most of them focus on its use as a dam building material [2], road building material [3,4,5], and for expansive soil improvement [6,7,8]. With the rapid development of highway construction in China, high-quality filler is increasingly scarce. Making full use of local resources is of great significance for saving engineering investments and protecting the environment. The stability of weathered sand is worse than that of general filler, so it cannot be directly used as a road material and must be stabilized [8]. The chemical stabilization method is mostly used in engineering, and the commonly used stabilizers are cement, lime, and lime-fly ash. An [3] used cement and lime-fly ash respectively to stabilize weathered sand and found that both had good mechanical strength, but the freeze stability and crack resistance of lime-fly ash-stabilized weathered sand were slightly worse. Guo et al. [4] studied the road performance of cement stabilized weathered sand. They found that the strength of cement stabilized weathered sand increased greatly, the water stability and freeze stability were good, and the temperature shrinkage coefficient and dry shrinkage coefficient were small. Wang et al. [5] carried out physical characteristics and field rolling test research on the weathered sand in the Three Gorges Dam area and believed that the compaction of the roadbed filled with weathered sand could meet the engineering requirements. Yang et al. [6] used weathered sand to improve expansive soil and found that weathered sand can better inhibit the expansion of expansive soil. Huang et al. [8] conducted experimental research on the shear strength of expansive soil improved with lime-weathered sand and proposed that the shear strength of the improved expansive soil can meet the soil standard for subgrade filling. Yang et al. [9,10] conducted systematic studies on the weathered sand in the Three Gorges Reservoir area and found that the weathered sand has distinct edges and corners, forming a skeleton by interlocking with each other, and has a large internal friction force. By adding stabilizers such as lime and cement, the cohesion between particles could be increased to improve its overall strength. For lime-ash-stabilized weathered sand, lime content is the primary factor affecting compressive strength, while the lime-ash ratio is the secondary factor [9]. For cement-stabilized weathered sand, considering economic and mechanical properties, the optimal cement content should be controlled at 7% [10].
Frost heaving and melt settling usually occur in inorganic binder-stabilized materials, leading to various road diseases such as mass loss [11], surface appearance defects, and strength attenuation [12,13]. Therefore, it is necessary to study the stability and durability of inorganic binder-stabilized materials under freeze–thaw cycles. Jumassultan et al. [14] studied the mechanical properties of cement-stabilized sand under freeze–thaw conditions and found that the strength and durability of the specimens decreased with the increase of the number of freeze–thaw cycles. Tian et al. [15] analyzed the strength loss law of cement-stabilized crushed rock under freeze–thaw action and suggested that a higher cement content and curing temperature could effectively reduce the strength loss. Hao et al. [16] carried out freeze–thaw cycle tests on red mud-steel slag-modified cement soil and found that the early freeze–thaw action had a greater impact on the strength. With the increase of the number of freeze–thaw cycles, the pores between the modified cement soil particles developed and expanded, the structure was loose, and the surface appearance showed different degrees of damage. Gao et al. [17] studied the static and dynamic characteristics of basalt fiber-reinforced cement soil after freeze–thaw cycles and found that freeze–thaw action has a significant impact on the strength loss, which was serious in cycles 1–3, and the addition of basalt fiber could improve this situation. Li et al. [18] studied the tensile strength of fiber-reinforced soil under freezing-thawing conditions and found that the decline of tensile strength was mainly concentrated in the first five times of freezing-thawing, and the strength remained relatively stable during the sixth to ninth freeze–thaw cycles. Li et al. [19] found in the freeze–thaw cycle that when loads were applied, the freeze–thaw cycle would destroy the structure of expansive soil and form new cracks, resulting in loose pore structure. Lake et al. [20] studied the mechanism of freeze–thaw damage of lightly cement soil before and after freeze–thaw cycle through optical microscope and mercury injection method, and found that the increase of sample hydraulic conductivity, the formation of microcracks and cracks and the damage of matrix after freeze–thaw were obvious, with high permeability coefficient. Eskisar et al. [21] studied the strength characteristics of fat clay and lean clay treated with Portland cement under freeze–thaw cycle. Through unconfined compression test and ultrasonic pulse velocity test, it was found that cement can improve the freeze–thaw durability of clay. Zhang et al. [22] further understood the phase change process of soil water by measuring pore water pressure of silty clay during freezing and thawing.
Macroscopic mechanical properties are the external manifestation of the microstructure, so it is of great significance to study the evolution of microscopic characteristics in a freeze–thaw environment. The microstructure of soil is mainly the relationship between the size, shape, and quantity of pores and particles, among which the change of pores is an important embodiment of structural deformation [23]. Scanning electron microscopy (SEM) is an effective way to study the microscopic pores and particles of soil [24]. The development morphology of pores can be qualitatively analyzed through SEM images, and the development status of porosity abundance can be quantitatively analyzed by image processing software [25]. Liu et al. [26] analyzed the abundance and orientation of pores and structural units of cement soil, and found that it has no obvious orientation. The above methods can also be used to analyze the microscopic degradation mechanism of macroscopic damage under freeze–thaw cycles. Hou et al. [27] analyzed the microstructure changes of cement soil under freeze–thaw action and found that the accumulation of repeated freezing and thawing damage caused the expansion of internal cracks, which eventually led to the overall destruction of the cement soil. Zhang et al. [28] analyzed the deterioration mechanism of cement soil under freeze–thaw cycles from the perspective of energy dissipation. When materials are in a freeze–thaw environment, the water in the pores will undergo a liquid–solid–liquid phase change, and the repeated action of frost heaving force is the main cause of mass loss and strength failure, which is the consensus of many studies [29,30,31]. Gao et al. [29] studied the changes of the apparent morphology and other properties of mineralized materials in four different freeze–thaw environments, and proposed that the appearance and disappearance of test samples accompanied by frost heave force resulted in the peeling phenomenon of materials in freeze–thaw environments. Ye et al. [30] conducted an experimental study on freeze–thaw cycle of loess ancient soil with different moisture content based on NUCLEAR magnetic resonance, and concluded that the freeze–thaw cycle changed the internal structure of ancient soil, and pore water and fissure water in soil changed the pore structure of soil under the action of frost swelling, resulting in damage and deterioration of soil. Ding et al. [31] studied the effects of fiber, cement, and freeze–thaw cycle on cement treated clay and fiber cement stabilized clay, and they found that the unconfined compressive strength decreased sharply after the first few freeze–thaw cycles and changed little after the last five freeze–thaw cycles. They put forward the empirical model of predicted UCS, and the predicted model is in good agreement with the experimental results.
At present, the utilization rate of weathered sand is low. If the weathered sand is used reasonably as subgrade filler, it can not only protect the ecological environment, but also reduce the project cost and bring good economic benefits. In addition, research on stabilized weathered sand mainly focuses on macroscopic mechanical properties, while the damage evolution of stabilized weathered sand under freeze–thaw action, especially on the microscopic properties, is rarely reported. This paper takes the weathered sand along the Xintai-Taierzhuang expressway project in Shandong Province as the research object, adopts cement to stabilize it, and focuses on the macroscopic deterioration characteristics of the stabilized weathered sand under freeze–thaw cycles. Moreover, by means of SEM, mercury intrusion porosimetry test (MIP), and image processing, the evolution law of the microstructure, and pore and particle characteristics of cement-stabilized weathered sand are analyzed. Based on this, the mechanism of freeze–thaw damage of cement-stabilized sand is discussed from the micro perspective.

2. Materials and Methods
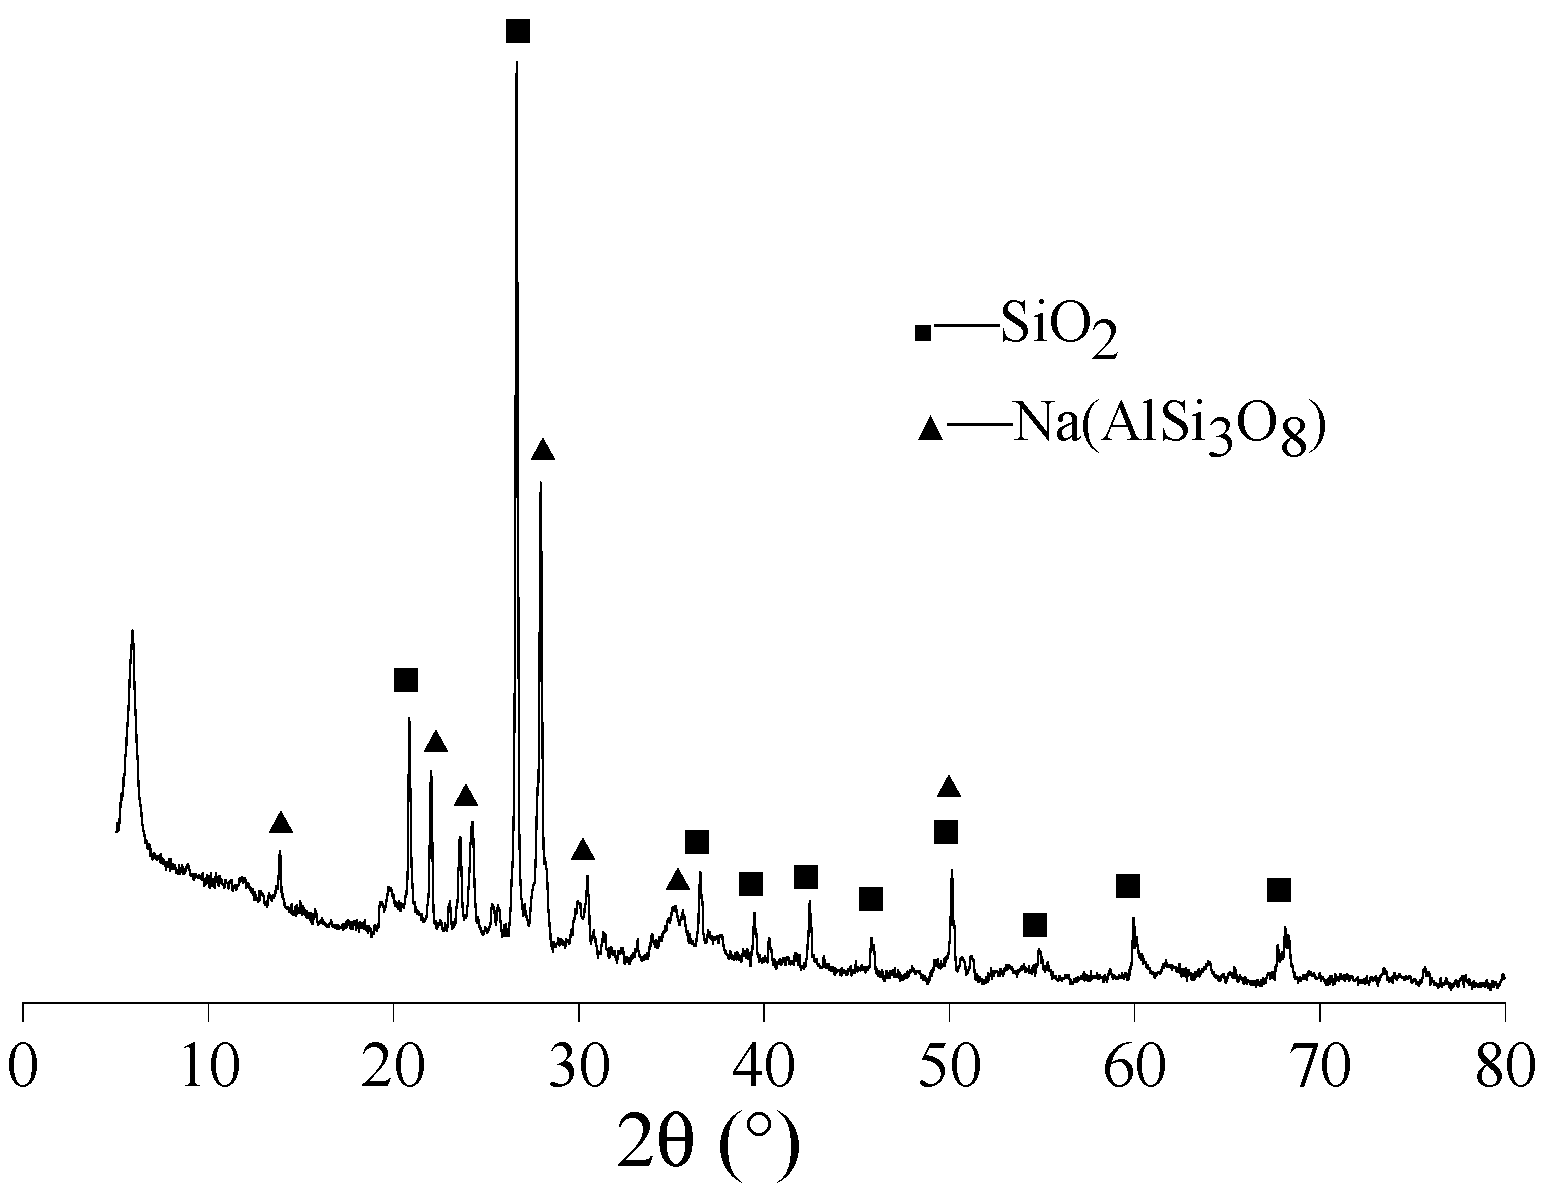
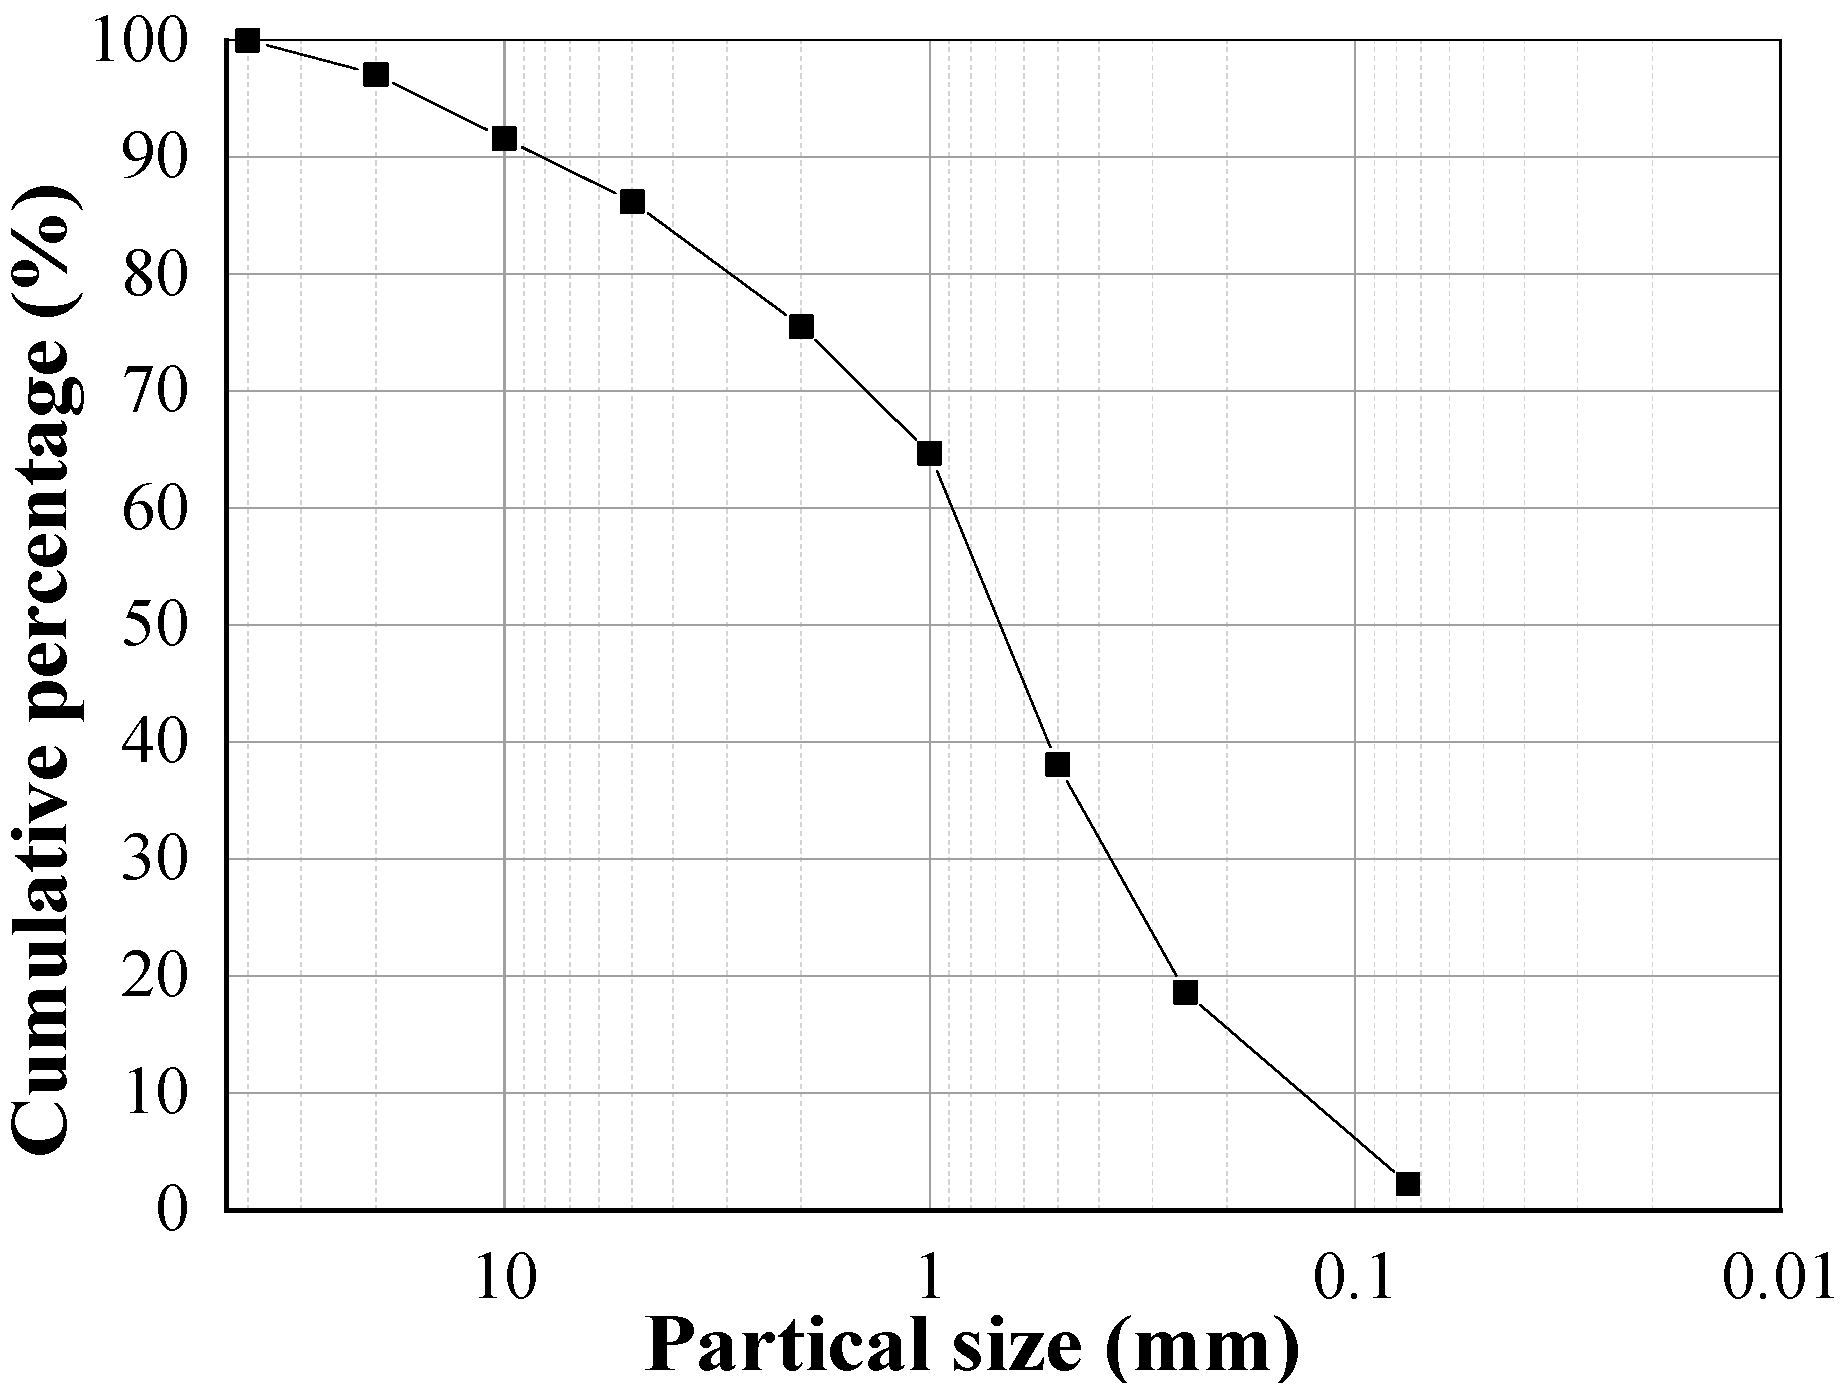
2.1. Materials

The weathered sand used in this study was yellowish brown, the natural water content was 3.1%, the optimal water content was 8.03%, and the maximum dry density was 2.13 g/cm3. Figure 1 shows the X-ray diffraction (XRD) results of the weathered sand after grinding. The main components of the weathered sand are quartz and albite, accounting for 96% of the total content. The analysis results of particle gradation are shown in Figure 2. The natural weathered sand was mainly composed of sand and gravel, in which the content of the gravel group accounted for 24.5%, and the content of the sand group accounted for 75.5%. The coefficient of nonuniformity Cu was 5.6 and the coefficient of curvature Cc is 1.1, indicating that the sand was well-graded. The basic physical indexes are shown in Table 1. Ordinary Portland cement 42.5 and tap water were used in the tests.

2.2. Testing Methods

Firstly, the optimum cement content in the stabilized weathered sand was determined. The cement content is the ratio of the mass of cement to dry weathered sand, which was 0, 1%, 2%, 3%, and 4%, respectively in the specimens. The compaction degree of specimens was 98%, and the curing ages were 7, 14, 28, 60, and 90 d. Table 2 shows the unconfined compressive strength (UCS) of the stabilized weathered sand with different cement content levels. Considering the actual engineering demands, the cement content of the stabilized weathered sand was 3% in this study. Secondly, freeze–thaw cycle tests were carried out to analyze the influence of freeze–thaw action on the surface appearance, mass changes, and strength characteristics of the stabilized weathered sand. Finally, based on the macroscopic study, the microstructural properties, and pore and particle characteristics of the cement-stabilized weathered sand subjected to a different number of freeze–thaw cycles were analyzed with the aid of SEM and MIP to explore the degradation mechanism of the cement-stabilized weathered sand in a freeze–thaw environment.

2.2.1. Sample Preparation

First, the dried weathered sand was mixed with water, and cement was added after being sealed overnight indoors. The water content was controlled to 8.5%, which is the optimal water content of a mixture with a cement content of 3%. Cylindrical specimens with a diameter of 50 mm and a height of 50 mm were made by static pressure and placed in a standard curing box for 28 days [32]. The height-diameter ratio of the sample is 1:1, close to that recommended in ASTM D1633-17, which is 1.15:1 [33]. On the last day of curing, the specimens were immersed in water.

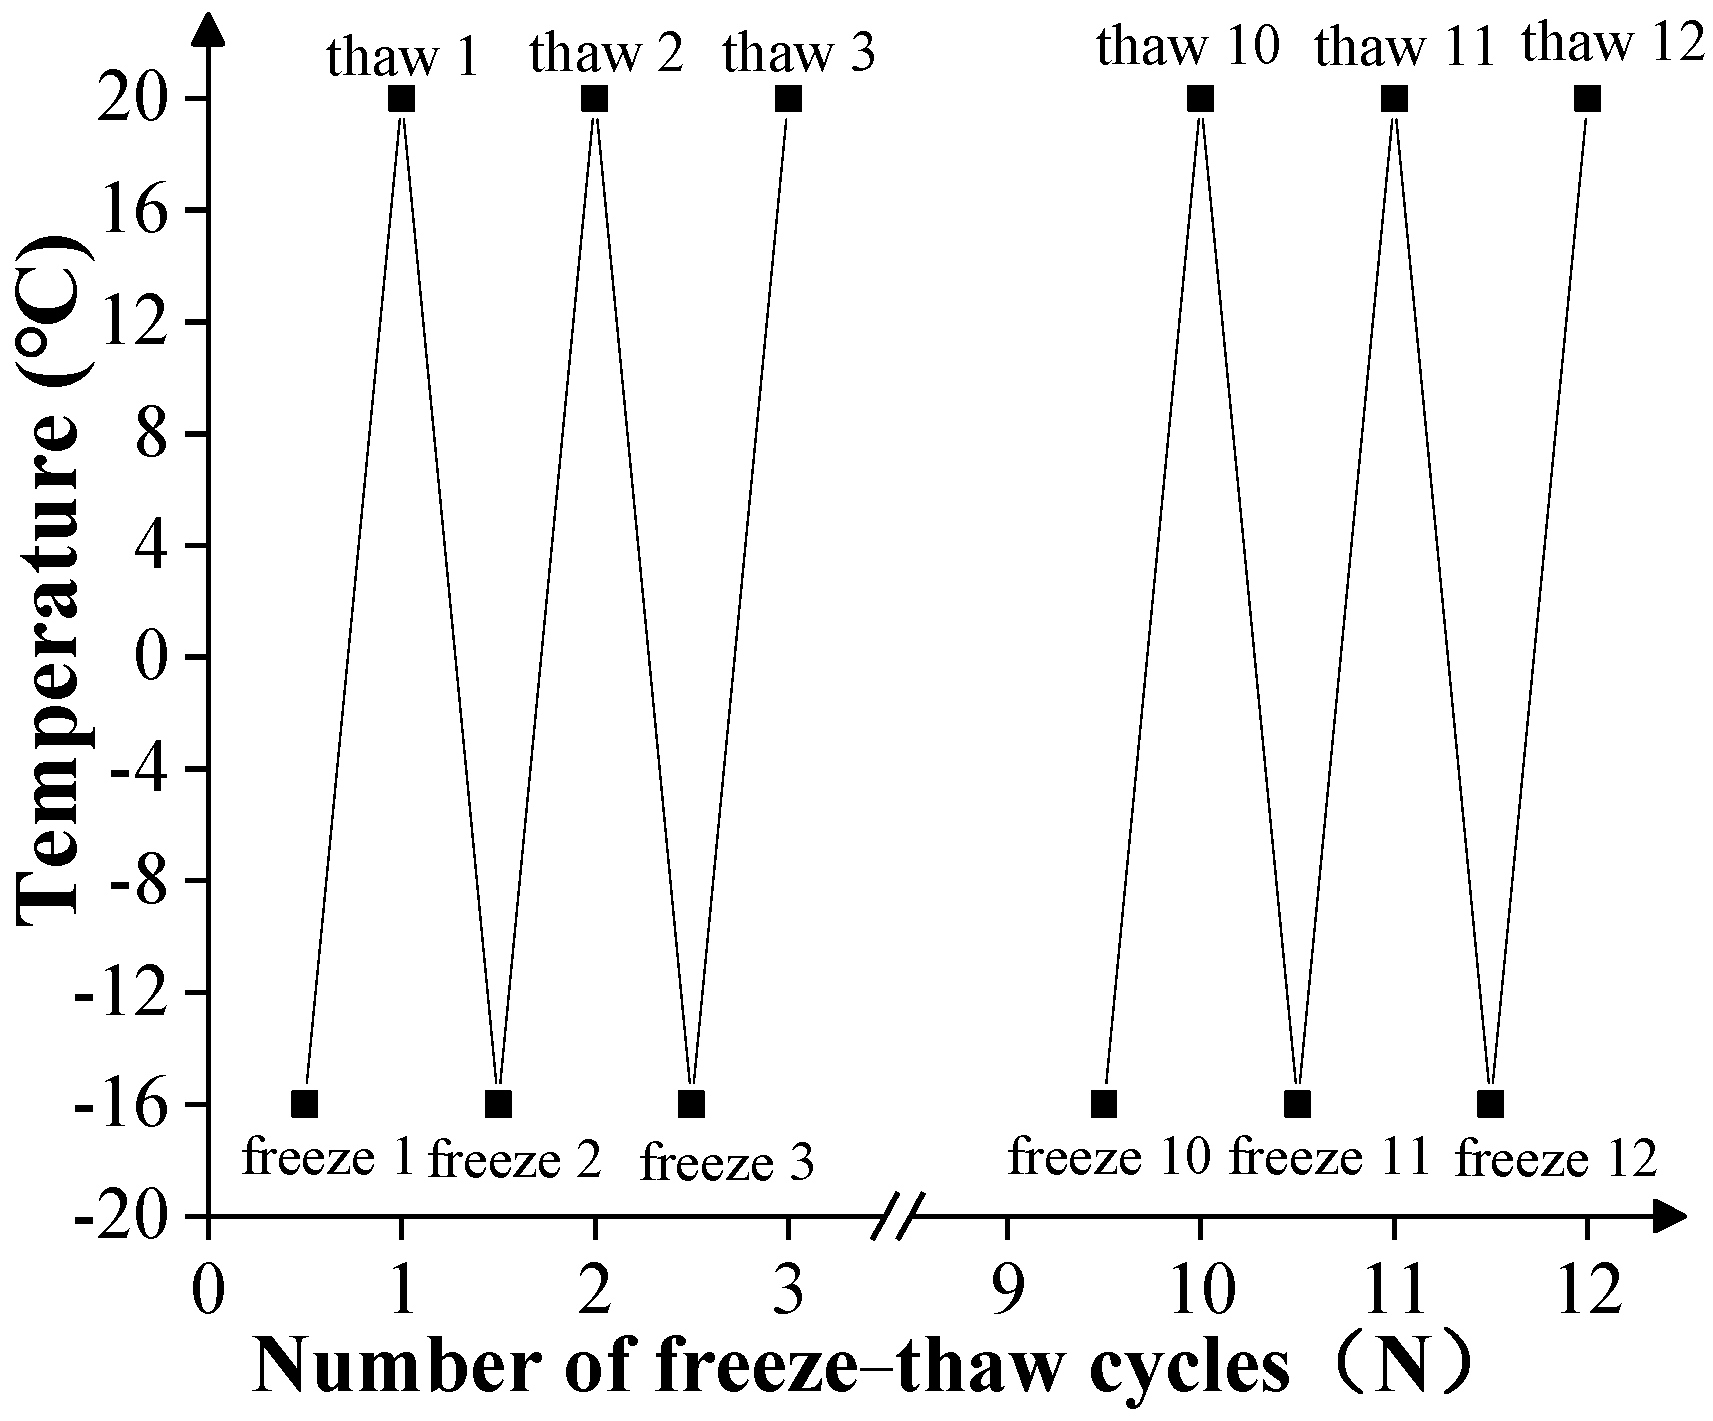
2.2.2. Freeze–Thaw Cycle Test

Following the “Test Methods of Materials Stabilized with Inorganic Binders for Highway Engineering (JTG E51-2009)” [32], before the freeze–thaw cycle test, the surface of the specimen was wiped with a damp cloth until there was no obvious liquid water, and its initial mass was recorded. The specimen was first placed in a low-temperature box and frozen at −18 °C for 16 h, then put into water at 20 °C to thaw for 8 h, and this process was a freeze–thaw cycle. The maximum number of freeze–thaw cycles in this study was 12, and the process of freeze–thaw cycles is shown in Figure 3. During the test, there were three specimens for each freeze–thaw cycle, and they were evenly placed at intervals of 20 mm to facilitate air circulation.

2.2.3. UCS Test

The unconfined compressive strength (UCS) test was carried out with a pavement material strength meter, and the loading rate was maintained at 1 mm/min [32]. The loading rate recommended in ASTM D1633-17 is 1.3 mm/min, which is close to 1 mm/min [33]. The mean average value of the three groups of parallel tests was taken as the test result.

2.2.4. SEM Test

SEM can clearly characterize the internal structure of soil, making it an effective method for qualitatively analyzing the evolution process of the internal structure of soil. After the freeze–thaw cycles test, the specimens were cut, and the samples with dimensions of less than 10 mm × 5 mm × 5 mm were selected for freeze-drying and gold spraying, and observed and photographed with a JSM-7610F scanning electron microscope.
In this study, the samples that underwent the SEM test and MIP test were all dried by a liquid nitrogen freeze vacuum sublimation drying method. The principle is to directly sublimate the amorphous ice to minimize the volume and microstructure changes caused by water loss. The selected samples were put into liquid nitrogen, and the water in it was frozen into non-expandable amorphous ice. Then the samples were put into a freeze dryer for vacuum treatment, and vacuumed for 8 h at −50 °C.

2.2.5. MIP Test

Mercury intrusion porosimetry test (MIP) is an effective way to quantitatively analyze the internal pore distribution of materials. The test used the AutoPore 9500 mercury intrusion instrument produced by Mike Instruments. A small piece (1 cm3) was cut from the specimens, then freeze-dried and loaded into the dilatometer for low-pressure and high-pressure tests.

2.2.6. SEM Image Processing

In this stage, SEM images were preprocessed by MATLAB (Matlab 2016b) and PHOTOSHOP software (Photoshop CC 2017). In MATLAB, the disk-shaped structure Disk in the image processing function Imopen was used to estimate the uneven background to eliminate the influence brought by the inconsistency of image light and shade. The function Imadjust was used to adjust the gray level of the image to enhance the contrast of the image. The function Wiener2 was used to control the noise. After the microscopic image was preprocessed, image processing software Image-Pro Plus (IPP) was used to extract and analyze the data.
In the quantitative analysis of the microstructure, the parameters that characterize the microstructure were firstly determined. From the perspective of morphology and geometry, the selected parameters included abundance C and average abundance Cp of pores and particles [34].
Abundance C: the ratio of the short axis to the long axis of pores (or particles), which can be calculated as follows: C = B/L where B is the short axis of pores (or particles) and L is long axis of pores (or particles).
Average abundance Cp: The average abundance of all pores (or particles). The abundance value is between 0 and 1, and the closer the value is to 0, the more elongated the shape of pores (or particles) is. On the contrary, the closer the value is to 1, the more the shape tends to be round.

3. Results and Discussion

3.1. Deterioration Characteristics of Stabilized Weathered Sand

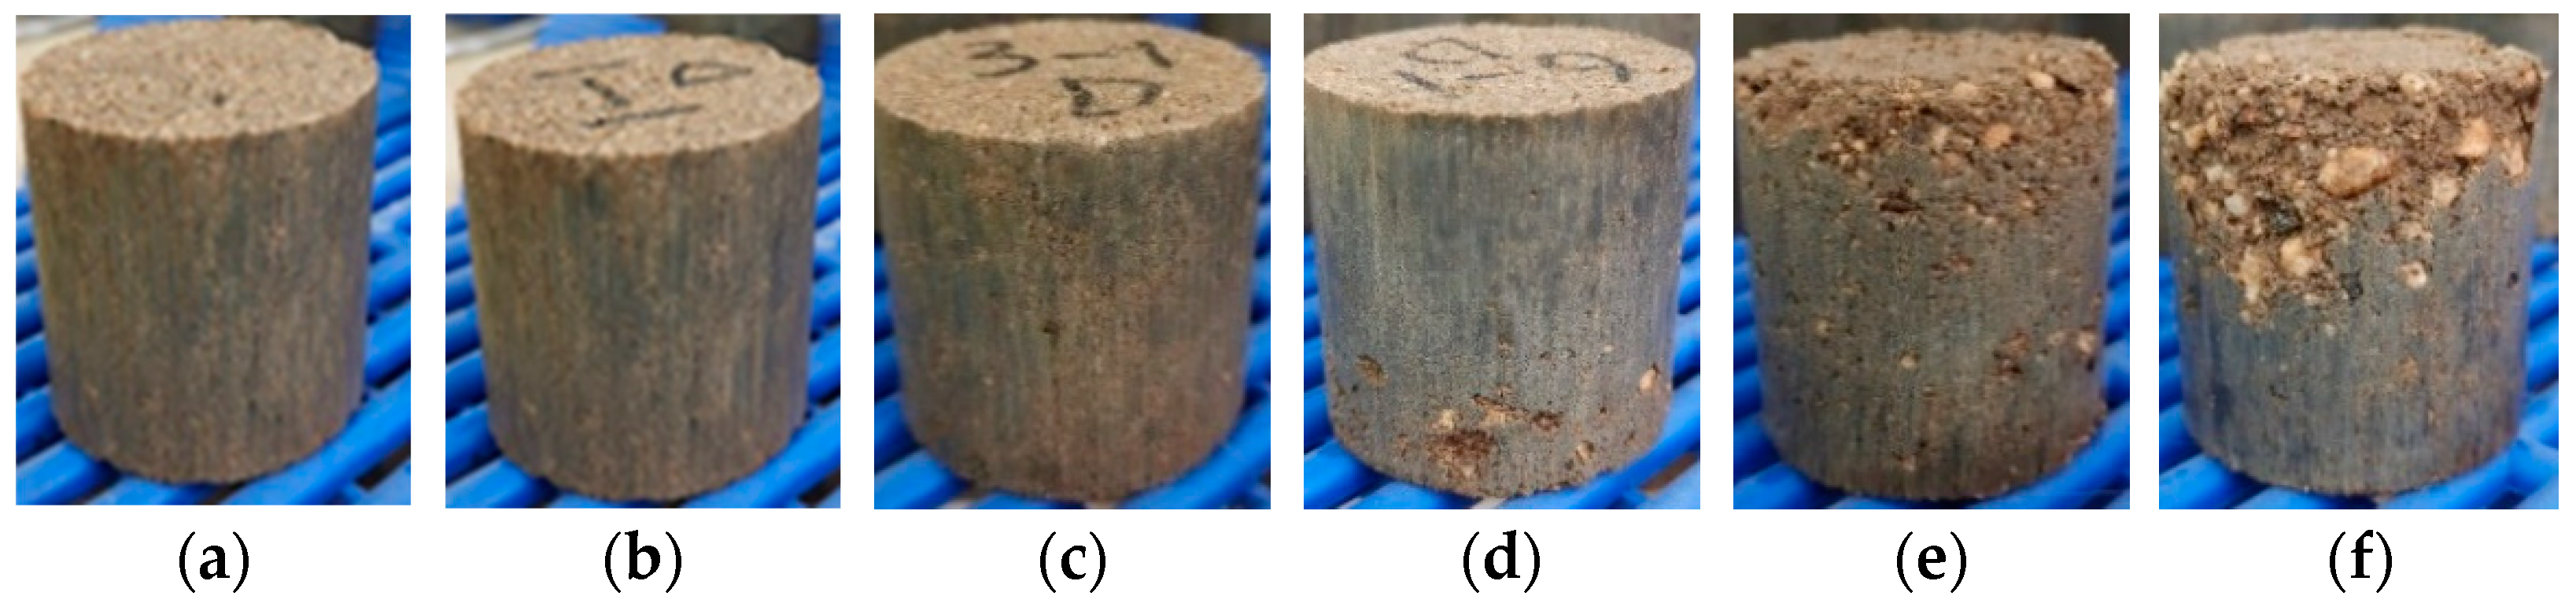
3.1.1. Degradation of Surface Appearance
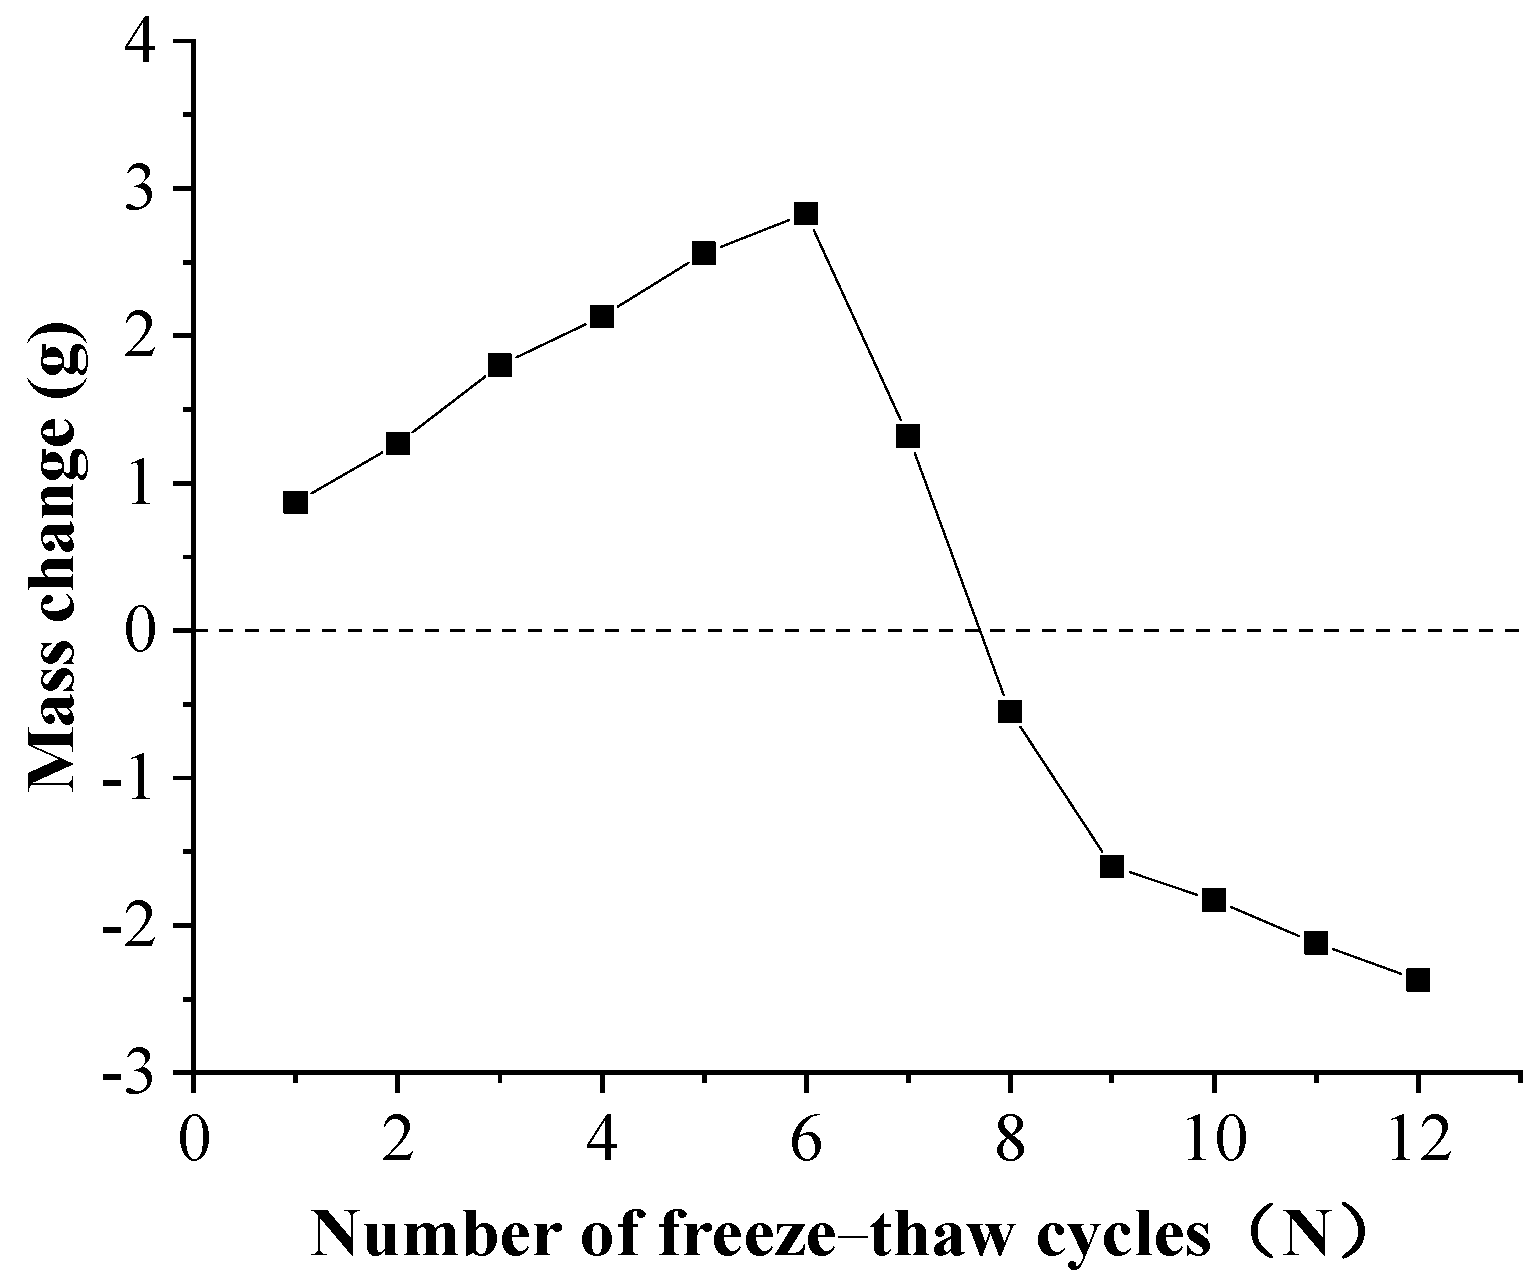
Figure 4 shows the appearance characteristics of cement-stabilized weathered sand under different freeze–thaw cycles. It can be seen from Figure 4b,c that the first three freeze–thaw cycles had almost no effect on the integrity of the specimen, and the specimen exhibits no obvious cracks or damage. Compared with when the number of freeze–thaw cycles is 1 (N = 1), the surface of the specimen at N = 3 is slightly rough, which indicates that under the effect of the early freeze–thaw action, the tiny particles on the surface of the specimen fell off, and this provided conditions for the intrusion of water into the interior. When N = 6, partial peeling occurred on the specimen surface (as shown in Figure 4d). When N = 9, the peeling area increased and extended to the interior, and large particles became exposed (as shown in Figure 4e). When N = 12, the peeling area and depth developed further, and the specimen degraded seriously and lost its integrity (as shown in Figure 4f).

3.1.2. Mass Change

In the process of freezing and thawing, the mass of the specimen changed because of water intrusion and particle shedding. Under repeated freeze–thaw action, with the continuous development of the pore structure inside the specimen, water migrated to the interior. The increased water was involved in the hydration of the cement and remained in the new crack, resulting in the increase of specimen mass. When the freeze–thaw action started to damage the structure of the specimen, the surface particles gradually peeled off, and the mass of the specimen itself was defective. If the defect amount was greater than the amount of water entering, the overall mass of the specimen decreased.
Taking the mass of the specimen before the freeze–thaw cycles test as the reference value, the mass change is defined as the difference between the mass of the specimen after the freeze–thaw cycles and the reference value. Figure 5 shows the effect of freeze–thaw cycles on the mass of the stabilized weathered sand specimens. It can be seen from Figure 5 that the mass change of specimens increased linearly during the first six freeze–thaw cycles. When N = 7, the mass of the specimen began to decline, but it was still greater than the reference value, indicating that when N ≤ 7, the leading factor affecting specimen mass was the amount of water entering, and the number of particles shedding at this stage was small. When N ≥ 8, specimen mass continued to decline and the mass change was negative. At this time, the hydration reaction and water migration were basically complete, and the macroscopic deterioration of the specimen was aggravated. The controlling factor of mass change was particles shedding. Wang et al. [35] attributed the reasons for the mass changes caused by freeze–thaw action to four factors: the amount of water migration, the amount of chemical reaction, the number of specimen defects, and the number of freeze–thaw cycles.

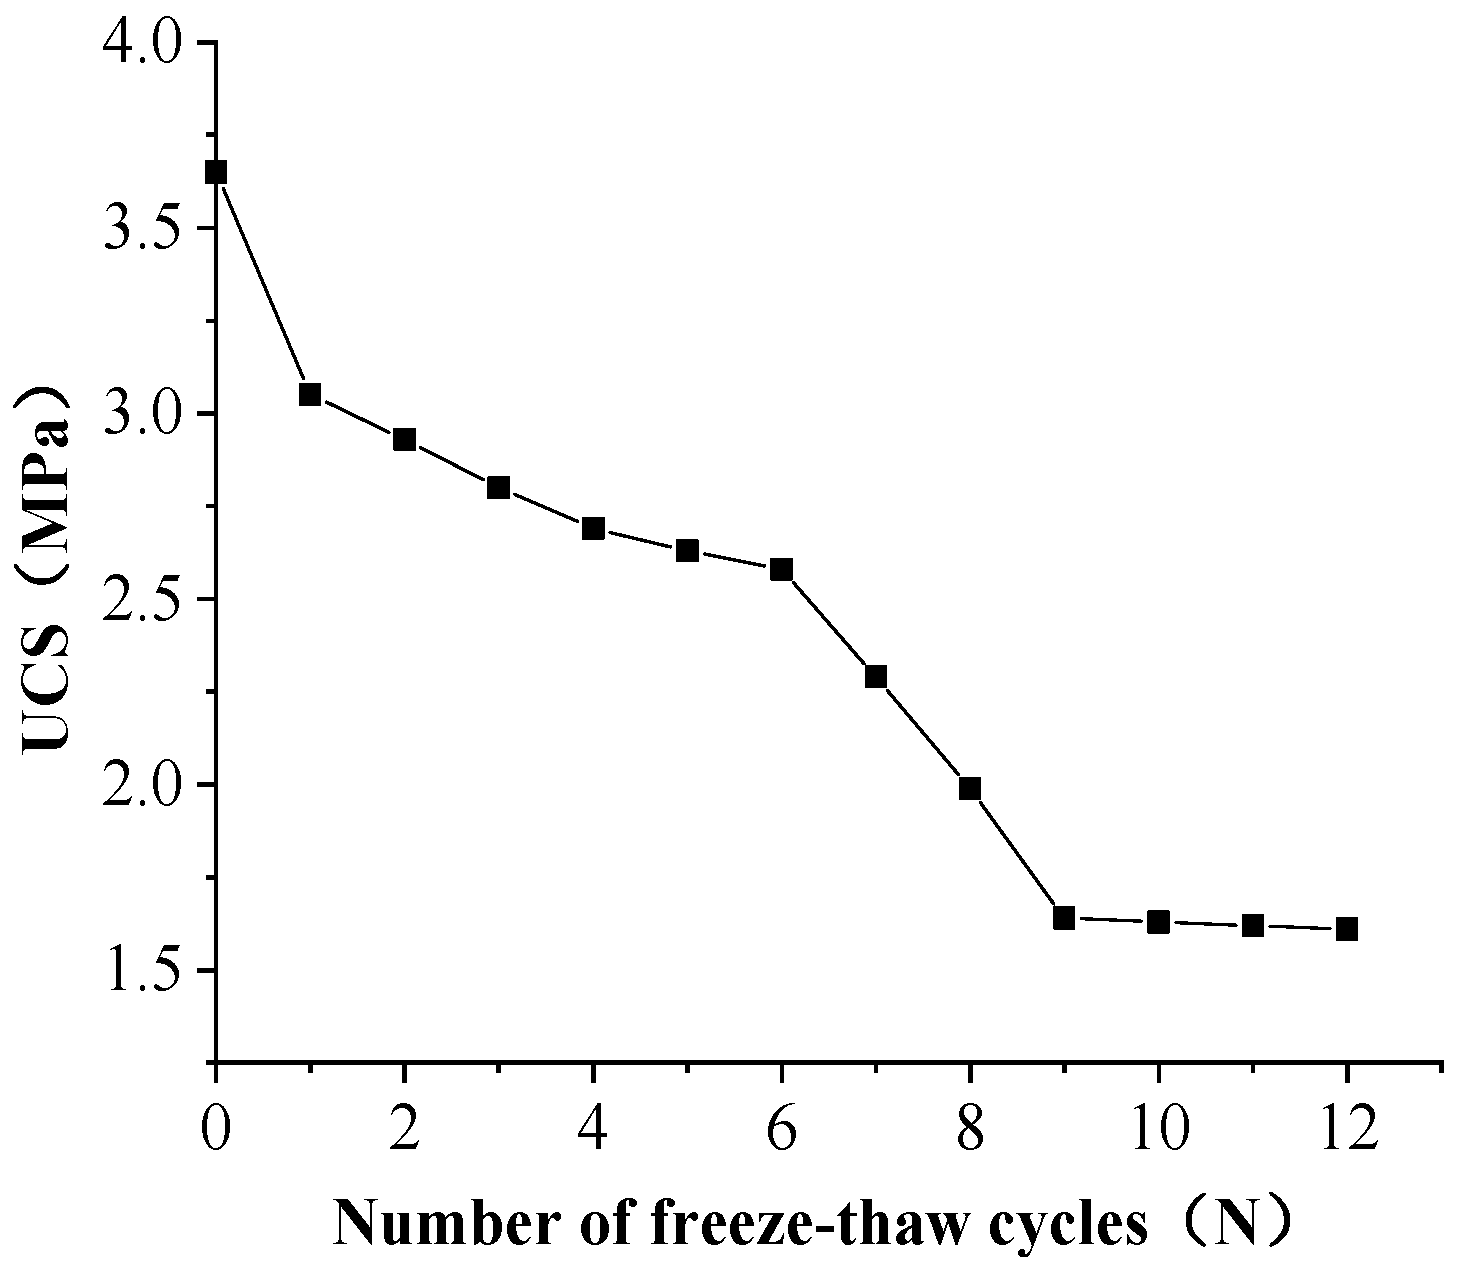
3.1.3. Loss of Strength

The effect of freeze–thaw action on the compressive strength of the stabilized weathered sand is shown in Figure 6. It can be seen from Figure 6 that as the number of freeze–thaw cycles increased, the unconfined compressive strength of the specimen gradually decreased. The strength of the specimen that did not undergo freeze–thaw action (N = 0) was 3.65 MPa, when N = 1, 3, 6, 9, 12, the corresponding compressive strengths were 3.05, 2.74, 2.58, 1.64, and 1.61 MPa, and the strength loss rates were 16.44%, 24.93%, 29.32%, 55.07%, 55.89%, respectively. It can be seen that when N = 9, the compressive strength of the specimen was greatly reduced and most of the bearing capacity was lost, indicating that the structure of the stabilized weathered sand had been greatly damaged, which is consistent with the law of the surface appearance and mass change of the specimen. After N = 9 times, increasing the number of freeze–thaw cycles had little influence on the strength of the specimens. For example, the strength loss rate at N = 12 was only 0.82% higher than that at N = 9.
With the rapid development of machine learning (ML), there have been various studies using machine learning to build predictive models and optimize material responses. For example, artificial neural network (ANN) was used to establish the prediction model of soil–water characteristic curve (SWCC) to study the influence of biochar on soil water retention [36]. ANN was used to predict the fracture behavior of granular polymer composites under different loading rates [37]. The combination of gas sensor array (GSA) and artificial intelligence (AI) algorithm is applied in the fields of environmental detection, food production, and explosive detection [38], and optimizing battery design based on machine learning (ML) models [39]. In the following research, it will be an interesting inspiration to use machine learning (ML) to find the optimal response of weathered sand.

3.2. Microscopic Characteristics of Stabilized Weathered Sand

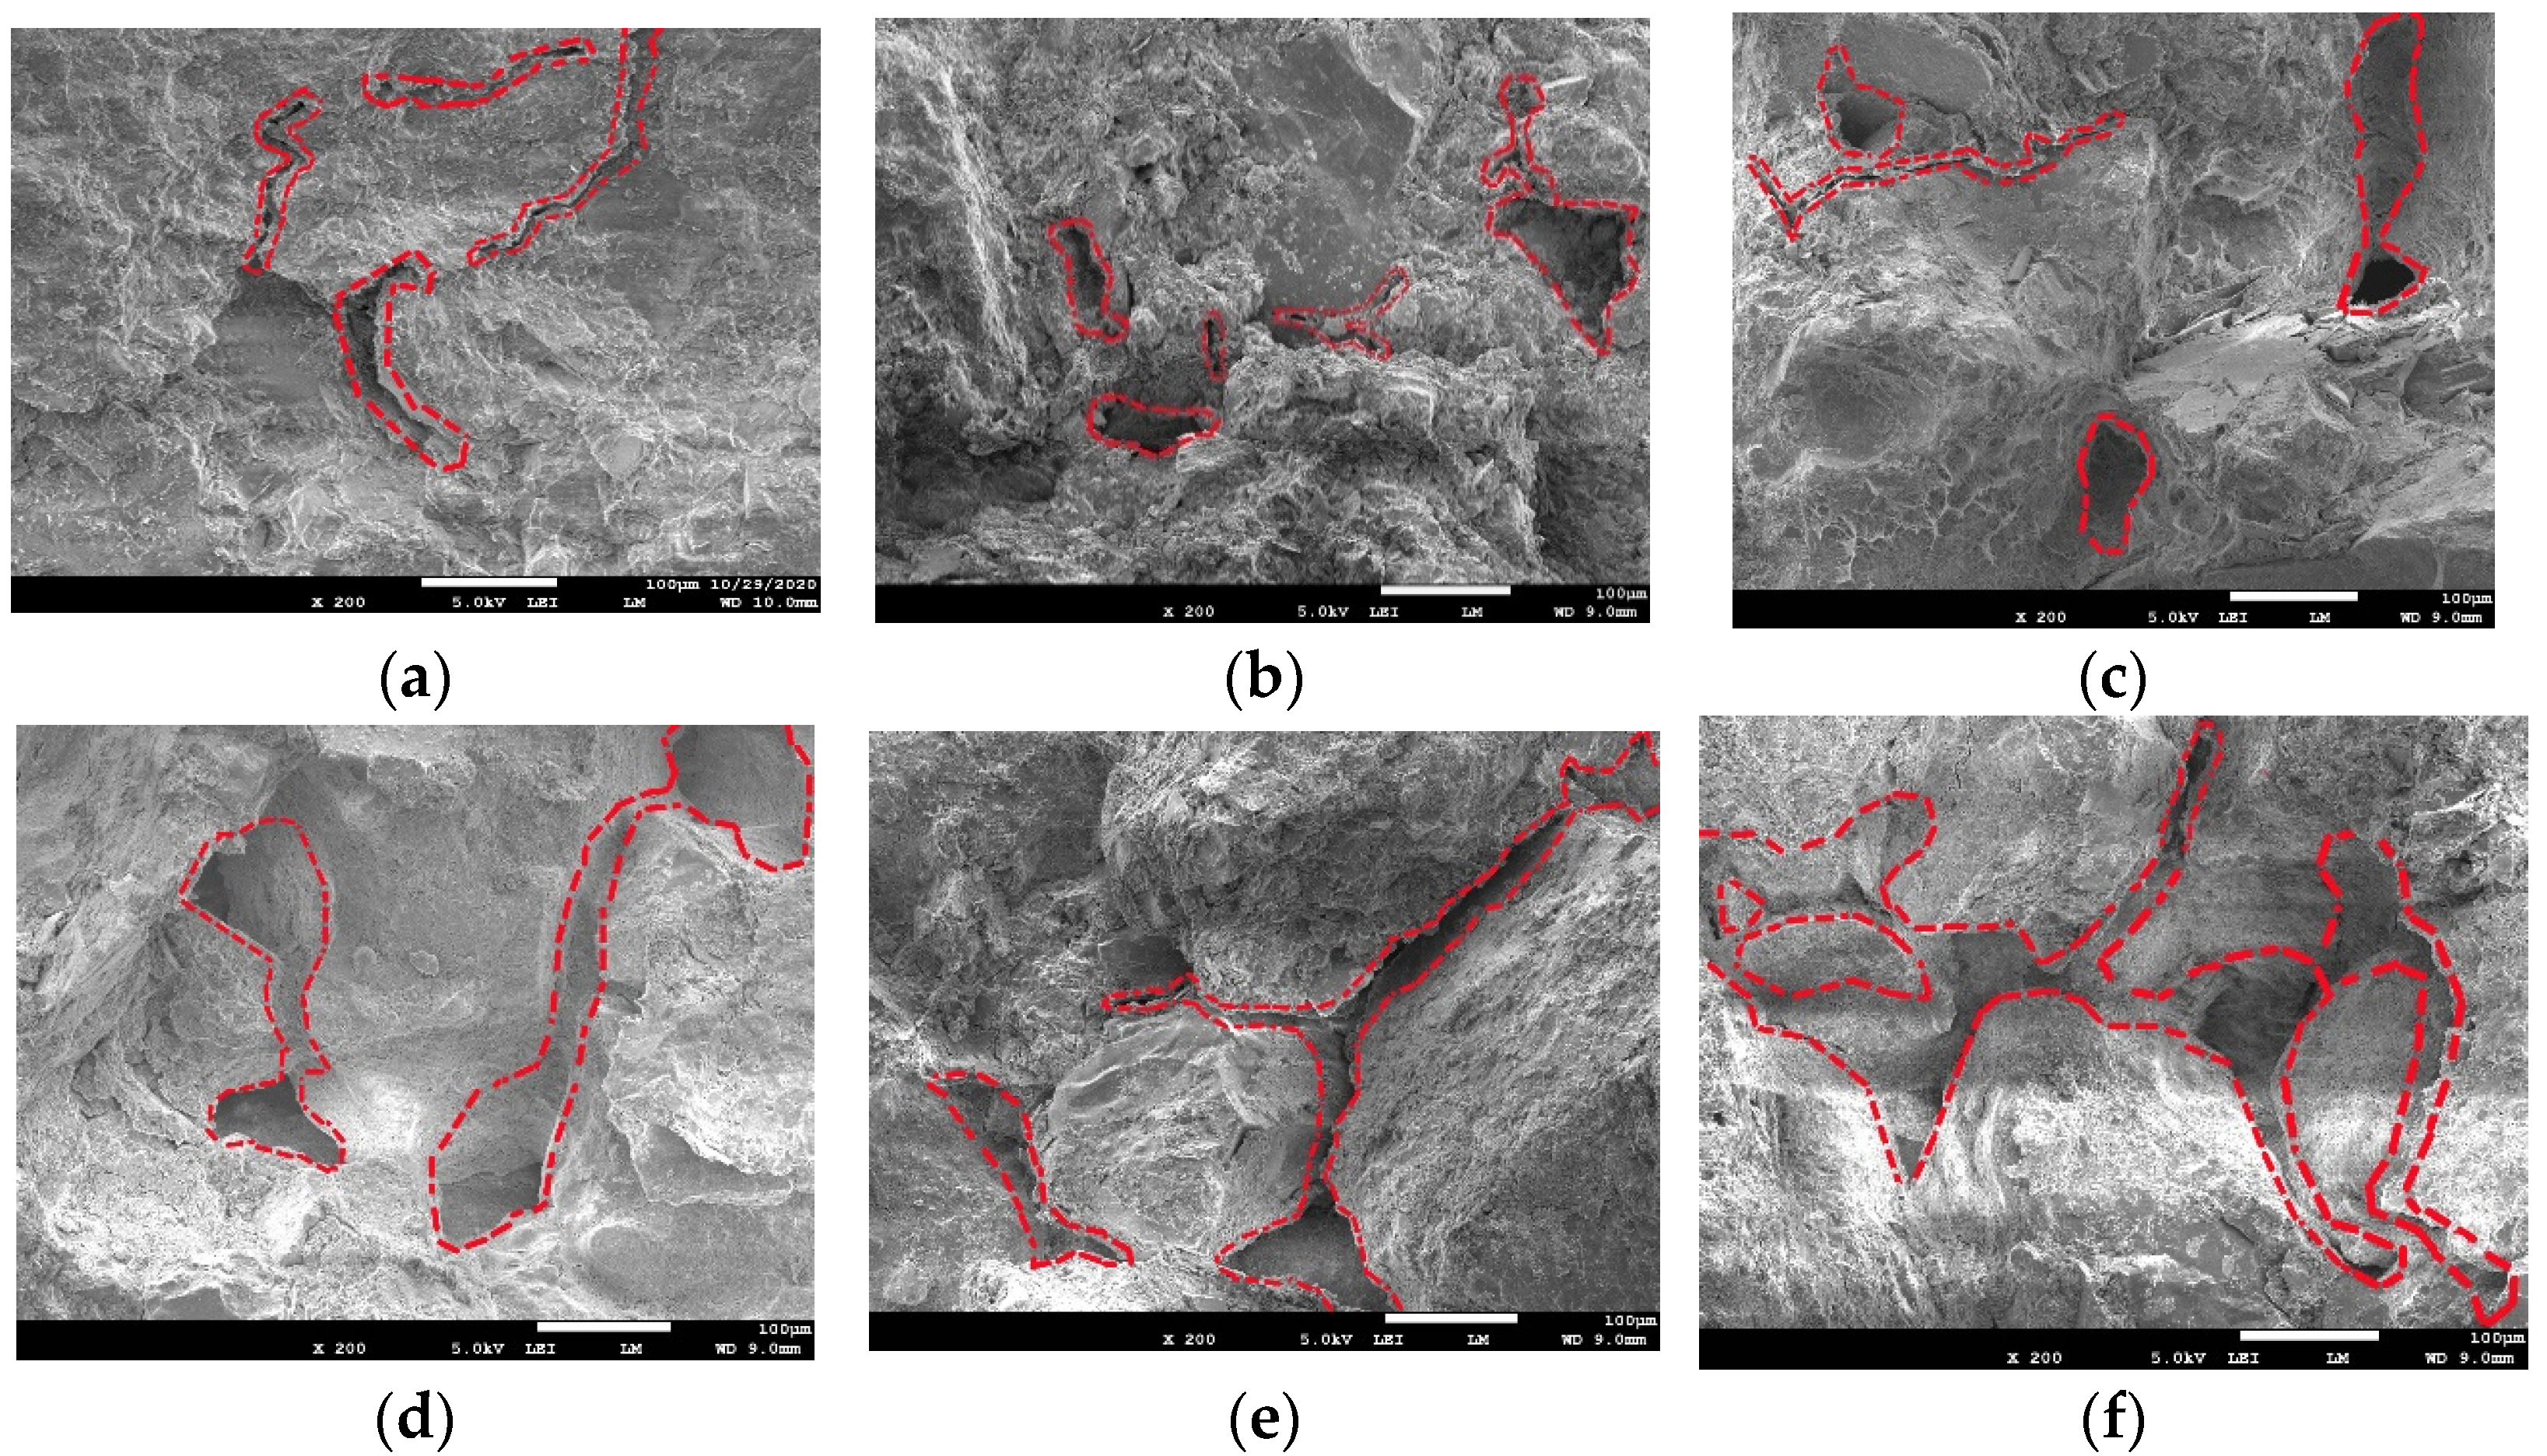
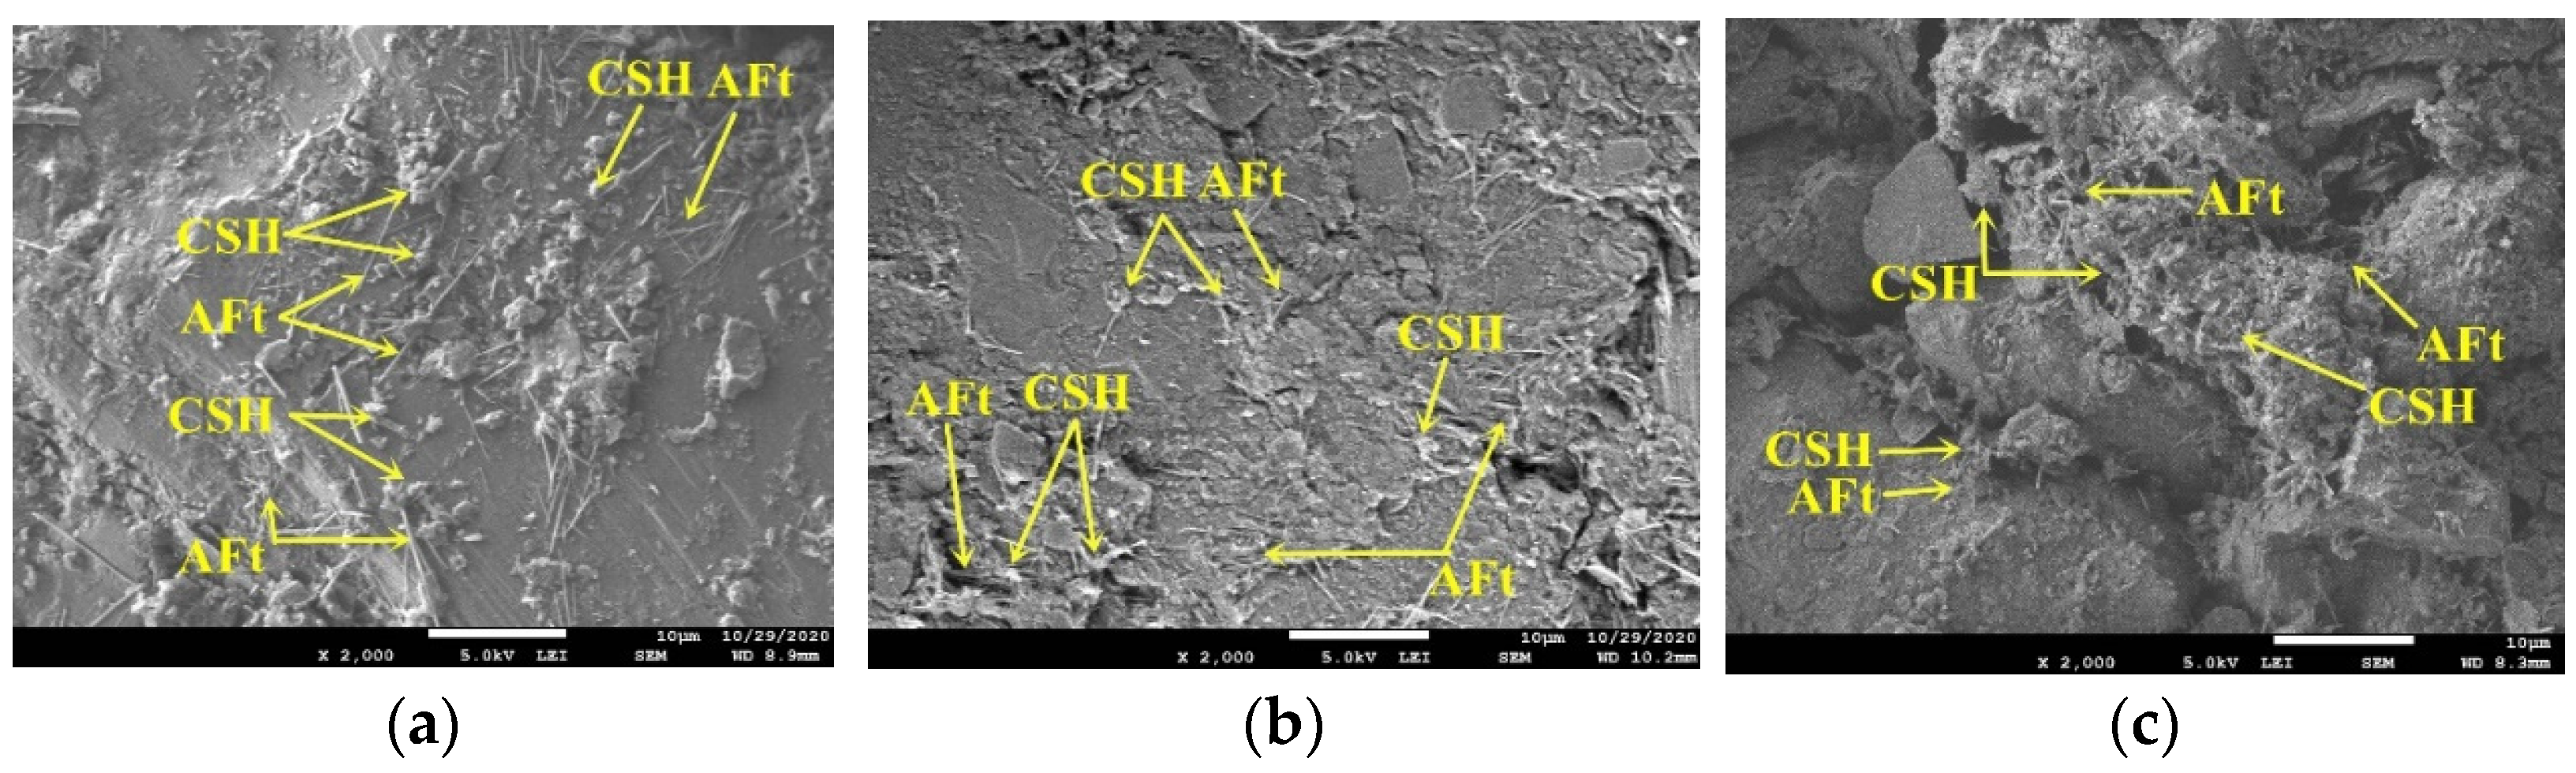
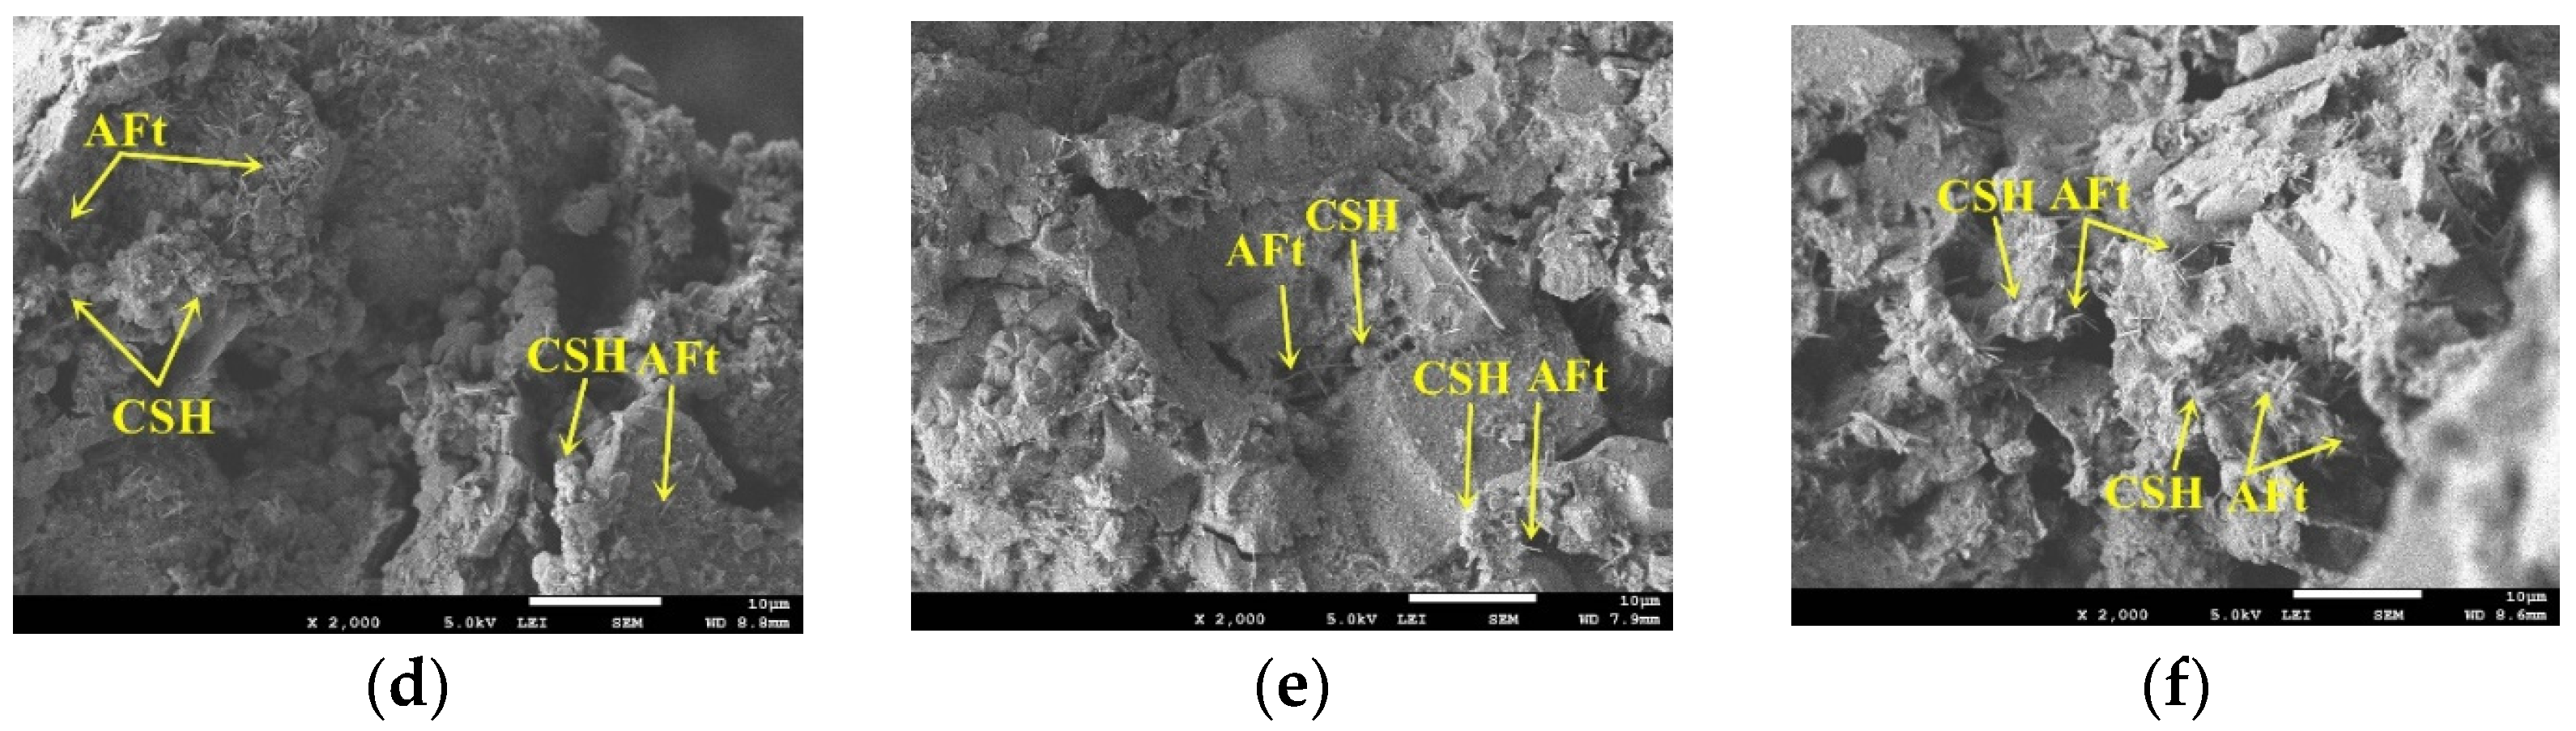
3.2.1. Evolution Characteristics of the Microstructure

Figure 7 and Figure 8 are SEM images of stabilized weathered sand under different freeze–thaw cycles, magnified 200 times and 2000 times, respectively. It can be seen from Figure 7 that the specimen at N = 0 has fewer pores and has a compact and dense structure. As the number of freeze–thaw cycles increased, the fine particles wrapped around the coarse particles or filled between the skeletons decreased. When N = 6, the continuous ‘gullies’ and large pores made the skeleton interface of coarse particles clearer, and the bonding effect between particles weakened. According to the figures, When N = 9, 12 times, the fine particles are further lost, some particles are displaced, and the cracks are interconnected.
As can be seen from Figure 8, the specimen at N = 0 contains a large amount of floccule calcium silicate gel (CSH) and acicular ettringite (AFt) produced by cement hydration. CSH gel and AFt crystal interweaved with each other to fill gaps and the contact between particles is extremely tight. With the increase of the number of freeze–thaw cycles, cracks gradually increased, and hydration products were constantly lost. It is difficult for CSH and AFt to fill the pores, and the specimen changed from a stable compact structure to a skeleton structure with multiple cracks and multiple pores.

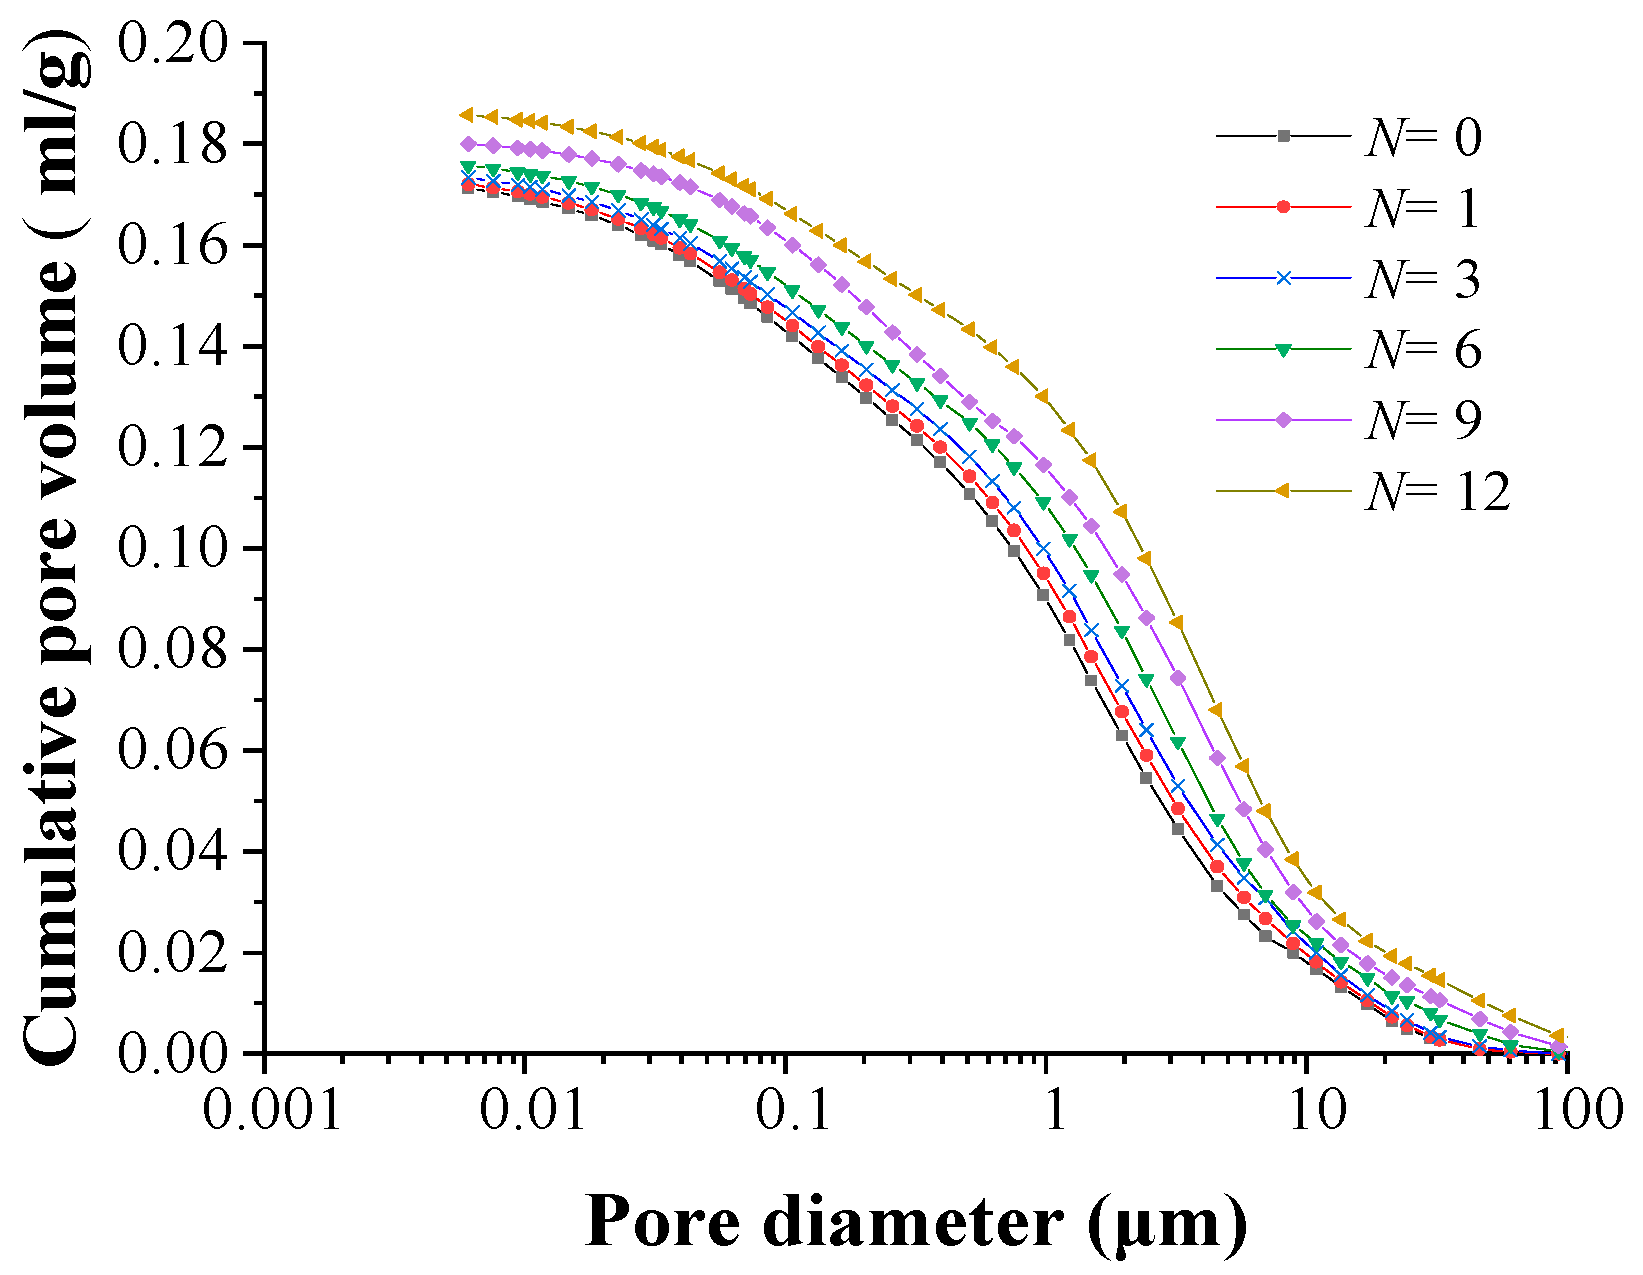
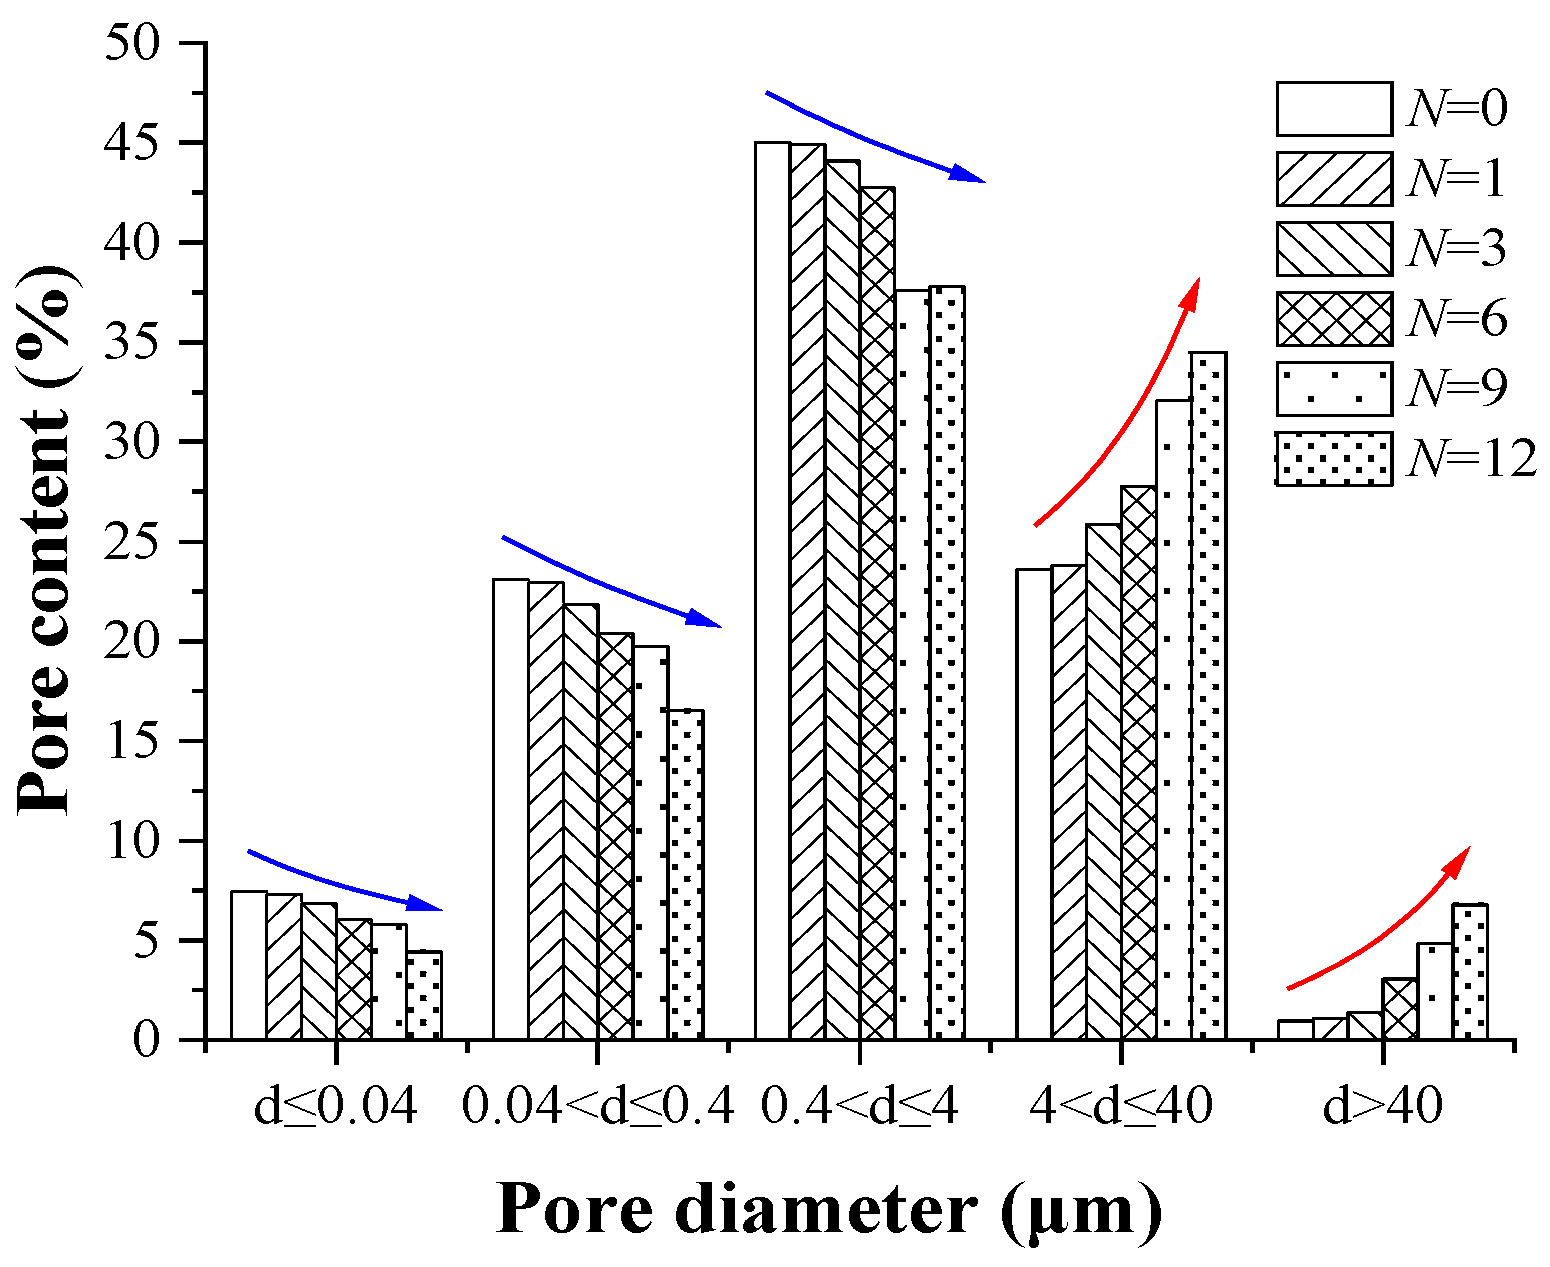
3.2.2. Evolution Characteristics of Pore Diameter

The results of the mercury intrusion porosimetry test (MIP) are shown in Figure 9. As can be seen from Figure 9, the cumulative pore volume increased with the increase of the number of freeze–thaw cycles. When N = 0, the cumulative mercury intake was 0.171 mL/g, and when N = 12, it reached 0.186 mL/g, increasing by 0.015 mL/g. The increase in cumulative pore volume indicates that under the action of freeze–thaw cycles, the pores inside the specimen gradually expanded and increased, making the structure loose, which is consistent with the SEM analysis results. The shape of the pore distribution curve under different freeze–thaw times is roughly the same. The curve is the steepest in the interval of 0.7–8.0 μm, and the cumulative pore volume changed greatly, indicating that most of the pores are within this interval.
To facilitate further analysis, pores were divided into five categories according to the pore diameter d: micro pores (d ≤ 0.04 μm), small pores (0.04 μm < d ≤ 0.4 μm), medium pores (0.4 μm < d ≤ 4 μm), large pores (4 μm < d ≤ 40 μm), and super large pores (d > 40 μm). The distribution of various pore contents (the percentage of each pore volume in the total pore volume) is shown in Figure 10. As can be seen from Figure 10, most pores were medium pores. With the increase of freeze–thaw times, the pore content of d ≤ 4 μm (including micro pores, small pores, and medium pores) decreased, while the pore content of d > 4 μm (large pores and super large pores) increased. When N ≤ 9, the relationship of all kinds of pore content was medium pore > large pore > small pore > micro pore > super large pore. When N = 12, the relationship of pore content was medium pore > large pore > small pore > super large pore > micro pore. When N = 12, the micro, small, medium, large and super large pore contents were 4%, 16%, 38%, 35%, and 7%, respectively. Compared with N = 0, the pore volume changed by −3%, −6%, −7%, +10%, and +6%, respectively.
From the overall trend of change, the effect of freeze–thaw cycles on pore diameter takes d = 4 μm as the dividing line. With the increase of the number of freeze–thaw cycles, micro pores, and micro cracks continued to expand and extend, and then penetrate to form large pores. As a result, the pore content of d ≤ 4 μm continued to decrease, while that of d > 4 μm continued to increase.

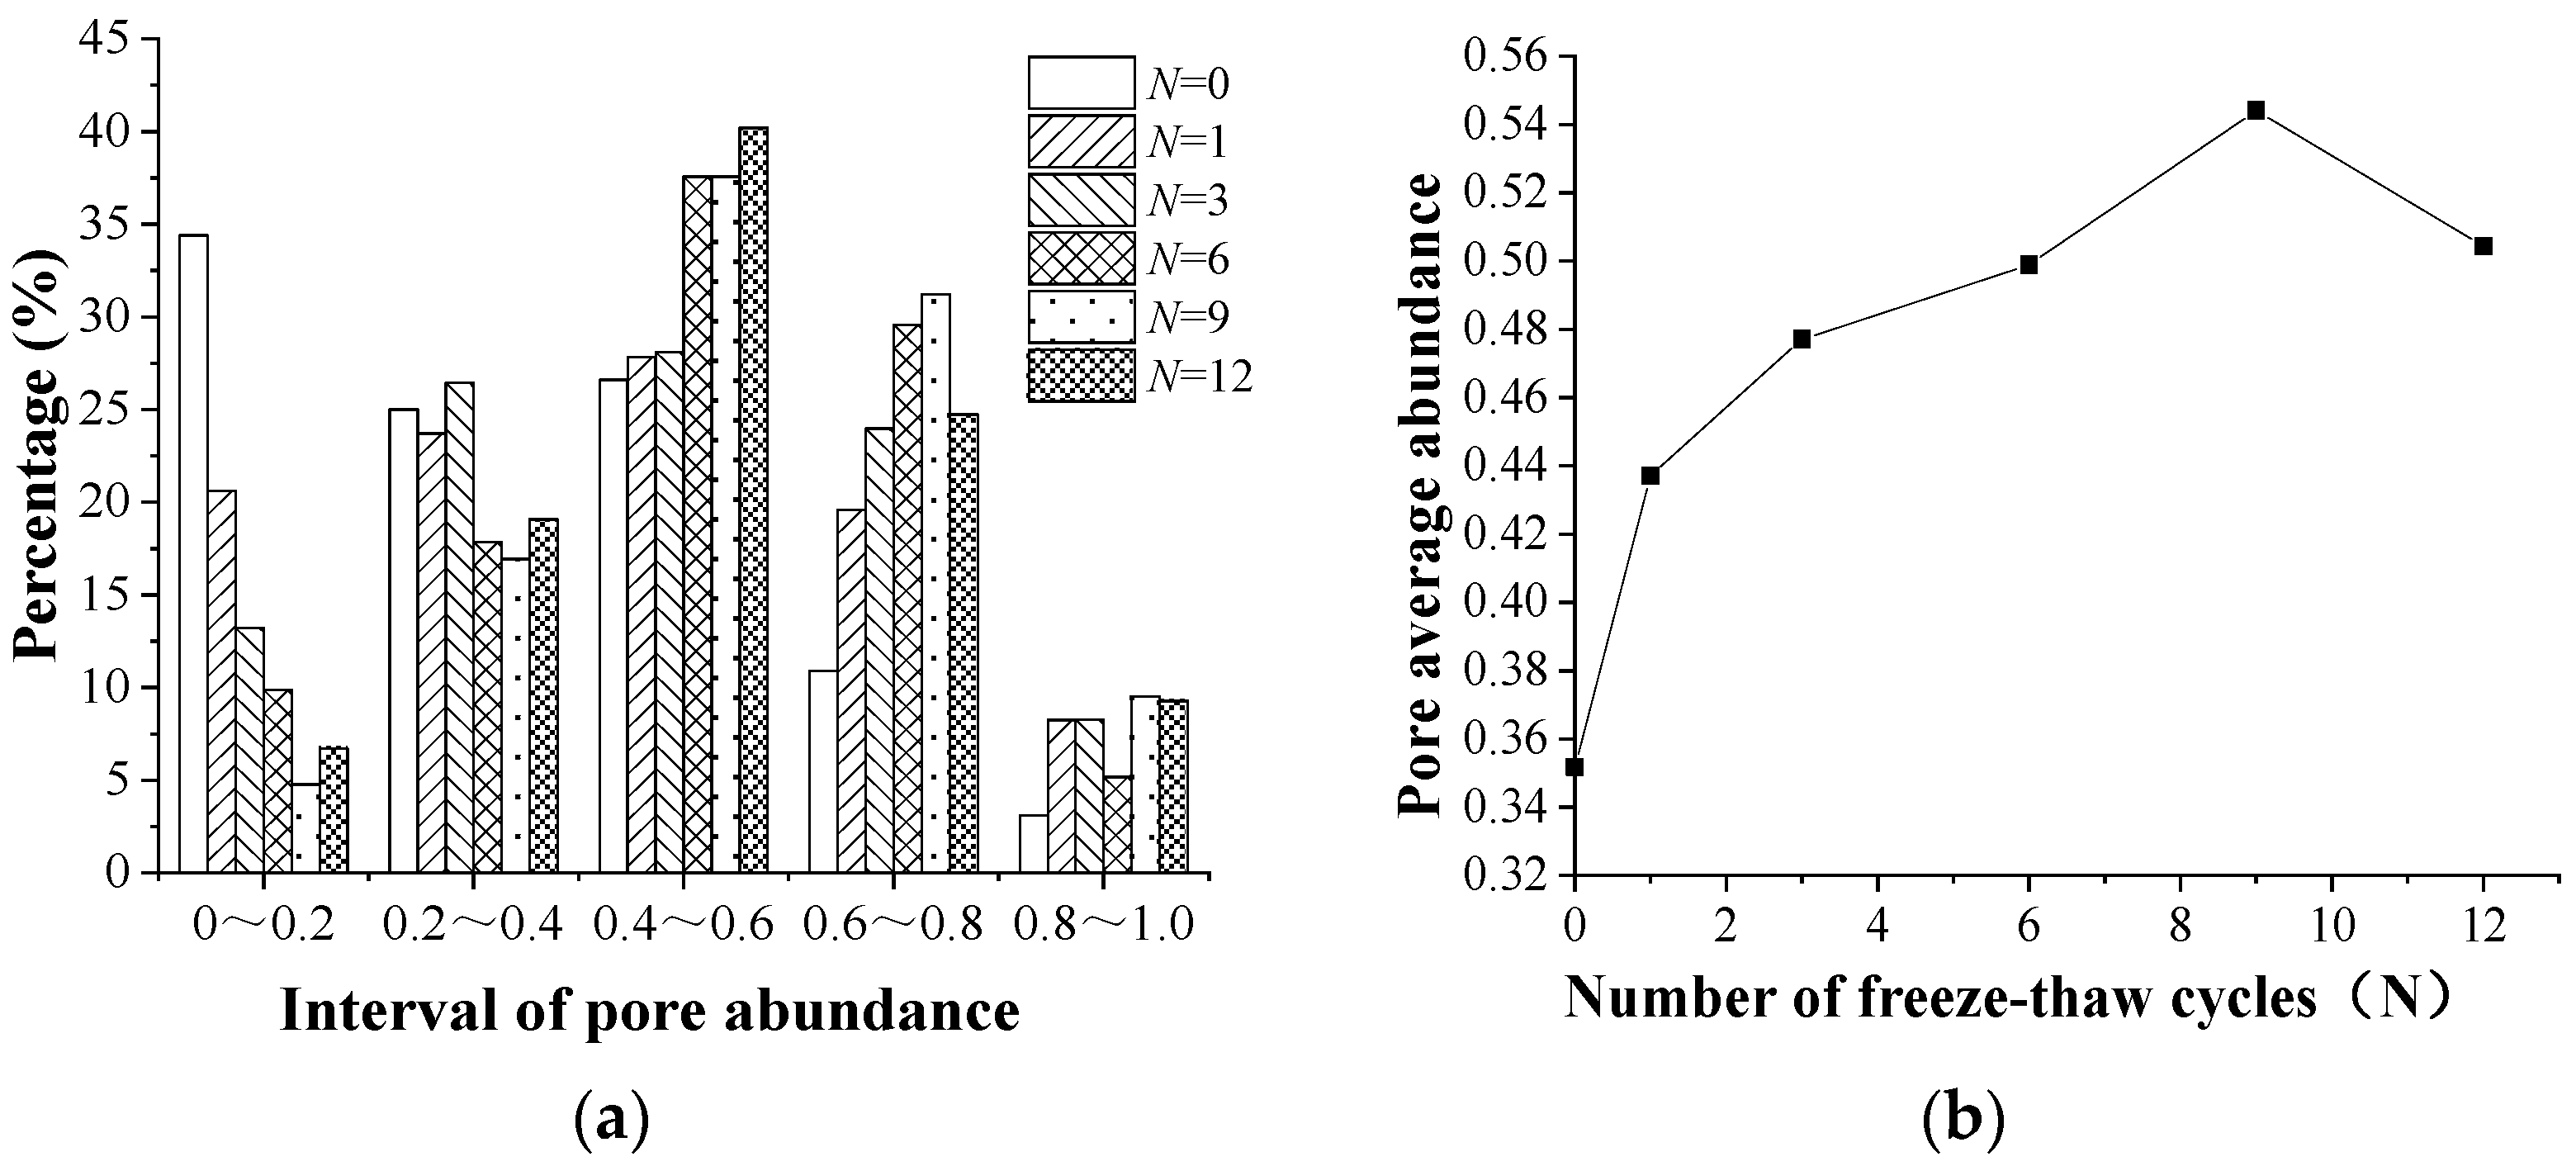
3.2.3. Evolution Characteristics of Pore Shape

Figure 11 shows the variation of pore abundance and average abundance under different freeze–thaw cycles. It can be seen from Figure 11a that the pore abundance is concentrated in the range of 0.2–0.4, 0.4–0.6, and 0.6–0.8, indicating that the pores were mainly oblate and oval under the freeze–thaw action. With the increase of the number of freeze–thaw cycles, the content of pore abundance in the range of 0–0.2 decreased, while that in the range of 0.4–0.6 increased, indicating that the narrow and long pores gradually changed into ovals during freeze–thaw cycles.
As shown in Figure 11b, with the increase of the number of freeze–thaw cycles, the average abundance of pores first increased and then decreased. The reason is that during the freeze–thaw cycles, water in the pores freezes and expands at low temperature, leading to pores and cracks not developing in a single direction, but gradually connecting with each other. The pore volume increases and the shape of elongated pores changes to oval. After nine cycles, the structure of stabilized weathered sand was destroyed, the oval pores turned to elongated pores, and the average abundance of pores decreased.

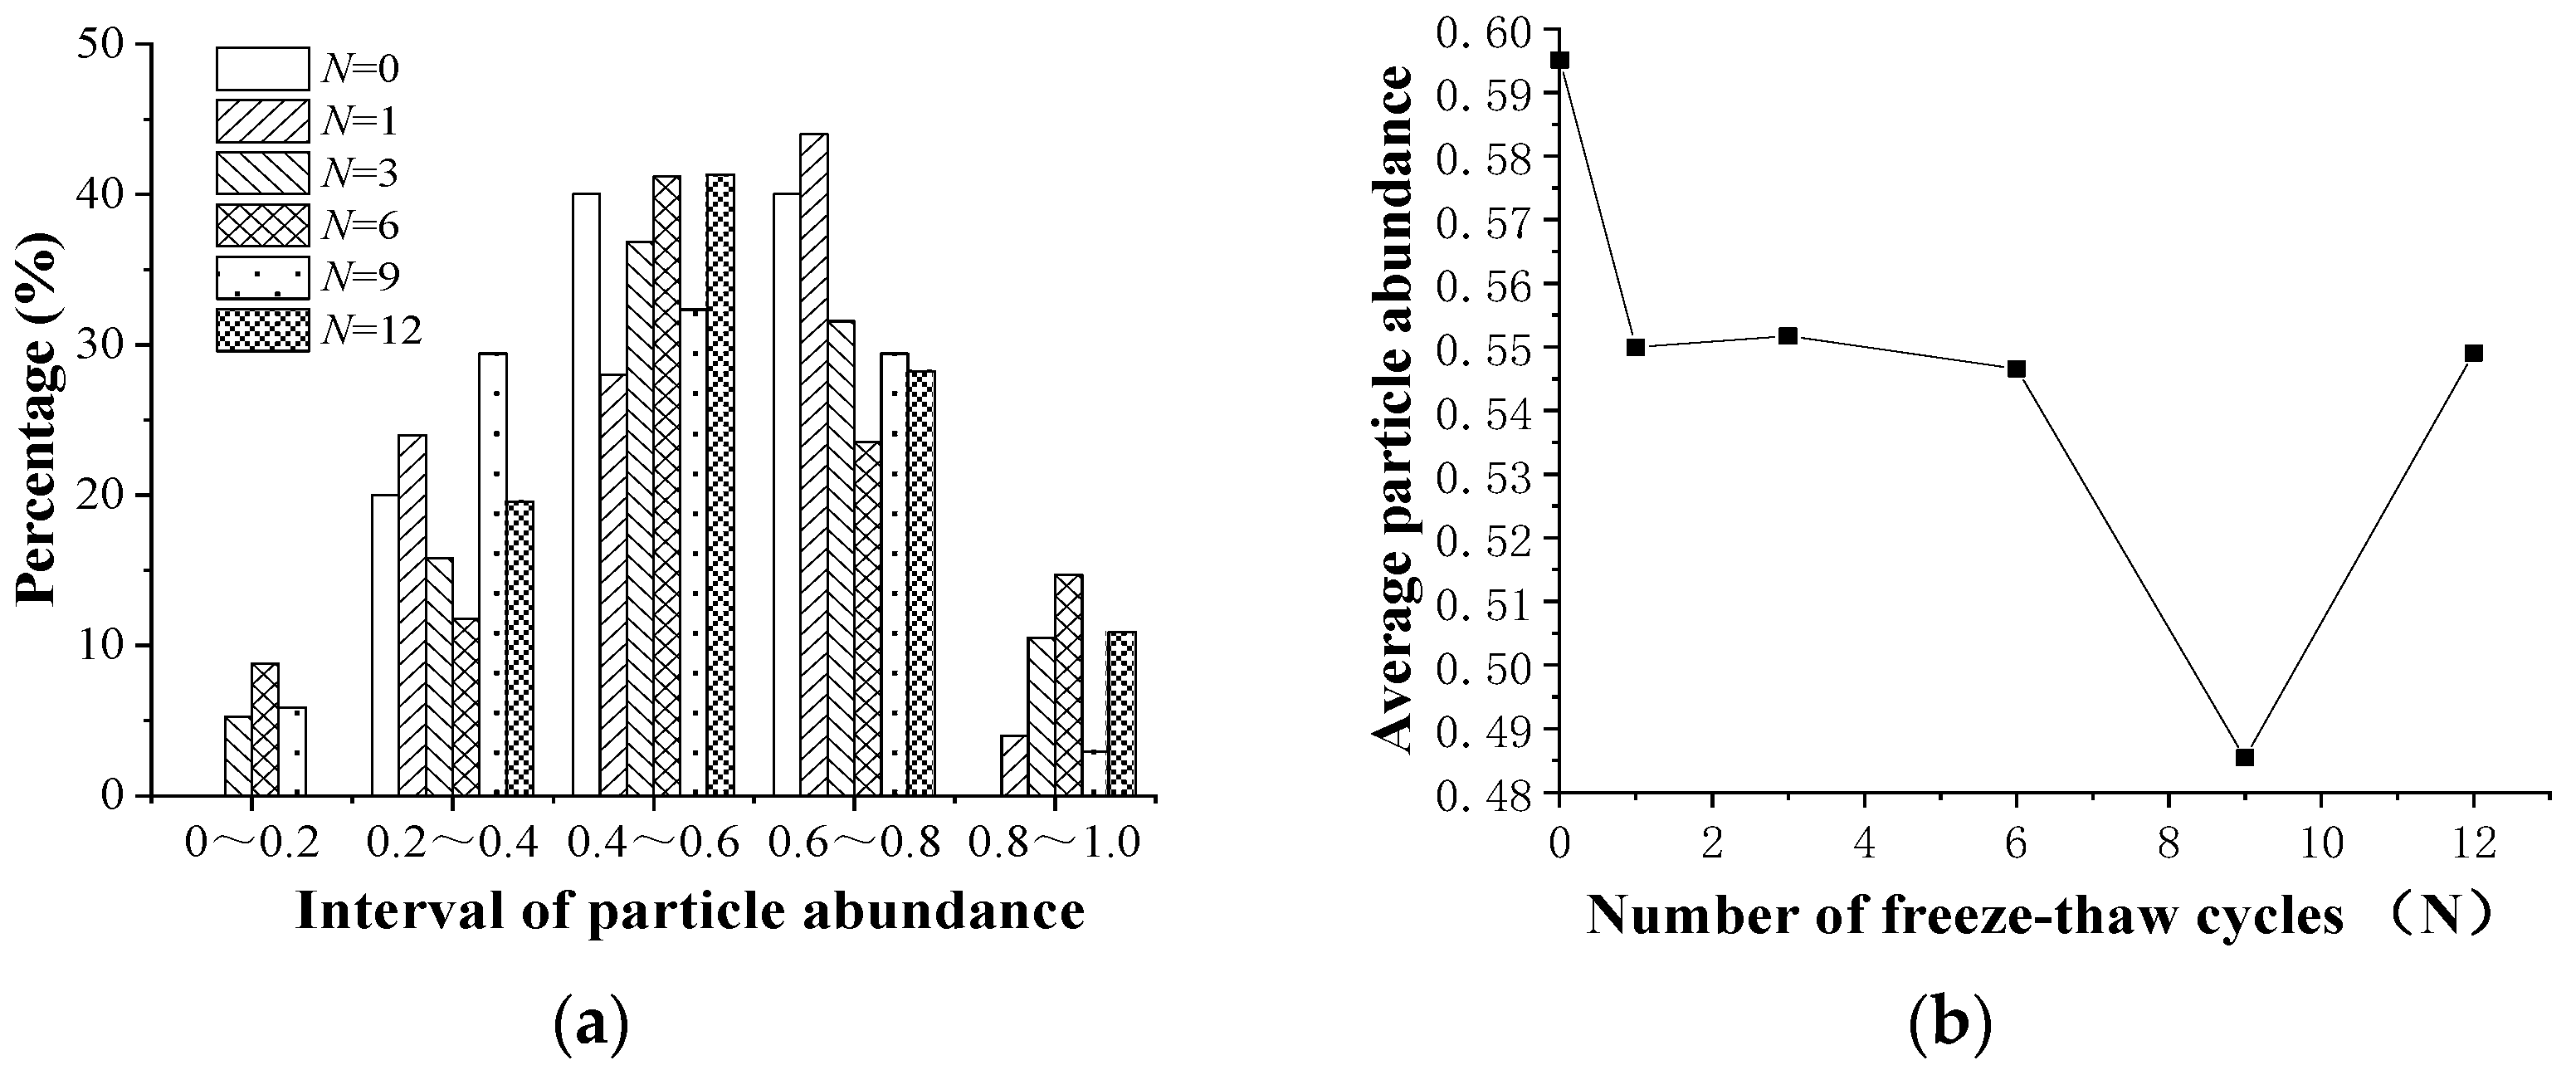
3.2.4. Evolution Characteristics of Particle Shape

Figure 12 shows the variation rules of particle abundance and average particle abundance under different freeze–thaw cycles. It can be seen from Figure 12a that the particle abundance is concentrated in the range of 0.2–0.4, 0.4–0.6, and 0.6–0.8, and a small amount appear in the range of 0–0.2, indicating that there were few elongated particles and most of the particles were oblate and oval.
It can be seen from Figure 12b that the average abundance of sample particles first decreased and then increased during the freeze–thaw cycles. The reason is that the hydration products and aggregates attached to the particle surface, gradually falling off and dissolving under the freeze–thaw action, which makes the particle shape become irregular, and the average abundance shows a downward trend.
When the freeze–thaw cycles progressed to a certain extent (N = 9), the cements on the surface of particles had basically disappeared, the surface became smooth, and the particles began to develop into a flat shape, so the average abundance of particles increased.

4. Deterioration Mechanism

The main components of weathered sand are quartz and sodium aluminosilicate, which hydrate with cement to form CSH gel and ettringite AFt. In cement-stabilized weathered sand that has not undergone freezing and thawing, CSH gel and AFt crystals fill the internal pores and cracks, sealing some of the pores to a certain extent. Furthermore, the hydration cement adheres to the surface of the particles and strengthens the connection between them. During the freeze–thaw cycles, freezing and thawing occur alternately. The pore water inside the specimen freezes and forms ice crystals at low temperature, and the resulting frost heaving force destroys the hydration cement between particles, making the pore structure inside the specimen develop continuously. As the temperature rises, the solid ice crystals change into liquid, and to a lesser extent, gas, and the melted liquid water enters the new pores created by frost heaving. With the increase of the number of freeze–thaw cycles, the periodic frost heaving force leads to cracks in the hydration cements, which continue to expand until broken, and dissolve in the melting liquid water environment. As a result, the cementation force between particles decreases, the pore structure develops significantly, and the macro level consequences are particle peeling and strength reduction.
The performance deterioration caused by freezing and thawing is a process of micro damage accumulation, mainly due to the generation and expansion of micro cracks and micro pores. The freeze–thaw damage of cement-stabilized weathered sand can be summarized as follows: internal pores → the alternating effects of frost heaving and thawing settlement leads to the development of pores and the migration of water to the interior → under freeze–thaw conditions, the cements are successively dissolved and the loss of cementation force decreases → crack expansion and connection → surface looseness and peeling, and the damage continues to develop to the interior. The freeze–thaw deterioration process is shown in Figure 13.

5. Conclusions

Based on laboratory tests, the macroscopic degradation laws and microscopic characteristics of cement-stabilized weathered sand under the action of freeze–thaw cycles were analyzed, and the following conclusions can be drawn:
(1)
Early freeze–thaw action caused tiny particles on the surface of the specimen to peel off. As the number of freeze–thaw cycles increased, the peeling area and depth of the specimen expanded further until the specimen lost its integrity.
(2)
When N ≤ 7, the mass change of the specimen was positive, and the dominant factor affecting specimen mass at this stage was the amount of water entering. When N ≥ 8, the mass change of specimen was negative, and the controlling factor of the mass change was particles shedding.
(3)
As the number of freeze–thaw cycles increased, the unconfined compressive strength of the specimens decreased gradually. When N = 9, the strength loss rate of the specimen was 55%. After that, the freeze–thaw action had less influence on the strength of the specimen.
(4)
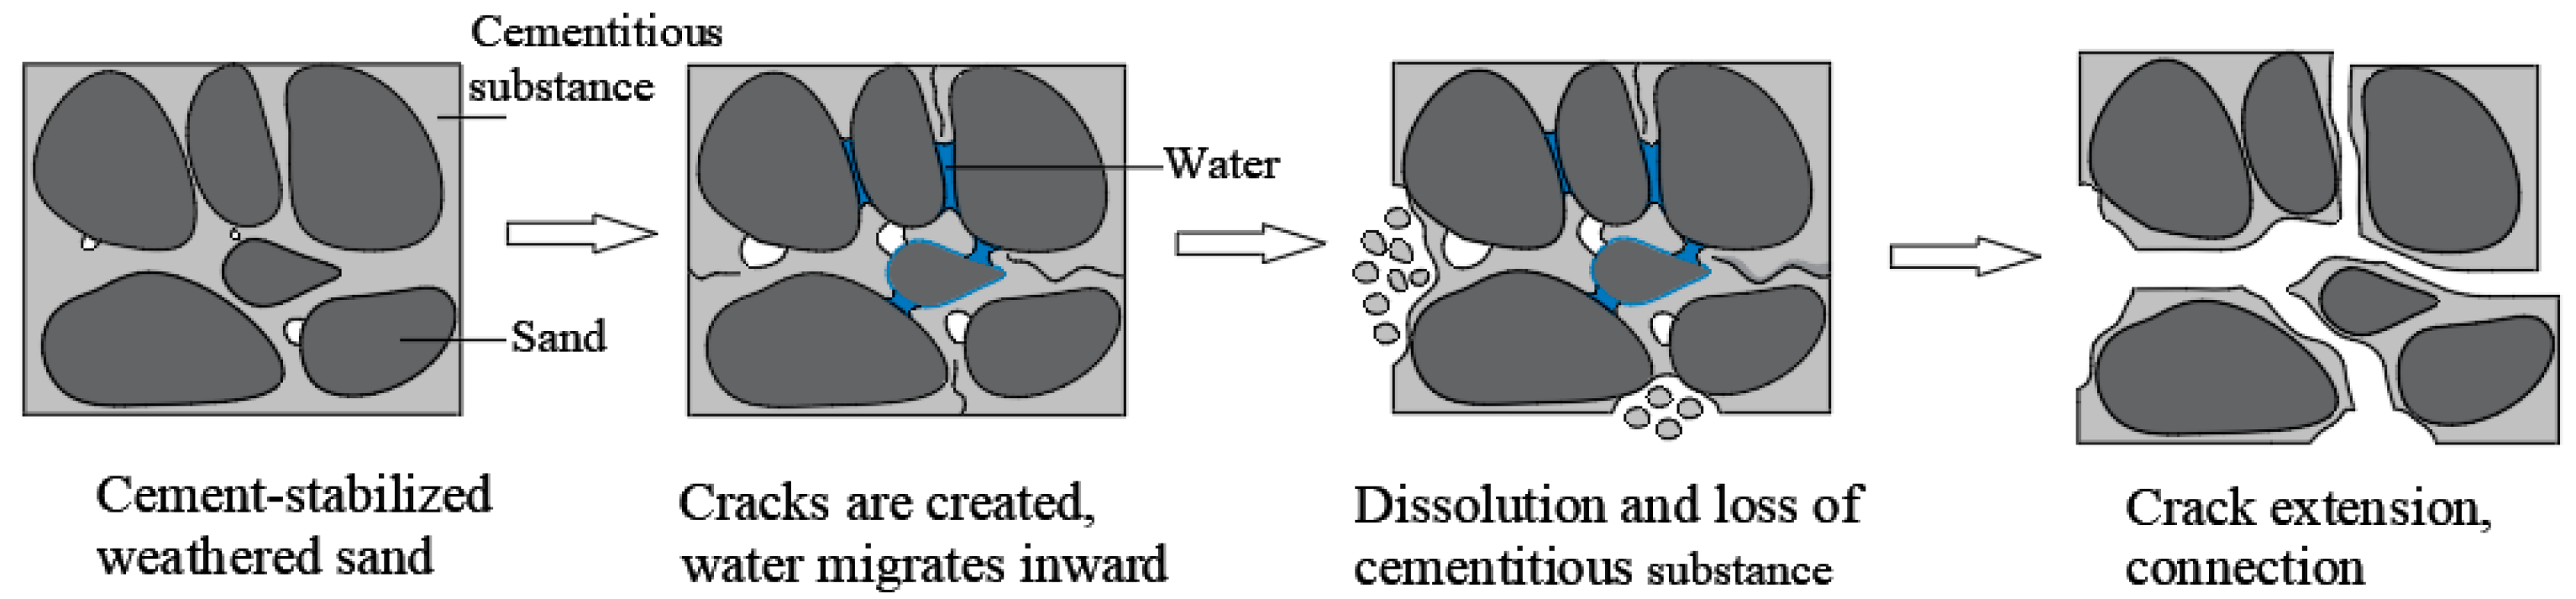
The freeze–thaw action caused the loss of fine particles and hydration products wrapped or filled around the coarse particles, leading to continuous accumulation and expansion of micro cracks and micro pores, and then interpenetrated to form large pores. In this process, the particle skeleton of the stabilized weathered sand changed from dense structure to porous structure.
(5)
When N ≤ 9, the average abundance of pores inside the specimen increased with the increase of number of freeze–thaw cycles, while the average abundance of particles decreased. The main reason is that the freeze–thaw action made the pores expand and connect, and at the same time, the cements attached to the particles’ surface continuously dissolves. When N > 9, the development trend of pore and particle abundance changed due to the damage of soil structure.
(6)
For cement-stabilized weathering sand, the performance deterioration caused by freeze–thaw cycles is a process of continuous accumulation of micro damage. The pore water inside the specimen is constantly transformed between ice crystals and liquid, and the frost heaving and shrinkage caused by this change weaken the connection between particles, which makes the internal pores develop and expand continuously.
In engineering application, cement content varies in different application scenarios. Further study is needed on the deterioration of stabilized weathered sand with different cement content under freeze–thaw conditions. In addition, with the development of new technology, machine learning (ML) methods can be considered to find the best response of weathered sand materials.

Author Contributions

Conceptualization, X.K. and W.H.; Methodology, S.C.; Validation, S.C., G.W. and Y.L.; Formal analysis, S.C.; Investigation, X.K.; Resources, W.H. and Z.Z.; Data curation, G.W. and Y.L.; Writing original draft, X.K.; Writing review, Z.Z.; Supervision, W.H. All authors have read and agreed to the published version of the manuscript.

Funding

This research was funded by Key Research and Development Project of Shandong (grant no. 2020CXGC011404); and Science and Technology Program of Higher Education in Shandong Province (grant no. J18KA216).

Institutional Review Board Statement

Not applicable.

Informed Consent Statement

Not applicable.

Data Availability Statement

The data presented in this study are available on request from the corresponding author.

Conflicts of Interest

The authors declare no conflict of interest.

References

  1. Yang, J.; Liu, S.; Zhang, G. Experimental study on CBR value of weathered sand in the Three Gorges Reservoir area stabilized by cement. J. Yangtze River Sci. Res. Inst. 2016, 33, 98–101. [Google Scholar]
  2. Xiong, G.; Li, Q.; Fan, Y.; Song, J. Long-term stability test of Maopingxi weathered sand in the Three Gorges. J. Yangtze River Sci. Res. Inst. 1999, 16, 23–27. [Google Scholar]
  3. An, Y. Application of Stabilized Weathered Sand in Expressway. Master’s Thesis, Chang’an University, Xi’an, China, 2005. [Google Scholar]
  4. Guo, Y.; An, Y.; Liu, G. Research on the road performance of cement stabilized weathered sand. China Foreign Highw. 2005, 25, 52–54. [Google Scholar]
  5. Wang, X.; Yang, S.; Chen, C. Application of weathered sand filling at Jiangxia avenue in Three Gorges dam area. Yangtze River 2001, 32, 16–17. [Google Scholar]
  6. Yang, J.; Yang, Z.; Zhang, G.; Tang, Y. Experimental study on swelling force of expansive soil improved by weathered sand. J. Chongqing Jiaotong Univ. (Nat. Sci.) 2014, 33, 106–109. [Google Scholar]
  7. Zhuang, X.; Wang, J.; Wang, K.; Li, K.; Hu, Z. Dynamic characteristics of weathered sand for improving expansive soil. Rock Soil Mech. 2018, 39, 149–156. [Google Scholar]
  8. Huang, M.; Xiong, J.; Tang, J.; Long, C. Experimental study on shear strength of expansive soil improved by lime-weathered sand. Appl. Mech. Mater. 2014, 2799, 1441–1447. [Google Scholar] [CrossRef]
  9. Yang, J.; Zhu, C.; Zhang, G. Experimental study on unconfined compressive strength of lime-ash stabilized weathered sand. J. Yangtze River Sci. Res. Inst. 2015, 32, 101–106. [Google Scholar]
  10. Yang, J.; Xiang, F. Cement stabilized weathered sand in the Three Gorges Reservoir area. Resilience modulus test and model evaluation. J. Chongqing Univ. 2016, 39, 132–139. [Google Scholar]
  11. Zaimoglu, A.S. Freezing-thawing behavior of fine-grained soils reinforced with polypropylene fibers. Cold Reg. Sci. Technol. 2010, 36, 63–65. [Google Scholar] [CrossRef]
  12. Lu, Y.; Liu, S.; Zhang, Y.; Li, Z.; Xu, L. Freeze-thaw performance of a cement-treated expansive soil. Cold Reg. Sci. Technol. 2020, 170, 102926. [Google Scholar] [CrossRef]
  13. Huang, M.; Duan, J.; Wang, J. Research on basic mechanical properties and fracture damage of coal gangue concrete subjected to freeze-thaw cycles. Adv. Mater. Sci. Eng. 2021, 2021, 6701628. [Google Scholar] [CrossRef]
  14. Jumassultan, A.; Sagidullina, N.; Kim, J.; Ku, T.; Moon, S.W. Performance of cement-stabilized sand subjected to freeze-thaw cycles. Geomech. Eng. 2021, 25, 41–48. [Google Scholar]
  15. Tian, Y.; Ma, B.; Wang, D.; Li, N. Frost resistance of cement stabilized crushed rock under freeze-thaw cycles. J. Chang’an Univ. (Nat. Sci.) 2017, 37, 84–91. [Google Scholar]
  16. Hao, Y.; Wen, H.; Fan, P.; Dong, X. Experimental study of freeze-thaw cycles on the strength of red mud-steel slag modified cement soil. J. Taiyuan Univ. Technol. 2021, 52, 117–121. [Google Scholar]
  17. Gao, C.; Du, G.; Guo, Q.; Zhuang, Z. Static and dynamic behaviors of basalt fiber reinforced cement-soil after freeze-thaw cycle. KSCE J. Civ. Eng. 2020, 24, 3573–3583. [Google Scholar] [CrossRef]
  18. Li, Y.; Ling, X.; Su, L.; An, L.; Li, P.; Zhao, Y. Tensile strength of fiber reinforced soil under freeze-thaw condition. Cold Reg. Sci. Technol. 2018, 146, 53–59. [Google Scholar] [CrossRef]
  19. Li, T.; Kong, L.; Gao, A. The deformation and microstructure characteristics of expansive soil under freeze-thaw cycles with loads. Cold Reg. Sci. Technol. 2021, 192, 103393. [Google Scholar] [CrossRef]
  20. Lake, C.; Yousif, M.; Jamshidi, R. Examining freeze/thaw effects on performance and morphology of a lightly cemented soil. Cold Reg. Sci. Technol. 2017, 134, 33–44. [Google Scholar] [CrossRef]
  21. Eskisar, T.; Altun, S.; Kalipcilar, L. Assessment of strength development and freeze-thaw performance of cement treated clays at different water contents. Cold Reg. Sci. Technol. 2015, 111, 50–59. [Google Scholar] [CrossRef]
  22. Zhang, K.; Zhang, L. Analysis of influence factors of pore water pressure change in frozen soil. Adv. Mater. Sci. Eng. 2021, 2021, 3290831. [Google Scholar] [CrossRef]
  23. Tang, C.; Lin, L.; Cheng, Q.; Zhu, C.; Wang, D.; Lin, Z.; Shi, B. Quantification and characterizing of soil microstructure features by image processing technique. Comput. Geotech. 2020, 128, 103817. [Google Scholar] [CrossRef]
  24. Zhang, X.; Kong, L.; Guo, A.; Tuo, Y. Based on SEM and MIP test structured clay microscopic pores during compression. Chin. J. Rock Mech. Eng. 2012, 31, 406–412. [Google Scholar]
  25. Xu, Q. Application of Digital Image Analysis Program in Soil Microstructure Research and Data Analysis. Master’s Thesis, Taiyuan University of Technology, Taiyuan, China, 2008. [Google Scholar]
  26. Liu, B.; Du, J.; Shen, T.; Wang, Z.; Hu, J.; Xie, P. Quantitative analysis of the microstructure of organic impregnated sand-cement soil. J. Hainan Univ. (Nat. Sci.) 2021, 39, 68–76. [Google Scholar]
  27. Hou, S.; Chen, L.; Wang, S.; Wan, Y.; Ding, X. Research on damage and degradation characteristics of cement-soil under freeze-thaw cycles. J. Yangtze River Sci. Res. Inst. 2016, 33, 124–127, 132. [Google Scholar]
  28. Zhang, J.; Duan, X. Damage characteristics and energy dissipation of cement-soil at different ages under freeze-thaw cycles. Bull. Chin. Ceram. Soc. 2019, 38, 2144–2151. [Google Scholar]
  29. Gao, Y.; Yao, D.; Qin, X.; Li, C. Study on freeze-thaw characteristics of microbial mineralized geotechnical materials under salt erosion environment. J. Earthq. Prevent. Disaster Mitigat. Eng. 2018, 38, 787–794. [Google Scholar]
  30. Ye, W.; Qiang, Y.; Jing, H.; Zou, Y. Experimental study on freeze-thaw cycles of loess paleosol with different moisture content based on nuclear magnetic resonance. J. Eng. Geol. 2021. [Google Scholar] [CrossRef]
  31. Ding, M.; Zhang, F.; Ling, X.; Lin, B. Effects of freeze-thaw cycles on mechanical properties of polypropylene Fiber and cement stabilized clay. Cold Reg. Sci. Technol. 2018, 154, 155–165. [Google Scholar] [CrossRef]
  32. In JTG E51-2009; Test Methods of Materials Stabilized with Inorganic Binders for Highway Engineering. Beijing People’s Communications Press: Beijing, China, 2009; pp. 146–149.
  33. In ASTM D 1633-17; Standard Test Methods for Compressive Strength of Molded Soil-Cement Cylinders1. ASTM: West Conshohocken, PA, USA, 2017.
  34. Kim, J.S.; Chun, S.Y.; Stephan, D.; Han, T.S. Issues on characterization of cement paste microstructures from μ-CT and virtual experiment framework for evaluating mechanical properties. Constr. Build. Mater. 2019, 202, 82–102. [Google Scholar] [CrossRef]
  35. Wang, L.; Ding, S.; He, H.; Liu, X. Experimental study on freeze-thaw failure of cement mortar with different particle sizes. J. Exp. Mech. 2019, 34, 138–148. [Google Scholar]
  36. Garg, A.; Wani, I.; Zhu, H.; Kushvaha, V. Exploring efficiency of biochar in enhancing water retention in soils with varying grain size distributions using ANN technique. Acta Geotech. 2021. [Google Scholar] [CrossRef]
  37. Sharma, A.; Kushvaha, V. Predictive modelling of fracture behavior in silica-filled polymer composite subjected to impact with varying loading rates using artificial neural network. Eng. Fract. Mech. 2020, 239, 107328. [Google Scholar] [CrossRef]
  38. Chen, Z.; Chen, Z.; Song, Z.; Ye, W.; Fan, Z. Smart gas sensor arrays powered by artificial intelligence. J. Semicond. 2019, 40, 111601. [Google Scholar] [CrossRef]
  39. Turetskyy, A.; Wessel, J.; Herrmann, C.; Thiede, S. Battery production design using multi-output machine learning models. Energy Storage Mater. 2021, 38, 93–112. [Google Scholar] [CrossRef]
Figure 1. XRD test results of the natural weathered sand.
Coatings 12 00272 g001
Figure 2. Grain gradation curve of natural weathered sand.
Coatings 12 00272 g002
Figure 3. Process of freeze−thaw cycles.
Coatings 12 00272 g003
Figure 4. Effect of freeze–thaw cycles on specimen appearance. (a) N = 0, (b) N = 1, (c) N = 3, (d) N = 6, (e) N = 9, (f) N = 12.
Coatings 12 00272 g004
Figure 5. Effect of freeze−thaw cycles on the mass of specimens.
Coatings 12 00272 g005
Figure 6. Effect of freeze–thaw cycles on compressive strength.
Coatings 12 00272 g006
Figure 7. SEM images of specimen at different freeze–thaw cycles (×200 times). (a) N = 0, (b) N = 1, (c) N = 3, (d) N = 6, (e) N = 9, (f) N = 12.
Coatings 12 00272 g007
Figure 8. SEM images of specimens at different freeze–thaw cycles (×2000 times). (a) N = 0, (b) N = 1, (c) N = 3, (d) N = 6, (e) N = 9, (f) N = 12.
Coatings 12 00272 g008aCoatings 12 00272 g008b
Figure 9. Curve of cumulative pore volume.
Coatings 12 00272 g009
Figure 10. Effect of freeze–thaw cycles on pore diameter.
Coatings 12 00272 g010
Figure 11. Pore abundance and average abundance under different freeze–thaw cycles. (a) Pore abundance. (b) Average abundance of pores.
Coatings 12 00272 g011
Figure 12. Particle abundance and average abundance under different freeze–thaw cycles. (a) Grain abundance. (b) Average abundance of particles.
Coatings 12 00272 g012
Figure 13. The freeze–thaw deterioration process of cement-stabilized weathered sand.
Coatings 12 00272 g013
Table 1. Basic physical indexes of the natural weathered sand.
Natural Water Content
(%)
Particle Size Distribution
(%)
Maximum Dry Density
(g/cm³)
Optimal Water Content
(%)
CBR
(%)
<0.5 mm0.5–5 mm>5 mm
3.138.148.113.82.138.0351
Table 2. Unconfined compressive strength test results.
No.Cement Content
(%)
UCS (MPa)
7 d14 d28 d60 d90 d
C-000.19----
C-110.901.001.091.231.42
C-222.082.322.362.752.91
C-333.153.253.654.444.60
C-443.704.284.454.575.23
Publisher’s Note: MDPI stays neutral with regard to jurisdictional claims in published maps and institutional affiliations.

