Article

Corrosion, Wear, and Antibacterial Behaviors of Hydroxyapatite/MgO Composite PEO Coatings on AZ31 Mg Alloy by Incorporation of TiO2 Nanoparticles

by
Hanane Mozafarnia
1,
Arash Fattah-Alhosseini
1,*,
Razieh Chaharmahali
1,
Meisam Nouri
1,
Mohsen K. Keshavarz
2 and
Mosab Kaseem
3,*
1
Department of Materials Engineering, Bu-Ali Sina University, Hamedan 65178-38695, Iran
2
Department of Mechanical and Mechatronics Engineering, University of Waterloo, Waterloo, ON N2L 3G1, Canada
3
Department of Nanotechnology and Advanced Materials Engineering, Sejong University, Seoul 05006, Republic of Korea
*
Authors to whom correspondence should be addressed.
Coatings 2022, 12(12), 1967; https://doi.org/10.3390/coatings12121967
Submission received: 28 November 2022 / Revised: 12 December 2022 / Accepted: 13 December 2022 / Published: 15 December 2022
(This article belongs to the Special Issue Advances in Corrosion Resistant Coatings)

Abstract

:
Plasma electrolytic oxidation (PEO) is a promising surface treatment for generating a thick, adherent coating on valve metals using an environmentally friendly alkaline electrolyte. In this study, the PEO method was used to modify the surface of AZ31 Mg alloy. The composite coatings were formed in a phosphate-based electrolyte containing hydroxyapatite nanoparticles (NPs) and different concentrations (1, 2, 3, and 4 g/L) of TiO2 NPs. The results showed that the incorporation of TiO2 NPs in the composite coatings increased the porosity, coating thickness, surface roughness, and surface wettability of the coatings. The corrosion-resistance results of coatings in simulated body fluid (SBF) were tested for up to 72 h and all coatings showed superior corrosion resistance compared to the bare substrate. Among samples containing TiO2, the sample containing 1 g/L TiO2 had the highest inner layer resistance (0.51 kΩ·cm2) and outer resistance (285 kΩ·cm2) and the lowest average friction coefficient (395.5), so it had the best wear and corrosion resistance performance. The antibacterial tests showed that the higher the concentration of TiO2 NPs, the lower the adhesion of bacteria, resulting in enhanced antibacterial properties against S. aureus. The addition of 4 g/L of TiO2 NPs to the electrolyte provided an antibacterial rate of 97.65% for the coating.

1. Introduction

Mg and its alloys are practical and useful in a wide range of technical applications and systems due to their low density and high strength [1,2,3,4,5]. In addition, Mg has indicated great biocompatibility that has made it as an attractive metal used in medical implants [6]. Nevertheless, Mg and its alloys have a low corrosion resistance which is a critical disadvantage and limits many application domains when compared to other structural materials, such as steels, Al, and Ti alloys [7,8,9,10,11].
Suitable mechanical properties of magnesium-based alloys are necessary for medical implants. The elasticity modulus of Mg alloys ranges from 40 to 45 GPa, which is fairly near that of a natural bone [12]. The latter characteristic is beneficial in preventing implants from loosening during the healing procedure. Nevertheless, surface treatments or coatings are required to ensure the function and surface treatments of Mg alloys against various corrosive environments [13,14,15]. Noble metals’ electro/electroless deposition considerably diminishes the subjection of Mg alloy to outer media, but galvanic corrosion on the surface occurs. Protective coating is an excellent approach for improving the corrosion resistance of Mg and its alloys [16,17]. There are numerous methods for achieving protective coatings, such as electroplating, sol-gel methods [18,19], chemical vapor deposition [20], electrophoretic precipitation [21], physical vapor deposition [22], hydrothermal oxidation [23], and plasma electrolytic oxidation (PEO) [24,25,26,27]. PEO is an electrochemical and plasma chemical treatment. This surface treatment combines electrochemical oxidation with a high voltage spark within an alkaline solution, producing a physically protective oxide layer on the metal surface that improves corrosion and wear resistance, as well as component longevity [28,29,30,31,32]. PEO coatings establish a two-layered morphology—an amorphous outer layer that has a coarse and porous morphology and an inner layer with numerous fine pores [33,34,35].
The PEO process is a multifactor-controlled treatment regulated by various characteristics, both intrinsic and extrinsic. The substrate composition and solution are considered as intrinsic factors that play an important role in the formation of the structure and composition of PEO coatings, while the extrinsic parameters generally consist of process temperature, time of oxidation, and electrical factors, in addition to electrolyte additives [36,37,38].
Modifying the composition of the electrolyte is one way to optimize the microstructure and composition to improve coating qualities. Particles in the solution have an effect on the PEO operation. This occurs because they can change the solution’s conductivity, pH, and viscosity, which can impact the morphology and characteristics of the coating. Various oxide and non-oxide particles (Al2O3, TiO2, ZrO2, CeO2, HA, ZnO, Ta2O5) have been used to modify oxide coatings and/or to form composite coatings on Mg alloys [39,40,41,42,43,44,45,46,47,48,49]. Calcium phosphates are very similar in chemical composition to the mineral part of bone and show very good biocompatibility. The most widely used Ca-P in implant fabrication and manufacturing is hydroxyapatite (HAp) [50,51,52]. The capacity of HAp to link with natural bone is unique, and this chemical bond accelerates the interaction of connective tissue and host bone. It is also non-toxic to the body and has great biocompatibility with hard tissues [28,53,54]. However, HAp coating has weak antibacterial activity, which affects its long-term durability and the rate of premature implant failure [55,56]. Many pure or oxide nanoparticles (NPs) can be added to the base electrolytes to improve the biological and corrosion aspects of PEO coatings. TiO2 NPs are widely used due to their unique features, such as high photocatalytic activity, superior corrosion and wear resistance, high chemical stability, and antibacterial capabilities. The addition of TiO2 NPs to the base electrolyte has been reported to produce multifunctional TiO2 PEO coatings on Ti substrates, which resulted in improved corrosion resistance, wear resistance, and antibacterial properties [57,58,59,60].
Yu et al. [61] studied the effect of adding TiO2 NPs on the characteristics of PEO coatings on an Mg–Zn–Ca–Mn alloy. In their study, various concentrations of TiO2 NPs were used. The results showed that increasing the concentration of TiO2 NPs decreases the size and number of pores formed on the surface, resulting in the formation of a dense coating layer. White et al. [62] investigated the effect of adding TiO2 NPs in phosphate electrolyte on the corrosion properties of coatings formed by the PEO method on AZ31 alloy. The results revealed that the current density of the formed coating containing NPs is much lower than that of magnesium alloy and the presence of NPs improved the corrosion properties of the coating. In addition, the coatings containing hydroxyapatite on the surface of metal materials showed very good biocompatibility.
In general, one of the conditions for bone grafting with implants is the formation of a layer of hydroxyapatite on the surface. This substance has a unique ability to bond with natural bone and this chemical bond accelerates the interaction between the host bone and connective tissue. These materials are very useful because they create a bond with bone cells, providing stability and stabilization of the implant around the bone, conversion of the non-bioactive surface into a bioactive surface, and increased corrosion resistance. Despite a few studies on the effects of TiO2 addition on different properties of coatings on Mg alloys, the literature lacks a comprehensive study on wear, corrosion, and biocompatibility of HAp/MgO composite coating on Mg alloys with the addition of TiO2 NPs.
In this research, composite coatings were created on AZ31 alloy by the PEO method in phosphate electrolyte containing HAp NPs and different concentrations of TiO2. In addition to the surface characterization of different coatings, the corrosion behavior of the coatings and their biocompatibility in the simulated body fluid (SBF), the abrasion behavior of the coatings, and the antibacterial behavior in the presence of S. aureus bacteria were investigated.

2. Materials and Methods

AZ31 alloy sheets were used as substrate with the chemical composition presented in Table 1. To conduct the coating process, the samples were cut by a wire-cut machine into a rectangular shape with a thickness of 3 mm and dimensions of 20 mm × 15 mm. Prior to coating, all samples were grounded with 400, 600, 800, 1000, and 2000 papers, respectively, then washed with distilled water and dried with cold air. AZ31 substrates were immersed in the electrolyte as an anode. To perform PEO processing, samples were immersed in electrolytes containing distilled water, trisodium phosphate Na3PO4.12H2O), potassium hydroxide (KOH) (provided by the Merck Co., Darmstadt, Germany), and various concentrations of TiO2 nanoparticles (with the average size of 20 nm, provided by US Research Co.). Table 2 shows the chemical composition of the electrolyte utilized for the coating process. The HAp NPs used in this study were synthesized by the wet chemical precipitation method [63]. The synthesis steps of HAp NPs were fully described in the previous research. The coating process was conducted for 7 min under constant current conditions of 300 mA/dm2 with a frequency of 1000 Hz and a duty cycle of 50%.
The surface morphology and local elemental analyses of the PEO coatings were studied using an FE-SEM equipped with an energy-dispersive X-ray spectroscopy detector. The pore size distribution of the layers was determined using Image J software to analyze the FE-SEM micrographs. To identify the phases in the coatings, the X-ray diffraction (XRD) patterns were obtained by the grazing incident XRD (GIXRD) method. XRD patterns were analyzed by Xpert HighScore software. The surface roughness (Ra) of specimens was measured using a roughness tester. A detailed description of the surface-roughness test can be found in [64,65]. Surface roughness measurements were carried out three times in the length direction and three times in the width direction on each specimen across the surface. The dynamic wettability of surfaces was determined using a contact angle goniometer. A 2 µL droplet of SBF was placed on the coated sample surface to determine the contact angle. Contact angle values were measured using a digital camera attached to an optical microscope. The average values and standard deviation were calculated based on a minimum of three repetitions of the tests. Electrochemical impedance spectroscopy (EIS) tests were carried out in an SBF solution. The corrosion tests were carried out using an Autolab apparatus with a three-electrode system consisting of a Pt counter-electrode, an Ag/AgCl reference electrode, and a coated sample as the working electrode. EIS tests were performed in the frequency range of 100 kHz to 10 mHz with a wavelength range of ±10 mV. The analysis of the results of the corrosion tests was carried out using the NOVA 1.11 software. A detailed description of antibacterial activity can be found in [64]. To evaluate the wear resistance of different coated specimens, the samples were subjected to the pin-on-disc test by WTC02 device, and wear evaluation was carried out following the guidelines of the ASTM G99 standard. The pin-on-disc test was carried out using a 15 N load, a sliding speed of 100 r/min, and 500 m distance. The pin was made from steel 52,100.

3. Results and Discussions

3.1. Voltage–Time Plot

The plot of voltage changes to the time of the PEO-coating process is presented in Figure 1. As is evident in the figure, the voltage–time plot of all the samples has three stages. In the first stage of the PEO-coating process, due to the formation of a very thin insulating layer on the surface of the magnesium alloy, the voltage increases linearly and rapidly with time. By increasing the time and voltage, a large number of gas bubbles are produced, which is very similar to the simple anodizing process. In the second stage, the voltage increases with time at a lower rate than in the first stage, and weak dielectric breakdowns occur in some areas of the oxide layer. As the time increases and the voltage passes from the breakdown voltage, short-term white sparks appear on the surface of the substrate and the growth rate of the coating decreases in this stage. When the third stage starts and the voltage crosses the critical voltage, the color of the sparks turns yellow and orange, their number decreases, and their intensity increases. In this stage, the growth rate of the coating increases and the film grows [66,67,68,69,70]. Table 3 shows the results of the voltage–time plot. As is clear from Figure 1 and Table 3, the breakdown voltage, critical voltage, and final voltage of all samples increase with increasing concentration of NPs, so that the graph of sample T4 in Figure 1 is higher than that of all other samples.
Electrical conductivity is an important and influencing parameter on the properties of PEO coatings and the behavior of the voltage–time plot of the samples. The Ikonopisov equation shows the relationship between breakdown voltage and electrical conductivity [71], as follows:
V b = a B + b B log 1 K
In this equation, Vb, aB, bB, and K are the breakdown voltage, substrate constant, electrolyte constant, and electrical conductivity, respectively. As can be deduced from the equation, breakdown voltage and electrical conductivity have an opposite relationship. As is clear in Table 2, increasing the concentration of NPs decreased the electrical conductivity of the solution. The increase in voltage, which is the result of the decrease in conductivity, causes more intense sparks.

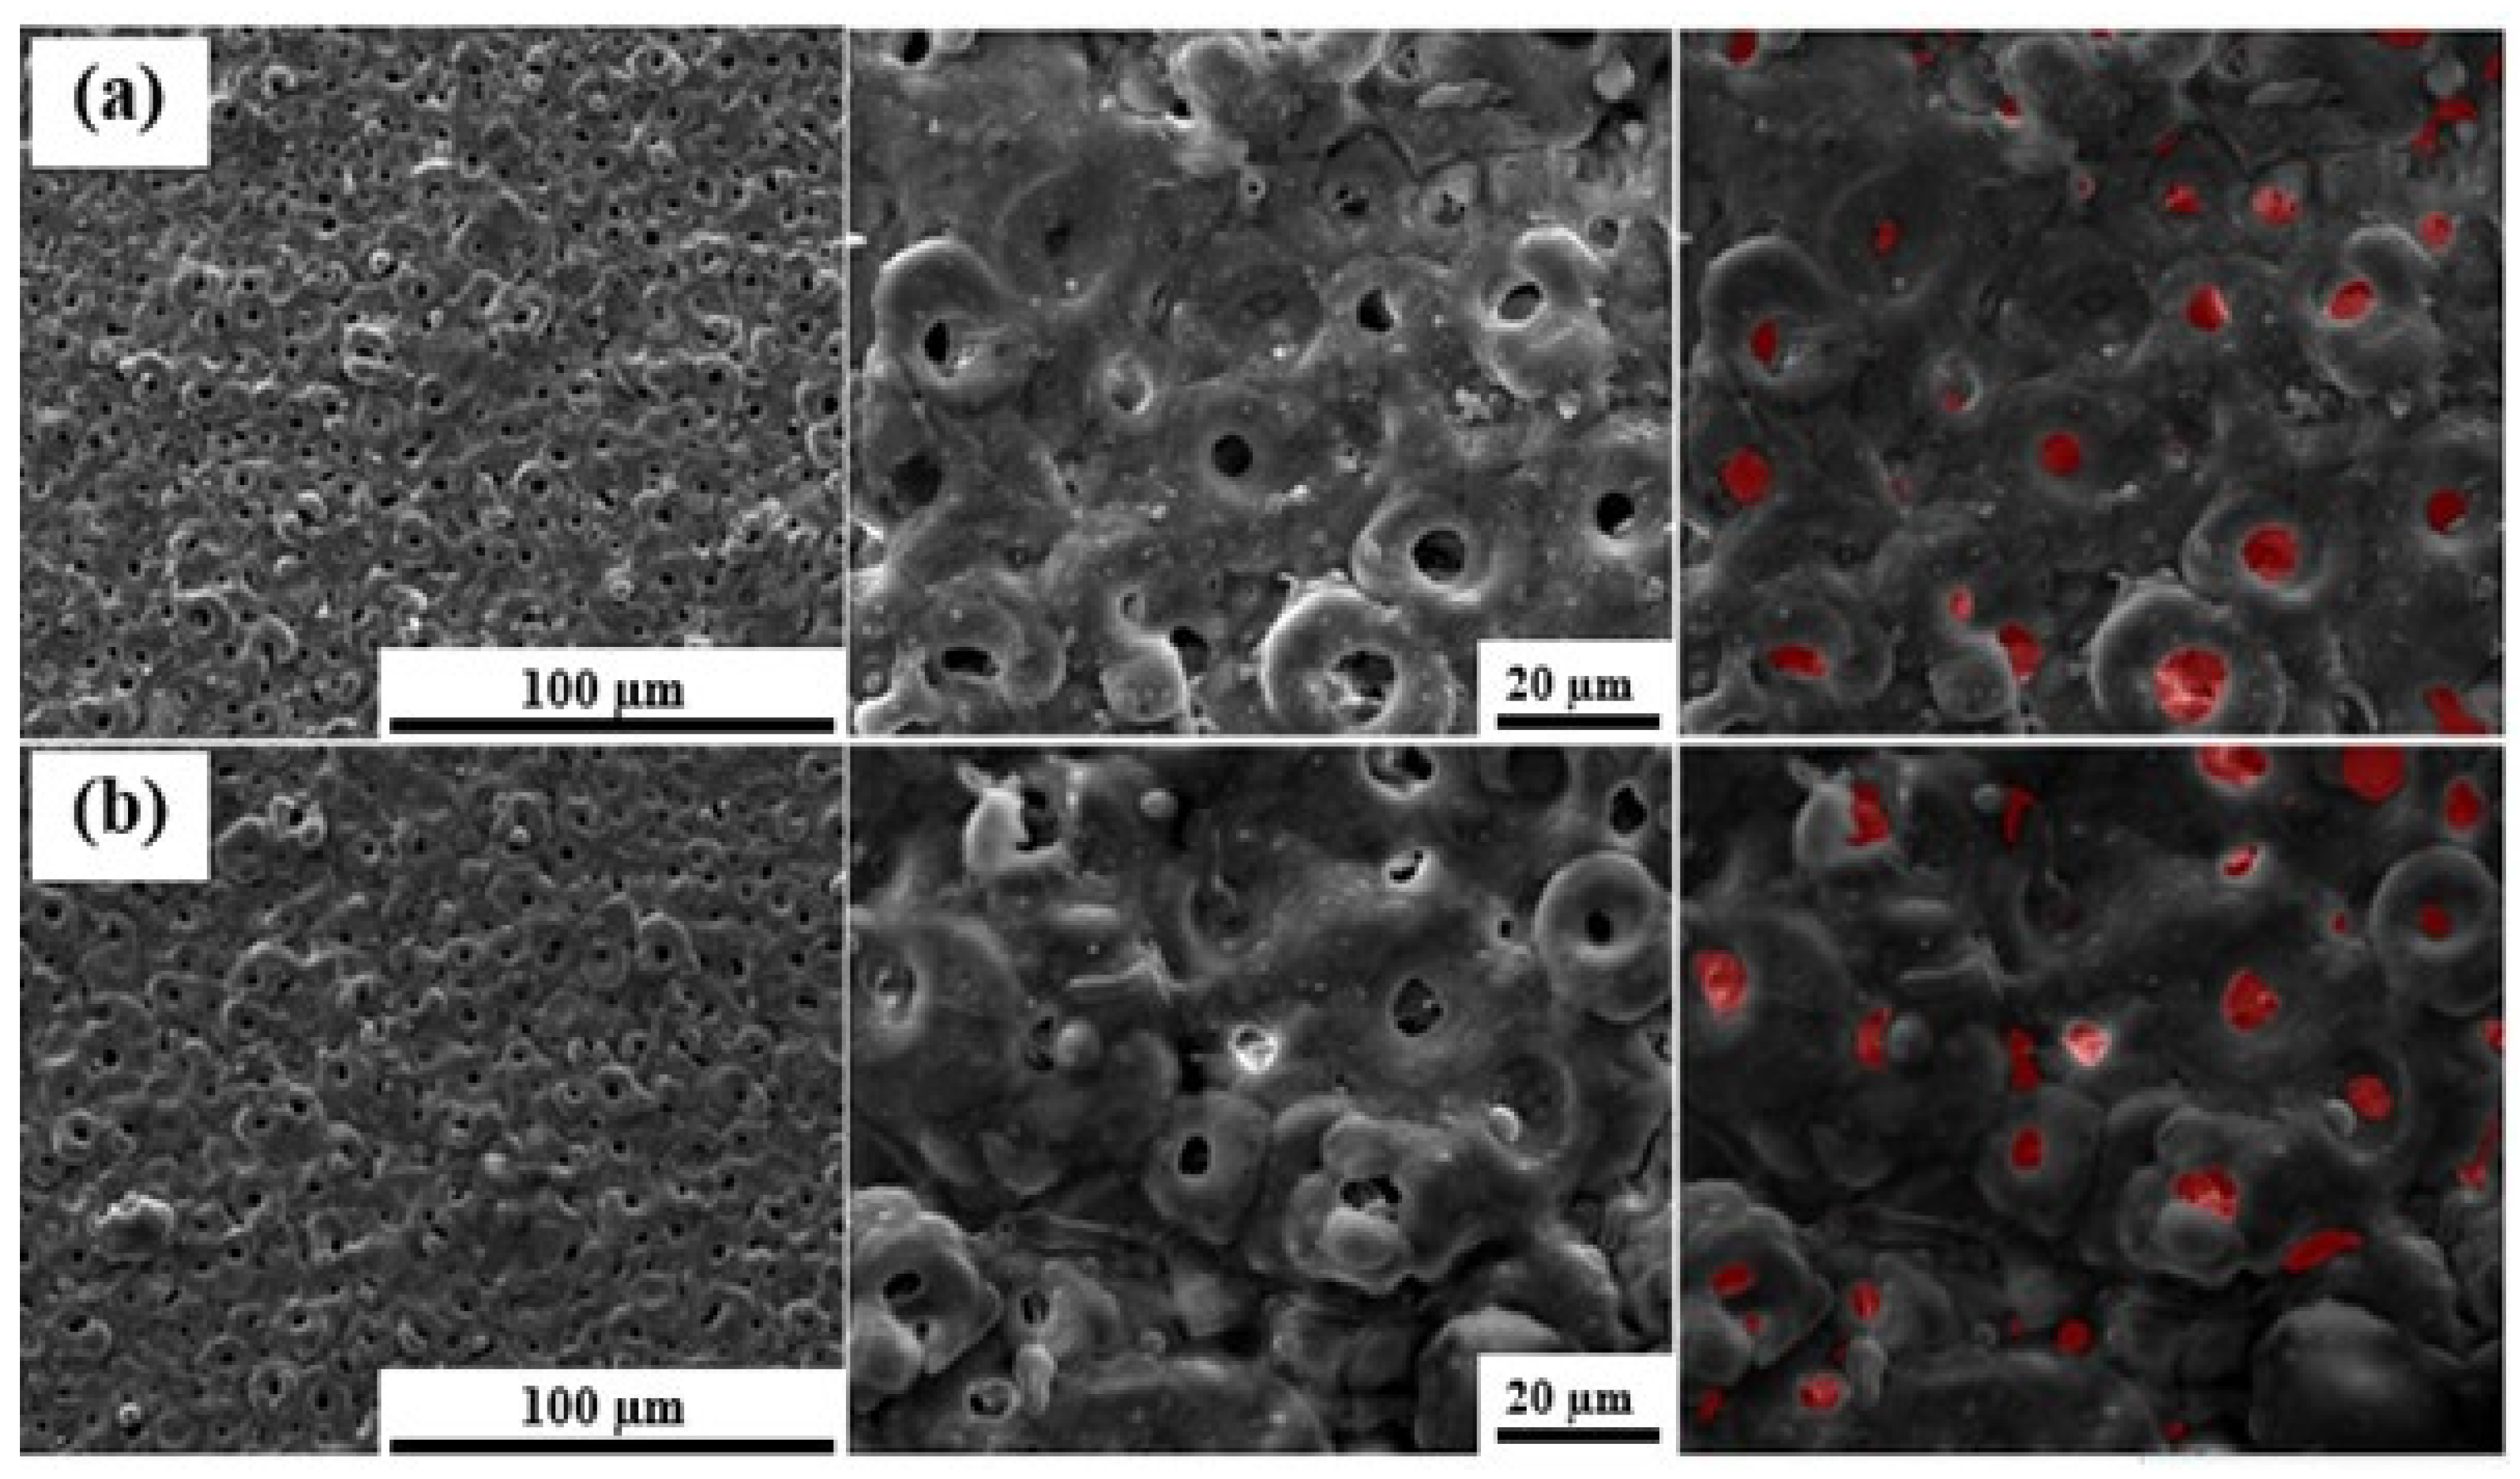
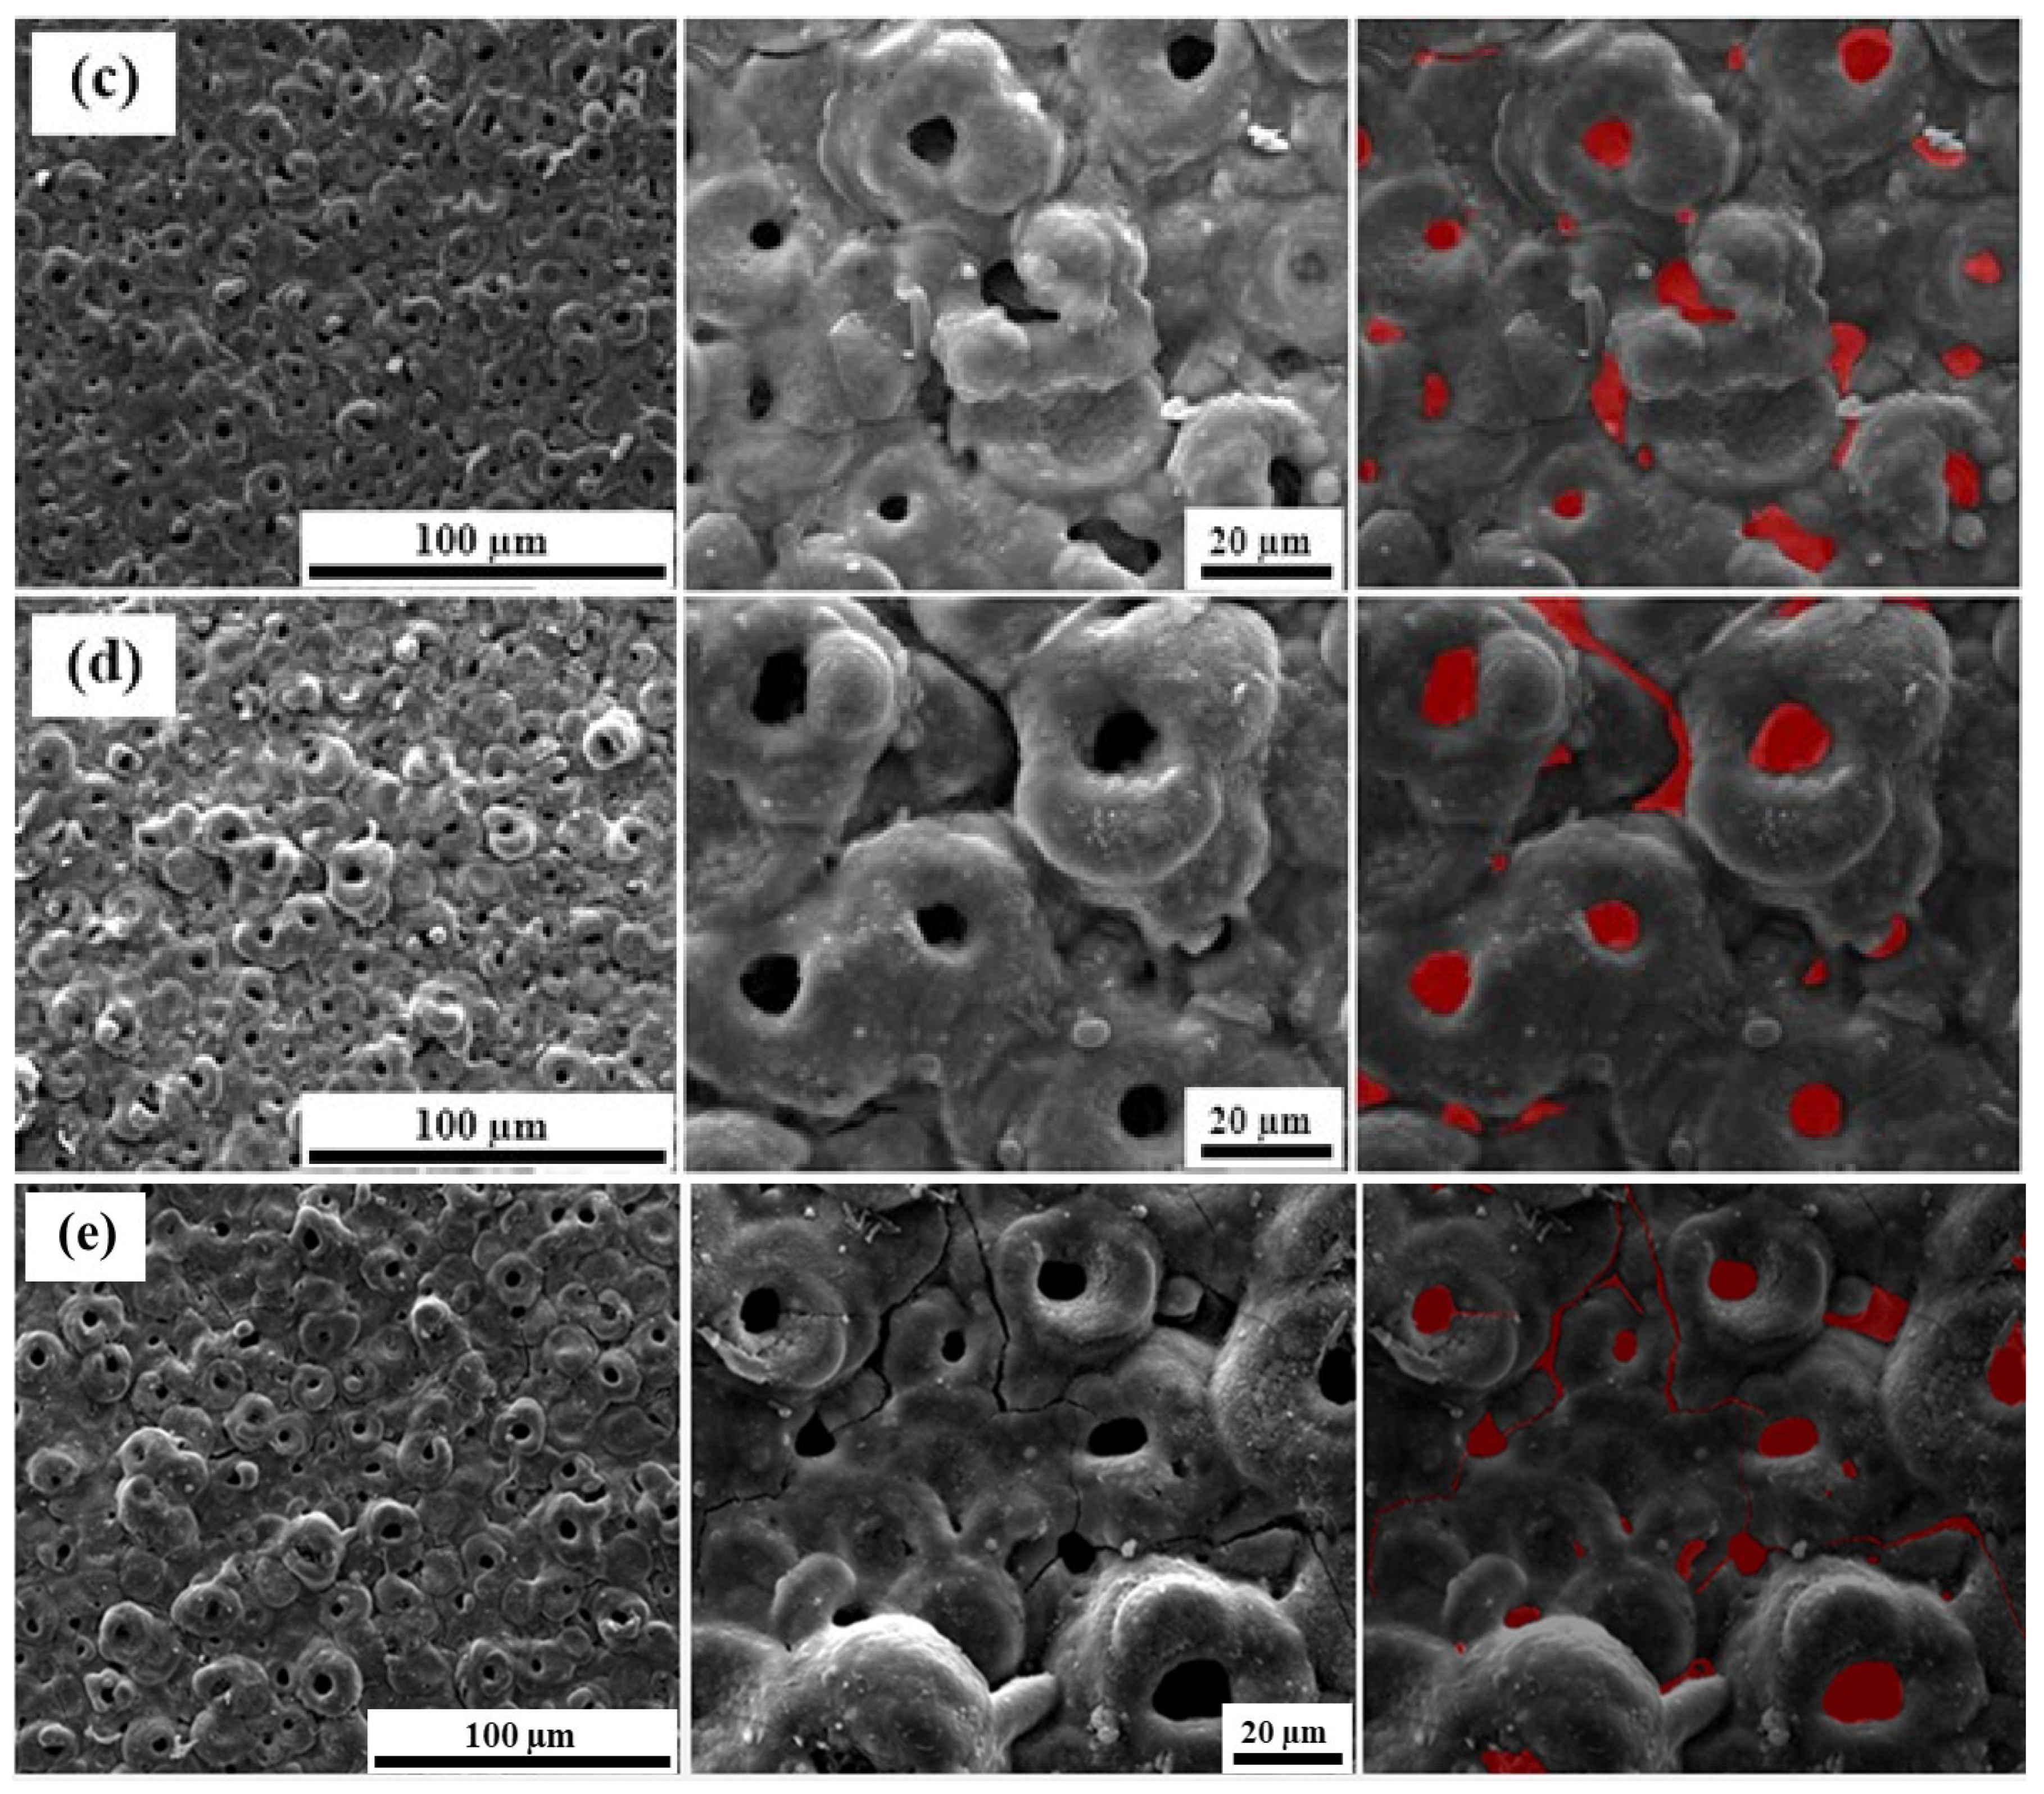
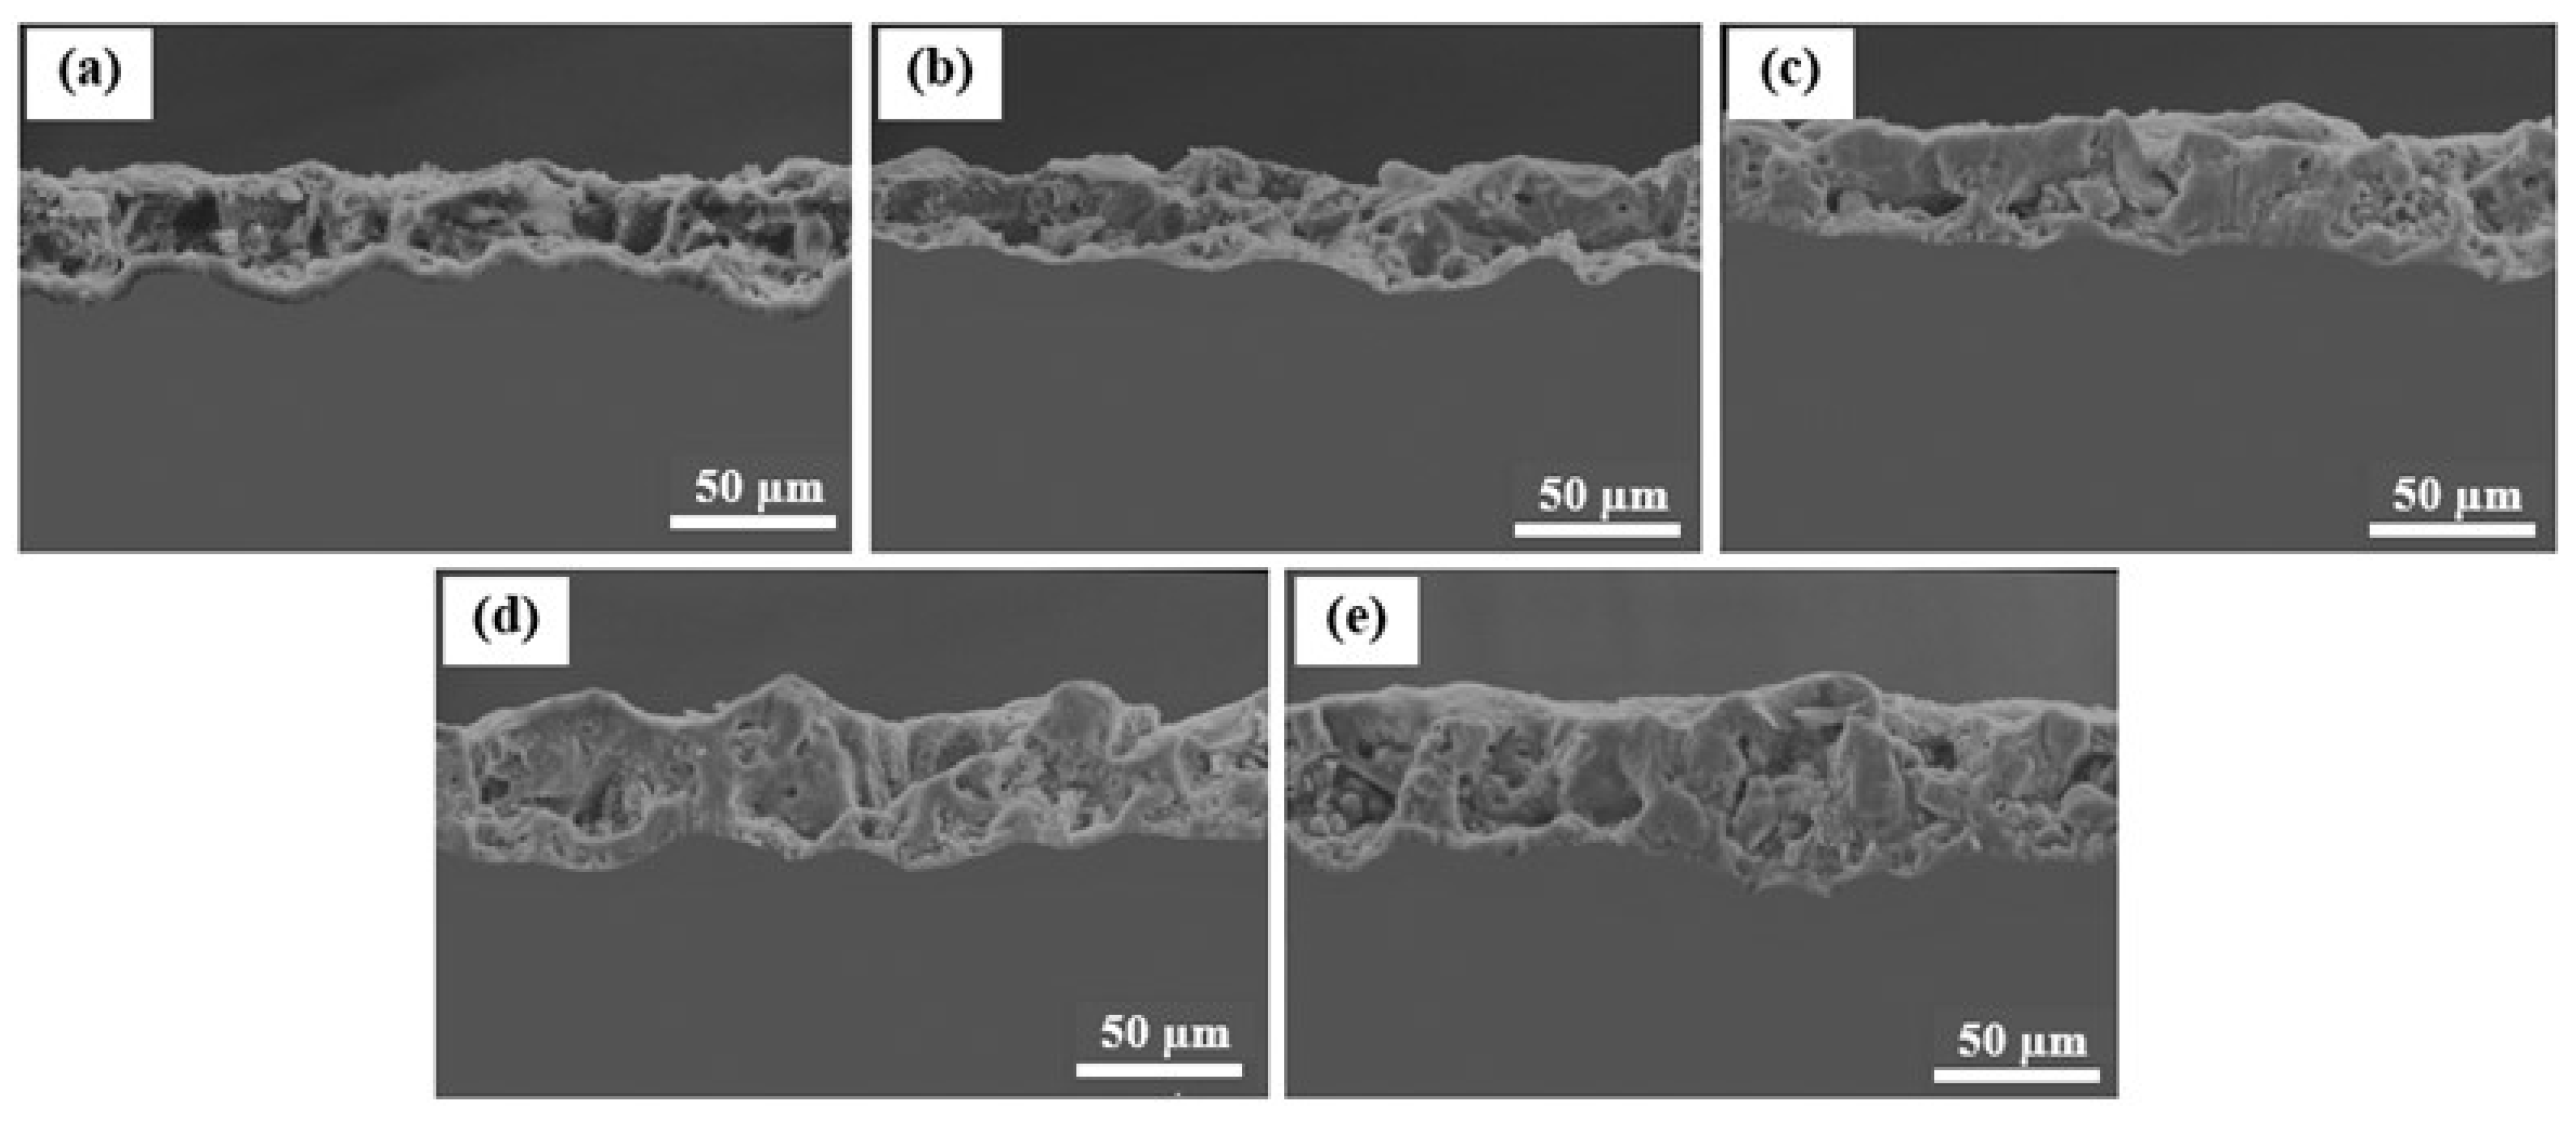
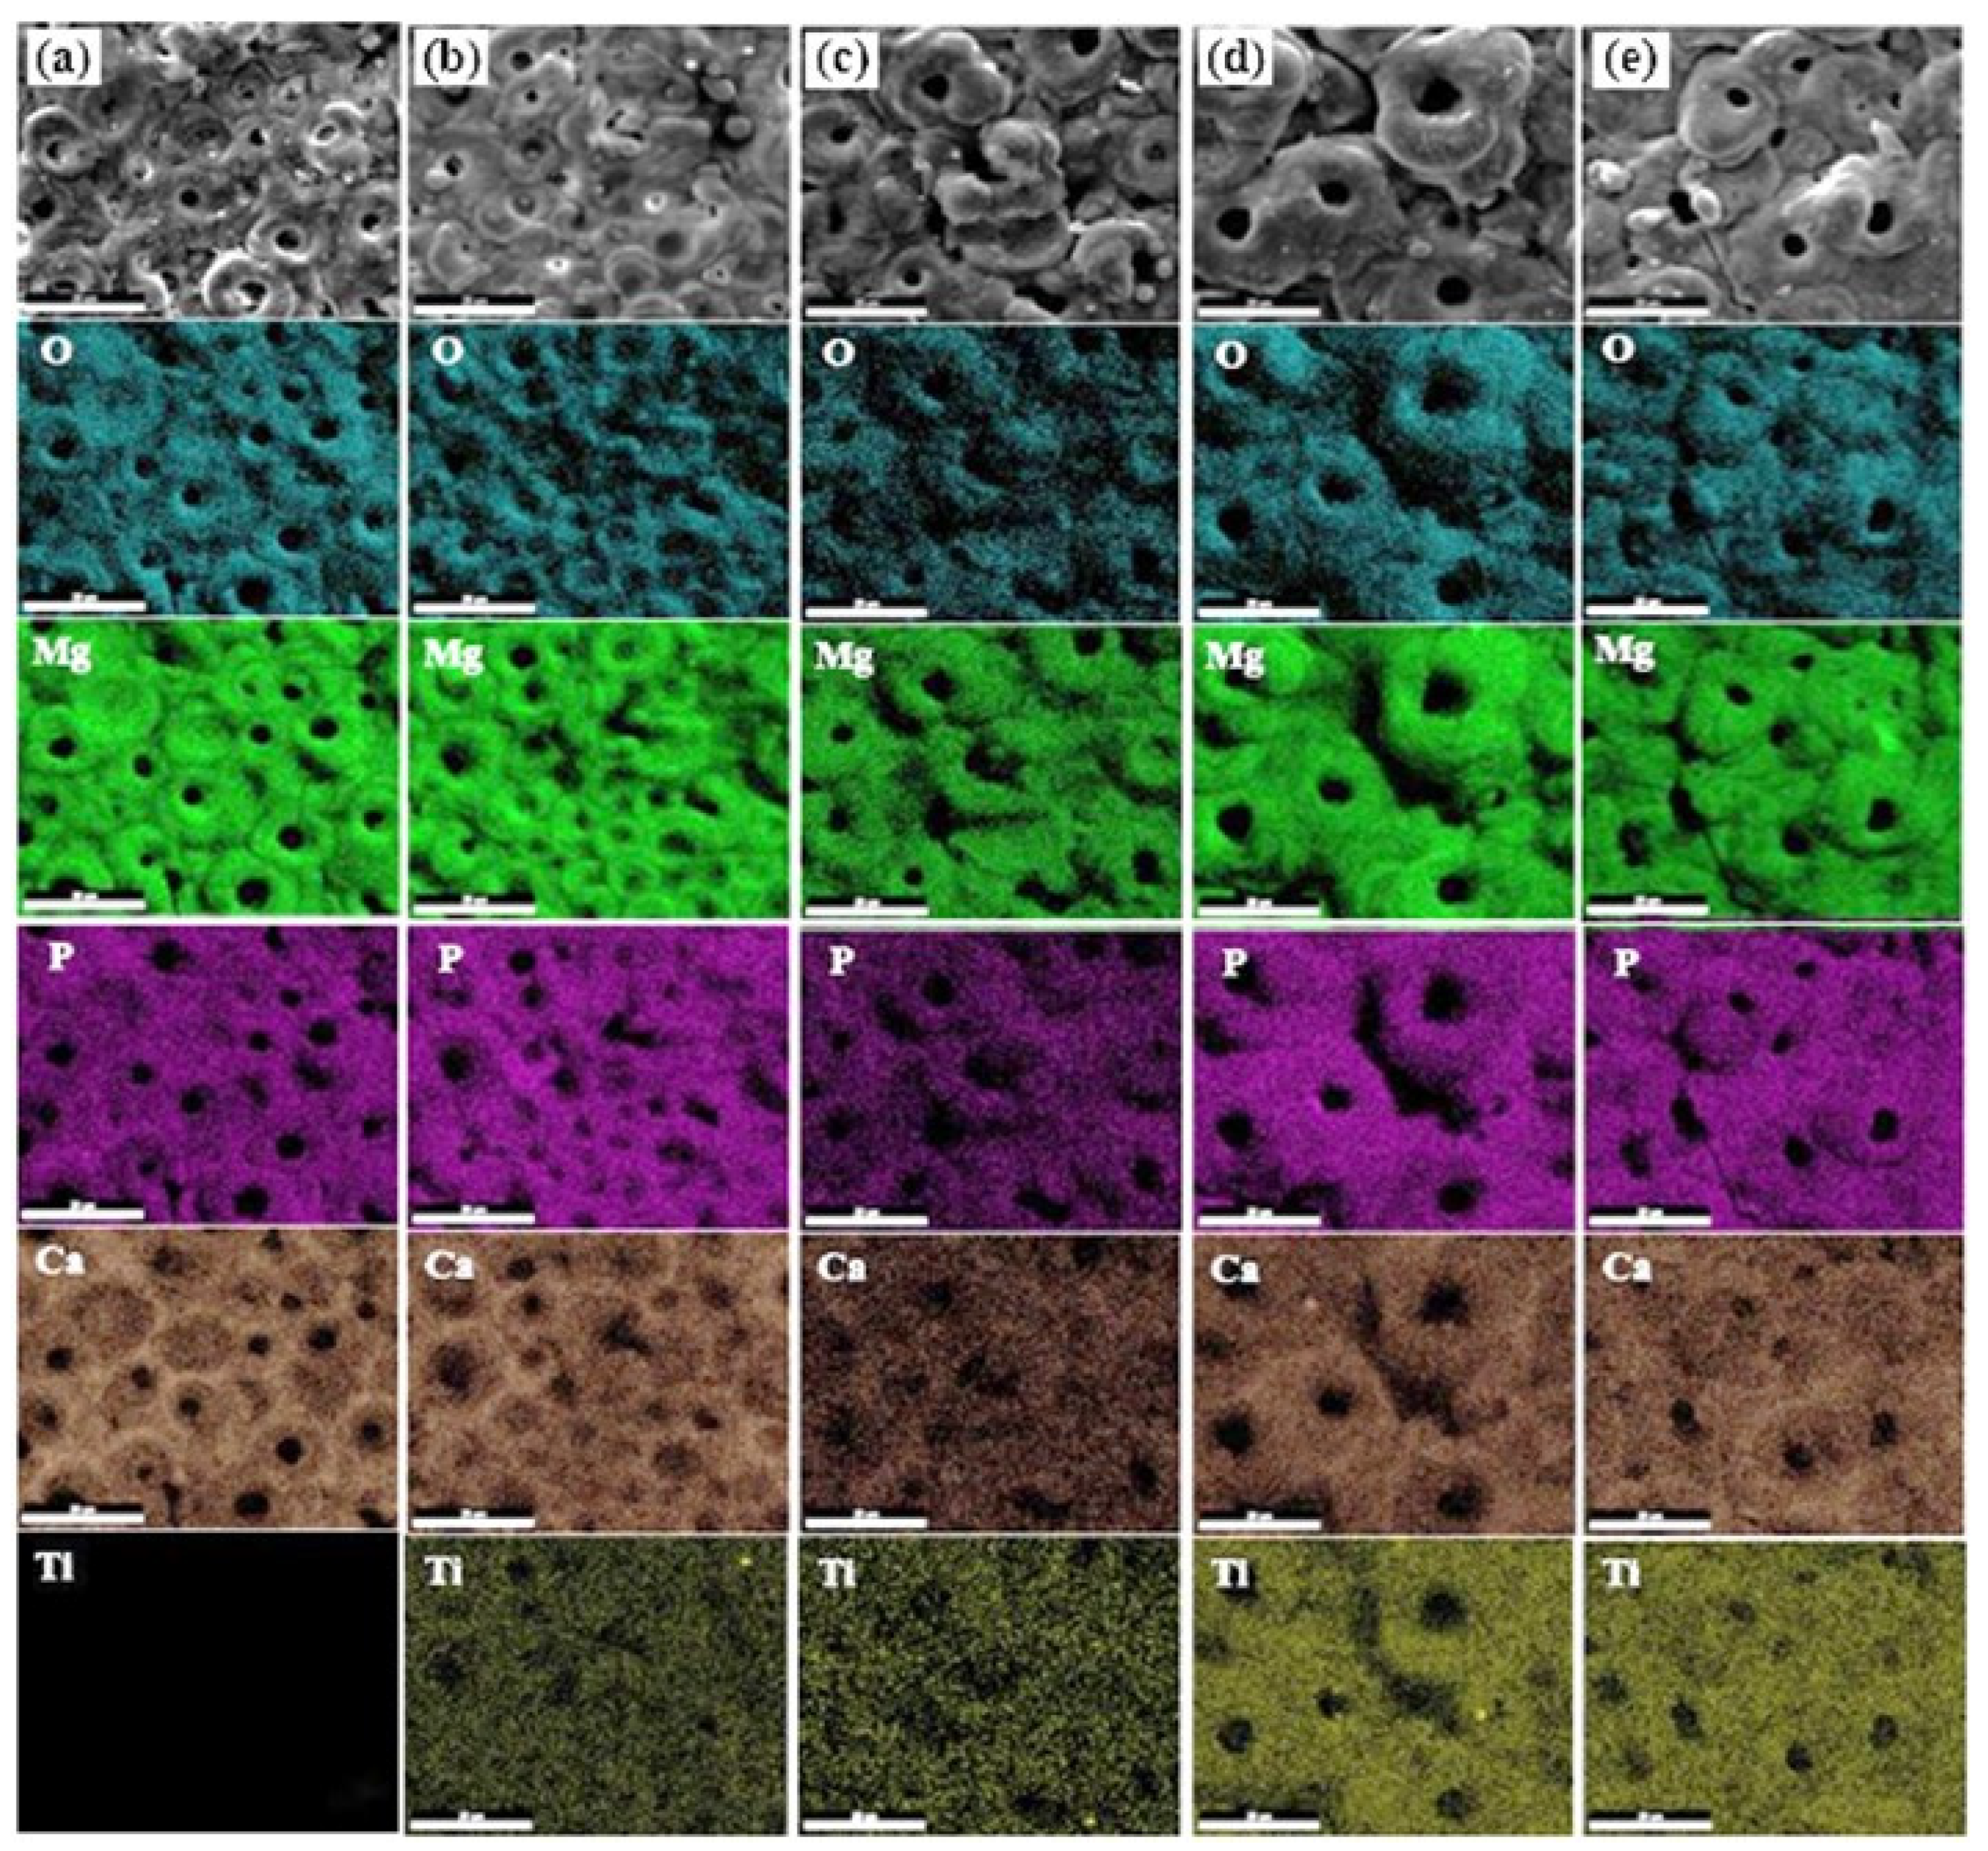
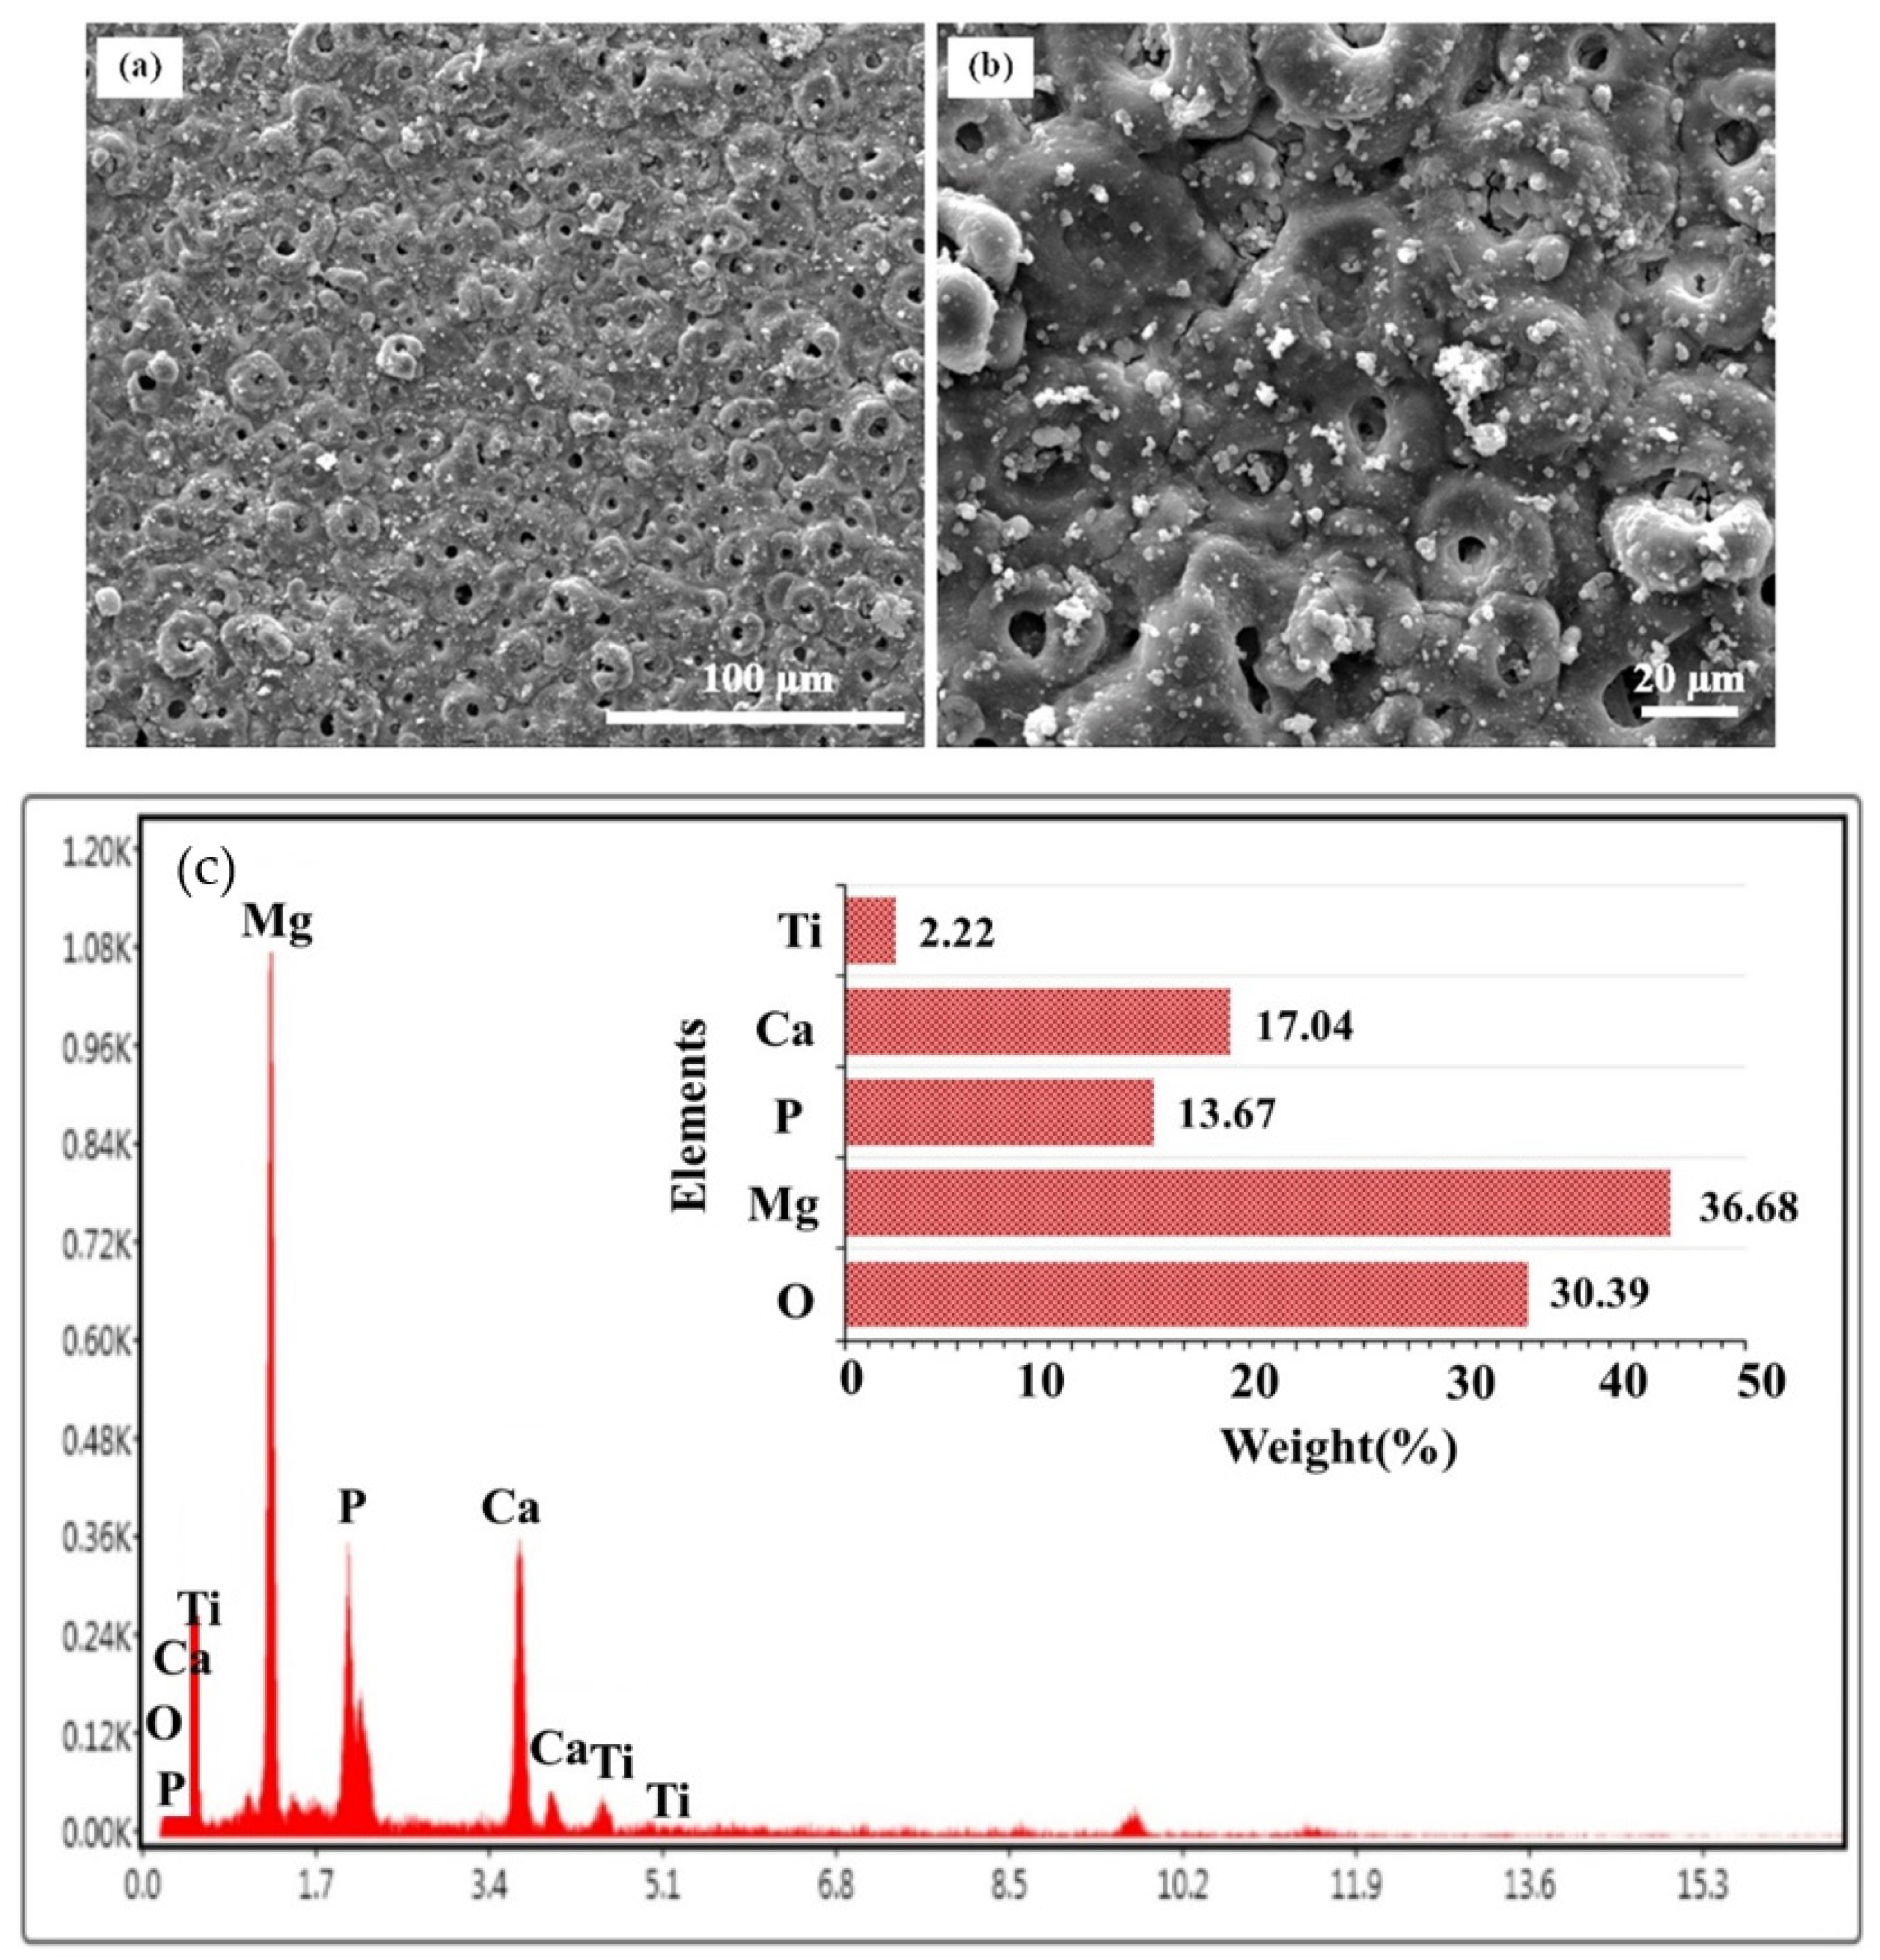
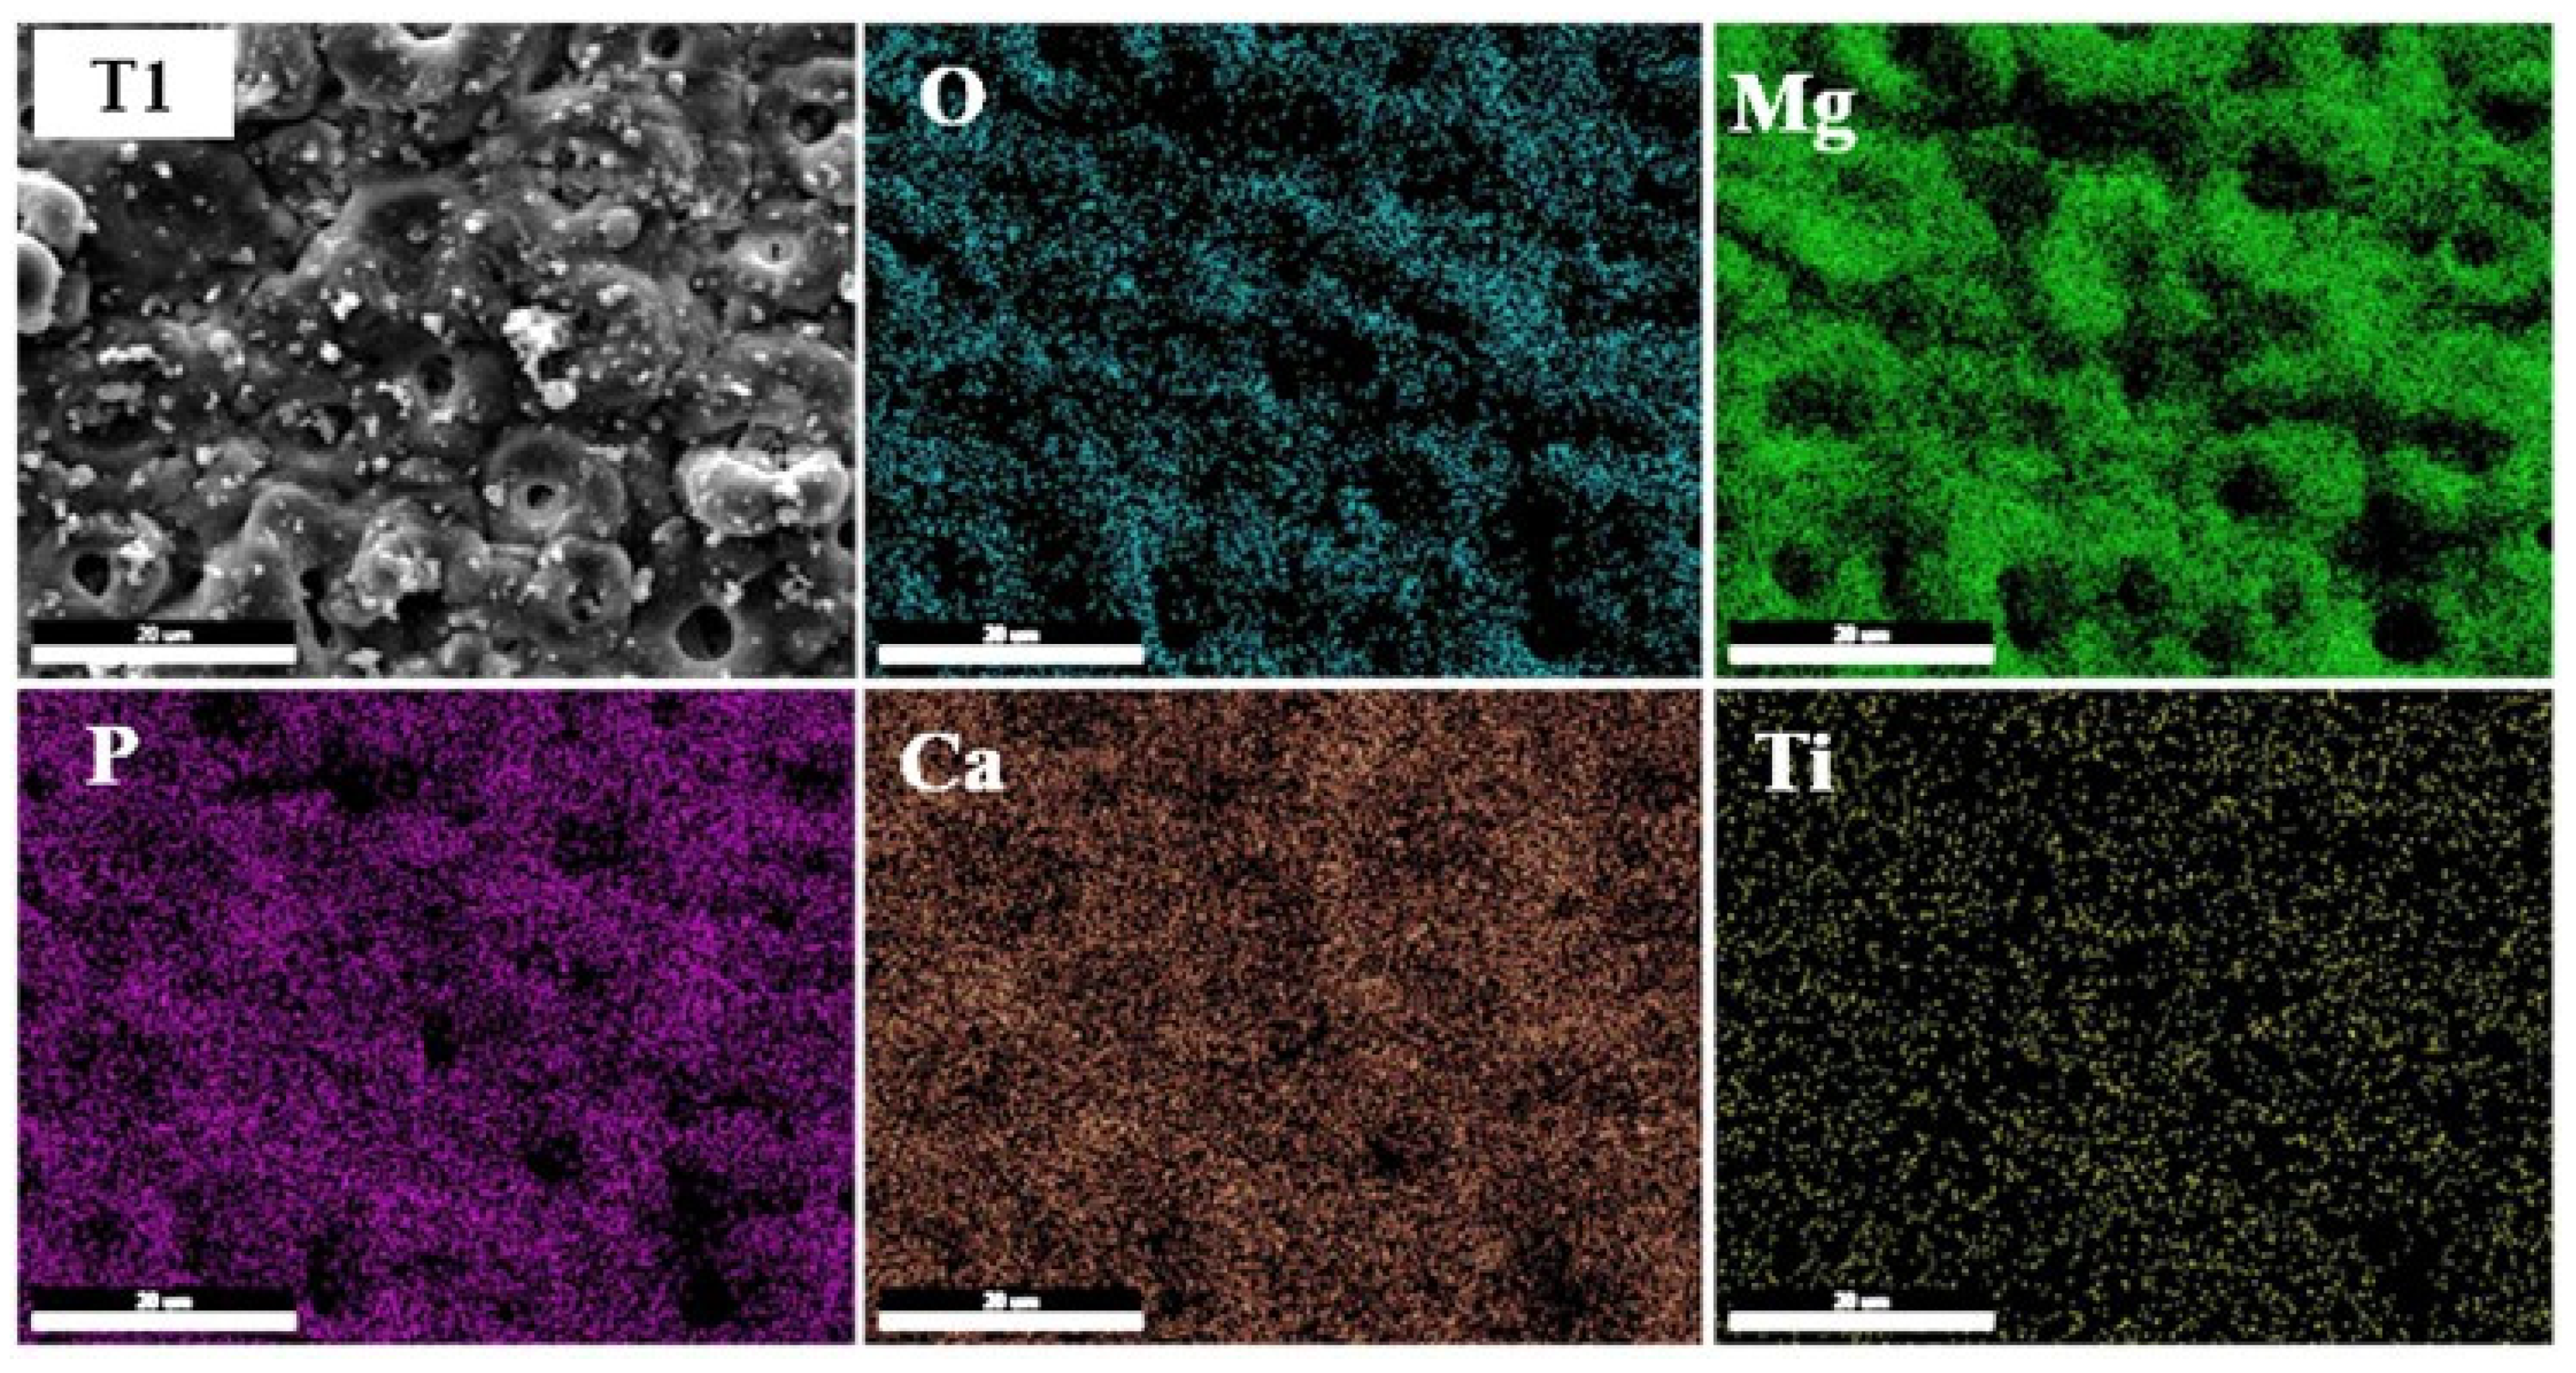
3.2. Surface and Cross-Sectional Morphology of Coatings

The FE-SEM images of the microstructure of the coated samples in the electrolyte containing different concentrations of NPs are presented in Figure 2. As can be seen, the surface of the coatings has porosity and microcracks, which are two of the main characteristics of the coatings created by the PEO method. The pores are randomly distributed in different sizes and shapes throughout the surface of the coatings. These pores are formed due to the escape of gas bubbles and the ejection of molten metal or molten oxide from the discharge channels, and their rapid solidification is due to being in contact with cold electrolyte [72,73,74,75,76], which also results in the release of high thermal stress and the formation of microcracks on the surface [34,77,78,79,80]. As the images show, the pores of all the coatings have the shape of a crater, similar to the crater of a volcano. This type of shape of the pores is due to the fact that they are melted by the flow of materials inside the discharge channels. As the gas bubbles leave these channels, they push out the melted materials, and these materials solidify quickly due to contact with the cold electrolyte, and this type of porosity is created.
The graphs of the average porosity and the average size of pores are shown in Figure 3. With the increase in the concentration of NPs from 0 to 4 g/L, the porosity and the size of the pores increased. This phenomenon can be related to the response of the voltage–time plot of the samples. With the increase in the concentration of NPs, the voltage forming the coating increased, which caused an increase in the energy in the discharge channels and the size of the pores. The increase in the intensity of sparking in the discharge channels may be due to the increase in the thickness of the coating or to the denser coating due to the incorporation of NPs into the coating; thus, it requires more energy to flow. Under these conditions, the current is concentrated at the weaker points of the layer to find its way through the coating. This increases the size of the pores. As can be seen, T4 has the highest number of pores among all samples, due to the higher critical and final voltages.
Figure 4 shows the cross-section images of coatings formed at various concentrations of TiO2 NPs. The average coating thicknesses for T0 and T1 samples were 30.5 and 30.6 µm, respectively, which meant that adding 1 g/L of NPs had no significant influence on the coating thickness. However, with further increases in the concentration of NPs, the thickness of the coatings increased, and the average thicknesses increased to 35.5, 36.9, and 41.4 µm, respectively. The reason for the increase in thickness in the samples can also be attributed to the voltage–time diagram. By increasing the concentration of NPs, the voltage forming the coating increased. An increase in the voltage forming the coating means creating more heat and energy in the discharge channels. As a result of more heat, more suitable conditions for reactions were created and more products resulted. These products can easily leave the drainage channels and deposits on the surface.

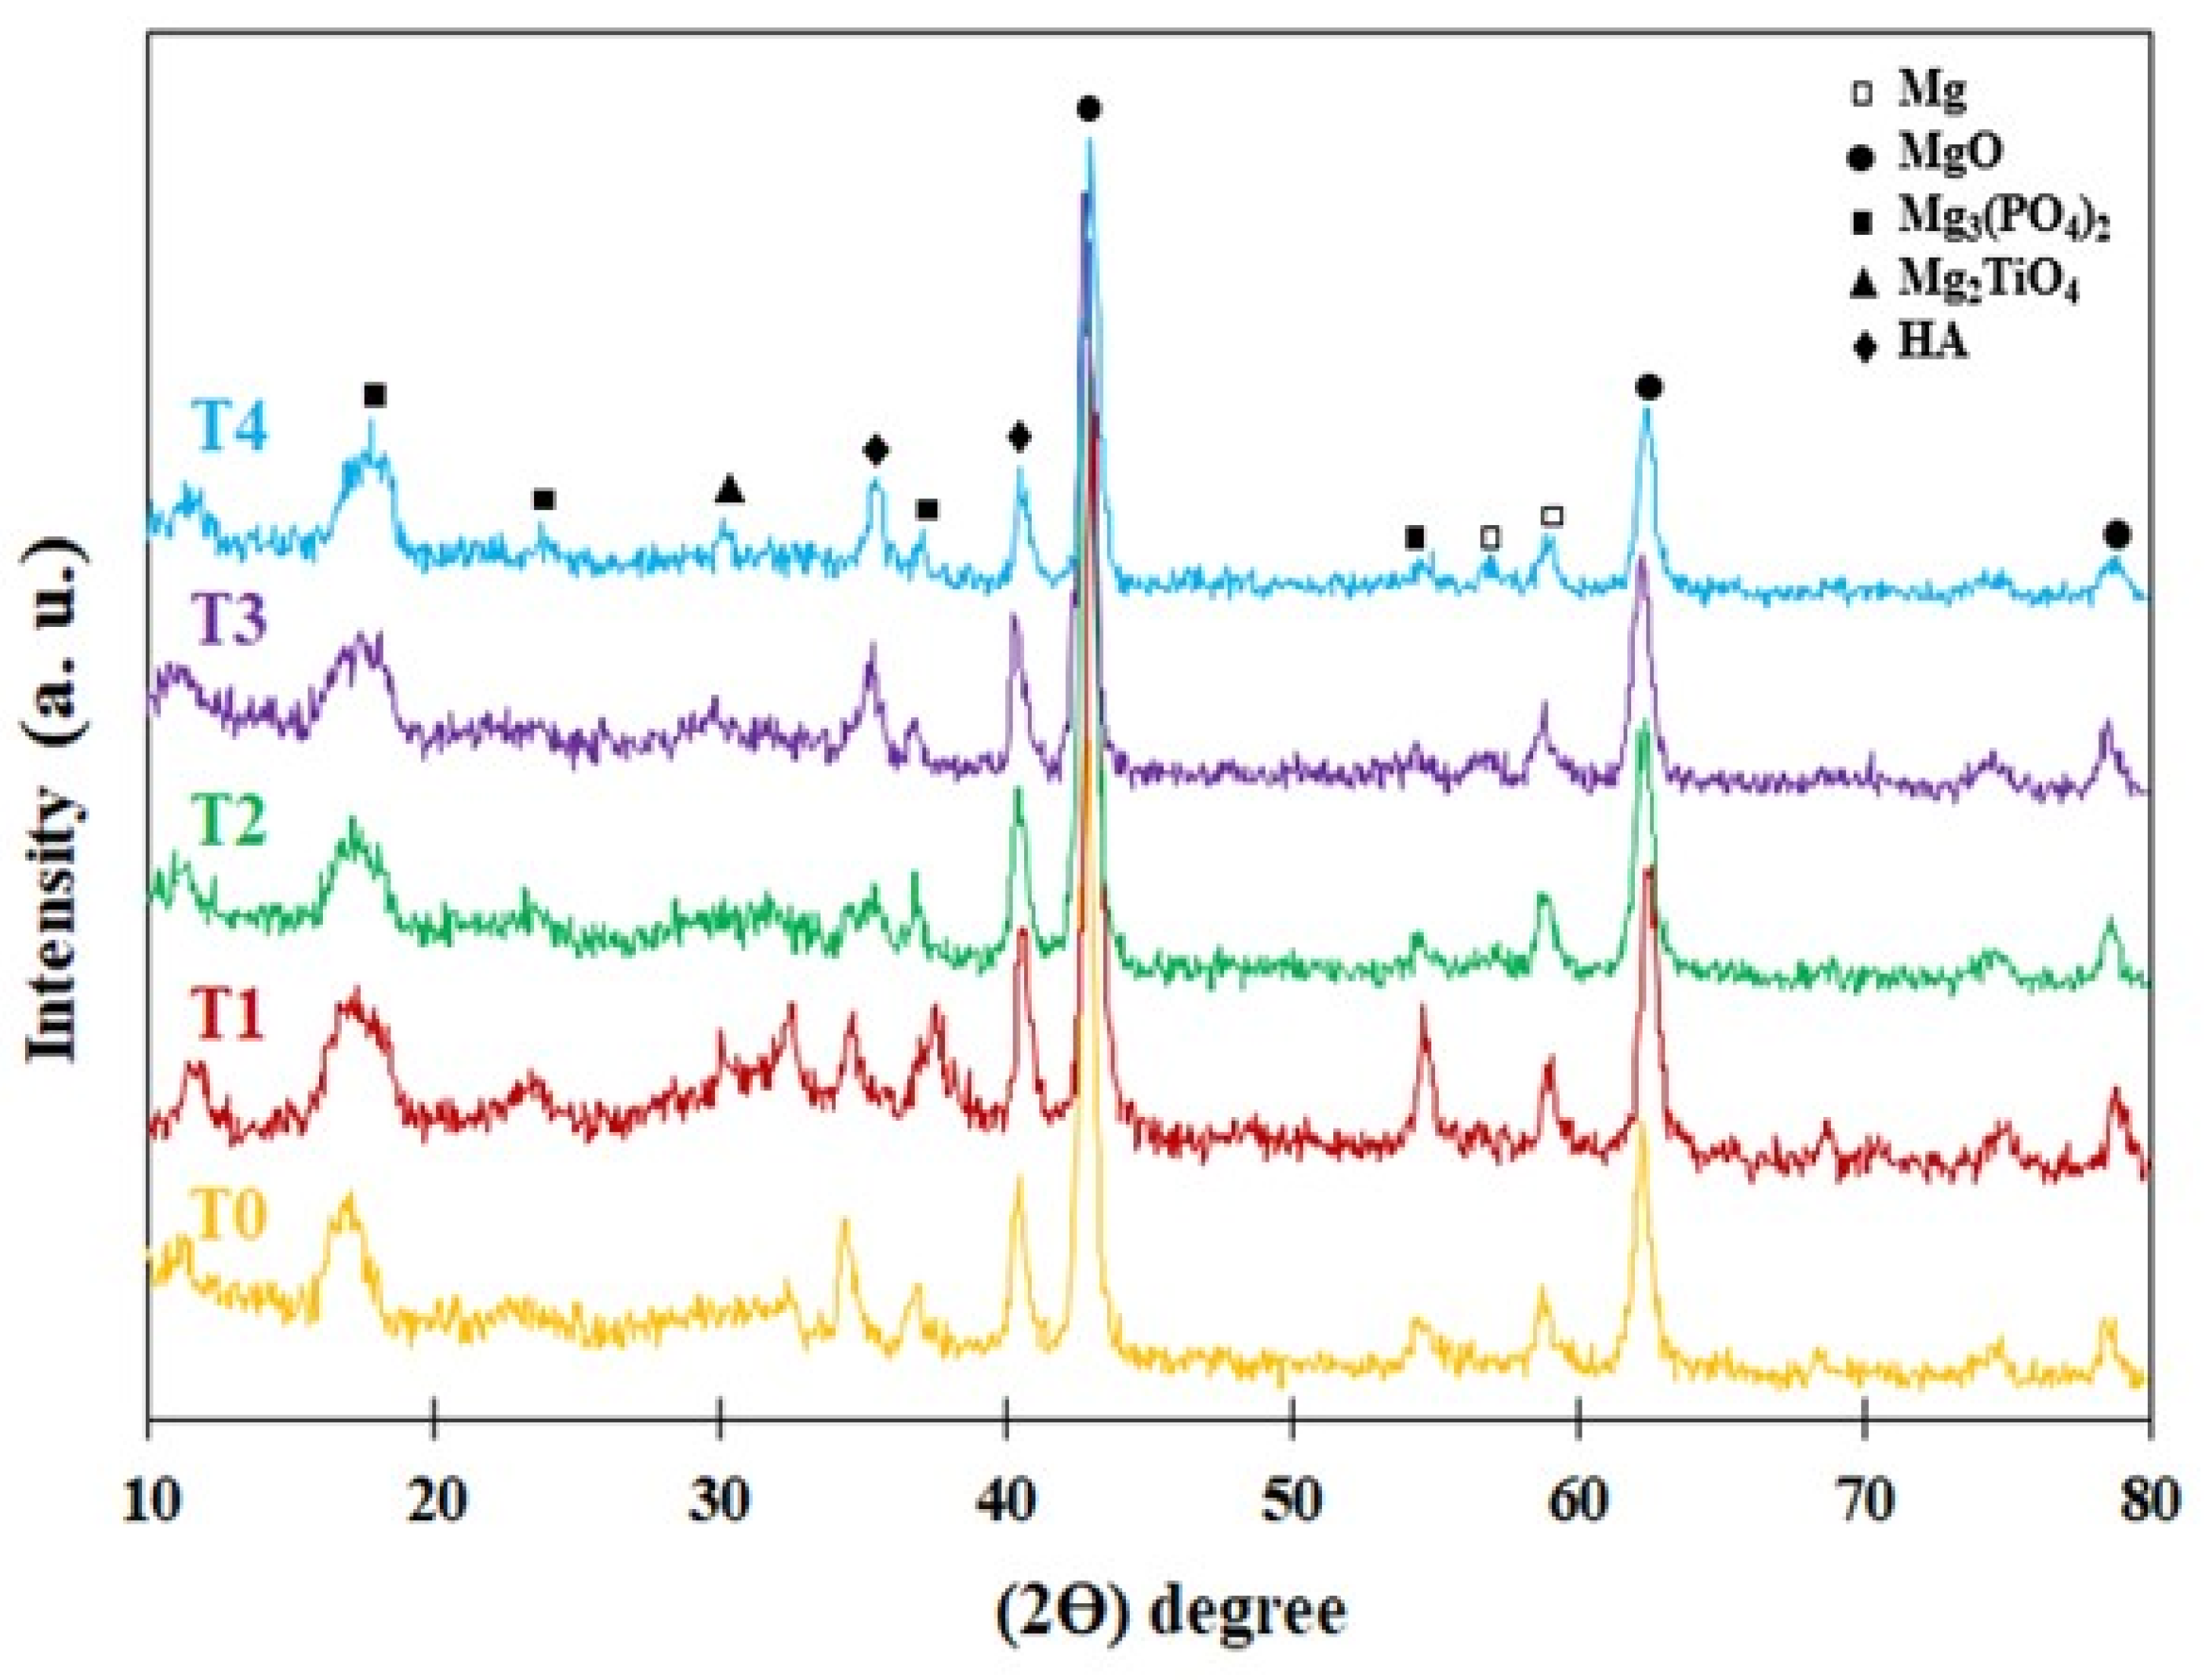
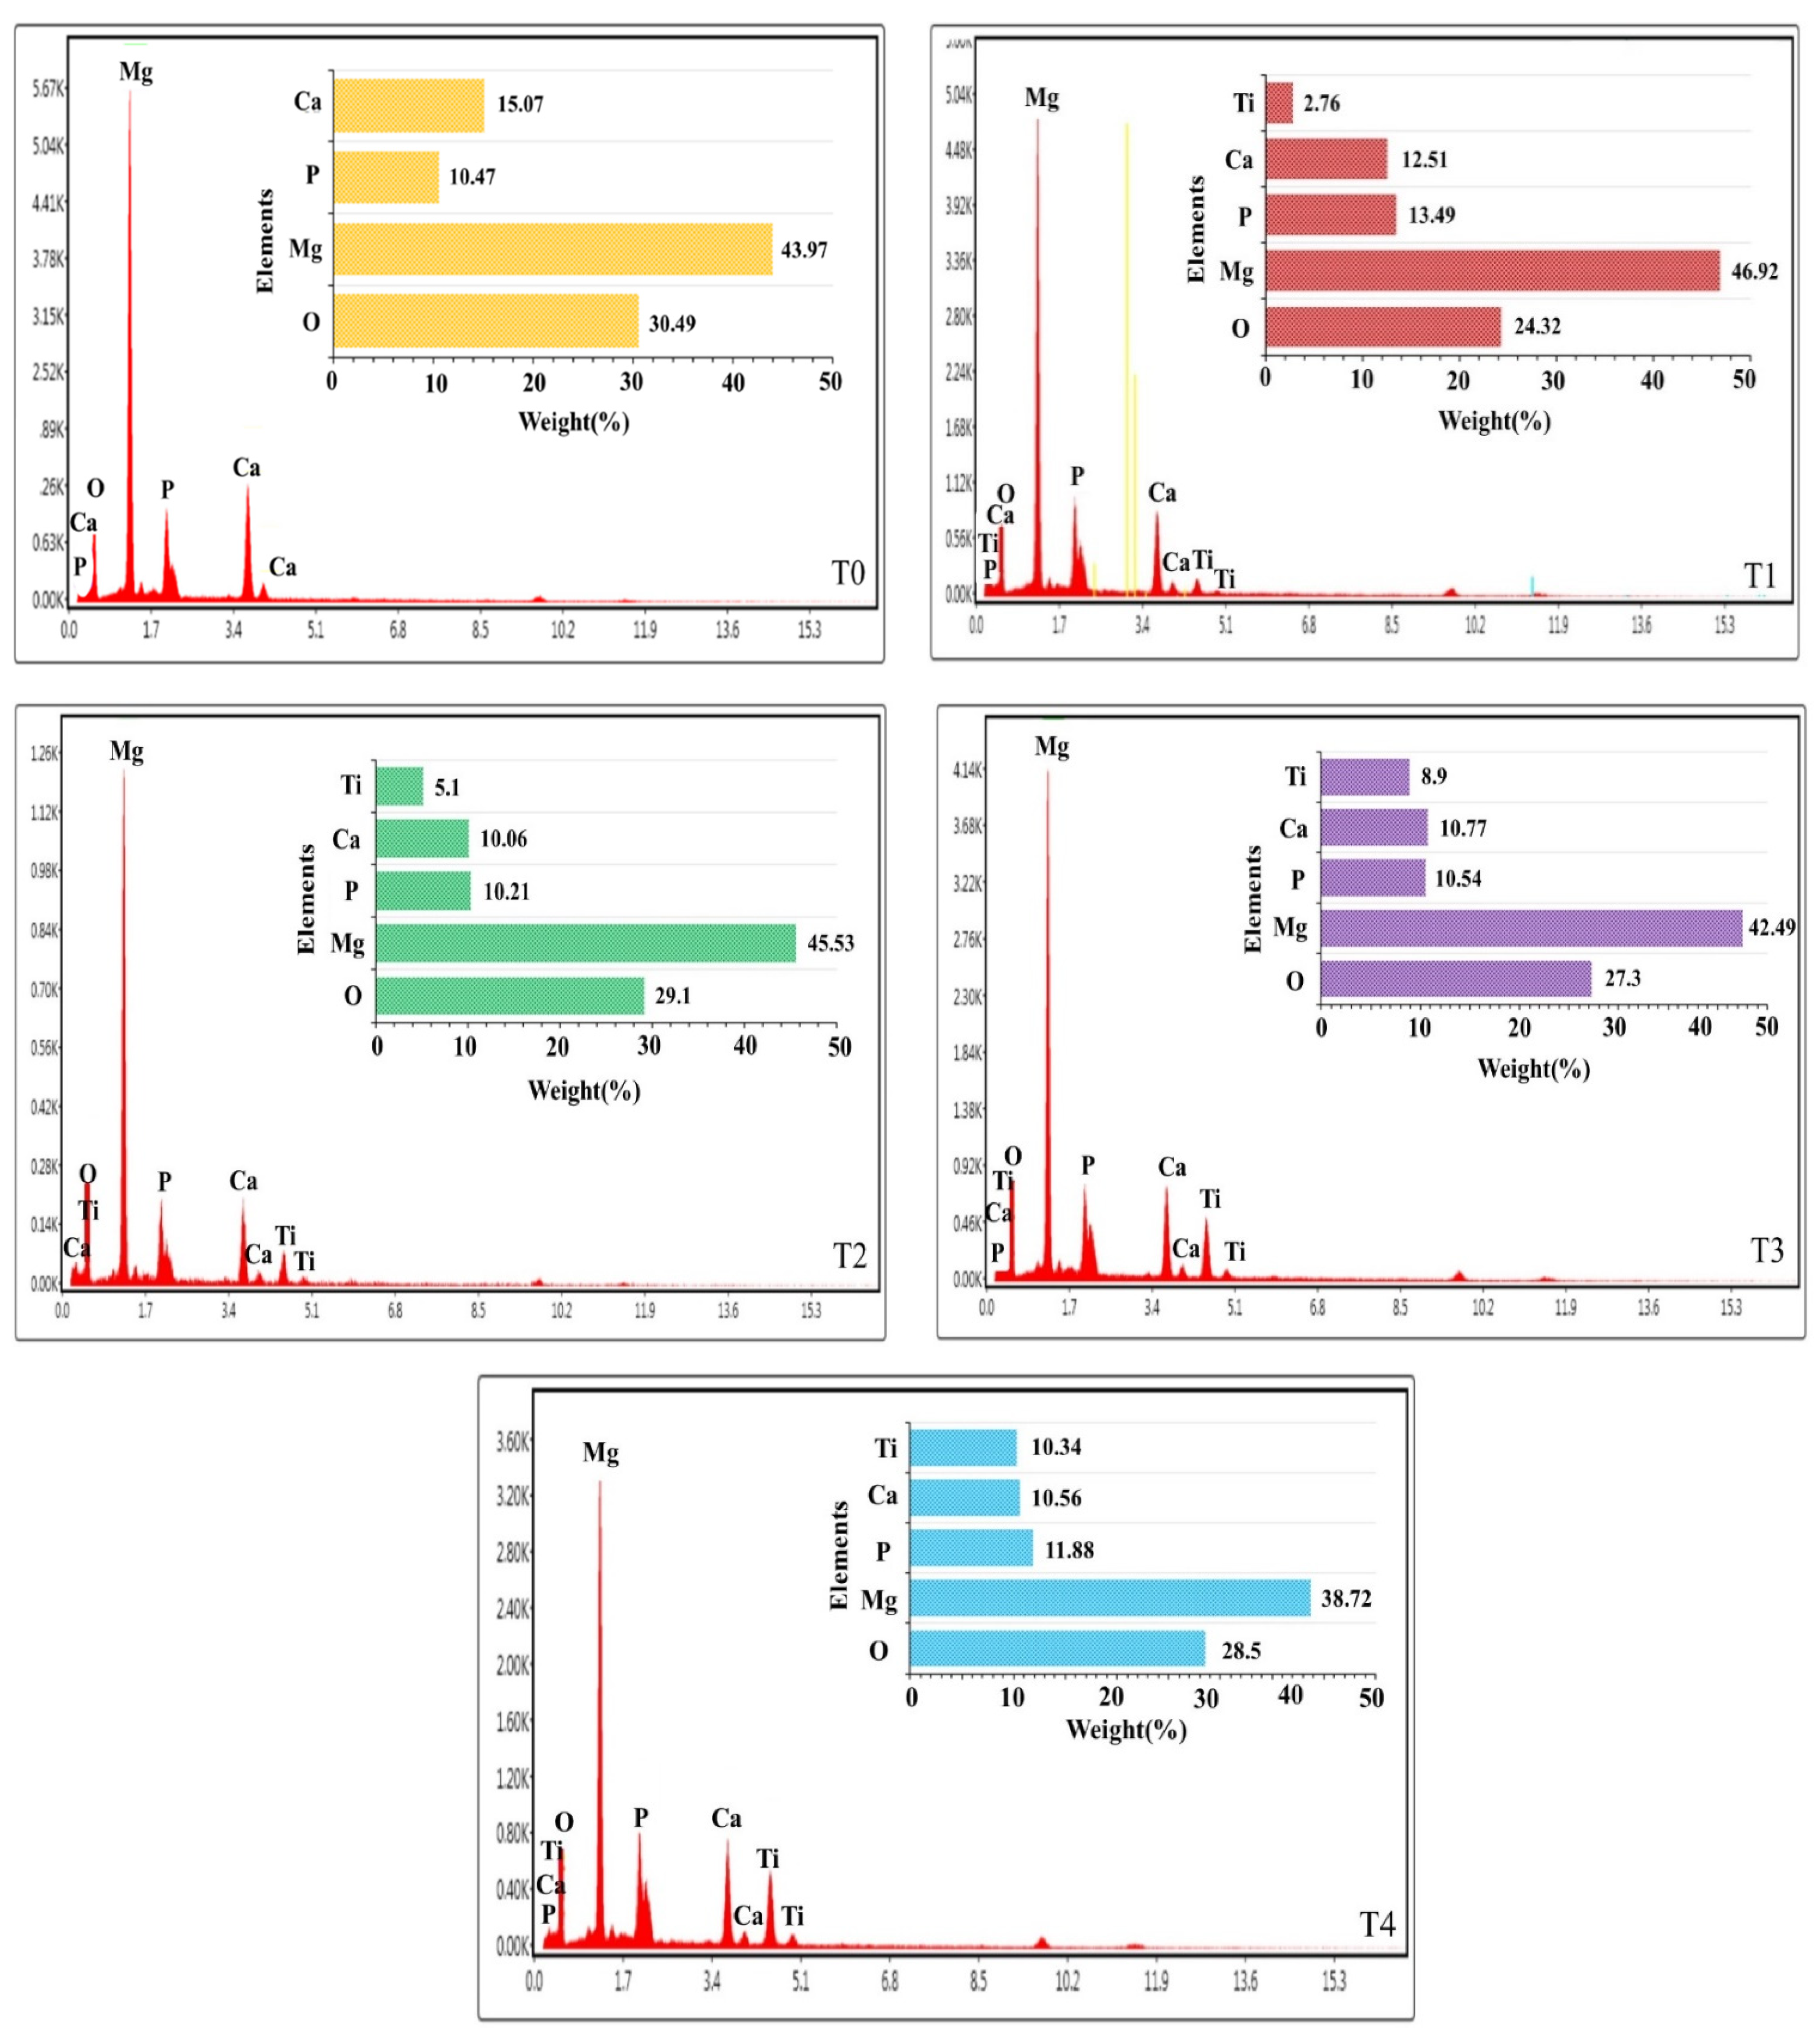
3.3. Phase and Elemental Composition of Coatings

Figure 5 shows the XRD patterns by the grazing method of different samples. The presence of Mg and MgO phases shows that due to the increase in the temperature of the molten substrate, some of it is oxidized and some of it remains uncombined in the coating [81,82,83]. The presence of the peak related to the Mg3(PO4)2 phase shows that the anions from the phosphate base electrolyte reacted with the cations resulting from the dissolution of Mg substrate and caused the formation of this phase. The HAp phase is also observed among the peaks, which indicates that these particles were successfully embedded into the coatings to form HAp/MgO composite coatings [84]. Another phase that is observed among the peaks is the Mg2TiO4 phase, which indicates that part of the TiO2 NPs has passively entered the coating due to the melting of the NPs; then, their reaction with MgO resulted in the formation of the Mg2TiO4 phase. There were no peaks corresponding to the TiO2 NPs in any of the samples. This is not the reason for the absence of neutral NPs inside the coatings because, in addition to the fact that the amount of TiO2 NPs in the coating electrolyte is very small, this phase probably exists in very small amounts of crystalline phases. The peaks of this phase overlapped with other phases and strengthened them.
The distribution map of the main constituent elements of the composite PEO coatings created in the electrolyte containing different concentrations of TiO2 NPs is shown in Figure 6. The main elements of the coating include O, Mg, P, Ca, and Ti. The elements identified in the coatings are uniformly distributed throughout the layer without any accumulation or segregation. For the NPs dispersed in the electrolyte to participate in the formation of the PEO coating, it is necessary to distribute them at the coating/electrolyte interface by an external force. One of the effective parameters that can direct the nanoparticle toward the anode is the electrophoretic force. The results of the zeta potential test of TiO2 NPs showed that the zeta potential of these particles in the pH range of 11 to 13 is between −21.8 and −22.6 mV. This causes the surface of the NPs to have a negative charge. Therefore, NPs can migrate toward the anode (substrate) in a strong electric field. In addition to the electrophoretic force, mechanical mixing causes particles to move toward the anode. The distribution map of the elements shows that most accumulation of the Ti element is observed around the pores and on the surface. It can be concluded that a high fraction of NPs is trapped in the molten oxide that was ejected from the discharge channels and was deposited on the surface, and a smaller fraction of TiO2 NPs was incorporated in the coating through surface defects, such as pores and cracks.
The EDS map and the amounts of the main constituent elements of the PEO coatings are presented in Figure 7. The source of Mg in the coatings is the magnesium substrate, the source of O is the compounds in the electrolyte, the source of P is sodium phosphate and HAp, the source of Ca is Hap, and the source of Ti is TiO2 NPs. Among the constituent elements of all coatings, the highest percentage belongs to the Mg element, which is due to the melting of the substrate during the PEO process. With the increase in the concentration of TiO2 NPs, the amount of Mg decreased, due to the creation of a thicker coating. High absorption of TiO2 particles occurs due to high discharge energy. The particles are placed inside the pores by the electrophoretic force. This force increases with the increase in the concentration of NPs and causes more NPs to enter the coating.

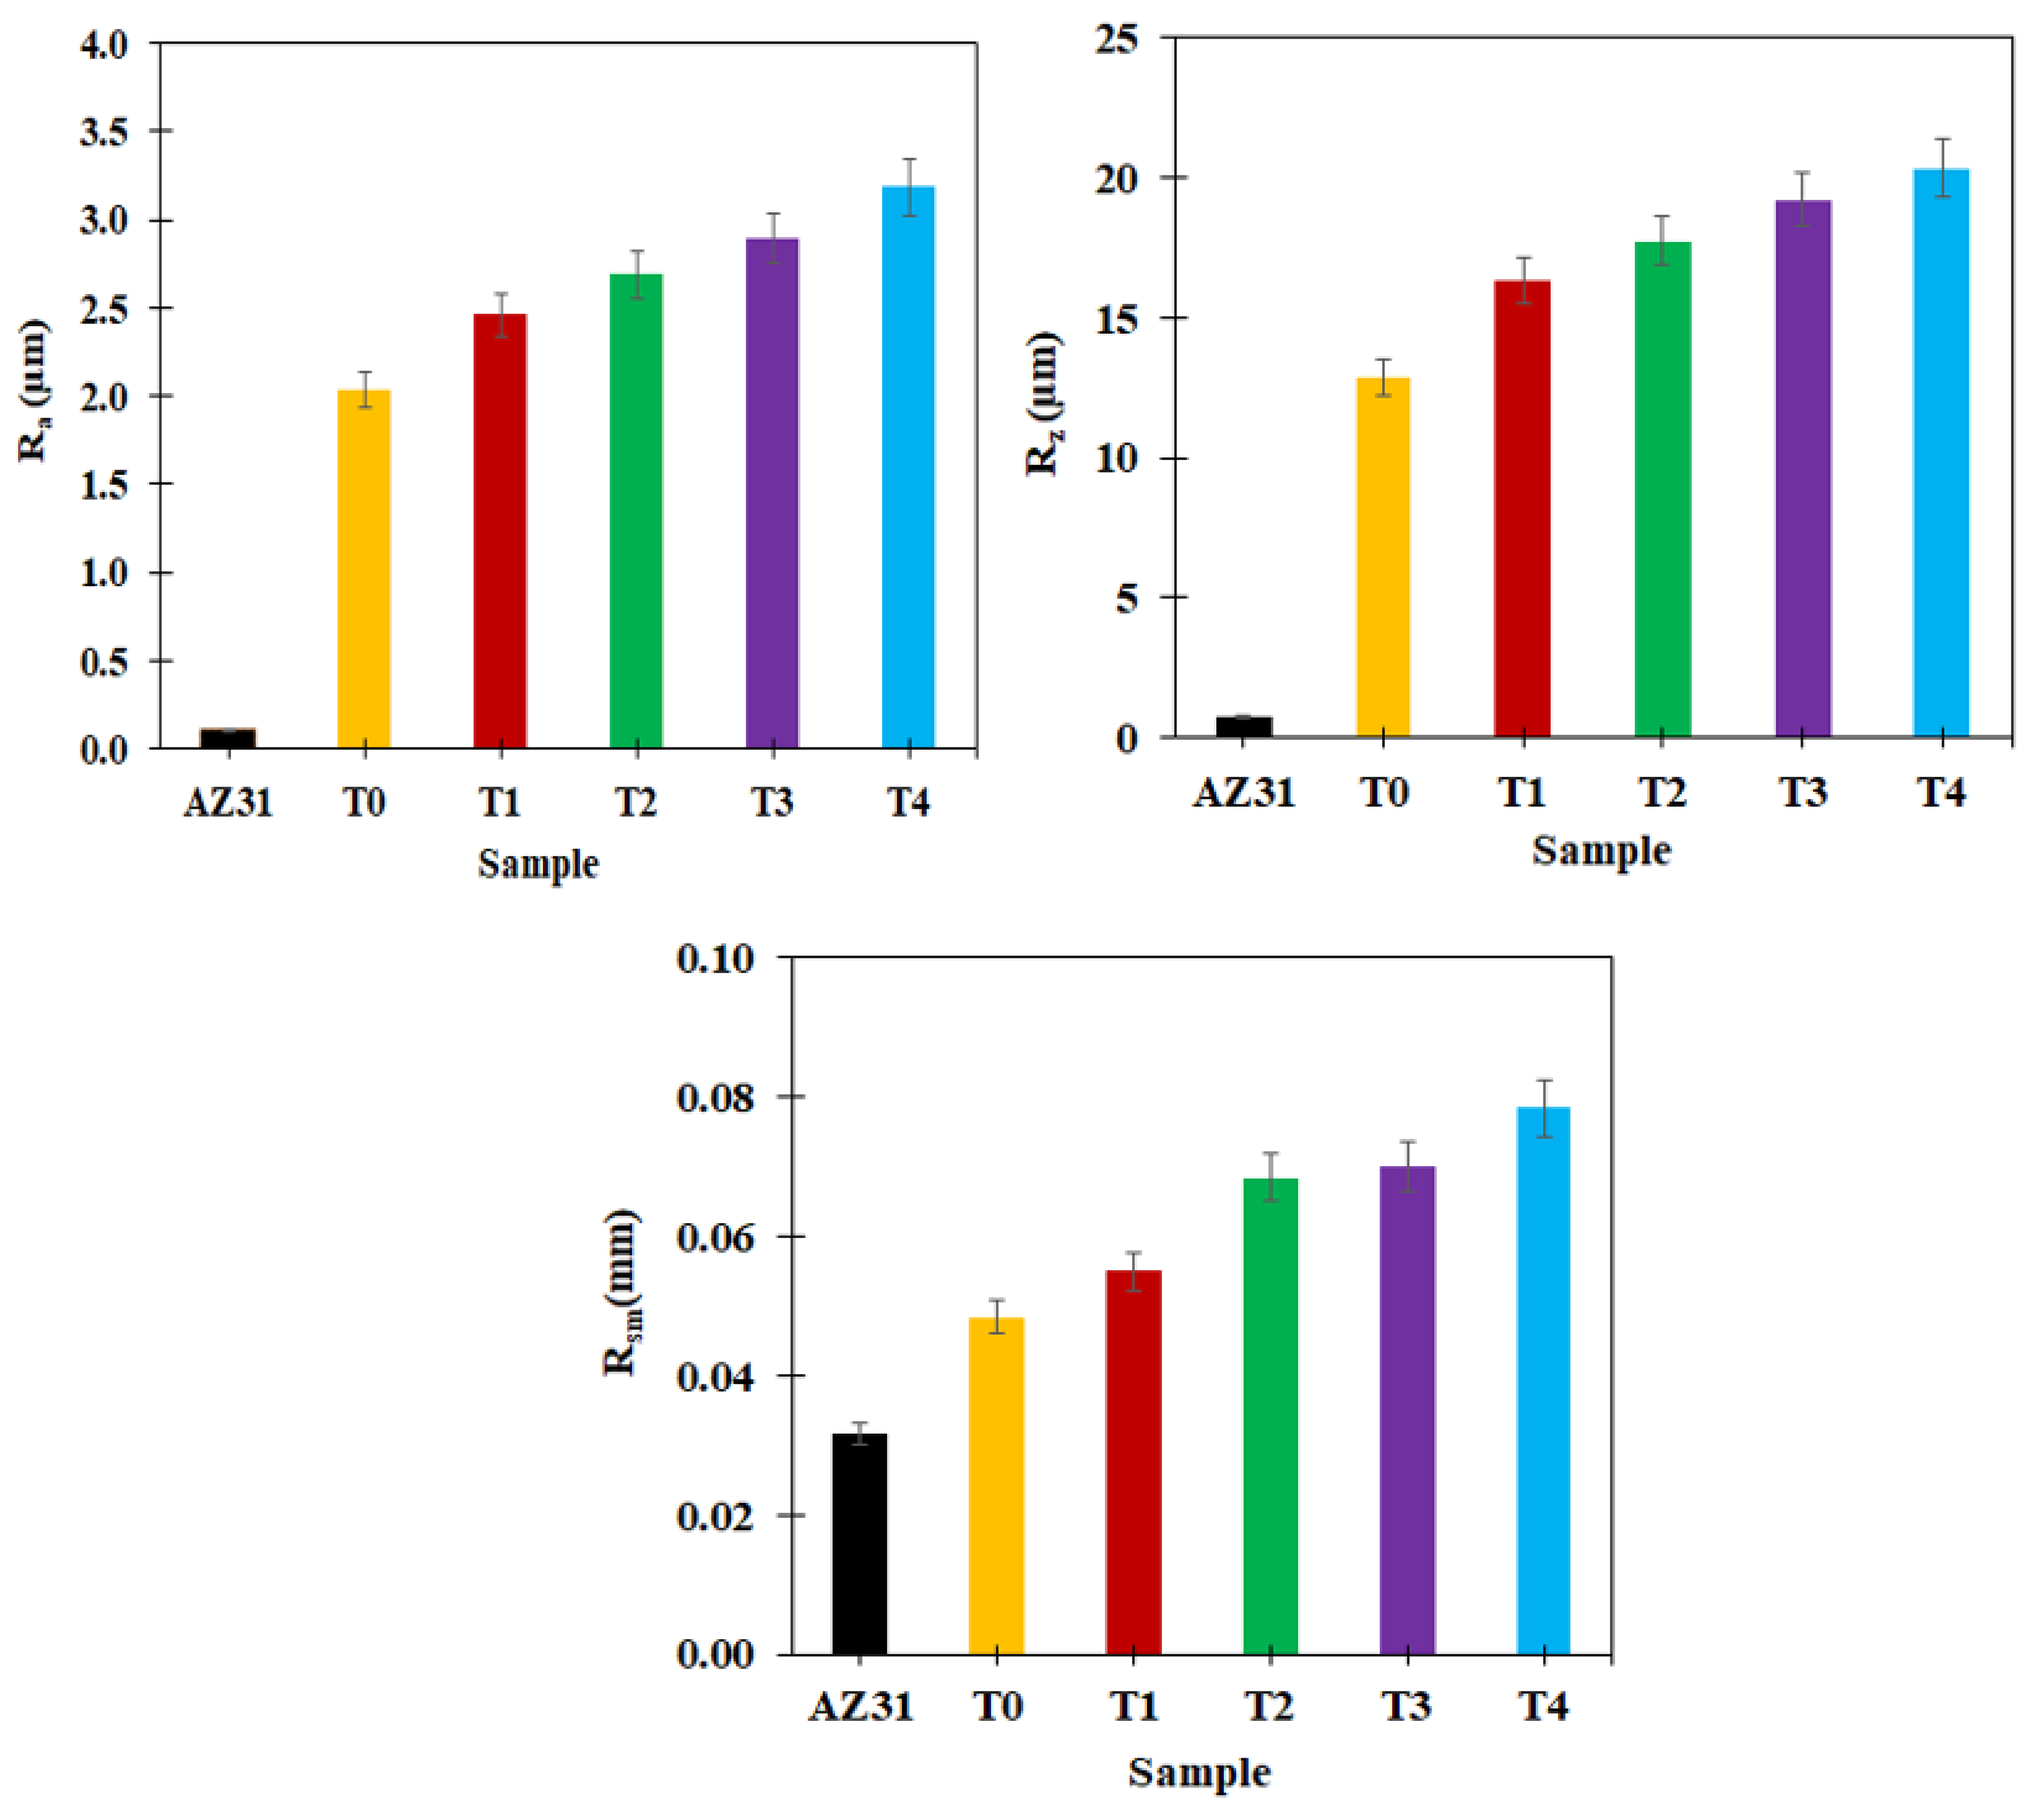
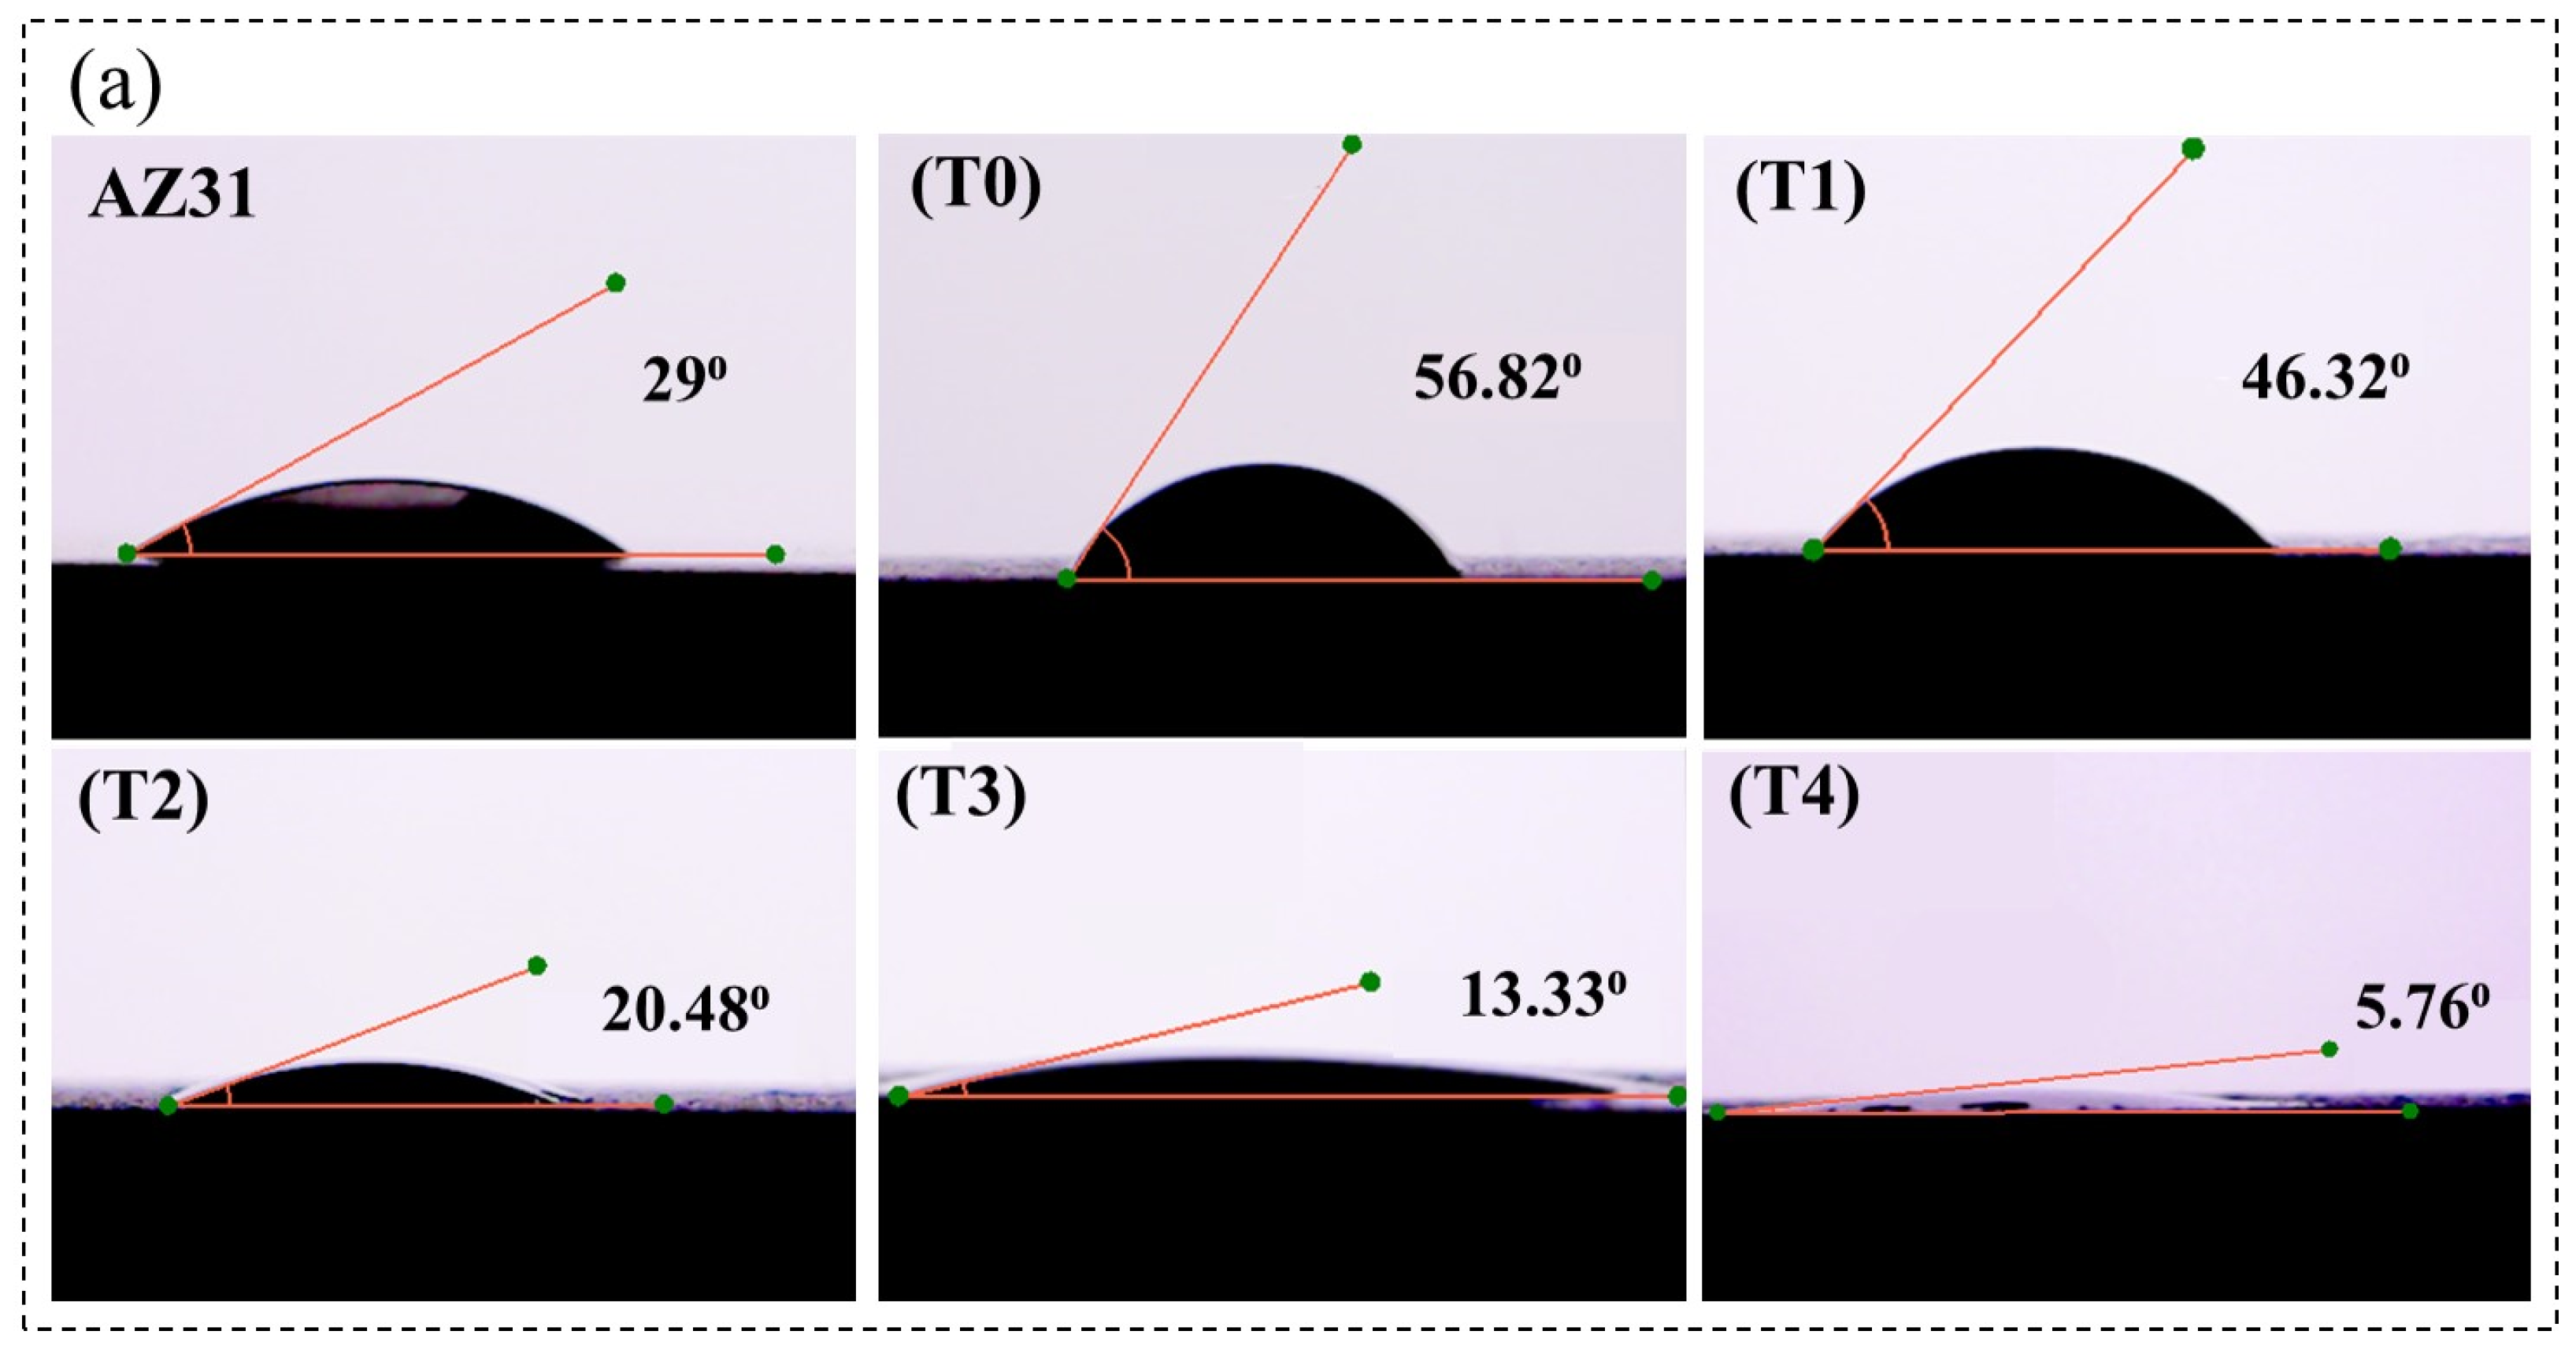
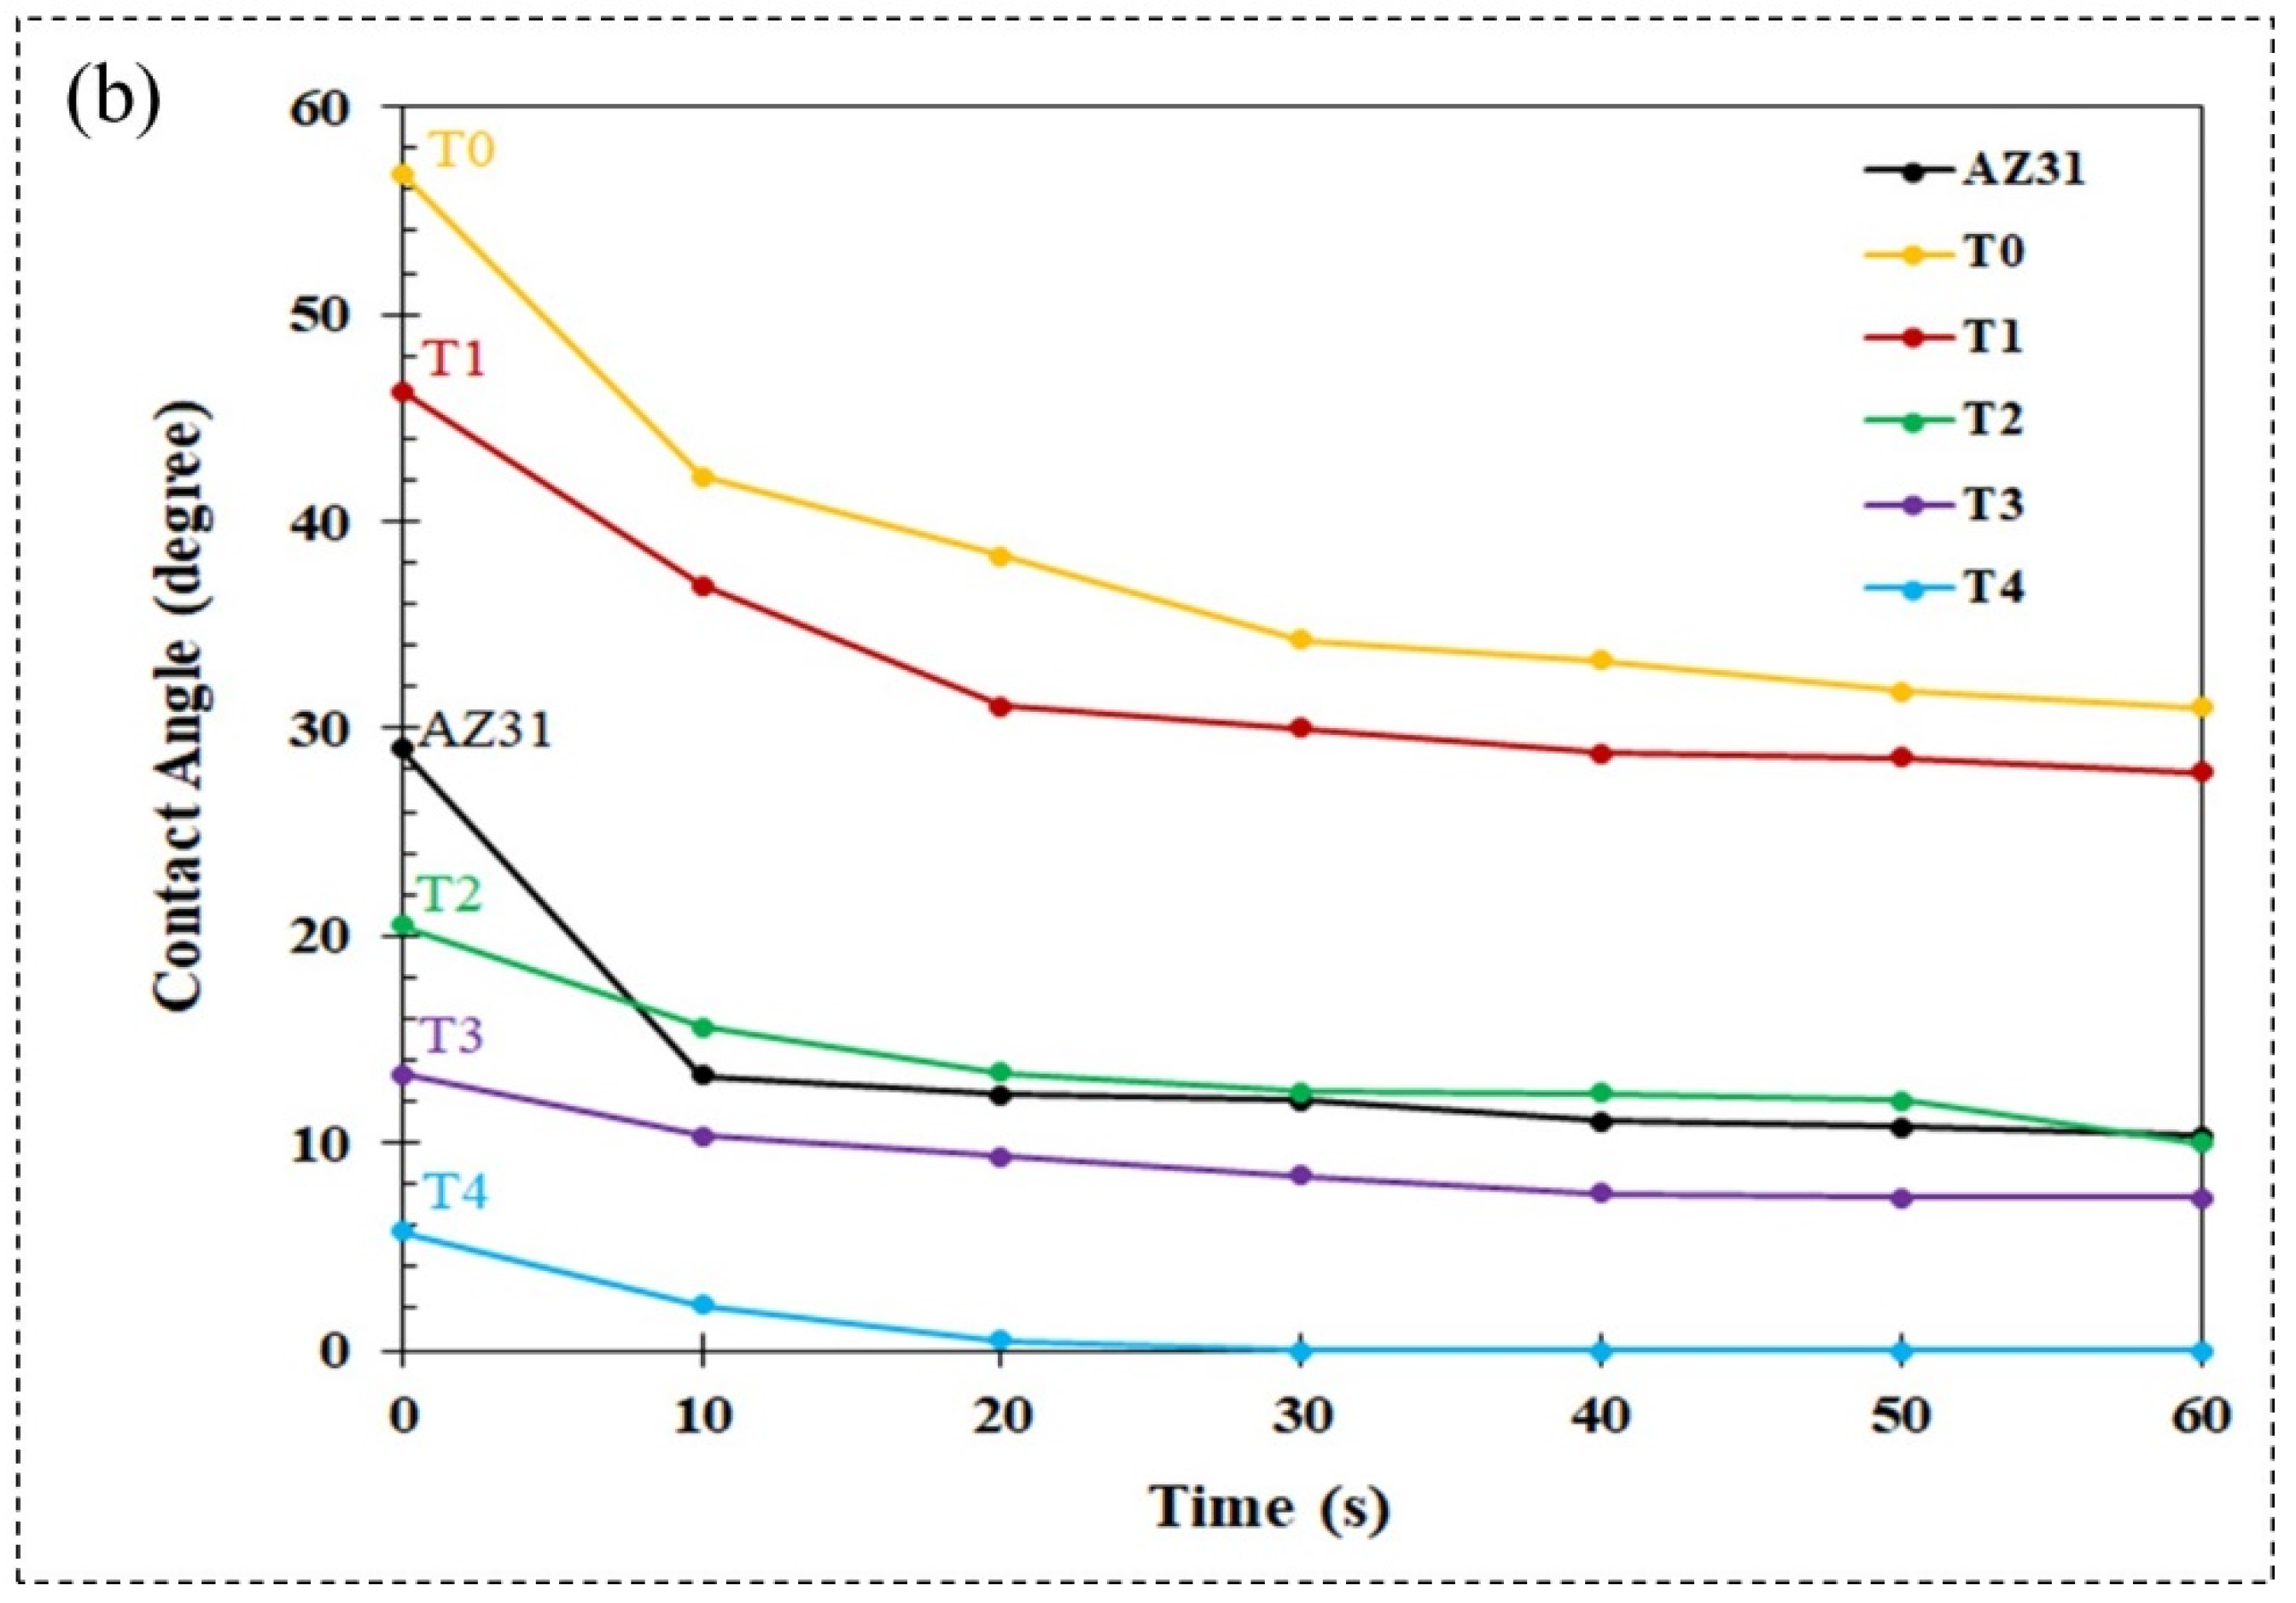
3.4. Roughness and Wetting of the Coatings

Surface roughness is one of the important properties in determining the performance of objects with their surrounding environment and affects other surface properties, such as corrosion properties, wear, and wettability of solid materials, especially biological materials. Ra, Rz, and Rsm parameters were used to examine the surface roughness of an uncoated AZ31 sample and coated samples in the electrolyte containing different concentrations of TiO2 NPs. Ra, Rz, and Rsm parameters, respectively, show the average deviation from the evaluated line, the maximum distance between the peak and the valley, and the average width of the surface furrows. Figure 8 shows the roughness values of Ra, Rz, and Rsm of the PEO-coated samples. As can be seen in the figure, with the increase in the concentration of NPs, all three values of the surface roughness of the coated samples increased. Increasing the concentration of NPs in the electrolyte causes an increase in the final and critical voltage in the voltage–time diagram, which causes sparks with greater intensity and energy on the surface. Creating a spark with more intensity and energy causes deeper porosity on the surface, which increases the surface roughness of the samples by increasing the concentration of NPs.
Wettability is one of the important properties of solid surfaces, which has a significant effect in many applications for biological users. The wettability of a surface can affect its other properties, such as corrosion and wear. The roughness, chemical composition, and microstructure of the surfaces are important factors affecting the wetting properties of the surfaces. The most common method of measuring surface wettability is to examine and photograph a small volume of liquid on the surface, and measure the contact angle of the droplet with the surface. According to the type of microstructure, surface wettability can be divided into three models: Young, Wenzel, and Cassie–Baxter. Young’s model is for smooth and homogeneous surfaces. Wenzel’s model is for the condition in which a drop in contact with the surface can penetrate into all the holes and grooves of the surface. Cassie–Baxter’s model is for the condition in which the liquid cannot penetrate into the surface cavities and is only placed on the surface irregularities. Figure 9a shows the wettability of PEO-coated specimens at different concentrations of TiO2 NPs at the first contact time of the droplet with the surface. As can be seen, the wetting angle decreases with the increasing concentration of TiO2 NPs. The presence of TiO2 is a highly hydrophilic material, due to its open nature and its ease in forming hydrogen bonds with water molecules. Thus, the presence of more TiO2 nanoparticles on the surface of the coatings helps to increase the coating wettability by increasing the of TiO2 nanoparticles concentration in the electrolyte. Figure 9b shows the change of the wetting angle of the coatings with a time of 60 s. As is clear in Figure 9b, with increasing time, the wetting angle of all samples decreased, which can be attributed to the roughness of the coatings. Considering that both surface roughness and wettability increased with the increase in the concentration of TiO2 NPs, it can be concluded that the wettability of the coated samples follows Wenzel’s model. Wenzel’s relationship shows that if the contact angle of the surface is more than 90 degrees, the wetting angle increases with the roughness of the surface, and if the contact angle of the surface is less than 90 degrees, the wetting angle decreases with the roughness of the surface [85].

3.5. Corrosion Behavior
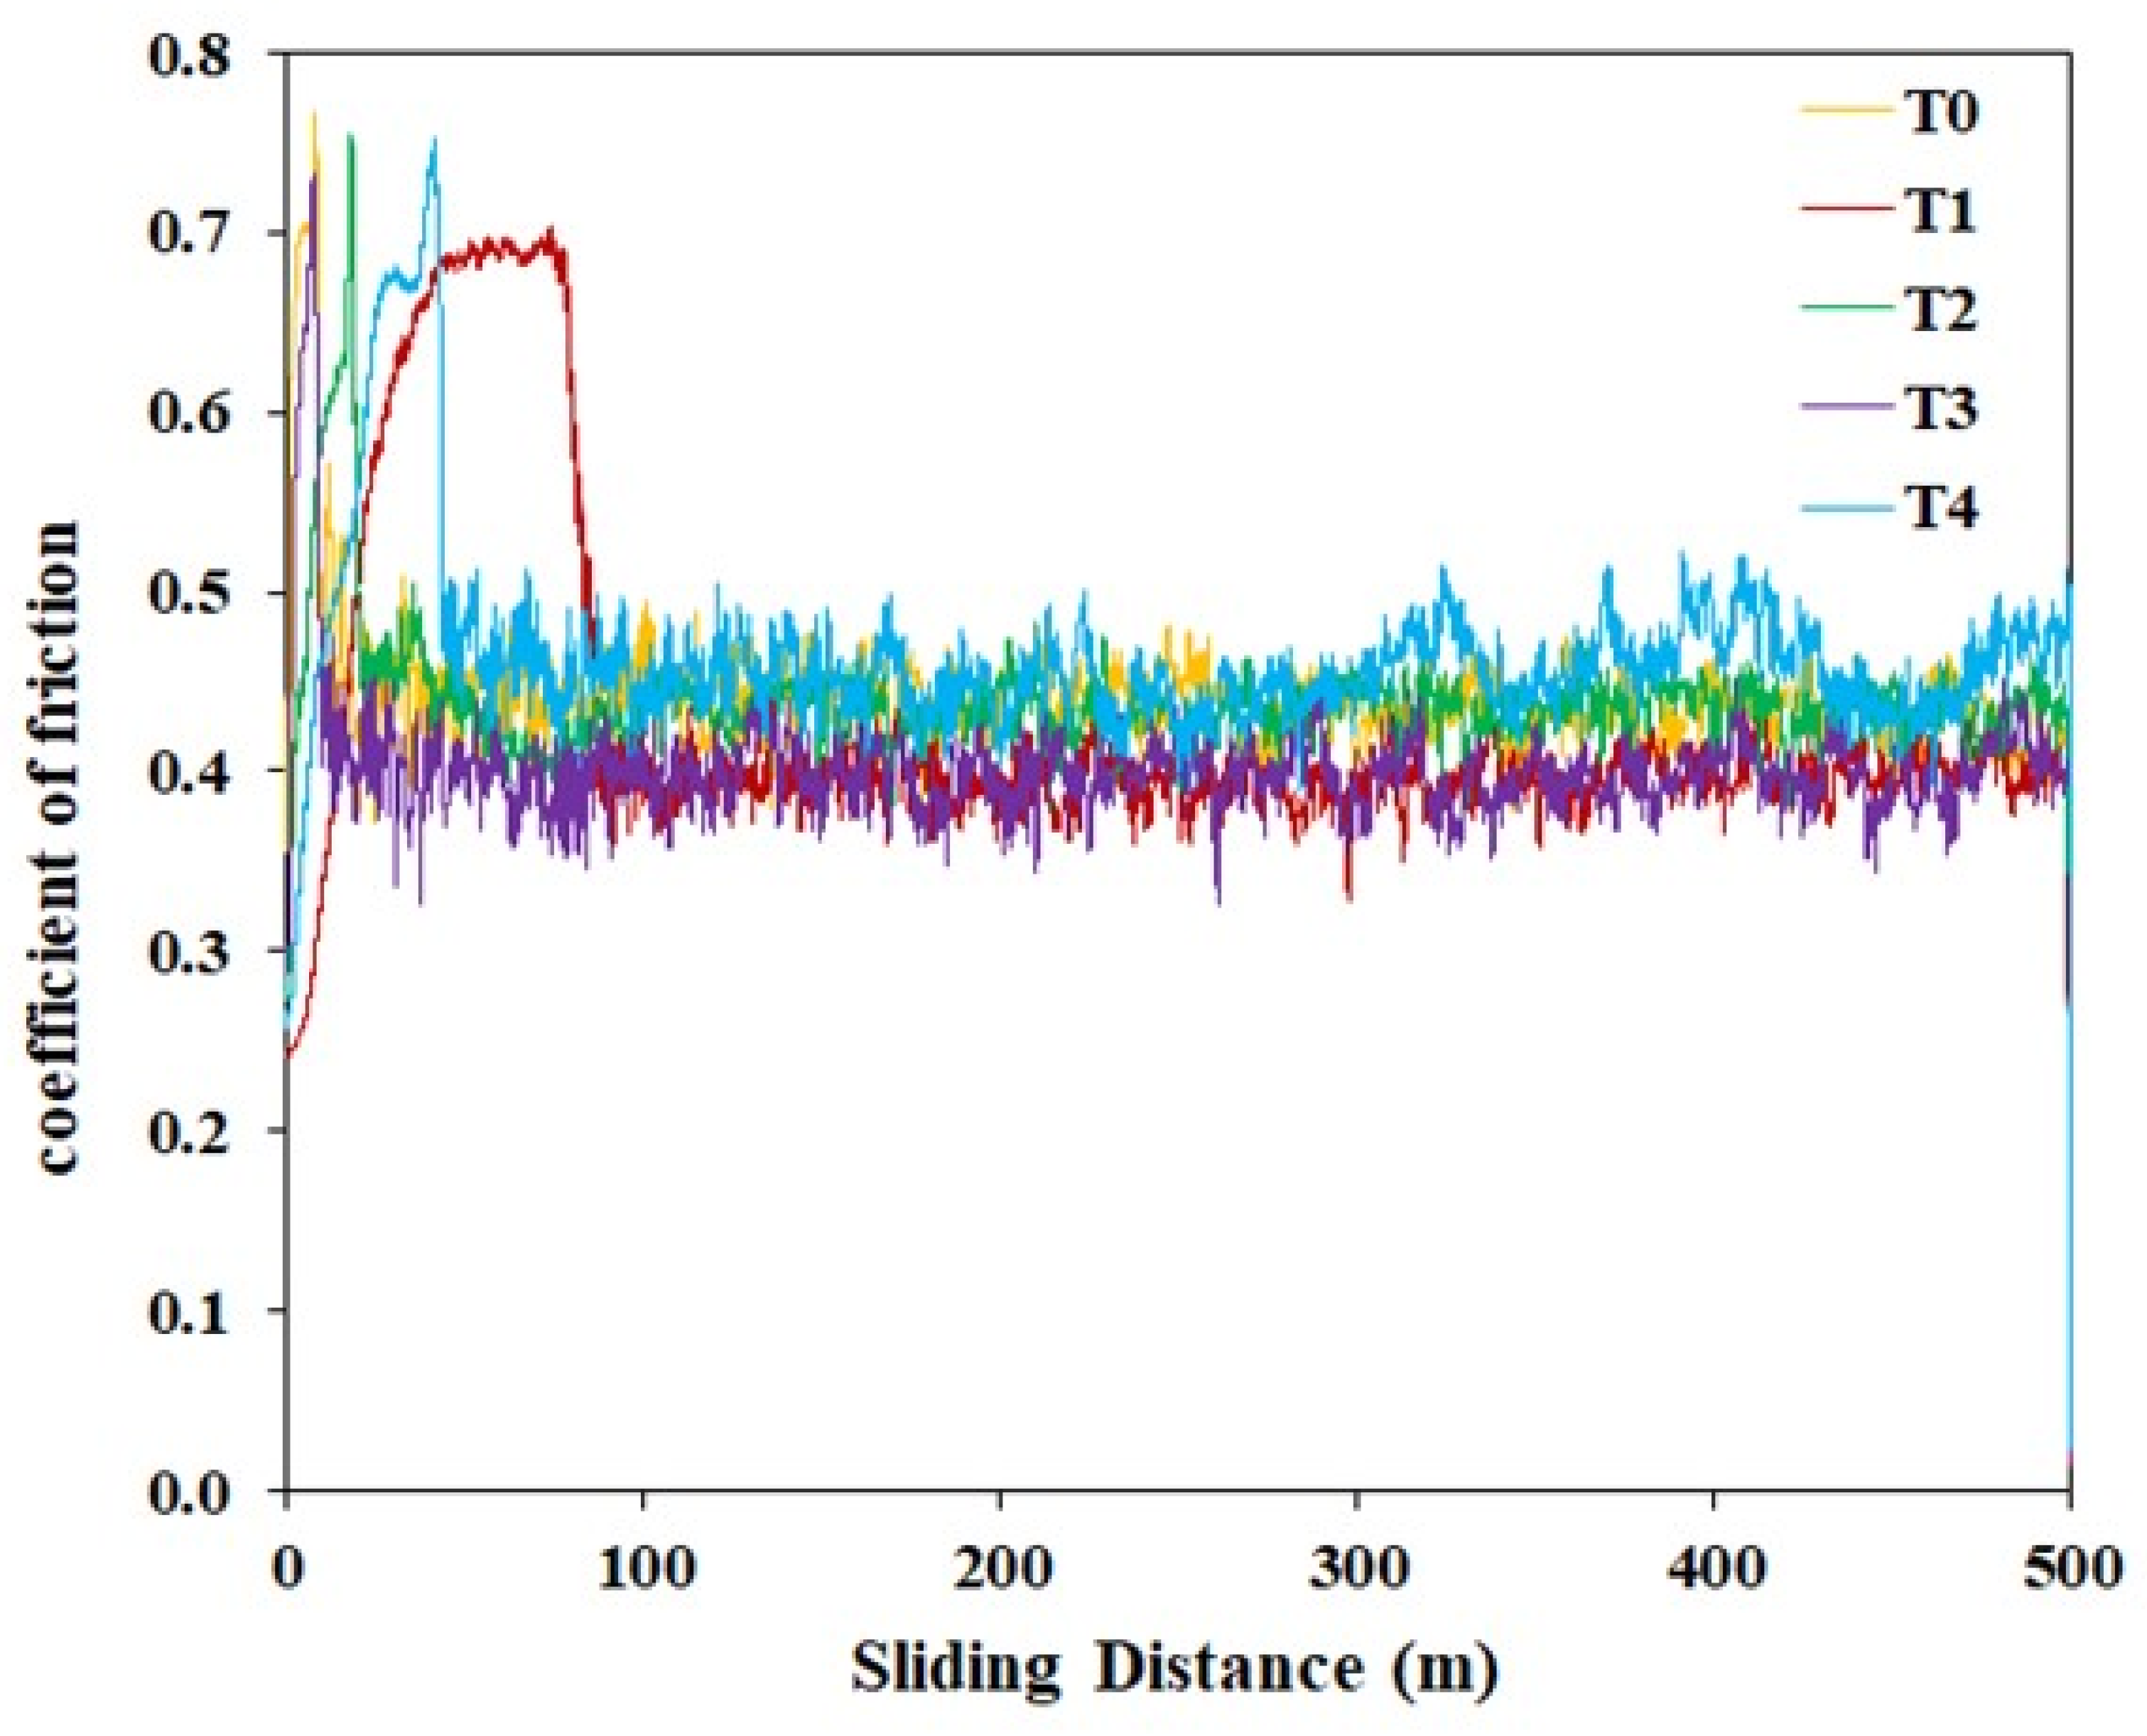
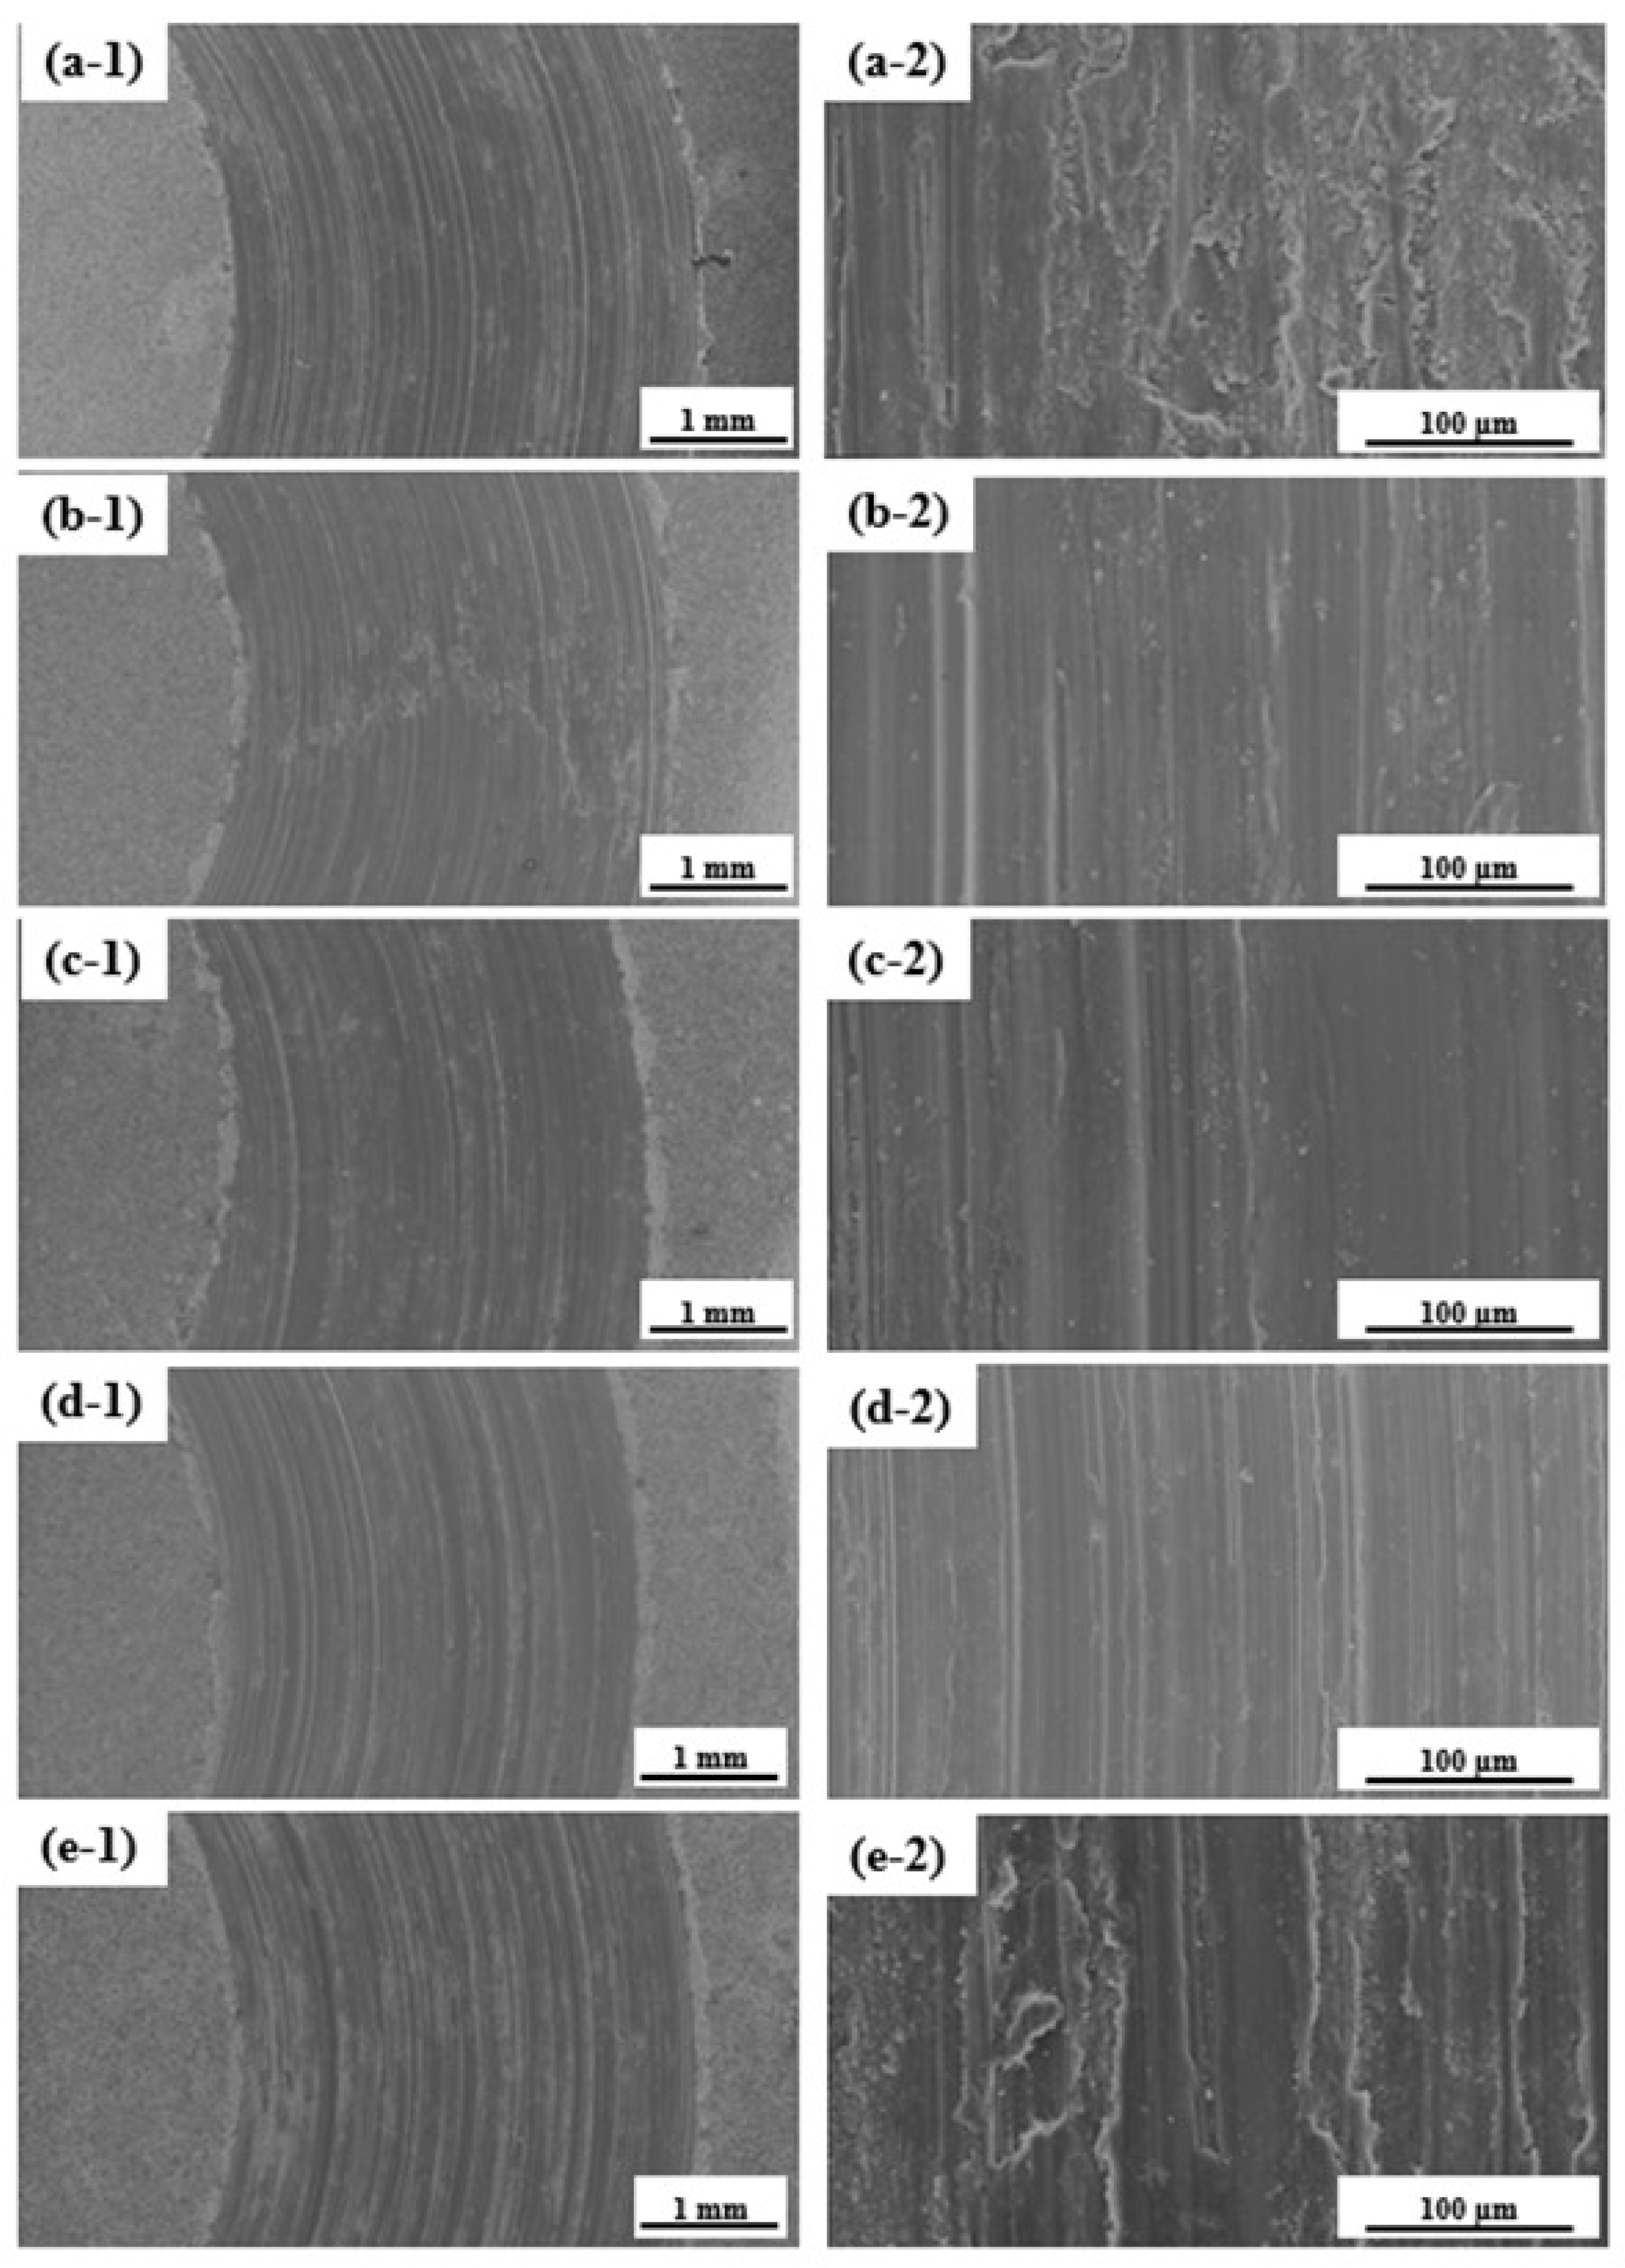
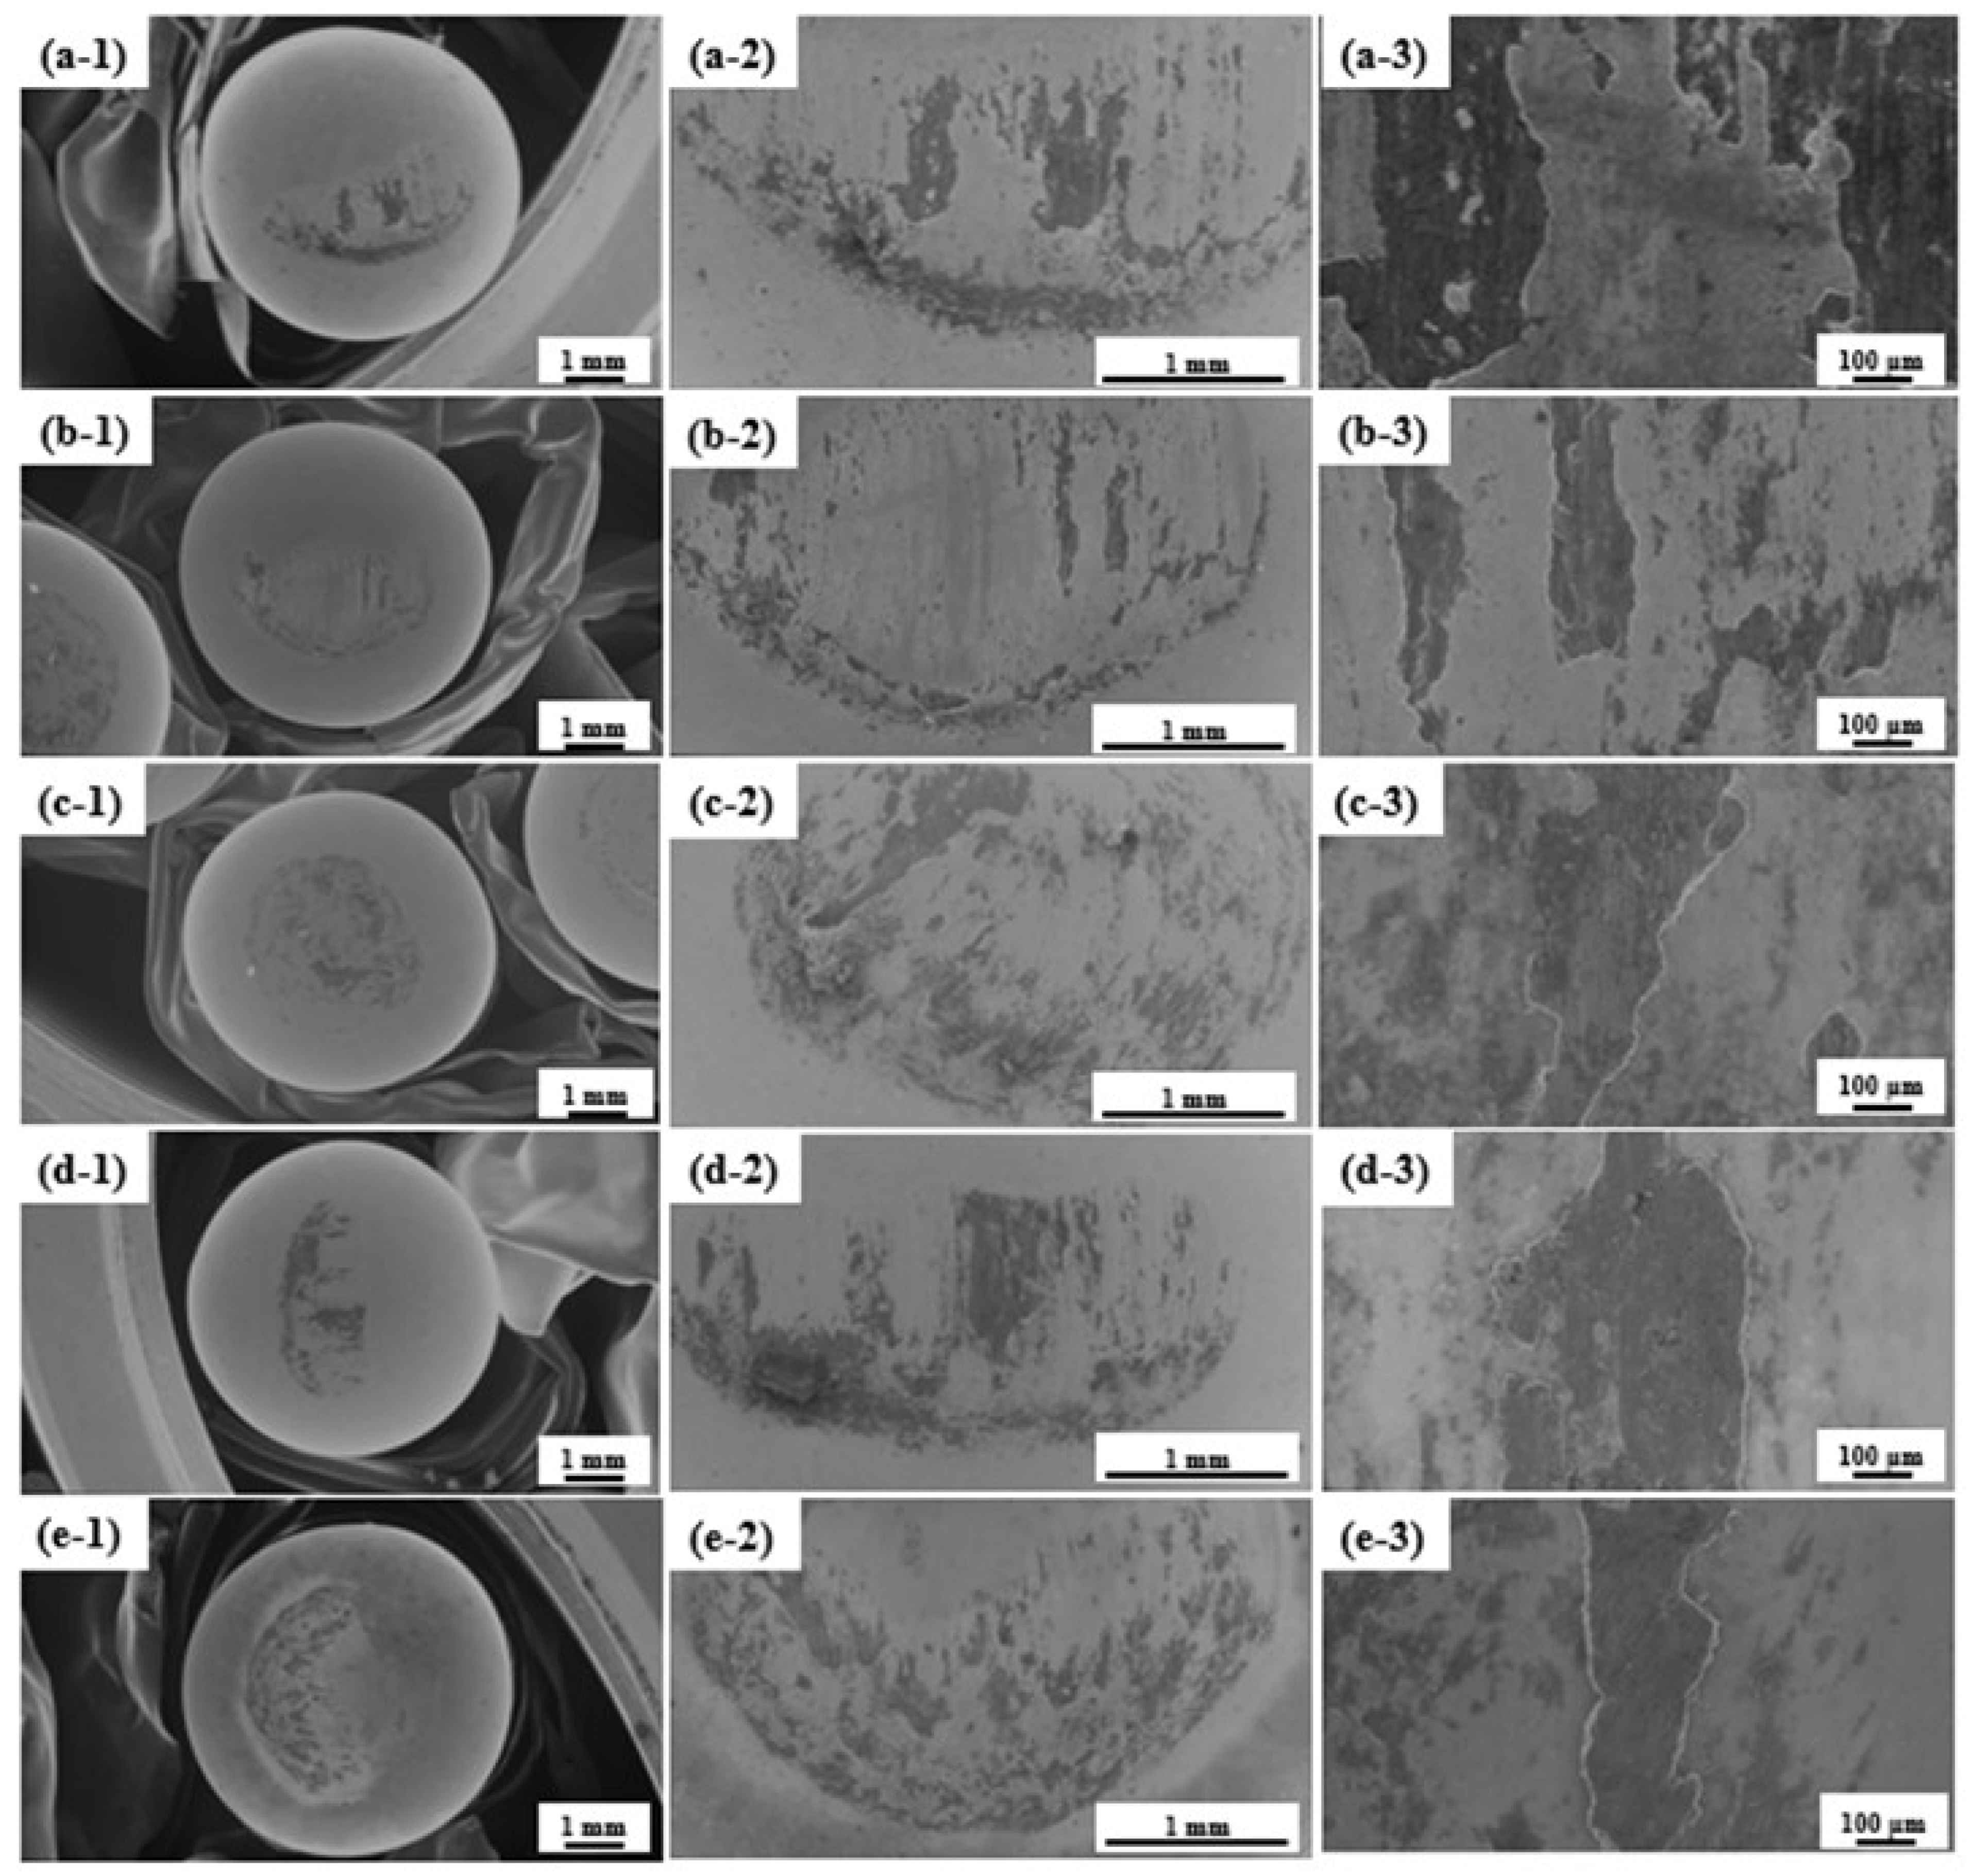
Figure 10 shows the EIS plots for the uncoated and PEO-coated samples for different immersion times (1, 24, 48, and 72 h) in the SBF solution. As shown in Figure 10a–e, the shape of the Nyquist curves of all coated samples is the same, but the curve for the AZ31 alloy sample is different from that of the coated samples. The difference in the Nyquist curve of the uncoated sample is due to its very low corrosion resistance and is caused by the induction behavior of this sample. When the uncoated AZ31 alloy sample is exposed to the atmosphere, an oxide film is immediately formed on this sample, and when this alloy is immersed in the SBF, due to the low resistance of the oxide layer against the corrosion of the corrosive solution, it passes through the oxide layer and reaches the AZ31 substrate, causing inductive behavior [86,87,88].
By observing the Nyquist curve of samples coated at various concentrations of TiO2 NPs, it is clear that after 1 h of immersion in SBF solution, all the curves include two capacitive semi-rings. At low frequencies, the loop created is related to the inner dense layer; at high frequencies, the created loop is related to the outer porous layer. In Figure 10a–e, it is clear that the best corrosion performance after 1 h is related to the sample containing 1 g/L of TiO2 NPs, and the diameter of the semicircles in the Nyquist plots decreases with the increase in the concentration of NPs. This indicates a reduction in the corrosion resistance of the coatings [89,90,91]. The Bode curve of the uncoated and coated samples is shown in Figure 10f–j. As is clear in this figure, in the range of low frequencies, the value of the impedance (Z), which represents the corrosion resistance of the samples, decreases with the increase in the concentration of TiO2 NPs from 1 to 4 g/L. The results of the EIS test after 72 h show that corrosion resistance increased in all samples with increasing immersion time.
The proposed equivalent circuits for modeling the electrochemical response of the uncoated sample and the coated samples in the electrolyte containing different concentrations of NPs are presented in Figure 11. It should be noted that for a better fit of the data with the equivalent circuit, instead of using the capacitor element (C), the constant phase element (CPE), which is a non-ideal capacitor, was used. The relationship of the CPE is as follows [92]:
Z C P E = 1 Y 0 j W n
Here, Y0 is the CPE constant, ω is the angular frequency, and n is the empirical power, which is in the range of 0 to 1. Figure 11a shows the equivalent circuit of the sample of AZ31 alloy without coating. In this circuit, Rs is the solution resistance, RO and CPEO are, respectively, related to the resistance and CPE of the external porous layer, and RL and L are, respectively, related to the resistance of the inductor and the inductor at low frequencies. Figure 11b shows the equivalent circuit of coated samples [93,94]. In the equivalent circuit related to coated samples, Rs is the resistance of the solution between the coating surface and the reference electrode, Ri and CPEi are, respectively, related to the resistance and CPE of the inner compressed layer, and RO and CPEO are, respectively, related to the resistance and CPE of the external porous layer. Due to the use of the same corrosion solution, the resistance value of the solution is almost the same for all coatings. The parameters related to the circuit of the proposed equivalents of Figure 11 are presented in Table 4. The outer porous layer has less resistance than the inner dense layer, which is due to the presence of sparks during the PEO process. This shows that the inner layer of the coatings plays a more important role against the penetration of destructive ions, due to having fewer defects and a denser structure. As is clear in Table 4, the highest resistance values are related to sample T1 and with an increasing concentration of TiO2 NPs from 1 to 4 g/L, the resistance of the outer and inner films of the coatings decreased. The corrosion resistance of a surface and the properties of the oxide layer, such as phase composition, thickness, wettability, and structural defects, are inextricably linked. The different surface structures (pore diameters), thicknesses, and contact angles of the ceramic layers obtained in this study changed significantly with increasing TiO2 concentration, while the phase compositions remained unchanged for all oxide layers. It is widely believed that larger micropores increase the actual surface area exposed to the corrosive solution and decrease corrosion resistance. Additionally, previous researchers stated that increasing the coating thickness has a positive effect on corrosion resistance. However, in light of the above analysis, this trend in corrosion results may result from an increase in the percentage of porosity and pore size, which increases exposure to destructive ions. Increasing the concentration of NPs from 1 to 4 g/L causes an increase in the percentage of porosity, an increase in wettability, and an increase in the roughness of the coatings, causing an increase in the contact of the corrosive solution with the coatings and, as a result, a decrease in corrosion-resistance properties. The reason for the increase in corrosion resistance with time is that the defects and porosity of the coatings are filled by products caused by corrosion. Another reason for increasing the corrosion resistance of the coatings is the presence of HAp and its growth and the formation of calcium phosphate deposits in the samples. According to the obtained results, we found that the best corrosion performance after 72 h is related to T1 samples.
Wang et al. [73] found that increasing the concentration of TiO2 NPs in the coatings increases the amorphous phases in them, and the increase in the amorphous phases decreases the corrosion performance of the coatings. The preferential dissolution of corrosion occurs in surface irregularities, such as the amorphous phases. The increase in the amorphous phases (caused by the increase in the concentration of NPs) in the external porous layer causes an increase in corrosion attacks on this layer, which leads to an increase in the penetration of ions into the inner dense layer and damage to it.
Figure 12 shows the FE-SEM images at two different magnifications and the results of EDS for sample T1 after 72 h of immersion in the SBF solution. As seen in Figure 12, after 72 h, the surface pores are filled and HAp has grown. A comparison of the amount of calcium and phosphorus elements of sample T1 before the corrosion test and after 72 h of immersion shows that the amount of calcium and phosphorus increased, which indicates the growth of HAp and the formation of calcium and phosphate deposits. This led to the improvement of the corrosion behavior of the samples by increasing the immersion time. Figure 13 shows the distribution map of the main constituent elements of sample T1 after 72 h of immersion. As is clear in the figure, there are calcium and phosphorus elements in the areas where precipitations are observed and around the surface pores.

3.6. Wear Behavior

Abrasion behavior depends on various factors, such as surface roughness and hardness, the chemical properties of the surface, the crystal structure of the material, the metallurgical properties of the surface, and the compatibility of two materials with each other. Surface roughness is one of the important and effective factors in the interaction between surfaces and, as a result, wear behavior. The roughness factor affects the contact stress, adhesion, and friction of two surfaces. When the roughness of the surfaces is very low, the particles between the two surfaces in contact establish a bond with each other and, as a result, increase the friction, due to the high adhesion force. When the roughness of the surfaces is high, the two surfaces are mechanically stuck together and the asperities are placed inside each other, thus increasing friction. Therefore, it can be concluded that to increase wear resistance, the roughness should be optimal. Another factor influencing wear-resistance properties is surface hardness. The higher the hardness, the lower the rate of wear and friction [95,96]. The wear resistance of PEO coatings is a characteristic that can be controlled by the degree of roughness and hardness of the coatings [97].
The changes in the friction coefficient according to the wear distance of the coated samples are shown in Figure 14. The observed fluctuation of the friction coefficient in all samples is due to the uneven distribution of porosity and surface cracks on the coated samples. The average coefficient of friction and weight loss of the specimens during the wear test is shown in Table 5. By comparing PEO coatings on magnesium alloy in electrolyte without TiO2 NPs and containing TiO2 NPs, Forno et al. [58] found that adding TiO2 NPs to the coatings increases the hardness of the coatings. This increase in hardness can be due to the strengthening role of the second phase by increasing the concentration of NPs. The results show that in the sample without TiO2 NPs (T0), the high average value of the friction coefficient can be due to the low hardness of this sample and the low roughness of the coatings. Because low roughness increases the adhesive force between the sample and the pin, the friction coefficient increases.
By adding TiO2 NPs, the average coefficient of friction and the lost weight of the samples decreased initially, which was due to the increase in the hardness of the coatings because of the increase in the concentration of TiO2 NPs and the increase in roughness, which caused less adhesion. However, increasing the concentration of NPs up to 4 g/L increased the average friction coefficient and decreased the weight of the samples. By examining the roughness of the coatings presented in Figure 8, and the amount and size of the pores presented in Figure 2, it can be concluded that the increase in the roughness and the size of the pores, due to the increase in the concentration of NPs up to 4 g/L in the coatings, increases the mechanical locking of the samples and the abrasive tool. This leads to severe abrasive wear, an increase in the average friction coefficient, and a decrease in the weight of the samples. As a result, it can be concluded that the addition of NPs initially reduces the wear rate, but when the concentration of NPs exceeds a certain value, it no longer has a positive effect on the wear resistance properties, and because it increases the roughness, it can have a destructive effect on wear resistance.
Figure 15 shows the image of the wear path and the morphology of the worn surface of the coated specimens. The value of the width of the wear track of the samples is presented in Table 5. In Figure 15a-2, it is clear that in sample T0, there are some parts where separation occurred. In Figure 15b-2,c-2,d-2, which is related to samples with concentrations of 1, 2, and 3 g/L of TiO2 NPs, respectively, there is no trace of separated or severe plowing, and only very shallow plowing parallel to the sliding path is seen. Considering that these samples had a lower average coefficient of friction and weight loss than those of other specimens, it can be concluded that these samples performed better in the wear test and that the wear mechanism of these samples was abrasion. As shown in Figure 15e-2, which is related to the sample with a concentration of 4 g/L of TiO2 NPs, there are deep grooves with asperities parallel to the sliding direction, which indicates severe abrasive wear in this sample. As seen earlier, this sample has more surface roughness and porosity than those of other samples, causing mechanical locking of the sample and the abrasive tool in each other, resulting in deep grooves.
Figure 16 shows the chips produced in the wear test of the coated samples. Considering the plate debris as shown in Figure 16a and the low roughness of sample T0, it can be concluded that the wear is adhesive wear. When the surface roughness of the sample is low, the actual surface in contact between the two samples increases, and this increase leads to the welding together of the sample and the abrasive tool, and the wear occurs through the fracture of the welded surfaces, which causes separation and, as a result, adhesion wear. The debris of the samples with concentrations of 1, 2, and 3 g/L of TiO2 NPs are more uniform and smaller, and the effect of severely separated and plate-like or strip-like debris is less visible. In the sample with a concentration of 4 g/L of TiO2 NPs, in addition to fine and small debris, strip-shaped and large debris are seen. The presence of band-shaped debris in the samples with a concentration of 0 and 4 g/L of TiO2 NPs indicates that the coating in these samples has been destroyed earlier and has reached the magnesium substrate, because the strip-shaped chips are related to the wear of the magnesium substrate, which is much softer than the ceramic coating. In fact, small and powder-shaped chips are the result of wear of the ceramic coating, and strip-shaped chips are the result of wear of the soft magnesium substrate. This is consistent with the average friction coefficient and weight loss of the samples that can be seen in Table 5, because the average coefficient of friction and weight loss of the samples containing 0 and 4 g/L of TiO2 NPs is higher than that of the other specimens. In addition, due to the fact that the wear debris of samples containing 1, 2, and 3 g/L NPs are smaller and more uniform than other samples, they can have a protective effect and cause the separation of two surfaces in contact with each other, which causes the phenomenon of three-body wear and reduces the friction between the two surfaces and, as a result, reduces the local stress.
Figure 17 shows the image of the steel pins used in the wear test of the coatings. As is clear in the figure, the surface of the worn pin on sample T0 is more damaged than on all other samples, which indicates that strong adhesive wear occurred in this sample. The surface of the worn pin on the T0 sample was less damaged than on the other samples, which is consistent with the low average friction coefficient of this sample, as shown in Table 5; this indicates that this sample had slight wear compared to that of other samples.

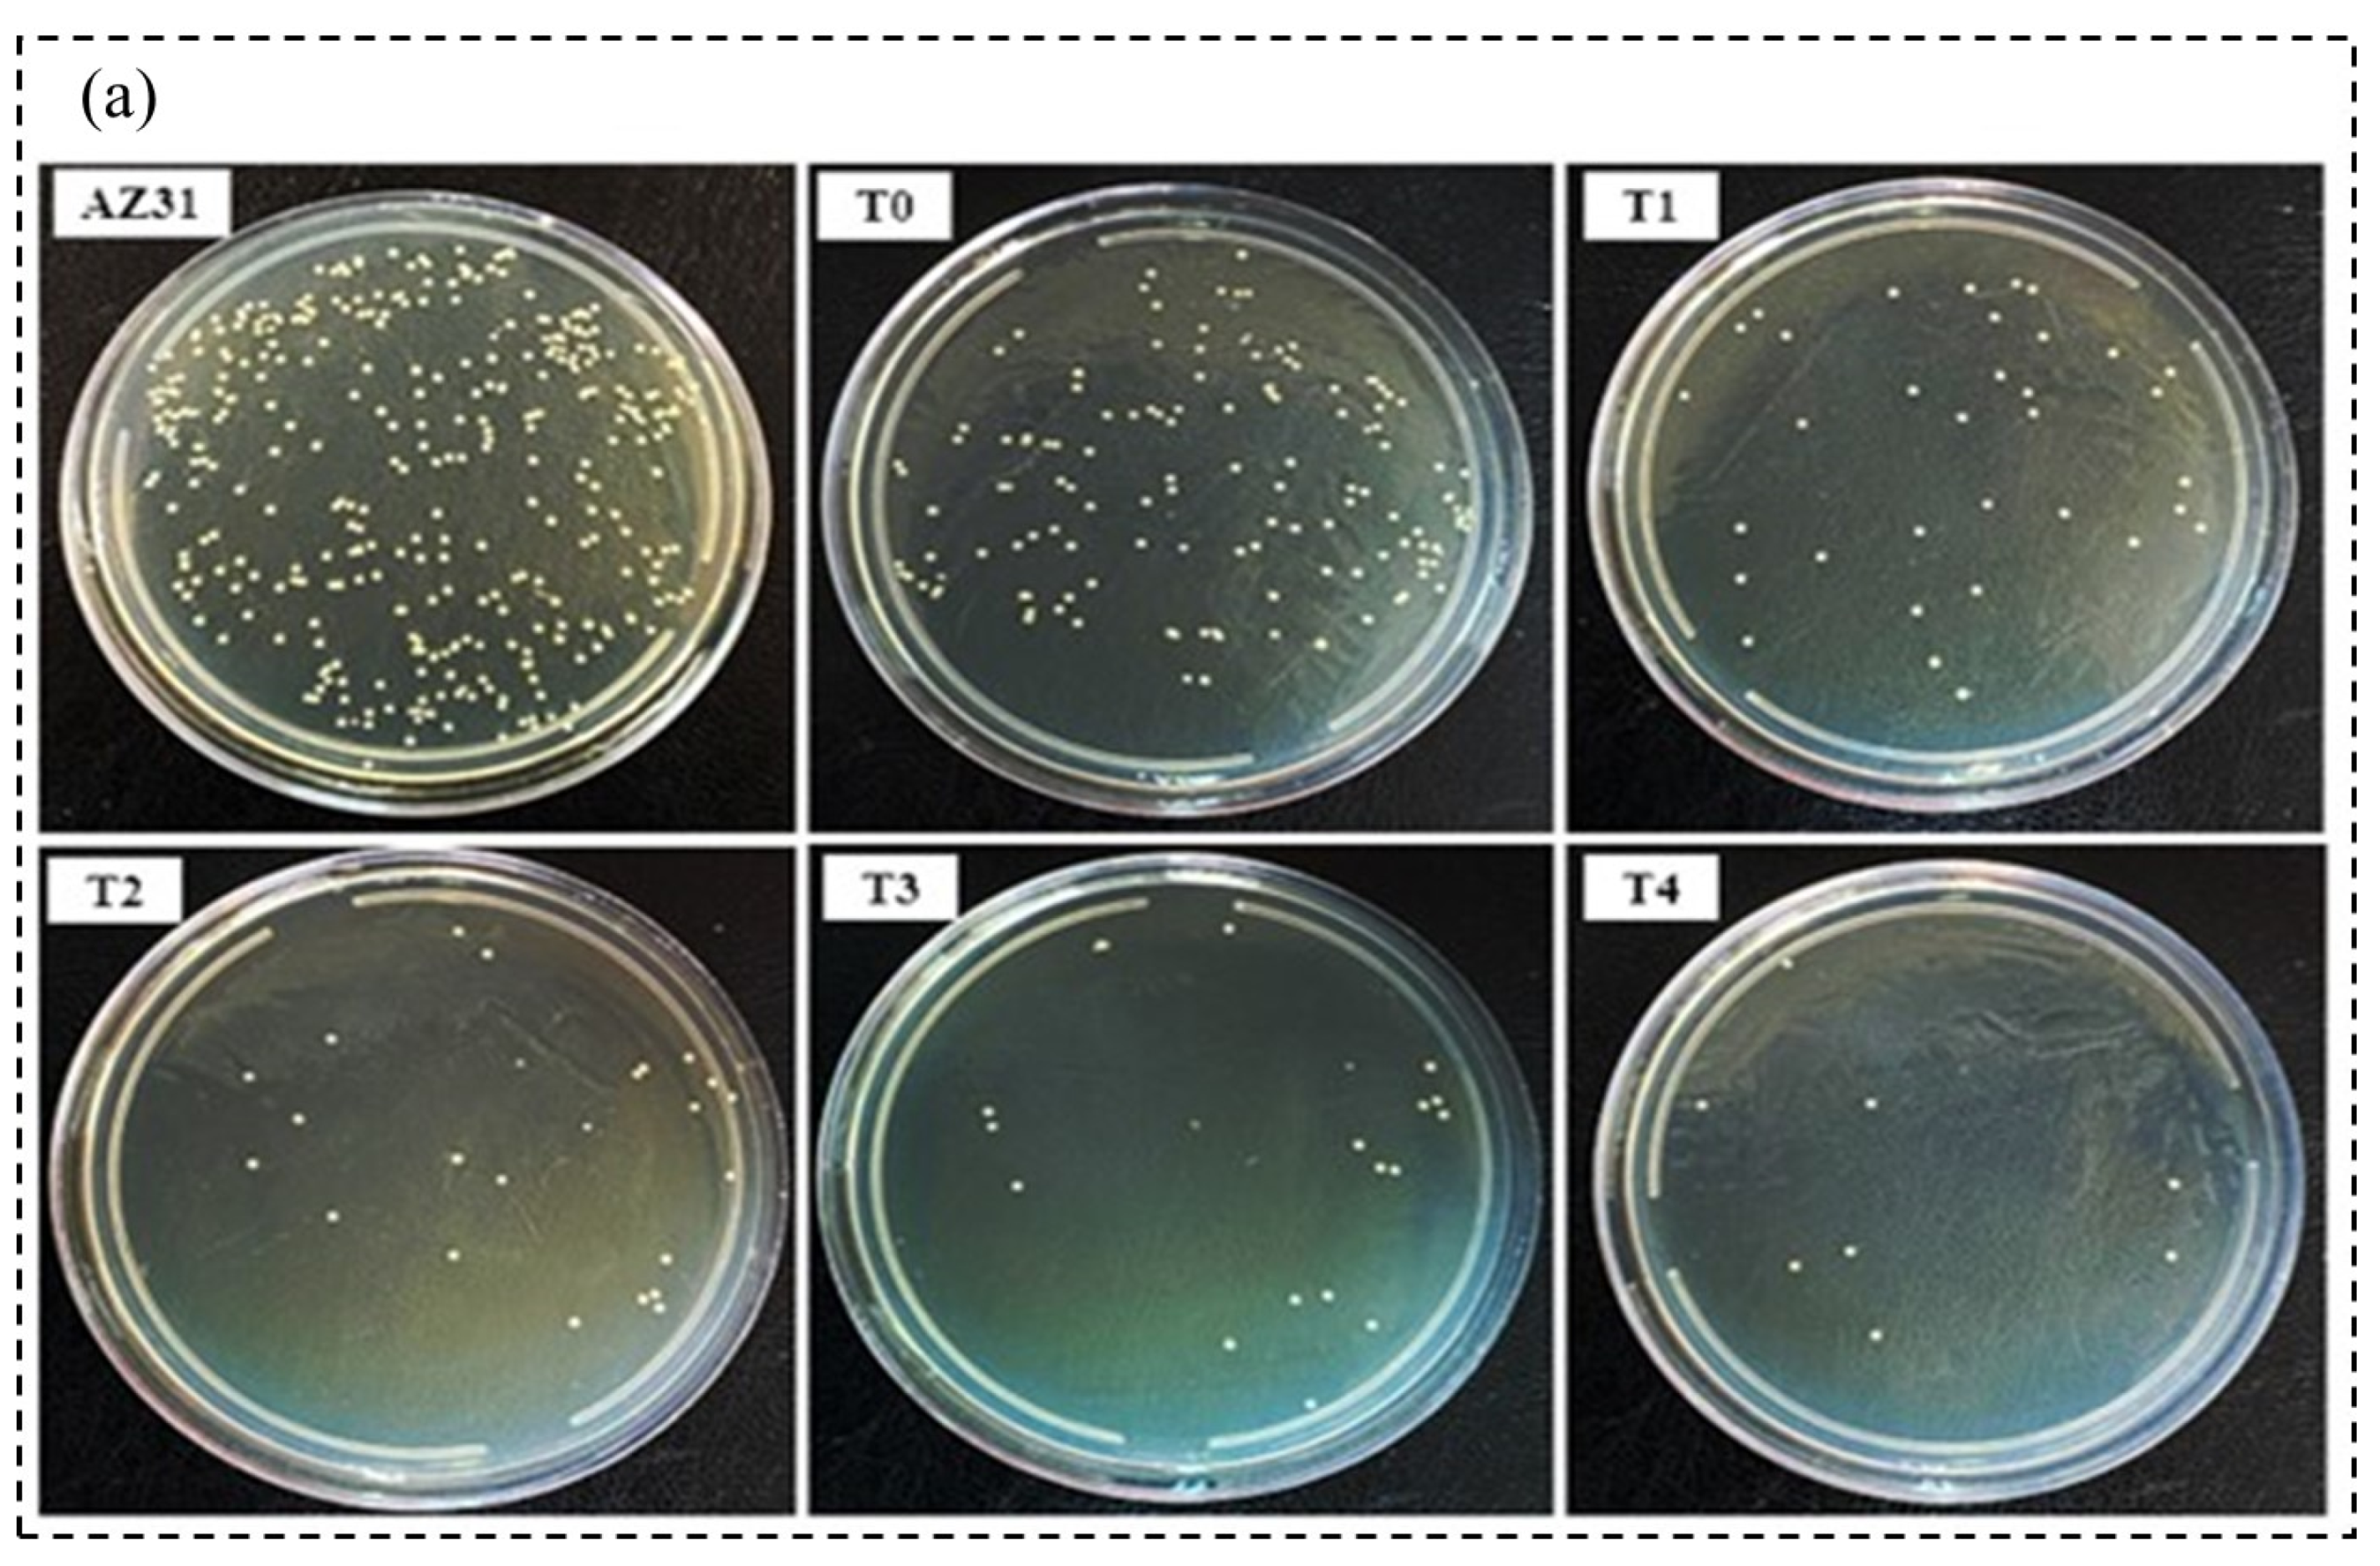
3.7. Antibacterial Behavior

S. aureus bacteria was used to investigate the antibacterial behavior of coated and uncoated samples. The antibacterial behavior results, including bacterial colonies grown on agar plates and the antibacterial rate calculated against S. aureus bacteria after 6 h of incubation at 37 °C, are depicted in Figure 18a. It is clear that the number of bacterial colonies on the PEO-coated surfaces was significantly lower, indicating better antibacterial properties, compared to those of the magnesium substrate. The results of the investigation of antibacterial properties show that the coating containing calcium phosphate (T0) does not have an antibacterial effect, because proteins, amino acids, and other organic substances are easily absorbed on the surface of calcium phosphate, which can cause the absorption and proliferation of bacteria on the surface of the coating and cause infections related to the implant. By adding TiO2 NPs to the coatings, the amount of bacterial colonies decreases significantly, so that the antibacterial effect increases as the concentration of NPs in the coating increases. The antibacterial effect of TiO2 is related to the formation of reactive oxygen species OH, O2 and their attack on the bacterial membrane [98,99]. The antibacterial rate was calculated for the coatings in Figure 18b. The results showed that by increasing the concentration of NPs, the antibacterial ability of the coatings increased significantly. It is known that most microorganisms and bacteria are negatively charged. Therefore, negatively charged surfaces further reduce bacterial attachment. As a result, negatively charged TiO2 NPs on the surface hindered bacterial attachment and provided a significant antibacterial influence for TiO2 NP-doped coatings. Another cause of the better antibacterial performance of coatings by increasing the concentration of NPs in them is the increase in the amount of roughness and wettability of the coatings. Yan et al. [100], comparing the antibacterial behavior of PEO coatings with uncoated Mg alloy, stated that when the bacterial suspension is placed on the uncoated sample, it always remains as water droplets. For this reason, all bacteria are not in direct contact with the surface of the alloy, and for this reason, S. aureus bacteria is slowly and gradually destroyed by OH-, resulting from Mg alloy corrosion. However, when the bacterial suspension is placed on the PEO coating, due to the presence of pores and greater surface roughness, it spreads on the surface. As a result, most bacteria can be directly in contact with the surface and OH- can react with bacteria and destroy them without going through any path and without spreading. As seen in the previous sections, with the increase in the concentration of TiO2, surface porosity increases and causes more surface roughness and, as a result, sample T4 shows the most antibacterial behavior.

4. Conclusions

In this research, the effect of addition of TiO2 NPs on the corrosion, wear, and antibacterial behavior of HAp/MgO composite coatings created on AZ31 Mg alloy by the PEO method was investigated. By examining and analyzing the results obtained in this study, the following results were obtained:
  • The most dense structure was achieved in the sample coated with 1 g/L of TiO2 having 4.39% porosity. In addition, the examination of the cross-sectional images showed that adding NPs up to 4 g/L increased the thickness of the coating, and the coating obtained by 4 g/L of NPs had higher thickness (41.49 µm) than other coatings.
  • Examining the surface properties of the coatings showed that increasing the concentration of NPs from 1 to 4 g/L increased the wettability and roughness of the coatings.
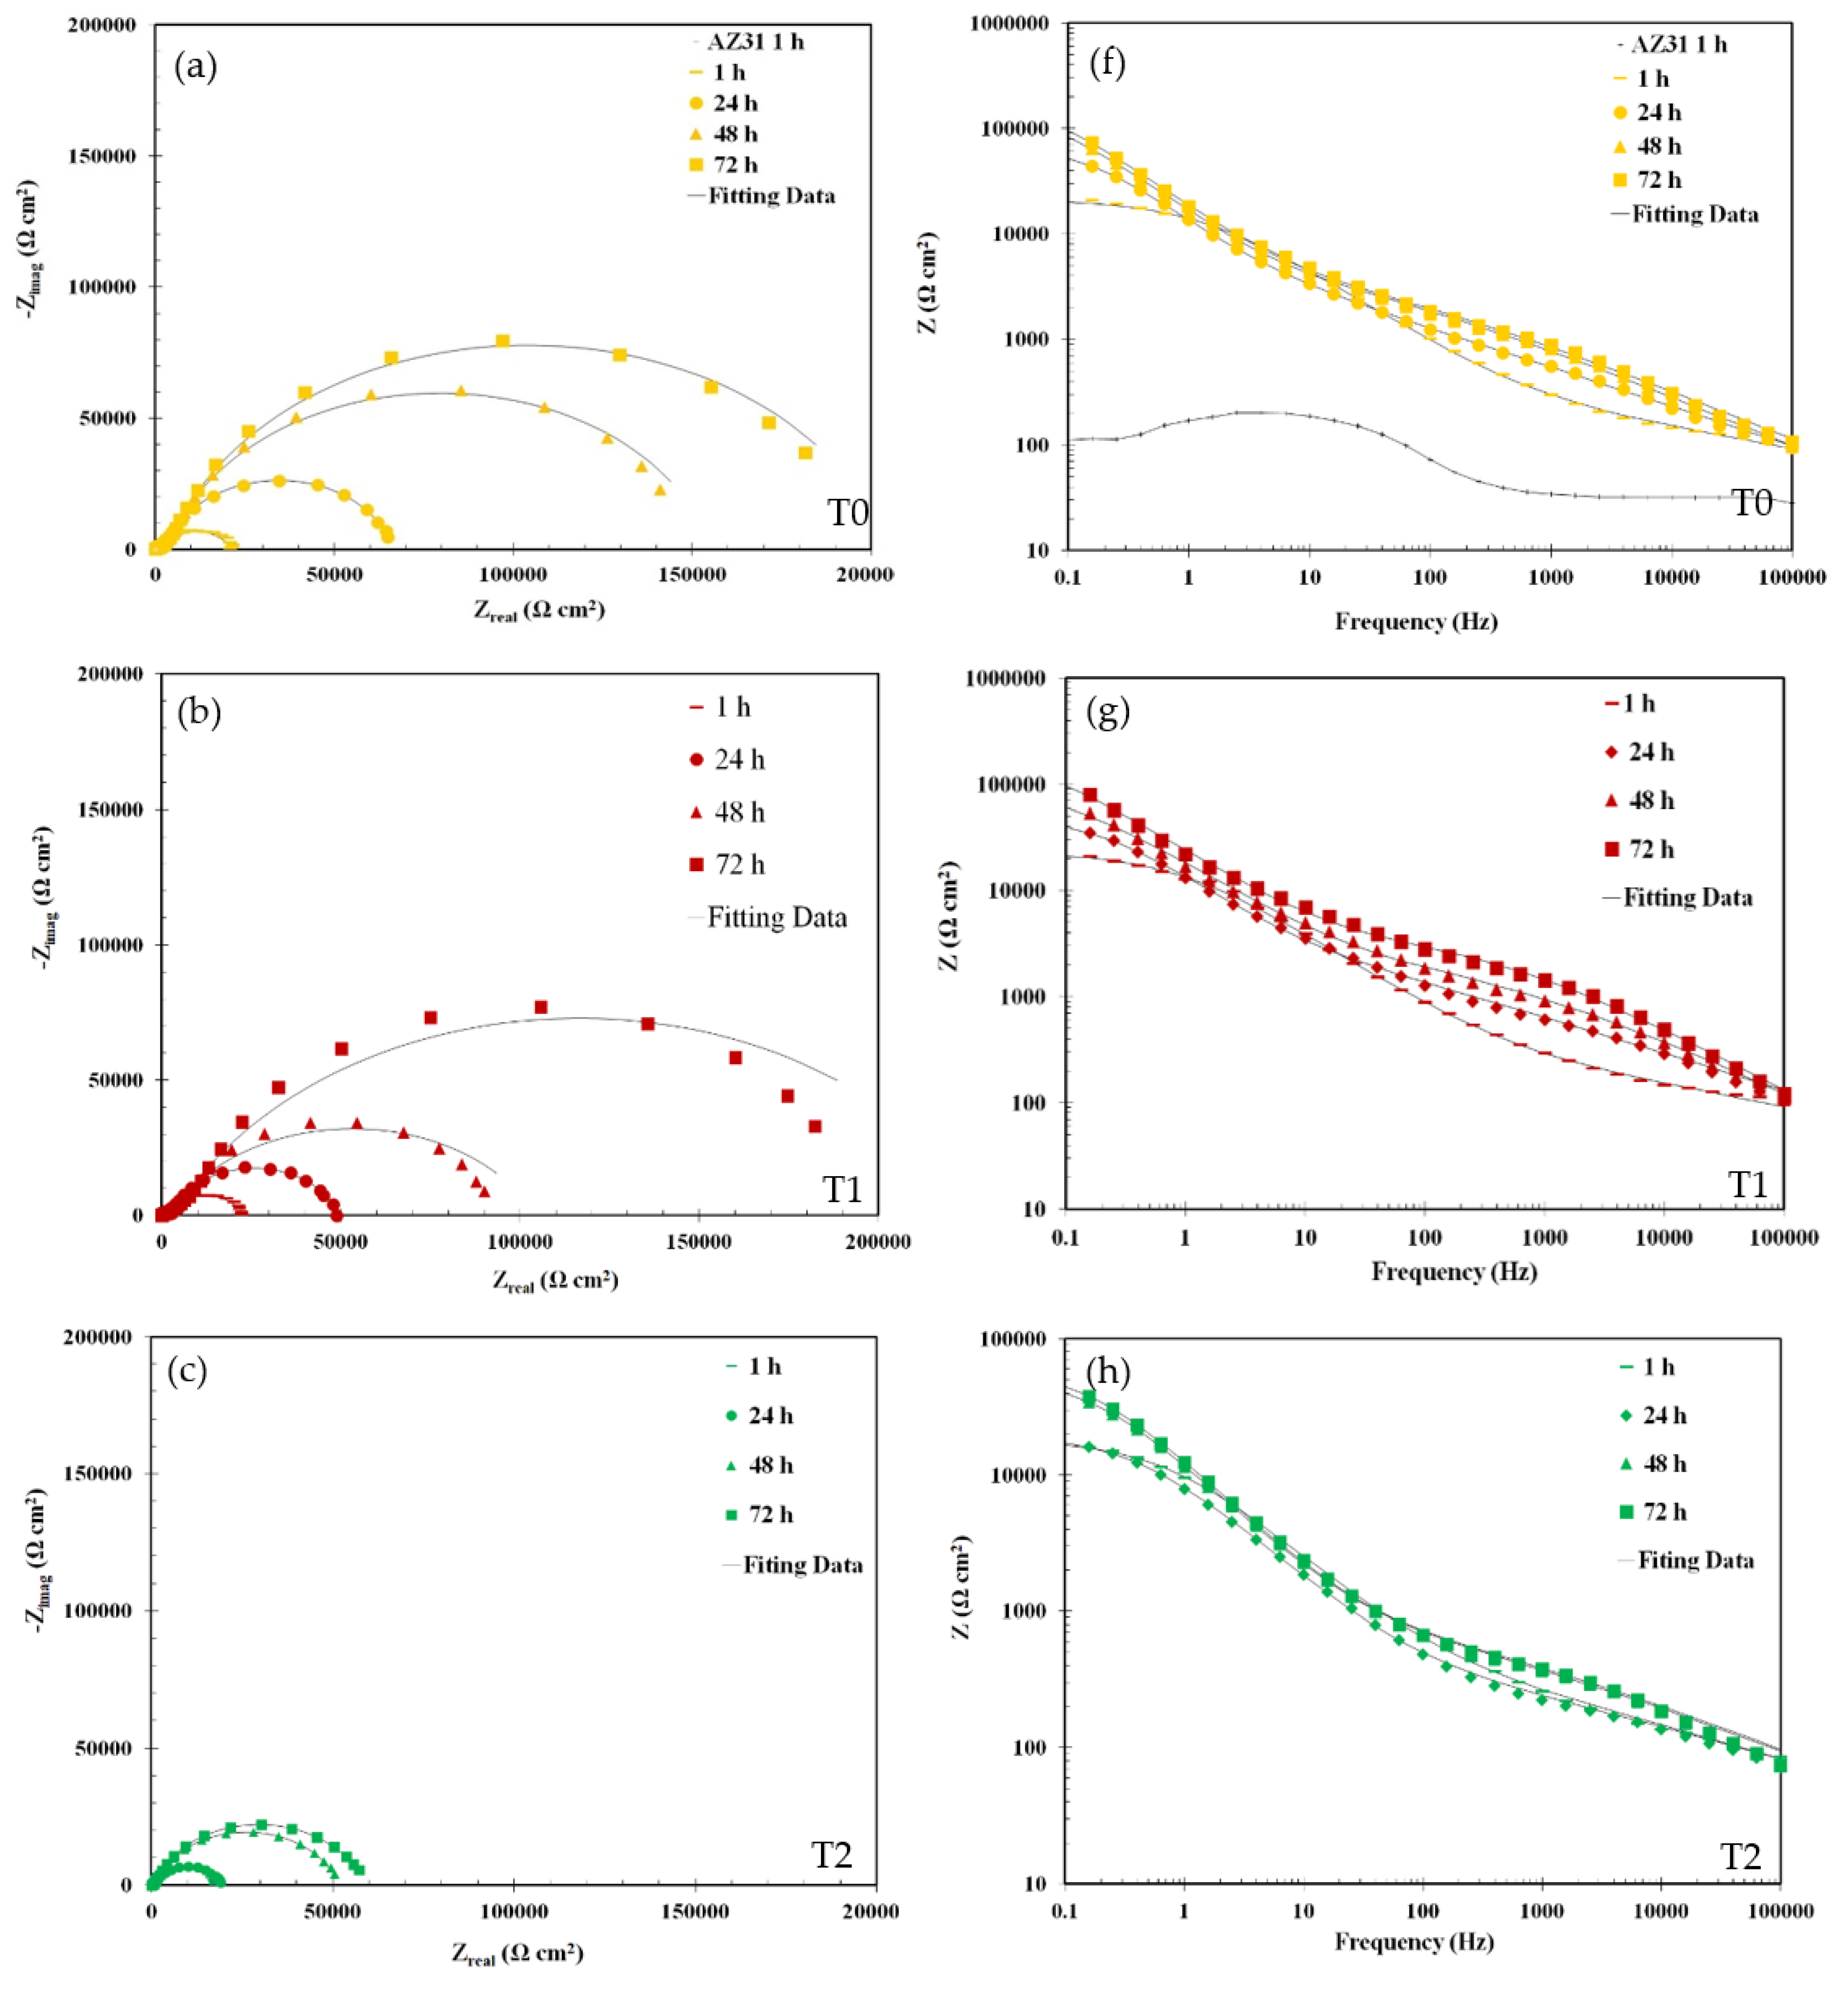
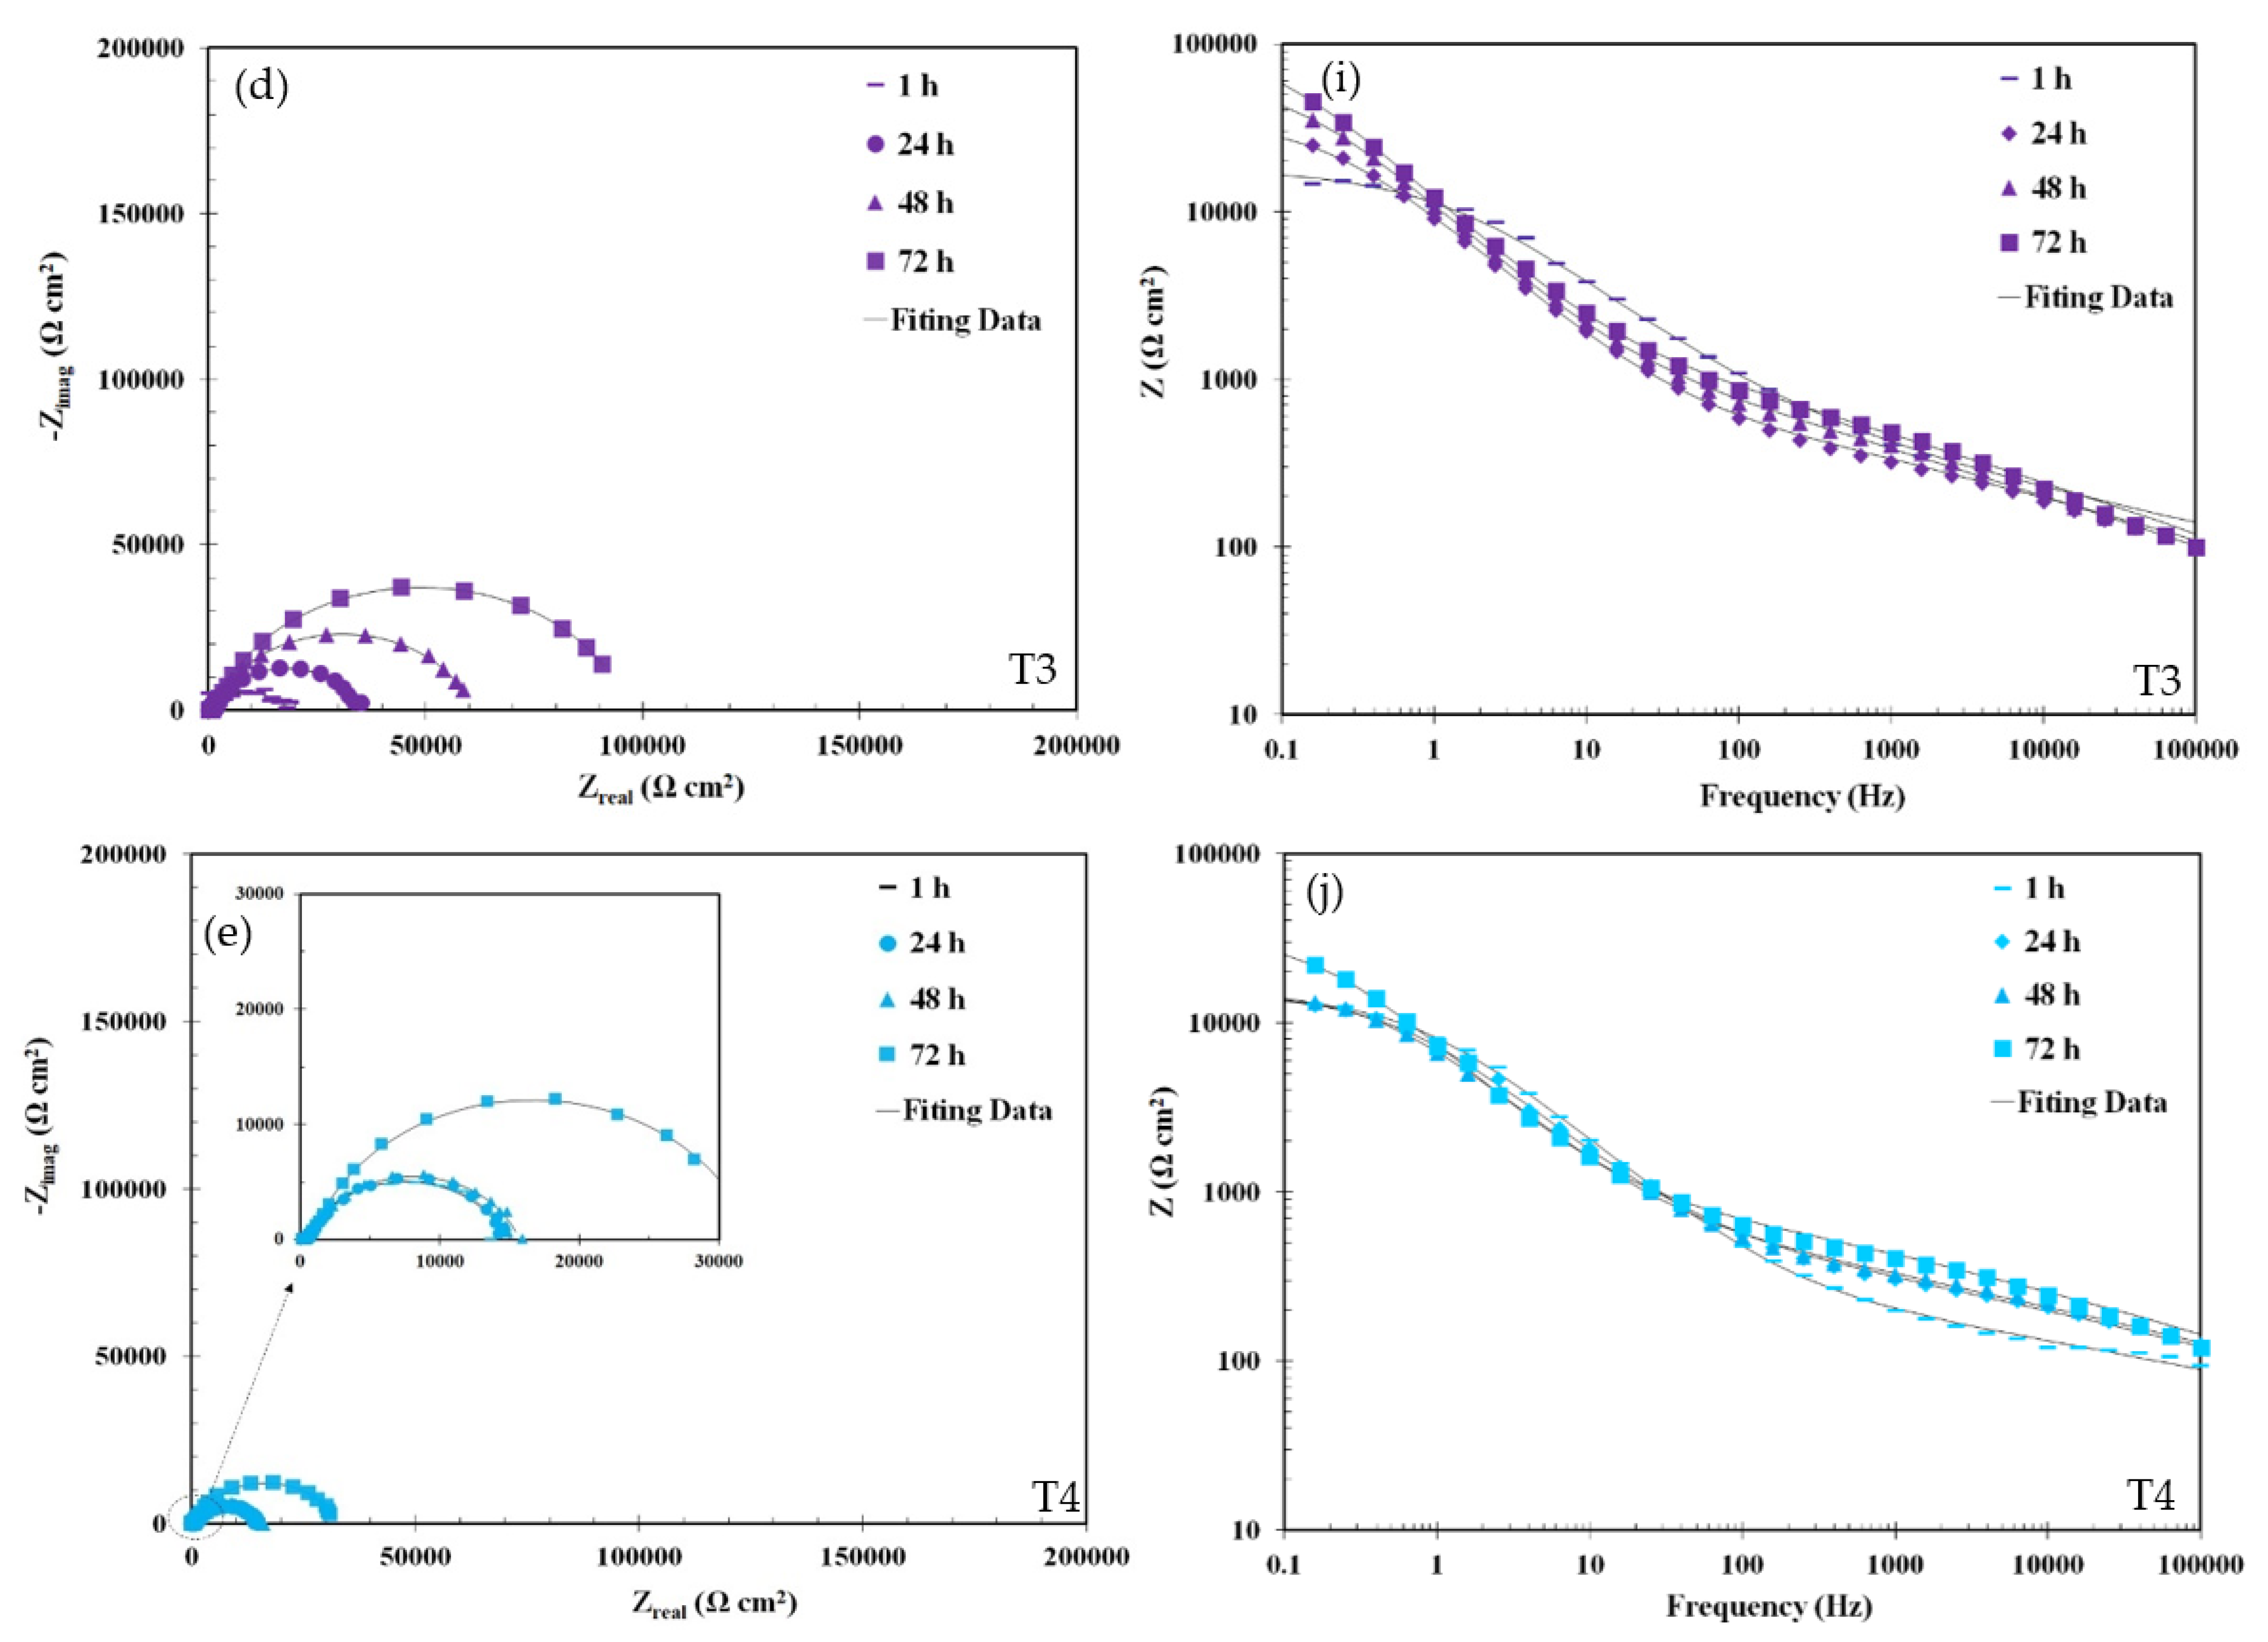
  • EIS tests of coated and uncoated samples showed that small amounts of TiO2 NPs (1 g/L) showed higher corrosion resistance in SBF solution, due to their denser structure. The results showed that with increasing immersion time (24, 48, and 72 h), the corrosion resistance of the coatings increased. The T1 sample had the highest resistance among the samples of the inner layer (8.6 kΩ·cm2) and the outer layer (285 kΩ·cm2) after 72 h in the SBF solution.
  • The results of the wear test of the samples showed that by adding TiO2 NPs, the average coefficient of friction and the mass loss of the samples decreased initially, which was due to the increase in the hardness of the coatings because of the increase in the concentration of TiO2 NPs and the increased roughness that caused less adhesion. However, increasing the concentration of NPs up to 4 g/L increased the average friction coefficient and decreased the weight of the samples.
  • The addition of NPs in the coating led to improvement in the antibacterial behavior of the coatings. Sample T4 had the highest antibacterial activity (97.65%) against S. aureus bacteria in a 6 h test period.
However, further research is needed to ensure that human interventions carry no risk, or at least minimal risk. The main disadvantages of the PEO method are high energy consumption, the presence of microcracks, and limited range of chemical compositions. These considerations will need to be explored further in the future and will certainly occupy biomedical development in the years to come. In conclusion, the authors believe that despite the tremendous progress made in the development of PEO coatings over the past few years, there is still considerable room for development, and in order to achieve and achieve the full potential of PEO coatings, a few considerations should be discussed further. For instance:
  • Although the in vitro antibacterial evaluation of PEO coatings has been fully investigated, in vivo studies are urgently needed. Model systems need to be further expanded to evaluate their performance more holistically.
  • The antibacterial mechanisms involved in PEO-modified Mg coatings containing antibacterial agents affect the osteogenic response. Therefore, it is critical to consider threshold levels and dose-dependent cytotoxicity for added antibacterial agents to achieve an appropriate balance between antibacterial activity and bone growth.

Author Contributions

H.M.: Conceptualization, Methodology, Validation, Formal analysis, Investigation. A.F.-A.: Conceptualization, Methodology, Supervision, Writing—review & editing. R.C.: Conceptualization, Methodology, Writing—original draft, Validation, Formal analysis, Investigation. M.N.: Conceptualization, Methodology, Supervision, Validation. M.K.K.: Conceptualization, Methodology. M.K.: Conceptualization, Methodology, Writing—review & editing, Formal analysis, Investigation. All authors have read and agreed to the published version of the manuscript.

Funding

This work was supported by Bu-Ali Sina University.

Institutional Review Board Statement

Not applicable.

Informed Consent Statement

Not applicable.

Data Availability Statement

Not applicable.

Conflicts of Interest

The authors declare no conflict of interest.

References

  1. James, D.W. High damping metals for engineering applications. Mater. Sci. Eng. 1969, 4, 1–8. [Google Scholar] [CrossRef]
  2. Gray, J.E.; Luan, B. Protective coatings on magnesium and its alloys—A critical review. J. Alloys Compd. 2002, 336, 88–113. [Google Scholar] [CrossRef]
  3. Zhang, Y.; Yan, C. Development of anodic film on Mg alloy AZ91D. Surf. Coat. Technol. 2006, 201, 2381–2386. [Google Scholar] [CrossRef]
  4. Zhao, Q.; Guo, X.; Dang, X.; Hao, J.; Lai, J.; Wang, K. Preparation and properties of composite MAO/ECD coatings on magnesium alloy. Colloids Surf. B Biointerfaces 2013, 102, 321–326. [Google Scholar] [CrossRef] [PubMed]
  5. Fattah-alhosseini, A.; Chaharmahali, R.; Keshavarz, M.K.; Babaei, K. Surface characterization of bioceramic coatings on Zr and its alloys using plasma electrolytic oxidation (PEO): A review. Surf. Interfaces 2021, 25, 101283. [Google Scholar] [CrossRef]
  6. Hornberger, H.; Virtanen, S.; Boccaccini, A.R. Biomedical coatings on magnesium alloys—A review. Acta Biomater. 2012, 8, 2442–2455. [Google Scholar] [CrossRef]
  7. Fattah-alhosseini, A.; Joni, M.S. Effect of KOH concentration on the microstructure and electrochemical properties of MAO-coated Mg alloy. J. Mater. Eng. Perform. 2015, 24, 3444–3452. [Google Scholar] [CrossRef]
  8. Alvarez-Lopez, M.; Pereda, M.D.; Del Valle, J.A.; Fernandez-Lorenzo, M.; Garcia-Alonso, M.C.; Ruano, O.A.; Escudero, M.L. Corrosion behaviour of AZ31 magnesium alloy with different grain sizes in simulated biological fluids. Acta Biomater. 2010, 6, 1763–1771. [Google Scholar] [CrossRef] [Green Version]
  9. Pommiers, S.; Frayret, J.Ô.; Castetbon, A.; Potin-Gautier, M. Alternative conversion coatings to chromate for the protection of magnesium alloys. Corros. Sci. 2014, 84, 135–146. [Google Scholar] [CrossRef]
  10. Feliu, S.; Llorente, I. Corrosion product layers on magnesium alloys AZ31 and AZ61: Surface chemistry and protective ability. Appl. Surf. Sci. 2015, 347, 736–746. [Google Scholar] [CrossRef]
  11. Fattah-alhosseini, A.; Chaharmahali, R.; Babaei, K. Impressive strides in amelioration of corrosion and wear behaviors of Mg alloys using applied polymer coatings on PEO porous coatings: A review. J. Magnes. Alloy. 2022, 10, 1171–1190. [Google Scholar] [CrossRef]
  12. Sezer, N.; Evis, Z.; Kayhan, S.M.; Tahmasebifar, A.; Koç, M. Review of magnesium-based biomaterials and their applications. J. Magnes. Alloy. 2018, 6, 23–43. [Google Scholar] [CrossRef]
  13. Fattah-alhosseini, A.; Chaharmahali, R.; Babaei, K. Effect of particles addition to solution of plasma electrolytic oxidation (PEO) on the properties of PEO coatings formed on magnesium and its alloys: A review. J. Magnes. Alloy. 2020, 8, 799–818. [Google Scholar] [CrossRef]
  14. Ali, M.; Hussein, M.A.; Al-Aqeeli, N. Magnesium-based composites and alloys for medical applications: A review of mechanical and corrosion properties. J. Alloys Compd. 2019, 792, 1162–1190. [Google Scholar] [CrossRef]
  15. Kaseem, M.; Hussain, T.; Zeeshan, U.R.; Yang, H.W.; Dikici, B.; Ko, Y.G. Fabrication of functionalized coating with a unique flowery-flake structure for an effective corrosion performance and catalytic degradation. Chem. Eng. J. 2021, 420, 129737. [Google Scholar] [CrossRef]
  16. Fattah-alhosseini, A.; Vakili-Azghandi, M.; Keshavarz, M.K. Influence of concentrations of KOH and Na2SiO3 electrolytes on the electrochemical behavior of ceramic coatings on 6061 Al alloy processed by plasma electrolytic oxidation. Acta Metall. Sin. Engl. Lett. 2016, 29, 274–281. [Google Scholar] [CrossRef] [Green Version]
  17. Nasirivatan, H.; Kahrizsangi, R.E.; Asgarani, M.K. Tribological performance of PEO-WC nanocomposite coating on Mg Alloys deposited by Plasma Electrolytic Oxidation. Tribol. Int. 2016, 98, 253–260. [Google Scholar] [CrossRef]
  18. Harada, Y.; Kumai, S. Effect of ceramics coating using sol-gel processing on corrosion resistance and age hardening of AZ80 magnesium alloy substrate. Surf. Coat. Technol. 2013, 228, 59–67. [Google Scholar] [CrossRef]
  19. Hu, H.; Xiao, W.; Yuan, J.; Shi, J.; Chen, M.; Shang Guan, W. Preparations of TiO2 film coated on foam nickel substrate by sol-gel processes and its photocatalytic activity for degradation of acetaldehyde. J. Environ. Sci. 2007, 19, 80–85. [Google Scholar] [CrossRef]
  20. Kuo, Y.-L.; Chang, K.-H. Atmospheric pressure plasma enhanced chemical vapor deposition of SiOx films for improved corrosion resistant properties of AZ31 magnesium alloys. Surf. Coat. Technol. 2015, 283, 194–200. [Google Scholar] [CrossRef]
  21. Xue, L.; Kajiyoshi, K.; Films, Y.Y.-T.S.; Films, U. Preparation of highly oriented titania nanosheet thin films by electrophoretic deposition. Thin Solid Film. 2009, 518, 10–15. [Google Scholar]
  22. Tavares, C.J.; Marques, S.M.; Rebouta, L.; Lanceros-Méndez, S.; Sencadas, V.; Costa, C.M.; Alves, E.; Fernandes, A.J. PVD-Grown photocatalytic TiO2 thin films on PVDF substrates for sensors and actuators applications. Thin Solid Films 2008, 517, 1161–1166. [Google Scholar] [CrossRef]
  23. Grandcolas, M.; Ye, J. N-doped titania-based nanofiber thin films synthesized via a hydrothermal route and their photo-induced properties under visible light. J. Ceram. Process. Res. 2012, 13, 65–70. [Google Scholar]
  24. Kaseem, M.; Fatimah, S.; Nashrah, N.; Ko, Y.G. Recent progress in surface modification of metals coated by plasma electrolytic oxidation: Principle, structure, and performance. Prog. Mater. Sci. 2021, 117, 100735. [Google Scholar] [CrossRef]
  25. Clyne, T.W.; Troughton, S.C. A review of recent work on discharge characteristics during plasma electrolytic oxidation of various metals. Int. Mater. Rev. 2019, 64, 127–162. [Google Scholar] [CrossRef] [Green Version]
  26. Zhang, W.; Du, Y.; Zhang, P. Excellent plasma electrolytic oxidation coating on AZ61 magnesium alloy under ordinal discharge mode. J. Magnes. Alloy. 2021, 10, 2460–2474. [Google Scholar] [CrossRef]
  27. Kim, S.-P.; Kaseem, M.; Choe, H.-C. Plasma electrolytic oxidation of Ti-25Nb-xTa alloys in solution containing Ca and P ions. Surf. Coat. Technol. 2020, 395, 125916. [Google Scholar] [CrossRef]
  28. Zhang, L.; Zhang, J.; Chen, C.; Gu, Y. Advances in microarc oxidation coated AZ31 Mg alloys for biomedical applications. Corros. Sci. 2015, 91, 7–28. [Google Scholar] [CrossRef]
  29. Rafieerad, A.R.; Ashra, M.R.; Mahmoodian, R.; Bushroa, A.R. Surface characterization and corrosion behavior of calcium phosphate-base composite layer on titanium and its alloys via plasma electrolytic oxidation: A review paper. Mater. Sci. Eng. C 2015, 57, 397–413. [Google Scholar] [CrossRef]
  30. Shen, D.; Li, G.; He, D. Effect of RE on PEO Effect of cerium and lanthanum additives on plasma electrolytic oxidation of AZ31 magnesium alloy. J. Rare Earths 2014, 31, 1208–1213. [Google Scholar] [CrossRef]
  31. Monetta, T.; Parnian, P.; Acquesta, A. Recent advances in the control of the degradation rate of PEO treated magnesium and its alloys for biomedical applications. Metals 2020, 10, 907. [Google Scholar] [CrossRef]
  32. Hafili, F.; Chaharmahali, R.; Babaei, K.; Fattah-alhosseini, A. Duty cycle influence on the corrosion behavior of coatings created by plasma electrolytic oxidation on AZ31B magnesium alloy in simulated body fluid. Corros. Commun. 2021, 3, 62–70. [Google Scholar] [CrossRef]
  33. Zehra, T.; Patil, S.A.; Shrestha, N.K.; Fattah-alhosseini, A.; Kaseem, M. Anionic assisted incorporation of WO3 nanoparticles for enhanced electrochemical properties of AZ31 Mg alloy coated via plasma electrolytic oxidation. J. Alloys Compd. 2022, 916, 165445. [Google Scholar] [CrossRef]
  34. Chaharmahali, R.; Fattah-alhosseini, A.; Nouri, M.; Babaei, K. Improving surface characteristics of PEO coatings of Mg and its alloys with zirconia nanoparticles: A review. Appl. Surf. Sci. Adv. 2021, 6, 100131. [Google Scholar] [CrossRef]
  35. Kaseem, M.; Choe, H.-C. The effect of in-situ reactive incorporation of MoOx on the corrosion behavior of Ti-6Al-4 V alloy coated via micro-arc oxidation coating. Corros. Sci. 2021, 192, 109764. [Google Scholar] [CrossRef]
  36. Kaseem, M.; Zehra, T.; Dikici, B.; Dafali, A.; Yang, H.W.; Ko, Y.G. Improving the electrochemical stability of AZ31 Mg alloy in a 3.5wt.% NaCl solution via the surface functionalization of plasma electrolytic oxidation coating. J. Magnes. Alloy. 2021, 10, 1311–1325. [Google Scholar] [CrossRef]
  37. Tang, H.; Gao, Y. Preparation and characterization of hydroxyapatite containing coating on AZ31 magnesium alloy by micro-arc oxidation. J. Alloys Compd. 2016, 688, 699–708. [Google Scholar] [CrossRef]
  38. Fattah-alhosseini, A.; Chaharmahali, R. Enhancing corrosion and wear performance of PEO coatings on Mg alloys using graphene and graphene oxide additions: A review. FlatChem 2021, 27, 100241. [Google Scholar] [CrossRef]
  39. Keyvani, A.; Zamani, M.; Bahamirian, M.; Nikoomanzari, E.; Fattah-alhosseini, A.; Sina, H. Role of incorporation of ZnO nanoparticles on corrosion behavior of ceramic coatings developed on AZ31 magnesium alloy by plasma electrolytic oxidation technique. Surf. Interfaces 2021, 22, 100728. [Google Scholar] [CrossRef]
  40. Shi, L.; Xu, Y.; Li, K.; Yao, Z.; Wu, S. Effect of additives on structure and corrosion resistance of ceramic coatings on Mg-Li alloy by micro-arc oxidation. Curr. Appl. Phys. 2010, 10, 719–723. [Google Scholar] [CrossRef]
  41. Lim, T.S.; Ryu, H.S.; Hong, S.H. Electrochemical corrosion properties of CeO 2-containing coatings on AZ31 magnesium alloys prepared by plasma electrolytic oxidation. Corros. Sci. 2012, 62, 104–111. [Google Scholar] [CrossRef]
  42. Tu, X.; Miao, C.; Zhang, Y.; Xu, Y.; Li, J. Plasma electrolytic oxidation of magnesium alloy AZ31B in electrolyte containing Al2O3 sol as additives. Materials 2018, 11, 1618. [Google Scholar] [CrossRef] [PubMed]
  43. Lu, X.; Schieda, M.; Blawert, C.; Kainer, K.U.; Zheludkevich, M.L. Formation of photocatalytic plasma electrolytic oxidation coatings on magnesium alloy by incorporation of TiO2 particles. Surf. Coat. Technol. 2016, 307, 287–291. [Google Scholar] [CrossRef]
  44. Lee, K.M.; Shin, K.R.; Namgung, S.; Yoo, B.; Shin, D.H. Electrochemical response of ZrO2-incorporated oxide layer on AZ91 Mg alloy processed by plasma electrolytic oxidation. Surf. Coat. Technol. 2011, 205, 3779–3784. [Google Scholar] [CrossRef]
  45. Tang, H.; Yu, D.; Luo, Y.; Wang, F. Preparation and characterization of HA microflowers coating on AZ31 magnesium alloy by micro-arc oxidation and a solution treatment. Appl. Surf. Sci. 2013, 264, 816–822. [Google Scholar] [CrossRef]
  46. Gao, J.H.H.; Guan, S.K.K.; Chen, J.; Wang, L.G.G.; Zhu, S.J.J.; Hu, J.H.H.; Ren, Z.W.W. Fabrication and characterization of rod-like nano-hydroxyapatite on MAO coating supported on Mg–Zn–Ca alloy. Appl. Surf. Sci. 2011, 257, 2231–2237. [Google Scholar] [CrossRef]
  47. Chen, F. Effect of Graphene on Micro-Structure and Properties of MAO Coating Prepared on Mg-Li Alloy. Int. J. Electrochem. Sci. 2017, 12, 6081–6091. [Google Scholar] [CrossRef]
  48. Madhankumar, A.; Thangavel, E.; Ramakrishna, S.; Obot, I.B.; Jung, H.C.; Shin, K.S.; Gasem, Z.M.; Kim, H.; Kim, D.-E.E. Multi-functional ceramic hybrid coatings on biodegradable AZ31 Mg implants: Electrochemical, tribological and quantum chemical aspects for orthopaedic applications. RSC Adv. 2014, 4, 24272. [Google Scholar] [CrossRef]
  49. Kaseem, M.; Choe, H.-C. Triggering the hydroxyapatite deposition on the surface of PEO-coated Ti–6Al–4V alloy via the dual incorporation of Zn and Mg ions. J. Alloys Compd. 2020, 819, 153038. [Google Scholar] [CrossRef]
  50. Chaharmahali, R.; Fattah-alhosseini, A.; Babaei, K. Surface characterization and corrosion behavior of calcium phosphate (Ca-P) base composite layer on Mg and its alloys using plasma electrolytic oxidation (PEO): A review. J. Magnes. Alloy. 2021, 9, 21–40. [Google Scholar] [CrossRef]
  51. Anawati; Asoh, H.; Ono, S. Enhanced uniformity of apatite coating on a PEO film formed on AZ31 Mg alloy by an alkali pretreatment. Surf. Coat. Technol. 2015, 272, 182–189. [Google Scholar] [CrossRef]
  52. Gao, Y.; Yerokhin, A.; Matthews, A. Effect of current mode on PEO treatment of magnesium in Ca- and P-containing electrolyte and resulting coatings. Appl. Surf. Sci. 2014, 316, 558–567. [Google Scholar] [CrossRef]
  53. Wu, G.; Ibrahim, J.M.; Chu, P.K. Surface design of biodegradable magnesium alloys—A review. Surf. Coat. Technol. 2013, 233, 2–12. [Google Scholar] [CrossRef]
  54. Rahman, M.; Li, Y.; Wen, C. HA coating on Mg alloys for biomedical applications: A review. J. Magnes. Alloy. 2020, 8, 929–943. [Google Scholar] [CrossRef]
  55. Li, B.; Xia, X.; Guo, M.; Jiang, Y.; Li, Y.; Zhang, Z.; Liu, S.; Li, H.; Liang, C.; Wang, H. Biological and antibacterial properties of the micro-nanostructured hydroxyapatite/chitosan coating on titanium. Sci. Rep. 2019, 9, 14052. [Google Scholar] [CrossRef] [Green Version]
  56. Bakhsheshi-Rad, H.R.; Hamzah, E.; Ismail, A.F.; Aziz, M.; Daroonparvar, M.; Saebnoori, E.; Chami, A. In vitro degradation behavior, antibacterial activity and cytotoxicity of TiO2-MAO/ZnHA composite coating on Mg alloy for orthopedic implants. Surf. Coat. Technol. 2018, 334, 450–460. [Google Scholar] [CrossRef]
  57. Molaei, M.; Fattah-alhosseini, A.; Babaei, K. Improving the wear resistance of plasma electrolytic oxidation (PEO) coatings applied on Mg and its alloys under the addition of nano- and micro-sized additives into the electrolytes: A review. J. Magnes. Alloy. 2021, 9, 1164–1186. [Google Scholar] [CrossRef]
  58. Da Forno, A.; Ke, L.; Bestetti, M. Effect of titania nanoparticles on micro-arc anodizing of AM60B magnesium alloy. Mater. Sci. Forum 2010, 654–656, 1876–1879. [Google Scholar] [CrossRef]
  59. Li, W.; Tang, M.; Zhu, L.; Liu, H. Formation of microarc oxidation coatings on magnesium alloy with photocatalytic performance. Appl. Surf. Sci. 2012, 258, 10017–10021. [Google Scholar] [CrossRef]
  60. Daroonparvar, M.; Yajid, M.A.M.; Yusof, N.M.; Bakhsheshi-Rad, H.R. Preparation and corrosion resistance of a nanocomposite plasma electrolytic oxidation coating on Mg-1%Ca alloy formed in aluminate electrolyte containing titania nano-additives. J. Alloys Compd. 2016, 688, 841–857. [Google Scholar] [CrossRef]
  61. Yu, Y.; Yan, Z.; Bi, S.; Ma, Z.; Qian, J. Investigation of heat treatment and subsequently surface modification by nano-TiO2 on Mg–Zn–Ca–Mn bio-magnesium alloy. Mater. Express 2019, 9, 931–939. [Google Scholar] [CrossRef]
  62. White, L.; Koo, Y.; Yun, Y.; Sankar, J. TiO2 Deposition on AZ31 Magnesium Alloy Using Plasma Electrolytic Oxidation. J. Nanomater. 2013, 2013, 319437. [Google Scholar] [CrossRef]
  63. Chaharmahali, R.; Fattah-alhosseini, A.; Esfahani, H. Increasing the in-vitro corrosion resistance of AZ31B-Mg alloy via coating with hydroxyapatite using plasma electrolytic oxidation. J. Asian Ceram. Soc. 2020, 8, 39–49. [Google Scholar] [CrossRef]
  64. Molaei, M.; Fattah-alhosseini, A.; Nouri, M.; Mahmoodi, P. Enhancing cytocompatibility, antibacterial activity and corrosion resistance of PEO coatings on titanium using incorporated ZrO2 nanoparticles. Surf. Interfaces 2022, 30, 101967. [Google Scholar] [CrossRef]
  65. Molaei, M.; Fattah-alhosseini, A.; Nouri, M.; Mahmoodi, P.; Nourian, A. Incorporating TiO2 nanoparticles to enhance corrosion resistance, cytocompatibility, and antibacterial properties of PEO ceramic coatings on titanium. Ceram. Int. 2022, 48, 21005–21024. [Google Scholar] [CrossRef]
  66. Wang, Y.; Yu, H.; Chen, C.; Zhao, Z. Review of the biocompatibility of micro-arc oxidation coated titanium alloys. Mater. Des. 2015, 85, 640–652. [Google Scholar] [CrossRef]
  67. Fattah-alhosseini, A.; Babaei, K.; Molaei, M. Plasma electrolytic oxidation (PEO) treatment of zinc and its alloys: A review. Surf. Interfaces 2020, 18, 100441. [Google Scholar] [CrossRef]
  68. Mohedano, M.; Lu, X.; Matykina, E.; Blawert, C.; Arrabal, R.; Zheludkevich, M.L. Plasma Electrolytic Oxidation (PEO) of Metals and Alloys. In Encyclopedia of Interfacial Chemistry; Elsevier: Amsterdam, The Netherlands, 2018; pp. 423–438. [Google Scholar]
  69. Babaei, K.; Fattah-alhosseini, A.; Chaharmahali, R. A review on plasma electrolytic oxidation (PEO) of niobium: Mechanism, properties and applications. Surf. Interfaces 2020, 21, 100719. [Google Scholar] [CrossRef]
  70. Kaseem, M.; Hussain, T.; Rehman, Z.U.; Ko, Y.G. Stabilization of AZ31 Mg alloy in sea water via dual incorporation of MgO and WO3 during micro-arc oxidation. J. Alloys Compd. 2021, 853, 157036. [Google Scholar] [CrossRef]
  71. Ikonopisov, S. Theory of electrical breakdown during formation of barrier anodic films. Electrochim. Acta 1977, 22, 1077–1082. [Google Scholar] [CrossRef]
  72. Guo, H.F.; An, M.Z.; Huo, H.B.; Xu, S.; Wu, L.J. Microstructure characteristic of ceramic coatings fabricated on magnesium alloys by micro-arc oxidation in alkaline silicate solutions. Appl. Surf. Sci. 2006, 252, 7911–7916. [Google Scholar] [CrossRef]
  73. Wang, Y.M.; Wang, F.H.; Xu, M.J.; Zhao, B.; Guo, L.X.; Ouyang, J.H. Microstructure and corrosion behavior of coated AZ91 alloy by microarc oxidation for biomedical application. Appl. Surf. Sci. 2009, 255, 9124–9131. [Google Scholar] [CrossRef]
  74. Liu, F.; Shan, D.Y.; Song, Y.W.; Han, E.H. Formation process of composite plasma electrolytic oxidation coating containing zirconium oxides on AM50 magnesium alloy. Trans. Nonferrous Met. Soc. China (English Ed.) 2011, 21, 943–948. [Google Scholar] [CrossRef]
  75. Toorani, M.; Aliofkhazraei, M.; Golabadi, M.; Rouhaghdam, A.S. Effect of lanthanum nitrate on the microstructure and electrochemical behavior of PEO coatings on AZ31 Mg alloy. J. Alloys Compd. 2017, 719, 242–255. [Google Scholar] [CrossRef]
  76. Zhu, J.; Jia, H.; Liao, K.; Li, X. Improvement on corrosion resistance of micro-arc oxidized AZ91D magnesium alloy by a pore-sealing coating. J. Alloys Compd. 2021, 889, 161460. [Google Scholar] [CrossRef]
  77. Yang, J.; Lu, X.; Blawert, C.; Di, S.; Zheludkevich, M.L. Microstructure and corrosion behavior of Ca/P coatings prepared on magnesium by plasma electrolytic oxidation. Surf. Coat. Technol. 2017, 319, 359–369. [Google Scholar] [CrossRef]
  78. Barati Darband, G.; Aliofkhazraei, M.; Hamghalam, P.; Valizade, N. Plasma electrolytic oxidation of magnesium and its alloys: Mechanism, properties and applications. J. Magnes. Alloy. 2017, 5, 74–132. [Google Scholar] [CrossRef]
  79. Toorani, M.; Aliofkhazraei, M. Review of electrochemical properties of hybrid coating systems on Mg with plasma electrolytic oxidation process as pretreatment. Surf. Interfaces 2019, 14, 262–295. [Google Scholar] [CrossRef]
  80. Farshid, S.; Kharaziha, M. Micro and nano-enabled approaches to improve the performance of plasma electrolytic oxidation coated magnesium alloys. J. Magnes. Alloy. 2021, 9, 1487–1504. [Google Scholar] [CrossRef]
  81. Zhang, R.F.; Zhang, S.F.; Shen, Y.L.; Zhang, L.H.; Liu, T.Z.; Zhang, Y.Q.; Guo, S.B. Influence of sodium borate concentration on properties of anodic coatings obtained by micro arc oxidation on magnesium alloys. Appl. Surf. Sci. 2012, 258, 6602–6610. [Google Scholar] [CrossRef]
  82. Durdu, S.; Aytaç, A.; Usta, M. Characterization and corrosion behavior of ceramic coating on magnesium by micro-arc oxidation. J. Alloys Compd. 2011, 509, 8601–8606. [Google Scholar] [CrossRef]
  83. Duan, H.; Yan, C.; Wang, F. Effect of electrolyte additives on performance of plasma electrolytic oxidation films formed on magnesium alloy AZ91D. Electrochim. Acta 2007, 52, 3785–3793. [Google Scholar] [CrossRef]
  84. Canillas, M.; Pena, P.; de Aza, A.H.; Rodríguez, M.A. Calcium phosphates for biomedical applications. Boletín Soc. Española Cerámica y Vidr. 2017, 56, 91–112. [Google Scholar] [CrossRef]
  85. Zhao, D.; Witte, F.; Lu, F.; Wang, J.; Li, J.; Qin, L. Current status on clinical applications of magnesium-based orthopaedic implants: A review from clinical translational perspective. Biomaterials 2017, 112, 287–302. [Google Scholar] [CrossRef]
  86. Cui, L.-Y.; Liu, H.-P.; Xue, K.; Zhang, W.-L.; Zeng, R.-C.; Li, S.-Q.; Xu, D.; Han, E.-H.; Guan, S.-K. In Vitro Corrosion and Antibacterial Performance of Micro-Arc Oxidation Coating on AZ31 Magnesium Alloy: Effects of Tannic Acid. J. Electrochem. Soc. 2018, 165, C821–C829. [Google Scholar] [CrossRef]
  87. Han, B.; Yang, Y.; Li, J.; Deng, H.; Yang, C. Effects of the graphene additive on the corrosion resistance of the plasma electrolytic oxidation (PEO) coating on the AZ91 magnesium alloy. Int. J. Electrochem. Sci. 2018, 13, 9166–9182. [Google Scholar] [CrossRef]
  88. Liang, J.; Hu, L.; Hao, J. Improvement of corrosion properties of microarc oxidation coating on magnesium alloy by optimizing current density parameters. Appl. Surf. Sci. 2007, 253, 6939–6945. [Google Scholar] [CrossRef]
  89. Zhao, J.; Xie, X.; Zhang, C. Effect of the graphene oxide additive on the corrosion resistance of the plasma electrolytic oxidation coating of the AZ31 magnesium alloy. Corros. Sci. 2017, 114, 146–155. [Google Scholar] [CrossRef]
  90. Kaseem, M.; Ko, Y.G. Morphological modification and corrosion response of MgO and Mg3(PO4)2 composite formed on magnesium alloy. Compos. Part B Eng. 2019, 176, 107225. [Google Scholar] [CrossRef]
  91. Kaseem, M.; Ko, Y.G. A novel hybrid composite composed of albumin, WO3, and LDHs film for smart corrosion protection of Mg alloy. Compos. Part B Eng. 2021, 204, 108490. [Google Scholar] [CrossRef]
  92. Córdoba-Torres, P.; Mesquita, T.J.; Devos, O.; Tribollet, B.; Roche, V.; Nogueira, R.P. On the intrinsic coupling between constant-phase element parameters α and Q in electrochemical impedance spectroscopy. Electrochim. Acta 2012, 72, 172–178. [Google Scholar] [CrossRef]
  93. Tang, H.; Wu, T.; Wang, H.; Jian, X.; Wu, Y. Corrosion behavior of HA containing ceramic coated magnesium alloy in Hank ’ s solution. J. Alloys Compd. 2017, 698, 643–653. [Google Scholar] [CrossRef]
  94. Mann, R.; Grman, V.; Hansal, W.E.G. Optimisation of PEO layers with incorporated nanoparticles. Trans. IMF 2021, 99, 10–16. [Google Scholar] [CrossRef]
  95. Rabinowicz, E.; Tanner, R.I. Friction and wear of materials. J. Appl. Mech. 1966, 33, 479. [Google Scholar] [CrossRef]
  96. Hutchings, I.; Shipway, P. Tribology: Friction and Wear of Engineering Materials; Butterworth-Heinemann: Oxford, UK, 2017; ISBN 0081009518. [Google Scholar]
  97. Sharifi, H.; Aliofkhazraei, M.; Darband, G.B.; Rouhaghdam, A.S. Tribological properties of PEO nanocomposite coatings on titanium formed in electrolyte containing ketoconazole. Tribol. Int. 2016, 102, 463–471. [Google Scholar] [CrossRef]
  98. Nadimi, M.; Dehghanian, C. Incorporation of ZnO–ZrO2 nanoparticles into TiO2 coatings obtained by PEO on Ti–6Al–4V substrate and evaluation of its corrosion behavior, microstructural and antibacterial effects exposed to SBF solution. Ceram. Int. 2021, 47, 33413–33425. [Google Scholar] [CrossRef]
  99. Daroonparvar, M.; Azizi, M.; Yajid, M.A.T.; Gupta, R.K. Antibacterial activities and corrosion behavior of novel PEO / nanostructured ZrO2 coating on Mg alloy. Trans. Nonferrous Met. Soc. China 2018, 28, 1571–1581. [Google Scholar] [CrossRef]
  100. Yan, X.; Zhao, M.-C.; Yang, Y.; Tan, L.; Zhao, Y.-C.; Yin, D.-F.; Yang, K.; Atrens, A. Improvement of biodegradable and antibacterial properties by solution treatment and micro-arc oxidation (MAO) of a magnesium alloy with a trace of copper. Corros. Sci. 2019, 156, 125–138. [Google Scholar] [CrossRef]
Figure 1. Voltage–time plots for PEO-coated specimens.
Coatings 12 01967 g001
Figure 2. FE-SEM images of surface at various concentrations of TiO2: 0 (a), 1 (b), 2 (c), 3 (d), and 4 (e) g/L.
Coatings 12 01967 g002aCoatings 12 01967 g002b
Figure 3. The average percentage of porosity and the average size of porosity with increasing concentration of TiO2 NPs.
Coatings 12 01967 g003
Figure 4. FE-SEM images of cross section at various concentrations of TiO2: 0 (a), 1 (b), 2 (c), 3 (d), and 4 (e) g/L.
Coatings 12 01967 g004
Figure 5. GXRD pattern of PEO-coated specimens.
Coatings 12 01967 g005
Figure 6. The surface EDS elemental mapping of PEO-coated specimens at various concentrations of TiO2: (a) 0, (b) 1, (c) 2, (d) 3 and (e) 4 g/L.
Coatings 12 01967 g006
Figure 7. The EDS point spectra of PEO-coated specimens at various concentrations of TiO2: T0 = 0 g/L, T1 = 1 g/L, T2 = 2 g/L, T3 = 3 g/L, and T4 = 4 g/L.
Coatings 12 01967 g007
Figure 8. The surface roughness values of PEO-coated specimens at various concentrations of TiO2: T0 = 0 g/L, T1 = 1 g/L, T2 = 2 g/L, T3 = 3 g/L, and T4 = 4 g/L.
Coatings 12 01967 g008
Figure 9. (a) Wettability graphs and (b) calculated contact-angle changes with time for PEO-coated specimens at various concentrations of TiO2: T0= 0 g/L, T1= 1 g/L, T2= 2 g/L, T3= 3 g/L, and T4= 4 g/L.
Coatings 12 01967 g009aCoatings 12 01967 g009b
Figure 10. (ae) Nyquist, and (fj) Bode plots of PEO-coated specimens at various concentrations of TiO2: T0 = 0 g/L, T1 = 1 g/L, T2 = 2 g/L, T3 = 3 g/L, and T4 = 4 g/L.
Coatings 12 01967 g010aCoatings 12 01967 g010b
Figure 11. Schematic of electrical equivalent circuits of (a) uncoated Mg alloy and (b) PEO coatings.
Coatings 12 01967 g011
Figure 12. (a,b) The FE-SEM surface morphology micrographs two-magnified and (c) EDS point spectra of T1 sample after 72 h of immersion to SBF.
Coatings 12 01967 g012
Figure 13. The surface EDS elemental mapping of samples after 72 h of immersion in SBF.
Coatings 12 01967 g013
Figure 14. Changes in the friction coefficient according to the wear distance of PEO-coated specimens.
Coatings 12 01967 g014
Figure 15. Wear distance and morphology of the coated samples: 0 (a), 1 (b), 2 (c), 3 (d), and 4 (e) g/L TiO2.
Coatings 12 01967 g015
Figure 16. Chips produced in the wear test of coated samples: 0 (a), 1 (b), 2 (c), 3 (d), and 4 (e) g/L TiO2.
Coatings 12 01967 g016
Figure 17. Steel pins used in coating wear test: 0 (a), 1 (b), 2 (c), 3 (d), and 4 (e) g/L TiO2.
Coatings 12 01967 g017
Figure 18. (a) The colonies photographs of S. aureus bacteria after 6 h incubation at 37 °C and (b) the calculated antibacterial rate graph for PEO coatings.
Coatings 12 01967 g018aCoatings 12 01967 g018b
Table 1. Chemical composition of AZ31B alloy.
ElementCaZnSiNiFeMnAlMg
Wt.%0.0060.960.010.010.0060.392.65Surplus
Table 2. Chemical composition of the electrolyte used for the ceramic composite coatings.
CodeElectrolytic (g/L)pHConductivity (ms/cm)
KOHNa3PO4HATiO2
T0355012.1011.3
T1355112.1111.1
T2355212.1310.9
T3355312.1510.9
T4355412.1610.7
Table 3. The results of the voltage–time diagram.
SampleBreakdown Voltage (V)Critical Voltage (V)Final Voltage (V)
T0325461457
T1397498486
T2406495499
T3507547516
T4512569551
Table 4. Electrochemical data of the uncoated and PEO-coated specimens in SBF solution for various durations, calculated from the circuit models.
Time (h)SamplesRouter (kΩ·cm2)Rinner (kΩ·cm2)
1AZ310.48
T033.10.45
T135.70.51
T227.60.42
T325.30.39
T422.60.35
24T093.24.5
T172.12.3
T230.10.75
T354.51.13
T422.91.13
48T02437.4
T11615.8
T279.41.44
T392.42.54
T423.21.49
72T02919.6
T12858.6
T290.21.52
T31482.92
T449.11.67
Table 5. Data extracted from wear test.
SamplesAverage Coefficient of Friction ×103Mass Loss (g)Wear Track Width (mm)
T0434.10.02203.467
T1395.50.01753.161
T2396.60.01623.196
T3398.70.01493.199
T4454.40.02123.448
Publisher’s Note: MDPI stays neutral with regard to jurisdictional claims in published maps and institutional affiliations.

