Article

Nondestructive Evaluation of Thermal Barrier Coatings Thickness Using Terahertz Time-Domain Spectroscopy Combined with Hybrid Machine Learning Approaches

1
School of Mechanical Engineering, Anhui Polytechnic University, Wuhu 241000, China
2
School of Artificial Intelligence, Anhui Polytechnic University, Wuhu 241000, China
3
School of Electrical and Automation, Wuhu Institute of Technology, Wuhu 241006, China
4
Department of Quality and Safety Engineering, China Jiliang University, Hangzhou 310018, China
5
Technical Section, Anhui Kuwa Robot Co., Ltd., Wuhu 241000, China
*
Authors to whom correspondence should be addressed.
Coatings 2022, 12(12), 1875; https://doi.org/10.3390/coatings12121875
Submission received: 7 November 2022 / Revised: 22 November 2022 / Accepted: 29 November 2022 / Published: 2 December 2022

Abstract

:
To ensure the thermal stability of aero-engine blades under high temperature and harsh service environments, it is necessary to quickly and accurately evaluate the thickness of thermal barrier coatings (TBCs). In this work, it was proposed to use the terahertz nondestructive testing (NDT) technique combined with the hybrid machine learning algorithm to measure the thickness of TBCs. The finite difference time-domain (FDTD) method was used to model the optical propagation characteristics of TBC samples with different thicknesses (101–300 μm) in the frequency band. To make the terahertz time-domain signal obtained simulation more realistic, uniform white noise was added to the simulation data and wavelet denoising was conducted to mimic the real testing environment. Principal components analysis (PCA) algorithm and whale optimization algorithm (WOA) combined with an optimized Elman neural network algorithm was employed to set up the hybrid machine learning model. Finally, the hybrid thickness regression prediction model shows low error, high accuracy, and an exceptional coefficient of determination R2 of 0.999. It was demonstrated that the proposed hybrid algorithm could meet the thickness evaluation requirements. Meanwhile, a novel, efficient, safe, and accurate terahertz nondestructive testing method has shown great potential in the evaluation of structural integrity of thermal barrier coatings in the near future.

1. Introduction

Aerospace manufacturing engineering is a vital part of modern industry, in which turbine blades are the core elements of aero-engines under harsh working conditions and severe service environments [1]. The blade life is mainly affected by high temperature, so the blade material needs to have excellent resistance to high temperature. Superalloy is applied to the blade manufacturing of traditional materials, but the single superalloy material is inefficient in practice. The aim is to extend the service life of engine turbine blades and strengthen the safety of use. Thermal barrier coatings (TBCs) are deposited on its surface to reduce the working temperature, prevent the high temperature corrosion, enhance the blade anti-erosion ability, and extend the service life [2,3].
TBCs are a complex multi-layer structure, which is usually composed of three layers. The topcoat (TC) is a ceramic layer with a typical thickness of 100 to 600 μm. Yttria stabilized zirconia (YSZ) is currently the most widely used topcoat material for TBCs, owing to its excellent insulation capacity and high fracture toughness [4,5]. The bottom layer is the substrate, which is usually made of Ni superalloy material. With a metal bond coating (BC) between the ceramic layer and the substrate, the BC material is alloy such as NiCrAlY. With the increase of blade service time, thermal growth oxides (TGO) would appear at the interface between the bond layer and the ceramic layer, which is a vital factor to weaken the TBC performance [6]. Factors that affect the performance of the TBCs or directly lead to the failure are complex. Thickness is an important index to analyze coating properties and can be used to evaluate whether the coating structure is damaged or has failed. Therefore, in terms of coating structural integrity evaluation, the thickness measurement of TBCs is the emphasis attention problem.
TBC thickness measurement methods are mainly classified into two categories, destructive testing and nondestructive testing (NDT). Destructive testing usually destroys the characterization of the coating. For example, the scanning electron microscopy (SEM) observation method requires the TBC sample to be ground before testing to obtain the electron micrograph and then analyze the microstructure [7]. Currently, NDT techniques are more applicable to the measurement of TBC thickness, such as infrared thermography [8], ultrasonic testing technology [9], X-ray inspection [10], digital image analysis [11], eddy current method, and microwave detection [12]. Various testing techniques have excellent characteristics and could be applied to samples under different experimental conditions, but there are some drawbacks and limitations. A coupling agent is needed for ultrasonic detection, and signal aliasing would occur when detecting multilayer coatings. Infrared thermal imaging is suitable for samples with high thermal conductivity, X-ray is harmful to human health, and so on. Compared with the above traditional testing techniques, terahertz technology is a unique nondestructive testing technique. With transient, penetrating, coherent, and low energy, it could be used in imaging and thickness measurement. High detection accuracy and efficiency can be maintained without touching the sample. Because terahertz energy is so small, it is not destructive to substances or harmful to humans. Because of the high terahertz frequency, the spatial resolution is also high, and the penetration of multilayer coatings is strong.
Recently, terahertz detection technology has become popular and widely used. For example, Fukuchi et al. [3] used terahertz waves to obtain the refractive index of YSZ ceramic coatings and the time delay of reflection echo to determine the thickness; Cao et al. [13] proposed an efficient and reliable measurement method for multilayer coatings based on terahertz time-domain spectroscopy; Zhang et al. [14] used terahertz time-domain spectroscopy and imaging to detect multilayered ceramic matrix composites, and analyzed the bonding defects by extracting waveform characteristics. Ye et al. [15] used terahertz technology to monitor the lifetime of multilayer coatings. The common feature of these previous works was the extraction of the time-domain signal using the terahertz propagation principle. The characteristic parameters of terahertz waves were extracted by signal processing and the sample information was obtained by calculation. Nevertheless, traditional NDT methods cannot meet the requirements under certain specific conditions, and the processing of echo signals is strict. Due to the difficulty of extracting feature information, it leads to the decrease of detection accuracy and increase of error when the signal is aliased. Moreover, it cannot meet the requirements of rapid and intelligent detection of TBC thickness. On the other hand, inspection personnel are required to have professional knowledge, and the practicability is poor. Consequently, the application of machine learning methods to nondestructive testing was put forward [16,17]. Zhang et al. [18] mentioned that the random optimization algorithm combined with terahertz technology can solve the problem when the sample thickness is too thin to obtain accurate flight time directly from the pulse echo. Through previous studies, it has been confirmed that terahertz technology is relevant in nondestructive testing and has promoted the development of the field of nondestructive testing [19,20,21,22].
In this work, a new TBC thickness measurement method combining terahertz technology and hybrid machine learning was proposed. Machine learning is used to optimize data processing, extract distinct features, ensure high detection accuracy, improve detection efficiency, and make the measurement of TBC thickness more intelligent. Simulated terahertz time-domain signal was obtained using the finite difference time-domain (FDTD) method. To be closer to the real test, the simulated signal was pre-processed by adding uniform white noise and using wavelet denoising. Since the data were high-dimensional and unsuitable as input to the model, principal component analysis (PCA) was used to reduce the dimensionality of the pre-processed data [23,24]. Signal features were extracted and input to the whale optimization algorithm (WOA) - Elman model, and squared correlation coefficient (R2), root mean square error (RMSE), mean absolute error (MAE), and mean absolute percentage error (MAPE) were calculated for the prediction model. Comparing the prediction results of the four machine learning models, it was obvious that PCA-WOA-Elman was the most accurate. It was proved that the proposed algorithm can accurately measure the thickness of TBCs.

2. Simulation Experiment Method

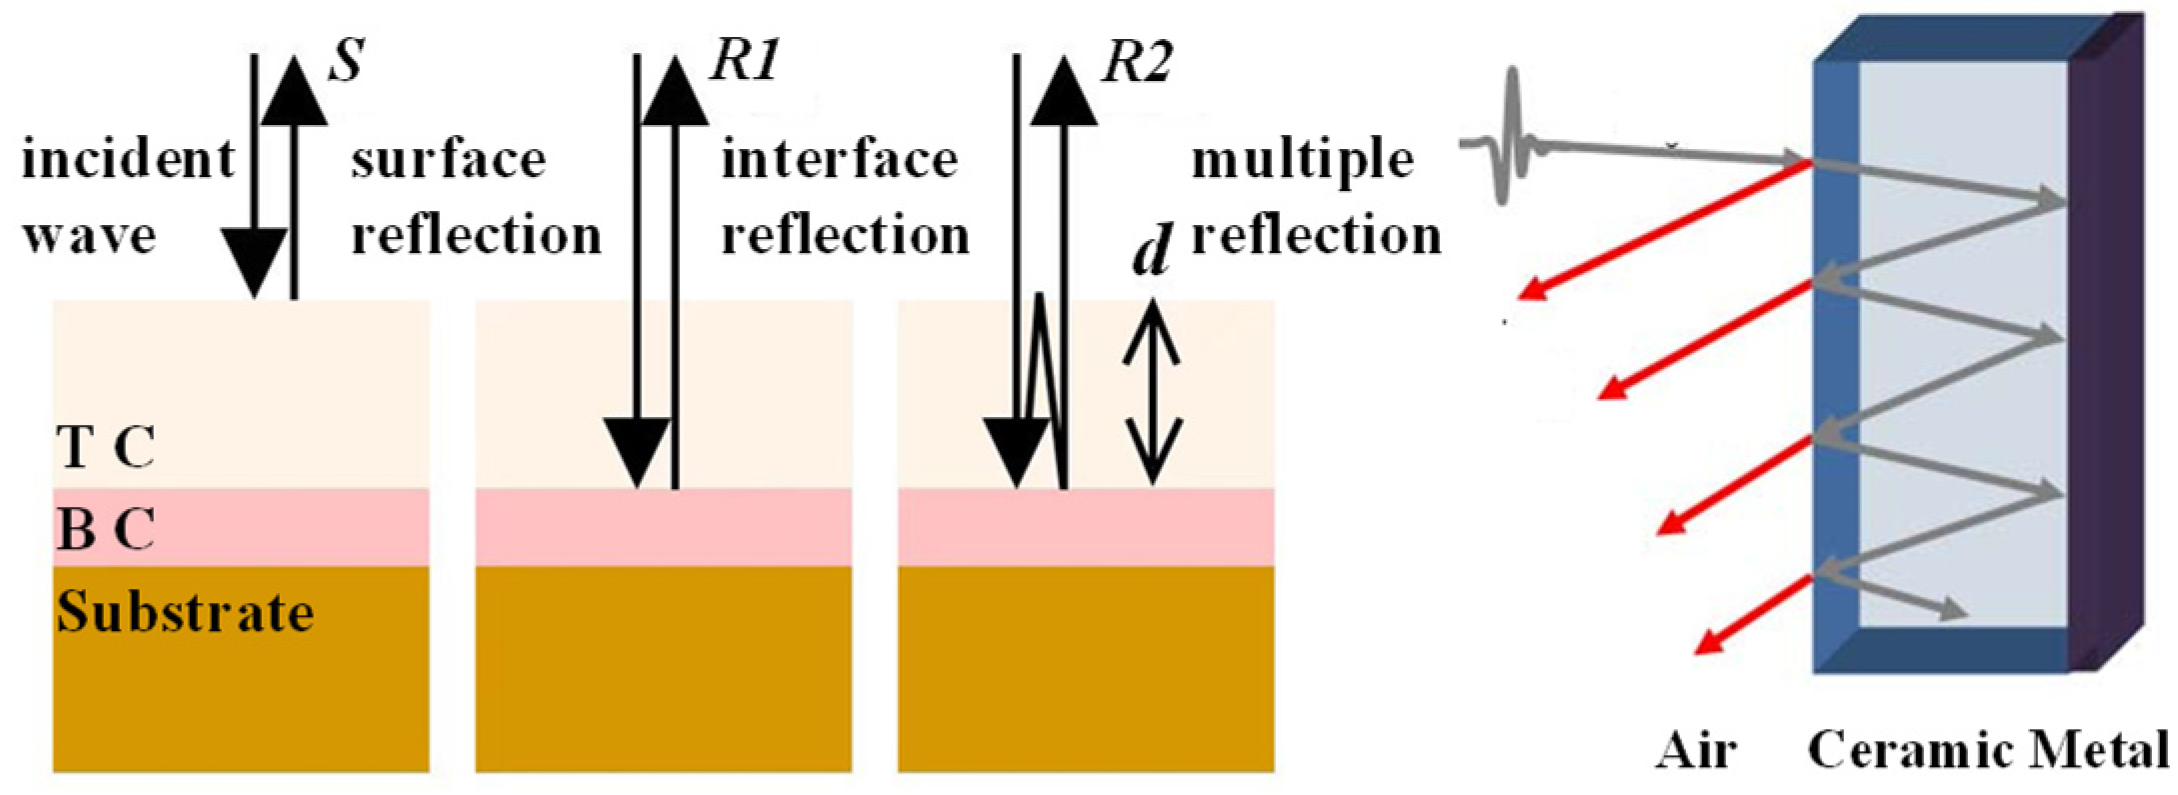
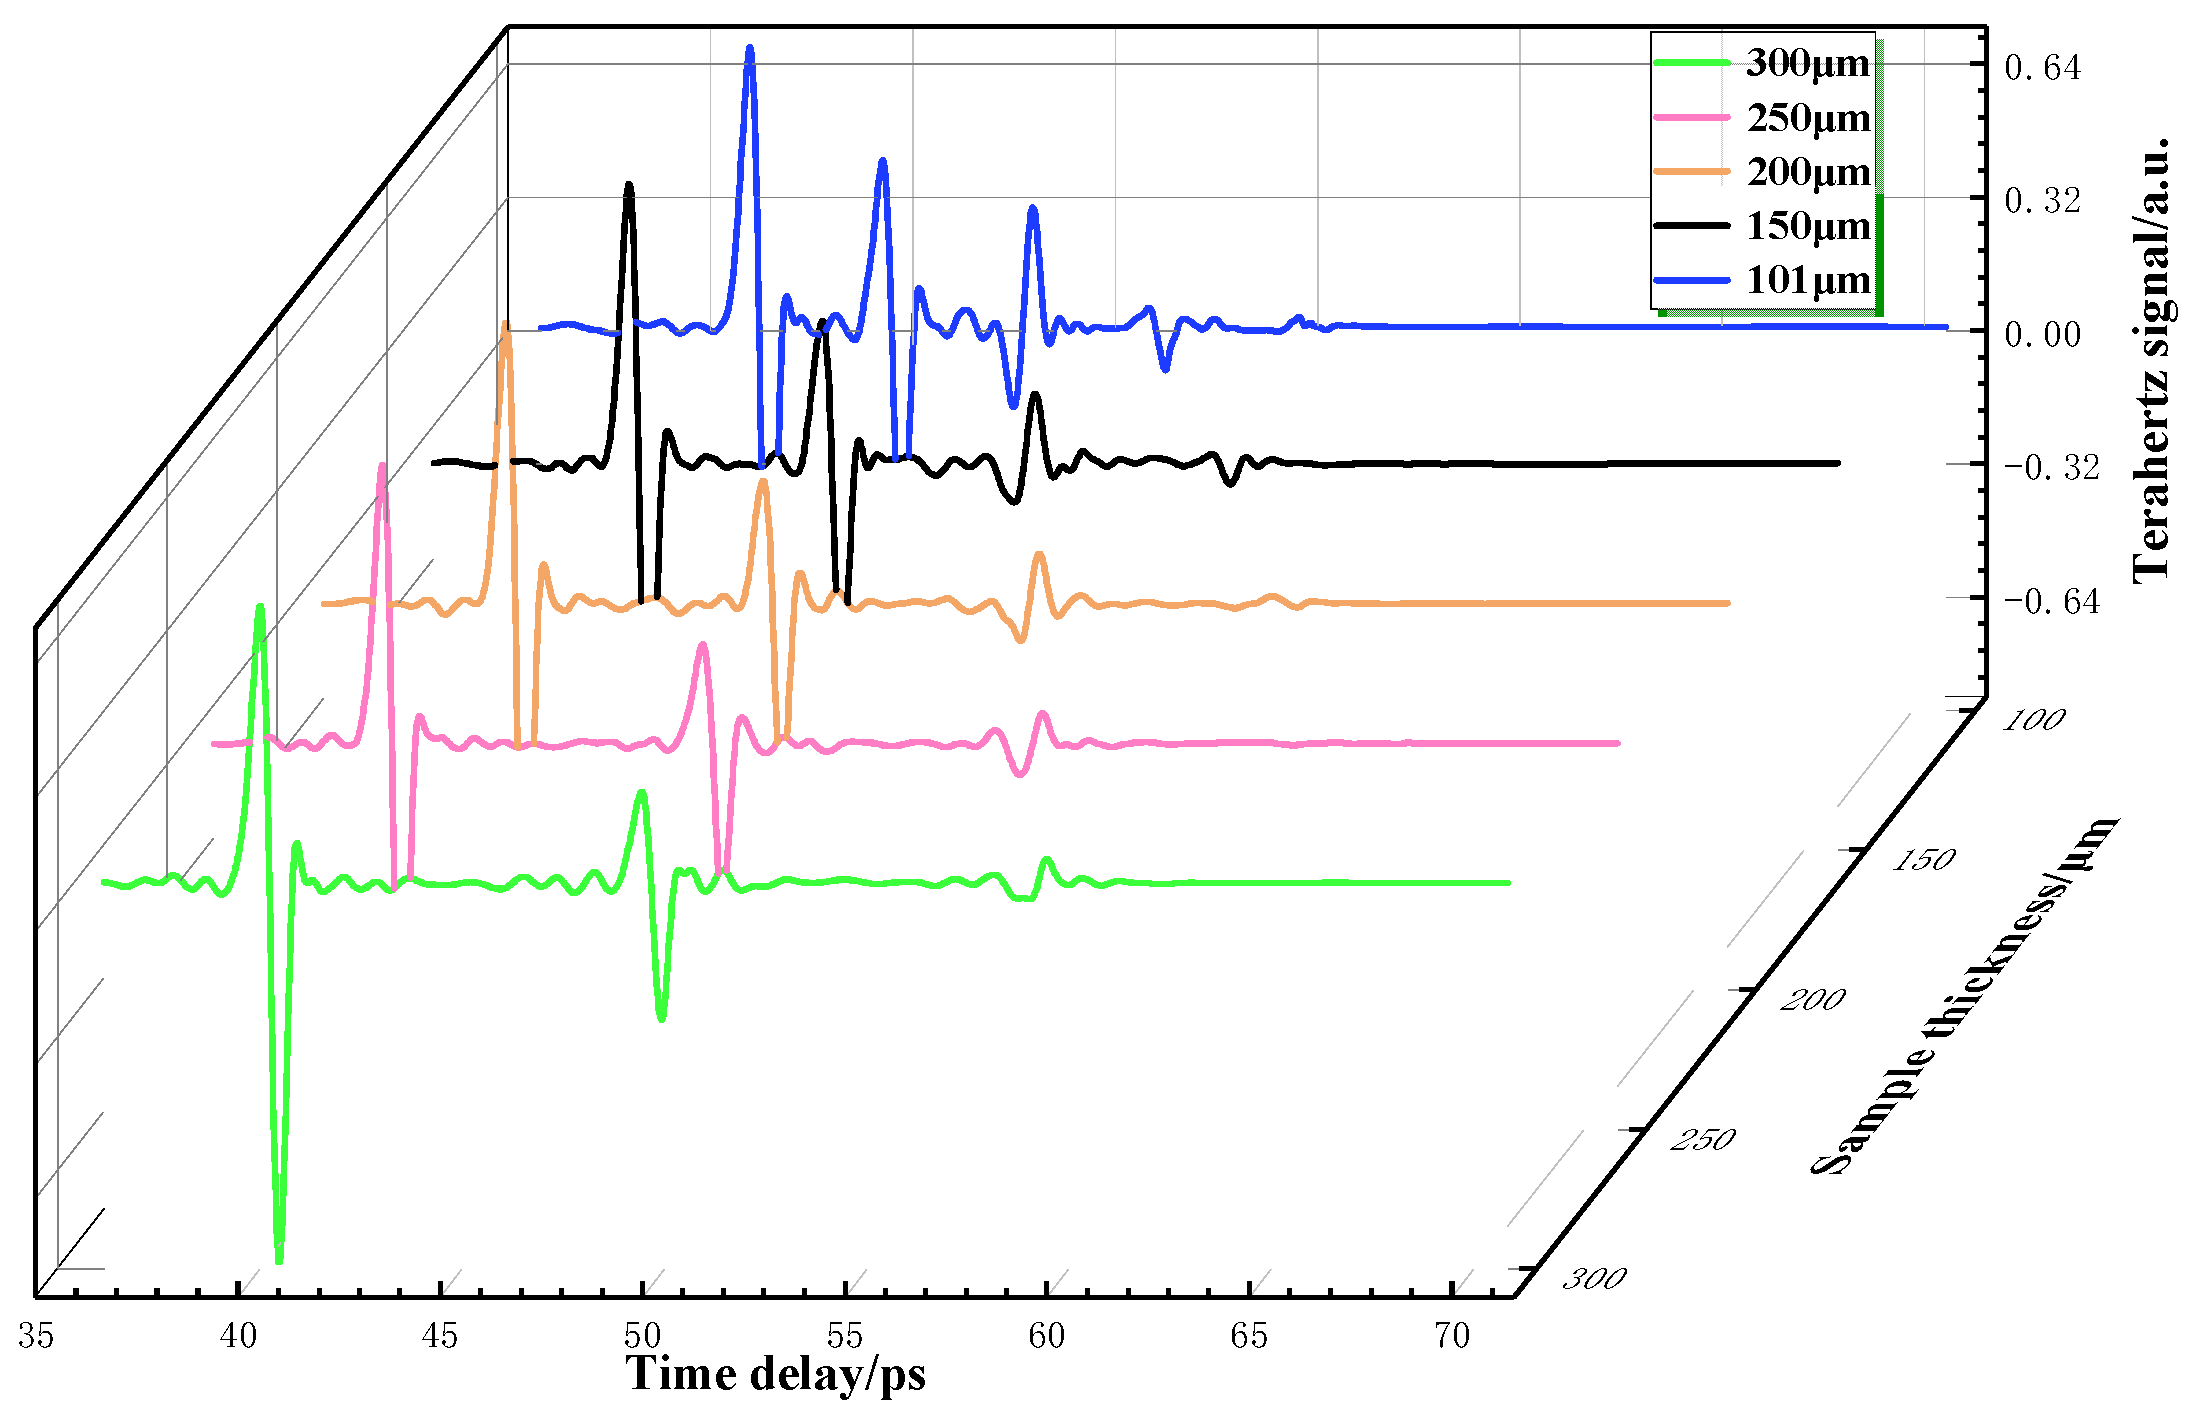
2.1. FDTD Simulation

The finite difference time-domain (FDTD) module of the Lumerical 2020 R2.1 software was used to simulate the electromagnetic field through the time-domain recursive simulation of the wave propagation process. An excellent feature of the model was the ability to specify the mesh and assign the corresponding variables so that complex structures can be modeled to meet the modeling needs. It was suitable for simulated terahertz signals and obtained signals and waveforms clearly [25].
As shown in Figure 1, it reflected the terahertz waves propagation in TBCs. S indicated interface reflected waves, R1 indicated that internal reflected waves are received for the first time, and R2 indicated that internal reflected waves are received for the second time. For the simplification of the model, the direction of terahertz wave incidence was kept perpendicular to the sample [26]. Since terahertz waves could only propagate in non-metallic media or metallic materials with high dielectric properties. While encountering metallic materials with low dielectric properties, the reflection phenomena would occur on the metal surface. Accordingly, terahertz can be transmitted in a ceramic layer, and reflection and refraction occur. Part of the vertically incident terahertz waves was reflected into the air on the surface of the ceramic layer, while the rest was transmitted through the ceramic layer and reflected off the metal substrate. The terahertz waves propagated through the ceramic layer again in the form of echoes so that multiple echoes could be received. Figure 2 shows five simulated terahertz time-domain signals for measuring the thickness of the TBCs. Several echoes were received from the incident terahertz waves in contact with the ceramic layer. The fluctuations gradually weaken with time and the waveform tended to be flat. Since the terahertz signal of 0–35 ps is 0, it was not shown in the figure in order to make the waveform easier to observe.
In this work, the terahertz frequency range was 0.3 to 1 THz, and the simulation TBC thickness was 101 to 300 µm, in 1 µm step, for a total of 200 sets of data. The refractive index of YSZ at this frequency range was usually 3.7 to 5.6; previous studies have shown that the error of thickness measurement was smaller when the refractive index was 4.7 [3]. Table 1 presents the details of the parameter settings of the FDTD software simulation.

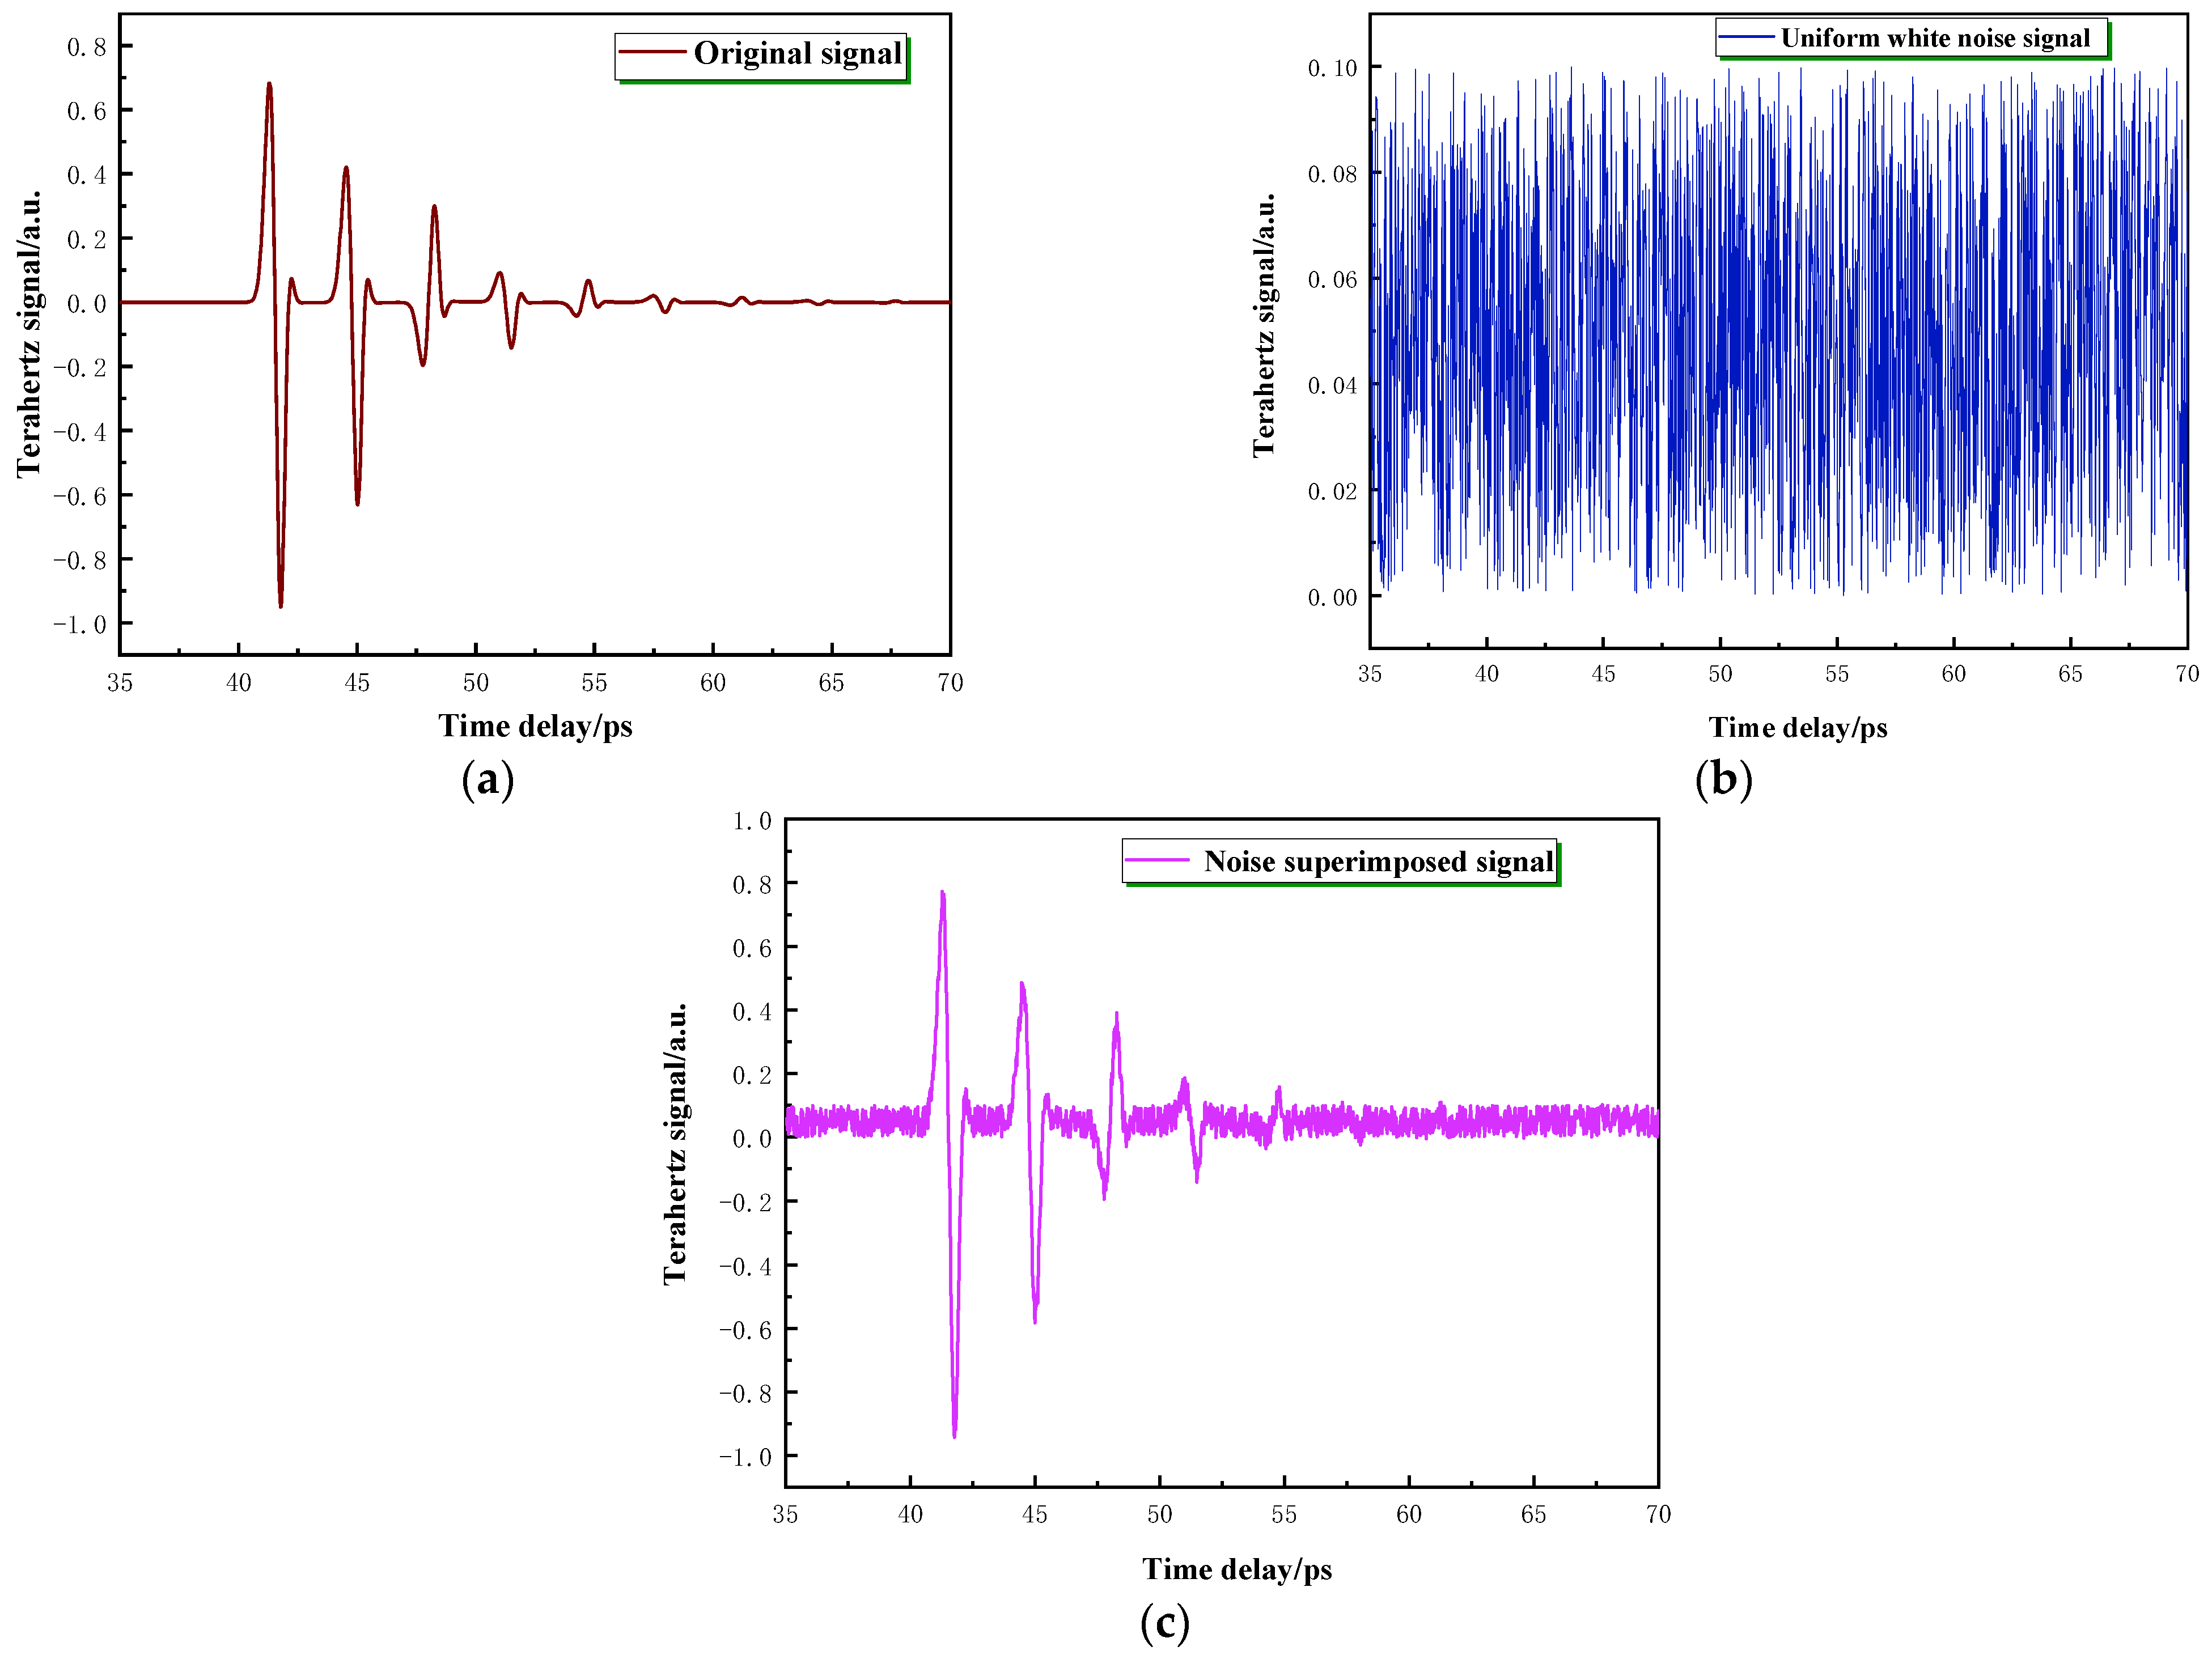
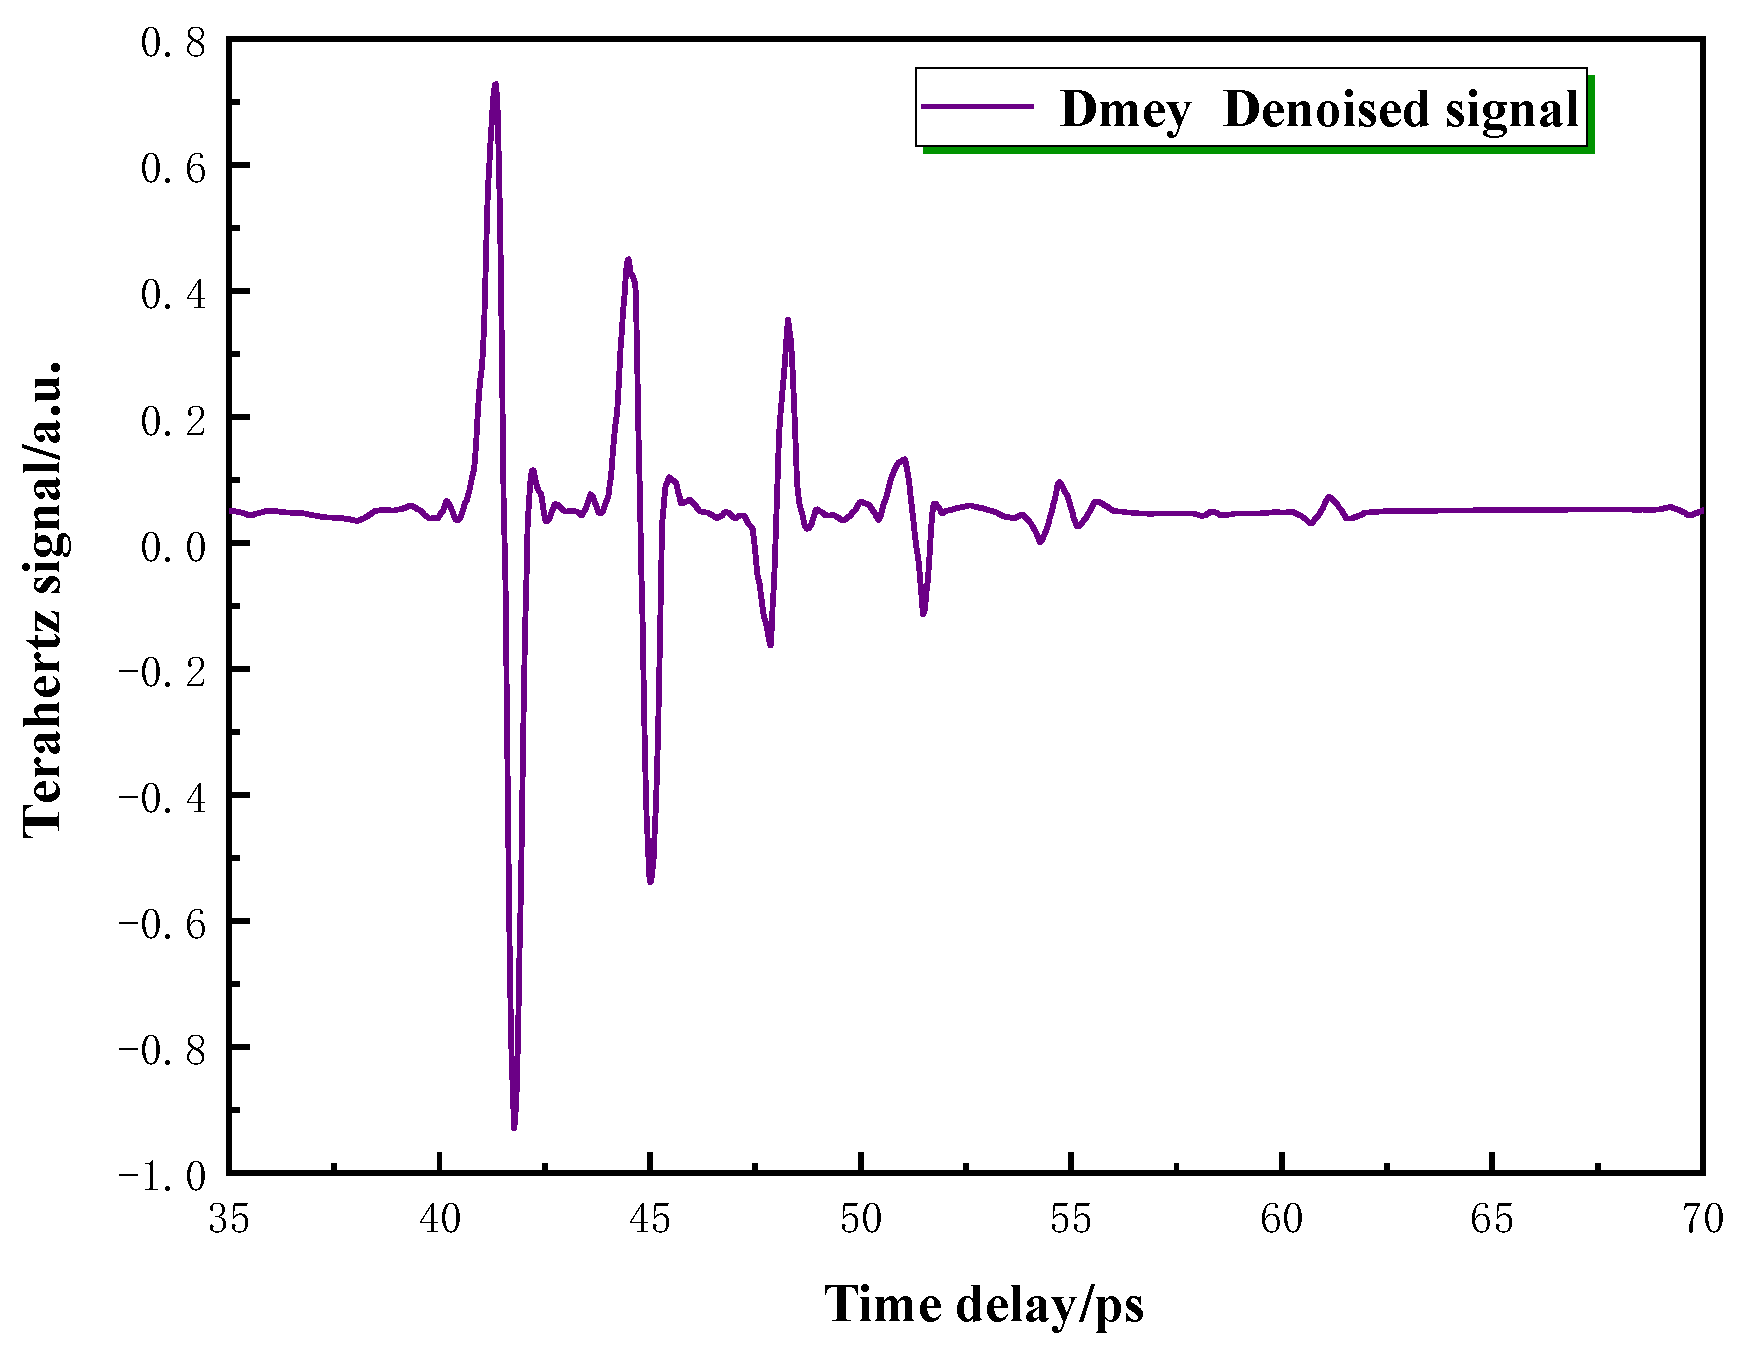
2.2. Signal Pre-Processing

The input of the machine learning model proposed was a terahertz time-domain signal, which was obtained by the FDTD software. Terahertz waves were perturbed by external factors during actual experiments. To make the simulated signal closer to the actual test, uniform white noise and wavelet denoising were added, with the rest of the data processed in the same way.
As shown in Figure 3, uniform white noise was distributed continuously and uniformly within a certain frequency range, with the equivalent noise energy density. In the simulation, the power spectrum density of uniform white noise was 0.1 and the distribution range was 0 to 1. This method is commonly used in the study of terahertz NDT and is a method widely accepted by researchers.
Dmey wavelet analysis denoising has been widely used in fault diagnosis, image processing, speech recognition, spectral analysis, and other fields [28,29,30]. Since wavelet analysis has excellent multi-resolution analysis characteristics, it can better achieve the denoising function. As shown in Figure 4, the Dmey wavelet denoising method was selected, and the terahertz time-domain signal with superimposed uniform white noise needed to be denoised to obtain a smooth signal curve.

2.3. PCA-WOA-Elman Machine Learning Model

2.3.1. Principal Component Analysis

Principal component analysis (PCA) is usually an excellent choice among many data dimensionality reduction algorithms. Its primary function is to reduce the high-dimensional data, extract the significant features of a huge data set, and compose representative and comprehensive new low-dimensional data [31]. The specific process is to calculate the eigenvectors and eigenvalues of the covariance matrix, and select a few eigenvectors with the highest eigenvalue ranking to form a new matrix. This method may reduce the data dimensions without losing the characteristics of the data, which is an effective method to simplify the data.
The following describes in detail the process of dimensionality reduction using the PCA technique, assuming that given the m × n sample matrix H, h j denotes the sample feature variable in column j, where j = [1, 2... n]. The process of PCA is shown in detail below [32].
(1)
Data decentralization
The given sample feature data are decentered to obtain the sample feature matrix H .
h j = h j h j ¯ s j
where h ¯ j and s j are the mean and variance of the j-th column and s, respectively.
(2)
Calculate the covariance matrix
Calculate the covariance matrix E of the decentered sample feature matrix H .
E = 1 m H T H
where H′T is the transpose of the sample eigenmatrix.
(3)
Calculate the eigenvalues and eigenvectors, as well as the corresponding eigenvectors a j
| E λ I | = 0
where λ is the eigenvalue, the number of eigenvalues is n, and I is the unit matrix.
(4)
Finding the γ principal components of the sample feature matrix
First, the contribution of each principal component has to be calculated. When the number of principal components is γ, it is set at a fixed value. The first γ principal components are selected when the cumulative contribution rate reaches a fixed value. Finally, the contribution rate and cumulative contribution rate of the first γ principal components are obtained.
η j = λ j j = 1 n λ j
η = j = 1 γ λ j j = 1 n λ j
where λj is the j-th eigenvalue, ηi is the i-th principal component contribution rate, and η is the cumulative contribution rate.
When determining the number of principal components whose cumulative contribution reaches a set value of γ, the γ principal components of the sample feature matrix can be calculated from the following equation.
y γ = a j T · h j
where a j T is the transpose of the feature vector and h j is the decentered sample feature data of the column j.

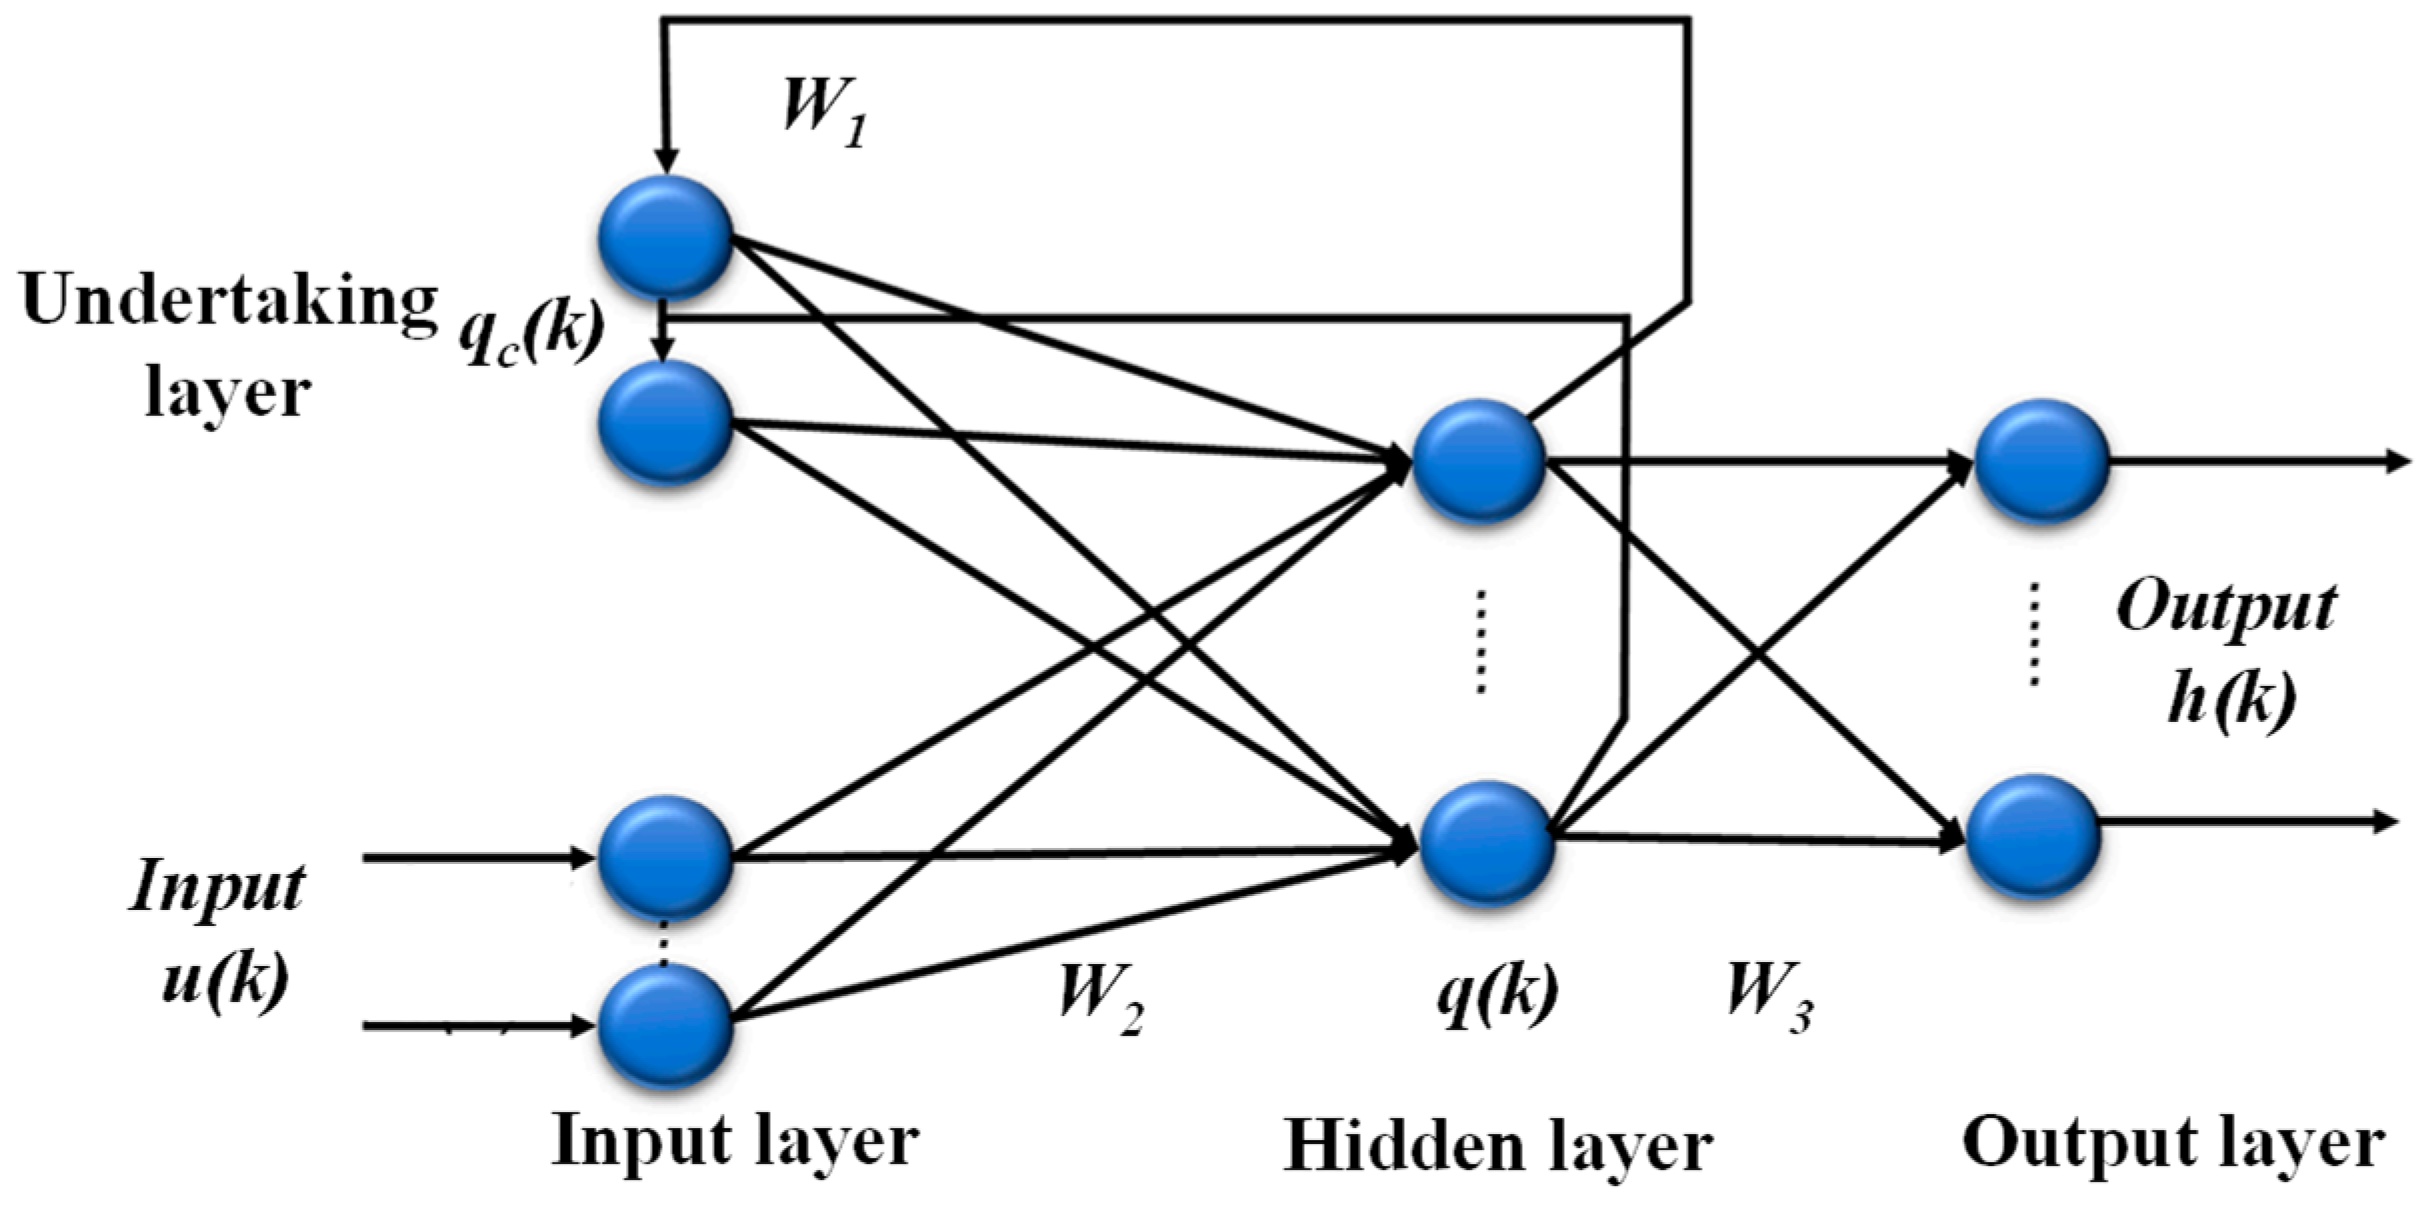
2.3.2. Elman Neural Network

There are two main types of standard neural networks, the feedback and the feedforward. The feed-forward network structure is relatively simple, has a rapid response, and has been extensively used. Nevertheless, a typical drawback is the inability to explain the specific operation process. The model output is only affected by the current input, independent of the previous output. By contrast, the feedback network is affected by the output or delayed input and there is feedback variation during the network operation. This property maintains a suitable iterative process to reach a steady state.
Elman neural network (ENN) is a typical local regression network which consists of four layers, the input layer, the implicit layer, the takeover layer, and the output layer [33,34,35]. Among them, the input layer serves as signal transmission, the implicit layer is the unit containing the transfer function, and the output layer not only transmits the signal but also has the function of linear weighting. It is worth mentioning that the Elman network adds a takeover layer compared to the traditional static network. Correlating the state of the previous moment and combining the input of this moment with the input of the hidden layer. This process is actually a feedback state.
Figure 5 shows the specific operation flow chart of the Elman neural network. W1, W2, and W3 are the connection weights between each layer, respectively. u ( k 1 ) ,   q ( k ) ,   h ( k ) , and q c ( k ) are the input vector of ENN, the output vector of the implicit layer, the output vector, and the output vector of the takeover layer, respectively, with the following mathematical model [36].
{ q ( k ) = v ( W 2 u ( k 1 ) + W 1 q c ( k ) ) q c ( k ) = q ( k 1 ) h ( k ) = p ( W 3 q ( k ) )
where v ( x ) and p ( x ) are the transfer functions of the implicit layer and the output layer, respectively.

2.3.3. Principle of The Whale Optimization Algorithm

The whale optimization algorithm (WOA) is a new population intelligence optimization algorithm, mainly derived from imitating the bubble net feeding style of whales. They will spiral close to the prey and spit out bubbles, chasing the fish to a small area for hunting [37,38,39,40].
The WOA process needs to adjust fewer parameters, so the iteration speed is fast and the optimization ability is particularly strong. The following is a mathematical model of the algorithm.
(1)
Surrounding and hunting
Assuming that the current prey is considered the best candidate prey, the current target prey is taken as a feasible solution, and the whale’s initial position vector is updated.
x ( k + 1 ) = | x ( k ) E F |
where x ( k + 1 ) and x ( k ) are the next and current positions of the whale at the time of model iteration, respectively, E is a vector of coefficient matrices, and F is the distance between the optimal target and the whale position
{ E = 2 a r 1 a a = 2 2 k T F = | C x ( k ) x ( k ) |
where k is the number of iterations and a has a decrease from 2 to 0 during the search process, C = 2 r 2 . r 1 and r 2 are the randomly generated vector ranging between [0, 1]. X* is the current optimal solution position, a is the convergence factor.
(2)
The position of the bubble net in the updated encircling pattern
During prey hunting, whales constantly exhale bubbles to form a spiral “bubble net”, and press on the prey closer until they can swallow it. In addition, the whale updates position towards the prey with equal probability p through both the encircling mechanism and the spiral, respectively, and the mathematical model is shown below [41].
F = | x * ( k ) x ( k ) |
x ( k + 1 ) = { F e q m cos ( 2 π l ) + x * ( k ) , p < 0.5 x * ( k ) E F , p 0.5
where q is a constant, p is a random number on [0, 1], and m is a random value on [−1, 1]. F’ is the distance between the prey and the whale’s position.
(3)
Search for prey
The whale optimization algorithm starts from a series of initial feasible solutions and changes the position through continuous iterations. The absolute value of the coefficient matrix vector |E| decreases as the number of iterations increases. When |E| > 1, the whale will expand the search range and randomly choose a feasible solution to update the position vector; when |E| < 1, the whale will select the current optimal solution to update the position vector.

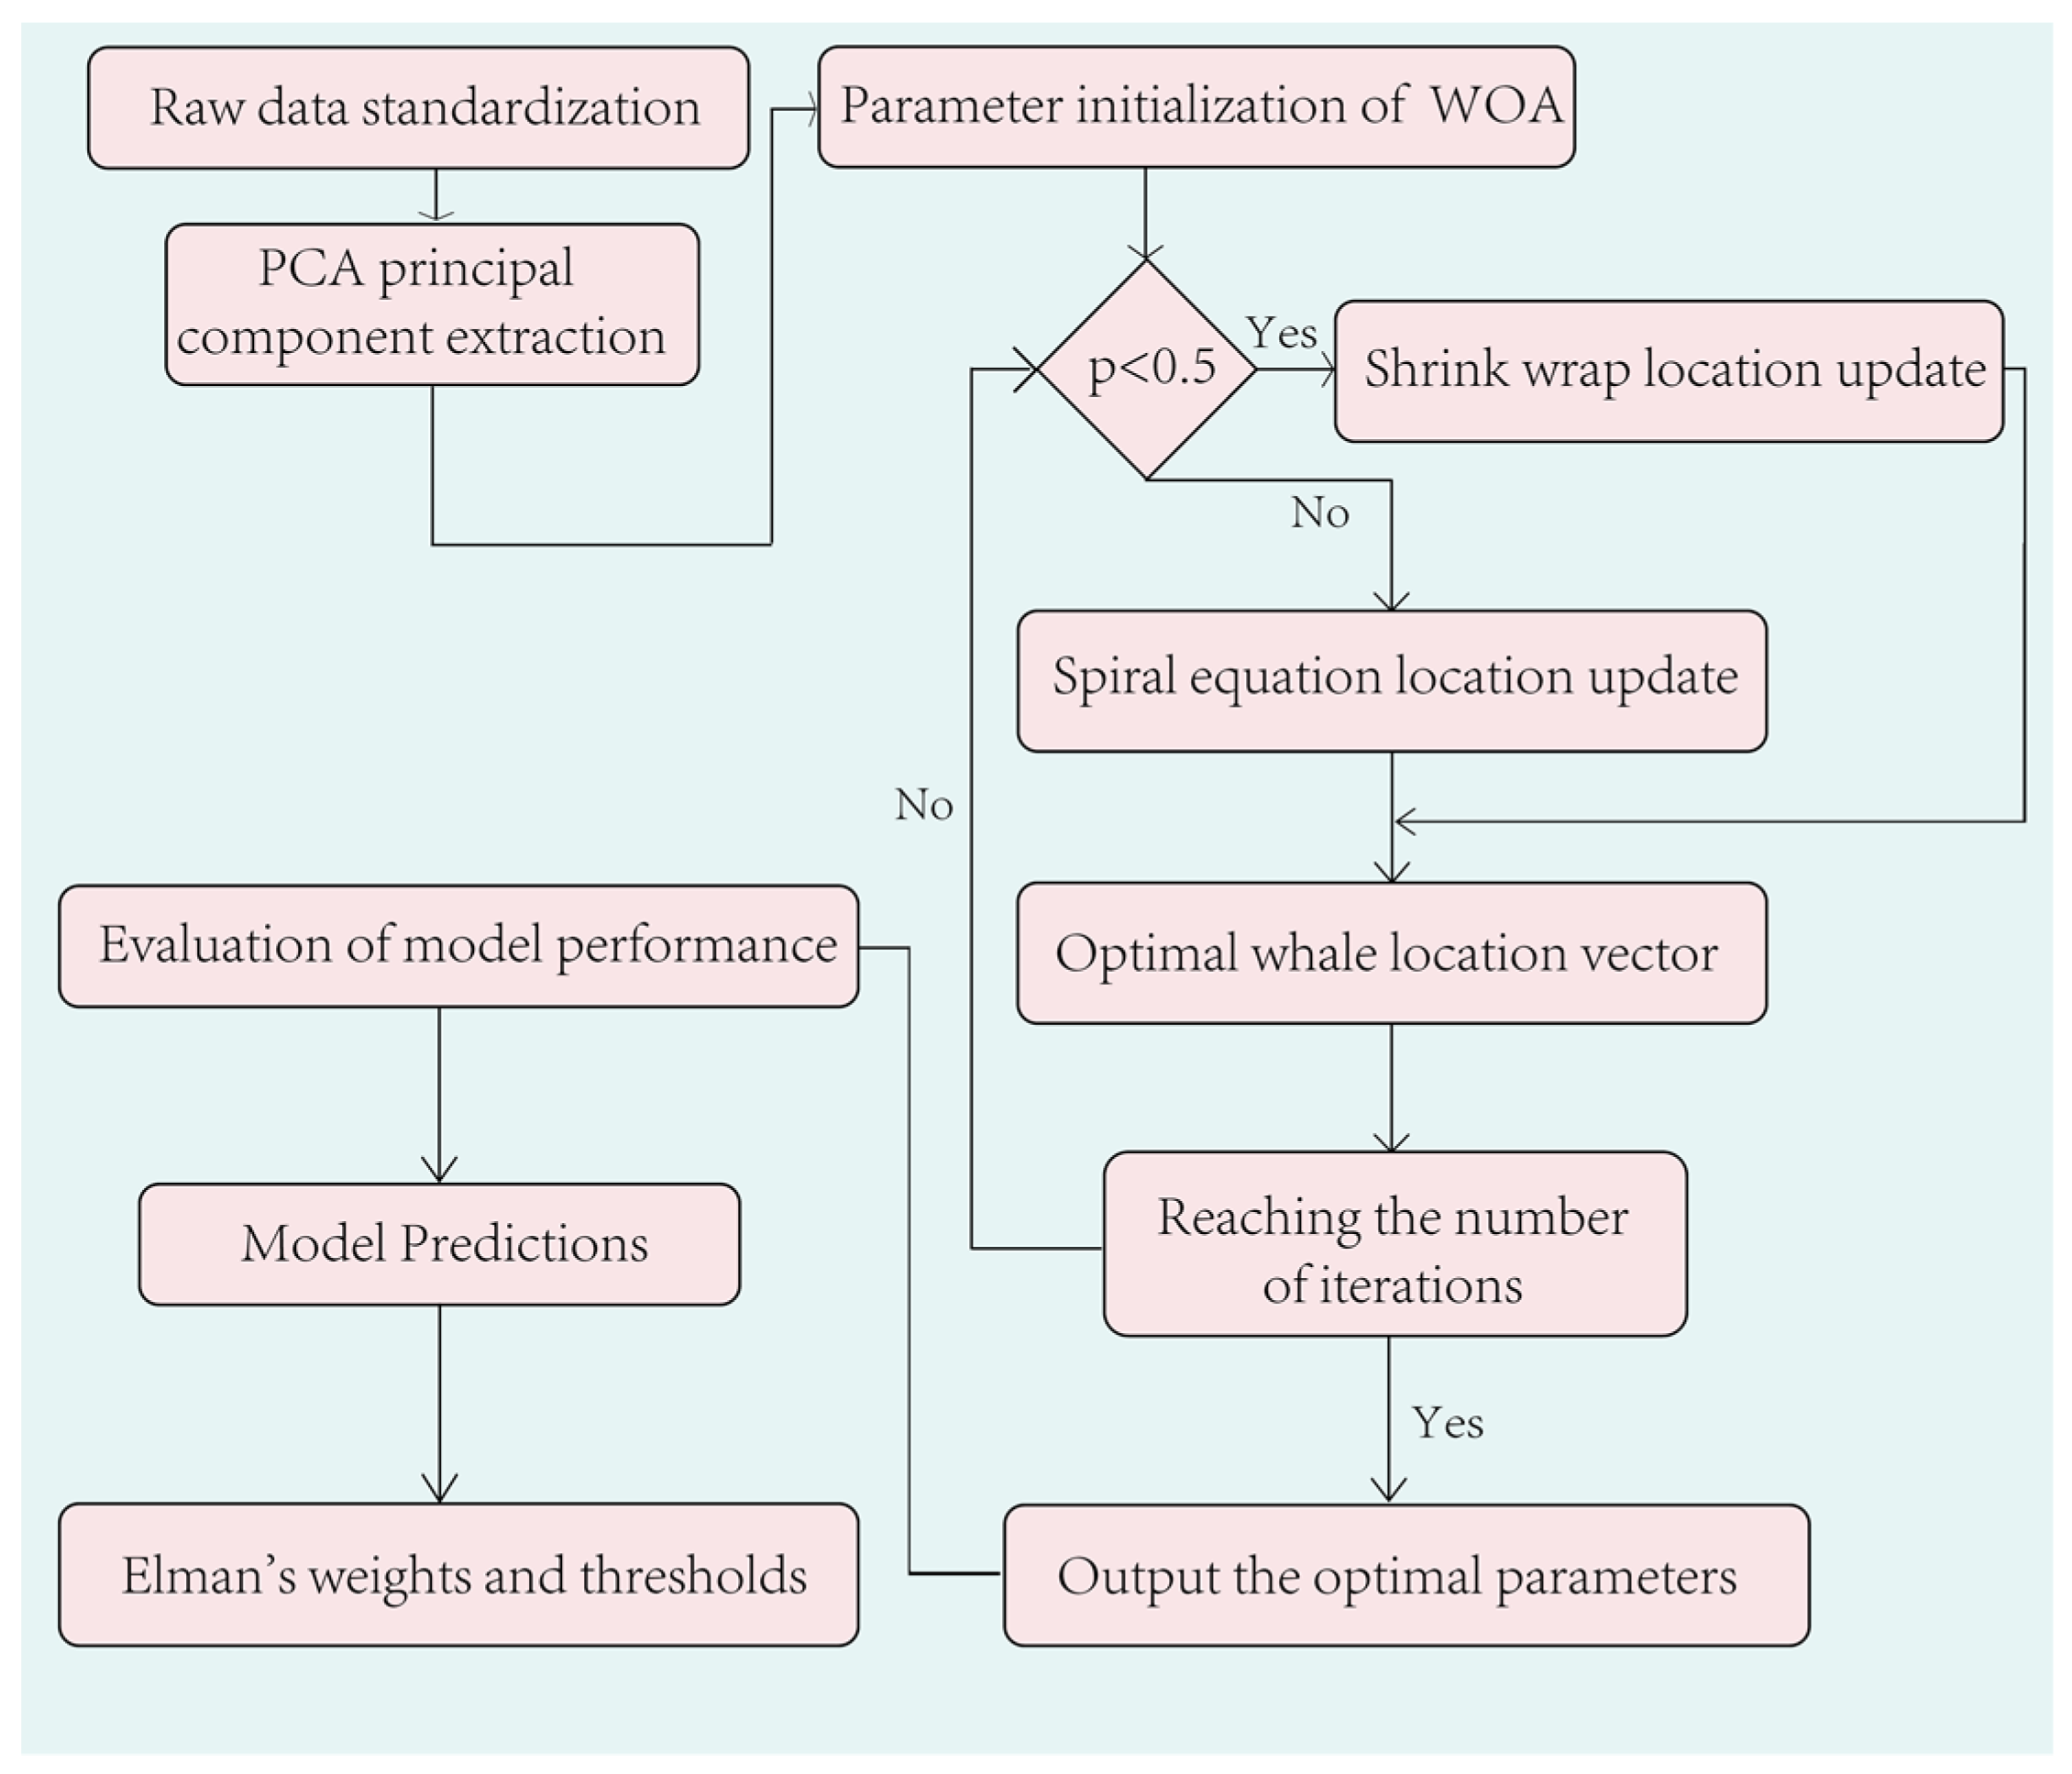
2.3.4. Whale Optimization Algorithm to Optimize Elman Neural Network

Too many parameters were set in the Elman neural network and the calculation time was long, resulting in slow convergence. Therefore, it was essential to optimize the Elman neural network. In the combined model of the whale optimization algorithm and the Elman neural network, the function of WOA was to optimize the weight and threshold of ENN, and the optimal solution obtained was used for model prediction. The original ENN prediction was optimized to obtain a more accurate output [42].
As shown in Figure 6, the terahertz time-domain data were input into the WOA-Elman model after dimensionality reduction by principal component analysis. The optimal solution was obtained with the whale optimization algorithm, and the thermal barrier coating thickness was predicted using the Elman neural network.
In this work, there are altogether 200 sets of data, among which 140 sets of random samples were used as the training set, and 60 sets were used as the prediction set. To test the prediction accuracy of the PCA-WOA-Elman model and verify its prediction performance, the coefficient of determination (R2), root mean square error (RMSE), mean absolute error (MAE), and mean absolute percentage error (MAPE) were introduced as the model evaluation indexes, the calculation formula is shown below.
R M S E = 1 n i = 1 n ( y y ) 2
M A P E = 1 n i = 1 n | y y | y × 100 %
M A E = 1 n i = 1 n | y y |
R 2 = 1 i = 1 n ( y y ) 2 i = 1 n y 2
where y is the real thickness of the ceramic layer, y′ is the predicted value, and n is the number of samples.

3. Simulation Analysis

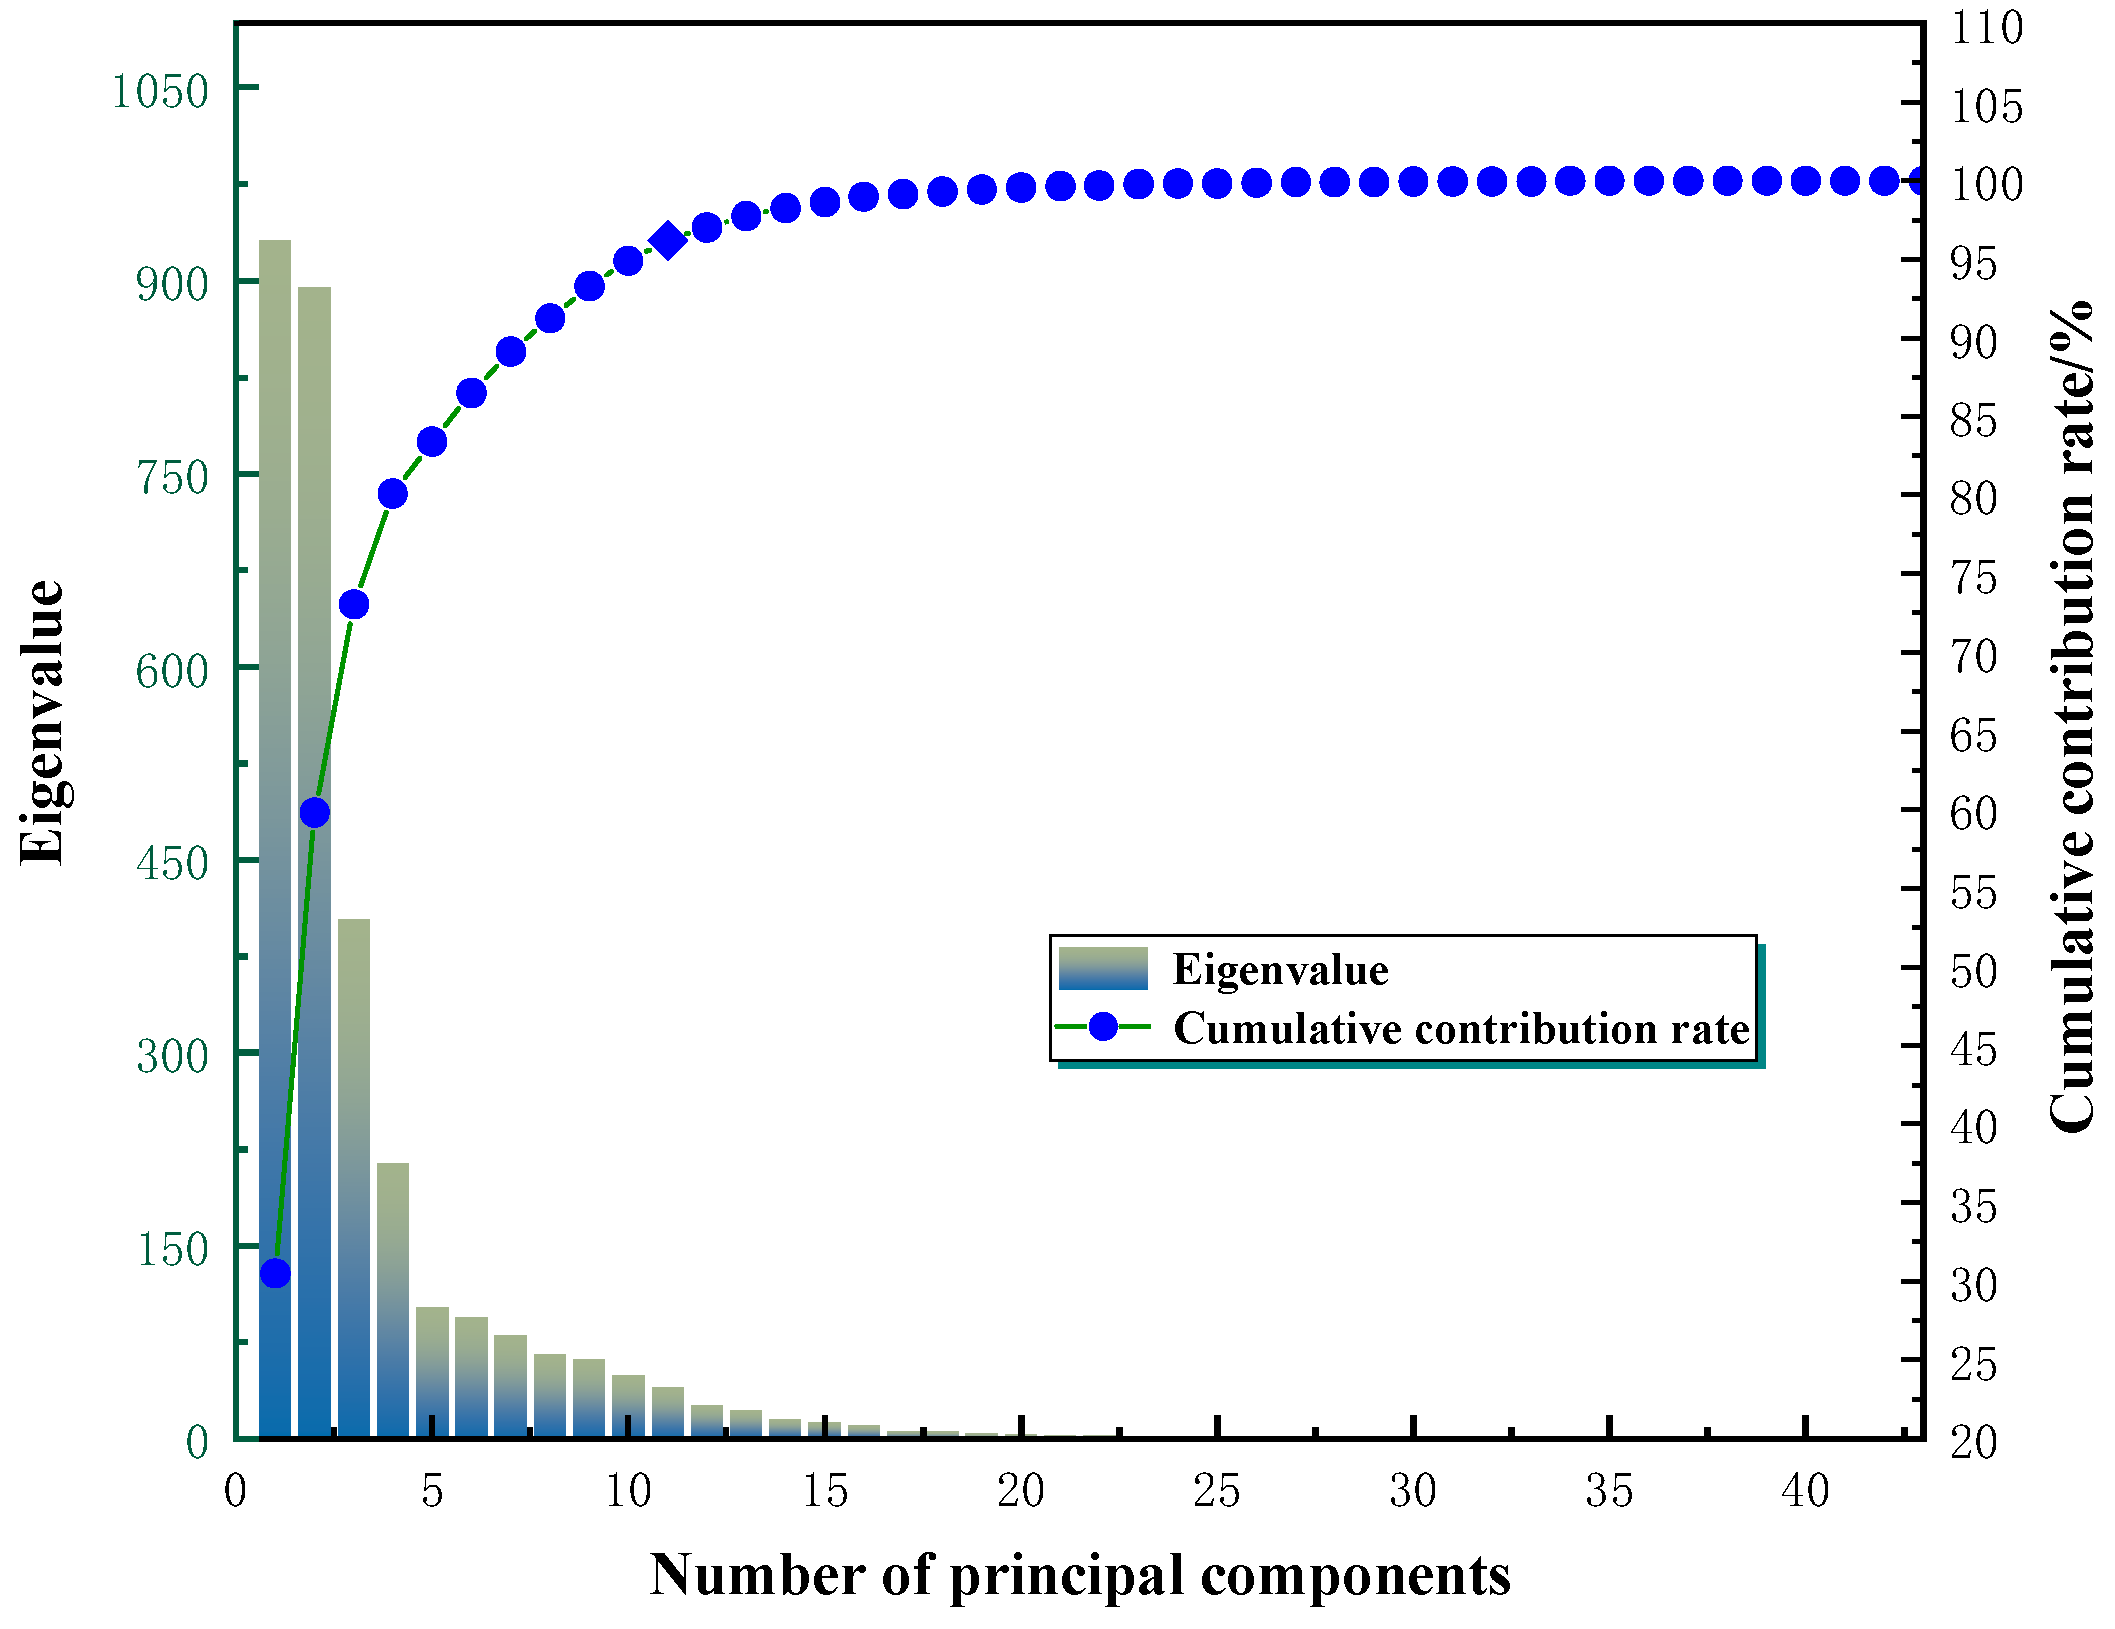
3.1. Results of Principal Component Analysis

The dimensionality of the 200 terahertz time-domain signals was 2596. High-dimensional data substituted into the model would lead to unsatisfactory prediction results and slow calculation speed. The principal component analysis method was used to reduce the dimension. Feature dimensionality reduction was used to extract data with low dimensionality and little redundancy, maximize the reflection of the main features, and process the data without losing the original sample information [40,43,44].
PCA was used to extract principal component features from the noise-processed data, as shown in Figure 7, which presents the cumulative contribution rate and eigenvalue of each principal component. It was evident that the eigenvalue of multi-dimensional data gradually decreases, and the corresponding contribution rate of the feature vector increases steadily. The cumulative contribution had reached 95% at the 11th principal component.
The obvious selection of the 11 principal components with the highest contribution could better reflect the main original data features, which were used as the input of the PCA-WOA-Elman model to measure the TBC thickness. Finally, the 2596 dimensions of the original data were reduced to 11 dimensions.
Table 2 shows the individual contribution rates, cumulative contribution rates, and eigenvalues of the top 11 principal components.

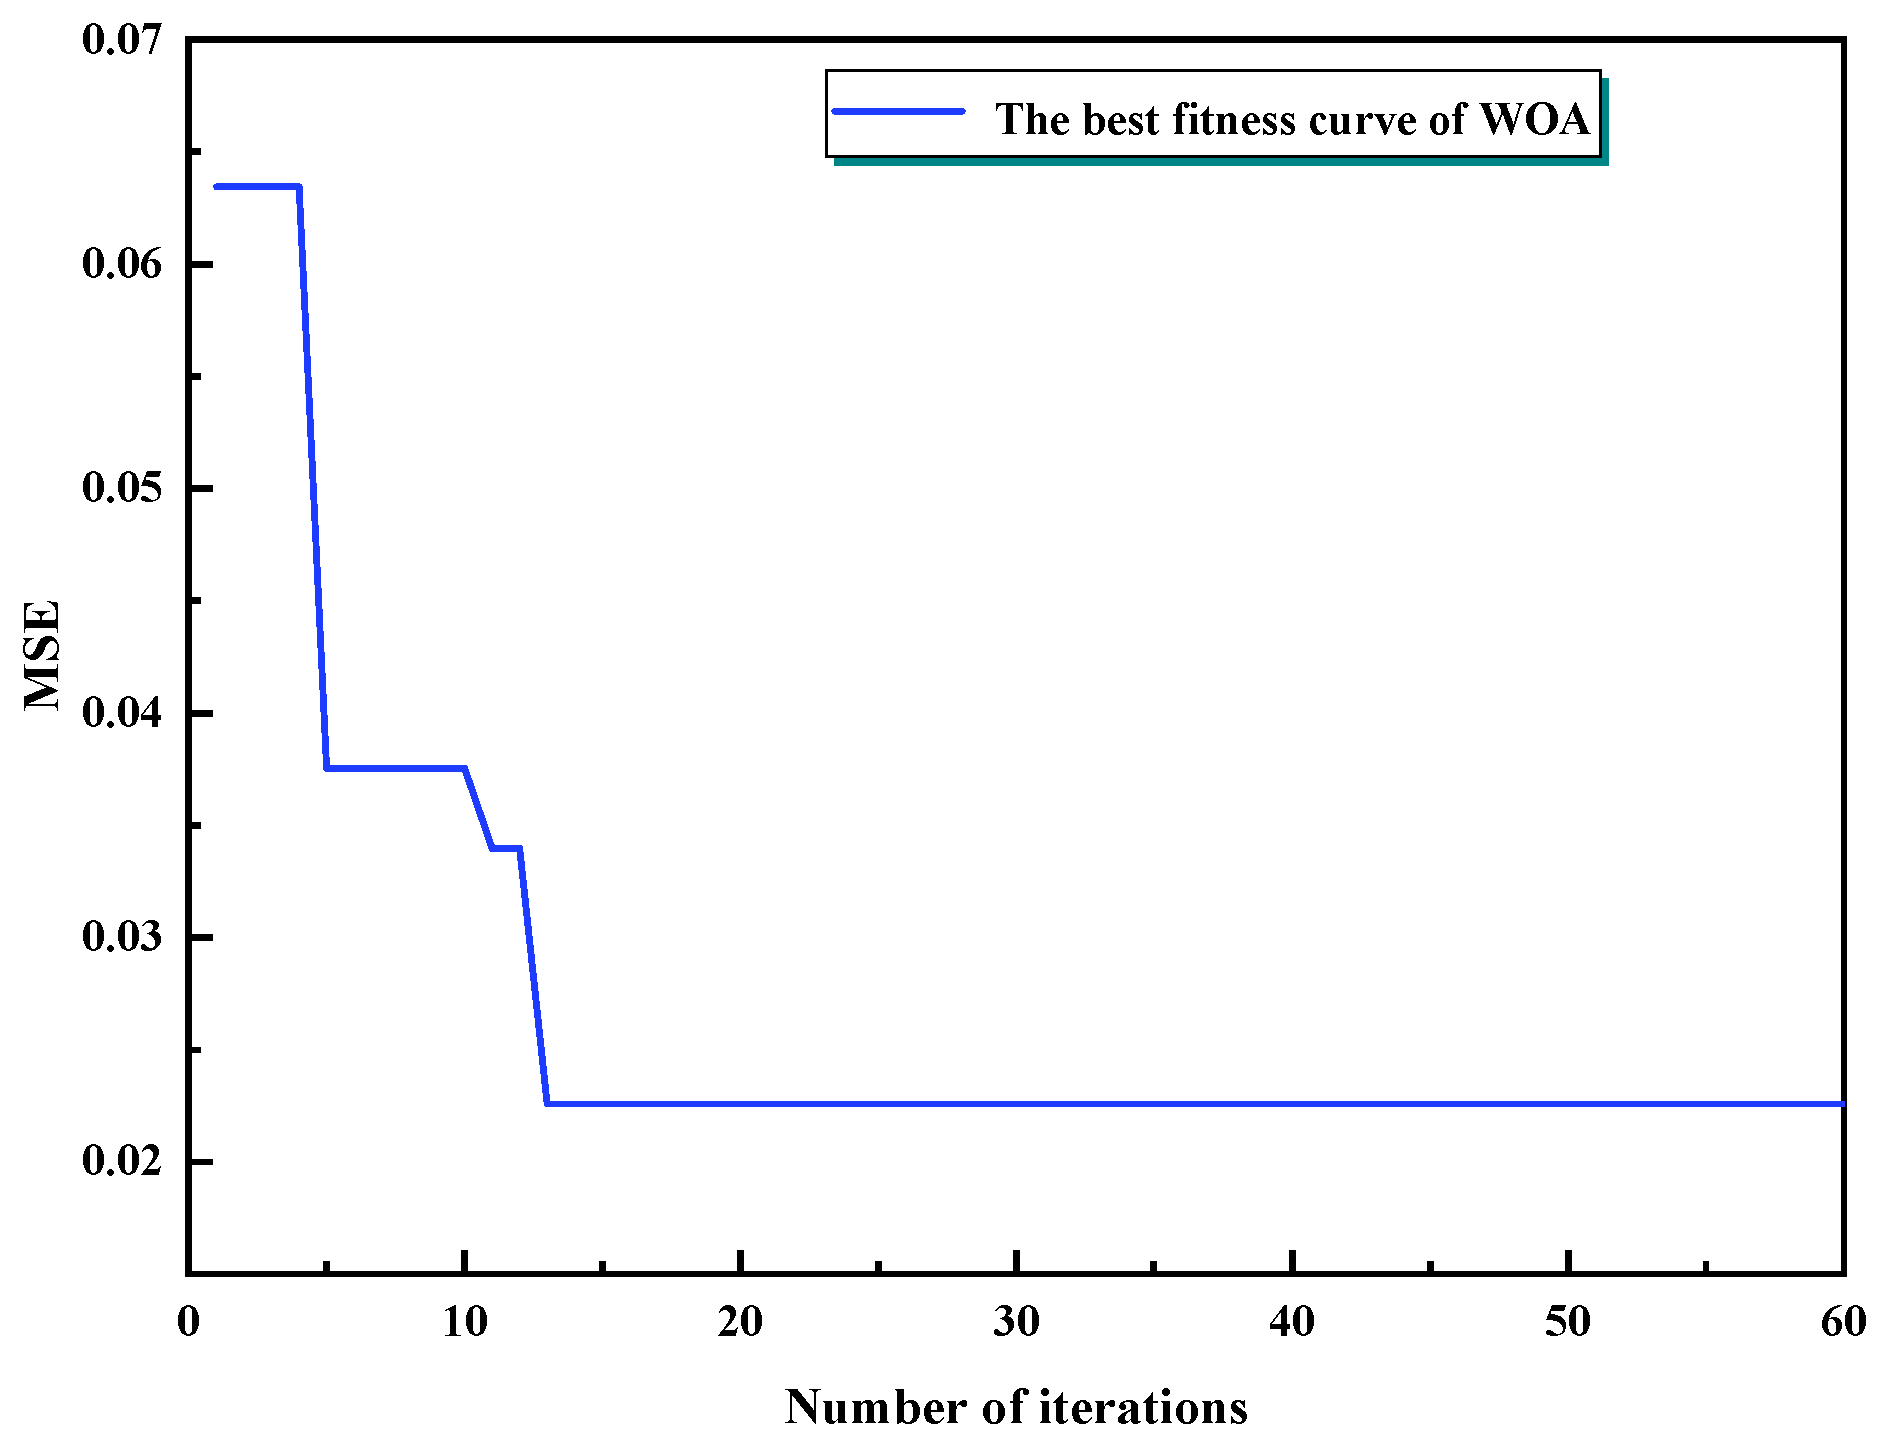
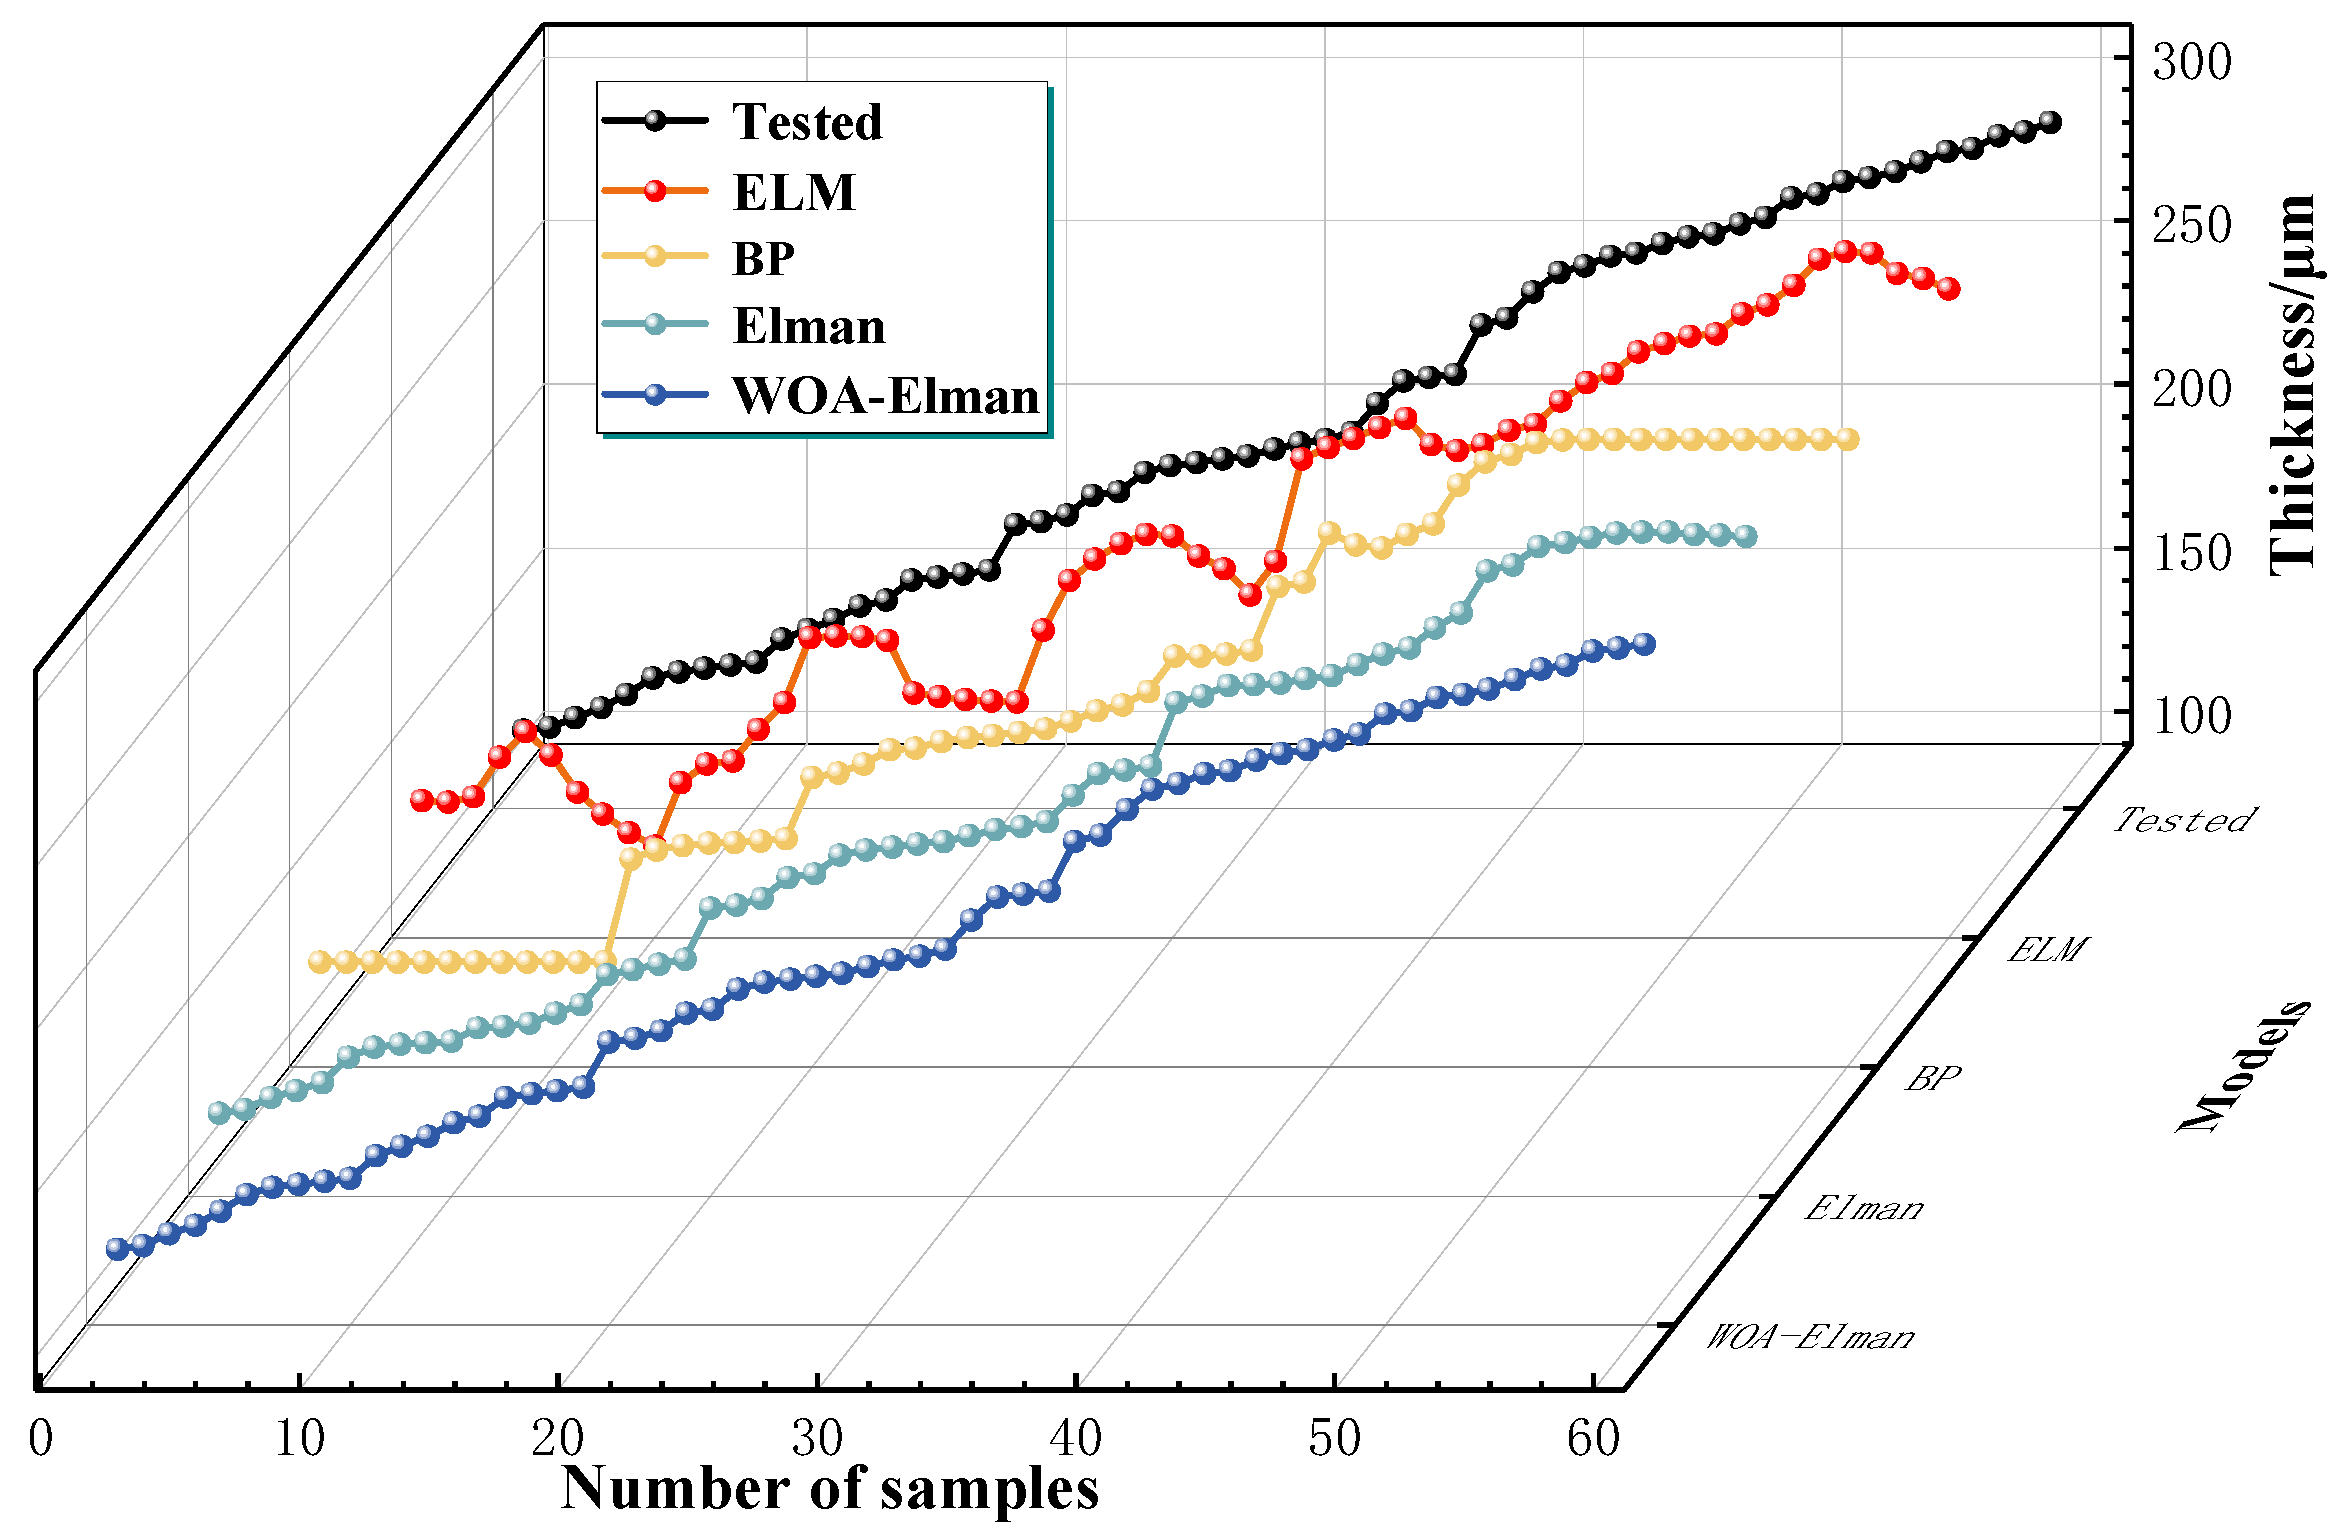
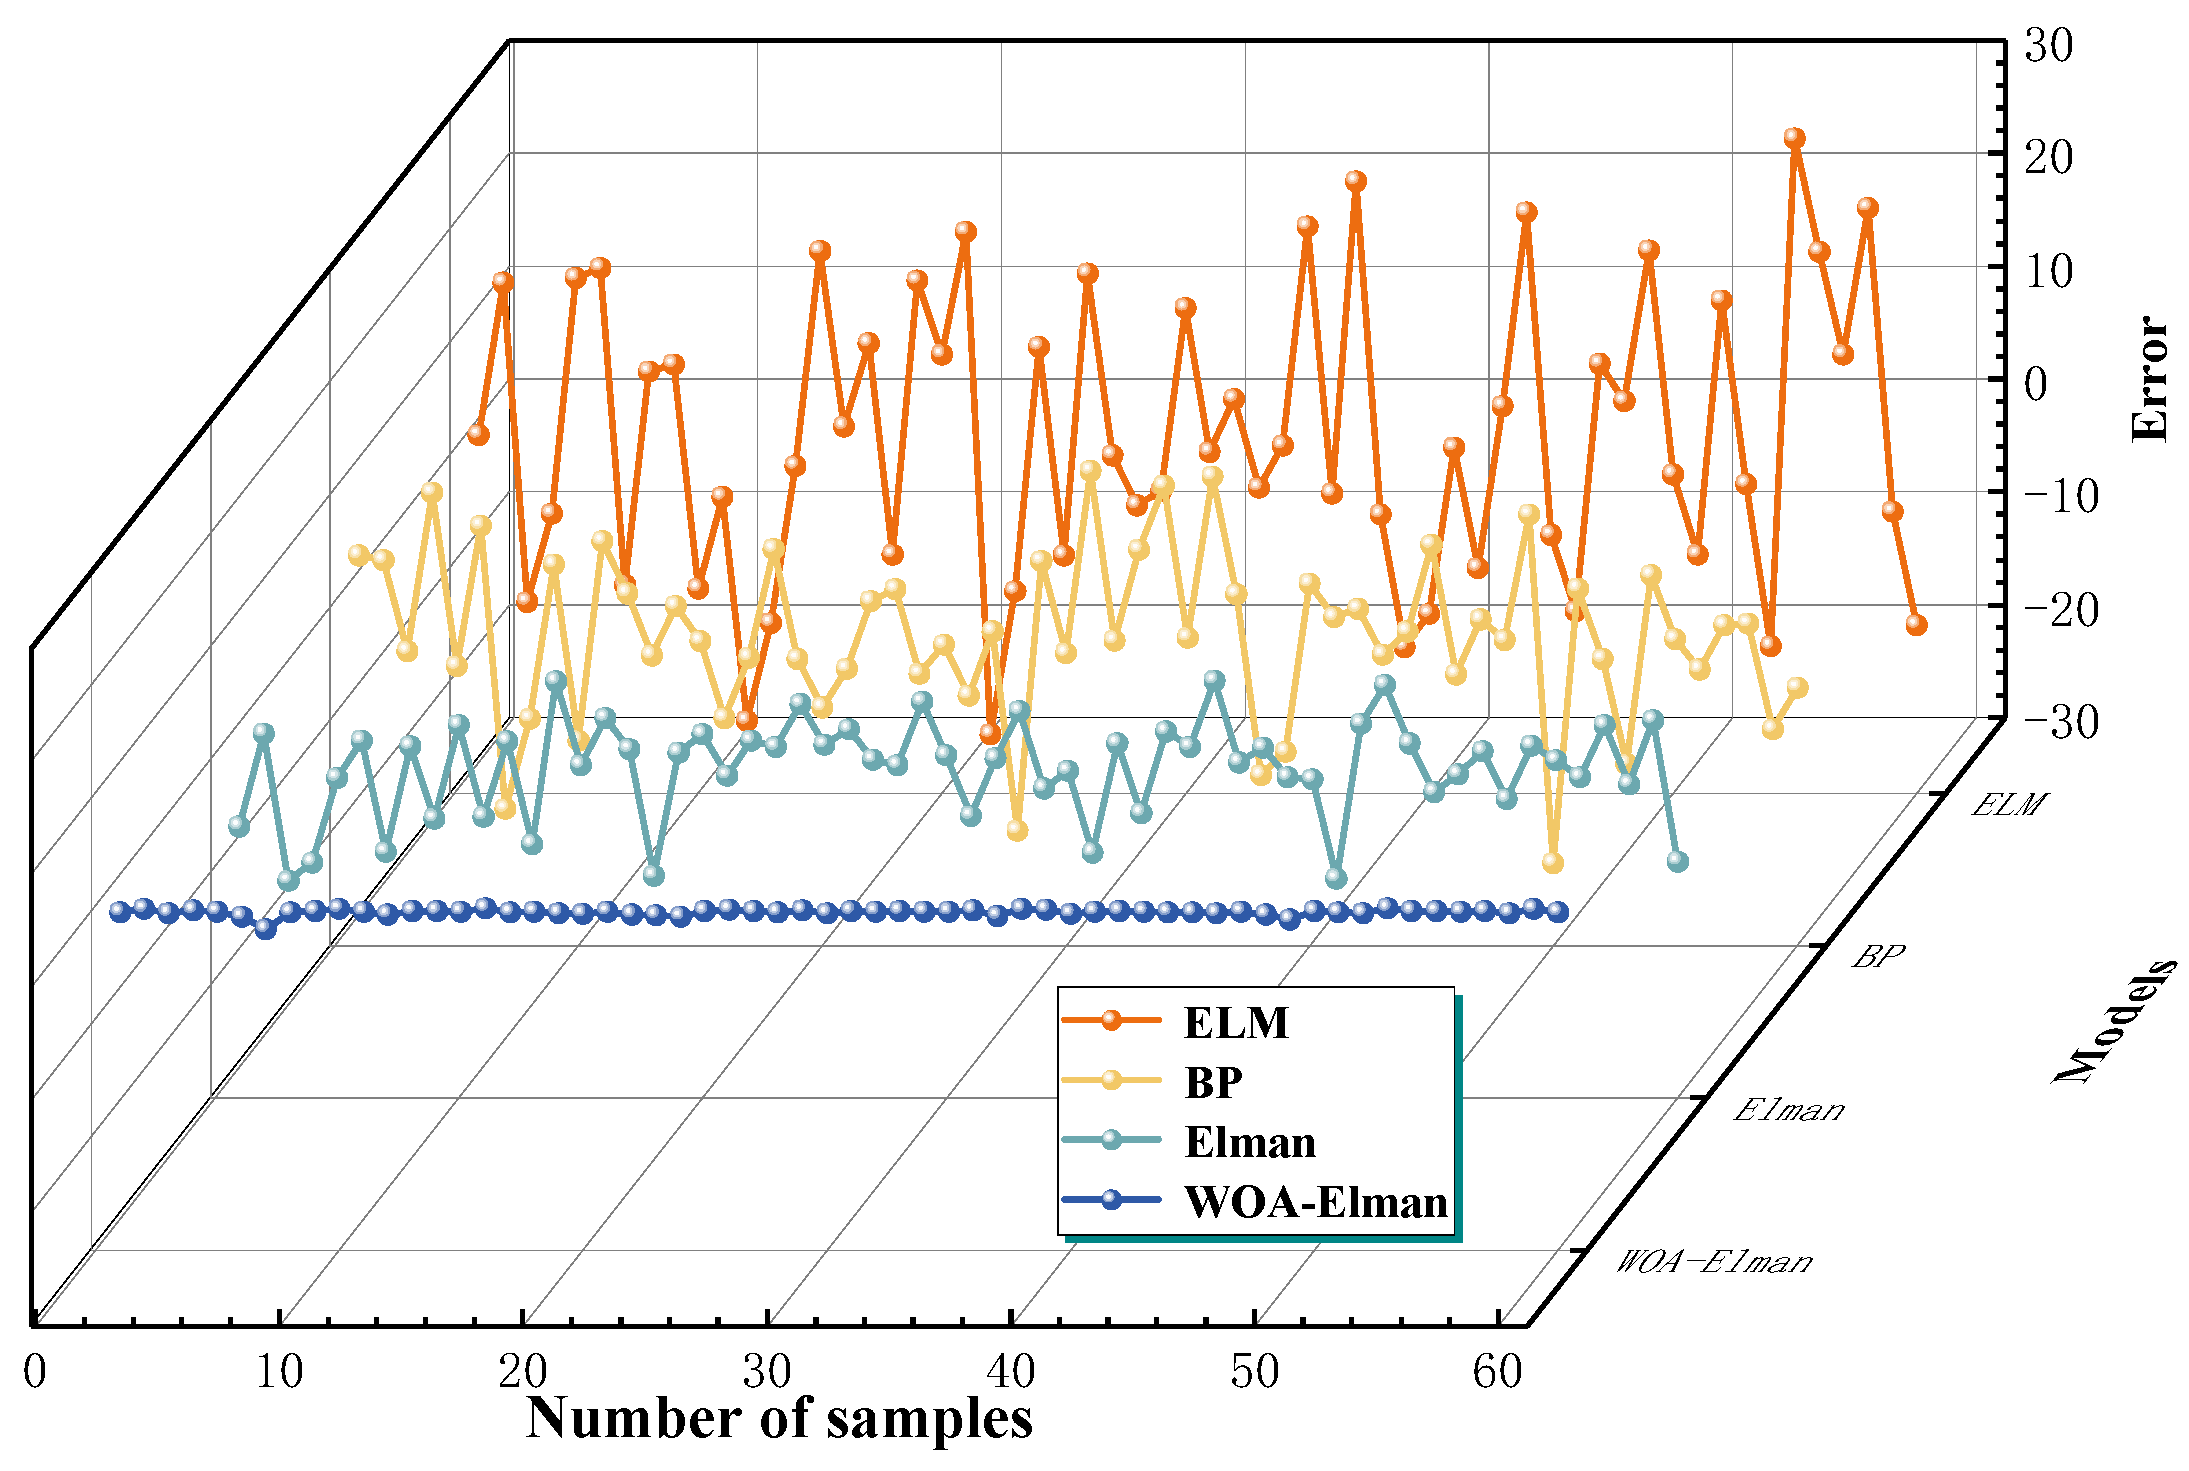
3.2. Model Training and Results Analysis

In this work, the terahertz time-domain signal obtained was wavelet denoised by stacking on uniform white noise. The dimensionality of the original spectral data is too high for substitution into the model for calculation, which will reduce the training accuracy and the calculation result in a large error. Therefore, principal component analysis was used to downscale the data to 11 dimensions. The downscaled data were used to replace the original data into the Elman neural network optimized by the whale algorithm for training. With the terahertz time-domain signal as the input variable and the TBC thickness as the output variable, and with 70% of the data, a total of 140 groups were randomly selected as training samples, and with 30% of the remaining data, a total of 60 groups were used as test samples.
To verify the reliability and validity of machine learning, the mean square error (MSE) was used as the fitness function when the neural network was trained with the training sample set. As shown in Figure 8, the MSE decreased with the increase in the number of WOA iterations, which tended to stabilize when the number of model training iterations reaches 13, indicating an excellent training effect.
The relevant parameters of the whale optimization algorithm and Elman neural network model are shown in Table 3 and Table 4.
Meanwhile, in order to verify the superiority of the combined PCA-WOA-Elman prediction model, its results were compared and analyzed with those of the back propagation (BP) neural network, single extreme learning machine (ELM) model [45], and Elman model. All four methods were simulated with MATLAB 2021a software, and a comparison of the prediction results is shown in Figure 9; single-point error was compared as shown in Figure 10.
It was observed that the prediction effect of the PCA-WOA-Elman model was significantly better than the traditional Elman model, the BP model, and the ELM model, and the prediction accuracy was much higher than others.
It was evident that the PCA-WOA-Elman model had the slightest error and the lowest error variation, and the ELM model had the most significant error variation. As shown in Table 5, the MAEs of the four models were 10.78, 6.04, 3.34, and 0.16, respectively, the RMSEs were 12.92, 7.77, 4.43, and 0.28, and the MAPEs were 6.11%, 3.20%, 1.55%, and 0.09%, respectively, and the advantages and disadvantages of the various forecasting models can be analyzed. Among them, the PCA-WOA-Elman prediction model had a coefficient of determination of 0.999, which indicated excellent prediction results.
According to the results of the prediction error, the PCA-WOA-Elman prediction model worked better than the traditional feedforward neural network. Mainly for the following reasons, Elman neural network was a typical local regression network which could fuse the current state with the results of the previous iteration as the current input [46,47]; it was the feedback principle. Based on the BP network, a takeover layer was added as the connection between the upper and lower layers to achieve the purpose of memory, the model can quickly reach a stable state. After PCA processing, the extracted data features were more obvious and retained the vast majority of data features. The whale algorithm introduced adaptive weight to improve the local search ability of the algorithm, and it worked well in combination with the Elman network [48]. Accordingly, the prediction using the PCA-WOA-Elman model was excellent and can be implemented in the TBC thickness measurement.

4. Conclusions

In this study, the terahertz NDT technique with hybrid machine learning was proposed to measure the ceramic layer thickness of TBCs. A combined prediction method based on the PCA-WOA-Elman neural network was proposed to accurately predict the TBC thickness. The FDTD method was used to simulate 200 terahertz time-domain data, with 200 sets of pre-processed data brought into the model, of which 140 sets were training samples and 60 sets were testing samples. By adding uniform white noise and the Dmey wavelet denoising, the obtained data were more suitable for the actual test. To improve training speed, the 2596-dimensional time-domain signal was downscaled to 11 dimensions by using principal component analysis since the contribution of the cumulative 11 principal components had reached 95%. The processed data were entered into the model with higher calculation accuracy. From the experimental results, it was shown that the prediction error of PCA-WOA-Elman was minimal and the accuracy was significantly higher than ELM, BP, and the traditional Elman model. The determination coefficient R2 reached 0.999, and the prediction results of the model were excellent.
To sum up, the PCA-WOA-Elman model shows excellent performance in the thickness measurement of TBCs, the model is able to measure different thicknesses with high accuracy, and thus has a broad prospect in the field of nondestructive inspection and evaluation of single or multi-layer coating thickness. The research is beneficial in terms of enriching the method system for surface evaluation of TBCs.

Author Contributions

Conceptualization, D.Y. and C.Y.; Data curation, R.L.; Funding acquisition, Z.X., D.Y., H.Z. and J.P.; Investigation, R.L., D.Y. and H.Z.; Methodology, R.L., D.Y., C.Y., H.Z., J.Y. and J.P.; Project administration, D.Y.; Resources, D.Y.; Software, R.L.; Supervision, Z.X.; Validation, Z.X., H.X. and Y.C.; Writing—original draft, R.L.; Writing—review & editing, Z.X., D.Y. and J.P. All authors have read and agreed to the published version of the manuscript.

Funding

This work is sponsored by the National Natural Science Foundation of China (52205547), Key Research and Development Projects in Anhui Province (2022a05020004, 202104a05020002), Anhui Polytechnic University-Jiujiang District Industrial Collaborative Innovation Special Fund Project (2022cyxta1), Science and Technology Plan Project of Wuhu City (2022yf67, 2022jc48), Zhejiang Provincial Natural Science Foundation of China (Q21E050068), Scientific Research Starting Foundation of Anhui Polytechnic University of China (2021YQQ029), Natural Science Research Project of Wuhu Institute of Technology (wzyzr202218, wzyzr202219), National College Student Innovation and Entrepreneurship Training Program Project (202210363020).

Institutional Review Board Statement

Not applicable.

Informed Consent Statement

Not applicable.

Data Availability Statement

Not applicable.

Conflicts of Interest

The authors declare no conflict of interest.

References

  1. Yang, P.; Yue, W.; Li, J.; Bin, G.; Li, C. Review of damage mechanism and protection of aero-engine blades based on impact properties. Eng. Fail. Anal. 2022, 140, 106570. [Google Scholar] [CrossRef]
  2. Cao, B.; Wang, M.; Li, X.; Fan, M.; Tian, G. Noncontact thickness measurement of multilayer coatings on metallic substrate using pulsed terahertz technology. IEEE Sens. J. 2020, 20, 3162–3171. [Google Scholar] [CrossRef]
  3. Fukuchi, T.; Fuse, N.; Okada, T.; Fujii, T.; Mizuno, M.; Fukunaga, K. Topcoat thickness measurement of thermal barrier coating of gas turbine blade using terahertz wave. Electr. Eng. Jpn. 2014, 189, 1–8. [Google Scholar] [CrossRef]
  4. Liu, J.; Lv, Z.; Zhou, Y.; Huang, S.; Chen, H.; Xu, N. Research progress of advanced ceramic materials for thermal barrier coatings. Surf. Technol. 2022, 51, 42–52. [Google Scholar]
  5. Yang, S.; Yan, X.; Guo, H. Failure mechanism and protection strategy of thermal barrier coatings under CMAS attack. Acta Aeronaut. Astronaut. Sin. 2022, 42, 1–17. [Google Scholar]
  6. Cheng, B.; Wang, Y.; Zhang, X.; An, G.; Chu, Q.; Zhang, X.; He, D.; Zhai, H.; Li, W. Sintering governing the cracking behaviors of different La2Zr2O7/YSZ ceramic layer combination TBCs at 1150 °C. Surf. Coat. Technol. 2021, 428, 127910. [Google Scholar] [CrossRef]
  7. Shang, Y.; Aderonke, A.; Tohren, C. A boosted decision tree approach to shadow detection in scanning electron microscope (SEM) images for machine vision applications. Ultramicroscopy 2019, 197, 122–128. [Google Scholar]
  8. Bu, C.; Zhao, B.; Liu, T.; Liu, G.; Liao, C.; Tang, Q. Infrared thermal imaging detection of debonding defects in carbon fiber reinforced polymer based on pulsed thermal wave excitation. Thermal. Sci. 2020, 24, 3887–3892. [Google Scholar] [CrossRef]
  9. Ren, X. Research on main defects and prevention measures of metal material welding based on ultrasonic nondestructive testing technology. J. Phys. Conf. Ser. 2022, 2321, 012023. [Google Scholar] [CrossRef]
  10. Queralt, I.; Ibañez, J.; Marguí, E.; Pujol, J. Thickness measurement of semiconductor thin films by energy dispersive X-ray fluorescence benchtop instrumentation: Application to GaN epilayers grown by molecular beam epitaxy. Spectrochim. Acta. Part B 2010, 65, 583–586. [Google Scholar] [CrossRef]
  11. Li, C.; Zhang, X.; Chen, Y.; Carr, J.; Jacques, S.; Behnsen, J.; Michiel, M.; Xiao, P.; Cernik, R. Understanding the residual stress distribution through the thickness of atmosphere plasma sprayed (APS) thermal barrier coatings (TBCs) by high energy synchrotron XRD; digital image correlation (DIC) and image based modelling. Acta Mater. 2017, 132, 1–12. [Google Scholar] [CrossRef]
  12. Chen, W.; Wu, D.; Wang, X.; Wang, T. A self-frequency-conversion eddy current testing method. Measurement 2022, 195, 111129. [Google Scholar] [CrossRef]
  13. Cao, B.; Zheng, D.; Fan, M.; Sun, F.; Liu, L. Efficient and reliable thickness measurement method for multilayer coatings based on terahertz Time-Domain spectroscopy technology. Acta Opt. Sin. 2022, 42, 127–137. [Google Scholar]
  14. Zhang, D.; Ren, J.; Gu, J.; Li, L.; Zhang, J.; Xiong, W.; Zhong, Y.; Zhou, T. Nondestructive testing of bonding defects in multilayered ceramic matrix composites using THz time-domain spectroscopy and imaging. Compos. Struct. 2020, 251, 112624. [Google Scholar] [CrossRef]
  15. Ye, D.; Wang, W.; Yin, C.; Xu, Z.; Zhou, H.; Fang, H.; Li, Y.; Huang, J. Pulsed terahertz spectroscopy combined with hybrid machine learning approaches for structural health monitoring of multilayer thermal barrier coatings. Opt. Express 2020, 28, 34875–34893. [Google Scholar] [CrossRef]
  16. Ye, D.; Wang, W.; Xu, Z.; Yin, C.; Zhou, H.; Li, Y. Prediction of thermal barrier coatings microstructural features based on support vector machine optimized by cuckoo search algorithm. Coatings 2020, 10, 704. [Google Scholar] [CrossRef]
  17. Xu, Z.; Ye, D.; Chen, J.; Zhou, H. Novel terahertz nondestructive method for measuring the thickness of thin oxide scale using different hybrid machine learning models. Coatings 2020, 10, 805. [Google Scholar] [CrossRef]
  18. Zhang, H.; He, M.; Shi, L.; Wang, P. Terahertz thickness measurement based on stochastic optimization algorithm. Spectrosc. Spect. Anal. 2020, 40, 3066–3070. [Google Scholar]
  19. Zhong, S. Progress in terahertz nondestructive testing: A review. Front. Mech. Eng. 2019, 14, 273–281. [Google Scholar] [CrossRef]
  20. Zhai, M.; Ahmed, M.; Locquet, A.; Schneider, G.; Kalmar, R.; Fendler, M.; Declercq, N.; Citrin, S. Diagnosis of injection-molded weld lines in ABS thermoplastic by polarized terahertz reflective imaging. NDT E Int. 2021, 122, 102497. [Google Scholar] [CrossRef]
  21. Fukuchi, T.; Fuse, N.; Fujii, T.; Okada, M.; Fukunaga, K.; Mizuno, M. Measurement of topcoat thickness of thermal barrier coating for gas turbines using terahertz waves. Electr. Eng. Jpn. 2013, 183, 1–9. [Google Scholar] [CrossRef]
  22. Fukuchi, T.; Fuse, N.; Okada, M.; Fujii, T.; Mizuno, M.; Fukunaga, K. Measurement of refractive index and thickness of topcoat of thermal barrier coating by reflection measurement of terahertz waves. Electron. Commun. Jpn. 2013, 96, 37–45. [Google Scholar] [CrossRef]
  23. Tipler, S.; D’ Alessio, G.; Van Haute, Q.; Parente, A.; Contino, F.; Coussement, A. Predicting octane numbers relying on principal component analysis and artificial neural network. Comput. Chem. Eng. 2022, 161, 107784. [Google Scholar] [CrossRef]
  24. Ocampo-Marulanda, C.; Fernández-álvarez, C.; Cerón Wilmar, L.; Canchala, T.; Carvajal-Escobar, Y.; Alfonso-Morales, W. A spatiotemporal assessment of the high-resolution CHIRPS rainfall dataset in southwestern Colombia using combined principal component analysis. Ain. Shams. Eng. J. 2022, 13, 101739. [Google Scholar] [CrossRef]
  25. Zhou, Z.; Wei, D. Analysis of ultrasonic sound field characteristic with FDTD. J. Mech. Eng. 2010, 46, 9–13. [Google Scholar] [CrossRef]
  26. Li, L.; Zhou, M.; Ren, J. Test of the adhesive thickness uniformity based on terahertz time-Domain spectroscopy. Laser Infrared 2014, 44, 801–804. [Google Scholar]
  27. Krimi, S.; Klier, J.; Jonuscheit, J.; Freymann, G.; Urbansky, R.; Beigang, R. Self-calibrating approach for terahertz thickness measurements of ceramic coatings. In Proceedings of the 2016 41st International Conference on Infrared, Millimeter, and Terahertz waves (IRMMW-THz), Copenhagen, Denmark, 25–30 September 2016; pp. 1–2. [Google Scholar]
  28. Gungo, M. A comparative study on wavelet denoising for high noisy CT images of COVID-19 disease. Optik 2021, 235, 166652. [Google Scholar] [CrossRef]
  29. Liu, L.; Huan, H.; Li, W.; Mandelis, A.; Wang, Y.; Zhang, L.; Zhang, X.; Yin, X.; Wu, Y.; Shao, X. Highly sensitive broadband differential infrared photoacoustic spectroscopy with wavelet denoising algorithm for trace gas detection. J. Photoacoust. 2021, 21, 100228. [Google Scholar] [CrossRef]
  30. Firoozi, P.; Mansour, V.; Amin, G. Lung sound signal denoising using discrete wavelet transform and artificial neural network. Biomed. Signal. Process. Control. 2022, 72, 103329. [Google Scholar]
  31. Claudia, L.; Jillian, J.H.; Anne-Louise, M.H.; Gerald, W.T.; Blair, L.; Sonya, L.C.; Ewa, A.S.; Andrew, R.; Barry, J.T.; Barbara, C.G.; et al. Compositional principal component analysis generates gut microbiota profiles that associate with children’s diet and body composition. Proc. Nutr. Soc. 2020, 79, E284. [Google Scholar]
  32. Geng, Z.; Duan, X.; Han, Y.; Liu, F.; Xu, W. Novel variation mode decomposition integrated adaptive sparse principal component analysis and it application in fault diagnosis. ISA Trans. 2021, 128, 21–31. [Google Scholar] [CrossRef] [PubMed]
  33. Luo, Y.; Cheng, Q.; Yan, S.; Yang, D. Situation awareness method of the distribution network based on EMD-SVD and Elman neural network. Energy Rep. 2022, 8, 632–639. [Google Scholar] [CrossRef]
  34. An, Y.; Sun, X.; Ren, B.; Li, H.; Zhang, M. A data-driven method for IGBT open-circuit fault diagnosis for the modular multilevel converter based on a modified Elman neural network. Energy Rep. 2022, 8, 80–88. [Google Scholar] [CrossRef]
  35. Masoud, F.; Michael, S.; Pankaj, J.; Christopher, H.; Erik, M.; Hamilton, L. Fully Elman neural network: A novel deep recurrent neural network optimized by an improved Harris Hawks algorithm for classification of pulmonary arterial wedge pressure. IEEE. Trans. Biomed. Eng. 2021, 69, 1733–1744. [Google Scholar]
  36. Ji, G. Prediction of Zhaoqing API based on factor analysis and WOA-Elman neural network. Math. Pract. Theory 2021, 51, 265–276. [Google Scholar]
  37. Mirjalili, S.; Lewis, A. The whale optimization algorithm. Adv. Eng. Softw. 2016, 95, 51–67. [Google Scholar] [CrossRef]
  38. Song, Z.; Zhao, Y.; Liu, G.; Cao, C.; Liu, Q.; Zhang, X.; Dai, D.; Zheng, Z. Surface roughness prediction and process parameter optimization of magnetic abrasive finishing based on WOA-LSSVM. Surf. Technol. 2022, 1–14. [Google Scholar]
  39. Andrzej, B.; Michal, P.; Joanna, J. The whale optimization algorithm approach for deep neural networks. Sensors 2021, 21, 8003. [Google Scholar]
  40. Chen, Z.; Li, C. Prediction of blasting flyrock distance based on KPCA-WOA-ELM. Exp. Mater. 2022, 51, 47–51. [Google Scholar]
  41. Zhang, C.; Ji, C.; Hua, L.; Ma, M.; Peng, T. Evolutionary quantile regression gated recurrent unit network based on variational mode decomposition, improved whale optimization algorithm for probabilistic short-term wind speed prediction. Renew. Energy 2022, 197, 668–682. [Google Scholar] [CrossRef]
  42. Zhu, C.; Kang, L.; Feng, W. Stock closing price prediction algorithm using adaptive whale optimization algorithm and Elman neural network. J. Comput. Appl. 2020, 40, 1501–1509. [Google Scholar]
  43. Kong, D.; Chen, H.; Chen, X.; Dong, R.; Wang, S. Research on oil identification method based on three-dimensional fluorescence spectroscopy combined with sparse principal component analysis and support vector machine. Spectrosc. Spect. Anal. 2021, 41, 3474–3479. [Google Scholar]
  44. Gao, S.; Zhao, H.; Bai, Z.; Han, B.; Zhao, R.; Zhang, N.; Li, C.; Lei, X.; Shi, W.; Zhan, L.; et al. Combined use of principal component analysis and artificial neural network approach to improve estimates of PM 2.5 personal exposure: A case study on older adults. Sci. Total Environ. 2020, 726, 138533. [Google Scholar] [CrossRef] [PubMed]
  45. Yuan, B.; Wang, W.; Ye, D.; Zhang, Z.; Fang, H.; Yang, T.; Wang, Y.; Zhong, S. Nondestructive evaluation of thermal barrier coatings thickness using terahertz technique combined with PCA-GA-ELM algorithm. Coatings 2022, 12, 390. [Google Scholar] [CrossRef]
  46. Zhang, Y.; Wang, X.; Tang, H. An improved Elman neural network with piecewise weighted gradient for time series prediction. Neurocomputing 2019, 359, 199–208. [Google Scholar] [CrossRef]
  47. Lin, P.; Peng, Z.; Lai, Y.; Cheng, S.; Chen, Z.; Wu, L. Short-term power prediction for photovoltaic power plants using a hybrid improved Kmeans-GRA-Elman model based on multivariate meteorological factors and historical power datasets. Energy Convers. Manag. 2018, 177, 704–717. [Google Scholar] [CrossRef]
  48. Krishnan, S.; Lokesh, S.; Devi, M. An efficient Elman neural network classifier with cloud supported internet of things structure for health monitoring system. Comput. Netw. 2019, 151, 201–210. [Google Scholar] [CrossRef]
Figure 1. Model for the propagation of terahertz signals in TBCs [3,27].
Coatings 12 01875 g001
Figure 2. Terahertz time-domain signal diagram.
Coatings 12 01875 g002
Figure 3. Noise added to the original signal (a) original signal; (b) uniform white noise signal; (c) noise added to the signal.
Coatings 12 01875 g003
Figure 4. The Dmey wavelet denoising diagram.
Coatings 12 01875 g004
Figure 5. Flow-process diagram of Elman neural network.
Coatings 12 01875 g005
Figure 6. PCA-WOA-Elman model algorithm flow.
Coatings 12 01875 g006
Figure 7. Cumulative contribution rate and eigenvalue of each principal component.
Coatings 12 01875 g007
Figure 8. Adaptation curve of WOA.
Coatings 12 01875 g008
Figure 9. Comparison of prediction results of four models.
Coatings 12 01875 g009
Figure 10. Comparison of errors predicted by the four models.
Coatings 12 01875 g010
Table 1. FDTD simulation parameter settings.
ParameterSetting Conditions
Simulation thickness101–300 μm
Step length1 μm
THz frequency0.3–1 THz
THz wavelength300–1000 μm
YSZ refractive index4.7
Mesh accuracy2
Simulation time100 ps
Boundary conditions (X,Y)Periodic
Boundary conditions (Z)PML
Table 2. Extraction of feature variables.
Principal ComponentEigenvalueContribution Rate/%Cumulative Contribution Rate/%
1931.2730.5130.51
2894.6029.3159.83
3404.0613.2473.07
4214.047.0180.08
5101.683.3383.41
694.433.0986.51
779.762.6189.12
865.062.1391.25
961.682.0293.28
1049.161.6194.89
1139.411.2996.18
Table 3. Parameter settings of the WOA model.
AlgorithmParameterParameter Value
WOAPopulation size40
Maximum number of iterations60
Independent variable range[−3, 3]
Constant1
Table 4. Parameter settings of Elman network.
Neural NetworkParameterParameter Value
ElmanHidden layer functiontansig
Output layer functionpurelin
Training times1000
Learning rate0.01
Training target error0.0001
Momentum factor0.01
Table 5. Prediction results of different models.
Prediction ModelMAERMSEMAPE/%R2
ELM10.7812.926.110.850
BP6.047.773.200.882
Elman3.344.431.550.892
PCA-WOA-Elman0.160.280.090.999
Publisher’s Note: MDPI stays neutral with regard to jurisdictional claims in published maps and institutional affiliations.

