Article

The Effect of the Dilution Level on Microstructure and Wear Resistance of Fe-Cr-CV Hardfacing Coatings Deposited by PTA-P

by
Thais Andrezza Passos
1,2,*,
Henara Costa
2,
Felipe Kevin Correa Luz
2 and
Giuseppe Pintaude
1
1
Post-Graduate Course on Mechanical and Materials Engineering, Universidade Tecnológica Federal do Paraná, Curitiba 81280-340, Brazil
2
School of Engineering, Campus Carreiros, Universidade Federal do Rio Grande, Rio Grande 96203-900, Brazil
*
Author to whom correspondence should be addressed.
Coatings 2022, 12(12), 1835; https://doi.org/10.3390/coatings12121835
Submission received: 21 October 2022 / Revised: 21 November 2022 / Accepted: 24 November 2022 / Published: 27 November 2022
(This article belongs to the Special Issue Tribological and Mechanical Properties of Coatings)

Abstract

:
Soil preparation tools are subject to severe abrasion. The wear resistance of various industrial components can be improved using the hardfacing technique. The improvement in hardfacing wear resistance depends on the microstructure, i.e., the chemical composition of the alloys, the method of overlay, and the parameters of the selected process. The Plasma Transferred Arc with Powder (PTA-P) welding process is interesting as a hardfacing technique since it promotes very low dilution of the substrate in the coating. In this article, the PTA-P welding process was used for the deposition of Fe-Cr-C-based hard coatings with the addition of vanadium onto cheap and relatively soft low-carbon steel substrates. Rubber-wheel abrasion tests were performed to compare the abrasion resistance between commercial anti-wear steel and weld-deposited Fe-Cr-C-V hard coatings. In addition, the microstructure, dilution, and wear mechanisms were investigated. The dilution of the coatings affected the microstructure, in particular, the free mean path of the vanadium carbides, but it only affected abrasion resistance when the wear mechanism involved rolling abrasion. The deposited coatings proved to be at least three times stronger than a commercial abrasion-resistant steel due to the distribution and morphology of the vanadium carbides formed in the coatings.

1. Introduction

Wear is a process of progressive material loss from the surface of components due to relative movement between the surfaces [1]. Globally, it dramatically impacts energy consumption, increases costs, and generates CO2 emissions. It is a perennial problem in several sectors, such as automobiles, agriculture, and mining. Mining, for example, accounts for almost 3% of the world’s CO2 emissions from wear and tear, contributing to just over 111 million euros annually for replacement, manufacturing spare parts, and maintenance [2]. The wear caused by soil particles is predominantly abrasive, which results in direct costs, such as higher fuel consumption, lower work rates, and poor quality of soil preparation, contributing to increased energy consumption and greenhouse gas emissions [3]. Abrasive wear is likely to be most severe in the excavation, earthmoving, mining, and mineral processing industries. In these areas, component deterioration occurs in various equipment such as excavator blades, excavator teeth, rock drills, etc. [4]. Due to their mechanical properties, these tools are typically made from low-alloy, medium-, or high-carbon steels. However, these tools often do not have sufficient wear resistance properties [5]. Wear and corrosion of soil tillage tools require thick protective layers to withstand harsh conditions of use. Surface coating is an alternative to increase wear resistance and, in this way, increase the useful life of the components, consequently contributing to the reduction in maintenance and costs.
Hardfacing is the deposition of a hard metallic alloy, through a welding process, onto the surface of a ductile material, often substantially cheaper, to prolong the life of use and restore and/or to protect the surface from wear or corrosion. Such coatings have a strong metallurgical bond to the substrate and do not cause significant loss of ductility or toughness [6,7]. It is one of the most common and cost-effective ways to improve the component surface property, durability, and performance [8,9].
The welding processes commonly used for hardfacing applications are Flux-Cored Arc Welding (FCAW), Shielded Metal Arc Welding (SMAW), Gas Metal Arc Welding (GMAW), Submerged Arc Welding (SAW) [10], and Plasma Transferred Arc (PTA). Each process differs in cost, efficiency, and substrate dilution.
The PTA process has the lowest dilution percentage (3% to 6%) and can be considered the best welding process for hardfacings on any type of carbon steel [11]. Due to its high concentration of energy, it produces coatings with a refined microstructure [12,13], which can contribute to improving wear resistance [14]. Keränen [15] reports that although PTA produces coatings with low dilution, the effect of dilution on abrasive wear resistance is unclear. The study showed that deposits with dilutions below 10%, when subjected to abrasive wear by a rubber-wheel, lost the same volume of material as coatings with dilution above 15%. This lack of effect is probably because dilution occurs very close to the fusion line between the materials, not interfering, in this case, with the surface of the coatings. Other advantages of the process are a deposition efficiency of more than 85% [16,17] and the diversity of metal alloys that can be used.
Abrasion-resistant metal alloys often contain carbide-forming alloying elements, which improve performance, resulting in alloys with greater hardness and strength [18]. Metal alloys in powder form, based on iron, chromium, and carbon (Fe-Cr-C), deposited by PTA onto stainless steel substrates, have been studied to improve wear resistance [19] or to investigate microstructural characteristics of the coatings [20]. The use of low carbon steel as a substrate for coatings made by PTA is around 37%, while almost 60% of the research on this welding process is carried out with stainless steel substrates [21]. It is believed that most studies are carried out using stainless steel substrates due to its low dilution in the coatings. However, in tools for soil preparation, the substrate is often low-carbon steel, since it is a low-cost and relatively ductile material.
Fe-Cr-C alloys are widely used as they form dispersed carbides in the matrix, contributing to increased abrasion resistance. This increase is due to the type and size of the secondary hard phase formed, which prevents effective cutting action by the abrasive particles [10,22]. The addition of vanadium (V) in iron-based coatings can reduce the size of primary carbides and improve abrasion resistance [23]. Vanadium carbides (VC) have high hardness and thermal stability and can be used to reinforce layers of thick coatings [24].
Researchers have reported that the process temperature significantly impacts the VC size and formation when using laser cladding to perform vanadium-added Fe-Cr-C coatings (V = 15%) [25]. Using the modified GMAW [26] welding process with a hot wire (Fe-CrC-12%V alloy) inserted into the weld pool, it was possible to control the energy input and the amount of deposited material. This technique provided a reduction in substrate dilution and an increase in the number of carbides and grain refinement.
Fe-Cr-C alloys are widely discussed in the literature; however, alloys of this type with a large amount of vanadium (greater than 5%wt.) still need to be investigated further. Tools with a high content of vanadium can replace the high chromium cast iron used in the mining industry, for example, as the high concentration of vanadium increases wear resistance by up to five times [27].
Some techniques performed in welding processes are common, among them the use of preheating of the substrate [15]. The main reason for preheating is to avoid cracking the coating due to the difference in the thermal expansion coefficients between the substrate and the coating [28]. The preheating temperature has a strong effect on substrate dilution. However, in PTA, the dilution depends heavily on other welding parameters, such as welding current, plasma gas flow rate, material deposition rate, bead dimensions, and torch weaving. Thirty-seven variables that affect the PTA welding process have been identified, but finding the best combination of these parameters is highly complex and not trivial [29], and are outside the scope of the this paper.
Performing post-welding heat treatments is another widely publicized technique. This technique can be used to reduce the brittleness of the coating, to reduce the retained austenite [30], or to relieve residual stresses [31]. Retained austenite and martensite formation in iron-based coatings effect abrasive wear resistance. Combining a martensitic matrix with a large fraction of coarse morphology carbides can improve abrasion resistance [32].
Although the techniques mentioned above are widely used in several studies, using these techniques in soil preparation components can become complex and expensive depending on the dimensions and shapes of the components. It has been reported that not performing heat treatment after the welding process results in a martensitic structure, with a small amount of residual austenite with high values of vanadium and carbon, favoring wear resistance [33].
In this context, there seems to be a field for studies of Fe-Cr-C coatings with high V content deposited by PTA onto low-carbon steel, without preheating or heat treatments after welding, to evaluate the effect of dilution on the abrasive wear of these coatings. Therefore, this work aims to contribute to the literature by investigating the characterization of V-reinforced Fe-Cr-C coatings (>5%wt.) processed by PTA with potential use in soil tillage tools. Deposition conditions are correlated with cooling rates, microstructure, and wear performance.

2. Materials and Methods

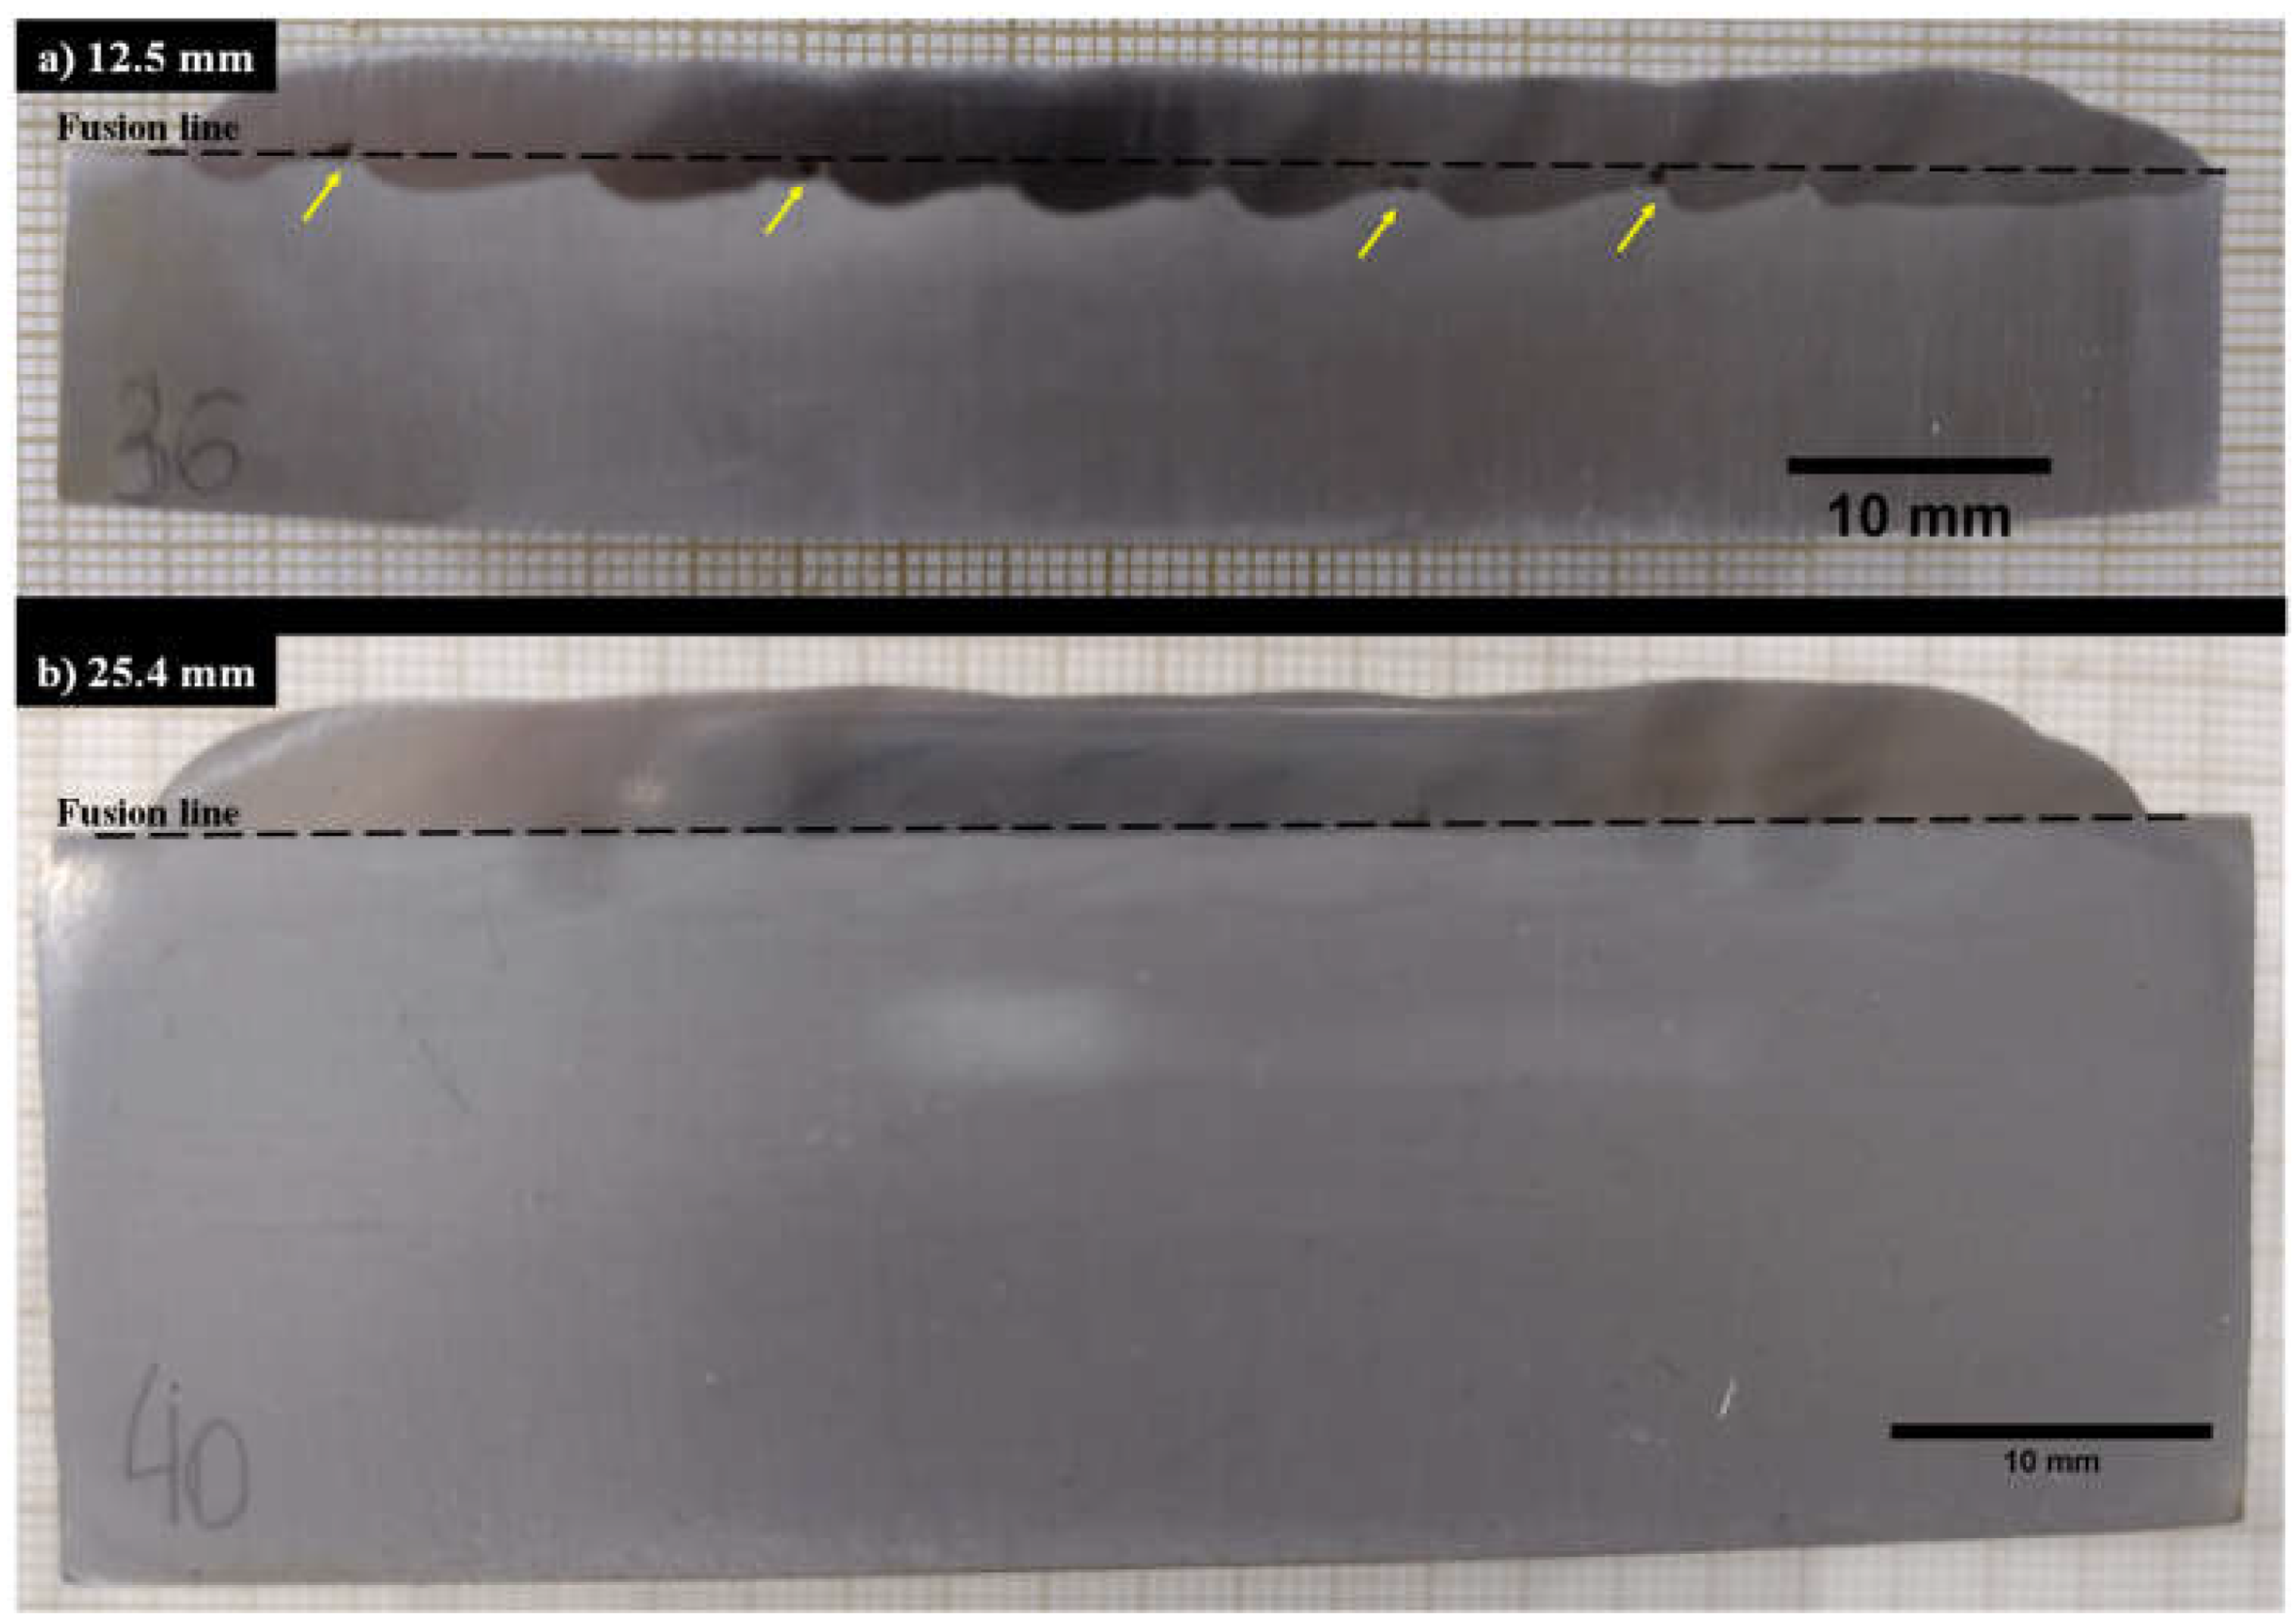
Low-carbon steel plates with dimensions of 200 mm × 150 mm with two thicknesses (12.5 mm and 25.4 mm) were used as substrates. The substrate was chosen because it is a mild steel commonly used as structural steel in the construction of agricultural equipment and machine parts and because it is a low-cost, relatively ductile steel, with low wear resistance [
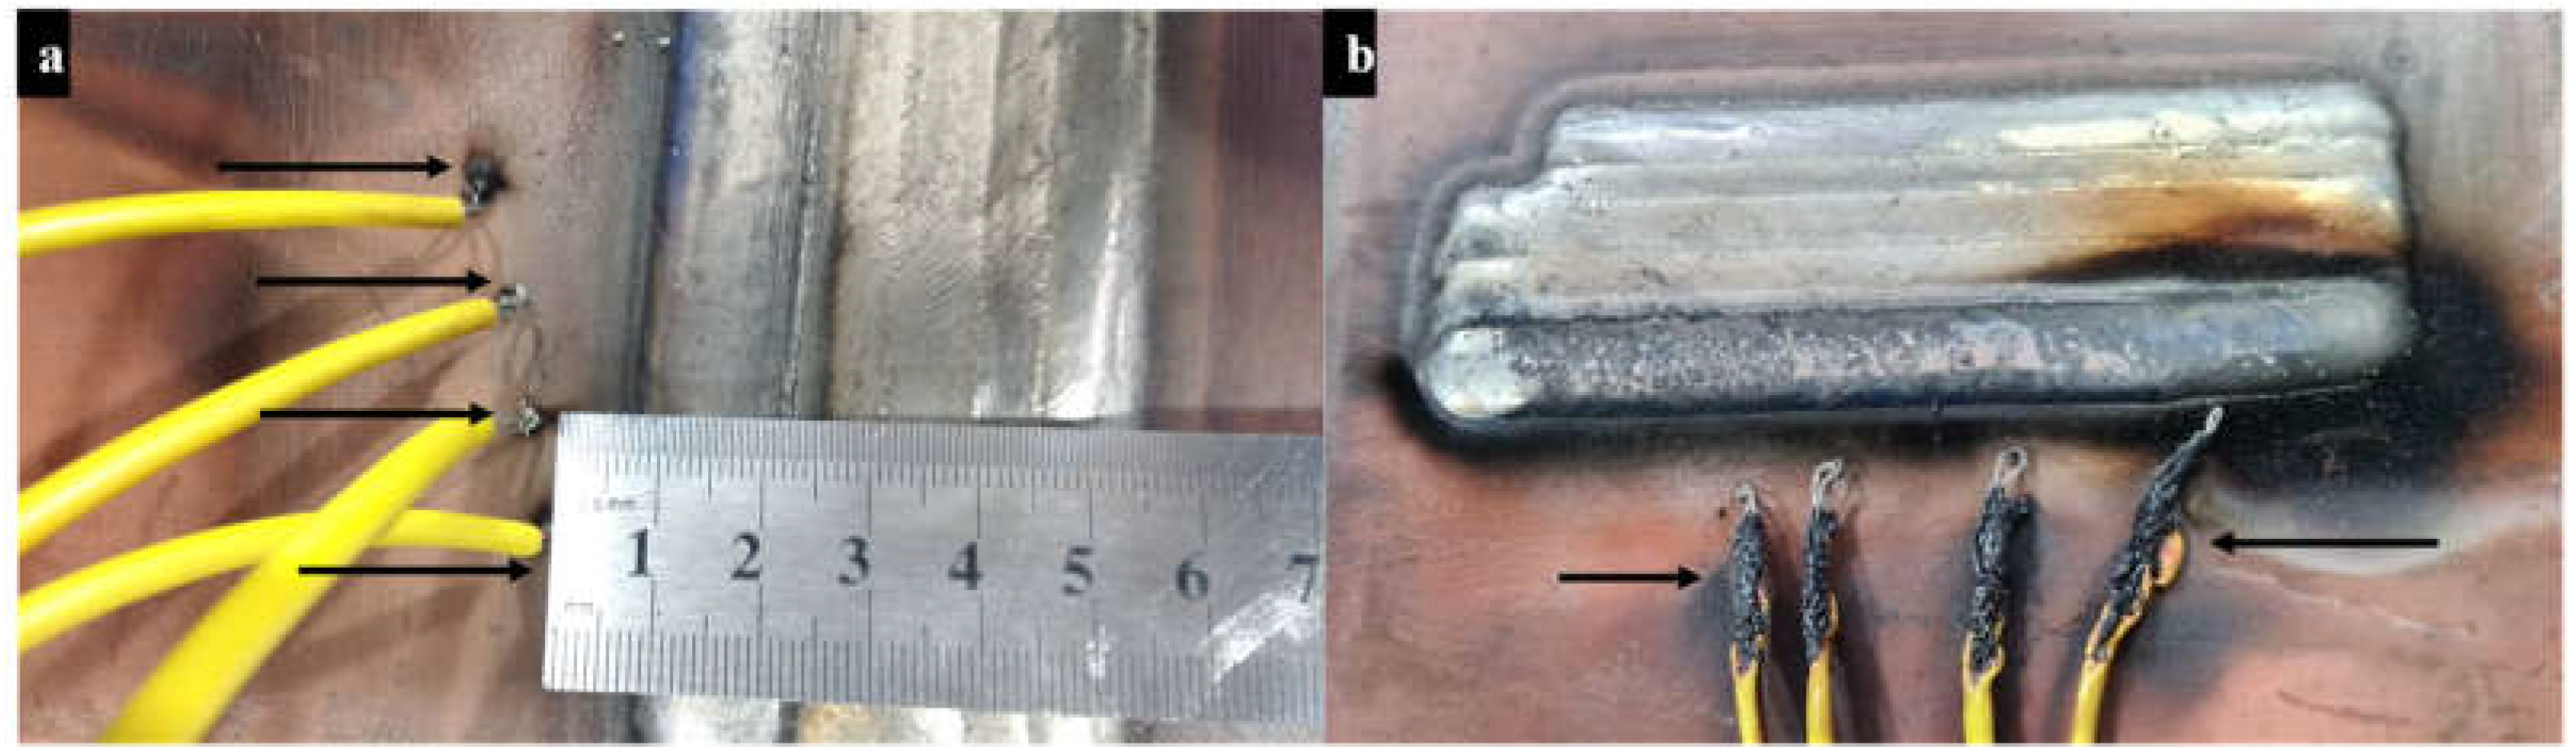
8]. Two substrate thicknesses were used, inferring that the dilution differ for each thickness. During the welding of the coatings, the heating and cooling temperatures were measured by thermocouples inserted close to each bead. The cooling rate was calculated between 800 °C and 500 °C (CR800-500), as this temperature range is significant for the relevant phase transformation that occur in ferrous alloys [34]. The welding current used for both coatings was the same, which provided the same heat input (calculated from welding parameters) during welding. The cooling rate was calculated and simplified by Equation (1) [35].
C R 800 - 500 = Δ T 800 - 500 Δ t 800 - 500
where ΔT800-500 was the temperature variation within the selected range of 800 and 500 °C. The cooling time between two given temperatures, commonly between 800 and 500 °C (Δt800-500), for sheets with three-dimensional heat flow, can be calculated by the following equation [36].
Δ t 800 - 500 = E 2 π k [ 1 500 T o 1 800 T o ]
where E is welding energy (kJ·cm−1), k is material thermal conductivity (W·cm−1·°C−1), and To is the initial temperature of the plate (°C). Welding energy is the energy generated by the heat source per unit length. It can be expressed by the following equation [37].
E = U · I v
where U is the arc voltage (V), I is the measured current (A), and v is the welding speed (mm·s−1).
An atomized commercial Fe-Cr-C-V powder alloy (A11) with a grain size ranging from 53 to 150 μm was deposited onto the substrate. The chemical composition of the commercial powder used to produce the hardfacings in this work is presented in Table 1. For comparison purposes, a commercial anti-wear steel commonly used in manufacturing tillage tools (USI AR 450) was used as a reference for the wear tests. Its chemical composition is also shown in Table 1.
The torch used in the welding process was coupled to a robotic arm with six degrees of freedom, model Motoman HP20D, which allows for the adjustment of the welding speed (v) weaving (amplitude and frequency), and distance between nozzle and workpiece (Nd). Once these parameters are set, they remain constant along the weld path. Table 2 provides the combinations of the variable parameters used in this investigation; their choice was based on the literature [38,39]. The parametrization of the welding process for coating deposition is outside the scope of this manuscript. A signal acquisition system with a rate of 5 kHz was used to acquire the welding current signals, and in this way, it was it was possible to obtain the measured welding current.
The coatings were carried out in a single layer. Beads of approximately 150 mm were overlapped by approximately 50%; that is, the center of the bead to be deposited coincided with the edge of the previous bead, controlled via an x-y stage. From the execution of the first bead, its width was measured, and the coordinate table was adjusted to half its width until the area was fully covered by the coating (Figure 1). The temperature between the beads was controlled (lower than 40 °C) to avoid any influence of the temperature of the previous bead on the cooling rate. Samples for characterization were taken, as shown in Figure 1 by the dashed yellow lines.
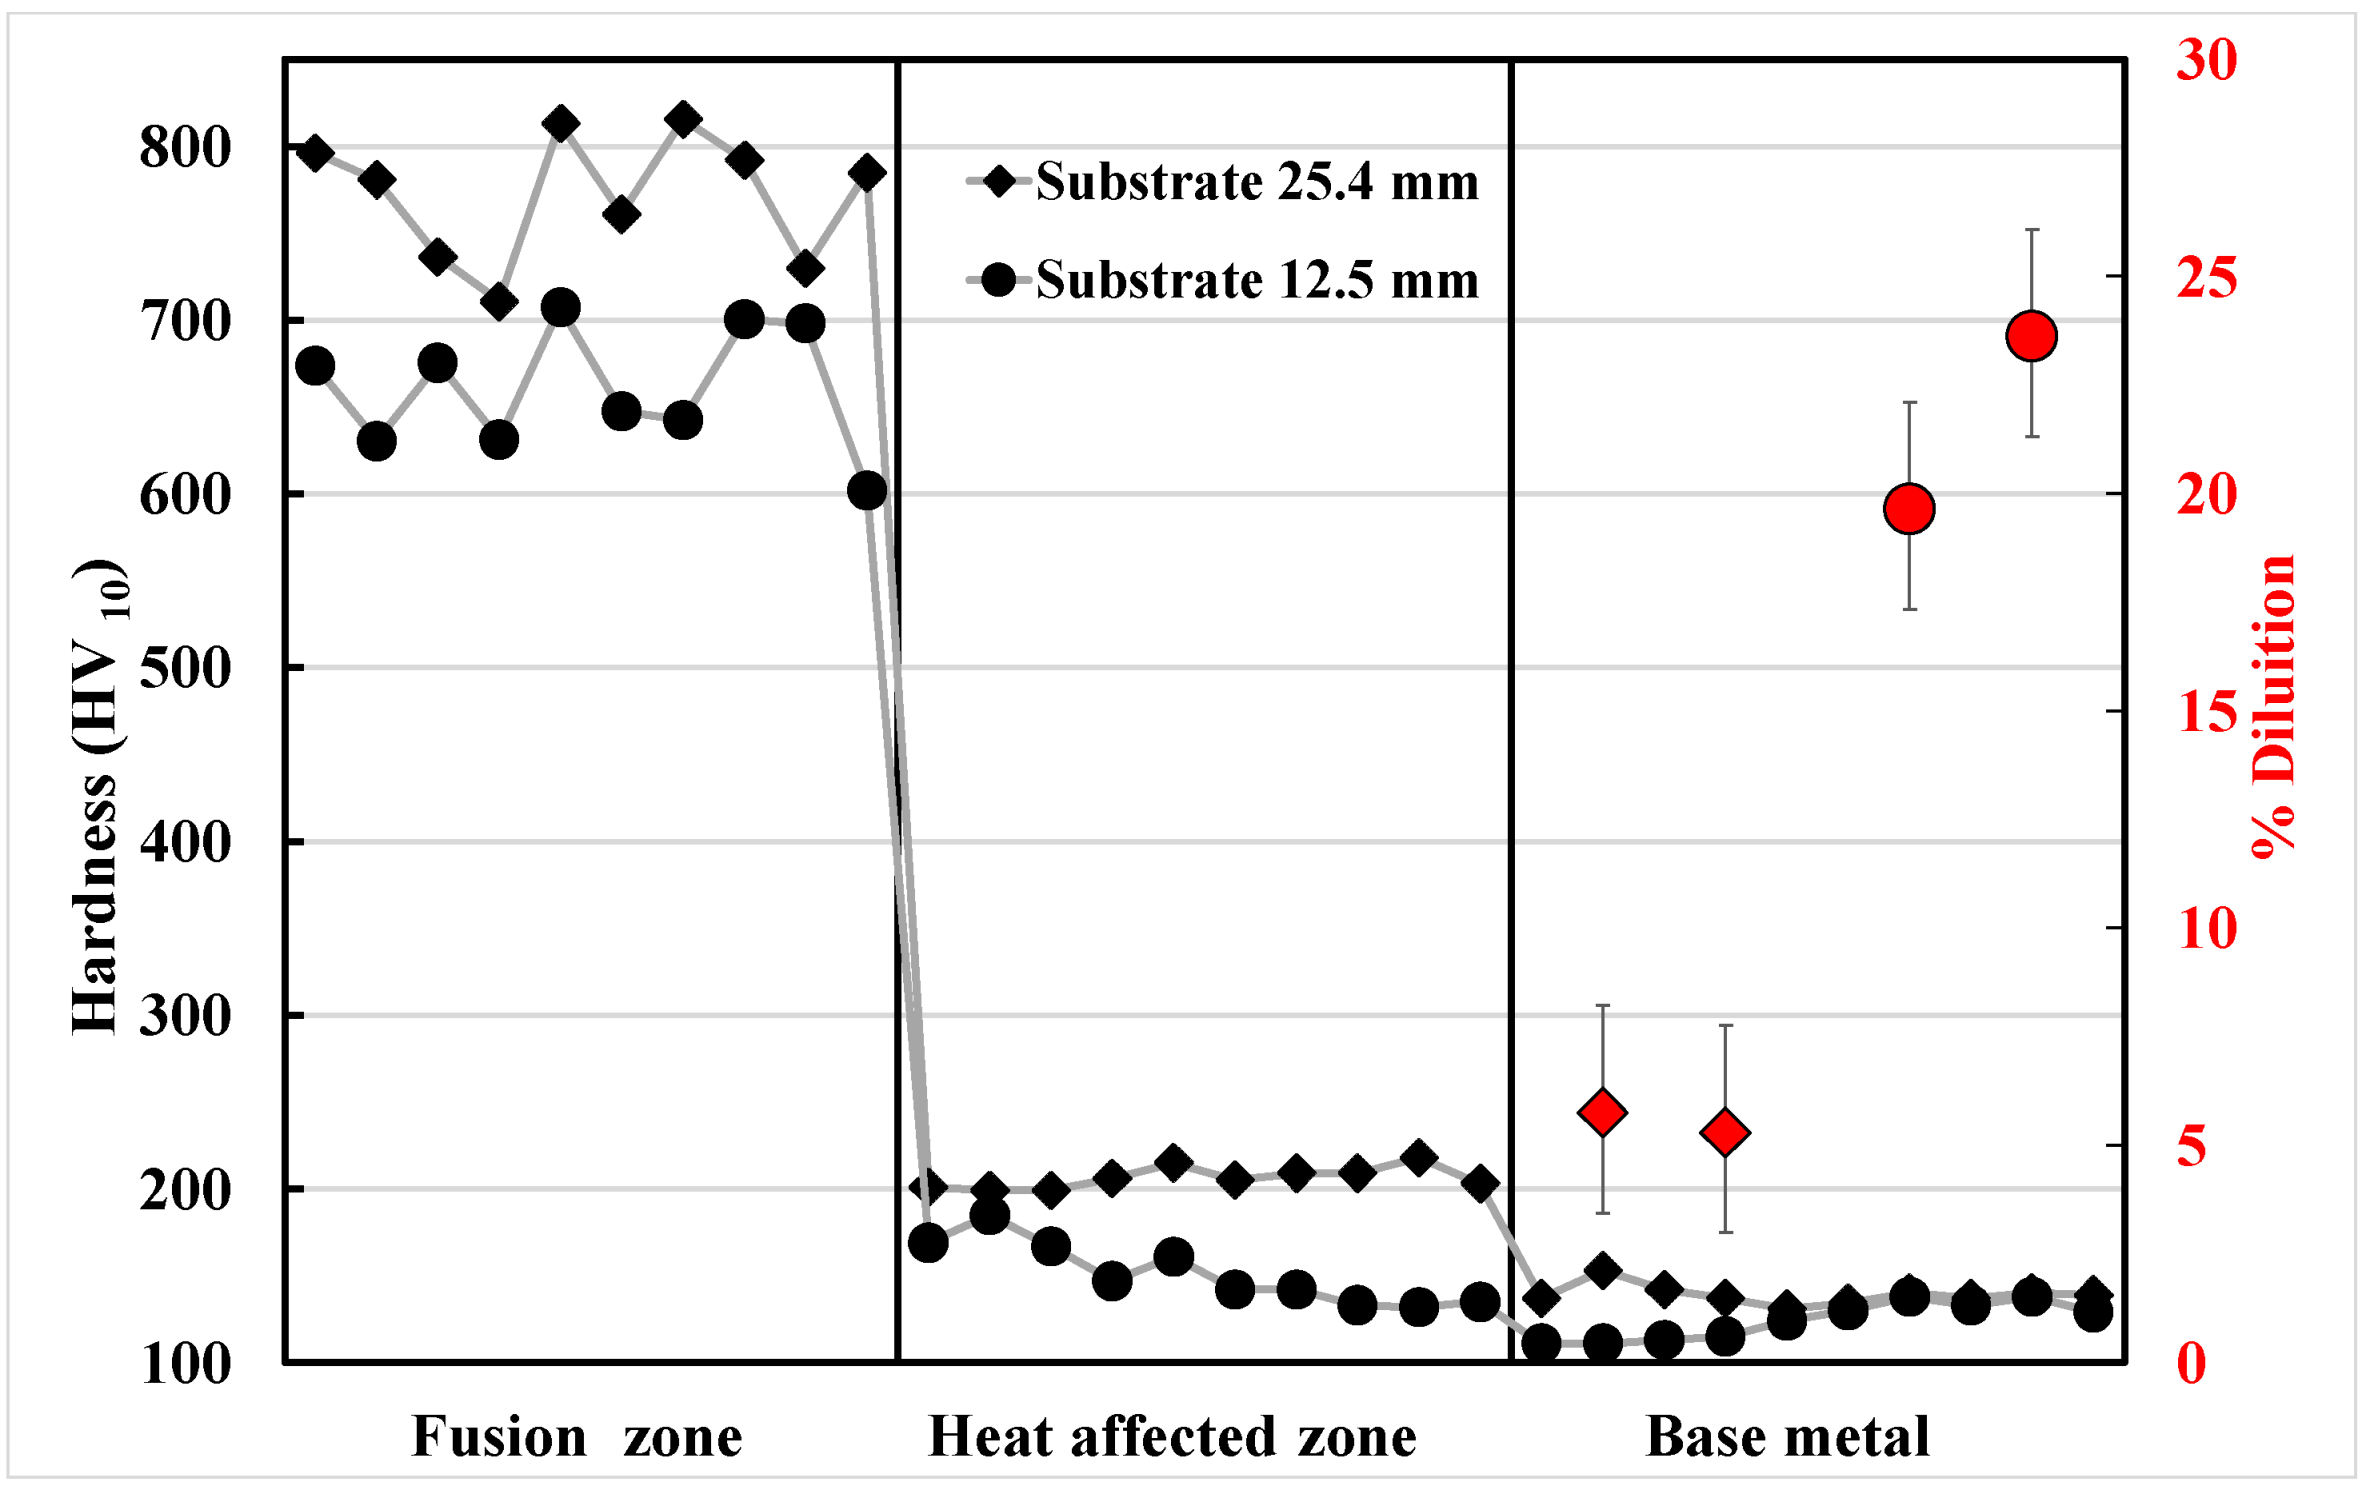
The dilution level (D) was evaluated by the area ratio between the area of the substrate (As) and the area of the hardfacing (Ah) measured in the cross section according to Equation (4).
D = A s A h + A s   · 100   ( % )
The samples were prepared by grinding with SiC water abrasive paper (80, 180, 300, and 1200 grit) and then polished with 2 μm diamond paste. The etching solution for the microstructural investigation contained 5 g of FeCl3, 10 mL of HNO3, 3 mL of HCl, and 87 mL of ethanol.
The microstructures were analyzed by scanning electron microscopy (SEM). The images of the microstructures were treated using the Fiji software with the aid of methodologies already reported in the literature [40,41] to calculate the carbide volumetric fraction (Vf) and the mean free path between carbides (λ). Vf was calculated as the relationship between the total area of the carbides (Ac) and the total area of the image (At). Equation (5) was used to calculate the mean free path between carbides [42].
λ = 1 V f ( N c / L c ) )
where Nc is the number of carbides that intersect a straight line with a length defined (Ls).
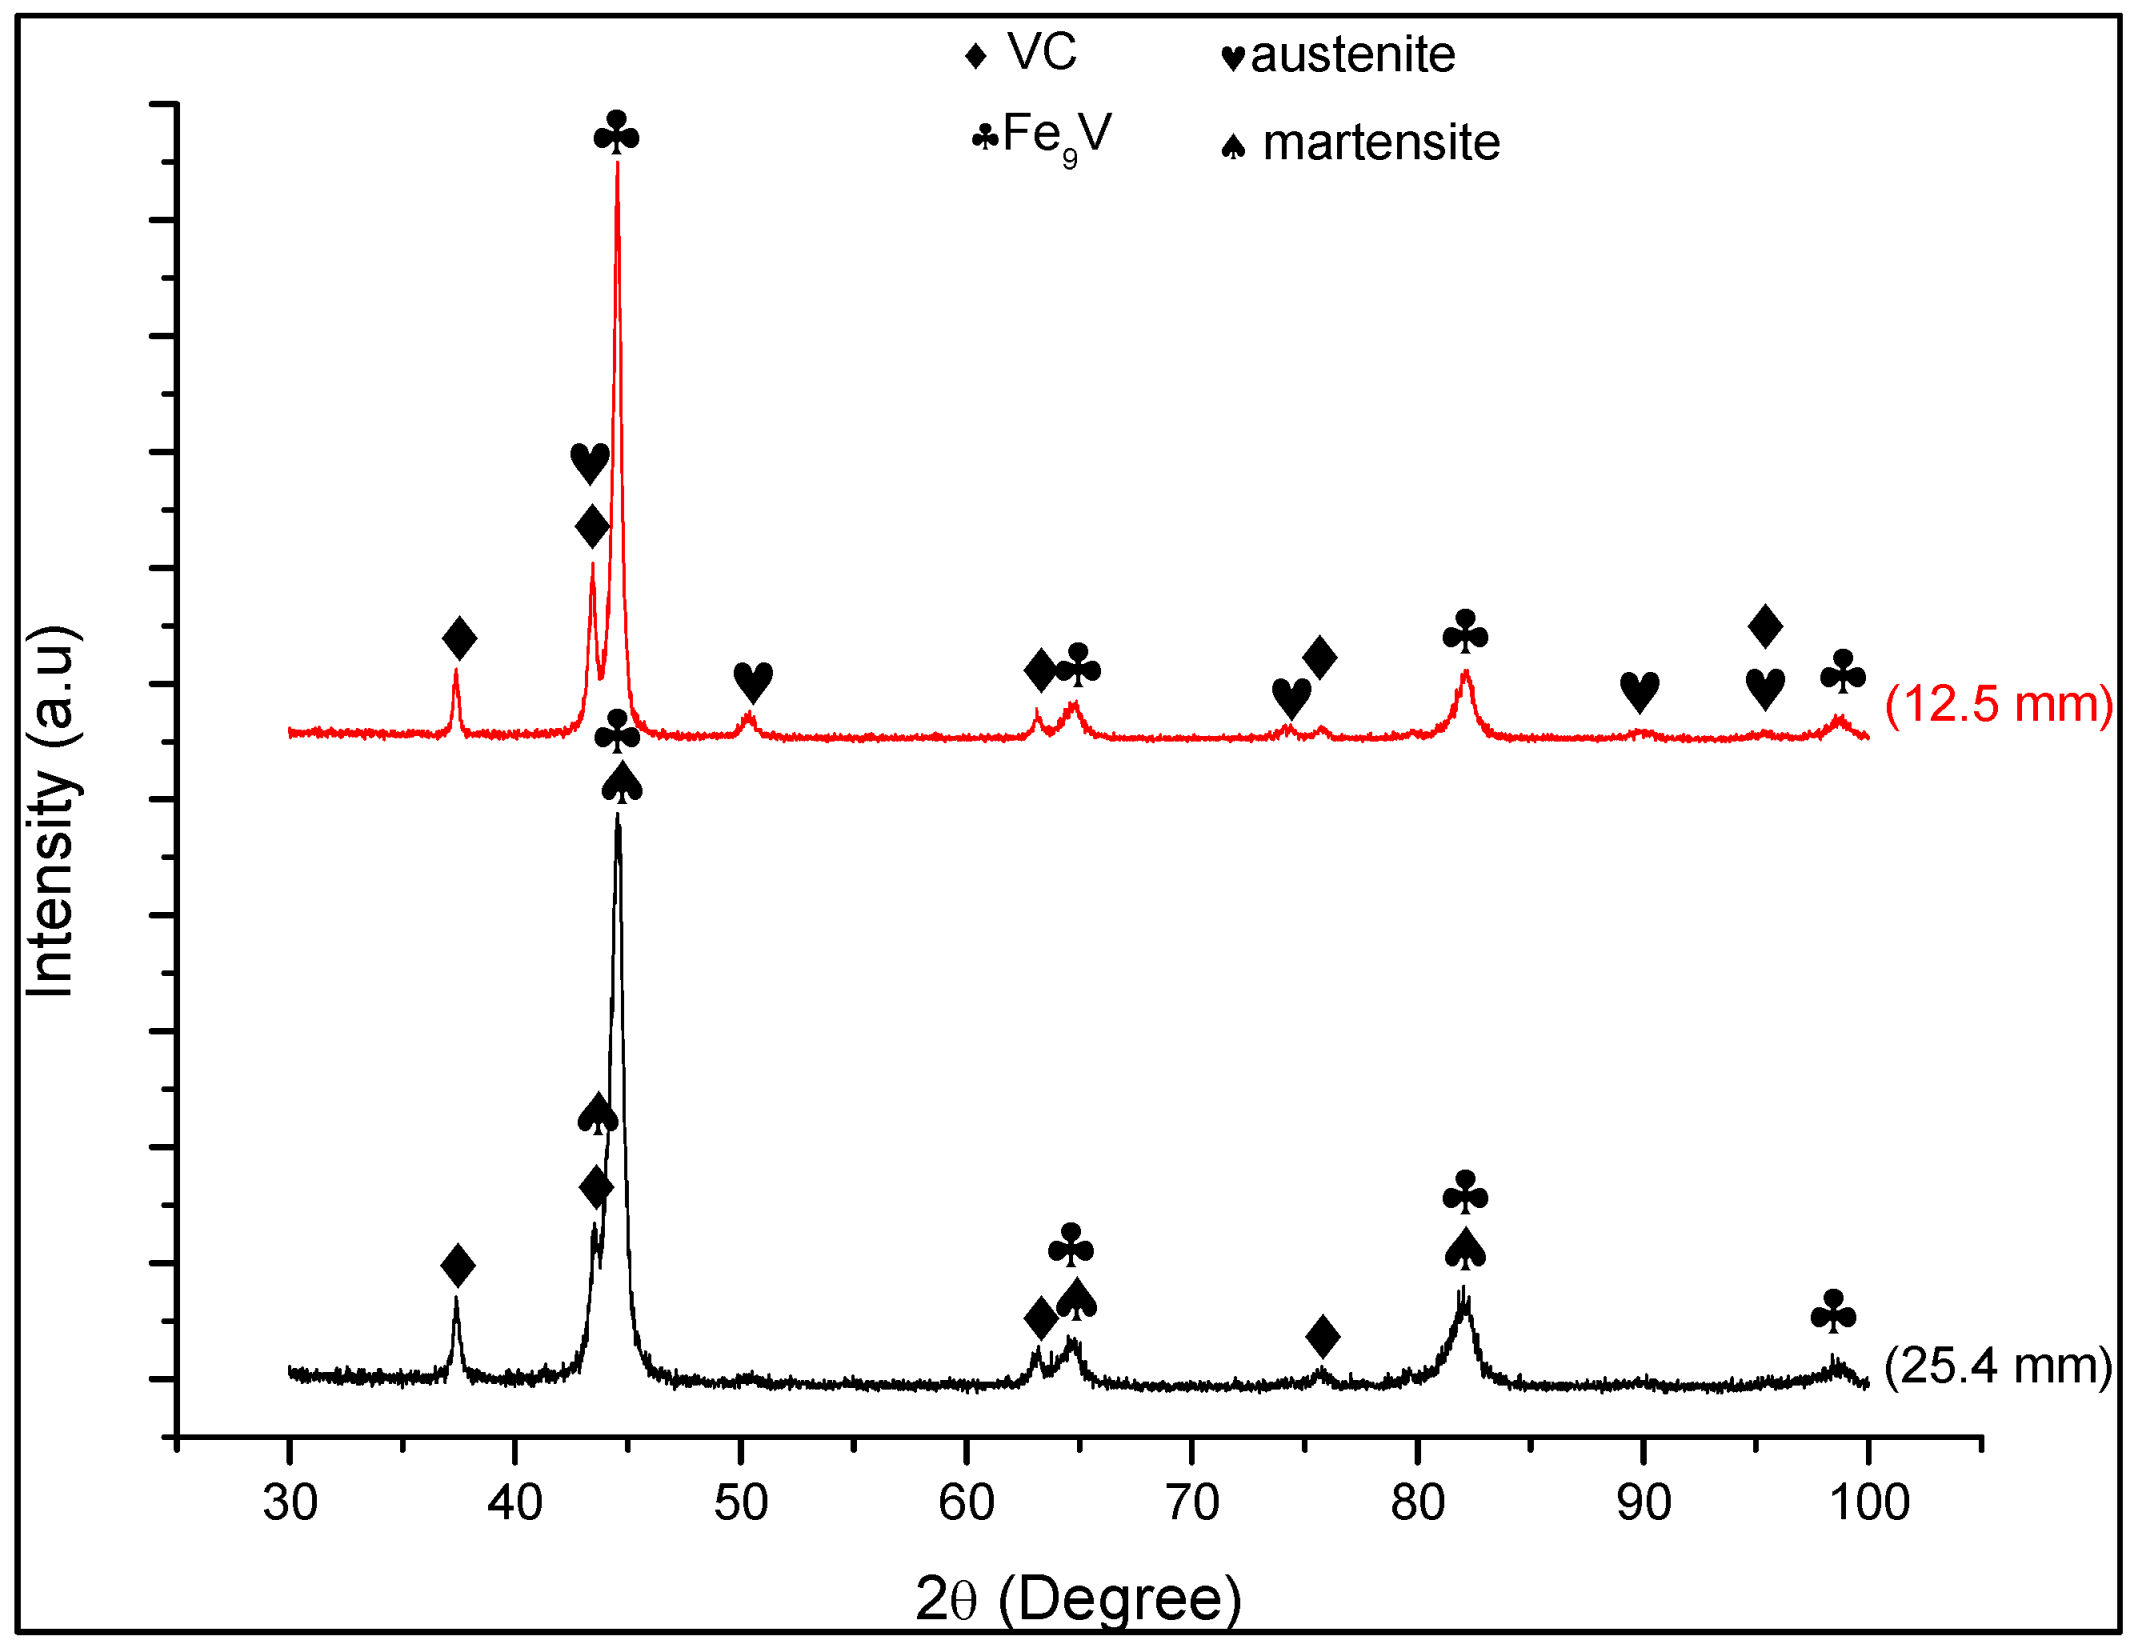
The formed phases in the coating were characterized using X-ray diffraction (XRD) analysis with a high-resolution X-ray diffractometer (Shimadzu, model XRD-7000). The X-ray tube was operated at 30 kV and 30 mA, and the diffractograms were recorded between 30° and 100° (2θ) with a step of 0.02° and a time of 1.2 s. The interpretation of the spectra obtained was performed using the X’Pert HighScore 2.0© software (Version 3.0).
The Vickers hardness measurements of the hardfaces and substrates were carried out using a hardness tester model Zwick/Roell LKV. The load and dwell times for hardness measurement were 10 kgf and 10 s, respectively. Ten measurements were performed along the hardfacing and ten measurements along the substrate, so that hardness profiles could be obtained.
Abrasive wear tests of the hardfacings were performed based on ASTM G-65 standard [43]. Although this standard describes the parameters for using the test, some changes were made to the test to allow for better reproduction of wear mechanisms found in real applications. The time, the type and granulometry of the abrasive and the loads applied were changed. For each hardfacing, two tests applying a load of 48 N were performed, and two others were applying a load of 160 N. For each applied force, two abrasive sizes were used, thus totaling eight tests for the coatings deposited onto the substrate with thickness of 12.5 mm and another set of eight tests for the thickness of 25.4 mm. The same forces and abrasives were used to test the reference anti-wear USI AR 450 steel. The parameters used in the abrasion tests are summarized in Table 3.
The tests were carried out on the surface of the Fe-Cr-C-V coatings without any surface preparation, aiming to reproduce the same condition used in the field. For comparison, USI AR 450 steel samples were also tested in the as-received condition. All samples were ultrasonic cleaned with acetone for 10 min before testing. A semi-analytical scale model Bel L 5202, with a precision of 0.01 g, was used to measure the mass loss, and Equation (6) was used to calculate the abrasive wear rate (W).
W = Q F · s
where Q (mm³) is the volume of worn material, F (N) is the applied load, and s (m) is the sliding distance. Small samples of the hardfacings were removed from the substrate by milling to determine the relative density of each coating through the pycnometric technique [44] to allow for the calculation of the worn volume from the mass loss measurements.

3. Results

3.1. Cooling Rate

Figure 2 shows the assembly of thermocouples before and after welding. Due to the torch weaving, the thermocouples are practically destroyed, making the acquisition of the temperature signals quite laborious and complex (Figure 2b). The temperature acquisition with the thermocouples installed on the counterface of the substrate would not present actual temperature values. For this reason, we chose to install the thermocouples as close as possible to the edge of the weld bead.
Figure 3 shows an example of the temperature curves obtained during the welding of the coatings. The red dots indicate the points used to calculate the cooling rate using Equation (1). As shown in Figure 3, depending on the distances from the thermocouples to the weld bead, some thermal cycles do not reach peak temperatures above 800 °C (Ta). These cycles were then not used to calculate the cooling rate. The calculated cooling rate was found to be the same, approximately 20 °C·s−1 for both substrate thicknesses.
The calculated cooling time using Equation (2) considering a three-dimensional heat flow was approximately 13 s. This result confirms that Δt800-500 values are constant for all points subjected to peak temperatures above about 900 °C [45]. A similar result was found in reference Dong, Qiu [41] when welding plates with thicknesses of 15 and 25 mm to assess the influence of sheet thickness on the cooling rate. Analytically, there seems to be no influence of sheet thickness on the cooling rate for sheets with intermediate thicknesses.

3.2. Dilution

The hardfacings deposited on the substrate with a thickness of 12.5 mm showed higher dilution values (above 20%), as shown in Figure 4 (red dots). The welding arc’s heat is partly diffused by conduction to preheat and melt the substrate. For both cases, the amount of heat transferred to the coated plate was the same (welding energy) since the welding current measured used was the same (~190 A). The more significant dilution that occurred in the 12.5 mm plates can be explained by the fact that the amount of heat transferred and absorbed by the plate increases when the heat concentration in thin plates is higher during the welding process [46].
The hardness profiles of the coatings deposited by PTA-P are shown in Figure 4. The hardness of the fusion zone of the coatings deposited on the 25.4 mm thick substrate is around 300 HV higher than the anti-wear USI AR 450 steel (450 HV10). As for the coating deposited onto the thinner substrate, the hardness was 200 HV higher than the USI AR 450 steel. In addition, the deposition of the coating led to nearly 20% increase in the substrate hardness. The dots highlighted in red show the percentage of substrate dilution in the 25.4 mm (around 5%) and 12.5 mm (above 20%) coatings.
Figure 5 shows the cross section of the coatings deposited onto 12.5 mm thick (Figure 5a) and 25.4 mm thick substrates (Figure 5b). It is possible to notice that the coating on the thinner substrate appears to have defects (yellow arrows). In addition, it can be seen that in the thinner slab, there is a coating below the fusion line, unlike the coating on the thicker plate.

3.3. Microstructure

The microstructures of hardfacings are shown in Figure 6. Upon solidification, primary carbides rich in vanadium (yellow circles) are formed in a martensitic matrix (dark gray in Figure 6a). Solidification is likely to start with the formation of vanadium-rich primary carbides (yellow circles) followed by the formation of primary austenitic dendrites and transformed martensite laths after cooling [47]. Figure 6b shows carbides (probably primary VC) more agglomerated when compared to Figure 6a. VC formation as spherical, petal-like particles, and thin scale-like segments can be seen in Figure 6b, as reported in the literature [48]. Primary carbides were found in the 25.4 mm substrate coatings along with the coarse structure of vanadium carbides (marked as 1 and 3 in Figure 6b). EDS analysis (Table 4) corroborates the hypothesis that they are vanadium carbides. These formations have already been reported in the literature [26,27]. The main difference in the microstructures is the appearance of coarser carbides in the coating deposited on the thicker plate.
Six transmission electron microscopy (TEM) classifications of VC [49] morphologies have been reported in the literature: (i) undissolved carbides, (ii) austenite precipitation, (iii) interphase precipitation, (iv) “fibrous” morphology, (v) matrix precipitation, and (vi) precipitation on dislocations. However, these differences between the precipitates and the precipitation sequence of the various morphologies were studied for levels below 1% of V [49,50]. Although the morphologies presented in these studies are for very low levels of V, compared to the content of this study, it is known that when the content of V is greater than the percentage of C, most of the C will combine with the V until saturation [51]. The amounts of C from the powder alloy added to the substrate used in this study can form a matrix composed of a combination of structural components such as martensite or austenite [33].
From the images obtained by scanning electron microscopy and using Particle Separation methodologies of the Fiji free available software [40,52], the percentual volume fraction of vanadium carbides (VC) and mean free distance, or mean free path (λ), were calculated and shown in Table 5. For the hardfacing deposited on the thicker substrate, the carbides with different morphologies were separated (primary carbides and coarse microstructures) to calculate the average size of the areas. The carbide volume fraction for the coating on the thicker substrate was just over two times higher than for the 12.5 mm substrate coating. Large conglomerates of particles can come off during abrasive testing and lead to higher wear rates.
A possible explanation for the differences in VC morphologies found in the microstructures shown between Figure 6a,b is that the dilution during the coating process would reduce the vanadium content and consequently decrease the formation of primary vanadium carbides along the coating [30].
Table 5 shows EDS results for the points marked in Figure 6 for the 12.5 and 25.5 mm plates. It is noted that the percentage of Fe for the 12.5 mm plate is higher than the percentage for the 25.4 mm sheet, and the percentage values of V and C increased for the plate with greater thickness, intensifying the claim that the dilution decreases the formation of primary vanadium carbides.
The phase composition of coatings was confirmed by XRD, and the results are shown in Figure 7. The presence of VC and Fe9V in the coatings of both substrates was confirmed and can be identified through the XRD powder diffraction pdf card by numbers 01-073-0476 and 03-065-7509, respectively [53]. For the coating deposited onto the substrate with the highest dilution (12.5 mm), austenite was found (pdf card 00-052-0512). On the other hand, for the coating on the 25.4 mm substrate, martensite was found (pdf card 00-044-1293). The software calculated the percentage of phases as follows: 30% VC, 56% Fe9V, and 14% austenite in the coating on the 12.5 mm substrate and; 22% VC, 55% Fe9V, and 24% martensite for the coating on the 25.4 mm substrate. The higher hardness found in the coating deposited on the thicker substrate can be explained by the amount of martensite found in the coating matrix.

3.4. Wear Rates

For the different test conditions, the newly proposed hardfacing showed lower wear rate values than the wear-resistant commercial steel (USI AR 450) commonly used in agriculture applications. Figure 8 plots a nondimensional relative wear resistance of the coatings as the ratio between the wear rates measured for the commercial wear-resistant USI AR 450 steel and the wear rate of the coating. It can be seen that when the Fe-Cr-C-V coating was tested with the larger size abrasive (#50) and different loads, there was no statistical difference in relative wear resistance between the coatings deposited on plates with different thicknesses, confirming the results of Keränen [15]. When the test was performed with the smallest abrasive (#100) and the applied load of 48 N, the highest wear resistance occurred for the coating welded to the 25.4 mm substrate. This coating was six times stronger than the commercial anti-wear steel. Under the same test conditions, the coating welded to the 12.5 mm substrate was almost five times stronger than the USI AR 450 steel. When increasing the load to 160 N with the smaller size abrasive, there seems to be no difference in the relative strength wear on both coatings. Even so, the coatings were almost five times more resistant to abrasion than the commercial wear-resistant steel.
The worn surfaces of the samples were analyzed under electron microscopy to identify the predominant abrasive wear mechanisms. Figure 9 and Figure 10 show secondary electron images (SEI) of the worn surfaces after the rubber wheel tests for the Fe-Cr-C-V coating deposited onto 12.5 and 25.4 mm thick substrates, respectively.
The shiny particles present in Figure 9a–c are silica abrasives according to the EDS analysis (Table 6). In contrast, the darker spots in these figures show oxidation and vanadium carbides. When the abrasion test was performed with larger particles (#50) for the two applied loads, it seems that the micro-mechanism of wear is micro-cutting (Figure 9a,b and Figure 10b).
Some shallow grooves were seen when the abrasion test was performed with the smallest particles (#100). However, the predominant wear micromechanism seems to be rolling abrasion due to microindentations (Figure 9c,d and Figure 10c,d). It seems that in this test condition, there is rolling of the abrasive particle between the sample and the rubber wheel. It is important to emphasize that the coatings showed a higher relative resistance to wear for this test condition, as show in Figure 8.
The abrasive particles are dry and loose in the rubber-wheel abrasion test. During the test, they interact with the samples in different ways: (i) the particles coming into contact with the rubber-wheel can plastically deform the matrix of the sample, (ii) the particles can stick to the rubber and groove the sample surface, and (iii) the abrasive particles can roll between the wheel and the sample causing plastic deformation similar to a series of microindentations on the surface. The transition in the abrasive dynamics from grooving to rolling has been widely reported in the literature, particularly for microabrasion tests [54]. Similar descriptions were also confirmed for rubber-wheel tests [55]. The particle dynamics depends on a combination of factors, including friction between the abrasives and the worn surface, normal load, relative hardness between the abrasives and worn surfaces, and particle size. Generally, when the normal load is higher, the load per particle is higher, so the abrasive can more easily indent the rubber and groove the specimen surface. Grooving becomes more severe when the abrasive size is larger, since larger abrasives result in fewer particles in the contact and, thus, higher load per particle. For lower loads and/or finer abrasives, the load per abrasive is lower, so that instead of the abrasives becoming fixed on the rubber and grooving the specimen surface, they remain as free particles rolling between the rubber and the surface, leading to multiple indentations. This micromechanism is less severe, often leading to lower wear rates [56].
This transition in wear mechanisms is also obviously influenced by the specimen hardness and microstructure, which should influence the grooving action of the abrasives. It is also noteworthy that when the abrasives led to microcutting, the coarse surface carbides tended to divert or even completely interrupt the grooves.
Figure 11 details the worn surface after the rubber-wheel test of the Fe-Cr-C-V coating deposited onto the thicker substrate (25.4 mm). Silica particles used as abrasives are the bright spots in Figure 11a. The wear micromechanisms are a mixture of rolling abrasion and a few grooves; arrows indicate various points with grooves. In Figure 11b, the same region is observed with backscattered electrons (BSE), which gives chemical contrast. It is possible to observe that the Fe matrix appears brighter than the vanadium carbides, highlighted by the ellipses. The blue arrow exemplifies a change in direction in the grooves due to the vanadium carbides. The darker spot on the right, marked by a rectangle, is tribochemical oxidation of the V-rich areas, probably due to the high affinity of vanadium with oxygen. All of those hypotheses were confirmed by EDS analyses, as shown in Table 7.
The hardfacing shown in Figure 10 had the lowest dilution value; it had lower concentrations of Fe from the substrate and higher concentrations of V and C. The cooling rates were monitored; for both substrate thicknesses, it was approximately 20 oC·s−1;, so the cooling rate was not responsible for the difference in dilution. The welding energy used was also the same for both coatings. A possible explanation for the difference in dilution for the substrate thicknesses could be that the amount of heat transferred and absorbed by the plate is higher for the 12.5 mm thick plate. The welding time for the coating beads (open plasma arc time) is the same for both thicknesses. However, for the smaller thickness, it is more difficult to dissipate or lose heat than for the thicker plate, which makes the plate hotter for longer and favors the increase in dilution for the plate of smaller thickness. For both plates, heat losses by convection occurred at the surface (top) and the base (bottom) of the plate, but heat loss is favored in the thicker plate because it has more mass to diffuse heat by conduction. These phenomena are analogous to those presented by Quintino, Liskevich [46].
Due to the lower dilution for the 25.4 mm substrate, the concentration of C is higher, while that of Fe is lower. The higher percentages of C combined with the high concentration of V favored the formation of coarse vanadium structures [27] (Table 5). In addition to the presence of martensite, these coarser VC structures seem to have favored the protection of the matrix during the abrasive wear test with smaller abrasive particles (#100) and lower applied load (48N), as it presented a relative wear resistance superior to all other conditions of use. On the other hand, when the highest load was applied (160 N), the different microstructures formed from the different dilutions did not seem to have influenced the wear resistance. In the test conditions with the largest abrasive particle (#50), the different microstructures formed due to the dilution do not seem to have influenced the wear behavior. For both applied loads, the wear was practically the same for both conditions. It probably results from the high load per particle when coarse abrasives and high loads are used. The grooves formed probably are too large to be stopped by the carbides, being removed together with the matrix.
Although the dilution does not seem to directly influence the wear resistance of the coatings when grooving abrasion prevailed, it contributed to the morphology and number of carbides. The area occupied by the primary carbides in the 12.5 mm substrate coating is 18%, while the primary carbides alone occupy an area of 24% in the 25.4 mm substrate coating. When the coarse VCs are considered for the 25.4 mm substrate coating, the area occupied by the carbides rises to 38%.
This increase in carbides should influence the wear resistance of the coating for the thicker substrate in all test conditions, but the abrasive wear test results did not show a significant difference for the most severe test conditions. As indicated in the literature [18], there is a tendency to increase the abrasion resistance with the increase in the number of carbides. On the other hand, if the precipitates have a low level of cohesion with the matrix, they can quickly come off and act as abrasive particles [57,58]. For example, adding VC from 6% to 10% by Gates [56] caused higher wear rates due to the detachment of precipitates from the matrix that acted as abrasive particles. On the other hand, the combination of high contents of vanadium (>10%wt.) and carbon (>2%wt.) in [25] provided high wear resistance due to the amount, morphology, and distribution of VC in the matrix. When comparing the average areas of the precipitates of the coatings, for the substrate thickness of 12.5 mm, the average area of the precipitates was 1.2 µm² without showing coarse carbide structures. The 25.4 mm substrate coating led to coarse structures with average areas of up to 33.4 µm², in addition to the primary carbides with an average area of 10.3 µm². These structures together, on the thicker substrate, provided a free distance between carbides of 2.2 µm, almost half the value for the thinner substrate. These results show the marked effect of the distribution and size of the precipitates on wear resistance. Possibly the morphology and distribution of vanadium carbides must have contributed to the better wear resistance of the sample tested with the smallest abrasive particle (#100) and applied load of 48 N. When the abrasion test was performed with a larger abrasive particle (#50), the distribution and morphology of the precipitates in both coatings did not affect the wear resistance, even though it was still around three times greater than the commercial anti-wear steel. There may have been a generalized detachment of the precipitates from the matrix, and, in this way, they could have contributed as abrasive particles during the tests. However, when rolling abrasion prevails, the removal of the carbides becomes less likely, and the specimen with more carbides showed superior performance. Therefore, it can be inferred that the effectiveness of carbides in increasing wear resistance depends on the distribution and size of the carbides [59] as well as on the dominant wear mechanism.
A relationship was established between the mean width of the grooves (L) after abrasion and the mean free distance (λ) for a possible explanation of the discrepancy in wear rates, as suggested by De Mello, Durand-Charre [60] (Table 8). For the coating deposited on the 12.5 mm substrate, L varies from 1.6 ± 1 µm to 12.4 ± 1 µm. For the coating deposited on the 25.4 mm substrate, L varies from 1.5 ± 0.2 µm to 3.9 ± 0.2 µm. When compared to the mean free distance (λ), these values suggest a greater material pullout for the coatings deposited on the 12.5 mm substrate. The mean groove widths caused in the abrasive test are smaller than λ in the test with the smallest abrasive particle (#100); this seems to be a reasonable explanation for the six times wear resistance of the coatings for the two substrates.

4. Conclusions

Fe-Cr-C-V coatings were deposited onto steel substrates by PTA. All coatings showed substantially higher abrasion resistance than a commercial anti-wear steel commonly used in soil preparation and mining applications;
The thickness of the substrate affected the dilution and, thus, the formation and distribution of carbides in the coating as well as the amount of martensite. Thicker substrates resulted in harder and more wear-resistant coatings. However, improved wear resistance for the harder coatings was only observed for less severe abrasion conditions.
Transitions in the wear mechanism occurred due to abrasive size and normal load, with grooving abrasion occurring for higher loads and coarser abrasives. The dilution effect on abrasion resistance was only significant when rolling abrasion was preponderant.

Author Contributions

Conceptualization, T.A.P. and G.P.; methodology, T.A.P.; validation, T.A.P., G.P. and H.C.; formal analysis, T.A.P. and F.K.C.L.; investigation, T.A.P. and F.K.C.L.; writing—original draft preparation, T.A.P.; writing—review and editing, H.C. and G.P.; supervision, G.P.; project administration, H.C. and G.P.; funding acquisition, H.C. and G.P. All authors have read and agreed to the published version of the manuscript.

Funding

H.C. acknowledges financial support from Fapergs (Brazil), grant number 19/2551-0001849-5 and CNPq (Brazil), grant number 305453/2017-3. G.P. acknowledges CNPq (Brazil), grant number 310523/2020-6.

Institutional Review Board Statement

Not applicable.

Informed Consent Statement

Not applicable.

Data Availability Statement

Not applicable.

Acknowledgments

The authors are grateful for the support of the company Primuss Indústria Metal Técnica, the Multiuser Center for Materials Characterization (CMCM) of the Federal Technological University of Paraná and the Center for Electronic Microscopy of the South Zone (CEME-SUL) of the Federal University of Rio Grande.

Conflicts of Interest

The authors declare no conflict of interest.

References

  1. G40-22; Standard Terminology Relating to Wear and Erosion. Book of Standards; ASTM International: West Conshohocken, PA, USA, 2022; p. 9.
  2. Holmberg, K.; Kivikytö-Reponen, P.; Härkisaari, P.; Valtonen, K.; Erdemir, A. Global energy consumption due to friction and wear in the mining industry. Tribol. Int. 2017, 115, 116–139. [Google Scholar] [CrossRef]
  3. Singh, J.; Chatha, S.S.; Sidhu, B.S. Influence of soil conditions on abrasion wear behaviour of tillage implements. Int. J. Latest Trends Eng. Technol. 2018, 258–263. [Google Scholar]
  4. Miller, B.A.; Shipley, R.J.; Parrington, R.J.; Dennies, D.P. Abrasive Wear Failures. In Failure Analysis and Prevention; Miller, B.A., Shipley, R.J., Parrington, R.J., Dennies, D.P., Eds.; ASM International: West Conshohocken, PA, USA, 2021. [Google Scholar]
  5. Singh, J.; Chatha, S.S.; Sidhu, B.S. Abrasive wear behavior of newly developed weld overlaid tillage tools in laboratory and in actual field conditions. J. Manuf. Process. 2020, 55, 143–152. [Google Scholar] [CrossRef]
  6. Hutchings, I.M. Tribology, Friction and Wear of Engineering Materials, 1st ed.; Elsevier Limited: Oxford, UK, 1992. [Google Scholar]
  7. ÇöMez, N. Effect of Vanadium on Wear and Corrosion Resistance of Fe-C-Cr Hardfacing Coatings. J. Mater. Eng. Perform. 2022, 1–11. [Google Scholar] [CrossRef]
  8. Ashvinkumar Padhiar, S.; Vincent, S. Effect of hard facing processes on Mild steel A-36 by arc welding. Mater. Today Proc. 2020, 28, 526–531. [Google Scholar] [CrossRef]
  9. Preedawiphat, P.; Mahayotsanun, N.; Sa-Ngoen, K.; Noipitak, M.; Tuengsook, P.; Sucharitpwatskul, S.; Dohda, K. Mechanical Investigations of ASTM A36 Welded Steels with Stainless Steel Cladding. Coatings 2020, 10, 844. [Google Scholar] [CrossRef]
  10. Buchely, M.F.; Gutierrez, J.C.; León, L.M.; Toro, A. The effect of microstructure on abrasive wear of hardfacing alloys. Wear 2005, 259, 52–61. [Google Scholar] [CrossRef]
  11. Balasubramanian, V.; Varahamoorthy, R.; Ramachandran, C.S.; Muralidharan, C. Selection of welding process for hardfacing on carbon steels based on quantitative and qualitative factors. Int. J. Adv. Manuf. Technol. 2009, 40, 887–897. [Google Scholar] [CrossRef]
  12. Garcia, R.; Canobre, S.; Costa, H. Microabrasion-corrosion resistance of Ni–Cr superalloys deposited by plasma transferred arc (PTA) welding. Tribol. Int. 2020, 143, 106080. [Google Scholar] [CrossRef]
  13. Deng, D.; Zhang, L.; Niu, T.; Liu, H.; Zhang, H.-C. Microstructures and Wear Performance of PTAW Deposited Ni-Based Coatings with Spherical Tungsten Carbide. Metals 2015, 5, 1984–1996. [Google Scholar] [CrossRef] [Green Version]
  14. Ferreira, L.d.S.; Graf, K.; Scheid, A. Microstructure and properties of Nickel-based C276 alloy coatings by PTA on AISI 316L and API 5L X70 steel substrates. Mater. Res. 2015, 18, 212–221. [Google Scholar] [CrossRef]
  15. Keränen, M. Effect of welding parameters of plasma transferred arc welding method on abrasive wear resistance of 12V tool steel deposit. Ph.D. Thesis, Aalto University School of Science and Technology, Espoo, Finland, 2010. [Google Scholar]
  16. Raghu, D.; Webber, R. PTA proves its worth in high-volume hardfacing jobs. Weld. J. 1996, 75, 34–40. [Google Scholar]
  17. Mendez, P.F.; Barnes, N.; Bell, K.; Borle, S.D.; Gajapathi, S.S.; Guest, S.D.; Izadi, H.; Gol, A.K.; Wood, G. Welding processes for wear resistant overlays. J. Manuf. Process. 2014, 16, 4–25. [Google Scholar] [CrossRef]
  18. Pintaude, G. Strategies for the development of wear-resistant coatings: A review. Soldag. Inspeção 2021, 26, e2616. [Google Scholar] [CrossRef]
  19. Ulutan, M.; Kiliçay, K.; Çelik, O.N.; Er, U. Microstructure and wear behaviour of plasma transferred arc (PTA)-deposited FeCrC composite coatings on AISI 5115 steel. J. Mater. Process. Technol. 2016, 236, 26–34. [Google Scholar] [CrossRef]
  20. Buytoz, S.; Orhan, A.; Gur, A.K.; Caligulu, U. Microstructural Development of Fe–Cr–C and B4C Powder Alloy Coating on Stainless Steel by Plasma-Transferred Arc Weld Surfacing. Arab. J. Sci. Eng. 2013, 38, 2197–2204. [Google Scholar] [CrossRef]
  21. Deshmukh, D.D.; Kalyankar, V.D. Recent status of overlay by plasma transferred arc welding technique. Int. J. Mater. Prod. Technol. 2018, 56, 23–83. [Google Scholar] [CrossRef]
  22. Buchanan, V.; Shipway, P.; McCartney, D. Microstructure and abrasive wear behaviour of shielded metal arc welding hardfacings used in the sugarcane industry. Wear 2007, 263, 99–110. [Google Scholar] [CrossRef]
  23. Qi, X.; Jia, Z.; Yang, Q.; Yang, Y. Effects of vanadium additive on structure property and tribological performance of high chromium cast iron hardfacing metal. Surf. Coatings Technol. 2011, 205, 5510–5514. [Google Scholar] [CrossRef]
  24. Wang, X.; Han, F.; Liu, X.; Qu, S.; Zou, Z. Microstructure and wear properties of the Fe–Ti–V–Mo–C hardfacing alloy. Wear 2008, 265, 583–589. [Google Scholar] [CrossRef]
  25. Aramide, B.; Pityana, S.; Jamiru, T.; Popoola, P.; Sadiku, R. Influence of Vanadium-Chromium Carbide on the Microstructure of Reinforced FeCrV15 Hardfacing during Laser Cladding Deposit. J. Mater. Eng. Perform. 2022, 31, 514–523. [Google Scholar] [CrossRef]
  26. Günther, K.; Bergmann, J.P. Influencing Microstructure of Vanadium Carbide Reinforced FeCrVC Hardfacing during Gas Metal Arc Welding. Metals 2020, 10, 1345. [Google Scholar] [CrossRef]
  27. Wei, S.; Zhu, J.; Xu, L. Effects of vanadium and carbon on microstructures and abrasive wear resistance of high speed steel. Tribol. Int. 2006, 39, 641–648. [Google Scholar] [CrossRef]
  28. Dutra, W.T.; Machado, I.G. Influência do Pré-aquecimento Indutivo Localizado sobre Características Metalúrgicas de Juntas Soldadas. Soldag. Inspeção 2017, 22, 333–342. [Google Scholar] [CrossRef] [Green Version]
  29. Deshmukh, D.D.; Kalyankar, V.D. Deposition Characteristics of Multitrack Overlayby Plasma Transferred Arc Welding on SS316Lwith Co-Cr Based Alloy—Influence of Process Parameters. High Temp. Mater. Process. 2019, 38, 248–263. [Google Scholar] [CrossRef] [Green Version]
  30. Laurila, J.; Milanti, A.; Nurminen, J.; Kallio, M.; Vuoristo, P. Microstructure and wear behaviour of a vanadium carbide reinforced weld coating. Wear 2013, 307, 142–149. [Google Scholar] [CrossRef]
  31. Czupryński, A.; Poloczek, T.; Urbańczyk, M.; Spawalnictwa, S.B.-I. Characterization of a new high abrasion and erosion resistance iron-based alloy for pta hardfacing. Int. J. Mod. Manuf. Technol. 2022, 14, 45–54. [Google Scholar] [CrossRef]
  32. Chen, L.H.; Chang, L.C.; Lui, T.S. The abrasion resistance of high-chromium white cast irons as a linear function of carbide volume fraction. Chukung (J. Chin. Foundrymen’s Assoc.) 1990, 65, 21–25. [Google Scholar]
  33. Pereplyotchikov, E. Development of high-vanadium alloy for plasma-powder surfacing of knives for cutting of non-metallic materials. Paton Weld. J. 2014, 2014, 128–131. [Google Scholar] [CrossRef] [Green Version]
  34. Kumar, R.; Arya, H.K. Experimental Determination of Cooling Rate and its Effect on Microhardness in Submerged Arc Welding of Mild Steel Plate (Grade c-25 as per IS 1570). J. Mater. Sci. Eng. 2013, 3, 1–4. [Google Scholar] [CrossRef] [Green Version]
  35. Naksuk, N.; Nakngoenthong, J.; Printrakoon, W.; Yuttawiriya, R. Real-Time Temperature Measurement Using Infrared Thermography Camera and Effects on Tensile Strength and Microhardness of Hot Wire Plasma Arc Welding. Metals 2020, 10, 1046. [Google Scholar] [CrossRef]
  36. Poorhaydari, K.; Patchett, B.M.; Ivey, D.G. Estimation of cooling rate in the welding of plates with intermediate thickness. Weld. J. 2005, 84, 149S–155S. [Google Scholar]
  37. Souza, D.; Tavares, A.F.; Costa, H.L.; Osorio, A.G. Efeito da energia de soldagem sobre a microestrutura e resistência à corrosão de revestimentos de Inconel 625 aplicados pelo processo GMAW. Materia 2020, 25, e12633. [Google Scholar] [CrossRef]
  38. D’Oliveira, A.; Paredes, R.; Santos, R. Pulsed current plasma transferred arc hardfacing. J. Mater. Process. Technol. 2006, 171, 167–174. [Google Scholar] [CrossRef]
  39. Balasubramanian, V.; Lakshminarayanan, A.K.; Varahamoorthy, R.; Babu, S. Understanding the Parameters Controlling Plasma Transferred Arc Hardfacing Using Response Surface Methodology. Mater. Manuf. Process. 2008, 23, 674–682. [Google Scholar] [CrossRef]
  40. Tarragó, J.; Coureaux, D.; Torres, Y.; Wu, F.; Al-Dawery, I.; Llanes, L. Implementation of an effective time-saving two-stage methodology for microstructural characterization of cemented carbides. Int. J. Refract. Met. Hard Mater. 2016, 55, 80–86. [Google Scholar] [CrossRef] [Green Version]
  41. Dong, L.-M.; Qiu, X.-B.; Liu, T.-Y.; Lu, Z.-Y.; Fang, F.; Hu, X.-J. Estimation of cooling rate from 800 °C to 500 °C in the welding of intermediate thickness plates based on FEM simulation. J. Mater. Sci. Eng. 2017, B7, 258–267. [Google Scholar]
  42. Voort, V.G.F. Metallography, Principles and Practice; ASM International: West Conshohocken, PA, USA, 1999. [Google Scholar]
  43. G65-16; Measuring Abrasion Using the Dry Sand/Rubber Wheel Apparatus. Annual Book of Standards Volume 0302: Wear and Erosion; Metal Corrosion. Book of Standards; ASTM International: Philadelphia, PA, USA, 2021.
  44. Macedo, B.P.N.; Trevisan, L.A.; Crespo, G.d.S.; Manera, R.d.S.; Ventrella, V.A.; Gallego, J. Revestimentos duros depositados por soldagem. In XXXVI Consolda—Congresso Nacional de Soldagem; ABS—Associação Brasileira de Soldagem: Sao Paulo, SP, Brazil, 2010. [Google Scholar]
  45. Modenesi, P.J.; Marques, P.V.; Santos, D.B. Introdução à Metalurgia da Soldagem; Universidade Federal de Minas Gerais: Belo Horizonte, Brazil, 2004; p. 79. [Google Scholar]
  46. Quintino, L.; Liskevich, O.; Vilarinho, L.; Scotti, A. Heat input in full penetration welds in gas metal arc welding (GMAW). Int. J. Adv. Manuf. Technol. 2013, 68, 2833–2840. [Google Scholar] [CrossRef]
  47. Maroli, B.; Dizdar, S.; Bengtsson, S. Iron Based Hardfacing Alloys for Abrasive and Impact Wear. In Proceedings of the ITSC2017—International Thermal Spray Conference, Düsseldorf, Germany, 7–9 June 2017. [Google Scholar]
  48. Takeda, M.; Mitome, M.; Hayakawa, H.; Nishiuchi, S.; Tanabe, T.; Yamamoto, S. Morphology and crystallographic phase of V–C particles formed in Fe–Cr–Ni–V–C alloys. Mater. Sci. Technol. 2013, 29, 672–678. [Google Scholar] [CrossRef]
  49. Todd, J.A.; Li, P. Microstructure-mechanical property relationships in isothermally transformed vanadium steels. Met. Mater. Trans. A 1986, 17, 1191–1202. [Google Scholar] [CrossRef]
  50. Pan, X.-L.; Umemoto, M. Precipitation Characteristics and Mechanism of Vanadium Carbides in a V-Microalloyed Medium-Carbon Steel. Acta Met. Sin. Engl. Lett. 2018, 31, 1197–1206. [Google Scholar] [CrossRef] [Green Version]
  51. Lei, Y.; Wang, X.; Zhu, Q.; Liu, F. Effect of Vanadium on Microstructure and Mechanical Properties of TIG Weld Joint of China Low Activation Martensitic Steel. J. Fusion Energy 2015, 34, 1112–1117. [Google Scholar] [CrossRef]
  52. Benito, S.; Wulbieter, N.; Pöhl, F.; Theisen, W. Microstructural Analysis of Powder Metallurgy Tool Steels in the Context of Abrasive Wear Behavior: A New Computerized Approach to Stereology. J. Mater. Eng. Perform. 2019, 28, 2919–2936. [Google Scholar] [CrossRef]
  53. Michalcová, A.; Pečinka, V.; Kačenka, Z.; Šerák, J.; Kubásek, J.; Novák, P.; Vojtěch, D. Microstructure, Mechanical Properties, and Thermal Stability of Carbon-Free High Speed Tool Steel Strengthened by Intermetallics Compared to Vanadis 60 Steel Strengthened by Carbides. Metals 2021, 11, 1901. [Google Scholar] [CrossRef]
  54. Costa, H.; Ardila, M.; Labiapari, W.; Silva, W.; de Mello, J. Effect of surface topography on the dynamics of the abrasive particles during micro-abrasion. Wear 2015, 324-325, 129–139. [Google Scholar] [CrossRef]
  55. Grasser, D.; Gallo, S.C.; Pereira, M.; Barnett, M. Experimental investigation of the effect of insert spacing on abrasion wear resistance of a composite. Wear 2022, 494-495, 204277. [Google Scholar] [CrossRef]
  56. Gates, J. Two-body and three-body abrasion: A critical discussion. Wear 1998, 214, 139–146. [Google Scholar] [CrossRef]
  57. García, C.; Martín, F.; Herranz, G.; Berges, C.; Romero, A. Effect of adding carbides on dry sliding wear behaviour of steel matrix composites processed by metal injection moulding. Wear 2018, 414-415, 182–193. [Google Scholar] [CrossRef]
  58. García, C.; Romero, A.; Herranz, G.; Blanco, Y.; Martin, F. Effect of vanadium carbide on dry sliding wear behavior of powder metallurgy AISI M2 high speed steel processed by concentrated solar energy. Mater. Charact. 2016, 121, 175–186. [Google Scholar] [CrossRef] [Green Version]
  59. Xu, L.; Wei, S.; Xiao, F.; Zhou, H.; Zhang, G.; Li, J. Effects of carbides on abrasive wear properties and failure behaviours of high speed steels with different alloy element content. Wear 2017, 376-377, 968–974. [Google Scholar] [CrossRef]
  60. De Mello, J.D.B.; Durand-Charre, M.; Mathia, T. Abrasion mechanisms of white cast iron II: Influence of the metallurgical structure of V Cr white cast irons. Mater. Sci. Eng. 1986, 78, 127–134. [Google Scholar] [CrossRef]
Figure 1. Layout of welded coating and cutting of samples for characterization of coatings.
Coatings 12 01835 g001
Figure 2. Assembly of thermocouples before (a) and after (b) welding.
Coatings 12 01835 g002
Figure 3. Examples of temperature curves obtained during the welding of the coatings on 12.4 mm and 25.4 mm thick substrates.
Coatings 12 01835 g003
Figure 4. Average percentage of dilution of A11 hardfacings (thicknesses 25.4 mm and 12.5 mm).
Coatings 12 01835 g004
Figure 5. Cross section of the coatings deposited onto substrates with thicknesses of 12.5 mm (a) and 25.4 mm (b).
Coatings 12 01835 g005
Figure 6. SEI SEM of Fe-Cr-C-V coating cross sections: (a) 12.5 mm thick substrate and (b) 25.4 mm thick substrate.
Coatings 12 01835 g006
Figure 7. XRD analysis of the coatings deposited onto the substrates with thicknesses of 12.5 mm (red) and 25.4 mm (black).
Coatings 12 01835 g007
Figure 8. Relative abrasive wear resistance of Fe-Cr-C-V taken the commercial wear-resistant USI AR 450 steel as reference.
Coatings 12 01835 g008
Figure 9. SEI SEM of Fe-Cr-C-V coatings (12.5 mm) tested with (a) sand #50 load 48 N, (b) sand #50 load 160 N, (c) sand #100 load 48 N, and (d) sand #100 load 160 N.
Coatings 12 01835 g009
Figure 10. SEM by SEI of Fe-CrC-V coatings (25.4 mm) tested with (a) sand #50 load 48 N, (b) sand #50 load 160 N, (c) sand #100 load 48 N, and (d) sand #100 load 160 N.
Coatings 12 01835 g010
Figure 11. SEI (a) and BSE (b) SEM of Fe-Cr-C-V coating (25.4 mm) tested with #50 sand and 48 N load.
Coatings 12 01835 g011
Table 1. Chemical composition of the specimens (wt.%).
CFeSiCrVMnNi
A11—Commercial powder2.35–2.55Bal.0.75–1.104.75–5.759.15–10.350.35–0.60-
Commercial anti-wear steel USI AR 450≥0.25Bal.-0.40-1.500.20
Table 2. Constant parameters of the PTA process.
ParametersValue
Feeding rate (kg/h)1.0
Set current (A)200
Average current (A)193
Torch weaving frequency (Hz)3.5
Weaving width (mm)3.0
Shielding gas; Ar (L/min)12
Plasma and Carrier gas; Ar (L/min)2.0
Electrode setback (mm)1.5
Travel speed (cm·min−1)7
Nozzle to workpiece distance (mm)15
Table 3. Rubber wheel abrasion test parameters.
ParameterValue
Wheel diameter (mm)225
Rotation speed (rpm)200
Time (min)60
Normal load (N)48 e 160
Sand flow2 kg·min−1
Sand granulometry # 500.6 mm up to 0.3 mm
Sand granulometry # 1000.3 mm up to 0.15 mm
Table 4. EDS results for the substrate thicknesses of 12.5 and 25.4 mm.
SubstratePointElements Content (wt.%)
CSiVCrMnFeMo
12.5 mmpt11.961.327.425.630.5881.521.56
pt24.131.1318.345.540.6867.722.46
pt32.011.296.364.380.7584.081.15
pt41.931.274.814.480.5386.330.65
25.4 mmpt16.711.1624.585.55-59.162.67
pt27.591.3224.995.770.6157.222.50
pt37.791.1618.945.060.5564.841.66
pt48.080.8749.854.25-34.661.89
Table 5. Volume fraction, mean free distance, and size particles area.
SubstrateVolume Fraction, % Mean Free Distance (λ), µmSize Particles Area, µm²
Primary CarbidesCoarse Microstructures
12.5 mm184.2 ± 0.11.2-
25.4 mm382.2 ± 0.1Min. 0.6
Max. 10.3
Min. 0.6
Max. 33.4
Table 6. EDS analyses in selected areas of the coatings.
Element Content (wt.%)
COSiVCrMnFe
shiny particles3.7239.5417.633.801.46-21.98
darker spots5.6218.573.0211.453.140.3854.58
Table 7. EDS results of Fe-Cr-C-V coating (25.4 mm) tested with #50 sand and 48 N.
PointElements Content (wt.%)
COSiVCrMnFeMo
pt12.734.921.7721.806.210.5158.373.20
pt21.6711.583.5212.674.690.5461.971.41
pt31.370.971.705.144.610.7584.230.88
pt41.1737.135.8323.532.990.3922.561.82
pt51.4436.2412.917.952.610.4029.171.18
Table 8. Average width L of grooves.
SubstrateSandLoad, NMean Free Distance (λ), µmAverage Width of Grooves L, µm
12.5 mm#50484.25.4 ± 2
16012.4 ± 1
#100482.7 ± 1
1601.6 ± 1
25.4 mm#50482.22.2 ± 2
1605.2 ± 3
#100481.5 ± 0.2
1603.9 ± 0.2
Publisher’s Note: MDPI stays neutral with regard to jurisdictional claims in published maps and institutional affiliations.

