Article

Study on Size Effect of Surface Roughness Based on the 3D Voronoi Model and Establishment of Roughness Prediction Model in Micro-Metal Forming

1
School of Mechanical and Electronic Engineering, Shandong Jianzhu University, Jinan 250101, China
2
School of Mechanical Engineering, Shandong University, Jinan 250061, China
*
Author to whom correspondence should be addressed.
These authors contributed equally to this work.
Coatings 2022, 12(11), 1659; https://doi.org/10.3390/coatings12111659
Submission received: 6 October 2022 / Revised: 22 October 2022 / Accepted: 26 October 2022 / Published: 1 November 2022

Abstract

:
The primary purpose of this paper is to study the size effect of surface roughness and realize the quantitative description of the surface roughness in micro-forming process. This work is a continuation of the previous work by the authors. The effects of the initial surface roughness of the specimen, the grain size, and grain orientations on the surface roughness of micro-upsetting products were investigated. The ratio of the number of grains of the surface layer to the total number of grains was adopted to characterize the size effect. The variation of the size effect on the contact normal pressure during the compression process was also analyzed. And the quantitative description of the evolution law of surface roughness for micro-formed parts was realized. The corresponding micro compression experiment was done in order to testify the prediction model.

1. Introduction

Due to the rapid development of micro-system technology (MST) and micro-electro-mechanical systems (MEMS), the forming and manufacturing technology of micro-parts is highly regarded. In contrast with the products from a traditional plastic forming process, the products from a micro-forming process have small sizes, high dimensional accuracy, and surface quality requirements due to their high-end applications [1,2,3]. Due to their miniaturized sizes, size effect is crucial in micro-forming processes [4,5,6]. During the micro-plastic forming process, the surface roughness does not decrease with the reduction in the geometric size of the product. Meanwhile, mechanical machining is challenging to improve the surface quality due to the difficulty in clamping and operation. Therefore, the surface roughness control for micro-formed products has become one of the critical challenges in micro-forming.
For the macro-formed products, the roughness is affected by various factors such as the initial specimen roughness, the sliding distance between the contact surface and die, the contact normal pressure on the surface, and the properties of the material, etc. [7,8,9]. Among these factors, the influence of the normal pressure, the initial surface roughness, the sliding distance, and the contact surface area on the surface roughness have been studied in our previous work [10]. However, in the micro-plastic forming process, the material properties change significantly with miniaturization due to the tiny size. One such property is the grain size, and the other is the specimen size. Both of these factors lead to a change in the ratio of thickness to the grain sizes of the specimen [11]. When the size of the workpiece is gradually reduced close to the grain size, the grain number in the workpiece is less, and a “size effect” occurs. The change in grain size and the incongruity of grain orientation become increasingly apparent, resulting in the change in material mechanical properties, impacting the roughness of the workpiece after deformation [12].
Many studies have reported that under uniaxial tensile deformation, the uneven plastic deformation between grain boundaries leads to surface roughness evolution [13,14]. Kubo et al. [14] reported the difference in the crystal orientations because of the stress state on the surface roughness of a low-carbon steel sheet. It is therefore suggested that surface quality after press forming may be further improved by reducing the number of grains with crystal orientation of ND(001) in interstitial-free (IF) steel sheets. The surface quality after press forming could also be improved by reducing the difference in deformation resistances among the grains. The effect of crystal orientations on the inner surface roughness of micro metal tubes in hollow sinking was investigated by Kishimoto et al. [15]. They suggested that the roughness of inner surface can be suppressed by decreasing the wall thickness. One of the crystal orientations was determined to inhibit the increase in internal surface roughness during the hollow sinking. Yoshida [16] found that the surface roughness mainly depends on the grain size of the workpiece through the plane strain tensile simulation process, whereas the ratio of the workpiece thickness to the grain size has little influence on the roughness. Wang et al. [17] found that the grain size and texture composition impact the surface roughness through the bending deformation of copper tubes. At a particular scale, the surface roughness increases with grain sizes. In the biaxial tensile deformation study, Anand et al. [11] suggested that the ratio of sheet thickness to grain size (t/d) significantly affects surface roughness due to the size effect. For thin brass sheets, the ratio of thickness to grain size has a significant role in increasing the roughness during biaxial tension. With the increase in t/d, the surface roughness decreases. Moreover, when t/d ≥ 12, the surface roughness basically remains unchanged.
To sum up, compared with the macro-formed parts, the roughness control for micro-formed parts is more complicated. The effects of grain size and grain orientation on the roughness should also be considered. However, the roughness prediction for micro formed parts based on the 3D Voronoi model has not yet been reported in the literature. In this work, the effects of specimen initial surface roughness, grain size, and grain orientation on the surface roughness of products after micro-upsetting were investigated. The cause of size effect on surface roughness was also analyzed. Based on our previous work, a surface roughness prediction model taking into account of size effect was established and testified through the corresponding micro-compression experiments.

2. Materials and Methods

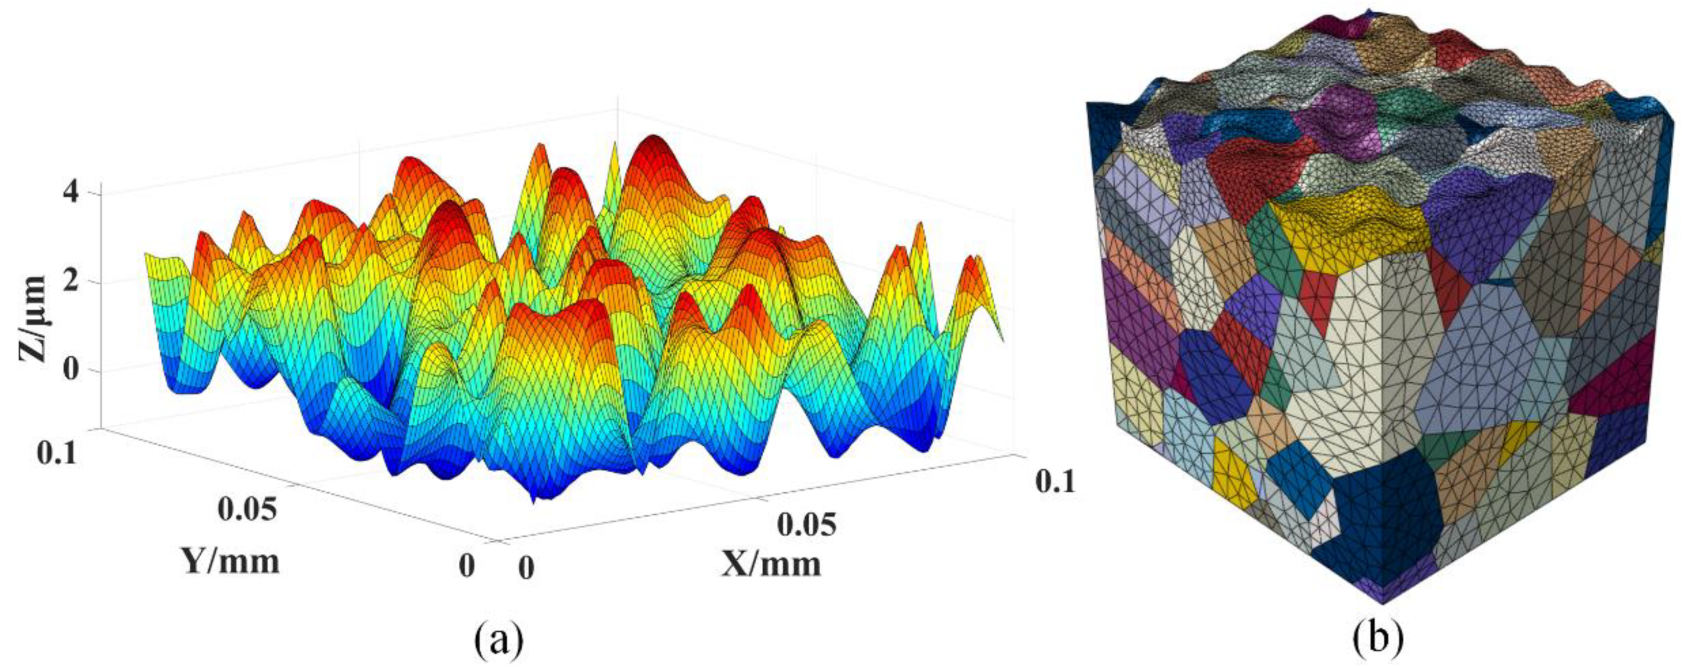
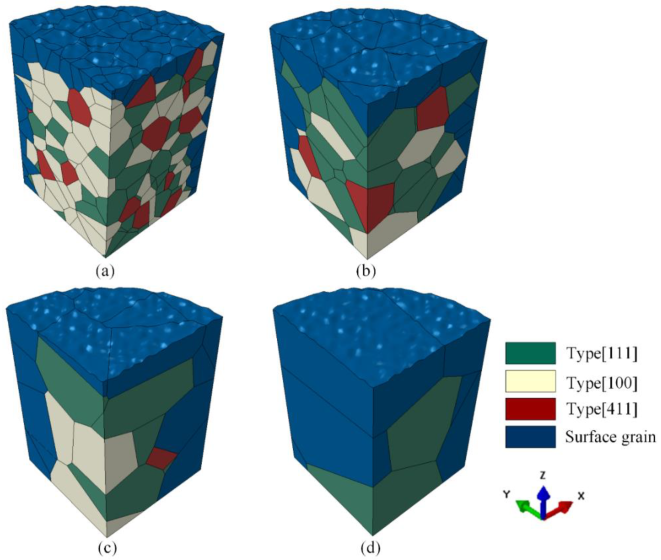
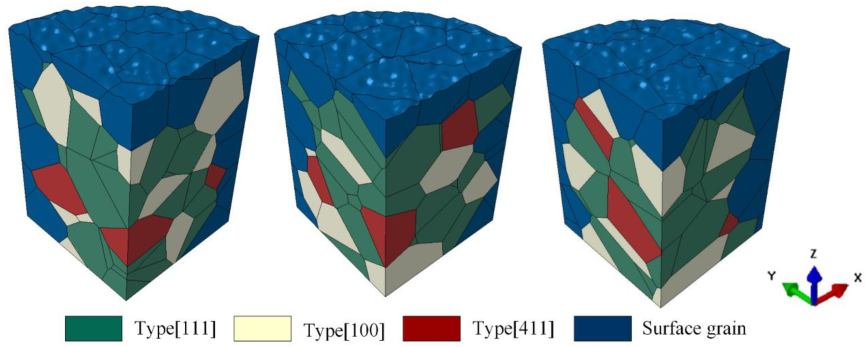
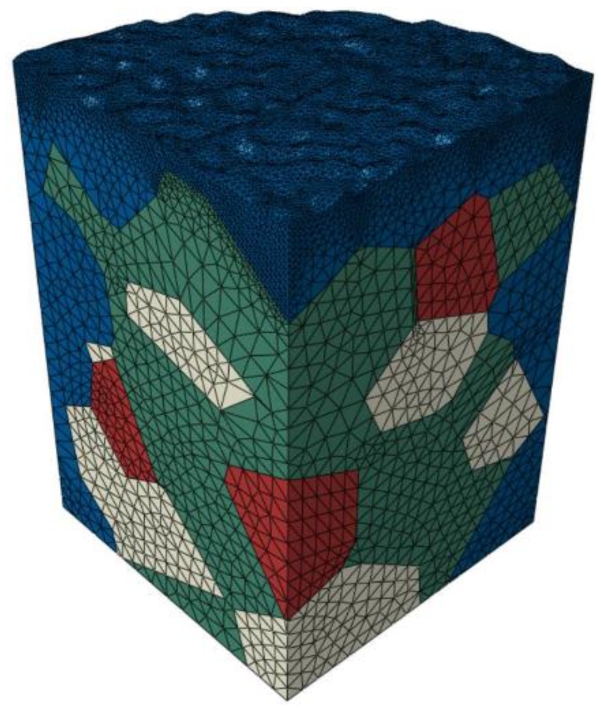
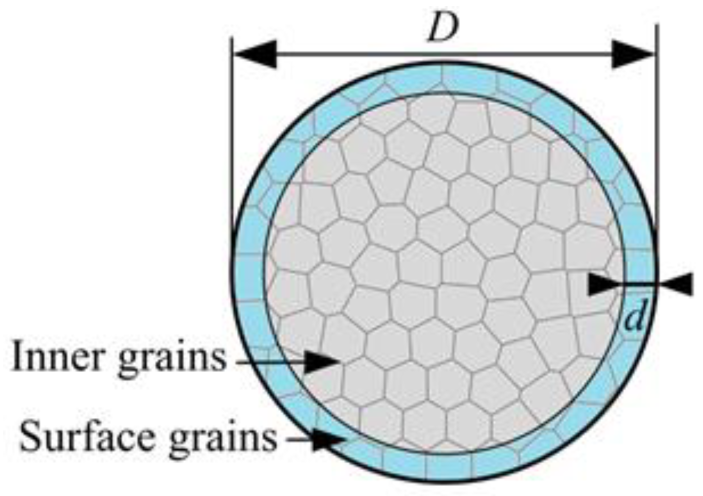
2.1. Development of Polycrystalline Finite Element Model with 3D Surface Roughness

Developing a polycrystalline geometric model is the foundation for investigating polycrystalline materials’ plastic deformation. The 3D grain cluster generated in this work was based on the Voronoi diagram method [18,19] and the ABAQUS/python script.
In order to describe the information on surface topography more comprehensively by the 3D parameter characterization method, the surface root mean square deviation (Sq) in ISO 25178-2 was used to evaluate the surface roughness [20]. The Sq represents the degree of deviation of the roughness morphology from the reference plane, and its mathematical expression is given in Equation (1) below.
S q = 1 l x l y 0 l x 0 l y Z 2 x , y d x d y = 1 m n i = 1 m j = 1 n Z i j x i , y j Z 0 2 .
where Z (x, y) is the height of the contour for each point, and lx and ly are the measured lengths in X and Y directions, respectively. m and n are the numbers of measurement points in X and Y directions, Zij is the height for the measuring point, and Z0 is the centerline height.
According to the self-programmed W–M function [21], the modeling of 3D rough surfaces with different fractal dimensions and scale coefficients was performed by MATLAB R2018a. The corresponding fractal dimension and scale coefficient were determined based on the measured rough surface profile. Figure 1a shows a randomly roughness profile with a surface roughness of 1.6 μm within 0.1 mm × 0.1 mm generated by MATLAB R2018a. Combining the roughness topography with the 3D Voronoi model, a 3D polycrystalline finite element model with initial roughness can be obtained in the finite element software ABAQUS, as shown in Figure 1b.

2.2. Development of 3D Polycrystalline Regionalized Constitutive Model at Micro-Scale

Based on the analysis of the microstructure of annealed pure copper, three different grain orientations are existed in the deformation direction: <411>, <100>, and <111> [22]. Table 1 shows the volume fractions and orientation factors for three different grain orientations of pure copper.
For polycrystalline materials, the flow stress is a weighted component of the flow stress of individual grains, given in Equation (2) below.
σ = M i n τ i + M i n K d 1 2 = i = 1 n λ i M i τ i + K d 1 2 .
where λi is the volume fraction of the i-th grain, Mi is the orientation factor of the i-th grain, τi is the frictional shear stress that restricts the dislocation sliding along the slip plane, K′d1/2 is the resistance shear stress due to dislocation stacking near the grain boundary, d is the grain size of the material, and n is the number of grains. Through the micro-compression experiment of pure copper, the flow stress–strain curves of the specimens with different grain sizes were obtained [18]. Equation (3) shows the representations of K′(ε) and τi(ε).
K ε = 2 . 688 ε 0.29 τ i ε = 100 . 1 ε 0 . 38 .
Moreover, Msurf = 2.0 for the surface layer grains [23]. The material constitutive relationship at any grain size can be determined by ignoring the rotation of grains and substituting the values of M <411>, M <100>, M <111>, and Msurf in Equation (2).

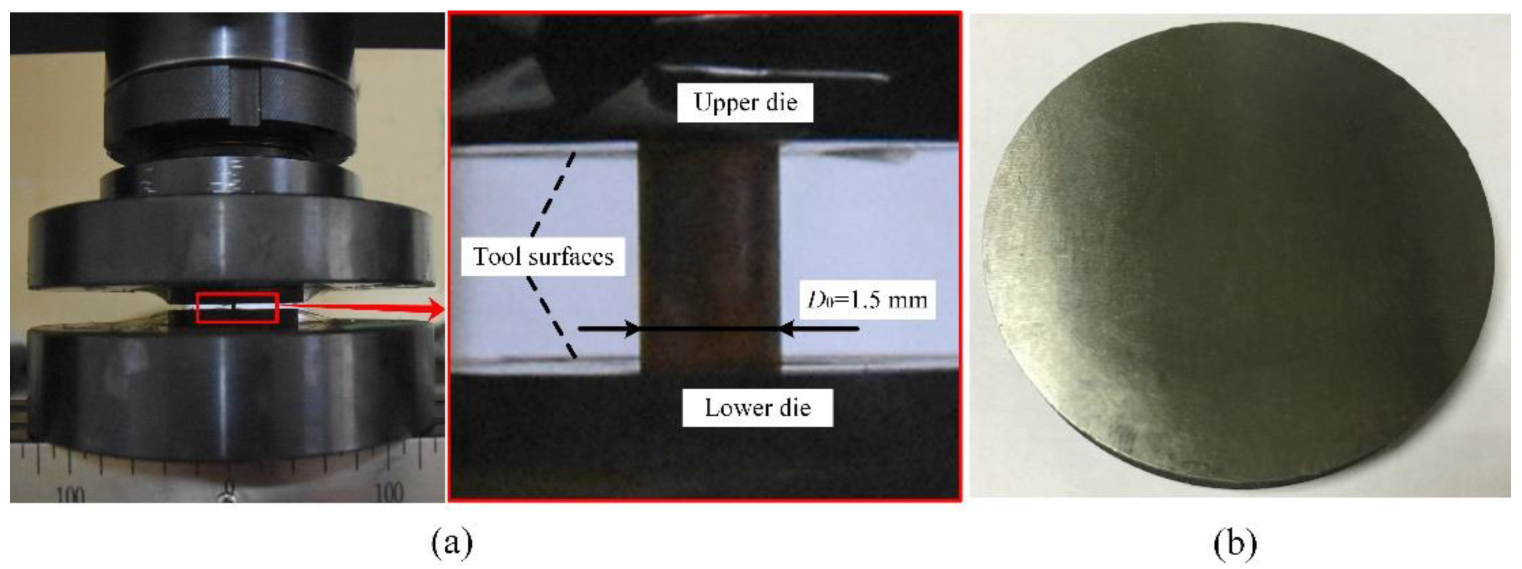
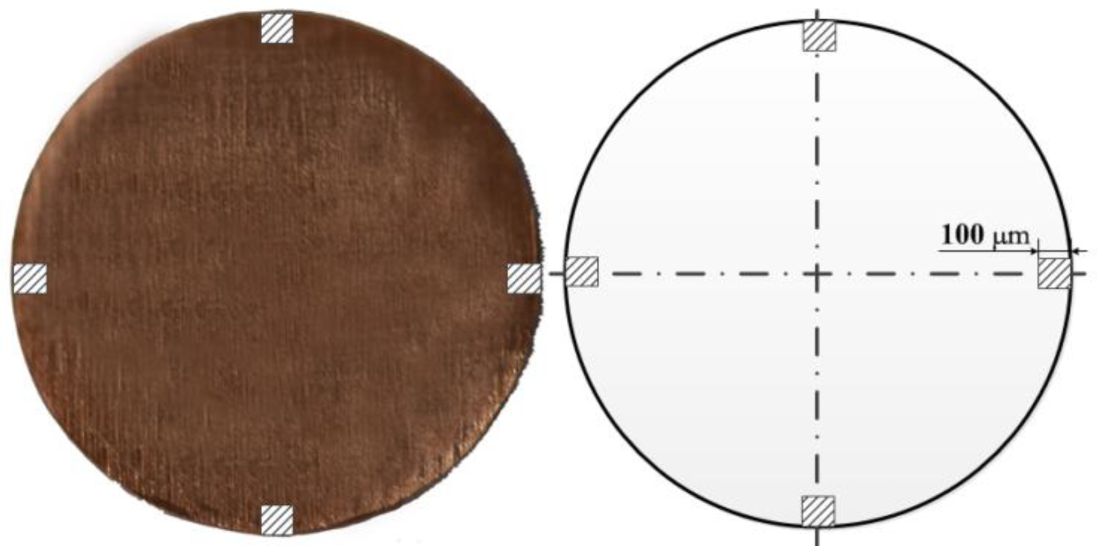
2.3. Polycrystalline Pure Copper Finite Element Simulation of the Upsetting Process

The micro-upsetting processes of pure copper with a 3D rough surface were simulated and analyzed to investigate the effect of grain size and grain orientations on the specimen surface roughness. In the simulation process, the diameter and the height of the specimen were set to 0.5 mm 1.5 mm, respectively. The grain sizes of the specimens were set to 30 μm, 50 μm, 80 μm, and 120 μm. One-eighth of the specimens were used for simulation, and the numbers of grains in the specimens were 681, 147, 36, and 11. As shown in Table 1, volume fractions for different grain orientations were set as 0.06, 0.22, and 0.72 for <411>, <100>, and <111> orientations, respectively. Four 3D surfaces with different initial roughness values were set in the simulation. The values of the roughness for the four 3D surfaces were 0 μm corresponding to an ideal plane surface, 0.7917 μm, 1.6131 μm, and 3.1152 μm. Three different 3D rough surface contours at the same surface roughness were randomly generated to decrease the experimental error. Figure 2 shows the assignment results with a random grain orientation of the model.
Considering the variation of material properties at the microscale, 10 random grain orientations were generated to investigate the effect of grain orientations on specimen roughness. Figure 3 depicts different grain orientations with the grain size of 50 μm.
The material constitutive model developed in Section 2.2 was adopted during the simulation of the micro-upsetting process. Moreover, the friction model used in this work is the Coulomb friction model based on the Wanheim/Bay friction model transformation [24]. The friction coefficient is a function related to the normal pressure of the contact surface. According to the symmetry condition, the left and lower ends of the specimen were set as the left–right and the upper–lower symmetric boundary condition, respectively. The upper die displacement was set downward along the Z direction with a 20% deformation. After the deformation, the coordinates of the specimen surface contours were extracted by postprocessing. According to Equation (1), the variation of the surface morphology roughness after deformation was calculated. The contact area of the specimen surface was divided by mesh refinement. Figure 4 exhibits the developed simulation model and its mesh generation.

3. Results and Discussions

3.1. Numerical Analysis Results

Based on the simulation results of the micro-upsetting deformation process, the effects of initial surface roughness, grain sizes, and grain orientations on the evolution of the surface roughness of specimens were analyzed in this work.

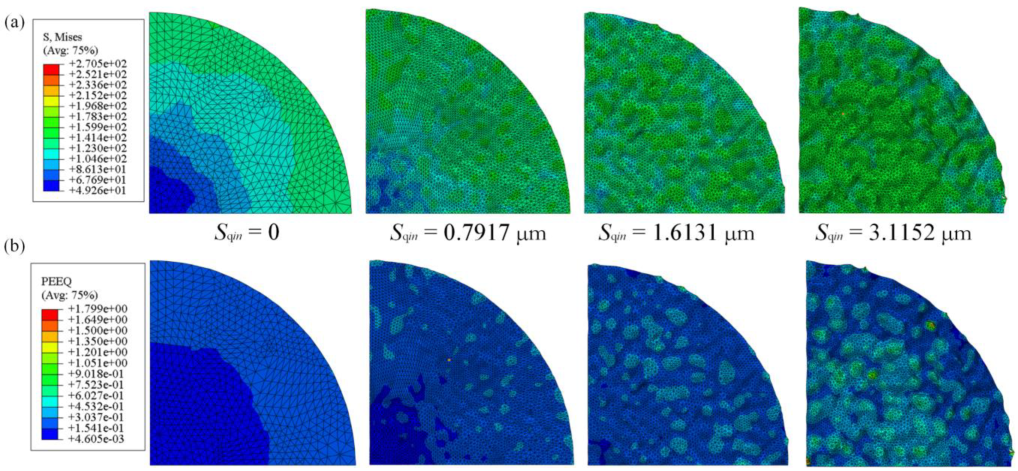
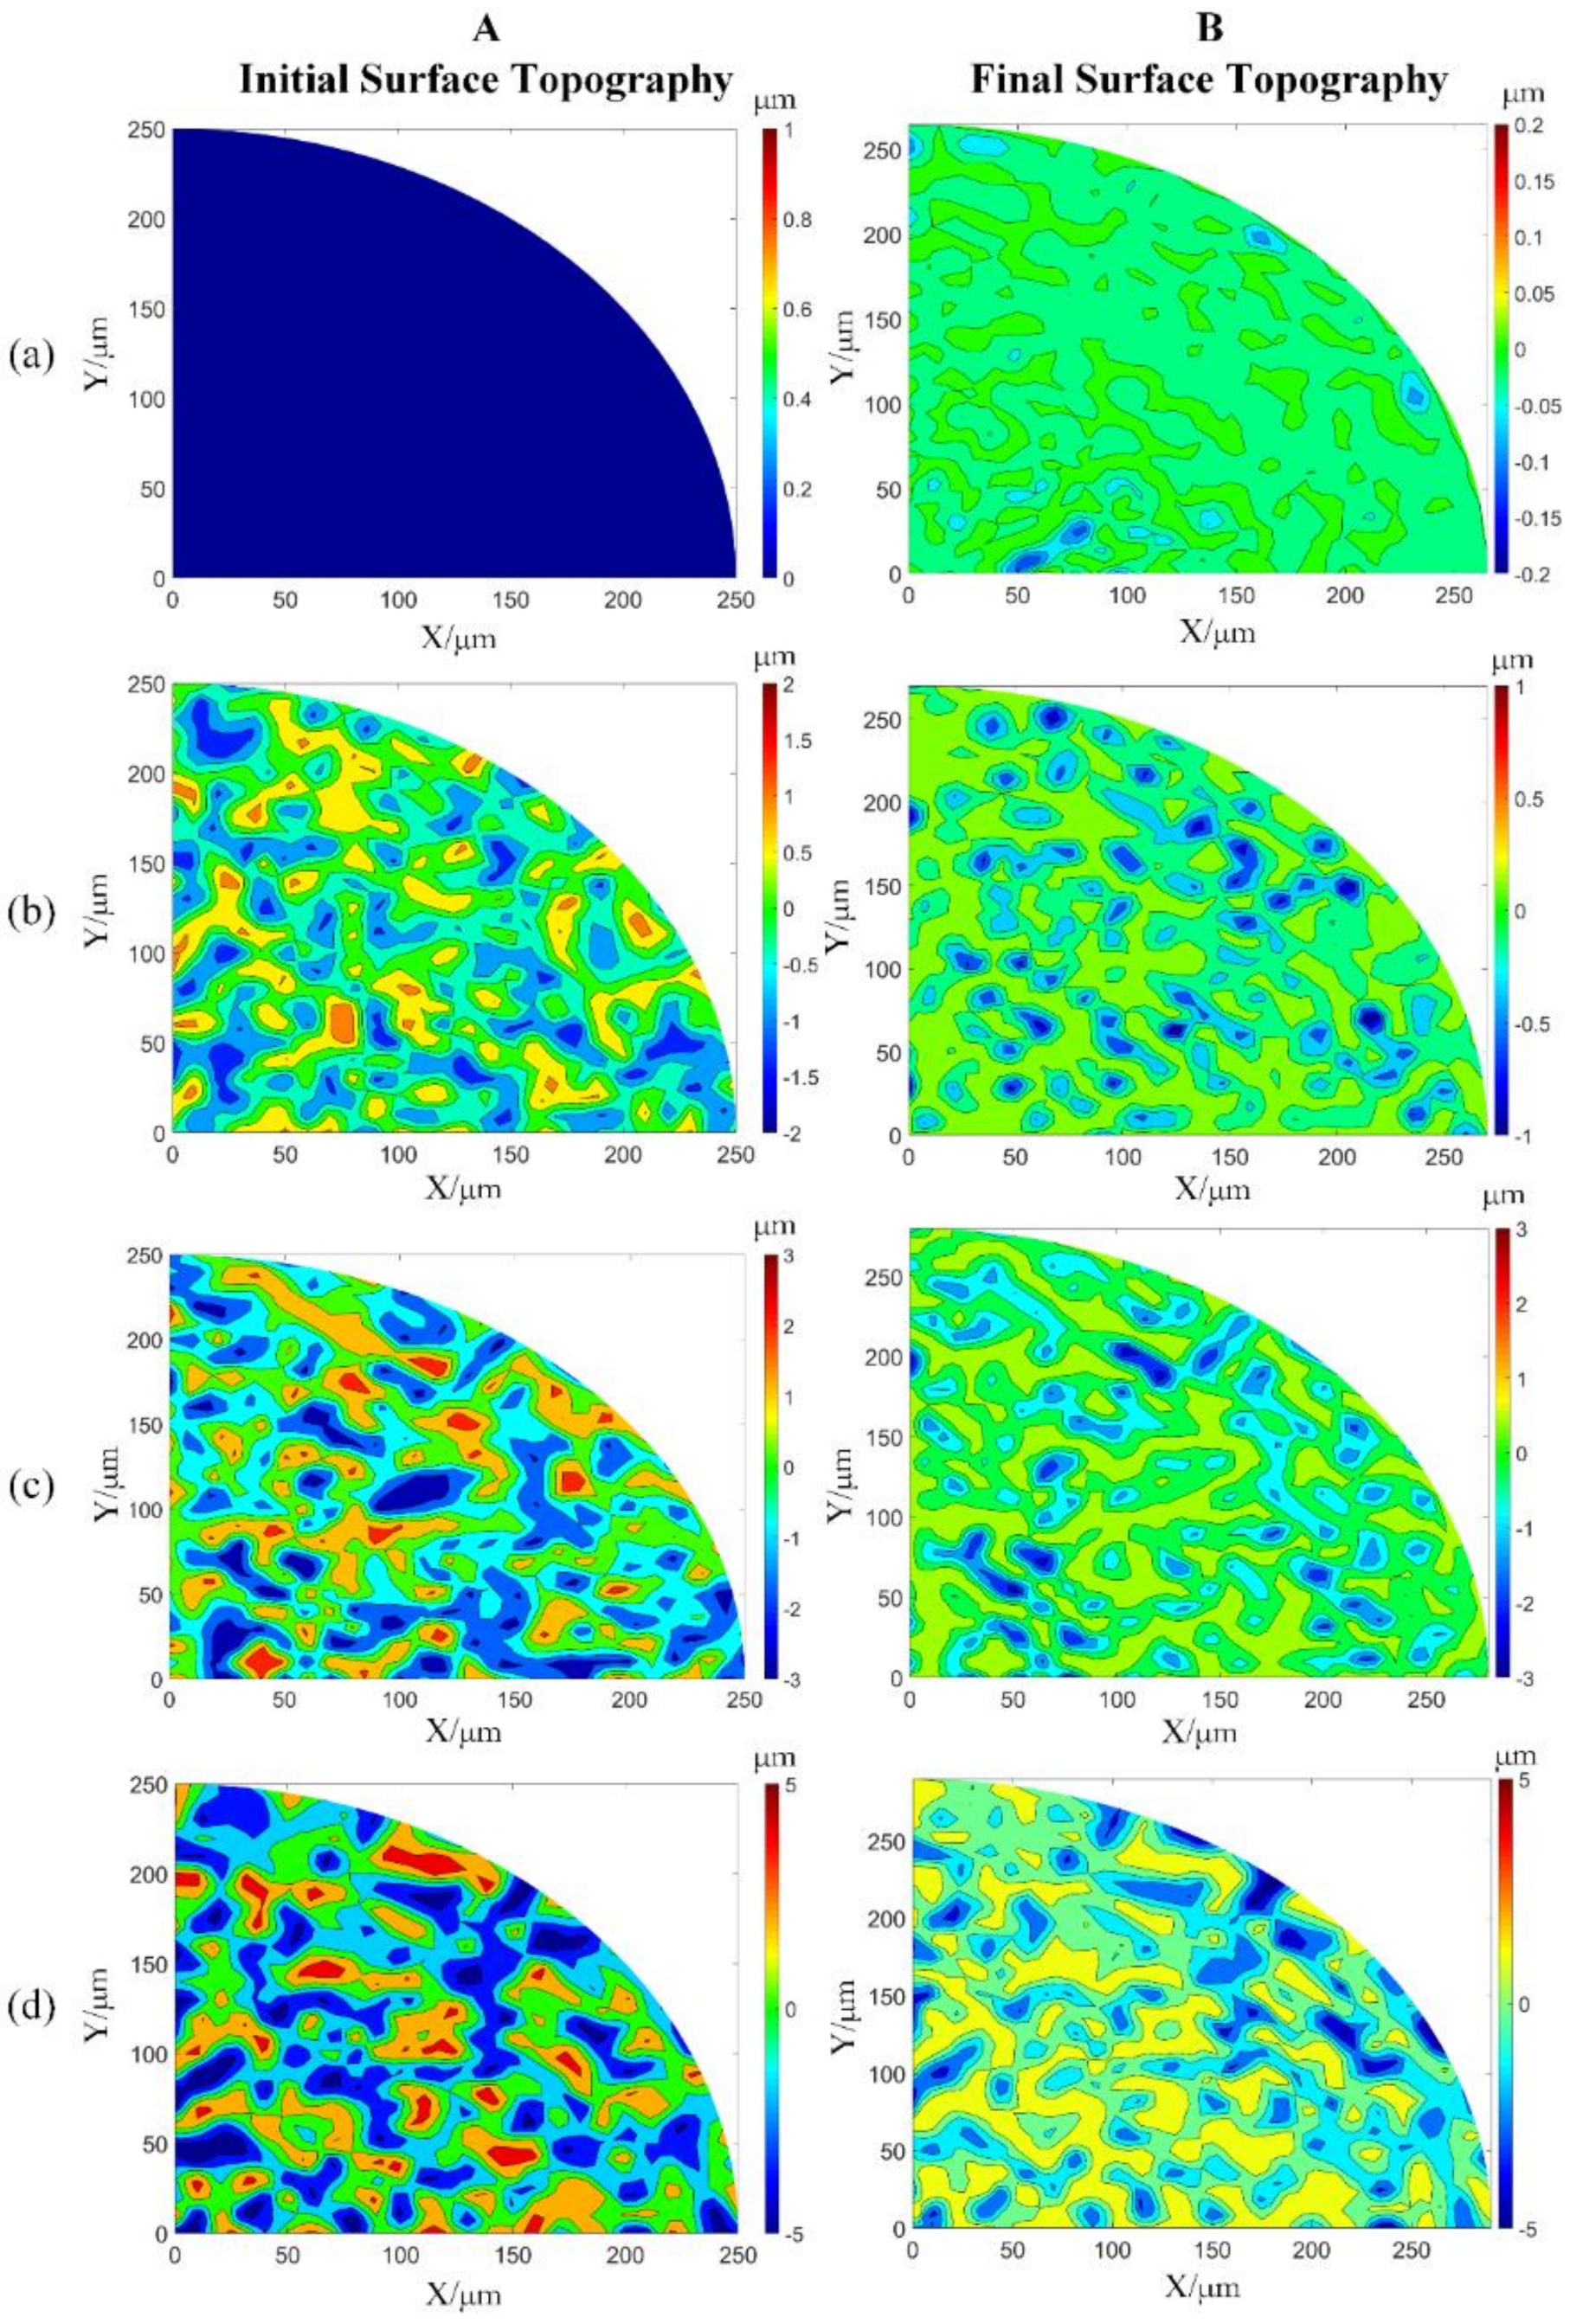
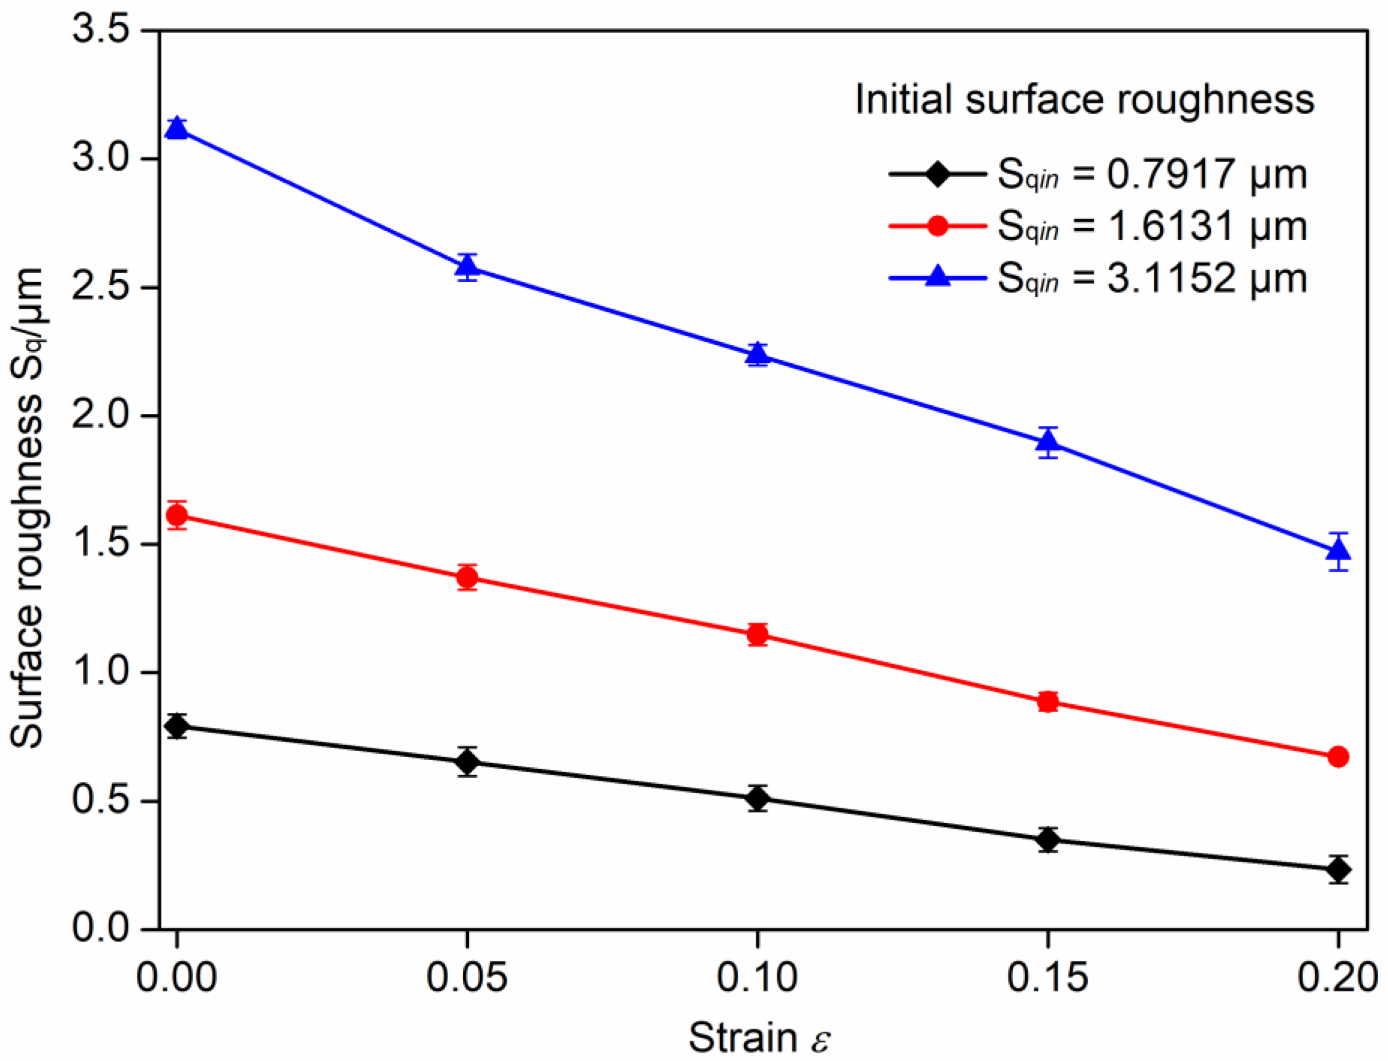
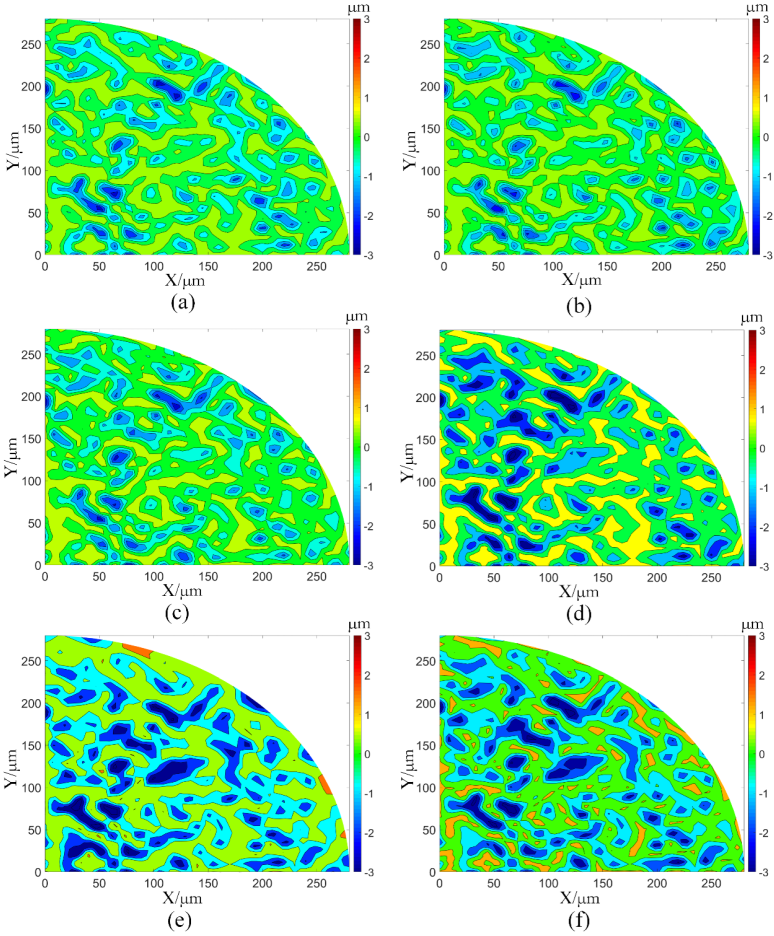
3.1.1. Effect of Initial Surface Roughness of Specimen on the Evolution of Contact Surface Roughness

According to the research of Wanheim and Bay [25], when the surface roughness of the mold is fixed, the shear film strength coefficient mc is mainly determined by the specimen initial roughness. Based on the previous research work of the authors [10,24], the relationship between the friction coefficient and the contact normal pressure under different initial surface roughness is determined. When the reduction in the upsetting is 20%, the equivalent stress and strain distribution of the specimens under different initial surface roughness are shown in Figure 5a,b, respectively. It depicts that the distribution of stress and strain increases with the initial surface roughness. During the deformation process, the actual contact area of the specimen surface with a high degree of initial surface roughness is smaller, resulting in the larger stress and strain of the micro-asperities on the contact surface under the same deformation. The larger the stress and strain of the micro-asperities on the contact surface, the more prone it is to plastic deformation.
The surface morphologies of deformed specimens under various initial roughness are shown in Figure 6a–d. Section “A” of Figure 6 shows the initial surface morphology, and section “B” reveals the final surface morphology with an upsetting reduction of 20%. When the material undergoes plastic deformation, a single micro asperity can only bear contact pressure proportional to the material’s yield stress. The increasing number of micro-asperities that enter the contact state and undergo plastic deformations make the surface flatter. In addition, it was also found that surface roughness is an inevitable phenomenon in the deformation process. Even if the initial surface roughness of the specimen and the die is zero, a specific roughness value will still appear after deformation. This is a result of the orientation difference between adjacent grains leading to the local strain concentration on the specimen surface during the deformation process.
By calculating the coordinates of the surface nodes in the Z-axis direction, the variation of the specimen surface roughness under a different initial roughness was obtained, as described in Figure 7. When upsetting reduction gradually increases from 0% to 20%, that is, the deformation strain ε   varied from 0 to 0.2, the surface roughness of the specimen with initial values of 0.7917 μm, 1.6131 μm, and 3.1152 μm gradually decreases to 0.2332 μm, 0.6733 μm, and 1.4709 μm. The roughness change is 0.5585 μm, 0.9398 μm, and 1.6443 μm. It means that with the increase in deformation, if the initial surface roughness of the specimen is high, the variation of the surface roughness after deformation will also be high. From the microscopic view, the actual contact area of the rough surface with fractal characteristics is much smaller than the nominal contact area, leading to a high value of actual contact pressure on the micro-asperities in real contact. With more plastic deformation to the micro-asperities, the workpiece has considerable change in its surface roughness.

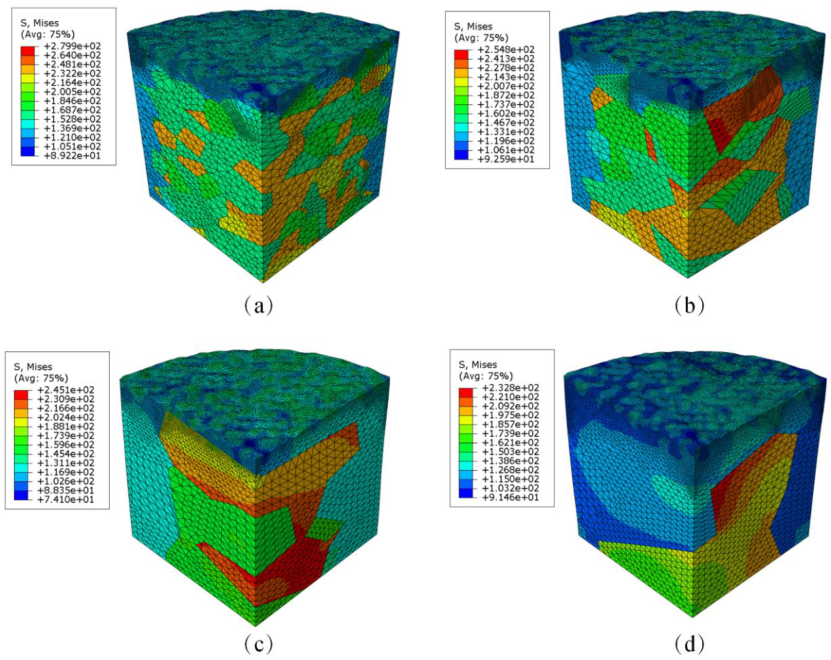
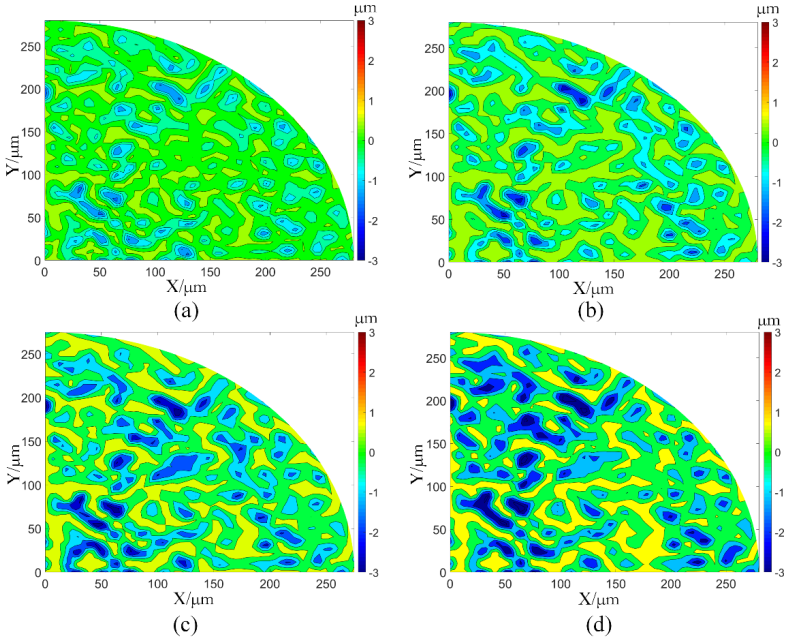
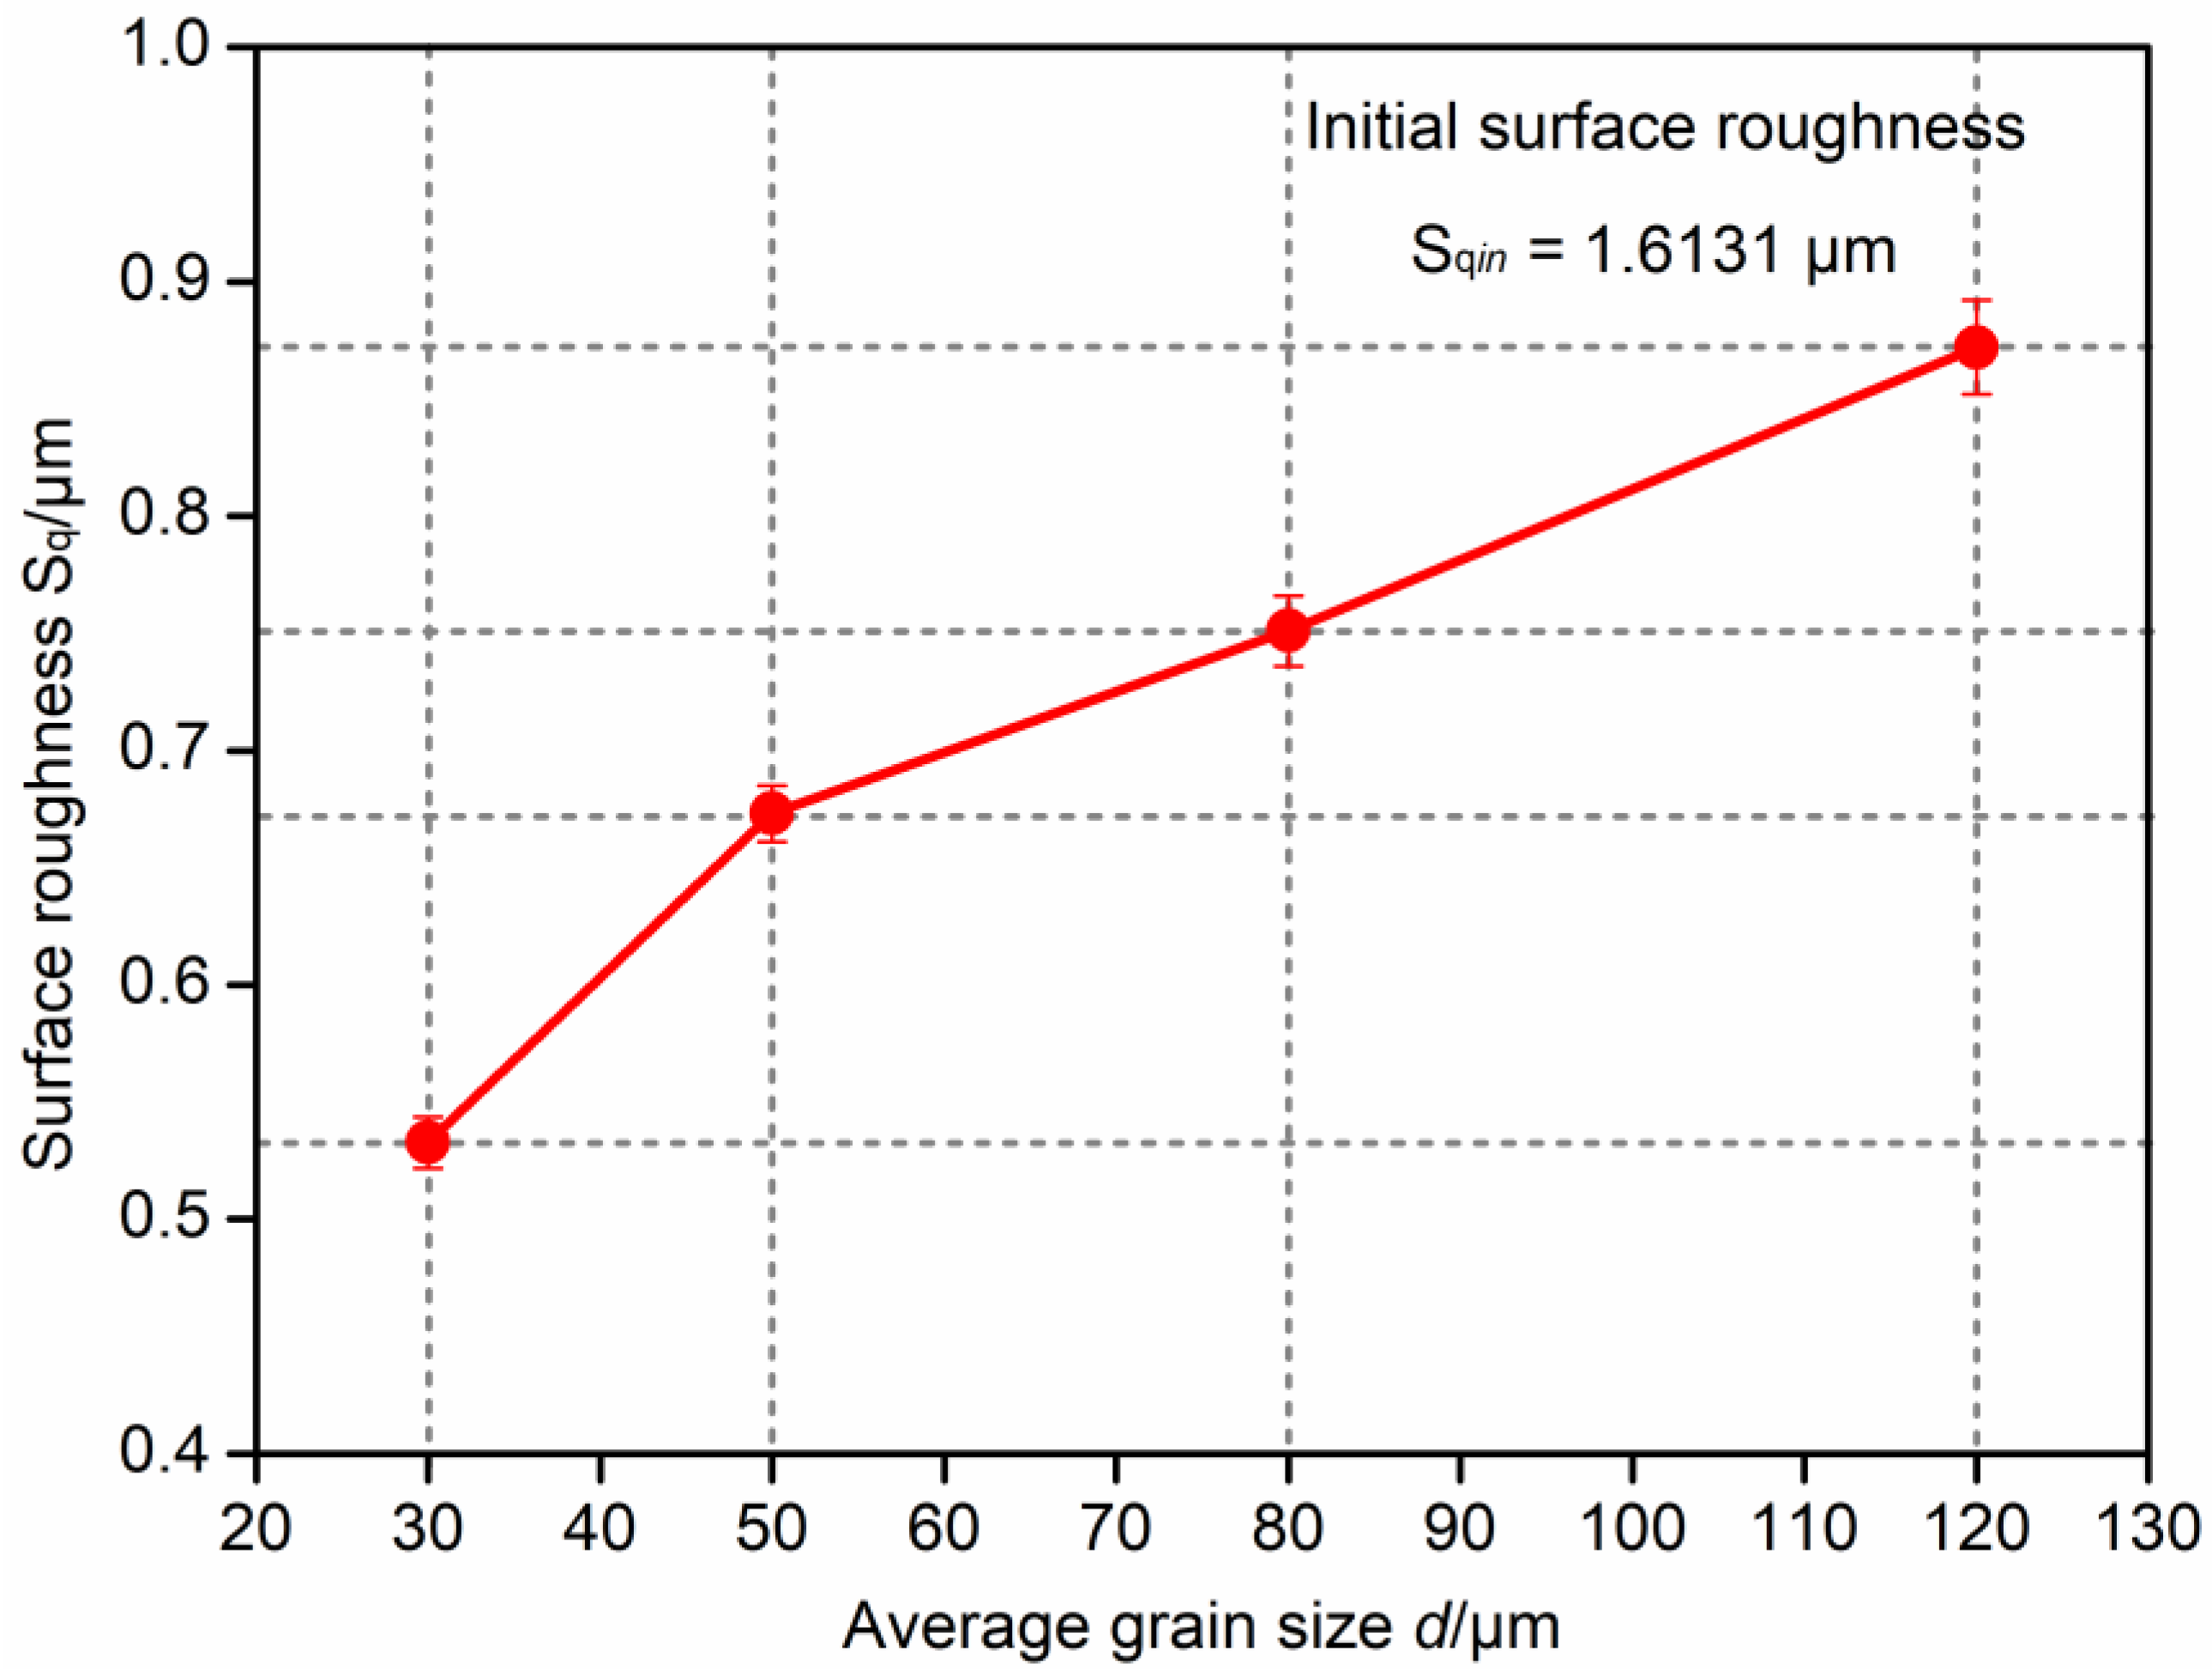
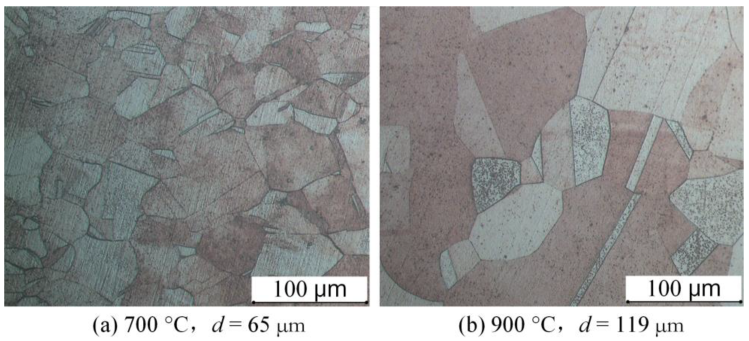
3.1.2. Effect of Grain Size on the Evolution of Contact Surface Roughness

Figure 8 exhibits the equivalent stress of deformed specimens for different grain sizes. It shows that with the increase in grain sizes, the flow stress of the material decreases gradually. The coarse grains increase the proportion of the surface layer grains gradually. The constraint of surface grain is smaller than that of internal grain. At the same time, the larger grain sizes weaken the deformation coordination between grains. The specimen deformation is significantly affected by the properties of single grain. Hence, with the coarse grain sizes, the specimen surface roughness become more irregularity after the micro compression process.
The contact surface morphologies of the deformed specimens with different grain sizes were obtained by extracting the node coordinates of the surface profile in the Z-axis direction. Let us take one of the three random morphologies as an example. Figure 9a–d show the surface morphologies for different grain sizes when the reduction amount is 20%. As the grain size increases, the flattening effect of surface asperities weakened, leading to the rougher surface of the specimen. The surface roughness for different grain sizes was calculated according to Equation (1). The surface roughness of the specimens changed from 1.6131 μm to 0.5327 μm, 0.6733 μm, 0.7512 μm, and 0.8720 μm corresponding to the grain sizes of 30 μm, 50 μm, 80 μm, and 120 μm, respectively, as depicted in Figure 10. Hence, with the increase in grain sizes, the specimen roughness increases gradually. In the deformation process, the grain sizes significantly impact the strain distribution in the material. Under the same deformation conditions, as the grain becomes smaller and smaller, the strain near the grain boundary becomes closer to the inside grain. Compared with the coarse grain, the deformation with fine grain becomes more uniform, and the corresponding surface roughness after deformation is lower.

3.1.3. Effect of Grain Orientation on the Evolution of Contact Surface Roughness

Based on the change in material properties at the micro-scale, the 3D Voronoi method was used to develop the finite element models. Ten random grain orientations were generated under the same grain size. The micro-upsetting simulation processes investigated the effect of grain orientations on the specimen roughness. Figure 11 shows the surface morphology of three specimens with different grain orientations (represented by #1, #2, and #3) corresponding to the grain sizes of 50 μm and 120 μm, respectively. The increasing grain sizes resulting in the increase in the uneven degree of stress on the surface micro-asperities. Accordingly, the degree of variation of surface roughness also increases.
In this paper, Gaussian distribution was used to characterize the effect of grain orientation on surface roughness [26]. Its expression is given below.
F S q = 1 2 π β exp S q γ 2 2 β 2 .
where Sq is the value of the roughness, β is the roughness standard deviation of the normal distribution, and γ is the roughness expected value of the normal distribution. With the grain sizes of 50 μm and 120 μm, the probability distributions of specimen surface roughness with random grain orientations are shown in Figure 12a,b. When the average grain size is 50 μm, the average value of surface roughness for different grain orientations is 0.6764 μm. The standard deviation is 0.0166, and the surface roughness distribution is relatively concentrated. Moreover, when the grain size is 120 μm, the average roughness under various grain orientations becomes 0.8602 μm. The standard deviation is 0.1145, and the roughness distribution is relatively discrete. In the micro-forming process, the increase in grain size reduces the number of grains in the surface layer, and the influence of single grain orientation on the deformation process increases. In addition, the coordination between the surface layer grains become worse, which also increases the deformation inhomogeneity. Finally, the difference in heights of the surface profiles and the variation range of surface roughness increases. In short, the effect of grain orientations on the surface roughness of the deformed specimens gradually increases with the increase in the grain size.

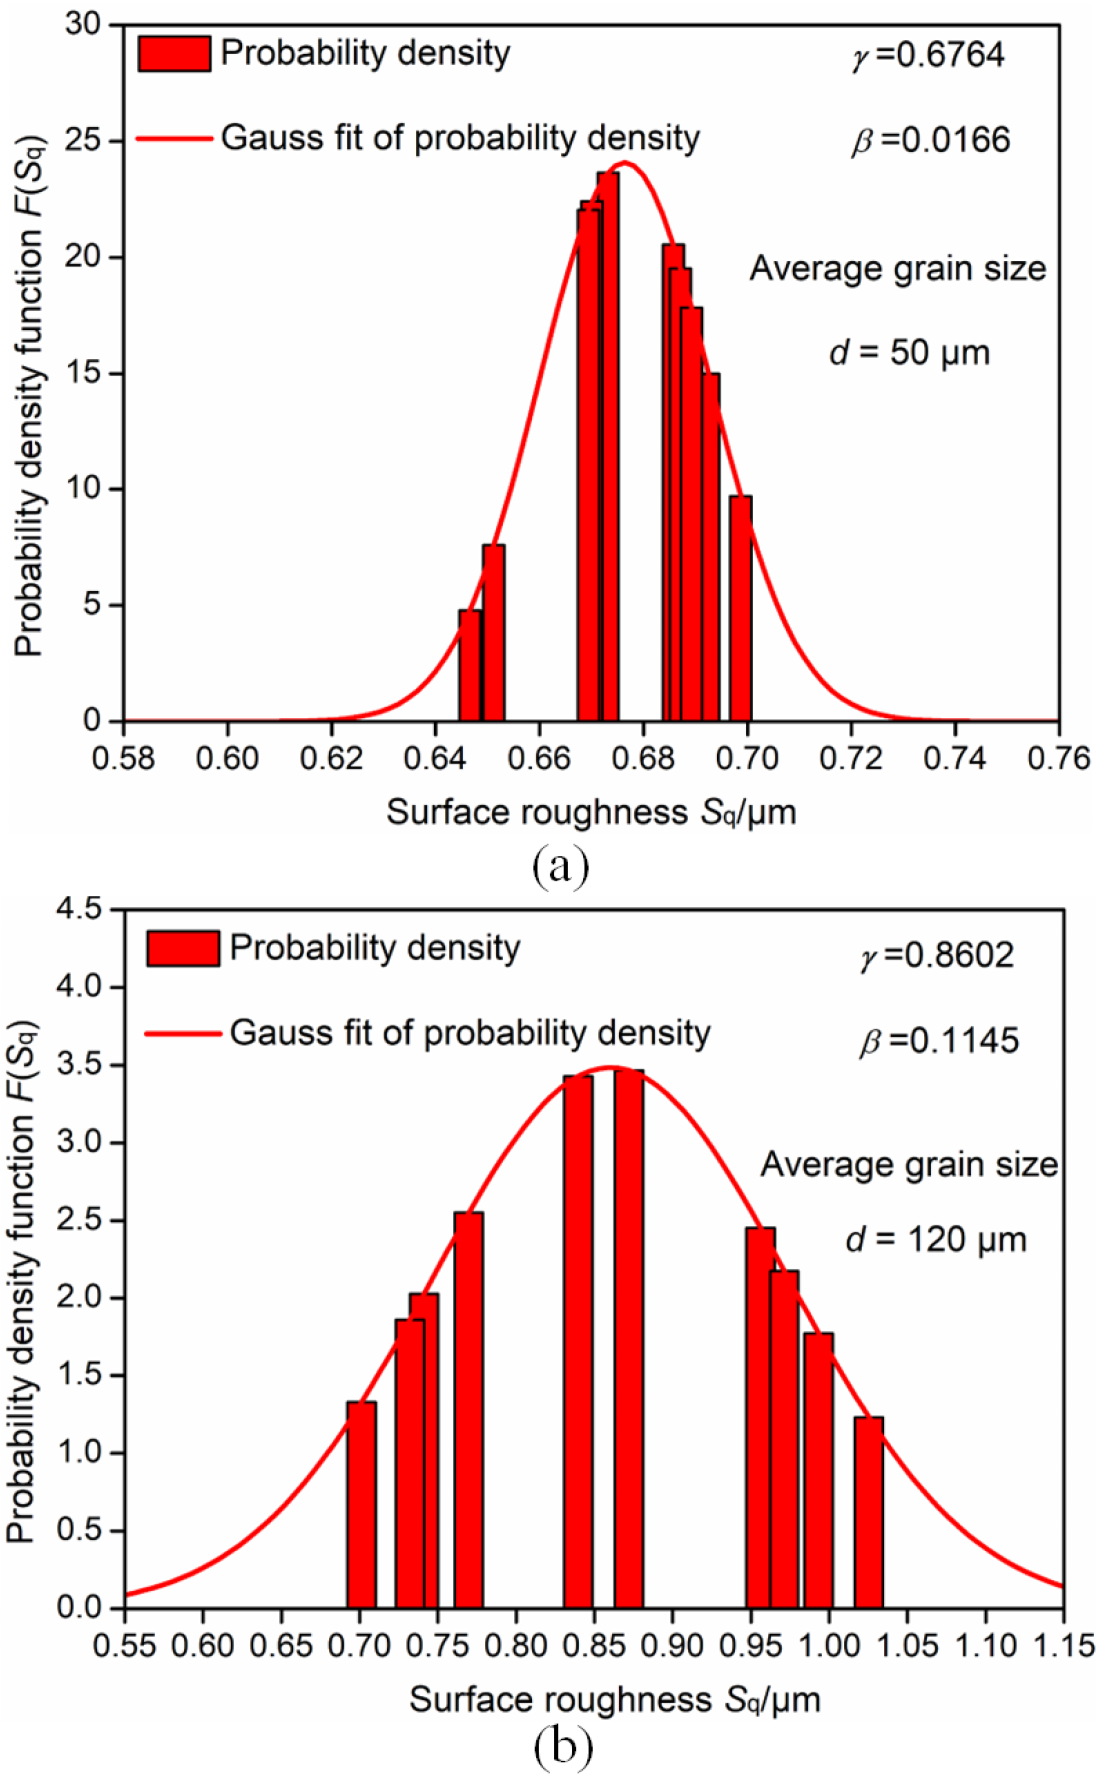
3.2. Quantitative Description of Surface Roughness Variation Caused by Size Effect

According to our previous research on the influencing factors of surface roughness in forming bulk metal [10], the normal pressure on the contact surface directly affects the surface roughness of the resulting deformed product. The discussion in Section 2.2 shows that the increase in grain size in the micro-upsetting process leads to the reduction in the overall flow stress of the material, thus reducing the normal pressure on the contact surface. Therefore, on the basis of the previously developed roughness prediction model for bulk metal forming, in this paper, we investigate the influence of size effect on the contact normal pressure between the specimen and the die by introducing the scale parameters. Then, the quantitative description of the influence of size effect on the surface roughness change was observed.

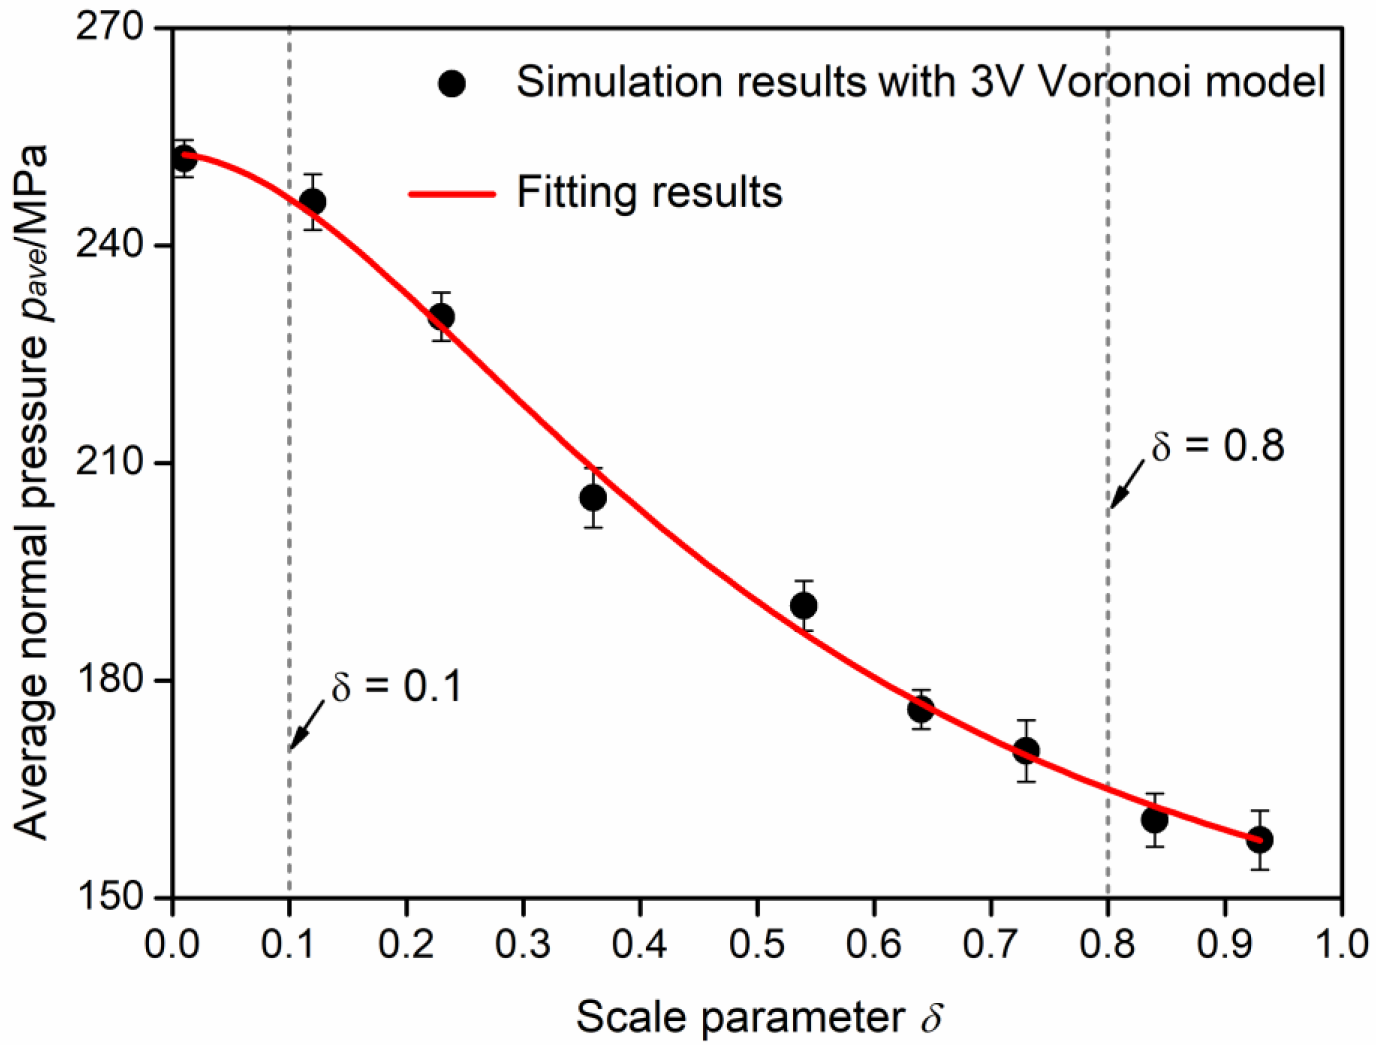
3.2.1. Influence of Size Effect on Normal Pressure of Contact Surface

The proportion of the surface layer grains numbers to the total grain numbers was introduced to study the influence of size effect on the normal pressure. The relative mathematical is as follows.
δ = 1 D 2 d 2 D 2 .
where D and d are the specimen size and average grain size, respectively, as shown in Figure 13. The range of scale parameter is 0 < δ < 1. For micro-formed parts, when the grain size gradually approaches the specimen size (D > 2d), the scale parameter gradually approaches 1.
Table 2 shows the grain sizes and the corresponding scale parameters for the fixed geometric sizes in simulation process. The model of the materials and the boundary conditions in the simulations were consistent with those in Section 2.2. The deformation reduction for different scale parameters was set as 20%. The average normal pressure of the specimen after deformation was calculated by the simulation results of three random grain orientations for each size parameter. As depicted in Figure 14, a decreasing trend of the average normal pressure exhibits with the increased scale parameters. When the scale parameter δ is below 0.1, the normal pressure has a minor change with the scale parameters. For δ greater than 0.1, the continuous decrease in the flow stress causes the normal pressure on the contact surface to decrease rapidly. As δ larger than 0.8, the variation of the normal pressure with the changing of scale parameters becomes slow. In the plastic deformation process, the increase in contact normal pressure of the specimen leads to a decrease in surface roughness. The size effect of the surface roughness during the micro-compression is mainly determined by the size effect of the normal pressure. For 0.1 < δ < 0.8, the specimen roughness increases with the increase in the scale parameters, and there is an apparent size effect. For the δ < 0.1 or δ > 0.8, the size effect of surface roughness becomes insignificant.

3.2.2. Development of Roughness Prediction Model in Micro-Forming Based on 3D Voronoi Model

A nonlinear fitting was performed to quantify the influence of size effect on surface roughness according to Figure 14. The relationship between the contact normal pressure and the scale parameter was obtained using Equation (6).
P m i c = 0.496 P m a c + 0.154 P m a c 0.304 + δ 1.81 .
pmic is the average normal pressure for micro forming with the consideration of size effect, and pmac is the normal pressure for macro forming regardless of size effect. Based on our previous work in the literature [10], a roughness prediction model for micro-formed parts is developed and represented by the equations below.
S q = S q i n 0.0013 P m i c S q i n 0.158 1 + 10 1.12 0.0093 P m i c 1 0.0089 L / P m i c 0.213 φ 0.611 P m i c = 0.496 P m a c + 0.154 P m a c 0.304 + δ 1.81
Sq represents the surface roughness of the deformed specimen. L is the sliding distance between the workpiece and the die. φ is the growth rate of the contact surface area. The previous report has detailed all the above parameters [10].
Above all, for the micro-formed parts, the surface roughness of the workpiece is mainly affected by multiple factors. The increase in normal pressure, the relative sliding distance, and surface area growth rate on the contact surface positively improve the workpiece’s surface roughness. However, with the increase in grain size, the contact surface’s normal pressure decreases gradually, which is detrimental to improve surface quality of micro-formed parts.

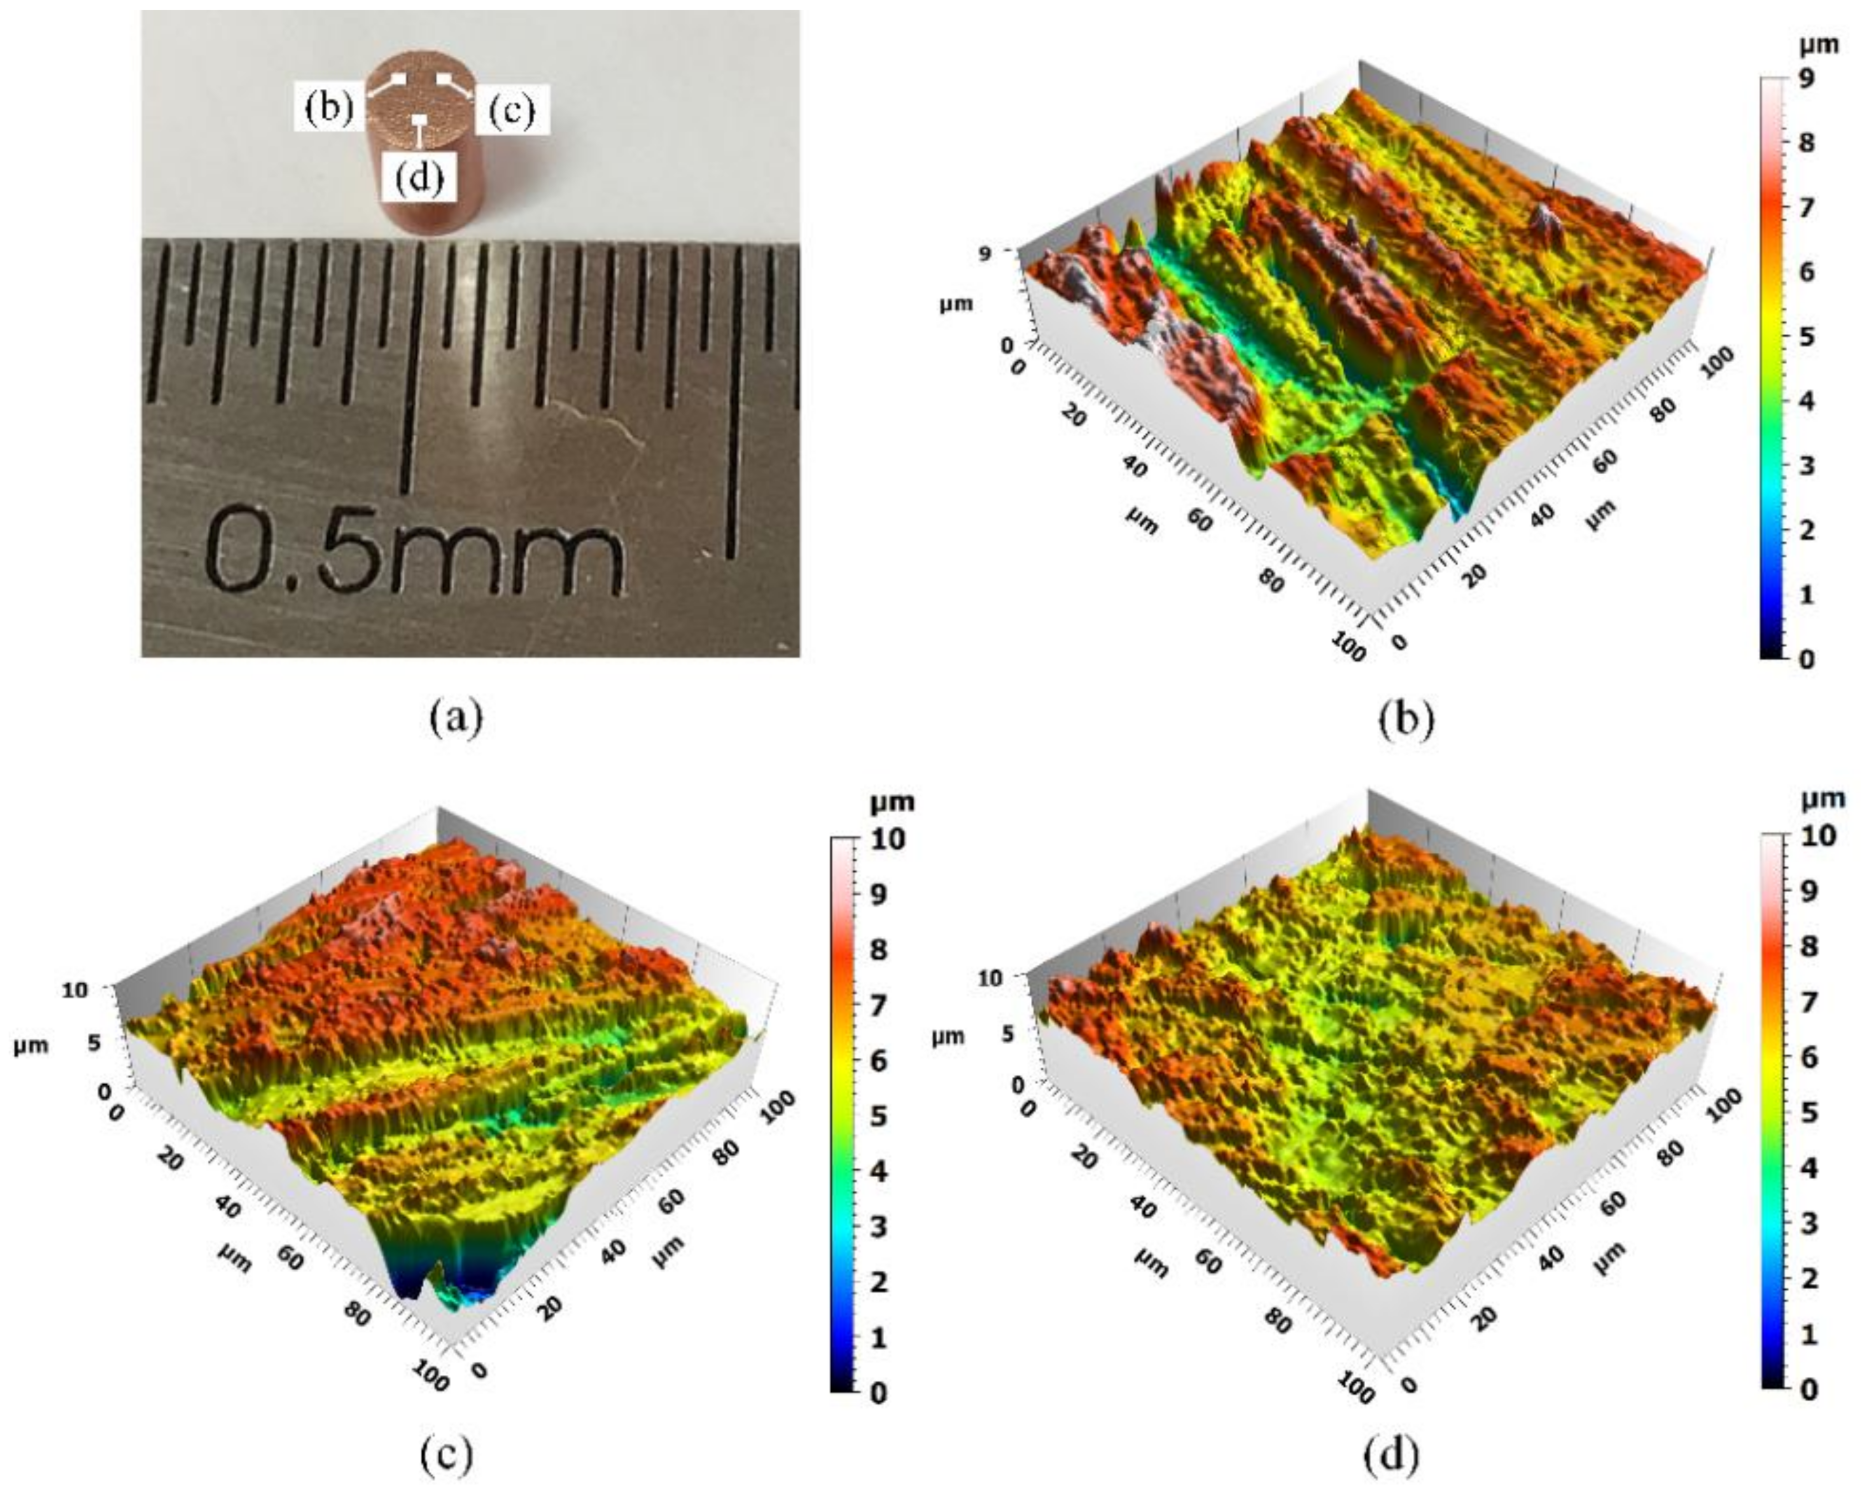
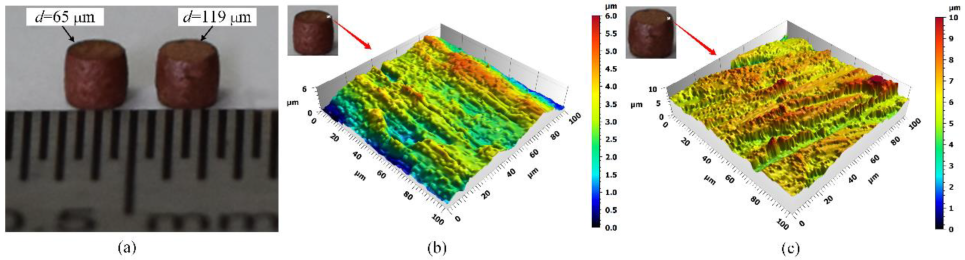
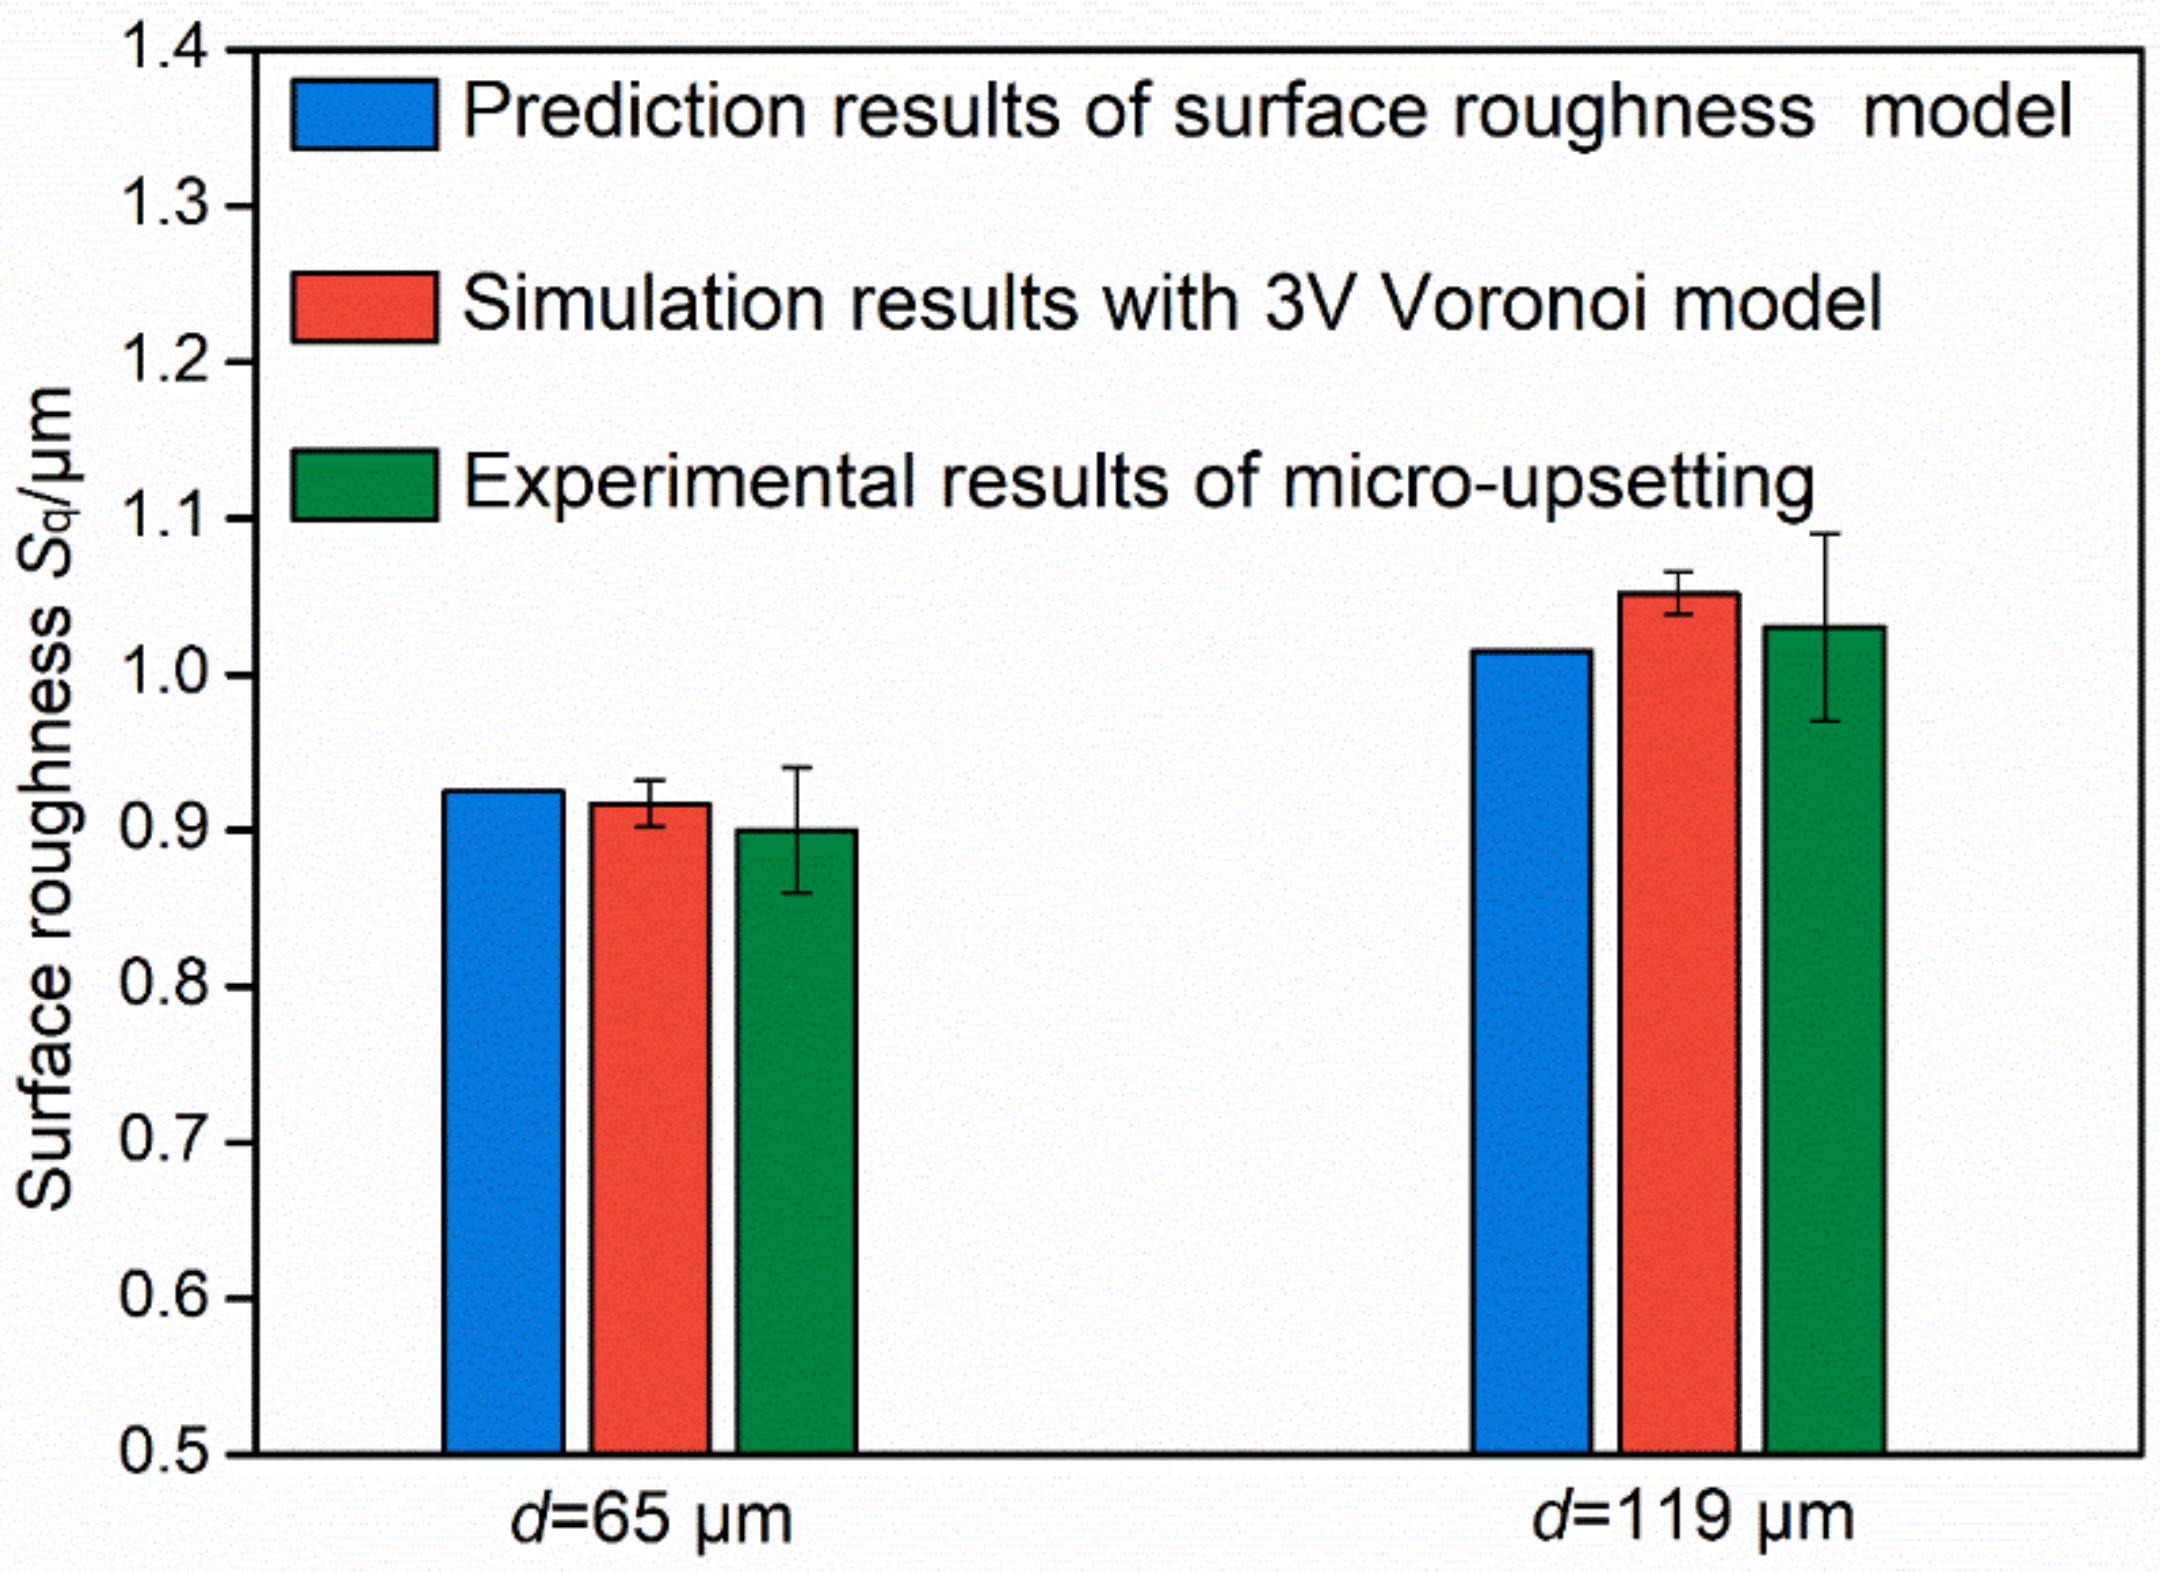
3.2.3. Verification of Roughness Prediction Model for Micro-Forming

The micro-compression experiments of pure copper for different grain sizes were carried out to testify the established roughness prediction model d. The cylindrical specimens of pure copper with a diameter of 1.5 mm and a height to diameter ratio of 1.5:1 was selected. The NBD-T1500 vacuum tube furnace was used to conduct two annealing heat treatment processes at 700 °C and 900 °C for one hour under the protection of argon gas. The average grain sizes of the specimens were measured to be 65 μm and 119 μm, as shown in Figure 15. The upper and lower end surfaces of the heat-treated specimens were polished to the same roughness after ultrasonic decontamination. The roughness at various positions on the specimens’ surface was measured using the VEECO NT9300 optical contour instrument. Figure 16a–d show the surface roughness profiles in different regions. The average roughness Sqin of the pre-treated cylindrical specimen was measured to be 1.57 μm.
In the micro-upsetting experiment, to reduce the effect of the die surface roughness on the surface quality of the deformed specimen, a set of gaskets with the roughness of 0.2 μm were adopted. Their surface roughness is much lower than the specimen surface roughness. The specimen was placed between two gaskets, and the CMT5105 electronic universal testing machine was used for the upsetting experiment at room temperature under dry friction conditions. Figure 17a,b show the experimental setup and the surface of the upper and lower gaskets used in the experiment, respectively. The deformation was set at 20%, and the low constant strain rate was set at 0.0003/s. Each group of parameters was repeated three times to reduce the experimental error. And four different locations were measured on each group of specimen surface. The surface roughness measurement area and its size diagram are presented in Figure 18.
Figure 19a,b present the surface roughness topography of the specimens and their measurement areas after deformation for different grain sizes with a deformation of 20%. The measurement results denoted that the specimen roughness is 0.90 μm with grain sizes of 65 μm, and 1.03 μm with grain sizes of 119 μm. The specimen roughness with larger grain sizes is becoming rougher after deformation under the same deformation conditions.
Through the simulation of micro-upsetting process under the same conditions as the experiment, the contact normal pressures were extracted, and the average normal pressure pmic under different grain sizes was calculated. By measuring the surface diameter of the specimen after deformation, the relative sliding distance L and the surface area growth rate φ between the specimen and the die can also be obtained. Combined with Equation (7), the roughness prediction results, the simulation results of the 3D Voronoi model, as well as the experimental results, are given in Figure 20. Because the 3D Voronoi model adopted in the simulation process cannot fully reflect the specimen grain orientations, the prediction results of surface roughness models for two different grain sizes have certain deviations from the experimental values, with deviations of 1.46% and 2.78%, which are within the acceptable error range. Considering the size effect, the established surface roughness prediction model can better predict the surface roughness of formed parts in micro-forming. Meanwhile, the research results in this paper also show that the grain size increase adversely impacts the surface roughness of the micro-formed parts. Consequently, to improve the surface roughness of the micro-formed parts, the grain refinement treatment should be conducted to avoid the increase in the surface roughness due to the large grain size of the bulk.

4. Conclusions

In this paper, in order to realize the quantitative description of surface roughness changes during the deformation process of micro-formed parts, the effects of initial surface roughness, average grain sizes, and grain orientations on the surface roughness of the specimen were analyzed. The influence of the size effect on the specimen surface roughness was quantified and a roughness prediction model with multi-factors for micro-formed parts was developed. The main conclusions of this paper are given below.
(1)
The finite element model of polycrystalline pure copper with a 3D rough surface was developed. The simulation results show that the variation in the specimen roughness increases when the increase in initial specimen roughness. Moreover, the increase in grain size leads to the gradual increase in the specimen roughness after deformation. At the same time, the effect of grain orientations on surface roughness enhances with coarse grains.
(2)
The scale parameter was adopted to characterize the influence of size effect on the contact normal pressure and the surface roughness. As the scale parameter increases, the average contact normal pressure decreases gradually. For the scale parameter 0.1 < δ < 0.8, the surface roughness increases with the increase in scale parameter, which shows an apparent size effect.
(3)
A roughness prediction model for micro-formed parts was developed. By comparing with the surface roughness measurement results of micro-upsetting specimens with different grain sizes, the rationality and applicability of the established prediction model were verified. The established model can be used to predict and control the surface roughness of micro-formed parts, especially for the parts affected by size effect during deformation process.

Author Contributions

Formal analysis, J.H. and W.Z.; Investigation, J.H., W.Z. and Q.C.; Methodology, J.H.; Software, J.H., J.S. and S.X.; Writing—original draft, J.H.; Writing—review & editing, J.H. and W.Z. All authors have read and agreed to the published version of the manuscript.

Funding

This research was funded by Shandong Provincial Natural Science Foundation Grant number. ZR2020QE161 and No. ZR2021ME182, PhD Research Foundation of Shandong Jianzhu University (X20053Z0101).

Institutional Review Board Statement

Not applicable.

Informed Consent Statement

Not applicable.

Data Availability Statement

Not applicable.

Conflicts of Interest

The authors declare no conflict of interest.

References

  1. Huang, J.H.; Xu, Z.T.; Li, X.N.; Peng, L.F.; Lai, X.M. An experimental study on a rapid micro imprinting process. J. Mater. Process. Technol. 2020, 283, 116716. [Google Scholar] [CrossRef]
  2. Guo, N.; Wang, J.; Sun, C.Y.; Zhang, Y.F.; Fu, M.W. Analysis of size dependent earing evolution in micro deep drawing of TWIP steel by using crystal plasticity modeling. Int. J. Mech. Sci. 2020, 165, 105200. [Google Scholar] [CrossRef]
  3. Luo, L.; Jiang, Z.Y.; Wei, D.B.; Jia, F.H. A study of influence of hydraulic pressure on micro-hydromechanical deep drawing considering size effects and surface roughness. Wear 2021, 477, 203803. [Google Scholar] [CrossRef]
  4. Behrens, G.; Trier, F.O.; Tetzel, H.; Vollertsen, F. Influence of tool geometry variations on the limiting drawing ratio in micro deep drawing. Int. J. Mater. Form. 2016, 9, 253–258. [Google Scholar] [CrossRef]
  5. Rathmann, L.; Vollertsen, F. Determination of a contact length dependent friction function in micro metal forming. J. Mater. Process. Technol. 2020, 286, 116831. [Google Scholar] [CrossRef]
  6. Anand, D.; Kumar, D.R. Effect of sheet thickness and grain size on forming limit diagrams of thin brass sheets. Adv. Intell. Syst. Comput. 2019, 1, 435–444. [Google Scholar] [CrossRef]
  7. Sail, K.; Aouici, H.; Hassani, S.; Fnides, B.; Belaadi, A.; Naitbouda, A.; Abdi, S. Influence of tribological parameters on S335 steel filing Ti-W-N in dry sliding wear: Prediction model and sliding condition optimization. Int. J. Adv. Manuf. Technol. 2017, 92, 4057–4071. [Google Scholar] [CrossRef]
  8. Hiegemann, L.; Weddeling, C.; Tekkaya, A.E. Analytical contact pressure model for predicting roughness of ball burnished surfaces. J. Mater. Process. Technol. 2016, 232, 63–77. [Google Scholar] [CrossRef]
  9. Hiegemann, L.; Weddeling, C.; Khalifa, N.B.; Tekkaya, A.E. Prediction of roughness after ball burnishing of thermally coated surfaces. J. Mater. Process. Technol. 2015, 217, 193–201. [Google Scholar] [CrossRef]
  10. Han, J.J.; Zhu, J.; Zheng, W.; Wang, G.C. Influence of metal forming parameters on surface roughness and establishment of surface roughness prediction model. Int. J. Mech. Sci. 2019, 163, 105093. [Google Scholar] [CrossRef]
  11. Anand, D.; Shrivastava, A.; Ravi, K.D. Size Effect on Surface Roughness of Very Thin Brass Sheets in Biaxial Stretching. Mater. Today Proc. 2019, 18, 2448–2453. [Google Scholar] [CrossRef]
  12. Peng, L.F.; Xu, Z.T.; Gao, Z.Y.; Fu, M.W. A constitutive model for metal plastic deformation at micro/meso scale with consideration of grain orientation and its evolution. Int. J. Mech. Sci. 2018, 138, 74–85. [Google Scholar] [CrossRef]
  13. Kubo, M.; Nakazawa, Y.; Hama, T.; Takuda, H. Effect of Microstructure on Surface Roughening in Stretch Forming of Steel Sheets. ISIJ Int. 2017, 57, 2185–2193. [Google Scholar] [CrossRef] [Green Version]
  14. Kubo, M.; Hama, T.; Tsunemi, Y.; Nakazawa, Y.; Takuda, H. Influence of Strain Ratio on Surface Roughening in Biaxial Stretching of IF Steel Sheets. ISIJ Int. 2018, 58, 704–713. [Google Scholar] [CrossRef] [Green Version]
  15. Kishimoto, T.; Suematsu, S.; Sakaguchi, H.; Tashima, K.; Kajino, S.; Gondo, S.; Suzuki, S. Effect of crystal orientation on inner surface roughness of micro metal tubes in hollow sinking. Mater. Sci. Eng. A 2021, 805, 140792. [Google Scholar] [CrossRef]
  16. Yoshida, K. Effects of grain-scale heterogeneity on surface roughness and sheet metal necking. Int. J. Mech. Sci. 2014, 83, 48–56. [Google Scholar] [CrossRef]
  17. Wang, S.W.; Zhang, S.H.; Song, H.W.; Chen, Y. Surface roughness improvement of the bent thin-walled copper tube by controlling the microstructure and texture components. Procedia Manuf. 2020, 50, 613–617. [Google Scholar] [CrossRef]
  18. Han, J.J.; Zheng, W.; Xu, S.B.; Dang, G.H. The regionalized modelling and simulation of the micro-tensile process based on 3D Voronoi model. Mater. Today Commun. 2022, 31, 103614. [Google Scholar] [CrossRef]
  19. Sun, F.W.; Meade, E.D.; Dowd, O.N. Strain gradient crystal plasticity modelling of size effects in a hierarchical martensitic steel using the Voronoi tessellation method. Int. J. Plast. 2019, 119, 215–229. [Google Scholar] [CrossRef]
  20. Stout, K.J. Development of Methods for the Characterisation of Roughness in Three Dimensions; Penton Press: London, UK, 2000. [Google Scholar]
  21. Majumdar, A.; Tien, C.L. Fractal characterization and simulation of rough surfaces. Wear 1990, 136, 313–327. [Google Scholar] [CrossRef]
  22. Huang, X.; Borrego, A.; Pantleon, W. Polycrystal deformation and single crystal deformation dislocation structure and flow stress in copper. Mater. Sci. Eng. A 2001, 319, 237–241. [Google Scholar] [CrossRef]
  23. Clausen, B.; Lorentzen, T.; Leffers, T. Self-consistent modelling of the plastic deformation of FCC polycrystals and its implications for diffraction measurements of internal stress. Acta Mater. 1998, 46, 3087–3098. [Google Scholar] [CrossRef]
  24. Han, J.J.; Lin, Y.; Zheng, W.; Wang, G.C. Experimental and numerical investigations on size effect of friction in meso-/micro-forming without lubricant. Int. J. Adv. Manuf. Technol. 2020, 106, 4869–4877. [Google Scholar] [CrossRef]
  25. Wanheim, T.; Bay, N.; Petersen, A.S. A theoretically determined model for friction in metal working processes. Wear 1974, 28, 251–258. [Google Scholar] [CrossRef]
  26. Pan, S.; Han, Y.Y.; Wei, S.; Wei, Y.X.; Xia, L.; Xie, L.; Kong, X.R.; Yu, W. A model based on Gauss Distribution for predicting window behavior in building. Build. Environ. 2019, 149, 210–219. [Google Scholar] [CrossRef]
Figure 1. (a) The randomly generated roughness profile with a surface roughness of 1.6 μm; and (b) The 3D polycrystalline finite element model with initial roughness within 0.1 mm × 0.1 mm × 0.1 mm.
Coatings 12 01659 g001
Figure 2. Assignment results for random orientations assignment results of the finite element models with different grain sizes (a) d = 30 μm; (b) d = 50 μm; (c) d = 80 μm; and (d) d = 120 μm.
Coatings 12 01659 g002
Figure 3. Three different grain orientations with the grain size of 50 μm.
Coatings 12 01659 g003
Figure 4. The 3D polycrystal model and its mesh generation.
Coatings 12 01659 g004
Figure 5. The effect of initial surface roughness on (a) the stress distribution and (b) the strain distribution under different values of initial surface roughness.
Coatings 12 01659 g005
Figure 6. The surface morphology under different initial roughness after micro compression process (a) Sqin = 0 μm; (b) Sqin = 0.7917 μm; (c) Sqin = 1.6131 μm; and (d) Sqin = 3.1152 μm.
Coatings 12 01659 g006
Figure 7. Variation of surface roughness for different values of the initial surface roughness.
Coatings 12 01659 g007
Figure 8. The equivalent stress of the deformed specimen for different grain sizes (a) d = 30 μm; (b) d = 50 μm; (c) d = 80 μm; and (d) d = 120 μm.
Coatings 12 01659 g008
Figure 9. Surface morphology of specimens after deformation for different grain sizes; (a) d = 30 μm; (b) d = 50 μm; (c) d = 80 μm; and (d) d = 120 μm.
Coatings 12 01659 g009
Figure 10. Change in specimen roughness under various grain sizes.
Coatings 12 01659 g010
Figure 11. Surface morphology of the deformed specimens with various grain orientations; (a) d = 50 μm, #1; (b) d = 50 μm, #2; (c) d = 50 μm, #3; (d) d = 120 μm, #1; (e) d = 120 μm, #2; and (f) d = 120 μm, #3.
Coatings 12 01659 g011
Figure 12. Probability density function of roughness with random grain orientations. (a) d = 50 μm; and (b) d = 120 μm.
Coatings 12 01659 g012
Figure 13. Schematic diagram of specimen diameter and grain size.
Coatings 12 01659 g013
Figure 14. Changing of average normal pressure with scale parameters.
Coatings 12 01659 g014
Figure 15. Metallography of pure copper specimens with different heat treatments (a) 700 °C, d = 65 μm, and (b) 900 °C, d = 119 μm.
Coatings 12 01659 g015
Figure 16. Surface roughness of pretreated cylindrical specimen with (a) roughness measurement positions as (b) Sqin = 1.58 μm, (c) Sqin = 1.56 μm, and (d) Sqin = 1.57 μm.
Coatings 12 01659 g016
Figure 17. The micro-upsetting experiment with (a) experimental setup and (b) gasket surface.
Coatings 12 01659 g017
Figure 18. Surface roughness measurement area and its dimensions.
Coatings 12 01659 g018
Figure 19. (a) Specimens after deformation with different grain sizes; the surface topography of corresponding regions with different grain sizes: (b) d = 65 μm, Sq = 0.90 μm; and (c) d = 119 μm, Sq = 1.03 μm.
Coatings 12 01659 g019
Figure 20. Comparison between model prediction, simulation, and experimental results for different grain sizes.
Coatings 12 01659 g020
Table 1. Volume fractions and orientation factors for three different grain orientations.
Type <411>Type <100>Type <111>
Volume fraction (λ)0.060.220.72
orientation factor (M)2.642.453.67
Table 2. Grain sizes and the scale parameters in the micro compression simulation process.
Grain size d/μm305080100120150180
Scale parameter δ0.230.360.540.640.730.840.92
Publisher’s Note: MDPI stays neutral with regard to jurisdictional claims in published maps and institutional affiliations.

