Article

Discrimination of Steel Coatings with Different Degradation Levels by Near-Infrared (NIR) Spectroscopy and Deep Learning

1
School of Computer Science and Technology, Harbin Institute of Technology Shenzhen Graduate School, Shenzhen 518055, China
2
Central Research Institute of Building and Construction (Shenzhen) Co., Ltd., MCC Group, Shenzhen 518066, China
*
Author to whom correspondence should be addressed.
Coatings 2022, 12(11), 1721; https://doi.org/10.3390/coatings12111721
Submission received: 14 October 2022 / Revised: 7 November 2022 / Accepted: 8 November 2022 / Published: 11 November 2022

Abstract

:
Assessing the current condition of protective organic coatings on steel structures is an important but challenging task, particularly when it comes to complex structures located in harsh environments. Near-infrared (NIR) spectroscopy is a rapid, low-cost, and nondestructive analytical technique with applications ranging from agriculture, food, and remote sensing to pharmaceuticals. In this study, an objective and reliable NIR-based technique is proposed for the accurate distinction between different coating conditions during their degradation process. In addition, a state-of-the-art deep learning method using a one-dimensional convolutional neural network (1-D CNN) is explored to automatically extract features from the spectrum. The characteristics of the spectrum show a downward trend over the entire wavenumber period, and two major absorption peaks were observed around 5250 and 4400 cm−1. The experimental results indicate that the proposed deep network structure can powerfully extract the complex characteristics inside the spectrum, and the classification accuracy of the training and testing data was 99.84% and 95.23%, respectively, which suggests that NIR spectroscopy coupled with a deep learning algorithm could be used for the rapid and accurate inspection of steel coatings.

1. Introduction

Assessing the current condition of protective organic coatings on steel structures is an important but challenging task. It is crucial for asset owners to understand when the coating is no longer effective, so the repair can be applied before damage is done to structures due to the failure of protective coatings, and the improvement in maintenance planning can have a significant financial benefit. Common coating assessment practices involve trained inspectors performing close-up visual inspections and using a rating system. However, these practices are not only labor-intensive but also time-consuming and pose significant safety and logistical challenges when structures are located in harsh places [1]. Therefore, an efficient and intelligent evaluation approach is highly required for making informed decisions about protective coating maintenance.
Near-infrared (NIR) spectroscopy is a rapid, nondestructive and relatively inexpensive analytical technique. It characterizes materials based on their absorption intensity in the NIR region of the electromagnetic spectrum, which ranges from 700 to 2500 nm. These optical responses in the NIR region reflect vibrations of molecular functional groups containing atoms like C, N, O, and S or chemical bonds between atoms, such as C=O, C=H and C-O-C, which allows researchers to analyze samples of organic composition [2]. Therefore, the technique has found broad application in agriculture, food, pharmaceuticals, remote sensing, and several other fields [3,4,5]. For example, Piehl et al. [6] presented the first quantitative and qualitative analysis of plastic contamination in agricultural soil based on the NIR technique. Via Fourier transform infrared (FTIR), they were able to identify and quantify macro and microplastic pieces within the investigated area, which therefore provided important data to determine the extent of contamination concerning agroecosystems. Valand et al. [7] provided an extensive review of the application of NIR spectroscopy for food adulteration and authenticity. The literature has shown that, over the last decades, NIR has proven itself to be a trustworthy technology for examining foods for adulteration and authenticity. It is not only a fast, easy, and generally cost-effective method, but it also can combine with other analytical chemistry techniques to develop validated or standardized methods.
Meanwhile, methods used to extract and process the NIR analytical information to produce quantitative and qualitative models has evolved during the last decade. Sohn et al. [8] proposed a combination model of Savitzky–Golay and a support vector machine (SVM) to classify six different Amaranthus species in Korea, and the result shows that Vis-NIR spectroscopy with an SVM model has the capability to discriminate Amaranthus species with a notable accuracy up to 99.7%. Nawar et al. [9] established a random forest (RF) modeling approach for the quantitative analysis of soil organic carbon (OC). The results suggest that RF regression with spiking provides an accurate prediction of OC under both indoor laboratory and on-site field scanning conditions. Sampaio et al. [10] compared the performance of partial least squares (PLS), interval-PLS, synergy interval-PLS, and moving windows-PLS models, and developed an optimal regression model with high accuracy for rice amylose determination. Recently, the deep learning algorithm has attracted increasing attention for NIR researchers; it has shown great capabilities in creating powerful analytic models based on multilayer abstraction to represent concepts or features [11,12,13]. Chen et al. [14] proposed a framework for a backpropagation, neural deep learning 1D-CNN to predict the nutrition components in soil samples; Rong et al. [15] applied a simple CNN architecture with a single convolutional layer to distinguish peach varieties; Gholizadehhis et al. [16] examined the capability of vis–NIR spectra coupled with traditional machine learning techniques and a fully connected neural network (FNN) to assess potentially toxic elements in forest soils. The results show that FNN provides better results in the availability of a large sample size. These research works indicate that deep learning can be successfully applied to NIR sensor data analysis.
A lot of research works have been conducted with respect to the application of NIR technology in the field of monitoring or the inspection of steel structure coatings [17,18,19]. Kishigami et al. [20] recently demonstrated the use of NIR in the estimation of the degree of abrasion of coating thickness. It was found that the observed infrared intensity could be used to estimate the top coating thickness based on the calibration relationship they discovered. Omar et al. [21] developed a novel integrated device based on FTIR and micro-electromechanics to make structural analyses of the epoxy coating of steel pipelines. It shows that their instrument was useful for on-site material analysis, especially in the investigation of the mechanical properties and detection of the distribution of particles inside the material. Raeissi et al. [22] explored the use of a k-means clustering algorithm on the NIR portion of hyperspectral images (NIR-HIS) to provide diagnostic information about the spatial inhomogeneities of the chemical structures of an applied steel coating.
The aim of the study was to present an innovative approach based on NIR spectroscopy as a novel solution to objectively assess the condition of the protective coatings applied to steel structures. Moreover, this method of nondestructive evaluation could provide precise and automatic grading in the assessment of coating degradation due to age or environmental factors. The potential of the approach was shown using a real NIR dataset acquired from prepared coating samples with an accelerated aging process. In addition, a modern convolutional neural network (CNN) was developed to classify the different grades of corrosion based on their NIR data. CNNs have achieved promising performances in such classification tasks due to their large flexibility regarding the dimensionality of the operational layers, their depth and breadth, and their ability to extract strong features about the input data [23]. With the excellent learning ability of CNNs, a spatial distribution of the intensity variations at particular absorption lines in the electromagnetic spectrum of NIR data can be reconstructed as essential features, which can be used for the identification and for the evaluation of chemical changes that occur as a result of coating degradation.

2. Materials and Data Collection

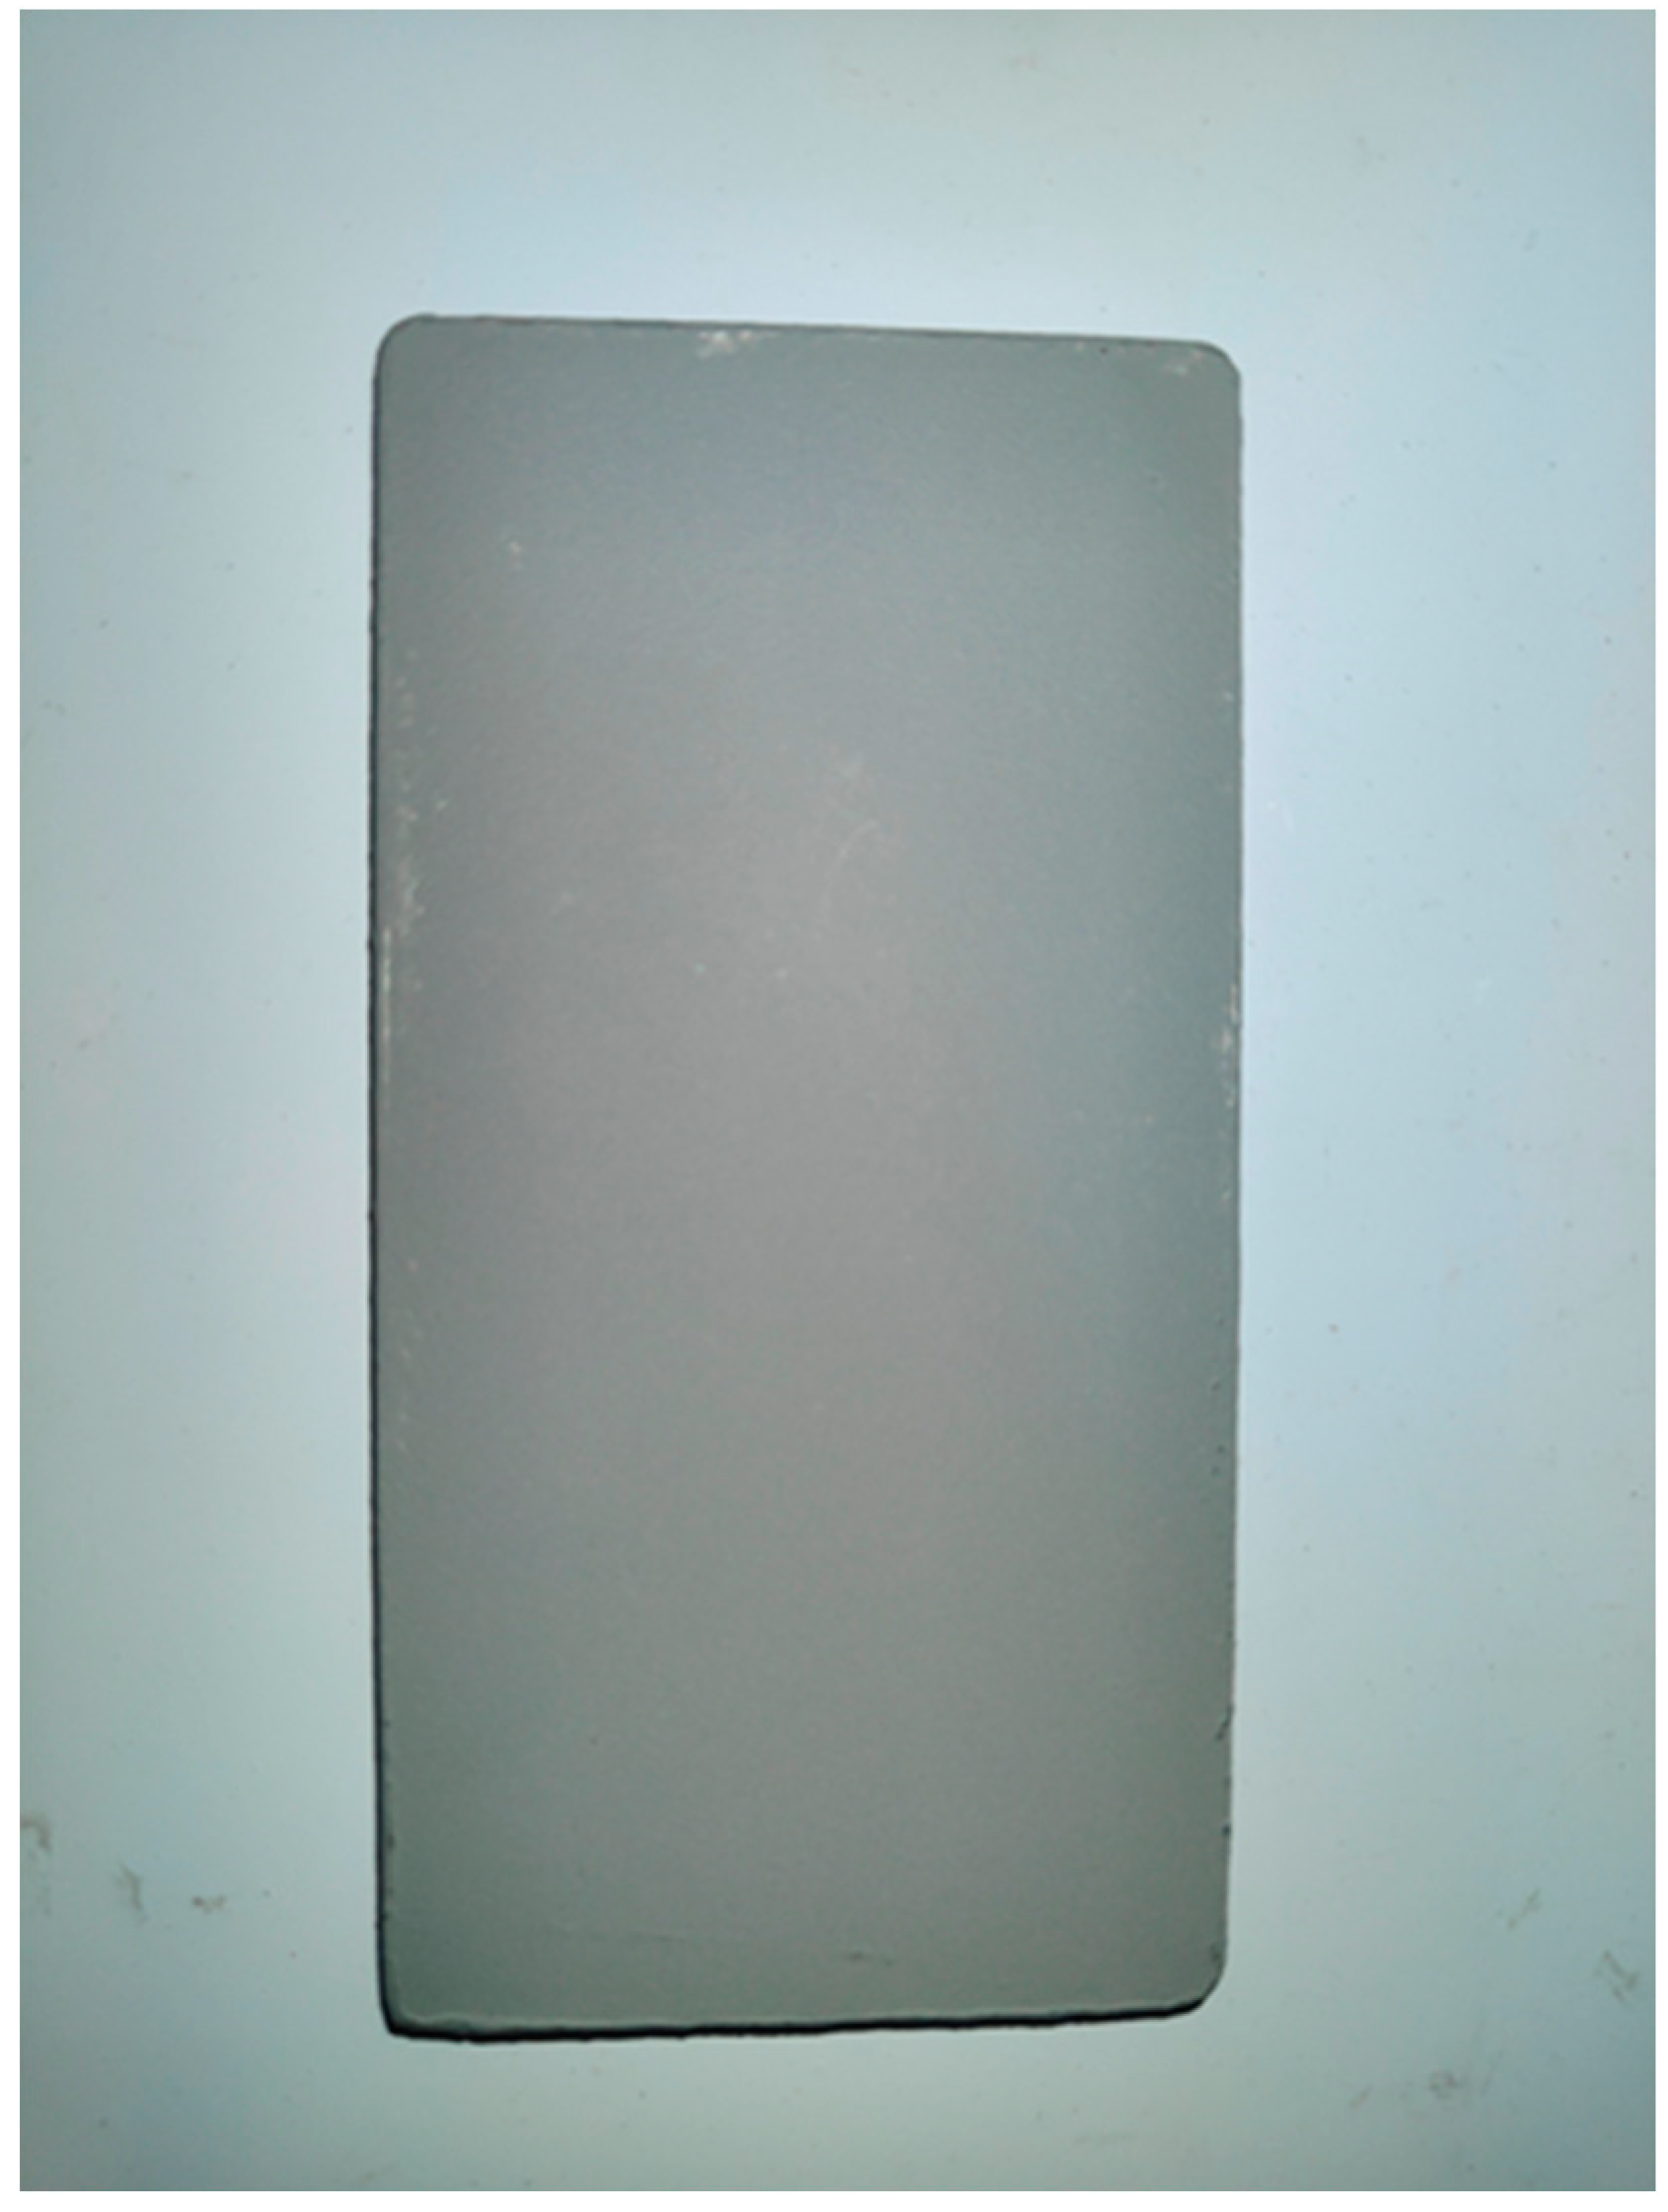
2.1. Sample Preparation

The protective coating used in this study was based on three layers of a composite coating system that was applied to the world-famous Hongkong-Zhuhai-Macro Bridge (HZMB). The coating system was formulated with zinc-rich epoxy primer, MIO epoxy intermediate paint, and a fluorocarbon topcoat, and each layer has a thickness of 100, 200, and 80 μm, respectively. Moreover, the composite coating was applied to steel plates using a high-pressure airless spraying method, following the specifications of painting and coating for steel structures in China. Chinese steel of grade Q235 was used for the steel plates, of which the dimensions were 100 mm × 50 mm × 10 mm. Figure 1 shows a real image of a steel plate with the composite coating.

2.2. Data Acquisition and Labelling

In order to simulate the behavior of coating degradation, 50 steel plates with a protective composite coating were exposed to a salt spray test device to accelerate corrosion growth. The salt spray test was performed following the instruction of the ISO 9227 standard, and each coated plate was grouped and subjected to a different exposure time: 120, 240, 360, 480, 600, 720, 840, 960, and 1080 h. Each sample was rinsed with water and air-dried before NIR data collection. The data collection was based on FTIR measurements performed using a BRUKER Lumos FTIR microscope. Reflectance spectra were recorded in the range of 8500 to 4000 cm−1. The resolution of the obtained spectra was 3.5 cm−1. For each coated sheet, six points located in the corner and center were measured individually. A total of 300 individual point spectra were recorded per one measurement, and a total of 10 measurements were made based on the different exposure times.
The labelling task was performed shortly after the NIR data collection of each steel sheet, and a human expert was present at the collection site to make an observation of the actual sample surface and assigned a label corresponding to their condition ratings. A four-level rating system is applied by inspectors and, in our study, is described in Table 1. The NIR dataset of a steel coating is then generated and referred to as a matrix of 1991 rows and 1201 columns. Each row represents the spectral information of the individual point from the coated steel sheet; each column (descriptive features) represents the reflectance magnitude of the NIR spectral band with a specific wavelength, which ranges from 8500 to 4000 cm−1; the last column has the condition class labels that are associated with each point. As shown in Table 1, the dataset is programmed to randomly divide into a training set and a testing set with a proportion of 80:20. The training set is used to train the model parameters and the testing set is used to check the classification performance of the trained model.

3. Methodology

3.1. Pre-Processing of NIR Data

Preprocessing of spectral data is the most important step before the subsequent modeling and analyzing. The objective of preprocessing is to remove physical phenomena in the spectra, such as baseline drift, high-frequency noise, and mutual interference between the components [9]. In this study, multiple preprocessing techniques were adopted based on four categories: smoothing, scatter correction, spectral derivatives, and wavelet denoising. Table 2 presented general information about these methods and a comparison of their denoising effect using root mean square error ( R M S E ) and signal-to-noise ratio ( S N R ). The two metrics are calculated by
S N R = 10 × log ( n = 1 N f ( n ) 2 n = 1 N [ f ( n ) f ^ ( n ) ] 2 )
R M S E = 1 n n [ f ( n ) f ^ ( n ) ] 2
where f ( n ) is the original spectrum, f ^ ( n ) is the denoised spectrum, and n is the sampling point. It can be seen that SG smoothing, MSC, 1st derivatives, and wavelet denoising with coiflets base have the best denoising effect in their category, respectively. However, the optimal preprocessing method will be determined according to the performance and robustness of the classification model, which is explained in detail in the next section.

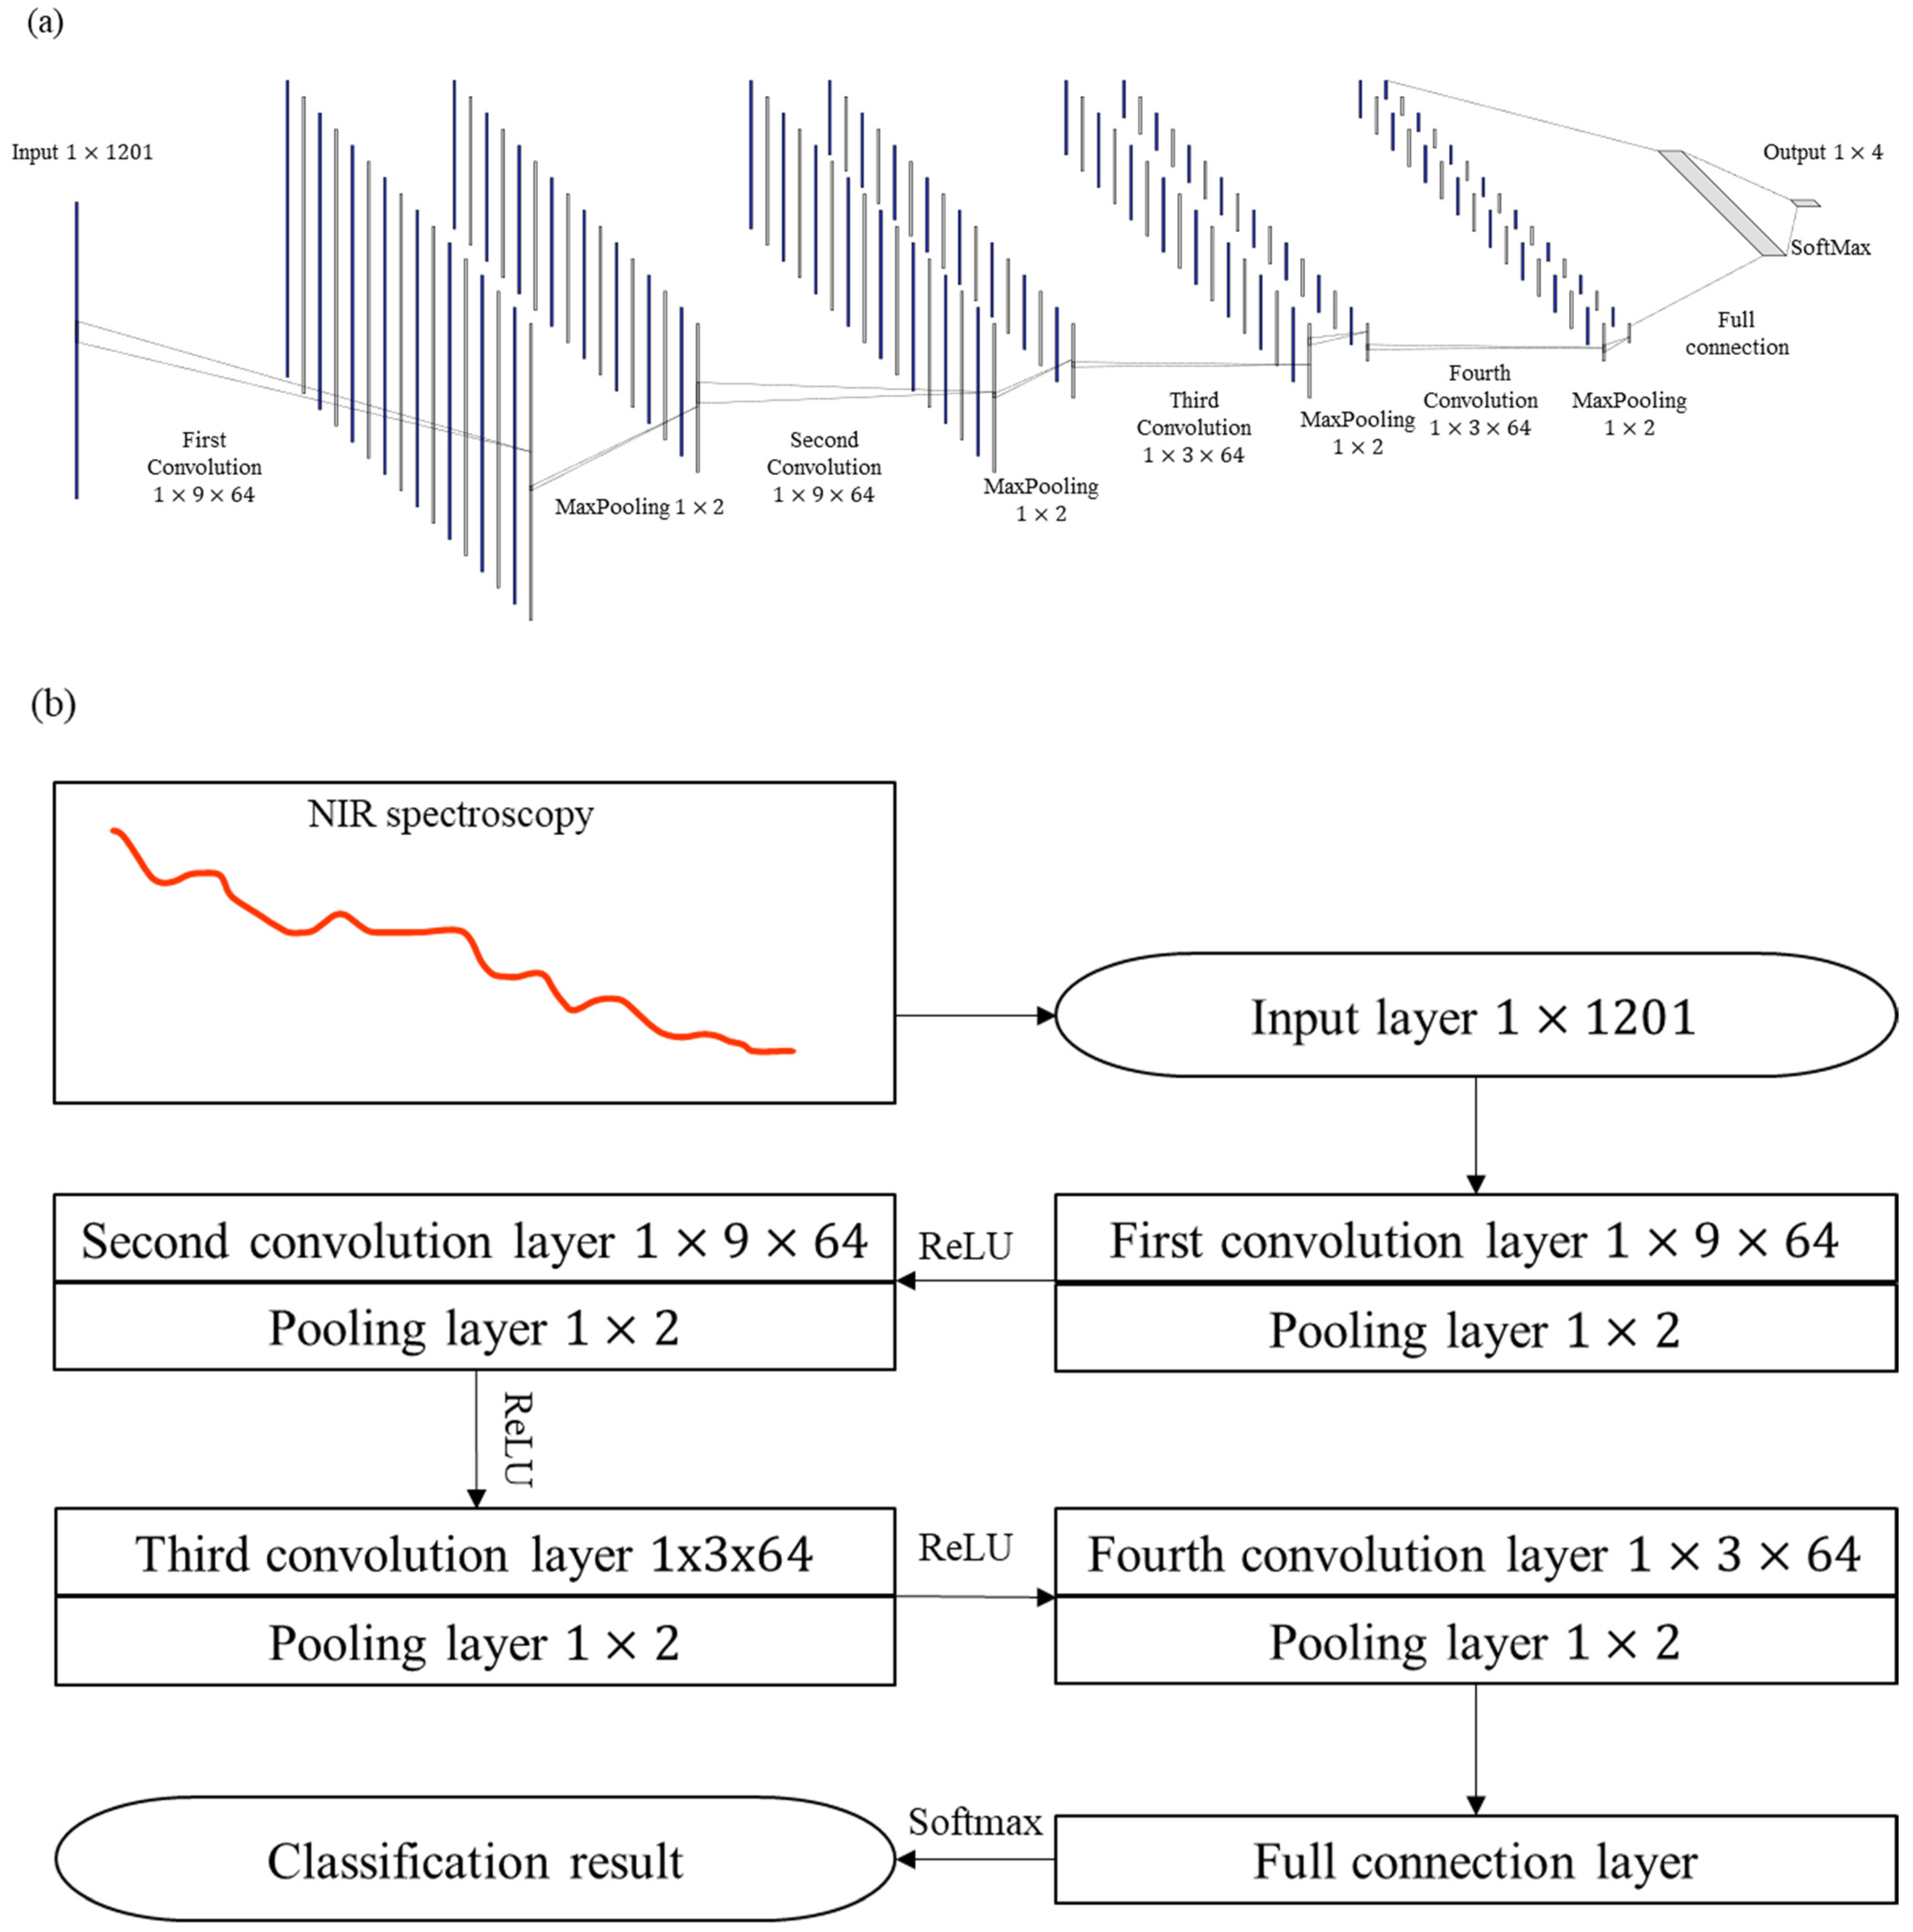
3.2. Architecture of the Proposed CNN Based Model

The CNN network can be variously arranged depending on the designed parameters and depths of the structure as well as the training method of the network. The basic architecture of the 1-D CNN in this paper consists of an input layer, multiple convolutional and pooling layers stacked together, a fully connected layer, and an output layer. A schematic diagram of this process is shown in Figure 2. As the obtained NIR input data represent a one-dimensional vector, the convolutional layer filters the input data with a one-dimensional kernel to obtain subtle feature information. A convolution kernel size of 1 × 9 is adopted in the first two convolutional layers to quickly obtain rough feature information, and then the convolution kernel with a small size of 1 × 3 is selected to extract more subtle features. In order to control the shrinkage of the dimensions, full zero padding and upward rounding are adopted in the process of convolution. The output of every convolutional layer is then passed to the pooling layer to reduce the size of the feature map, and the maximum operation is used. The size of the pooling layer is set as 1 × 2 with a step of 2 in this study. The final feature maps from the pooling layer are then flattened and passed to the fully connected layers at the end of the network. The Rectified Linear Unit (ReLU), the most commonly used activation function, is adapted in this model to implement nonlinear transformations [24]. The model applied Batch Normalization over the output of the convolutional layer to carry out the standardization process and the dropout mechanism is used to alleviate overfitting. The function of cross entropy is selected as the loss function in this study to quantify the difference between two probability distributions [25]. Lastly, the mathematical function of Softmax is implemented for the neural network of multiple classifications. In order to train the proposed CNN model, the learning rate is set to 0.001, the batch size is set to 64, and the epoch of training is set to 100.

3.3. Performance Evaluation

In order to evaluate the overall performance of the proposed model, the following four criteria were used: classification accuracy, precision, recall, and F1 score. These metrics are calculated by
Aaccuracy = i = 1 n ( T P i + F N i ) i = 1 n ( T P i + T N i + F P i + F N i )
Precision = 1 n i = 1 n T P i T P i + F P i
Recall = 1 n i = 1 n T P i T P i + F N i
F 1 = 1 n i = 1 n 2 T P i 2 T P i + F P i + F N i
where T P , T N , F P , and F N are true positive, true negative, false positive, and false negative, respectively. A confusion matrix is provided to demonstrate insight information for the predictions and to comprehend other classification metrics.

3.4. Software Tools

The Python 3.6 program with PyCharm IDE was used to perform spectral extraction, preprocessing, and other analysis models. The 1D-CNN model was programmed using the Pytorch framework, running on the graphics processing unit.

4. Results and Discussion

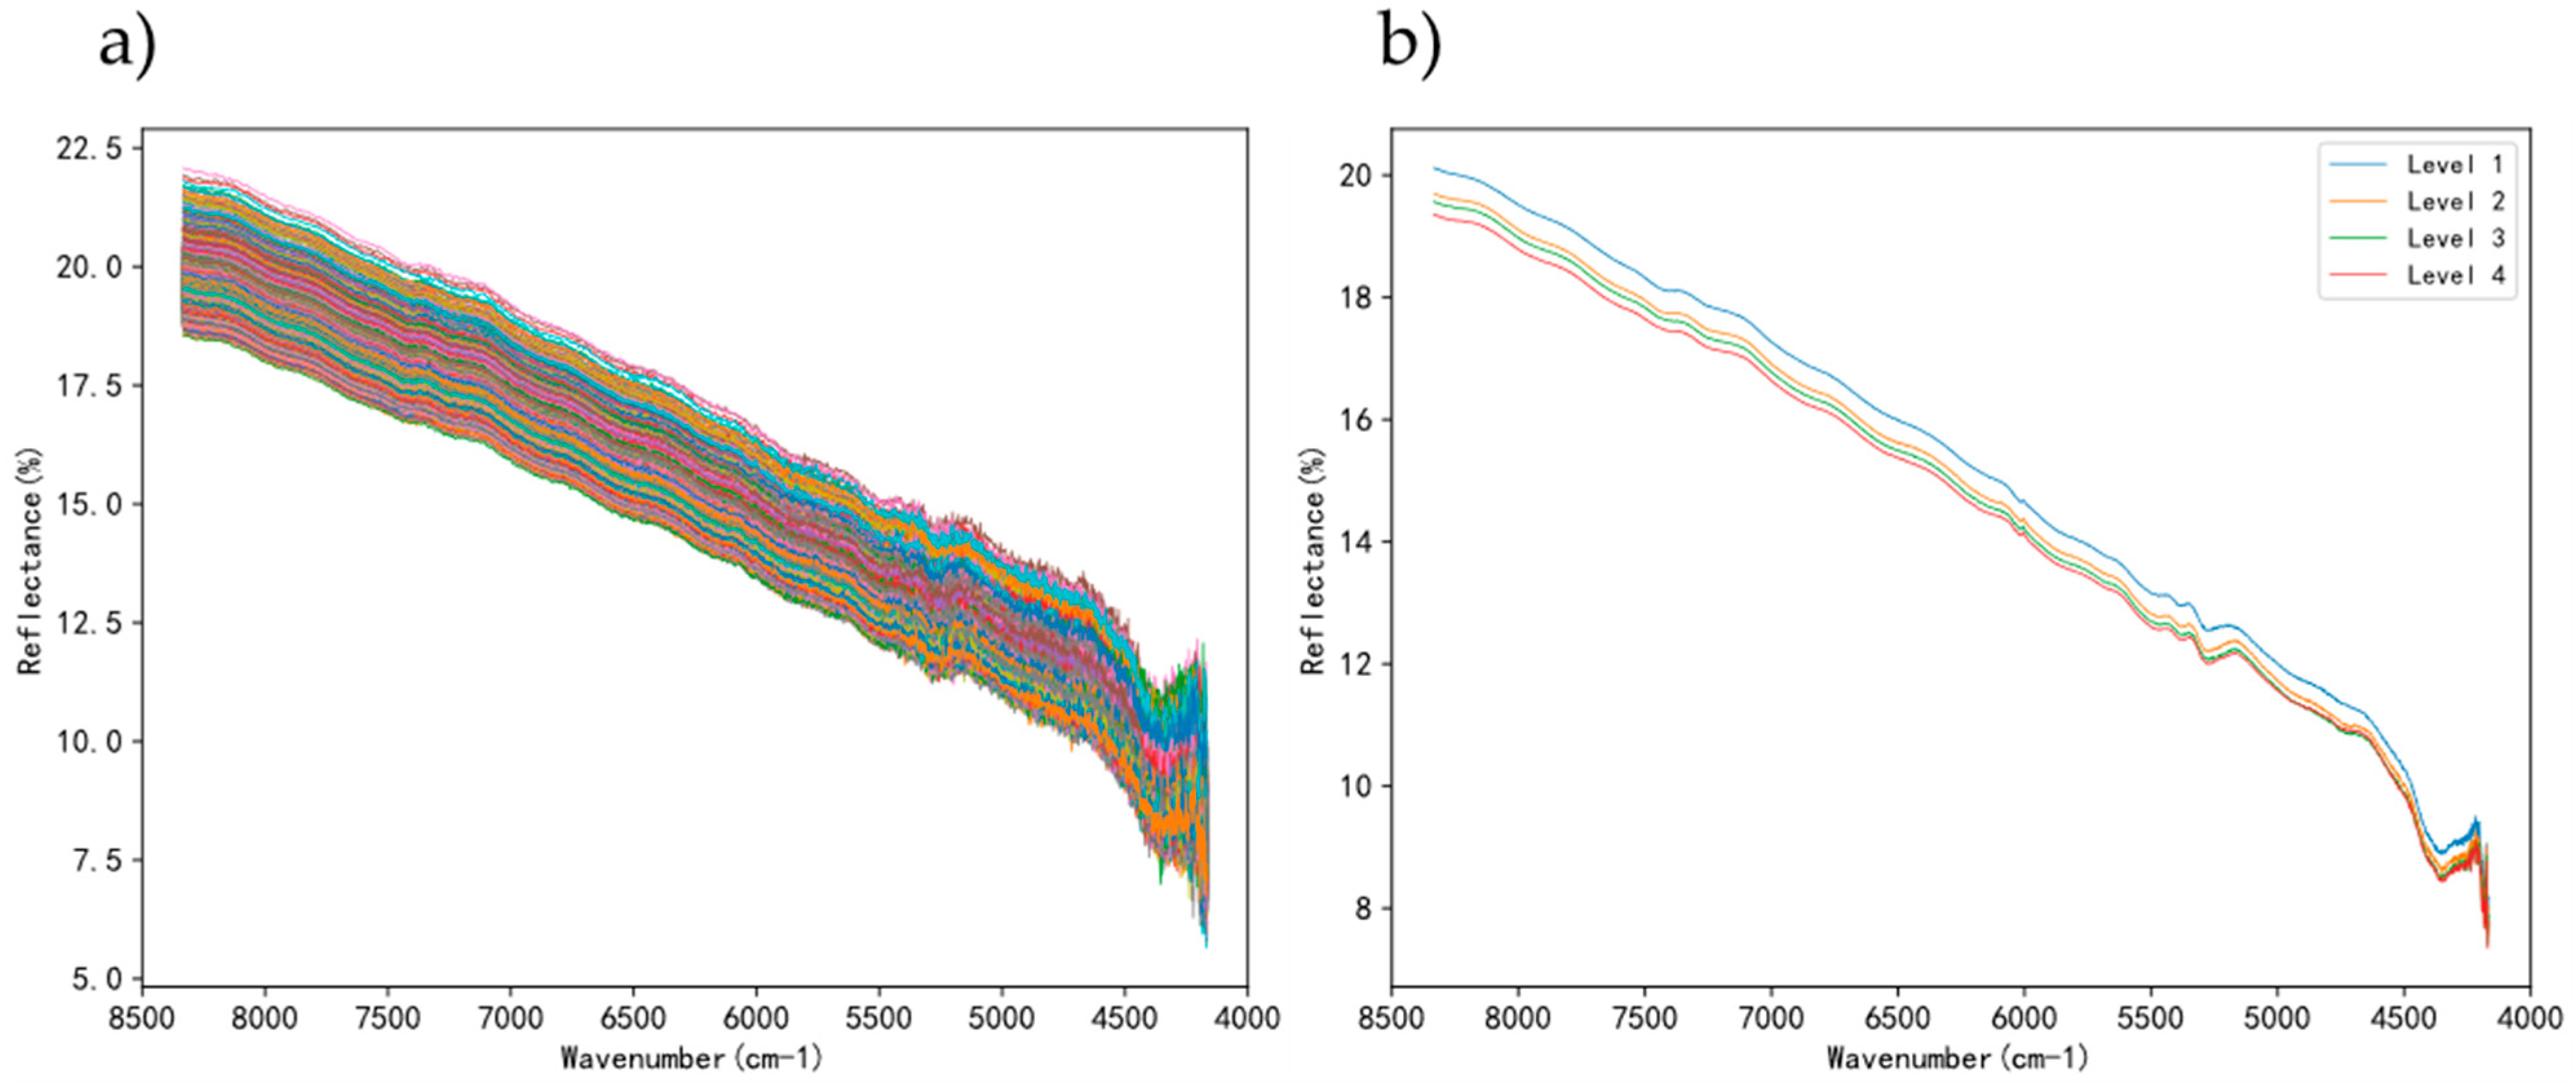
4.1. Spectral Characteristic

The original and mean NIR spectra of the steel coatings with different grades of corrosion are shown in Figure 3a,b, respectively. Overall, the original spectrum of the four kinds of coating conditions showed a downward trend over the entire wavenumber period. Two major absorption peaks were observed around 5250 and 4400 cm−1. A peak around 5250 cm−1 is typically attributed to the hydroxyl ring, which represents a combination of asymmetric stretching and bending of O-H, and the peak around 4400 cm−1 represents the combination band of the second overtone of the epoxy ring [22,26,27]. Both characteristics are highly correlated to coating degradation. Another clear trend from Figure 3b was a decrease in the coating degradation in the reflectance of the spectra features. This phenomenon reflected the thickness and total surface coverage of the corrosion compounds within the analysis area [28].

4.2. Preprocessing Method

NIR spectral data are often interfered with by stray light, noise, baseline drift, and other factors, thus affecting the final qualitative and quantitative analysis results. In this paper, multiple pretreatment methods were used for the comparative analysis, and the following accuracy results of the proposed CNN model are shown in Table 3. Compared with other methods, SG smoothing is more competitive, with a 95.8% accuracy, but the MSC and SNV methods reached close accuracy results of around 95%. Obviously, spectral derivative methods are not suitable for the proposed model. It is worth mentioning that wavelet methods (coiflets and symmlets family) showed an inferior performance of 85–90% accuracy while having better denoising results based on the RMSE and SNR results in Table 2. In summary, SG smoothing was selected as the preprocessing method for the proposed discriminant model.

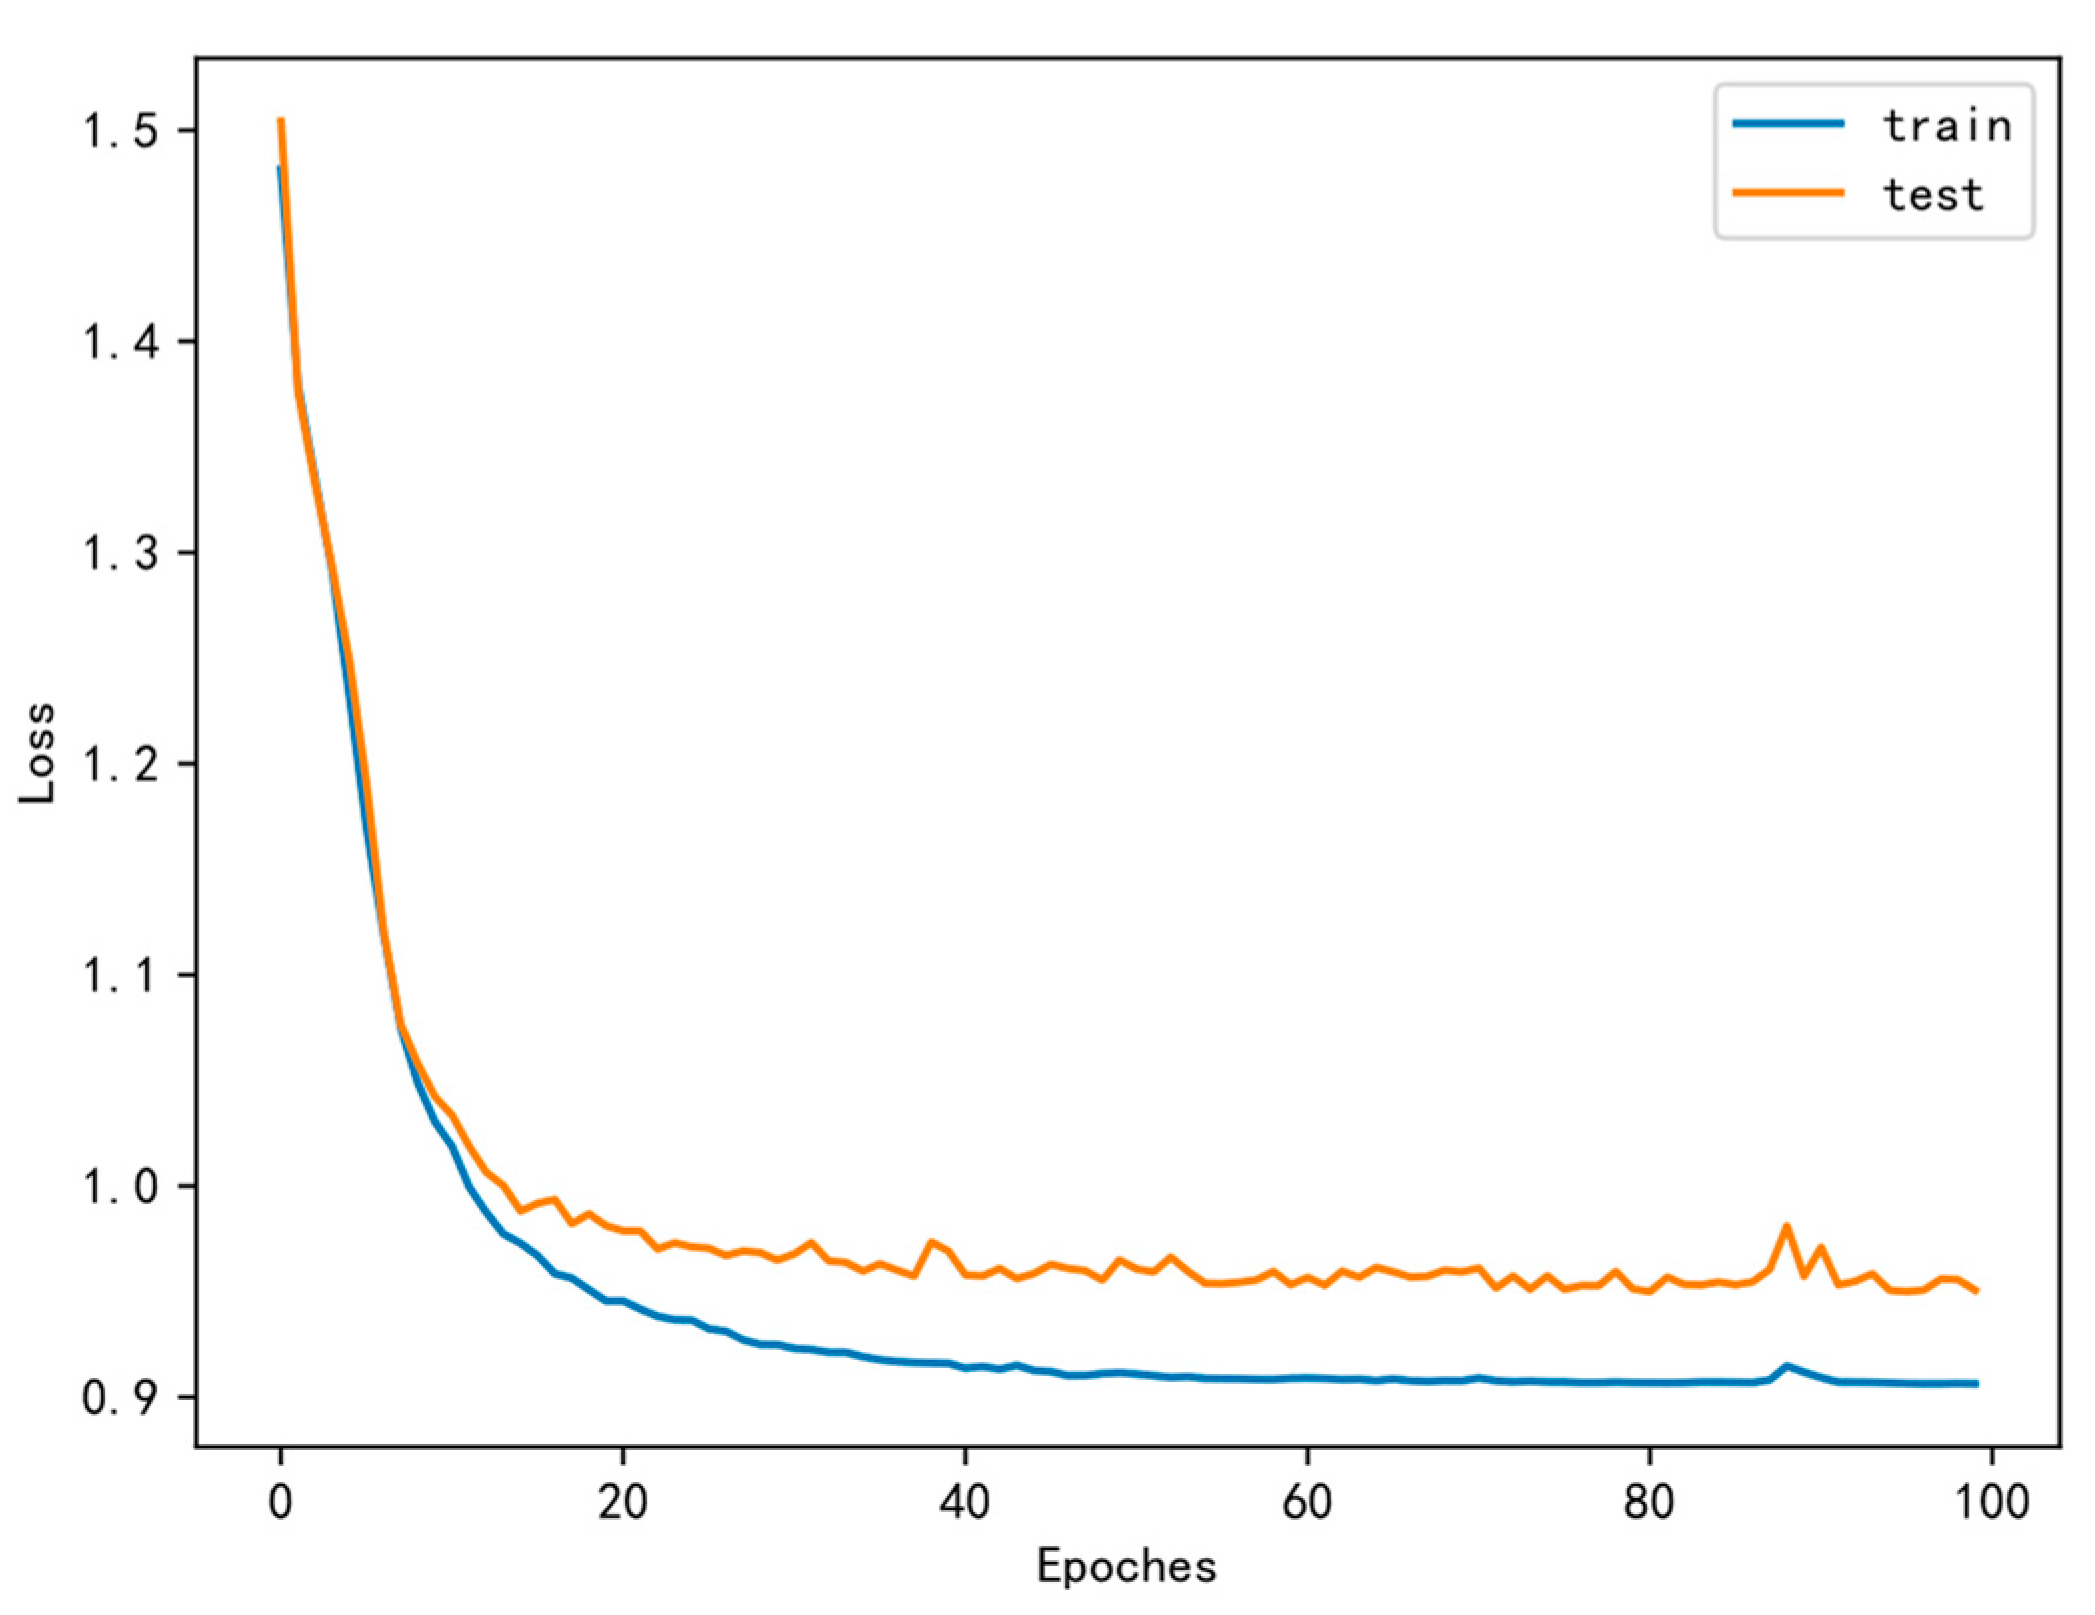
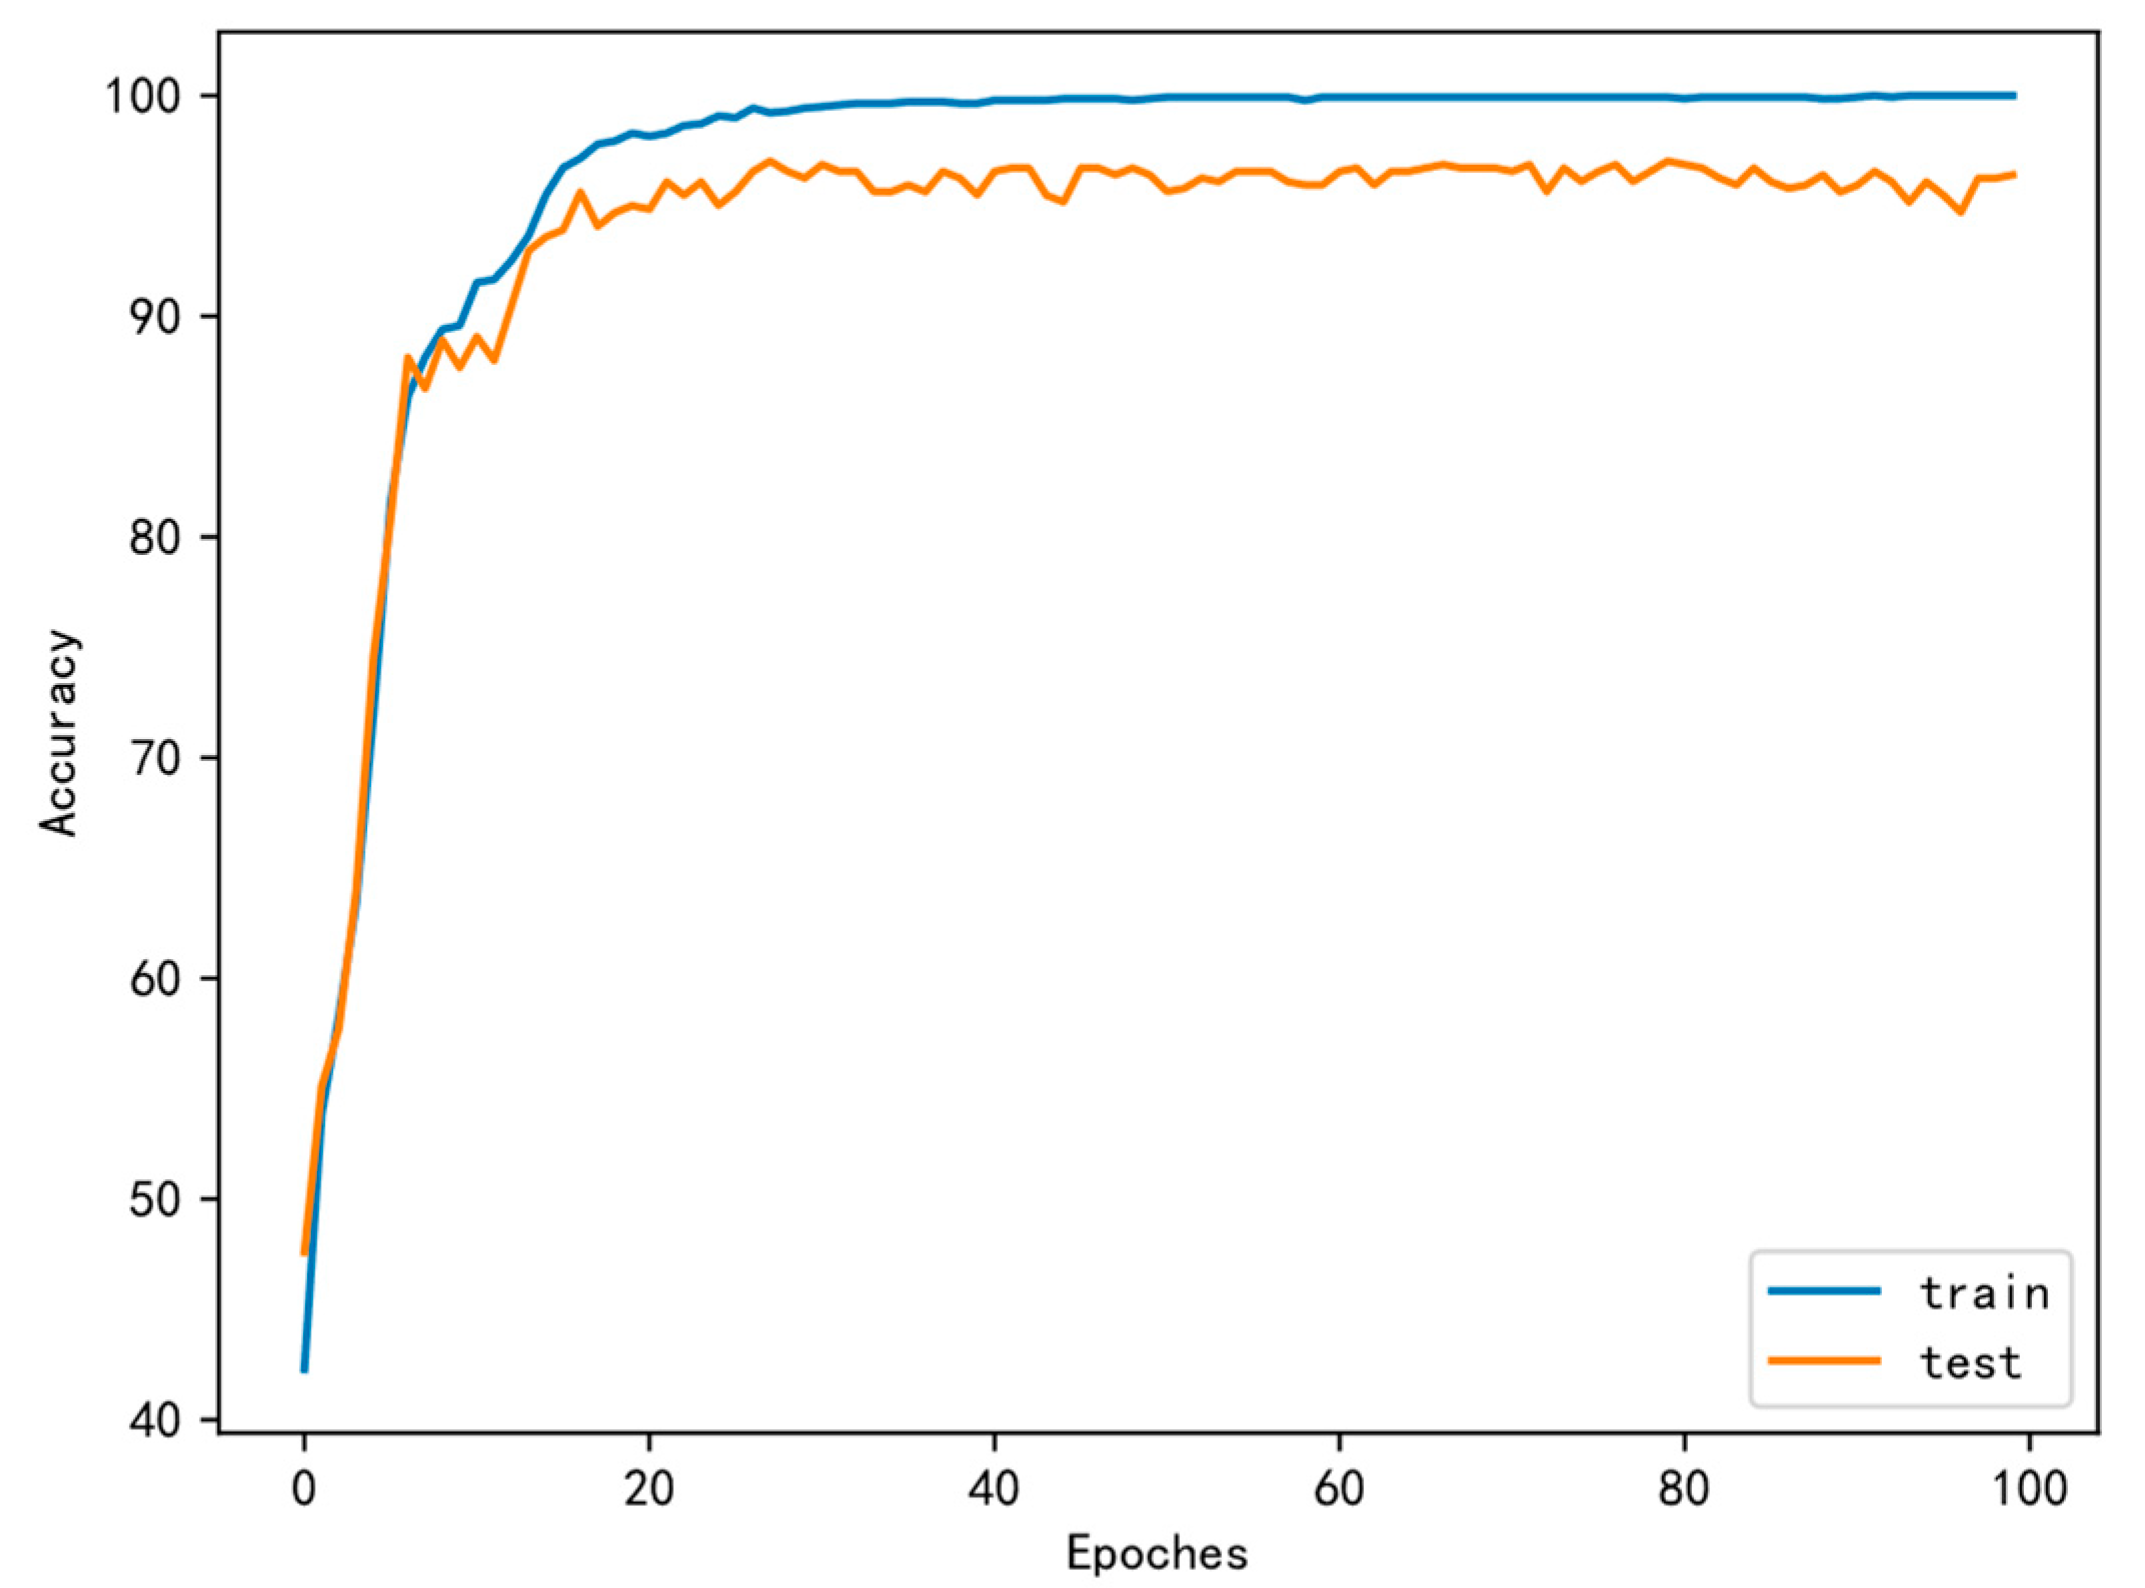
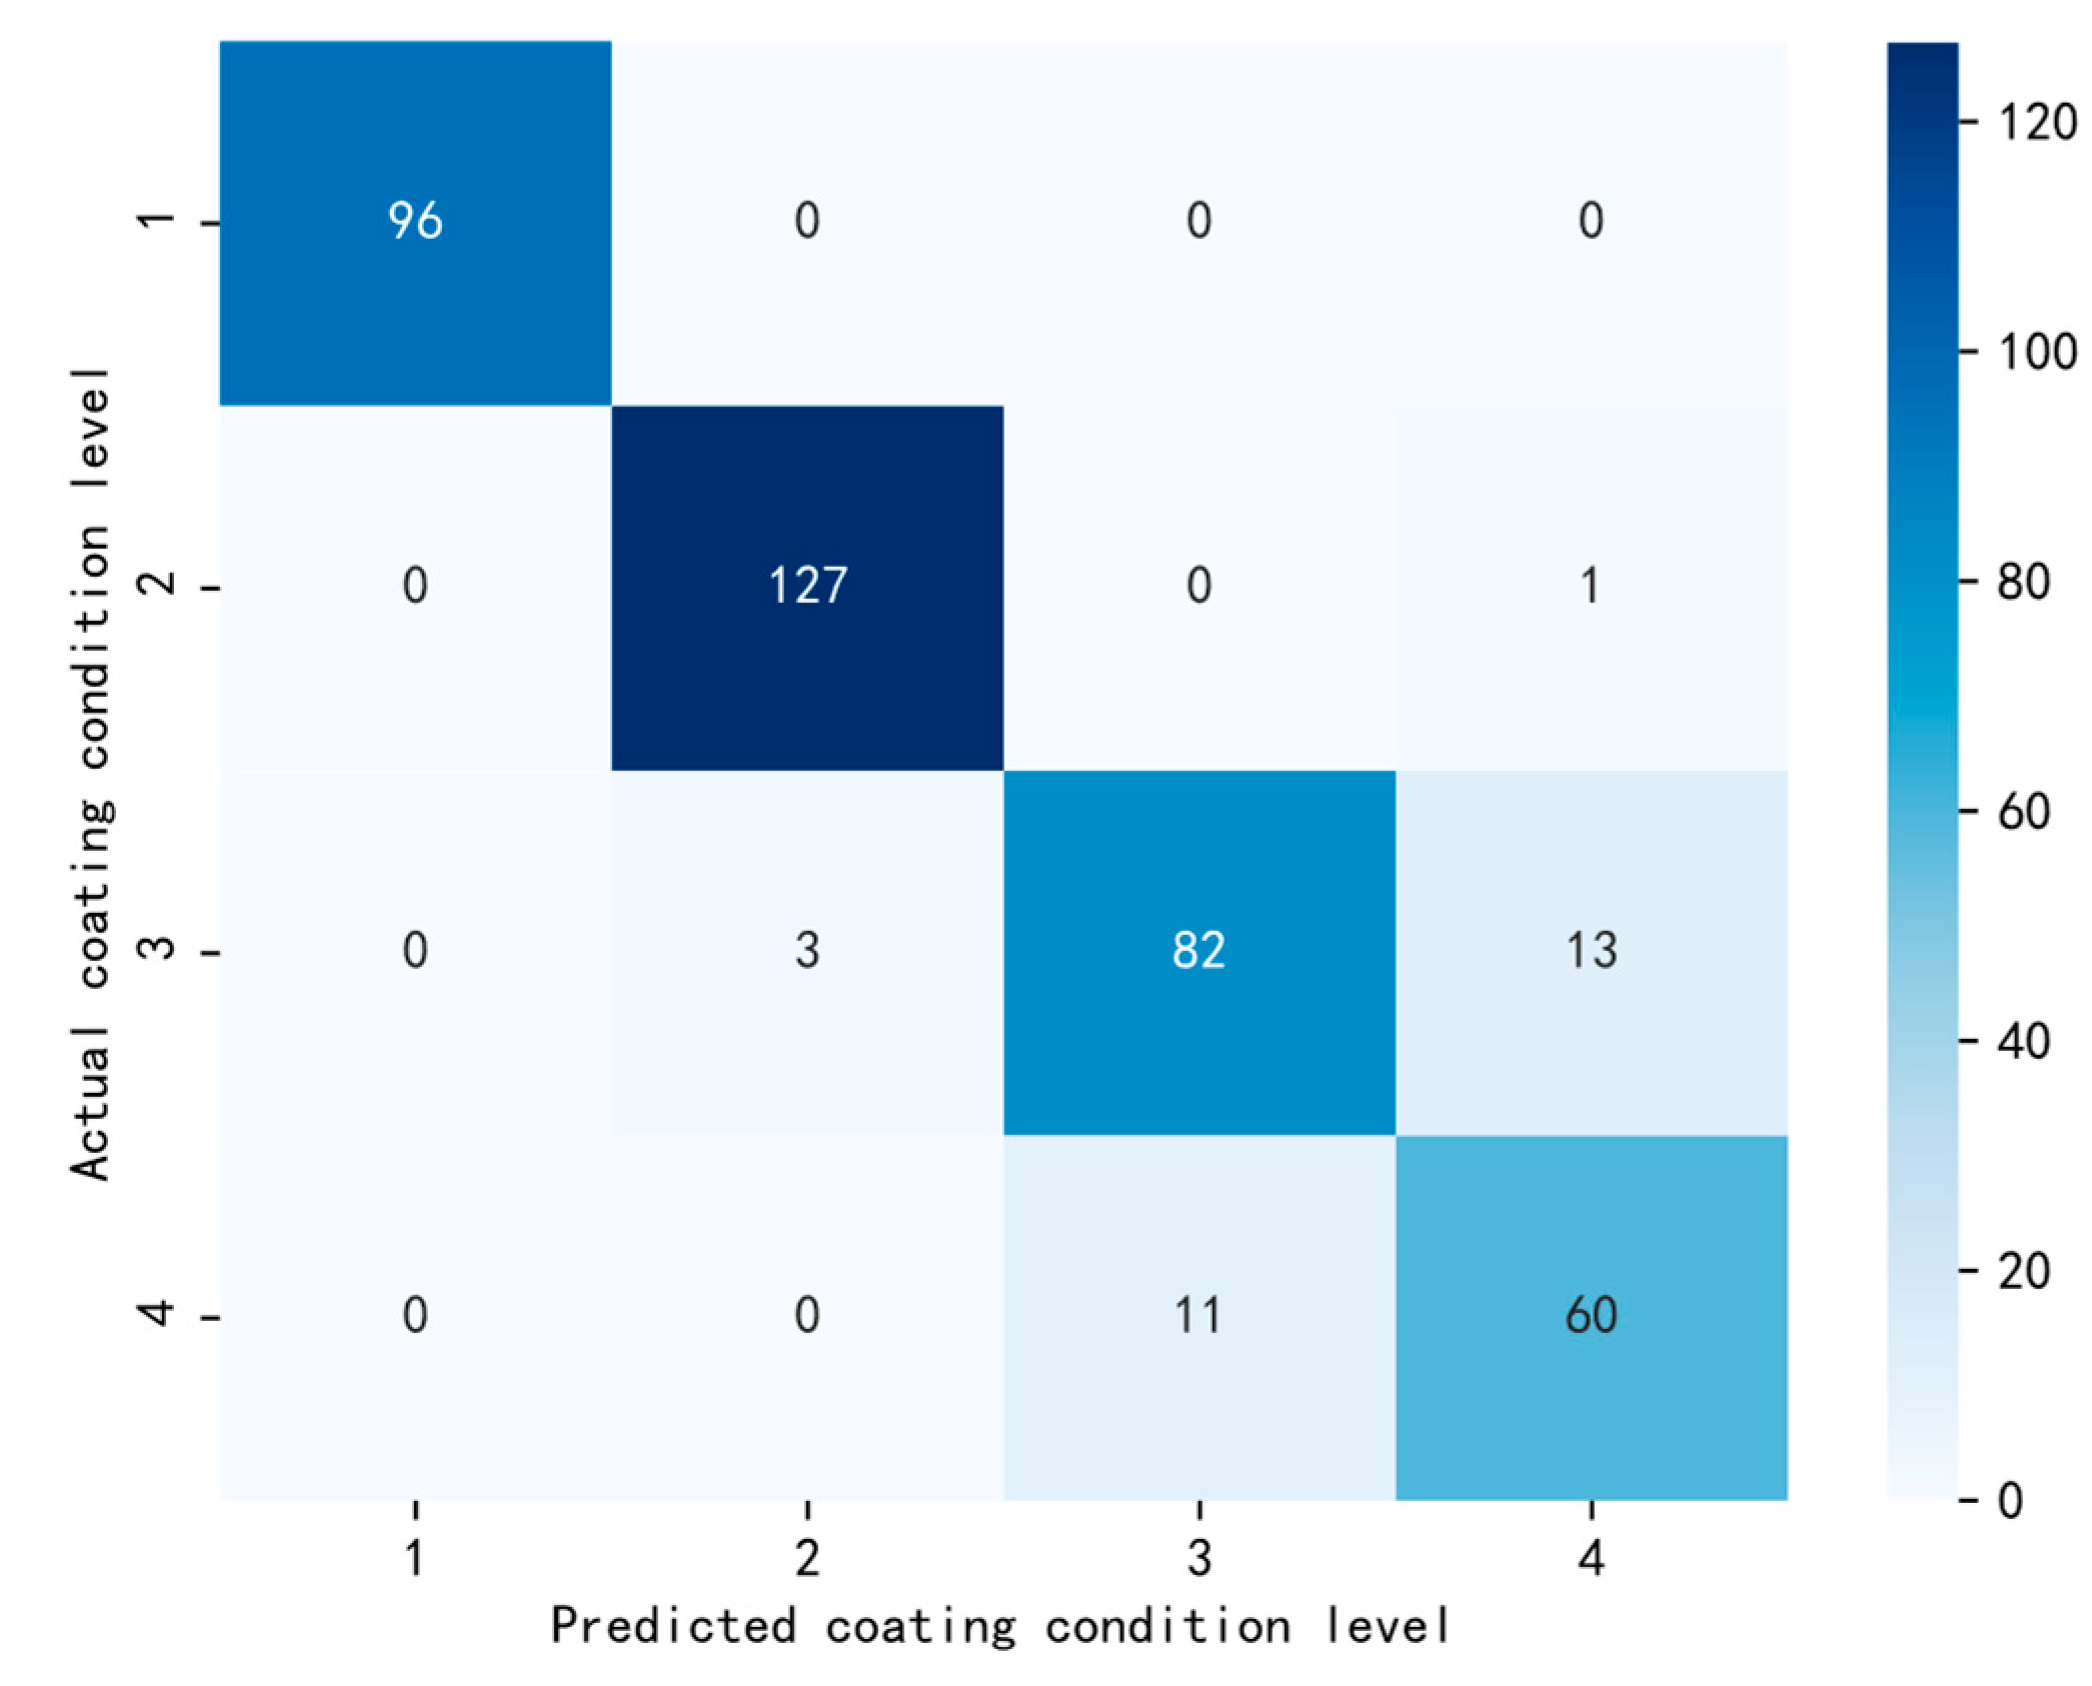
4.3. CNN-Based Steel Coating Condition Assessment Model

The results for loss value and prediction accuracy on the training set and test set are shown in Figure 4 and Figure 5. As can be seen in Figure 4, the loss value shows a trend that drops down rapidly during the first 20 epochs, then decreases slowly until it is steady. In the end, the loss values of the training set and the testing set were 0.759 and 0.829, respectively. In Figure 5, it is observed that the classification performance of the 1D-CNN model shows a trend of rapid rise, gradual and slow increase, and then tends to be stable. After 40 epochs, the accuracy rate of the testing and training sets reach 99.84% and 95.23%, respectively.
In order to better explain the prediction results of the 1D-CNN model for each category in the test set, a confusion matrix was introduced and is shown in Figure 6. As can be seen from the confusion matrix, the predictions of a coating with a level 1 condition are all correct, and only one sample with a level 2 coating condition is falsely predicted as being level 3. The coating samples with a level 3 condition show the lowest prediction accuracy, with a total of 14 samples being misclassified; most of them are falsely predicted as a level 4 condition. Similarly, seven coating samples with a level 4 condition are misclassified to level 3. The result of the confusion matrix indicates that most false predictions occur in condition levels 3 and 4.
The overall performance results are shown in Table 4, which confirms that, for limited high-dimensional data, the proposed 1D-CNN model has excellent classification ability and can discriminate the condition levels of steel coatings. This reveals the superiority of the deep learning model with a high ability for feature extraction and learning over traditional processing.

5. Conclusions

In this paper, a 1D-CNN-based model was developed for the assessment of steel coating conditions using NIR data. Four levels of coating degradation were constructed by artificially-accelerated aging, and the data were collected based on different exposure times. With the current popular research method of deep learning, NIR data can be directly input into the model, extracting feature information from the spectrum and conducting automatic learning. Therefore, an accurate assessment of the coating condition can be achieved. The major findings of this paper can be summarized as follows:
  • The characteristics of the spectrum showed a downward trend over the entire wavenumber period, and two major absorption peaks were observed around 5250 and 4400 cm−1;
  • A decrease in the reflectance of the spectrum features was observed along with the coating degradation process;
  • A comparison of the different preprocessing methods indicated that the SG smoothing method was the most suitable method for the proposed model to effectively improve classification performance;
  • Based on the above data and pretreatment, the experimental results of the proposed model achieved an overall prediction accuracy of 95.8% and very minimal error measures.
All the findings suggest that the proposed 1D-CNN framework coupled with NIR data has great potential for steel coating assessment and can provide rapid and accurate predictions of coating degradation levels. The next steps in this research should be to collect more coating data under a complex environment to build a comprehensive database; thus, the robustness of the model can be improved.

Author Contributions

Conceptualization, M.C. and G.W.; methodology, M.C. and G.W.; validation, M.C. and G.W.; formal analysis, M.C.; investigation, M.C.; writing—original draft preparation, M.C.; writing—review and editing, G.L. and G.W.; visualization, M.C.; supervision, G.L. and G.W.; funding acquisition, G.W. All authors have read and agreed to the published version of the manuscript.

Funding

This research was funded by the National Key Research and Development Program of China (No. 2019YFB1600702).

Institutional Review Board Statement

Not applicable.

Informed Consent Statement

Not applicable.

Data Availability Statement

Not applicable.

Conflicts of Interest

The authors declare no conflict of interest.

References

  1. Huynh, C.P.; Mustapha, S.; Runcie, P.; Porikli, F. Multi-class support vector machines for paint condition assessment on the Sydney Harbour Bridge using hyperspectral imaging. Struct. Monit. Maint. 2015, 2, 181–197. [Google Scholar] [CrossRef] [Green Version]
  2. Pasquini, C. Near infrared spectroscopy: A mature analytical technique with new perspectives–A review. Anal Chim. Acta 2018, 1026, 8–36. [Google Scholar] [CrossRef] [PubMed]
  3. Corradini, F.; Bartholomeus, H.; Lwanga, E.H.; Gertsen, H.; Geissen, V. Predicting soil microplastic concentration using vis-NIR spectroscopy. Sci. Total Environ. 2019, 650, 922–932. [Google Scholar] [CrossRef] [PubMed]
  4. Firmani, P.; De Luca, S.; Bucci, R.; Marini, F.; Biancolillo, A. Near infrared (NIR) spectroscopy-based classification for the authentication of Darjeeling black tea. Food Control 2019, 100, 292–299. [Google Scholar] [CrossRef]
  5. Hong, Y.; Chen, Y.; Yu, L.; Liu, Y.; Liu, Y.; Zhang, Y.; Liu, Y.; Cheng, H. Combining fractional order derivative and spectral variable selection for organic matter estimation of homogeneous soil samples by VIS–NIR spectroscopy. Remote Sens. 2018, 10, 479. [Google Scholar] [CrossRef] [Green Version]
  6. Piehl, S.; Leibner, A.; Löder, M.G.J.; Dris, R.; Bogner, C.; Laforsch, C. Identification and quantification of macro- and microplastics on an agricultural farmland. Sci. Rep. 2018, 8, 17950–17959. [Google Scholar] [CrossRef] [PubMed] [Green Version]
  7. Valand, R.; Tanna, S.; Lawson, G.; Bengtström, L. A review of Fourier Transform Infrared (FTIR) spectroscopy used in food adulteration and authenticity investigations. Food Addit. Contam. Part A 2020, 37, 19–38. [Google Scholar] [CrossRef]
  8. Sohn, S.; Oh, Y.; Pandian, S.; Lee, Y.; Zaukuu, J.Z.; Kang, H.; Ryu, T.; Cho, W.; Cho, Y.; Shin, E. Identification of Amaranthus species using visible-near-infrared (vis-NIR) spectroscopy and machine learning methods. Remote Sens. 2021, 13, 4149. [Google Scholar] [CrossRef]
  9. Nawar, S.; Mouazen, A.M. On-line vis-NIR spectroscopy prediction of soil organic carbon using machine learning. Soil Tillage Res. 2019, 190, 120–127. [Google Scholar] [CrossRef]
  10. Sampaio, P.S.; Soares, A.; Castanho, A.; Almeida, A.S.; Oliveira, J.; Brites, C. Optimization of rice amylose determination by NIR-spectroscopy using PLS chemometrics algorithms. Food Chem. 2018, 242, 196–204. [Google Scholar] [CrossRef]
  11. Wanderi, K.; Cui, Z. Organic Fluorescent Nanoprobes with NIR-IIb Characteristics for Deep Learning; Wiley Online Library: Hoboken, NJ, USA, 2022; p. 20210097. [Google Scholar]
  12. Naqvi, R.A.; Arsalan, M.; Batchuluun, G.; Yoon, H.S.; Park, K.R. Deep learning-based gaze detection system for automobile drivers using a NIR camera sensor. Sensors 2018, 18, 456. [Google Scholar] [CrossRef] [PubMed] [Green Version]
  13. Nguyen, D.T.; Pham, T.D.; Lee, Y.W.; Park, K.R. Deep learning-based enhanced presentation attack detection for iris recognition by combining features from local and global regions based on NIR camera sensor. Sensors 2018, 18, 2601. [Google Scholar] [CrossRef] [PubMed] [Green Version]
  14. Chen, H.; Liu, Z.; Gu, J.; Ai, W.; Wen, J.; Cai, K. Quantitative analysis of soil nutrition based on FT-NIR spectroscopy integrated with BP neural deep learning. Anal. Methods 2018, 10, 5004–5013. [Google Scholar] [CrossRef]
  15. Rong, D.; Wang, H.; Ying, Y.; Zhang, Z.; Zhang, Y. Peach variety detection using VIS-NIR spectroscopy and deep learning. Comput. Electron. Agric. 2020, 175, 105553. [Google Scholar] [CrossRef]
  16. Gholizadeh, A.; Saberioon, M.; Ben-Dor, E.; Rossel, R.A.V.; Bor Uu Vka, L.V.S. Modelling potentially toxic elements in forest soils with vis–NIR spectra and learning algorithms. Environ. Pollut. 2020, 267, 115574. [Google Scholar] [CrossRef]
  17. Poliskie, M.; Clevenger, J.O. Fourier transform infrared (FTIR) spectroscopy for coating characterization and failure analysis. Met. Finish. 2008, 106, 44–47. [Google Scholar] [CrossRef]
  18. Pareja, R.R.; Ibáñez, R.L.; Martín, F.; Ramos-Barrado, J.R.; Leinen, D. Corrosion behaviour of zirconia barrier coatings on galvanized steel. Surf. Coat. Technol. 2006, 200, 6606–6610. [Google Scholar] [CrossRef]
  19. Caldona, E.B.; Wipf, D.O.; Smith, D.W., Jr. Characterization of a tetrafunctional epoxy-amine coating for corrosion protection of mild steel. Prog. Org. Coat. 2021, 151, 106045. [Google Scholar] [CrossRef]
  20. Kishigami, S.; Matsumoto, Y.; Ogawa, Y.; Mizokami, Y.; Shiozawa, D.; Sakagami, T.; Hayashi, M.; Arima, N. Quantitative Deterioration Evaluation of Heavy-Duty Anticorrosion Coating by Near-Infrared Spectral Characteristics. Eng. Proc. 2021, 8, 26. [Google Scholar]
  21. Abdelkarim, O.; Abdellatif, M.H.; Khalil, D.; Bassioni, G. FTIR And Uv In Steel Pipeline Coating Application. Geomate J. 2020, 18, 130–135. [Google Scholar] [CrossRef]
  22. Raeissi, B.; Bashir, M.A.; Garrett, J.L.; Orlandic, M.; Johansen, T.A.; Skramstad, T.O.R. Detection of different chemical binders in coatings using hyperspectral imaging. J. Coat. Technol. Res. 2022, 19, 559–574. [Google Scholar] [CrossRef]
  23. Paoletti, M.E.; Haut, J.M.; Plaza, J.; Plaza, A. Deep learning classifiers for hyperspectral imaging: A review. ISPRS J. Photogramm. Remote Sens. 2019, 158, 279–317. [Google Scholar] [CrossRef]
  24. Dubey, A.K.; Jain, V. Comparative study of convolution neural network’s relu and leaky-relu activation functions. In Applications of Computing, Automation and Wireless Systems in Electrical Engineering; Springer: Berlin/Heidelberg, Germany, 2019; pp. 873–880. [Google Scholar]
  25. Shore, J.; Johnson, R. Axiomatic derivation of the principle of maximum entropy and the principle of minimum cross-entropy. IEEE Trans. Inf. Theory 1980, 26, 26–37. [Google Scholar] [CrossRef] [Green Version]
  26. Guerguer, M.; Naamane, S.; Edfouf, Z.; Raccurt, O.; Bouaouine, H. Chemical Degradation and Color Changes of Paint Protective Coatings Used in Solar Glass Mirrors. Coatings 2021, 11, 476. [Google Scholar] [CrossRef]
  27. González, M.G.; Cabanelas, J.C.; Baselga, J. Applications of FTIR on epoxy resins-identification, monitoring the curing process, phase separation and water uptake. Infrared Spectrosc. Mater. Sci. Eng. Technol. 2012, 2, 261–284. [Google Scholar]
  28. Deng, F.; Huang, Y.; Azarmi, F. Corrosion behavior evaluation of coated steel using fiber Bragg grating sensors. Coatings 2019, 9, 55. [Google Scholar] [CrossRef]
Figure 1. Image of a steel plate sample.
Coatings 12 01721 g001
Figure 2. A schematic diagram of the proposed 1D-CNN classification model: (a) basic structure; (b) architectural details.
Coatings 12 01721 g002
Figure 3. Near-infrared (NIR) spectra of steel coating: (a) raw data for all samples; (b) mean spectra of different grades of the coating condition.
Coatings 12 01721 g003
Figure 4. The loss value of the proposed 1D-CNN model.
Coatings 12 01721 g004
Figure 5. The accuracy of the proposed 1D-CNN model.
Coatings 12 01721 g005
Figure 6. The confusion matrix for the testing set.
Coatings 12 01721 g006
Table 1. The four-level coating condition rating system.
Coating ConditionNumber of Training SetNumber of Testing SetDescription
Level 137599The coating remains intact
Level 2566146The coating is slightly degraded, with speckled rusting in areas that are less than 1% of the total surface area.
Level 335690The coating is moderately degraded, with speckled rusting in areas greater than 1% and less than 40% of the total surface area.
Level 428673The coating is no longer effective, with speckled rusting in areas larger than 40% of the total surface area.
Total1583408/
Table 2. Comparison of preprocessing method denoising effects.
CategoriesPre-Processing MethodsRMSESNR
SmoothingMean average (MA) smoothing0.054520.18
Savitzkygolay (SG) smoothing0.011229.94
Scatter CorrectionMultiplicative scatter correction (MSC)0.032228.50
Standard normal variate (SNV)0.032228.50
Spectral Derivatives1st Derivatives0.22088.05
2nd Derivatives0.22537.88
Wavelet DenoisingHaar wavelet 0.28135.94
Daubechies wavelet0.017829.89
Coiflets wavelet0.010934.16
Symmlets wavelet0.012732.86
Table 3. The accuracy results of the 1D-CNN model with different preprocessing methods.
CategoriesPre-Processing MethodsAccuracy (%)
Raw Data/91.8
SmoothingMean average (MA) smoothing92.8
Savitzkygolay (SG) smoothing95.8
Scatter CorrectionMultiplicative scatter correction (MSC)94.7
Standard normal variate (SNV)95.0
Spectral Derivatives1st Derivatives80.3
2nd Derivatives61.5
Wavelet DenoisingHaar wavelet 55.7
Daubechies wavelet85.1
Coiflets wavelet91.0
Symmlets wavelet84.8
Table 4. The performance results of the proposed 1D-CNN model.
PerformanceTrain (%)Test (%)
Accuracy99.8495.23
Precision score99.8394.90
Recall score99.7394.74
F1 score99.8194.48
Publisher’s Note: MDPI stays neutral with regard to jurisdictional claims in published maps and institutional affiliations.

