Article

Gum Acacia- and Gum Tragacanth-Coated Silver Nanoparticles: Synthesis, Physiological Stability, In-Vitro, Ex-Vivo and In-Vivo Activity Evaluations

by
Mohammad Javed Ansari
1,*,
Najeeb Ur Rehman
2,
Elmoatasim Ibnouf
3,4,
Ahmed Alalaiwe
1,
Majid Ahmad Ganaie
5 and
Ameeduzzafar Zafar
6
1
Department of Pharmaceutics, College of Pharmacy, Prince Sattam Bin Abdulaziz University, Al-Kharj 11942, Saudi Arabia
2
Department of Pharmacology and Toxicology, College of Pharmacy, Prince Sattam Bin Abdulaziz University, Al-Kharj 11942, Saudi Arabia
3
Department of Pharmaceutics (Pharmaceutical Microbiology), College of Pharmacy, Prince Sattam Bin Abdulaziz University, Al-Kharj 11942, Saudi Arabia
4
College of Medical Laboratory Sciences, Omdurman Islamic University, Khartoum P.O. Box 382, Sudan
5
Department of Pharmacology and Toxicology, College of Dentistry and Pharmacy, Buraydah Colleges, Buraidah 51418, Saudi Arabia
6
Department of Pharmaceutics, College of Pharmacy, Jouf University, Sakaka 72341, Saudi Arabia
*
Author to whom correspondence should be addressed.
Coatings 2022, 12(10), 1579; https://doi.org/10.3390/coatings12101579
Submission received: 20 September 2022 / Revised: 8 October 2022 / Accepted: 14 October 2022 / Published: 19 October 2022
(This article belongs to the Section Bioactive Coatings and Biointerfaces)

Abstract

:
The current research article presents development, characterization, stability, antimicrobial activity, antispasmodic activity and antidiarrheal activity of silver nanoparticles synthesized and stabilized by polymeric coating of gum tragacanth solution. The nanoparticles were developed by a chemical reduction of silver nitrate. The reducing sugars and polysaccharides-based natural polymers such as gum acacia, gum tragacanth, alginates and cellulose derivatives were investigated as both reducing agents and stabilizers of silver nanoparticles. Influence of the molar concentration of silver nitrate, type and concentration of reducing agent on the formation and stability of silver nanoparticles have been investigated in detail. The stability or aggregation behavior of silver nanoparticles when diluted with simulated gastric fluid, simulated intestinal fluid and phosphate buffer saline were investigated to understand the influence of biological fluids on the stability of silver nanoparticles. SNPs in basic buffers were found to be more stable compared to those in acidic buffers. Silver nanoparticles were characterized by UV absorption spectrometry, particle size and zeta potential analyzer, FTIR spectroscopy, differential scanning calorimetry, X-ray diffraction and atomic force microscopy. SNPs were found spherical within 2.5–4 nm as per atomic force microscopic studies. The silver nanoparticles developed from gum tragacanth were better and more stable than those produced by gum acacia. The smaller particle size, low polydispersity index and high zeta potential resulted in silver nanosuspensions stable over a period of six months. The silver nanoparticles were found to exhibit significant antimicrobial, antispasmodic and antidiarrheal activities.

1. Introduction

Silver has been used as a safe and effective antimicrobial agent, wound healing agent and anti-inflammatory agent for centuries. The advent of nanotechnology has resulted in substantial growth in the development and investigation of silver nanoparticles (SNPs), owing to the great potential of both nanotechnology, as well as silver. Therefore, SNPs have become one of the most widely investigated metallic nanoparticles, either as nanomedicine or drug delivery carriers, for a wide range of biological applications such as antibacterial, antifungal, antiviral and anticancer, etc.
The method of preparation or fabrication of nanoparticles can broadly be grouped as either a “bottom up” or a “top down” method. The bottom up method includes techniques to assemble atoms to nuclei and subsequent precipitation to nanoparticle size range, while the top down method includes techniques to break down bulk materials into a nanoparticle size range. There are several methods of syntheses of SNPs, such as physical, chemical electrical, electrochemical, biological, thermal etc. [1,2]. Every method has its own advantages and drawbacks reported elsewhere [2,3,4]. Among these methods, chemical synthesis is one of the most common methods, due to its simplicity, rapidity and cost feasibility. The chemical method is based on the bottom up technique, wherein silver precursors such as silver nitrate [5], silver chloride [6], silver citrate [7,8] and silver phosphate [9] are chemically reduced to silver ions by reacting with reducing agents such as formic acid [9], sodium borohydride [10,11], sodium citrate [12], ascorbic acid [13] and formaldehyde [14], which are subsequently stabilized by polyvinylpyrrolidone [11,15,16], polyethylene glycol [14] and polyethyleneimine [13]. However, toxicity of the chemicals used in the chemical synthesis process limits the application of this method [17].
Attempts have been made to replace the synthetic chemicals by semi-synthetic or natural compounds and plant extracts as reducing agents and stabilizing agents for the synthesis of SNPs. For instance, reducing sugars [18,19,20], cellulose derivatives [21], chitosan [22], aloe vera extract [23] and lavender extract [24] have been reported as reducing agents in SNP synthesis. Likewise, gelatin [25,26], starch [27,28], acacia gum [29], gum tragacanth [30] and guar gum [31,32] have been reported as stabilizers in SNP synthesis. Many of the reported methods have certain limitations, such as employing high temperatures (60–160 °C) and requiring long duration within a range of 1–72 h in order to carry out the reduction of silver nitrate to silver nanoparticles [33,34,35,36]. Furthermore, the stability of silver nanoparticles, agglomeration over time periods, influence of dilution by neutral vehicle such as distilled water and influence of buffered vehicles on the agglomeration or stability have not been reported in the literature.
The current study has been undertaken to investigate and compare natural or semi-synthetic compounds which could possibly be used as the most efficient natural compound as a dual reducing, as well as stabilizing agent for the synthesis and stabilization of SNPs. In the current study, we have investigated polysaccharide-based natural compounds such as cellulose derivatives (carboxy methyl cellulose, hydroxyl propyl methyl cellulose) gum acacia (GA), gum tragacanth (GT) and alginates as dual action reducing, as well as stabilizing agents for the synthesis and stabilization of SNPs. The proposed natural compounds would have several benefits over the chemical reducing agents employed generally for SNP synthesis, such as acting as a dual capping agent and reducing agents, as well as stabilizing the SNP dispersions by minimizing agglomeration without the use of an additional stabilizer, in addition to minimizing the inherent toxicity associated with chemical compounds. Moreover, ultra-sonication has been employed in the synthesis method to avoid the requirement of high temperatures (60–160 °C) or long durations (1–72 h) reported for the reaction to occur. In addition, the stability of SNPs in physiological buffers has been investigated in order to understand the fate of SNPs in these conditions.

2. Materials and Methods

Silver nitrate, gum acacia, gum tragacanth acetylcholine chloride, loperamide hydrochloride, carbachol (CCh), dicyclomine, hydrochloric acid, glacial acetic acid and castor oil were obtained from Sigma Chemical Company (St. Louis, MO, USA). Research-grade salts to prepare physiological buffer were obtained from Merck, Germany, and include sodium chloride, magnesium sulphate, potassium chloride, glucose, sulphate magnesium chloride, calcium chloride, potassium dihydrogen phosphate, sodium dihydrogen phosphate and sodium bicarbonate. For in-vitro and ex-vivo assays, stock concentrations were prepared using distilled water, while normal saline was as solvent for drugs for in-vivo assays.

2.1. Synthesis and Characterization of SNPs

The SNPs were synthesized by using silver nitrate as a precursor, which was chemically reduced by GA, GT, carbohydrates, alginates and cellulose derivative-based polymers in alkaline media to silver ions, followed by nucleation and stabilization as silver nanoparticles in natural or semi-synthetic polymeric solutions. Briefly, a 0.1 M aqueous solution of silver nitrate and sodium hydroxide was prepared. Similarly, 1% w/v aqueous solutions of polymers were prepared. In the preliminary experiments, 50 microliters of silver nitrate solution was mixed with 50 microliters of sodium hydroxide. To this mixture, 400 microliters of distilled water and 500 microliters of polymeric solution were added and vertex mixed for 30 s. Such mixtures were prepared using the different polymeric solutions in question, followed by the ultrasonication of these mixtures for 30–120 min, set at a 40 Kz frequency with an amplitude of 80%, and a temperature of 60 °C (WUC-D06, Witeg, Germany). The formation of SNPs was ascertained by Ultraviolet-Visible (UV-Vis) Spectroscopic studies, owing to their distinct optical behavior as metallic nanoparticles, exhibit a distinct optical feature called localized surface plasmon resonance (LSPR) at specific wavelengths. The synthesized SNP suspensions with or without dilution were scanned between 300–600 nm under double beam UV spectrophotometer (UV 630 V, Jasco, Japan).

2.2. Effect of Physiological Buffers on the Prepration and Stability of SNPs

The reduction of silver nitrate to SNPs was also investigated in different buffers (simulated gastric fluid pH 1.2, acetate buffer pH 4.0, simulated intestinal buffer pH 6.8 and phosphate buffer saline pH 7.4) with or without sodium hydroxide, in order to evaluate the stability of SNP in these buffers. The SNPs were synthesized by adding buffer solutions instead of distilled water in a mixture of precursor and stabilizer with or without sodium hydroxide. Alternatively, freshly prepared distilled water-based SNP suspension was diluted 10 times with these buffers, and optical behavior was monitored at 0, 15, 30, 45, 60 and 120 min.

2.3. Effect of Sodium Hydroxide on the Prepration of SNPs

The influence of sodium hydroxide (alkaline medium) on the reduction of silver nitrate to SNP was investigated by incorporating 0, 5, 10, 20, 40, 80 and 90 mM of sodium hydroxide in the mixtures of the precursor and stabilizer.

2.4. Effect of Silver Nitrate on the Prepration of SNPs

The influence of silver nitrate on the preparation of SNP was investigated by varying silver nitrate amounts of 1, 2, 3, 4, 5, 10, and 20 mM in the reaction mixtures.

2.5. Effect of Dilution on SNPs

The influence of dilution on SNP was investigated by monitoring optical behavior after diluting freshly prepared SNP 0-, 10- and 100-fold.

2.6. Stability of SNPs over a Time Period of 12 Months

The influence of time period on SNP suspensions were investigated by monitoring optical behavior and size analysis at day 0, day 1, day 7, 3 months and 1 year after preparation.

2.7. Lyophilization of SNPs and Solid State Characterization

SNP suspensions were lyophilized to obtain solid state SNPs, which were then subjected to characterization by XRD, DSC, FT-IR and AFM.

2.8. Antibacterial Activity Evaluation

Antibacterial activity of SNP was investigated against gram positive and gram negative bacteria using a well diffusion medium [37]. Muller Hinton agar medium was prepared and sterilized, as described previously [38]. Approximately twenty milliliters of the media was poured onto petriplates, followed by seeding with bacterial culture. Approximately 100 μL of the pure ciprofloxacin or SNP suspension were added into wells and incubated at 37 °C for 24 h. The antibacterial activity was evaluated by measuring the zone of inhibition developed around the well.

2.9. Ex-Vivo and In-Vivo Activity Evaluation

2.9.1. Ex-Vivo Antispasmodic Activity Evaluation

To study the possible smooth muscle relaxant effect of the test sample, we used 2 cm-long segments of ileum obtained from rats after cervical dislocation, and the tissues were transferred to organ bath (emkaBath, Paris, France) with attached transducer and IOX software (version 2, emka Technologies, Paris, France) to record the responses. The tissue baths containing fresh physiological buffer (Tyrode’s solution) were aerated with bubbles of carbogen (95% O2 and 5% CO2) using a gas cylinder, while the physiological temperature of 37 °C was maintained by the inbuilt controlled heating system in emkaBath. After half an hour of incubation, the ileum tissues were exposed to repeated doses of 0.3 µM acetylcholine and washed with fresh buffer in order to receive equal contractions. After the ileum tissue was stabilized, the test material was tested for ileum smooth muscle relaxation, and different spasmolytic mechanism(s) such asanticholinergic and Ca2+ channel antagonist (CCB) were explored using carbachol (CCh; 1 µM) and high K+ (80 mM)-evoked spasms [39].

2.9.2. In-Vivo Antidiarrheal Activity Evaluation

For diarrhoea protection determination, BALB/c mice with approximate weights of 20–25 g of both male and female gender were obtained from the animal house facility located at Prince Sattam Bin Abdulaziz University. After acclimatization, all mice were deprived of food for 24 h prior to startoral dosings. During routine housing, the mice had free access to tap water with pallets of balanced feed, including (g/kg): fiber 380, flour 380, molasses 12, nutrivet L 2.5, edible salt (NaCl) 5.8, potassium metabisulfate 1.2, fish meal 170, vegetable oil 38 and dry milk 150. Due care was taken while handling the animals following the instructions specified in [40]. The Bio-Ethical Research Committee (BERC), Prince Sattam Bin Abdulaziz University, approved the current study protocol (BERC-004–12–19).
Following 24 h of fasting, the mice were assigned into five equal groups with random number of male and female [41]. Normal saline (10 mL/kg, i.p.) was administered to mice of the 1st group, which acted as a negative control. The 2nd, 3rd and 4th group mice were administered orally the increasing doses of SNPs at 1, 3 and 10 mg/kg (i.p), respectively. The 5th group mice were administered with a standard antidiarrheal agent, loperamide (10 mg/kg, i.p), and were labelled as positive control. After 1 hr, each individual mouse was exposed to castor oil (10 mL/kg, p.o.) using oral gavage, and was kept in a separate cage with a blotting sheet as bedding to record diarrhoea spottings. After 4 h of the castor oil administration, all cages were evaluated by a blind observer for counting of the number of wet, dry and total feces, and the results were compared with the 1st group (negative control).

2.9.3. Statistical Analysis

The obtained results were expressed as mean ± standard error of mean (S.E.M.) and the median effective concentrations (EC50 values) with 95% confidence intervals (CI). The concentration-response curves were statistically analyzed by GraphPad Prism 4 (Dotmatics, San Diego, CA, USA), following non-linear regression. To compare the diarrhea assay observations, one-way ANOVA was followed, followed by the Tukey-Kramer Multiple Comparisons test.

3. Results

3.1. Synthesis and Characterization of SNPs

The SNPs were synthesized by using silver nitrate as precursor, which was chemically reduced by GA, GT, carbohydrates, alginates and cellulose polymers in alkaline media to silver ions, followed by nucleation and stabilization as SNP in the natural or synthetic polymeric solutions. The formation of SNP can be easily ascertained by observation of yellowish, brownish to grayish color, as exhibited by suspensions of SNPs with varying size. The preliminary studies revealed that GA and GT successfully reduced the silver nitrate to SNP, and subsequently stabilized against aggregation. The development of brownish color can be seen with GA and GT in the inset of Figure 1b.
The formation of SNPs can also be ascertained by Ultraviolet-Visible (UV-Vis) spectroscopic studies, owing to their distinct optical behavior. Metallic nanoparticles exhibit a distinct optical feature called localized surface plasmon resonance (LSPR) at specific wavelengths. SNP exhibited this optical resonance between 410–420 nm, as shown in the Figure 1. The clear solution of silver nitrate, the precursor of SNP, did not exhibit such resonance, while the yellowish-brown solution exhibited a prominent resonance at approximately 410 nm, suggesting the formation of SNPs in the yellowish-brown solution.

3.2. Effect of Physiological Buffers on the Prepration and Stability of SNPs

The reduction of silver nitrate to SNP was investigated in different buffers, in addition to distilled water, in order to investigate the fate of silver nanoparticles in the buffers such as simulated gastric juice, acetate buffer, simulated intestinal buffer and phosphate buffer saline. It has been observed that alkaline medium is necessary for the synthesis of SNPs, as the formation of silver nanoparticles did not occur when sodium hydroxide was not added to the reaction mixtures, as evidenced from absence of a yellow or brown color, while the presence of sodium hydroxide favored the development of a relatively more intense yellowish-brown color, as shown in the inset of Figure 2.
The effect of physiological buffers on the preparation and stability of SNPs was further investigated by comparing the UV-Visible spectroscopic resonance behavior of SNPs, prepared with or without buffers. The results are presented in Figure 2.
To explore the stability profile of SNP in the physiological buffers, the freshly prepared SNPs in distilled water with sodium hydroxide were diluted 10-fold with different buffers (simulated gastric juice, acetate buffer, simulated intestinal buffer and phosphate buffer saline), and compared with those diluted with distilled water. The stability or instability of the diluted SNP suspension was ascertained by monitoring color change and change in the optical resonance under UV-Vis spectroscopic evaluations. The effect of various physiological buffers on the stability or instability (change of color) of SNP suspension prepared and stabilized by GA and GT has been depicted in Figure 3.
GT was found to provide better synthesis and stabilization of SNP across all the investigated buffer solution, as compared to that provided by the GA. Furthermore, GT produced SNP at a faster pace as compared to GA, as is evident from the rapid development of intense color and higher absorption bands of SNP produced and stabilized by GT (Figure 4).
Therefore, SNPs produced by GT were further investigated to explore the stability profile of SNPs in the physiological buffers over different time periods. The freshly prepared SNPs were diluted 10-fold with different buffers (simulated gastric juice, acetate buffer, simulated intestinal buffer and phosphate buffer saline), and optical resonance under UV-Vis spectroscopy was monitored between 300–600 nm at 0, 15, 30, 45, 60, 90 and 120 min after preparation. The UV spectra of SNPs diluted with distilled water and various buffers are presented in Figure 5 and Figure 6, respectively. Furthermore, Dynamic light scattering (DLS) technique was employed to measure the particle size and size distribution pattern after dilution with investigated buffers at various time points. The results are reported in Table 1.

3.3. Effect of Sodium Hydroxide on the Prepration of SNPs

The influence of sodium hydroxide (alkaline medium) on the reduction of silver nitrate to SNP was investigated by incorporating 0, 5, 10, 20, 40, 80 and 90 mM of sodium hydroxide in the mixtures of precursor and stabilizer. The results are presented in Figure 7.

3.4. Effect of Silver Nitrate on the Prepration of SNPs

The influence of silver nitrate on the preparation of SNP was investigated by varying silver nitrate amounts of 1, 2, 3, 4, 5, 10, and 20 mM in the reaction mixtures.

3.5. Effect of Dilution on SNPs

The influence of dilution on SNPs was investigated by monitoring optical behavior of SNP suspensions before and after the dilution of freshly prepared SNP by distilled water at two levels (10-fold and 100-fold). The results are presented in Figure 8.

3.6. Stability of SNPs over a Time Period of 12 Months

The influence of time period on SNP suspensions was investigated by monitoring optical behavior and size analysis at day 0, day 1, day 7, 3 months and 1 year after preparation. The results are presented in Figure 9.

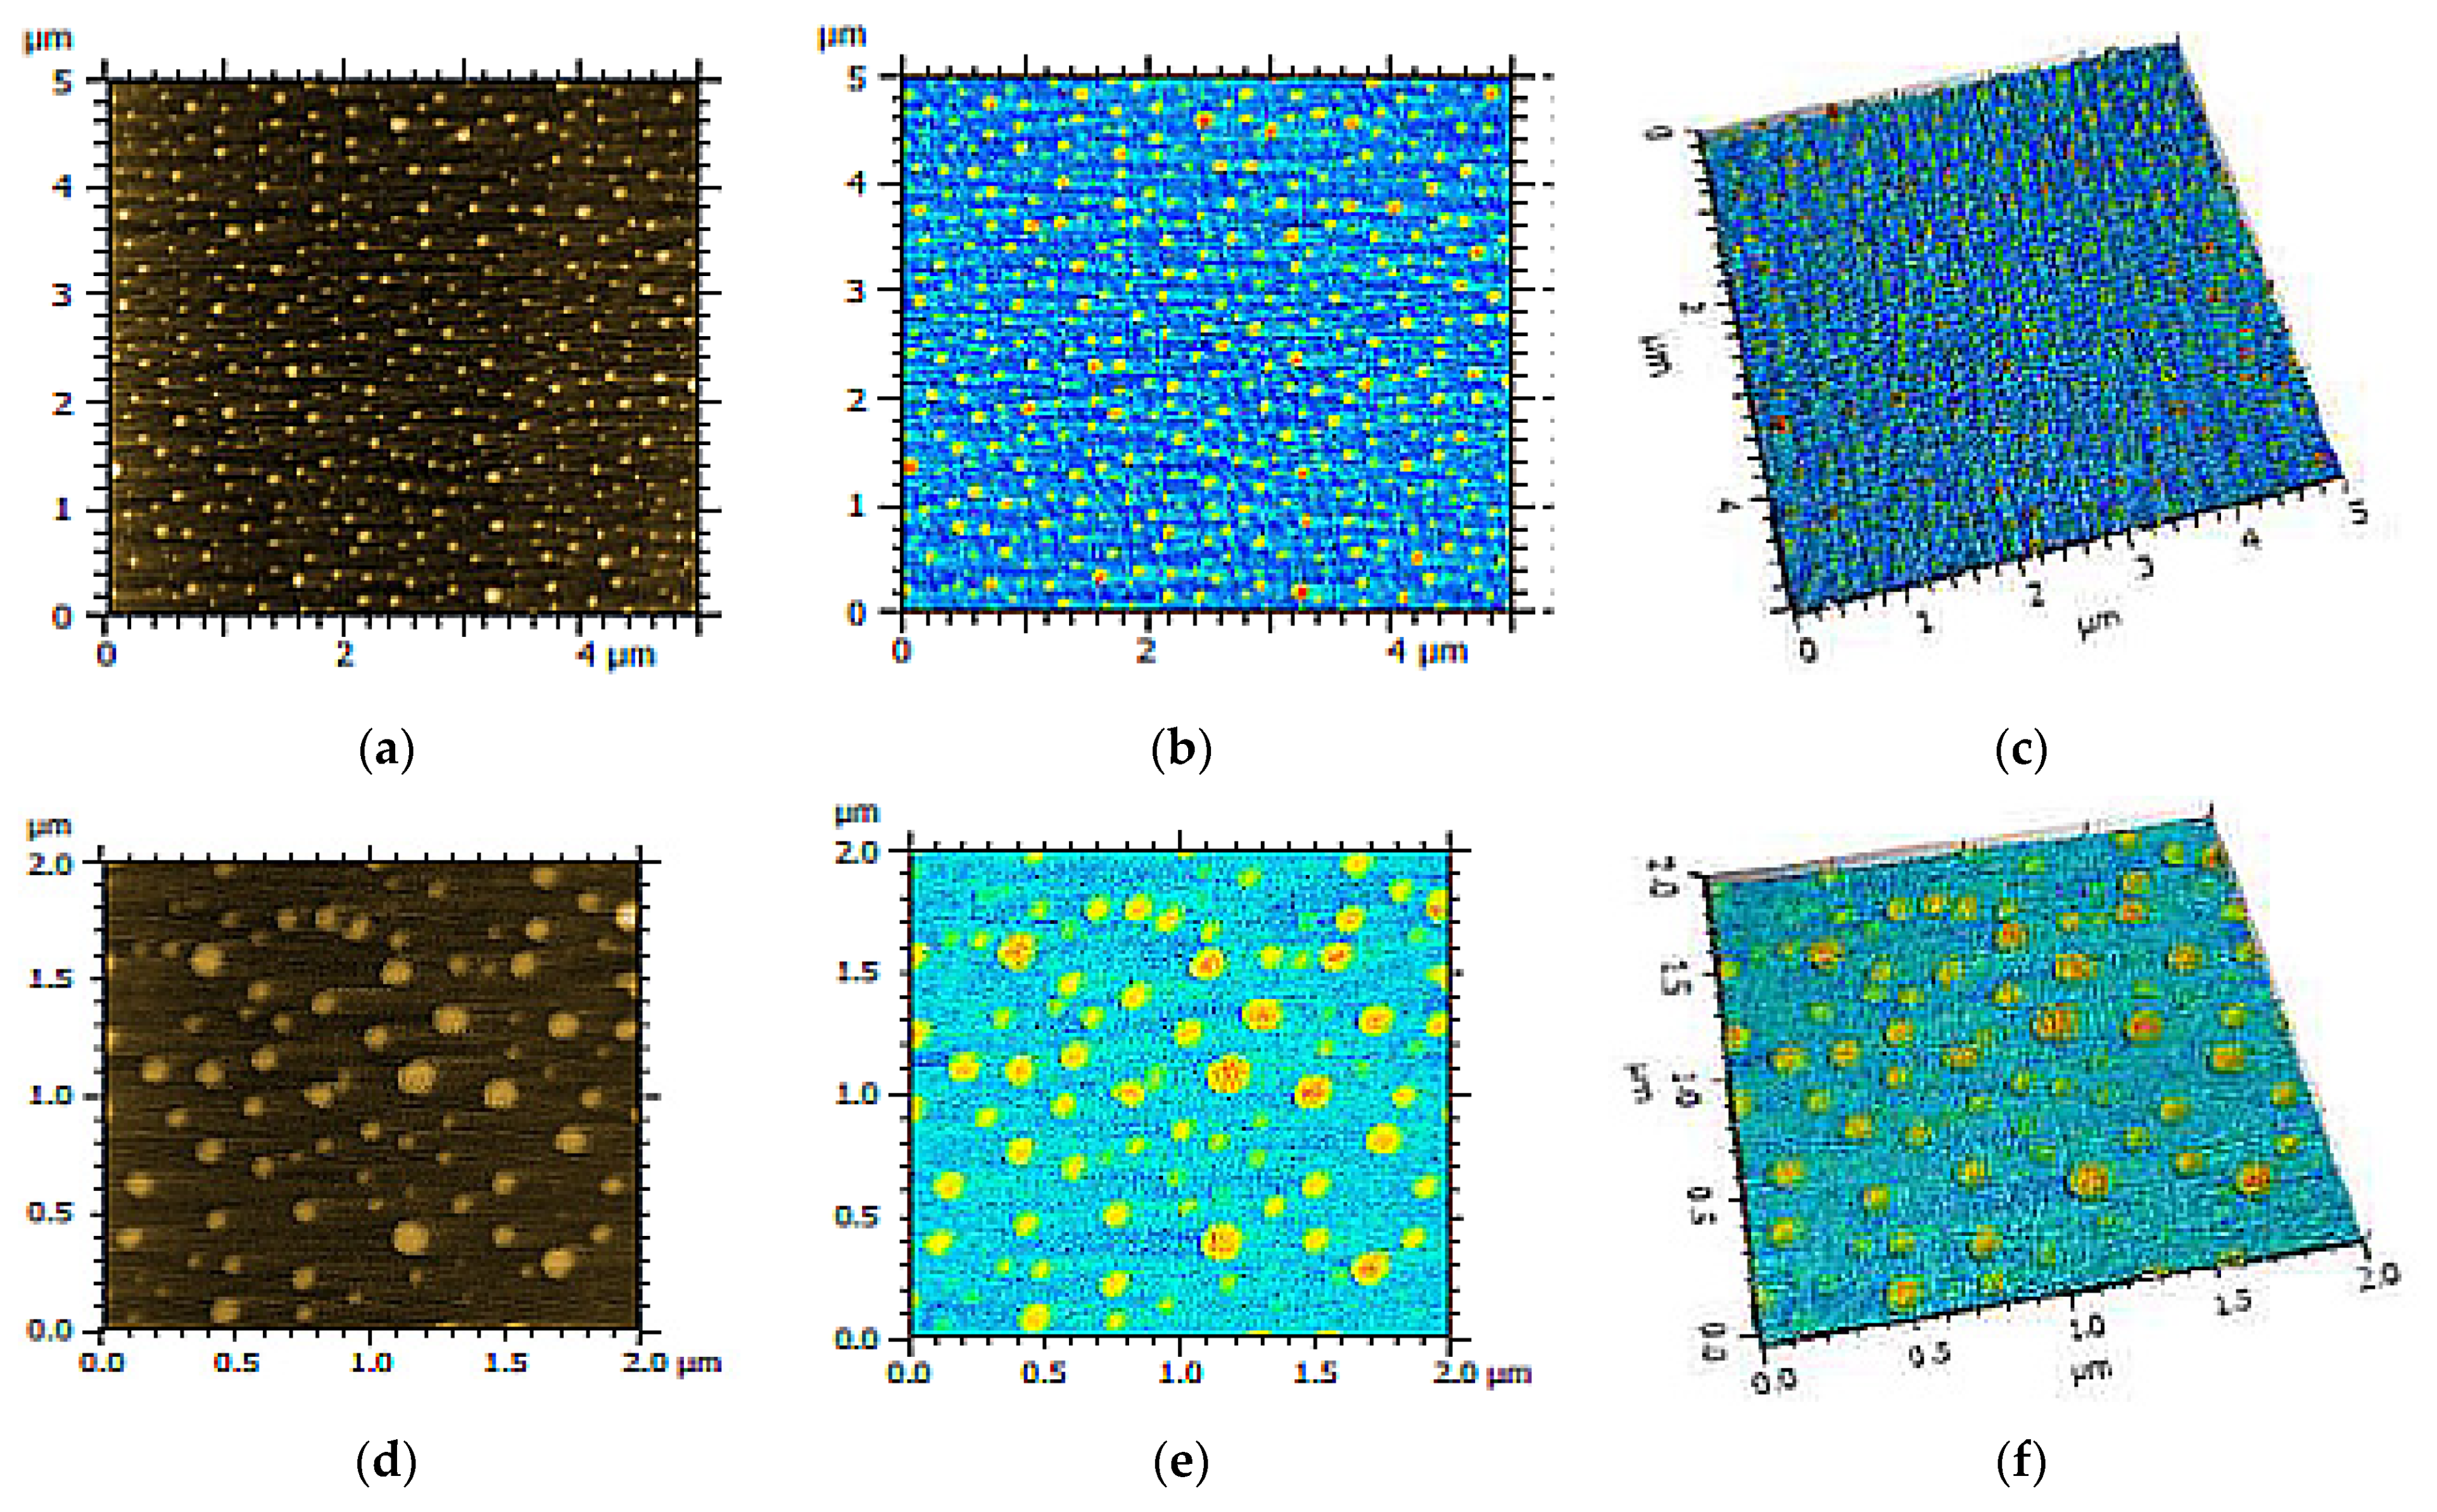
3.7. Lyophilization of SNPs and Solid State Characterization

Based on the results obtained from optical behavior, dilution, and stability studies, SNP suspension synthesized with 5 mM silver nitrate was lyophilized to obtain solid state SNPs, which were then further characterized by various techniques such as Fourier-Transform Infrared Spectroscopy (FT-IR), X-ray diffraction study (XRD), Differential Scanning Calorimetry (DSC) and Atomic Force Microscopy (AFM). The results of above characterization are presented in Figure 10, Figure 11, Figure 12 and Figure 13, respectively.

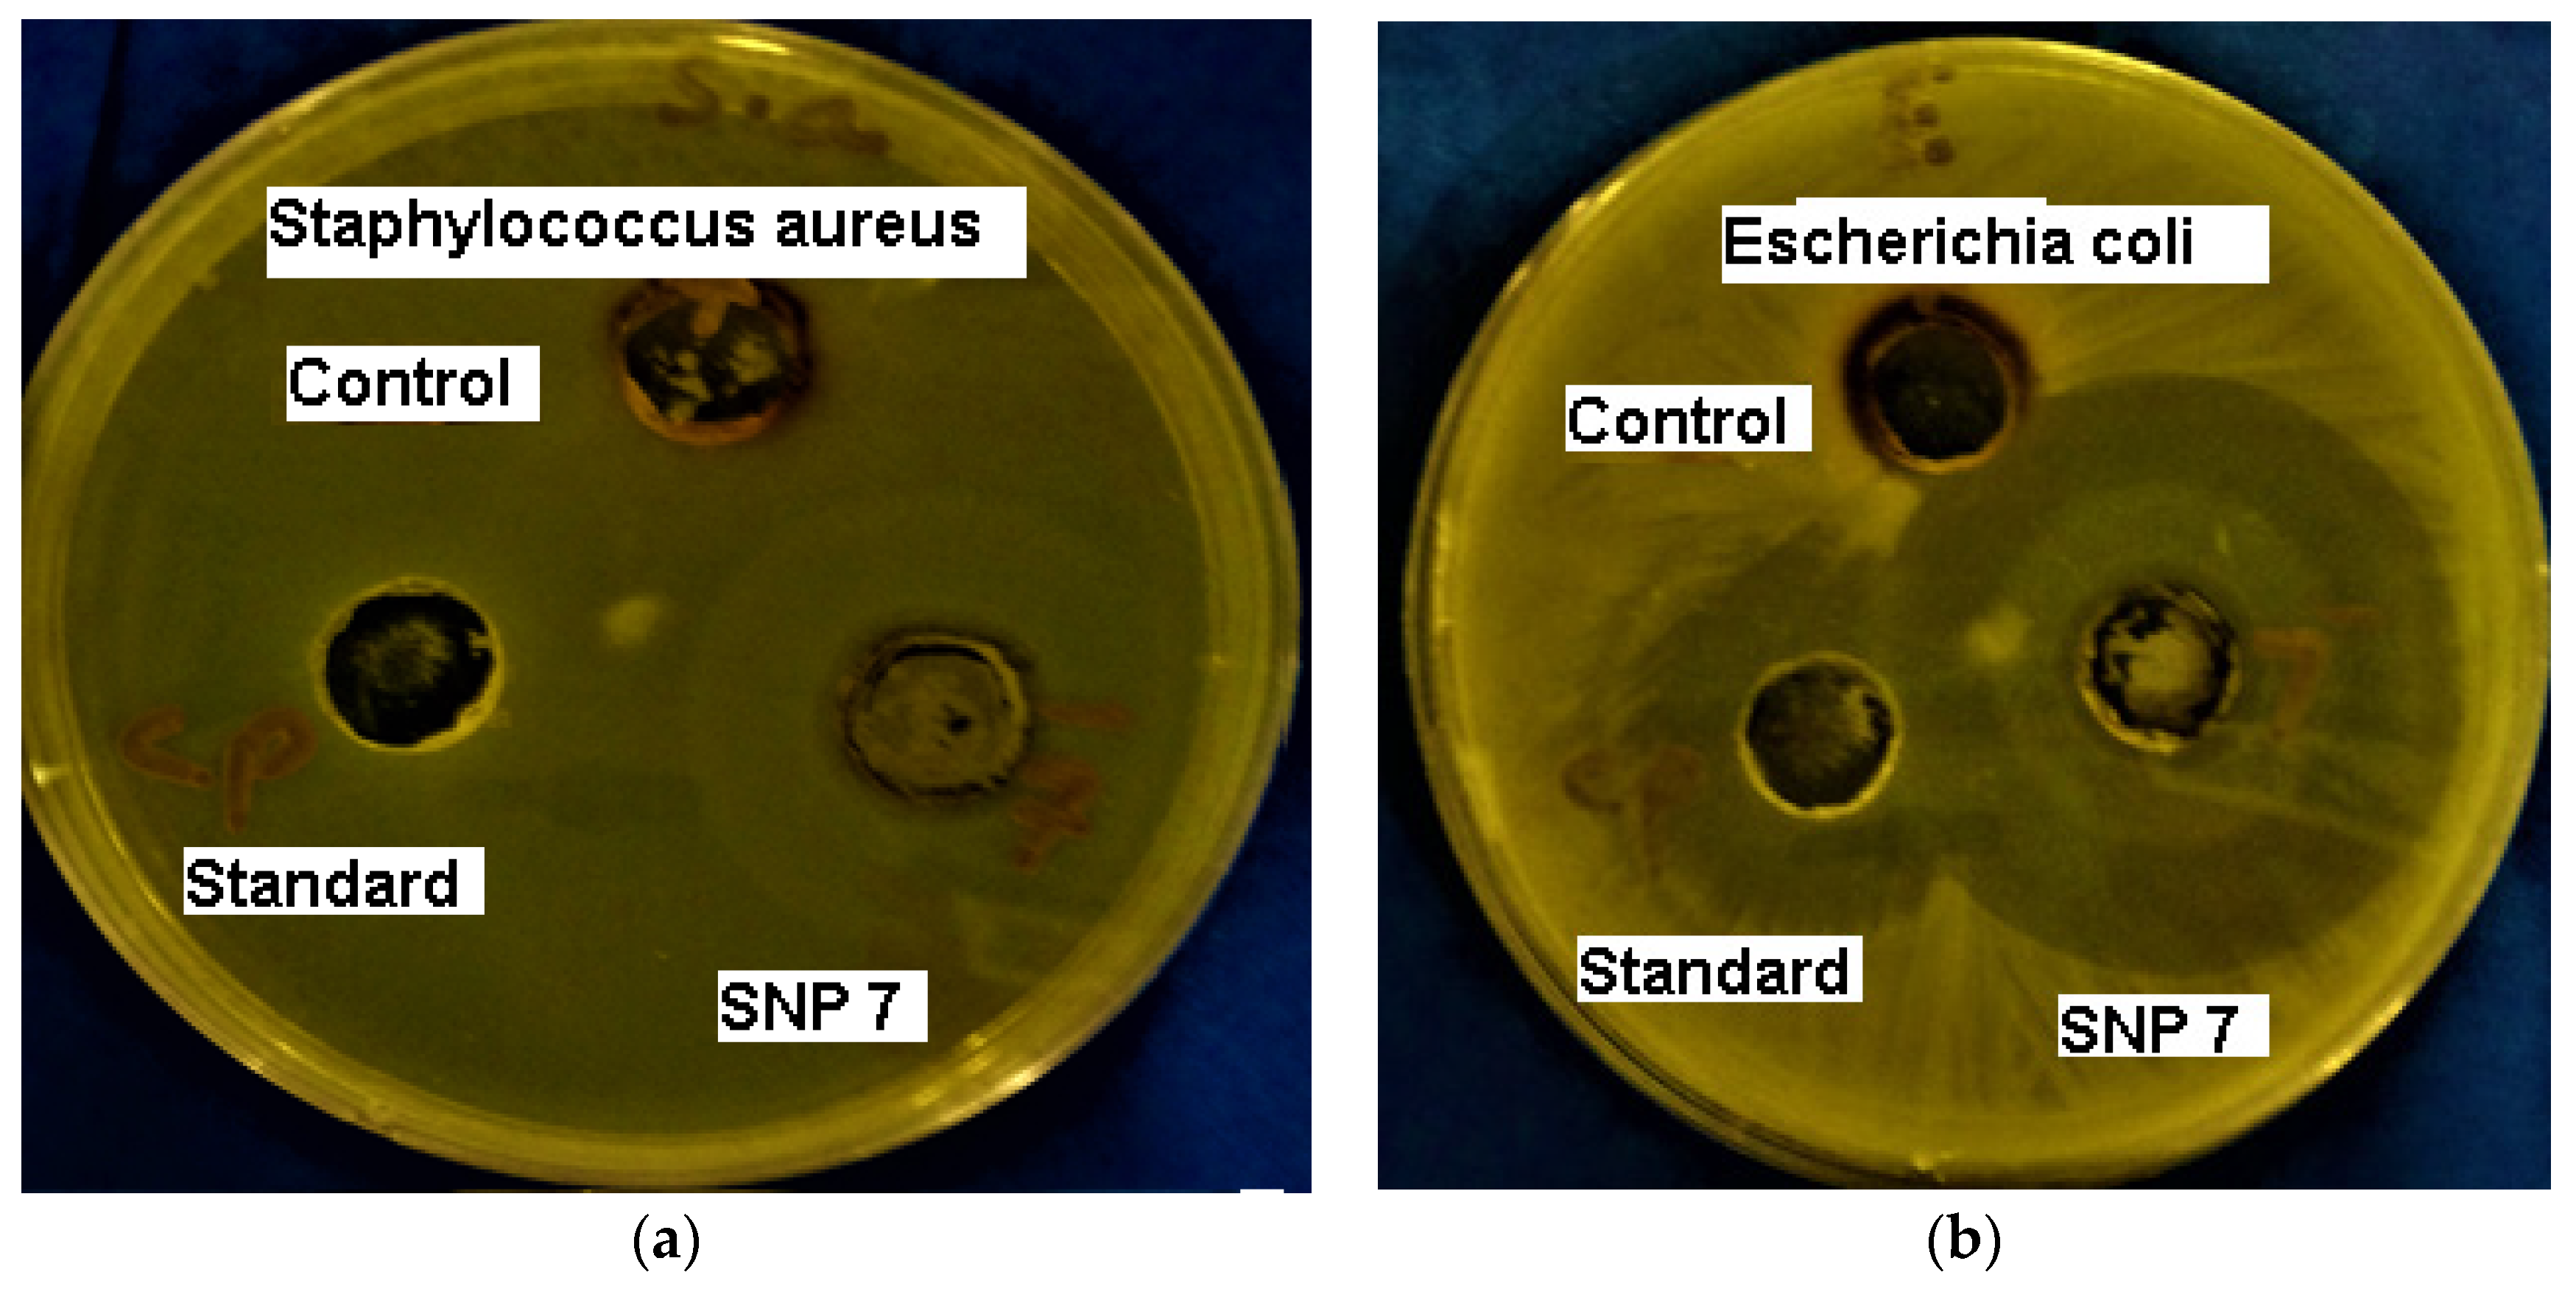
3.8. Antibacterial Activity Evaluation

The optimized silver nanoparticles were found to exhibit significant antibacterial activities against gram-positive and gram-negative bacteria, as compared to the standard (ciprofloxacin). The results are presented in Table 2 and Figure 14.

3.9. Effect on Castor Oil-Induced Diarrhea

Regarding the effect on castor oil-induced diarrhea in mice, in our experimental settings, SNPs showed a dose-dependent antidiarrheal effect in terms of a decrease in the number of wet feces compared to the vehicle-treated group. The total number of wet feces in saline group was 5.2 ± 0.48, which was decreased in a dose-dependent manner in the SNP-treated groups with 3.4 ± 0.24, 2.6 ± 0.50 and 2.00 ± 1.00, at respective doses of 1, 3 and 10 mg/kg. The loperamide-treated group showed the highest decrease in wet feces (p < 0.001), at 10 mg/kg compared to saline, as detailed in Table 3.

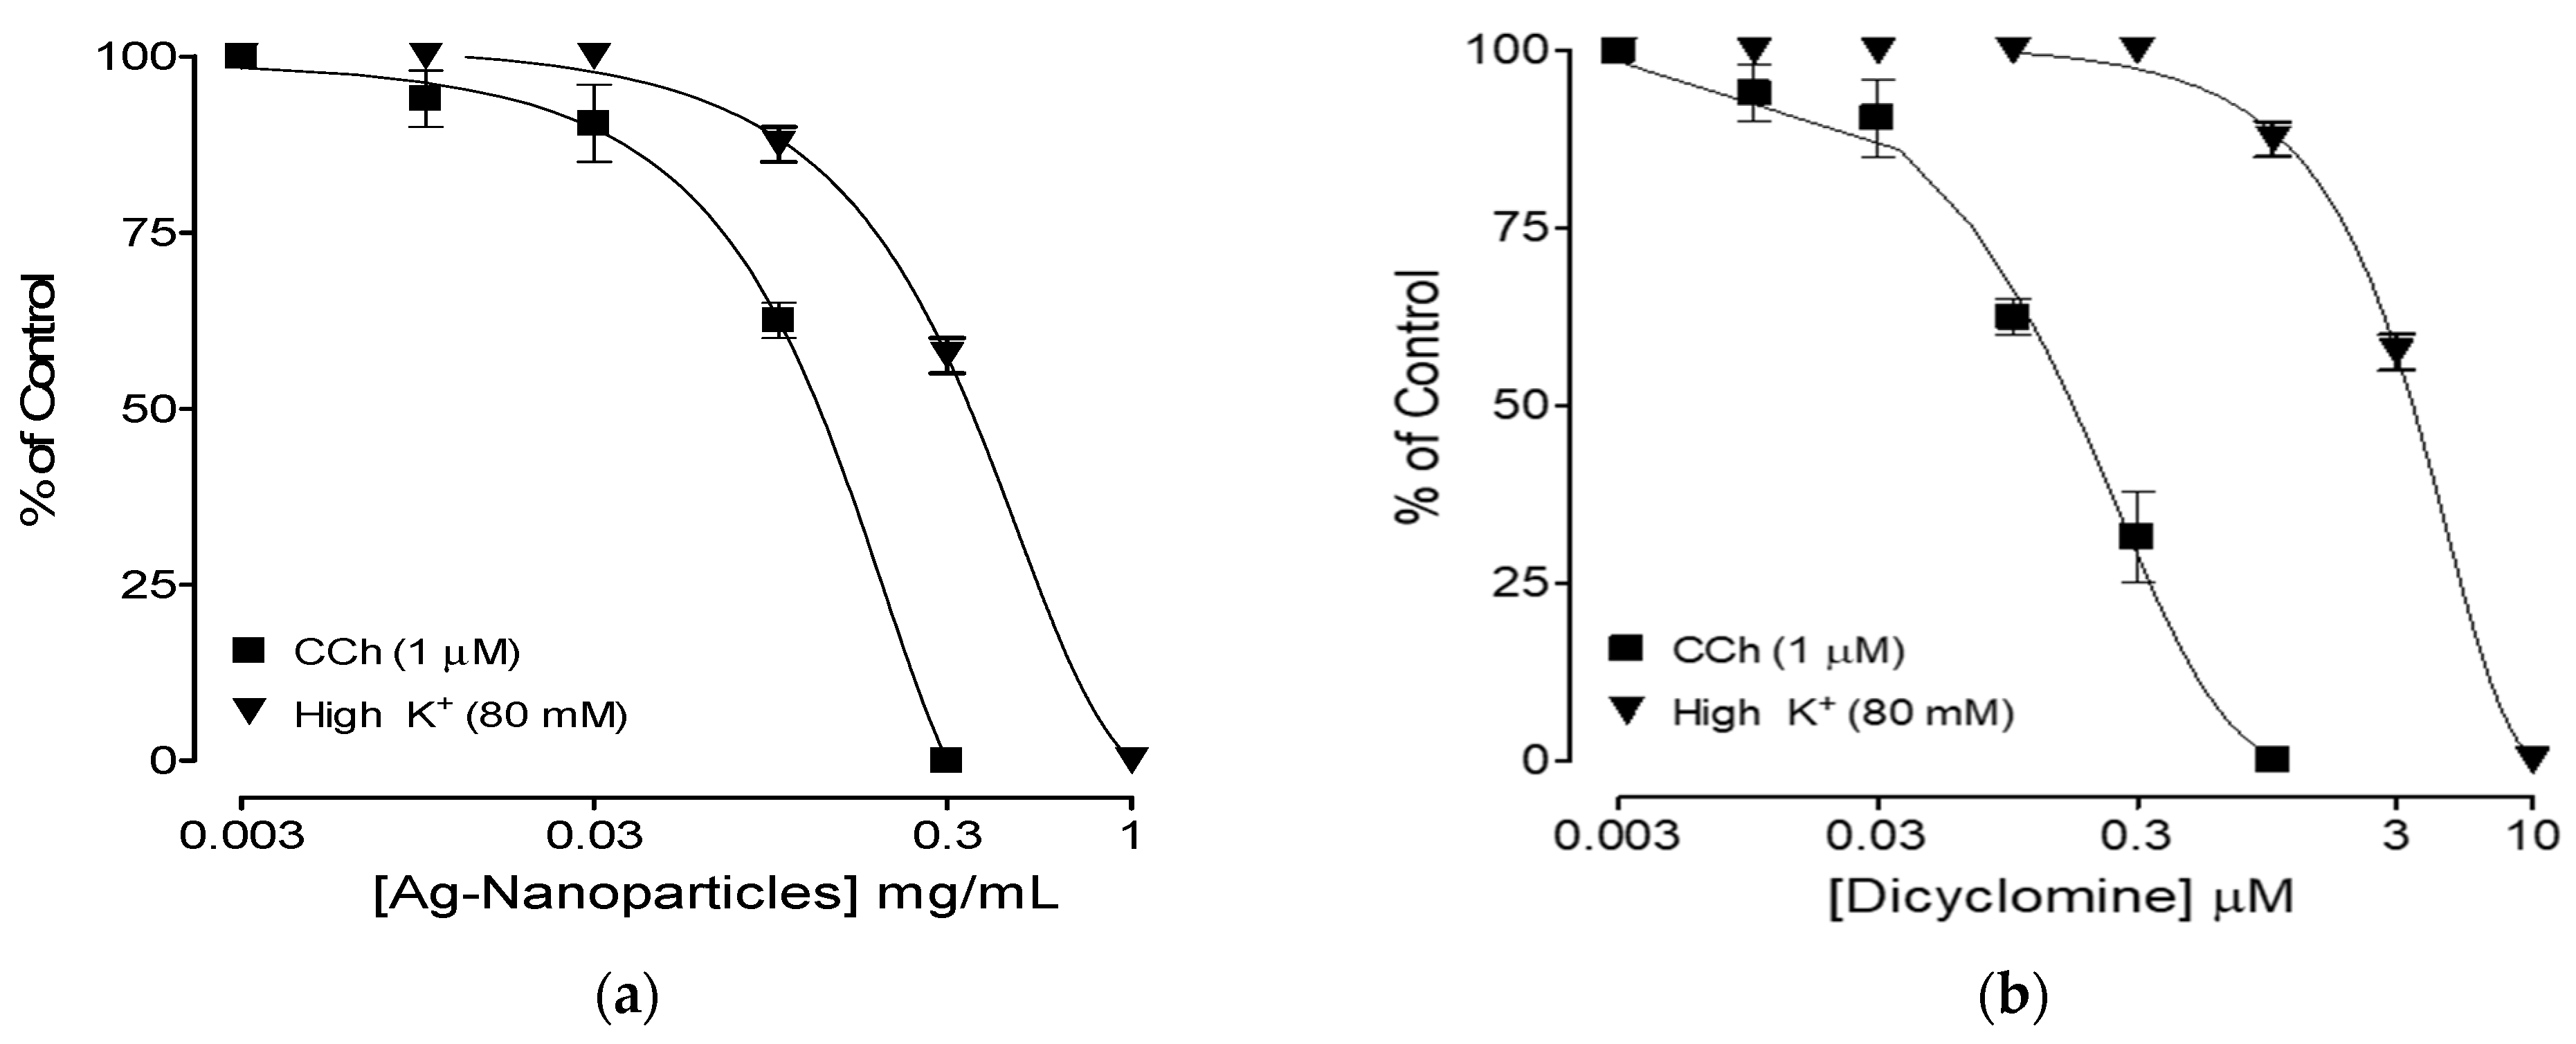
3.10. Effect on Isolated Rat Ileum

Regarding the effect on rat ileum, SNPs at concentrations ranging from 0.003 to 1 mg/mL caused dose-dependent inhibition of CCh and high K+-induced contractions with significantly higher potency against CCh compared to high K+. The resultant EC50 values against CCh and high K+ were recorded as 120 µg/mL (104–144, n = 4) and 562 µg/mL (224–748, n = 4), respectively (Figure 15a). The control drug dicyclomine also showed more potency against CCh and high K+-induced contractions with respective EC50 values of 18 µg/mL (14–32, n = 4) and 384 µg/mL (327–532, n = 4), as shown in Figure 15.

4. Discussion

4.1. Synthesis and Characterization of SNPs

The SNPs were synthesized by using silver nitrate as precursor, which was chemically reduced by GA, GT, carbohydrates, alginates and cellulose polymers in alkaline media to silver ions, followed by nucleation and stabilization as SNPs in the natural or synthetic polymeric solutions. The preliminary studies revealed that GA and GT successfully reduced the silver nitrate to SNPs, and subsequently stabilized against aggregation. The yellowish-brown color produced by GT was intense compared to those produced by GA, which suggests that GT has better efficiency and productivity as compared to GA. The better reducing capacity of GT compared to GA may be attributed to higher proportions of reducing sugars such as arabinose and fructose in the GT (ca 40%), as compared to GA (ca 20%) [42,43].
The formation of SNPs can also be ascertained by Ultraviolet-Visible (UV-Vis) Spectroscopic studies, owing to their distinct optical behavior. Metallic nanoparticles exhibit a distinct optical feature called localized surface plasmon resonance (LSPR) at specific wavelengths. SNPs are reported to exhibit this optical resonance between 400–500 nm, depending on size and concentration of nanoparticles [44,45]. The silver nanoparticle suspensions with smaller particle sizes (10–50 nm) tend to exhibit UV responses of between 400–430 nm, while those with larger particles (over 100 nm) tend to exhibit UV responses near 500 nm [46]. The clear solution of silver nitrate, the precursor of SNPs, did not exhibit such resonance, while the yellowish-brown solution exhibited a prominent resonance between 410–420 nm, suggesting the formation of SNPs in the yellowish-brown solution. In the current investigation, the silver nitrate reduced and stabilized by GT exhibited optical resonance at 417 nm, with an optical density of 0.333, while those reduced and stabilized by GA exhibited optical resonance at 409 nm, with an optical density of 0.156 (Figure 1). These results are in accordance with available literature of SNPs prepared and stabilized by GT [30,47] or GA [25,48,49]. It is also noteworthy that the silver nitrate reduced and stabilized by GT produced an intense color, thus resulting in 2.13-times higher optical density compared to those reduced and stabilized by GA, which may be due to better reducing potential of GT as compared to GA.

4.2. Effect of Physiological Buffers on the Prepration and Stability of SNPs

The reduction of silver nitrate to SNPs was investigated in different buffers in addition to distilled water, in order to investigate the fate of silver nanoparticles in the buffers such as simulated gastric juice, acetate buffer, simulated intestinal buffer and phosphate buffer saline. The selection of these buffers was made to simulate the pH conditions in body fluids such as gastric fluids, intestinal juice, blood and on the skin, in order to understand the stability of SNPs upon oral, parenteral or dermal applications. In order to avoid the neutralization of buffer or alteration of pH, sodium hydroxide was not added to the reaction mixtures. It was notheworthy that there was either no or very minimal reduction of silver ions to silver atoms, as evident from the absence of a yellow or brown color. All the reaction mixtures containing GA, silver nitrate and different buffers remained colorless, except SIF, simulated gastric fluid, which exhibited a very mild yellow color, indicating no or very minimal reduction of silver ions to the silver atom and further nucleation and formation of SNPs. However, the reaction mixtures containing GA (Figure 2b, inset), silver nitrate and different buffers exhibited the appearance of low-intensity colors as compared to those exhibited by GT (Figure 2b, inset), indicating the better reducing potential of GT as compared to GA. This could be due to the higher proportion of reducing sugars in the GT than in the GA. It was also noteworthy that both GA as well as GT exhibited a slight yellowish color in the SIF, indicating the formation of SNPs in the SIF buffer, which could be due to the fact that sodium hydroxide was a component of SIF buffer, while other buffers do not have sodium hydroxide as a component of buffer (methodology Section 3, preparation of buffers). Later on, sodium hydroxide was added to all mixtures in order to investigate its effect on SNP formation and stability. It was interesting to observe that the addition of sodium hydroxide in all buffers did not result in the formation of a considerable amount of SNP, as compared to those formed in distilled water-based mixtures of both GT, as well as GA. There was no sign of SNP formation in SGF (pH 1.2), AB (pH 4.5) and PBS (pH 7.4), though SIF (pH 6.8) and DW (pH 7.0) exhibited the formation of considerable (yellowish color) and significant (brownish color) amounts of SNP, respectively (insets in Figure 2a,b). The effect of physiological buffers on the formation of SNP was also monitored with the help of UV spectroscopy. The reaction mixtures which contained buffers exhibited no or very low surface plasmon resonance, while those containing distilled water exhibited very intense surface plasmon resonance (Figure 2a,b). This behavior indicated the positive effect of sodium hydroxide, while the negative effect of pH and buffer components on the formation of SNP. The use of an alkaline medium for the reduction of silver ions to silver atoms and the further nucleation or formation of silver nanoparticles has been found to be necessary, as the presence of sodium hydroxide favored the development of a relatively more intense yellowish-brown color. The alkaline medium in the reduction of silver nitrate and formation of SNPs has been reported to enhance the reduction rate of silver ions and nucleation rate of silver atoms for the formation of SNPs [50]. Furthermore, sodium hydroxide was reported to enhance the oxidation of reducing agents used in the formation of SNPs [50].
To further investigate the fate and stability of SNP in various physiological buffers, freshly prepared SNP in DW was diluted 10 times with investigated buffers. The color intensity (intense for GT mixtures, as compared to those of GA) and change in color from yellowish (GT-DW and GT-AB) to an amber color or brownish (GA-AB, GT-SIF and GT-PBS) or the disappearance of color (GA-SGF, GA-SIF, GA-PBS and GT-SGF) can be seen in the insets of Figure 3. The yellow-colored suspension indicates relatively smaller, stable and agglomerate-free nanosuspensions, while amber- or brown-colored suspensions indicate relatively larger nanoparticles with a tendency to agglomerate over time. The colorless suspension indicates the absence of SNP, which may be either due to agglomerates or the formation of silver ions form silver nanoparticle thus being the most unstable mixture among all investigated mixtures. All nanosuspension mixtures were also subjected to UV-spectroscopy to investigate surface plasmon resonance behavior, and the results are shown in Figure 3. The SNP prepared and stabilized by GT exhibited higher SPR (Figure 3b), compared to those prepared and stabilized by GA (Figure 3a).
GT was found to provide better synthesis and stabilization of SNP across all the investigated buffer solutions, as compared to that provided by the GA. Furthermore, GT produced SNP at a faster pace as compared to GA, as is evident from the rapid development of intense color and the higher absorption bands of SNP produced and stabilized by GT both after 30 min, as well as at 180 min (Figure 4). Therefore, SNP prepared with GT was further investigated to explore the stability profile of SNP in the physiological buffers over different time periods. The freshly prepared SNP was diluted 10-fold with different buffers (simulated gastric juice, acetate buffer, simulated intestinal buffer and phosphate buffer saline), and optical resonance under UV-Vis spectroscopy was monitored between 300–600 nm at 0, 15, 30, 45, 60, 90 and 120 min after preparation. The UV spectra of SNP diluted with distilled water and with various buffers are presented in Figure 5 and Figure 6, respectively. The optical behavior of mixture prepared in distilled water was found to be very consistent with a very slight blue or red shift and a minimal change in SPR peak intensity over the testing periods of 120 min. The SPR peaks were found at 411.2 nm for most of the observed time periods, except at 30 min and 120 min, where it was found at 411.8 nm and 410.8 nm, respectively. The mean absorbance maximum was found to be 411.23 ± 0.32, with a very small coefficient of variation of only 0.07%. The average change in the absorption maximum over the entire investigation periods with respect to zero time was found as only 0.008%. The SPR peak intensity ranged between 0.269–0.371, with a mean peak intensity of 0.308 ± 0.037 and a coefficient of variation of 12.35%. The peak intensity at zero time was 0.371, which decreased to 0.269 at 15 min, though later it gradually increased to 0.355 at 120 min. The average change in the peak intensity over the entire investigation periods with respect to zero time was found to be −14.2%. The consistency in the peak absorbance maximum and slight change in peak intensity indicates the absence of aggregation during the testing period on 120 min, and thus nanoparticle suspension was considered as physically stable (Figure 8).
The optical behavior of SNP suspension diluted with different buffers is presented in Figure 6. The SGF was found to cause blue shift, a hypsochromic effect, in Figure 6a. The SPR peaks of SNP in SGF were found within 404.8–406.4 nm, which were within 410.8–411.8 nm for SNP in DW. The mean wavelength of maximum absorbance in SGF was found to be 404.13 ± 0.41, as opposed to that of 411.23 ± 0.32 found in DW. The SPR at lower wavelengths is reported to be due to smaller SNPs. Thus, SNP in SGF seems to have a smaller particle size as compared to SNP in DW. However, approximate decreases of 44% and 70% in SPR peak intensity of SNP in SGF, as compared to SNP in DW at zero min and 120 min, respectively (0.163 versus 0.371 at zero min and 0.130 versus 0.355 at 120 min), indicated instability of SNP in SGF. The mean peak intensity in SGF was found to be 0.125 ± 0.019 (CV 15.6%), as opposed to 0.308 ± 0.037 (CV 12.3%) found in DW, and thus SGF caused an average decrease in peak intensity of about 40.6% with respect to DW. It was also observed that the average decrease in peak intensity over the time period of 120 min, as compared to zero time, was higher for SGF as opposed to DW (−27.7% versus −14.2%). Furthermore, the SPR peaks in SGF became irregular and distorted, compared to those observed with DW.
The SPR peaks of SNP in AB lay within 403.6–405.4 nm, thus exhibiting a slight blue shift as compared to SNP in DW Figure 6b. The mean wavelength of maximum absorbance in AB was found to be 403.93 ± 0.78, as opposed to 411.23 ± 0.32 found in DW. The mean peak intensity in AB was found to be 0.255 ± 0.021 (CV 8.3%), as opposed to 0.308 ± 0.037 (CV 12.3%) found in DW, and thus AB caused an average decrease in peak intensity of about 17% with respect to DW. It was also observed that the average decrease in peak intensity over the time period of 120 min, as compared to zero time, was almost similar for both AB, as well as DW (−12.3% versus −14.2%). It was noteworthy that SNP in AB remained relatively more stable, as compared to SGF, as only a 23.1% decrease in peak intensity was observed in AB, as opposed to a 70% decrease in SGF after 120 min. Moreover, the SPR peaks in AB remained almost similar to those observed with DW (Figure 6b). Thus, it is revealed that SNPs in strongly acidic media are less stable compared to weakly acidic media.
The SPR peaks of SNP in SIF remained mostly consistent, and lay within 404.4–404.8 nm, thus exhibiting a slight blue shift as compared to SNP in DW Figure 6c. The mean wavelength of maximum absorbance in SIF was found to be 404.71 ± 0.16, as opposed to the 411.23 ± 0.32 found in DW. It was noteworthy that SNP in SIF exhibited only 27% peak intensity, as compared to DW at zero minute (0.101 vs. 0.371), which indicated the detrimental effect of SIF over formation of SNP, though surprisingly, the peak intensity increased gradually with the time, and was found to be slightly higher than those observed in DW, at 120 min (0.358 vs. 0.355). The gradual increase in peak intensity over this time may be due to the presence of sodium hydroxide and the higher pH of SIF compared to SGF and AB. The mean peak intensity in SIF was found to be 0.264 ± 0.093 (CV 35.1%), as opposed to the 0.308 ± 0.037 (CV 12.3%) found in DW, with SIF thus causing an average decrease in peak intensity of only 14.3%, with respect to DW. It was noteworthy that the SNP in SIF was found to be relatively more stable than both in SGF and AB, as only a 9.6% decrease in peak intensity was observed, as opposed to approximately 70% and 23% decreases in SGF and AB, respectively, after 120 min. Furthermore, the SPR peaks in SIF remained almost similar to those observed with DW (Figure 6c).
The SPR peaks of SNP in PBS were found at 400 nm, thus exhibiting a slight blue shift as compared to SNP in DW (Figure 6d). Moreover, the peaks remained the same throughout the testing period of 120 min, indicating the absence of aggregation and any stability issue in the SNP suspended in PBS. The mean wavelength of maximum absorbance in PBS was found to be 404.71 ± 0.16, as opposed to the 411.23 ± 0.32 found in DW. It was noteworthy that SNP in PBS also exhibited only a 26.9% peak intensity, as compared to DW at minute zero (0.100 vs. 0.371), which indicated the detrimental effect of PBS over the formation of SNP, though surprisingly, the peak intensity increased gradually with the time, and reached approximately 89% of those observed in DW, at 120 min (0.315 vs. 0.355). The gradual increase in peak intensity over this time may be due to the higher pH of PBS, as compared to SGF and AB. The mean peak intensity in PBS was found to be 0.232 ± 0.072 (CV 31.3%), as opposed to the 0.308 ± 0.037 (CV 12.3%) found in DW, with PBS thus causing an average decrease in peak intensity of about 24.7%, with respect to DW.
All the buffer solutions investigated in the current study were found to influence the stability of SNP, except PBS, as evident from changes in the SPR bands and SPR peak intensities. The mean SPR band of SNPs after dilution with SGF, AB, SIF and PBS were found to be 405.2 ± 0.41, 403.9 ± 0.79, 404.7 ± 0.17 and 400.0 ± 0.00, respectively. The mean SPR band intensity of SNPs after dilution with SGF, AB, SIF and PBS were found to be 0.125 ± 0.019, 0.255 ± 0.021, 0.264 ± 0.093 and 0.232 ± 0.072, respectively. The % average change in SPR of SNPs over the time after dilution with SGF, AB, SIF and PBS were found to be 0.11%, 0.43%, 0.03% and 0.00%, respectively. The % average change in SPR peak intensities over the time after dilution with SGF, AB, SIF and PBS were found to be −27.73%, −12.27%, 194.46% and 155.64%, respectively. The negative change in the peak intensities and overall lower peak intensities in SGF and AB indicate their detrimental effect on the stability of SNP, as compared to positive change in peak intensities and overall higher peaks observed with SIF and PBS. It has thus been revealed that SNPs are more stable in the basic buffers, as compared to acidic buffers.

4.3. Effect of Sodium Hydroxide on the Prepration of SNPs

The reaction mixture with zero concentration of sodium hydroxide did not form SNP, as evident from the absence of a yellowish-brown color formation and the absence of an SPR band under UV spectroscopic evaluation (Figure 7). These results are in accordance with the available reports [51,52]. The sodium hydroxide at 5 mM in reaction mixture produced a SPR band of 412.8 nm, with a peak intensity of 0.317. The sodium hydroxide was found to have a direct relationship with SPR peak intensity, as increasing concentrations to 10 mM, 20 mM and 40 mM resulted in increased peak intensities of 0.465, 0.568 and 0.601, respectively. A further increase in sodium hydroxide concentration to 80 mM or 90 mM did not exhibit a further increase in the SPR peak intensit—rather, a decrease in peak intensity was noted, which could be due to the insufficient amount of the reducing agent GT, as compared to the excess of sodium hydroxide in the reaction mixtures.

4.4. Effect of Silver Nitrate on the Prepration of SNPs

The concentration of precursor, silver nitrate, was also found to have a direct relationship with the formation of SNP, as evident from the more intense color and higher SPR peak intensities (Figure 8) observed with increasing concentrations of the precursor (1–20 mM). These results are in accordance with the available reports [53,54].

4.5. Effect of Dilution on SNPs

The original mixtures exhibited peak bands of between 407.4–417.2 nm with peak intensities within 2.286–2.649 (Figure 8a), while 10-dilution with distilled water resulted to SPR bands within 403.2–418.2 nm with peak intensities between 0.376–0.729 (Figure 8b). Further dilution 100-fold resulted in peak bands between 414–417.8 nm with peak intensities between 0.09–0.361 (Figure 8c). It was noteworthy that diluted samples exhibited better SPR bands (more consistent SPR peaks and less variation in maximum absorption wavelengths) with higher peak intensities as compared to undiluted samples. In addition, peaks were distorted in the undiluted samples, which remained symmetrical in the case of diluted samples. It has been revealed that the dilution of SNPs greatly affects its color intensity and absorption bands. The suitable dilution is critical to the measurement of SNPs. These results are in accordance with the available report [55].

4.6. Stability of SNPs over a Time Period of 12 Months

The stability of SNP with respect to time period was also investigated by measuring SPR peak bands and intensities of 100-fold diluted samples at day zero, day 1, day 7, day 90 and 360 days after preparation. The freshly prepared SNP suspensions exhibited peak bands between 403.6–424.2 nm and peak intensities within 0.188–0.355, with mean values of 412.57 nm and 0.258, respectively (Figure 9a). The peak intensities were found between 0.271–0.537 with an average of 0.381 thus exhibiting approximately a 1.5-fold increase with respect to freshly prepared SNPs, which further increased to 0.591 after one month (a ~2.3-fold increase compared to intensity observed at day 1) (Figure 9c). The increase in the intensity over the time could be due to a further reduction of the precursor to SNPs. The average SPR peaks were found at 415 nm and 413 nm at day 7 and day 30, respectively, as opposed to 412 nm observed at day 1, thus indicating the stability of SNPs over a 30-day testing period. However, an approximate 10–50% decrease in the peak intensities was found when tested after one year of preparation. Moreover, SPR peak shapes were distorted as compared to those observed at day 1, thus indicating instability after one year of preparation (Figure 9d). These results are in accordance with the available report [56,57].

4.7. Solid State Characterization os SNPs

Fourier Transform-Infrared Spectroscopy was performed on the freeze-dried SNPs, along with silver nitrate, the precursor of SNPs, and GT, the stabilizer (Figure 10). Silver nitrate exhibited major absorbance bands at 3285, 2352, 1291, 1051, 913, 791, 480 and 449 cm−1, respectively. GT exhibited a prominent absorption band at 1013 cm−1, which is due to several alcoholic groups present in the GT. SNP exhibited absorption bands at 3320, 1342, 994, 911, 571 and 412 cm−1, respectively. Thus, SNP exhibited disappearance of some absorption bands in addition to shifts in the absorbance bands with decreased band intensity—for instance, shifts of 3285 to 3320; 1291 to 1342; 1051 to 913; 480 to 571; and 449 to 412 cm−1, with the disappearance of the band at 2350 and 790 cm−1.
X-ray diffraction patterns of freeze-dried SNPs, along with silver nitrate, the precursor of SNPs, and GT, the stabilizer, has been shown in the Figure 11. Silver nitrate exhibited several diffraction bands at approximately 16°, 19°, 22°, 24°, 29°, 32°, 35°, 39°, 42°, 49°, 55°, 70°, 78° and 87°, respectively, owing to its crystalline nature. GT did not exhibit sharp diffraction peaks, most likely due to the amorphous nature of the compound. SNP exhibited diffraction bands at approximate bands at 38° 44°, 64° and 78°, which correspond to the (111), (200), (220) and (311) facets of the crystal planes, as compared to the standard JCPDS file 04-0783, suggesting face-centered cubic crystal structure of developed SNP [58]. Some peaks in the SNP diffraction pattern observed at 11°, 12°, 18°, 21°, 22°, 24° (marked with *) may be attributed to silver nitrate.
Differential Scanning Thermograms of freeze-dried SNPs, along with silver nitrate, the precursor of SNPs, and GT, the stabilizer, is shown in Figure 12. Silver nitrate exhibited exothermic peaks at 170 °C and 210 °C, corresponding to loss of water and crystallization, respectively. Further heating caused decomposition of silver nitrate at 460 °C. GT did not exhibit any sharp DSC peak, due to its amorphous nature. The SNP exhibited an exothermic peak at 150 °C, corresponding to a loss of water, while further heating brings no change in the thermograms, indicating the stability of SNPs over the heating range investigated.
The Atomic Force Microscopic photographs of SNPs exhibited spherical particles with a size range of approximately 2.5–4 nm (Figure 13). There are several reports of AFM of SNPs, due to the advantages of this technique such as low sample requirement, minimal sample processing requirement, and capability to measure liquid samples, in addition to being economical, as compared to optical microscopy [59,60].

4.8. Antibacterial Activity Evaluation

The optimized SNPs were found to exhibit significant antibacterial activities against gram positive and gram negative bacteria, as compared to the standard (ciprofloxacin). The SNPs are reported to damage the cell membranes, disrupting DNA replication [61,62].

4.9. Ex-Vivo and In-Vivo Activity Evaluation

When the synthesized SNPs were tested for possible inhibitory effect gastrointestinal tract (GIT), it interestingly produced small intestine relaxation and the inhibition of diarrhea in a dose-mediated manner. Usually, the gut inhibitory substances exhibit antispasmodic effect by multiple mechanism(s), including anti-muscarinic [63], calcium channel blockade [64] and/or phosphodiesterase inhibition [65]. In our in-vivo assays, we found that SNPs decreases the number of wet feces in mice administered with castor oil and previously incubated with SNPs increasing doses, similar to loperamide, a standard antidiarrheal drug [66]. Castor oil-mediated diarrhea model is a well-established assay to know the diarrhea protection property of unknown substances, as castor oil induces diarrhea by converting into ricinolic acid, which ultimately excites te colon and thus results in copious diarrheal droppings [67]. The possible mechanism explored for the gut inhibition was found to be similar to dicyclomine, a known anticholinergic and calcium channel blocker [68], and was also reported for diarrhea protection (Pasricha 2006; [69]).

5. Conclusions

The SNPs were synthesized by using silver nitrate as precursor, which was chemically reduced by GA and GT. The GT successfully reduced the silver nitrate to SNPs, and subsequently stabilized against aggregation more efficiently, compared to GA, which may be due to higher proportions of reducing sugars such as arabinose and fructose in the GT. The use of an alkaline medium for the reduction of silver ions to silver atoms and the further nucleation or formation of SNPs has been found to be necessary, as the presence of sodium hydroxide favored the development of a relatively more intense yellowish-brown color. Acidic buffers significantly reduced the formation of silver nanoparticles, while neutral or slightly basic buffers favored its formation. GT-stabilized nanoparticles remained stable in different physiological buffers during a period of 120 min. The GT-stabilized silver nanoparticles suspension were found to be stable over a period of 30 days after preparation, while after one year of preparation it showed a significant reduction in the peak intensity due to aggregation or precipitation. The SNPs were found to inhibit the hyperactive gut, probably mediated by the dual inhibition of muscarinic receptors and Ca++ channels, while additional mechanism(s) cannot be ruled out.

Author Contributions

Conceptualization, M.J.A.; methodology, M.J.A., N.U.R., E.I. and M.A.G.; formal analysis, M.J.A.; investigation, M.J.A., N.U.R., E.I. and M.A.G.; resources, M.J.A.; data curation, A.Z.; writing—original draft preparation, M.J.A.; writing—review and editing, M.A.G. and A.Z.; visualization, A.A.; supervision, M.J.A.; project administration, M.J.A.; and funding acquisition, M.J.A. All authors have read and agreed to the published version of the manuscript.

Funding

This research was funded by deanship of scientific research, Prince Sattam bin Abdul-Aziz University, Saudi Arabia, Grant No. 2021/03/19232.

Institutional Review Board Statement

The study was conducted according to the guidelines of the Institute of Laboratory Animal Resources, Commission on Life Sciences and National Research Council, and the study protocol was approved by the Bio-Ethical Research Committee (BERC), Prince Sattam Bin Abdul-Aziz University (Approval No. BERC-004–12–19).

Informed Consent Statement

Not applicable.

Data Availability Statement

Not applicable.

Conflicts of Interest

The authors declare no conflict of interest. The funders had no role in the design of the study; in the collection, analysis, or interpretation of data; in the writing of the manuscript; or in the decision to publish the results.

References

  1. Guzman, M.; Dille, J.; Godet, S. Synthesis and antibacterial activity of silver nanoparticles against gram-positive and gram-negative bacteria. Nanomed. Nanotechnol. Biol. Med. 2012, 8, 37–45. [Google Scholar] [CrossRef] [PubMed]
  2. Iravani, S.; Korbekandi, H.; Mirmohammadi, S.V.; Zolfaghari, B. Synthesis of silver nanoparticles, chemical.; physical and biological methods. Res. Pharm. Sci. 2014, 9, 385–393. Available online: https://www.ncbi.nlm.nih.gov/pmc/articles/PMC4326978/ (accessed on 19 September 2022). [PubMed]
  3. Tran, Q.H.; Le, A.T. Silver nanoparticles, synthesis.; properties.; toxicology.; applications and perspectives. Adv. Nat. Sci. Nanosci. Nanotechnol. 2013, 4, 33001. [Google Scholar] [CrossRef] [Green Version]
  4. Almatroudi, A. Silver nanoparticles, Synthesis.; characterisation and biomedical applications. Open Life Sci. 2020, 15, 819–839. [Google Scholar] [CrossRef] [PubMed]
  5. Quintero-Quiroz, C.; Acevedo, N.; Zapata-Giraldo, J.; Botero, L.E.; Quintero, J.; Zárate-Triviño, D.; Saldarriaga, J.; Pérez, V.Z. Optimization of silver nanoparticle synthesis by chemical reduction and evaluation of its antimicrobial and toxic activity. Biomater. Res. 2019, 23, 27. [Google Scholar] [CrossRef] [PubMed]
  6. Sharifi-Rad, M.; Pohl, P. Synthesis of biogenic silver nanoparticles (Agcl-NPs) using a pulicaria vulgaris gaertn. aerial part extract and their application as antibacterial, antifungal and antioxidant agents. Nanomaterials 2020, 10, 638. [Google Scholar] [CrossRef] [Green Version]
  7. Patra, C.R.; Mukherjee, S.; Kotcherlakota, R. Biosynthesized silver nanoparticles, a step forward for cancer theranostics? Nanomedicine 2014, 9, 1445–1448. [Google Scholar] [CrossRef] [PubMed]
  8. Naik, A.N.; Patra, S.; Sen, D.; Goswami, A. Evaluating the mechanism of nucleation and growth of silver nanoparticles in a polymer membrane under continuous precursor supply, tuning of multiple to single nucleation pathway. Phys. Chem. Chem. Phys. 2019, 21, 4193–4199. [Google Scholar] [CrossRef]
  9. Jeong, Y.; Lim, D.W.; Choi, J. Assessment of size-dependent antimicrobial and cytotoxic properties of silver nanoparticles. Adv. Mater. Sci. Eng. 2014, 2014, 763807. [Google Scholar] [CrossRef] [Green Version]
  10. Dai, L.; Nadeau, B.; An, X.; Cheng, D.; Long, Z.; Ni, Y. Silver nanoparticles-containing dual-function hydrogels based on a guar gum-sodium borohydride system. Sci. Rep. 2016, 6, 36497. [Google Scholar] [CrossRef]
  11. Raza, M.A.; Kanwal, Z.; Rauf, A.; Sabri, A.N.; Riaz, S.; Naseem, S. Size-and shape-dependent antibacterial studies of silver nanoparticles synthesized by wet chemical routes. Nanomaterials 2016, 6, 74–79. [Google Scholar] [CrossRef] [PubMed] [Green Version]
  12. Li, H.; Xia, H.; Ding, W.; Li, Y.; Shi, Q.; Wang, D.; Tao, X. Synthesis of monodisperse.; quasi-spherical silver nanoparticles with sizes defined by the nature of silver precursors. Langmuir 2014, 30, 2498–2504. [Google Scholar] [CrossRef] [PubMed]
  13. Shahzad, A.; Chung, M.; Yu, T.; Kim, W.S. A Simple and Fast Aqueous--Phase Synthesis of Ultra--Highly Concentrated Silver Nanoparticles and Their Catalytic Properties. Chem. Asian J. 2015, 10, 2512–2517. [Google Scholar] [CrossRef]
  14. Mlalila, N.; Swai, H.; Hilonga, A. Optimized Preparation of Silver Nanoparticles from Polyethylene Glycol and Formaldehyde. Int. Res. J. Pure Appl. Chem. 2016, 13, 1–9. [Google Scholar] [CrossRef]
  15. Nishioka, M.; Miyakawa, M.; Kataoka, H.; Koda, H.; Sato, K.; Suzuki, T.M. Continuous synthesis of monodispersed silver nanoparticles using a homogeneous heating microwave reactor system. Nanoscale 2011, 3, 2621–2626. [Google Scholar] [CrossRef]
  16. Bortoli, L.D.; Palácio, S.M.; Hermes, E.; Zenatti, D.C.; Veit, M.T.; Campos, É.A. Removal of silver nanoparticles coated with different stabilizers from aqueous medium by electrocoagulation. Environ. Technol. 2020, 41, 1139–1150. [Google Scholar] [CrossRef] [PubMed]
  17. Lanje, A.S.; Sharma, S.J.; Pode, R.B. Synthesis of silver nanoparticles, A safer alternative to conventional antimicrobial and antibacterial agents. J. Chem. Pharm. Res. 2010, 2, 478–483. [Google Scholar]
  18. Mehta, S.K.; Chaudhary, S.; Gradzielski, M. Time dependence of nucleation and growth of silver nanoparticles generated by sugar reduction in micellar media. J. Colloid Interface Sci. 2010, 343, 447–453. [Google Scholar] [CrossRef]
  19. Oluwafemi, O.S.; Lucwaba, Y.; Gura, A.; Masabeya, M.; Ncapayi, V.; Olujimi, O.O.; Songca, S.P. A facile completely ‘green’size tunable synthesis of maltose-reduced silver nanoparticles without the use of any accelerator. Colloids Surf. B. Biointerfaces 2013, 102, 718–723. [Google Scholar] [CrossRef]
  20. Meshram, S.M.; Bonde, S.R.; Gupta, I.R.; Gade, A.K.; Rai, M.K. Green synthesis of silver nanoparticles using white sugar. IET Nanobiotechnol. 2013, 7, 28–32. [Google Scholar] [CrossRef]
  21. Suwan, T.; Khongkhunthian, S.; Okonogi, S. Silver nanoparticles fabricated by reducing property of cellulose derivatives. Drug Discov. Ther. 2019, 13, 70–79. [Google Scholar] [CrossRef] [PubMed]
  22. Wang, L.S.; Wang, C.Y.; Yang, C.H.; Hsieh, C.L.; Chen, S.Y.; Shen, C.Y.; Wang, J.J.; Huang, K.S. Synthesis and anti-fungal effect of silver nanoparticles-chitosan composite particles. Int. J. Nanomed. 2015, 10, 2685–2696. [Google Scholar] [CrossRef] [Green Version]
  23. Cortes, Y.Z.; Valenzuela, L.M.; Pena, E.A.E.; Sanchez, B.L.E. Antibacterial Activity of Electrospun Nanocomposites Fabricated by in Situ Chitosan/Silver Nanoparticles. IEEE Trans. Nanobiosci. 2022, 21, 89–96. [Google Scholar] [CrossRef] [PubMed]
  24. Baláž, M.; Bedlovičová, Z.; Daneu, N.; Siksa, P.; Sokoli, L.; Tkáčiková, Ľ.; Salayová, A.; Džunda, R.; Kováčová, M.; Bureš, R.; et al. Mechanochemistry as an Alternative Method of Green Synthesis of Silver Nanoparticles with Antibacterial Activity, A Comparative Study. Nanomaterials 2021, 11, 1139. [Google Scholar] [CrossRef] [PubMed]
  25. Mohan, S.; Oluwafemi, O.S.; George, S.C.; Jayachandran, V.P.; Lewu, F.B.; Songca, S.P.; Kalarikkal, N.; Thomas, S. Completely green synthesis of dextrose reduced silver nanoparticles, its antimicrobial and sensing properties. Carbohydr. Polym. 2014, 106, 469–474. [Google Scholar] [CrossRef] [PubMed]
  26. Bruniera, J.F.B.; Gabriel-Silva, L.; Goulart, R.S.; Silva-Sousa, Y.T.C.; Lara, M.G.; Pitondo-Silva, A.; Miranda, C.E.S. Green Synthesis, Characterization and Antimicrobial Evaluation of Silver Nanoparticles for an Intracanal Dressing. Braz. Dent. J. 2020, 31, 485–492. [Google Scholar] [CrossRef]
  27. White, R.J.; Budarin, V.L.; Moir, J.W.; Clark, J.H. A sweet killer, mesoporous polysaccharide confined silver nanoparticles for antibacterial applications. Int. J. Mol. Sci. 2011, 12, 5782–5796. [Google Scholar] [CrossRef]
  28. El-Rafie, M.H.; Ahmed, H.B.; Zahran, M.K. Facile Precursor for Synthesis of Silver Nanoparticles Using Alkali Treated Maize Starch. Int. Sch. Res. Not. 2014, 2014, 702396. [Google Scholar] [CrossRef] [PubMed] [Green Version]
  29. Alzahrani, E. Colorimetric Detection Based on Localised Surface Plasmon Resonance Optical Characteristics for the Detection of Hydrogen Peroxide Using Acacia Gum-Stabilised Silver Nanoparticles. Anal. Chem. Insights 2017, 12, 1177390116684686. [Google Scholar] [CrossRef] [Green Version]
  30. Kora, A.J.; Arunachalam, J. Green fabrication of silver nanoparticles by gum tragacanth (Astragalus gummifer), a dual functional reductant and stabilizer. J. Nanomater. 2012, 2012, 869765. [Google Scholar] [CrossRef] [Green Version]
  31. Iqbal, D.N.; Shafiq, S.; Khan, S.M.; Ibrahim, S.M.; Abubshait, S.A.; Nazir, A.; Abbas, M.; Iqbal, M. Novel chitosan/guar gum/PVA hydrogel, Preparation.; characterization and antimicrobial activity evaluation. Int. J. Biol. Macromol. 2020, 164, 499–509. [Google Scholar] [CrossRef] [PubMed]
  32. Deka, R.; Sarma, S.; Patar, P.; Gogoi, P.; Sarmah, J.K. Highly stable silver nanoparticles containing guar gum modified dual network hydrogel for catalytic and biomedical applications. Carbohydr. Polym. 2020, 248, 116786. [Google Scholar] [CrossRef]
  33. Zulkifli, N.I.; Muhamad, M.; Zain, N.N.M.; Tan, W.N.; Yahaya, N.; Bustami, Y.; Abdul Aziz, A.; Kamal, N.N.S. A Bottom-Up Synthesis Approach to Silver Nanoparticles Induces Anti-Proliferative and Apoptotic Activities Against MCF-7.; MCF-7/TAMR-1 and MCF-10A Human Breast Cell Lines. Molecules 2020, 25, 4332. [Google Scholar] [CrossRef]
  34. Jalab, J.; Abdelwahed, W.; Kitaz, A.; Al-Kayali, R. Green synthesis of silver nanoparticles using aqueous extract of Acacia cyanophylla and its antibacterial activity. Heliyon 2021, 7, e08033. [Google Scholar] [CrossRef]
  35. Mechouche, M.S.; Merouane, F.; Messaad, C.E.H.; Golzadeh, N.; Vasseghian, Y.; Berkani, M. Biosynthesis.; characterization.; and evaluation of antibacterial and photocatalytic methylene blue dye degradation activities of silver nanoparticles from Streptomyces tuirus strain. Environ. Res. 2022, 204 Pt D, 112360. [Google Scholar] [CrossRef] [PubMed]
  36. Simon, S.; Sibuyi, N.R.S.; Fadaka, A.O.; Meyer, M.; Madiehe, A.M.; du Preez, M.G. The antimicrobial activity of biogenic silver nanoparticles synthesized from extracts of Red and Green European pear cultivars. Artif. Cells Nanomed. Biotechnol. 2021, 49, 614–625. [Google Scholar] [CrossRef]
  37. Bonev, B.; Hooper, J.; Parisot, J. Principles of assessing bacterial susceptibility to antibiotics using the agar diffusion method. J. Antimicrob. Chemother. 2008, 61, 1295–1301. [Google Scholar] [CrossRef] [Green Version]
  38. Ansari, M.J.; Althubaiti, M.; Ibnouf, M.O.; Anwer, M.K.; Ahmed, M.M.; Fatima, F.; Jamil, S. Enhanced Antibacterial Effects of Ciprofloxacin Enclosed In Cyclodextrin and Nano-Suspension Carrier Systems. Bull. Env. Pharmacol. Life Sci. 2015, 4, 14–18. [Google Scholar]
  39. Farre, A.J.; Columbo, M.; Fort, M.; Gutierrez, B. Differential effects of various Ca++ antagonists. Gen. Pharmacol. 1991, 22, 177–181. [Google Scholar] [CrossRef]
  40. National Research Council. Guide for the Care and Use of Laboratory Animals; National Academy Press: Washington, DC, USA, 1996; pp. 1–7. Available online: https://www.ncbi.nlm.nih.gov/books/NBK54050/ (accessed on 10 March 2022).
  41. Rehman, N.U.; Khan, A.; Fatima, U.; Akram, M.; Al-Musayeib, N.; Al-Massarani, S.; El-Gamal, A.; Gilani, A.H. Presence of laxative and antidiarrheal activities in Periploca aphylla, a Saudi medicinal plant. Int. J. Pharmacol. 2013, 9, 190–196. [Google Scholar] [CrossRef] [Green Version]
  42. Tischer, C.A.; Iacomini, M.; Gorin, P.A. Structure of the arabinogalactan from gum tragacanth (Astralagus gummifer). Carbohydr. Res. 2002, 337, 1647–1655. [Google Scholar] [CrossRef]
  43. Nejatian, M.; Abbasi, S.; Azarikia, F. Gum Tragacanth, Structure.; characteristics and applications in foods. Int. J. Biol. Macromol. 2020, 160, 846–860. [Google Scholar] [CrossRef] [PubMed]
  44. Desai, R.; Mankad, V.; Gupta, S.K.; Jha, P.K. Size distribution of silver nanoparticles, UV-visible spectroscopic assessment. Nanosci. Nanotechnol. Lett. 2012, 4, 30–34. [Google Scholar] [CrossRef]
  45. Sharma, G.; Nam, J.S.; Sharma, A.R.; Lee, S.S. Antimicrobial potential of silver nanoparticles synthesized using medicinal herb coptidis rhizome. Molecules 2018, 23, 2268. [Google Scholar] [CrossRef] [Green Version]
  46. De Leersnyder, I.; De Gelder, L.; Van Driessche, I.; Vermeir, P. Revealing the importance of aging.; environment.; size and stabilization mechanisms on the stability of metal nanoparticles, A case study for silver nanoparticles in a minimally defined and complex undefined bacterial growth medium. Nanomaterials 2019, 9, 1684. [Google Scholar] [CrossRef] [PubMed] [Green Version]
  47. Indana, M.K.; Gangapuram, B.R.; Dadigala, R.; Bandi, R.; Guttena, V. A novel green synthesis and characterization of silver nanoparticles using gum tragacanth and evaluation of their potential catalytic reduction activities with methylene blue and Congo red dyes. J. Anal. Sci. Technol. 2016, 7, 19. [Google Scholar] [CrossRef] [Green Version]
  48. Venkatesham, M.; Ayodhya, D.; Madhusudhan, A.; Veera Babu, N.; Veerabhadram, G. A novel green one-step synthesis of silver nanoparticles using chitosan, catalytic activity and antimicrobial studies. Appl. Nanosci. 2014, 4, 113–119. [Google Scholar] [CrossRef] [Green Version]
  49. Dong, C.; Zhang, X.; Cai, H. Green synthesis of monodisperse silver nanoparticles using hydroxy propyl methyl cellulose. J. Alloys Compd. 2014, 583, 267–271. [Google Scholar] [CrossRef]
  50. Nishimura, S.; Mott, D.; Takagaki, A.; Maenosono, S.; Ebitani, K. Role of base in the formation of silver nanoparticles synthesized using sodium acrylate as a dual reducing and encapsulating agent. Phys. Chem. Chem. Phys. 2011, 13, 9335–9343. [Google Scholar] [CrossRef] [PubMed]
  51. Yadav, V.D.; Jain, R.; Dandekar, P. Influence of sodium hydroxide in enhancing the surface plasmon resonance of silver nanoparticles. Mater. Res. Express 2017, 4, 085015. [Google Scholar] [CrossRef]
  52. Singh, M.; Sinha, I.; Mandal, R.K. Role of pH in the green synthesis of silver nanoparticles. Mater. Lett. 2009, 63, 425–427. [Google Scholar] [CrossRef]
  53. Sobczak-Kupiec, A.; Malina, D.; Wzorek, Z.; Zimowska, M. Influence of silver nitrate concentration on the properties of silver nanoparticles. Micro Nano Lett. 2011, 6, 656–660. [Google Scholar] [CrossRef]
  54. Htwe, Y.Z.; Chow, W.S.; Suda, Y.; Mariatti, M. Effect of silver nitrate concentration on the production of silver nanoparticles by green method. Mater. Today Proc. 2019, 7, 568–573. [Google Scholar] [CrossRef]
  55. Chhatre, A.; Solasa, P.; Sakle, S.; Thaokar, R.; Mehra, A. Color and surface plasmon effects in nanoparticle systems: Case of silver nanoparticles prepared by microemulsion route. Colloids Surf. A Physicochem. Eng. Asp. 2012, 404, 83–92. [Google Scholar] [CrossRef]
  56. El-Sheikh, M.A.; El-Rafie, S.M.; Abdel-Halim, E.S.; El-Rafie, M.H. Green synthesis of hydroxyethyl cellulose-stabilized silver nanoparticles. J. Polym. 2013, 2013, 650837. [Google Scholar] [CrossRef]
  57. Sharma, R.; Dhillon, A.; Kumar, D. Mentha-stabilized silver nanoparticles for high-performance colorimetric detection of Al (III) in aqueous systems. Sci. Rep. 2018, 8, 5189. [Google Scholar] [CrossRef] [Green Version]
  58. Rajendrachari, S.; Kumaraswamy, B.E. Biosynthesis of silver nanoparticles using leaves of Acacia melanoxylon and their application as dopamine and hydrogen peroxide sensors. Phys. Chem. Res. 2020, 8, 1–18. [Google Scholar]
  59. Kumar, K.P.; Paul, W.; Sharma, C.P. Green synthesis of silver nanoparticles with Zingiber officinale extract and study of its blood compatibility. Bionanoscience 2012, 2, 144–152. [Google Scholar] [CrossRef]
  60. Kent, R.D.; Vikesland, P.J. Controlled evaluation of silver nanoparticle dissolution using atomic force microscopy. Environ. Sci. Technol. 2012, 46, 6977–6984. [Google Scholar] [CrossRef] [Green Version]
  61. Sharma, V.K.; Siskova, K.M.; Zboril, R.; Gardea-Torresdey, J.L. Organic-coated silver nanoparticles in biological and environmental conditions: Fate, stability and toxicity. Adv. Colloid Interface Sci. 2014, 204, 15–34. [Google Scholar] [CrossRef]
  62. González, A.L.; Noguez, C.; Beránek, J.; Barnard, A.S. Size, shape, stability, and color of plasmonic silver nanoparticles. J. Phys. Chem. C 2014, 118, 9128–9136. [Google Scholar] [CrossRef]
  63. Gilani, A.H.; Shaheen, F.; Christopoulos, A.; Mitchelson, F. Interaction of ebeinone, an alkaloid from Fritillaria imperialis, at two muscarinic acetylcholine receptor subtypes. Life Sci. 1997, 60, 535–544. [Google Scholar] [CrossRef]
  64. Fleckenstein, A. Specific pharmacology of Ca++ in myocardium.; cardiac pacemakers and vascular smooth muscle. Rev. Pharmacol. Toxicol. 1977, 17, 149–166. [Google Scholar] [CrossRef] [PubMed]
  65. Rehman, N.U.; Ansari, M.N.; Ahmad, W.; Ahamad, S.R. Dual inhibition of phosphodiesterase and Ca++ channels explain the medicinal use of Balanites aegyptiaca (L.) in hyperactive gut disorders. Plants 2022, 11, 1183. [Google Scholar] [CrossRef]
  66. Wintola, O.A.; Sunmonu, T.O.; Afolayan, A.J. The effect of Aloe ferox Mill. in the treatment of loperamide-induced constipation in Wistar rats. BMC Gastroenterol. 2010, 10, 95. [Google Scholar] [CrossRef] [Green Version]
  67. Croci, T.; Landi, M.; Elmonds-Alt, X.; Le Fur, G.; Maffrand, J.P.; Manara, L. Role of tachykinins in castor oil induced diarrhea in rats. Br. J. Pharmacol. 1997, 121, 375–380. [Google Scholar] [CrossRef] [PubMed]
  68. Downie, J.W.; Twiddy, D.A.; Awad, S.A. Antimuscarinic and non-competitive antagonist properties of dicyclomine hydrochloride in isolated human and rabbit bladder muscle. J. Pharmacol. Exp. Ther. 1977, 201, 662–668. [Google Scholar]
  69. Pasricha, P.J. Treatment of disorders of bowel motility and water flux; antiemetics; agents used in bilary and pancreatic diseases. In The Pharmacological Basis of Therapeutics, 11th ed.; McGraw-Hill: New York, NY, USA, 2006; pp. 983–1008. [Google Scholar]
Figure 1. UV-Vis spectroscopic spectrum with surface plasmon resonance of (a) 0.1 M aqueous solution of silver nitrate; and (b) 0.1 M aqueous silver nitrate reduced and stabilized by 0.5% w/v aqueous GT (dotted curve) or 0.5% w/v aqueous GA (solid curve). Inset in (b) is showing a yellowish color developed by GA, while a brownish color by GT.
Coatings 12 01579 g001aCoatings 12 01579 g001b
Figure 2. UV-Vis spectroscopic spectrum with surface plasmon resonance of SNPs prepared in distilled water or buffers DW-distilled water, SGF-Simulated Gastric Fluid, AB-Acetate Buffer, SIF-Simulated Intestinal Buffer and PBS-Phosphate Buffer Saline. (a) Nanoparticles reduced and stabilized by 0.5% w/v aqueous GA; and (b) Nanoparticles reduced and stabilized by 0.5% aqueous w/v GT.
Coatings 12 01579 g002aCoatings 12 01579 g002b
Figure 3. UV-Vis spectroscopic spectrum with surface plasmon resonance of SNPs diluted with distilled water or buffers (DW-distilled water, SGF-Simulated Gastric Fluid, AB-Acetate Buffer, SIF-Simulated Intestinal Buffer and PBS-Phosphate Buffer Saline) (a) SNPs reduced and stabilized by 0.5% w/v aqueous GA; and (b) SNPs reduced and stabilized by 0.5% aqueous w/v GT.
Coatings 12 01579 g003aCoatings 12 01579 g003b
Figure 4. Comparative evaluation of color development and UV-Vis spectroscopic spectra with surface plasmon resonance of SNP produced and stabilized by 0.5% w/v aqueous GA or 0.5% aqueous w/v GT at 30 min and 180 min.
Coatings 12 01579 g004
Figure 5. UV-Vis spectroscopic spectra with surface plasmon resonance of SNP showing the amount and stability of GT stabilized nanoparticles over definite time periods.
Coatings 12 01579 g005
Figure 6. UV-Vis spectroscopic spectra with surface plasmon resonance of SNPs showing amount and stability of GT-stabilized nanoparticles over definite time periods in various physiological buffers (a) SGF-Simulated Gastric Fluid; (b) AB-Acetate Buffer; (c) SIF-Simulated Intestinal Fluid; and (d) PBS-Phosphate Buffer Saline.
Coatings 12 01579 g006
Figure 7. UV-Vis spectroscopic spectra with surface plasmon resonance of SNPs showing effect of various concentrations of sodium hydroxide on the reduction of silver nitrate to SNPs by GT.
Coatings 12 01579 g007
Figure 8. UV-Vis spectroscopic spectra with surface plasmon resonance of SNPs showing influence of dilution over absorption behavior and intensity of SNP with varying concentration of silver nitrate (1–20 mM) (a) Undiluted samples; (b) 10-fold diluted in distilled water; (c) 100-fold diluted in distilled water; and (d) Visual appearance of SNP suspensions prepared by varying amount of silver nitrate (1–20 mM) added to mixtures containing 0.5% w/v aqueous solution of GT and 20 mM aqueous solution of sodium hydroxide.
Coatings 12 01579 g008aCoatings 12 01579 g008b
Figure 9. UV-Vis spectroscopic spectra with surface plasmon resonance of SNPs showing amount and stability of GT-stabilized nanoparticles with varying concentration of silver nitrate (1–20 mM) over definite time periods. (a) Freshly prepared; (b) After 24 h; (c) After 1 week; (d) After 3 months; and (e) After 1 year.
Coatings 12 01579 g009aCoatings 12 01579 g009bCoatings 12 01579 g009c
Figure 10. Fourier Transform-Infrared Spectroscopic spectra of (a) silver nanoparticles; (b) Silver nitrate; and (c) GT.
Coatings 12 01579 g010
Figure 11. X-ray diffractogram of green, GT; orange, Silver nanoparticles; and blue, Silver nitrate. * indicates peaks corresponding to silver oxide or other impurities.
Coatings 12 01579 g011
Figure 12. Differential Scanning calorimetric thermograms of (a) silver nitrate; (b) Silver nanoparticles; and (c) GT.
Coatings 12 01579 g012
Figure 13. Atomic Force Microscopic photographs of SNPs (a) Topographic image of 2 micrometer scan range; (b) phase imaging of 2 micrometer scan range; (c) topographic overlay with phase image of 2 micrometer scan range; (d) Topographic image of 4 micrometer scan range; (e) phase imaging of 4 micrometer scan range; (f) topographic overlay with phase image of 2 micrometer scan range; (g) line profile on small particles showing a maximum height of 2.5 nm; and (h) line profile of large particles showing a maximum height of 4 nm.
Coatings 12 01579 g013aCoatings 12 01579 g013b
Figure 14. Antibacterial activity of silver nanoparticle suspension, as compared to ciprofloxacin. (a) Gram positive bacteria (b) Gram negative bacteria.
Coatings 12 01579 g014
Figure 15. Inhibitory effect of (a) SNPs and (b) dicyclomine on carbachol (CCh; 1 µM) and high K+ (80 mM)-induced contractions in isolated rat ileum.
Coatings 12 01579 g015
Table 1. Effect of diluents on the particle size and polydispersity index (PDI) of SNP over different time periods.
Diluents0 Min15 Min30 Min45 Min60 Min120 MinMean Size
(nm) ± SD
Mean PDI
± SD
SizePDISizePDISizePDISizePDISizePDISizePDI
DW130.10.158134.50.149142.70.037143.20.0641400.106133.60.198137.4 ± 5.40.119 ± 0.061
SGF149.80.033169.70.124186.70.133199.60.151204.70.176226.50.137189.5 ± 27.10.126 ± 0.049
AB141.60.213152.70.164174.50.142164.40.161162.50.196170.20.168161.0 ± 12.00.174 ± 0.026
SIF154.90.232136.60.25143.80.234142.20.2311560.031147.10.201146.8 ± 7.50.197 ± 0.083
PBS100.40.187121.40.165129.60.178133.90.177144.20.092144.20.167129.0 ± 16.50.161 ± 0.035
DW-Distilled water, SGF-Simulated Gastric Fluid, AB-Acetate buffer, SIF-Simulated Intestinal Fluid, and PBS-Phosphate Buffer Saline.
Table 2. Antibacterial activity of silver nanoparticle suspension, as compared to ciprofloxacin.
Zone of Inhibition (mm)
StrainsSampleCiprofloxacinSilver Nanoparticles
S. aureus118.035.0
ATCC #219.033.0
25923318.036.0
-MEAN18.3* 34.7
-SD0.61.5
E. coli130.045.0
ATCC #228.044.0
13706330.044.0
-MEAN29.3* 44.3
-SD1.20.6
* signifies statistically significant difference under two-sided student t-test at 5% significance level between the mean zone of inhibition exhibited by ciprofloxacin and SNPs (the t-values were −17.32412 and −20.12461 with corresponding p-values of 0.000065 and 0.000036 against S. aureus and E. coli, respectively. # signifies American Type Culture Collection number-ATCC number).
Table 3. Antidiarrheal effect of SNPs on castor oil-induced diarrhea in mice.
GroupsDose (mg/kg)No. of Wet StoolTotal No. of Stool
Saline10 mL/kg (p.o)5.2 ± 0.485.8 ± 1.3
SNPs1 mg/kg (i.p)3.4 ± 0.24 *6.4 ± 2.07 ns
SNPs3 mg/kg (i.p)2.6 ± 0.50 **7.2 ± 2.7 ns
SNPs10 mg/kg (i.p)2.0 ± 1.00 ***8.2 ± 4.3 ns
Loperamide10 mg/kg (i.p)0.60 ± 0.40 ***1 ± 1.41 **
Values shown are mean ± S.E.M. of 5 animals per group. * p < 0.05, ** p < 0.01 and *** p < 0.001 show a comparison of all group vs. saline (One-way ANOVA followed by Tukey-Kramer Multiple Comparisons test). i.p. = intraperitoneal, p.o = per oral.
Publisher’s Note: MDPI stays neutral with regard to jurisdictional claims in published maps and institutional affiliations.

