Article

Compressibility and Rarefaction Effects on Particle Dynamics and Heat Transfer in Aerosol Deposition Process

1
Department of Chemical Engineering, California State University, Long Beach, CA 90840, USA
2
Department of Mechanical and Industrial Engineering, University of Toronto, Toronto, ON M5S 3G8, Canada
*
Author to whom correspondence should be addressed.
Coatings 2022, 12(10), 1578; https://doi.org/10.3390/coatings12101578
Submission received: 1 September 2022 / Revised: 13 October 2022 / Accepted: 16 October 2022 / Published: 19 October 2022
(This article belongs to the Section Surface Characterization, Deposition and Modification)

Abstract

:
The aerosol deposition (AD) method is an emerging coating technique to create a dense ceramic or metal layer on a substrate through the kinetic impaction and cumulative deposition of ultrafine solid particles under near-vacuum conditions. Prediction of the particles’ impact velocity and temperature during the AD process is crucial in enhancing the coating quality. In the present work, a two-way coupled Eulerian-Lagrangian model is developed for an AD system equipped with a converging-barrel nozzle to simulate the supersonic gas flow, particle in-flight behavior, as well as particle conditions upon impact on a flat substrate. The focus of the current study is to understand the effects of compressibility and rarefaction on particle velocity and temperature during the AD process. The effects of compressibility and rarefaction can be assessed using the Mach and Knudsen numbers. Therefore, different models for the drag coefficient and the heat transfer coefficient that take into account the Knudsen, Mach, and Reynolds number effects are implemented into the computational fluid dynamics (CFD) models. The results show that compressibility and rarefaction have significant influence on the particle temperature and velocity. As the particle size reduces, the effects of compressibility and rarefaction become more important.

1. Introduction

The aerosol deposition (AD) method, also known as the vacuum cold spray (VCS) process, is being used in various industries, including energy, electronics, aerospace, and biomedicine, as an effective method to deposit ceramic or metal coatings at or near room temperature. This technique has been utilized for different energy-harvesting devices such as solid oxide fuel cells (SOFC), solid-state lithium batteries, sensors, electronic devices (e.g., semiconductor fabrication equipment), and dye-sensitized solar cells (DSSC) [1,2,3]. In this technique, the solid-state submicron ceramic/metal particles are accelerated in a high-speed gas flow to impact with the substrate (i.e., the part to be coated) and form a dense thick/thin coating under vacuum. Compared to other technologies in this area, such as plasma spraying, which are typically based on the melting and solidification of particles, there is no need to heat and melt the particles in the AD method. As a result, the adverse effect of high temperature on temperature-sensitive materials is removed and considerable progress in the performance of coatings has been observed [4]. Furthermore, due to relatively low-temperature operation, the energy consumption and cost as well as the emissions of toxic air pollutants are significantly reduced in the AD process [5,6,7,8,9].
In general, the AD system includes an aerosol generator, a deposition chamber equipped with a substrate holder and a converging-diverging or converging-barrel nozzle, and an evacuation system (see Figure 1). The evacuation system (usually a rotary vacuum pump coupled to a mechanical booster pump) is used to reduce the pressure of the deposition chamber to around 0.01–1.5 kPa. A mixture of solid particles and gas, called aerosol, is injected into the nozzle at higher pressure. Due to the nozzle geometry and the pressure difference, a highly under-expanded supersonic jet is formed outside the nozzle. In addition, depending on the substrate location, a Mach disk and/or a strong bow shock can be formed near the substrate. The particle size is typically not more than 5 µm. Owing to high-speed gas flow, particles are accelerated to several hundreds of meters per second upon impact [6,7,8,9]. The carrier gas can be preheated (while the temperature is kept below the particle melting point) to increase the sonic velocity of the carrier gas in the throat and to reduce the consumption of process gas [5]. In addition, by preheating the carrier gas to a temperature of several hundred degrees Celsius, the particle velocity and temperature increase and particle interface bonding can be improved [10].
Due to the significant effect of in-flight particle velocity on the coating quality, considerable efforts have been devoted to study the influence of operating parameters such as gas temperature [10], gas flowrate, chamber (back) pressure, standoff distance (i.e., the distance between the nozzle exit and the substrate), particle size, and shape [2,11,12,13,14,15,16] on particle conditions upon impact. Akedo et al. [6] found a connection between the particle impact velocity and the gas (i.e., nitrogen, helium, and air) consumption to control the velocity of particles using a time-of-flight method. It is worth mentioning that, in order to control the particle velocity in a broad range, helium gas is usually used, while air or nitrogen gas can be used to reduce the cost [17]. Glosse et al. [18] investigated the effect of gas flow rates and chamber pressures on the jet formation using a shadow optical imaging system and were able to estimate the gas flow structure and the particle trajectories. Particle size also significantly affects the particle trajectory and velocity. Ma et al. [19] numerically showed that there is an optimum particle diameter for achieving higher impact velocity in particle deposition systems. To obtain a higher impact velocity for copper particles, they suggested that the substrate should be located behind the high-pressure region of gas shock wave. Although most of the previous works were conducted solely at room temperature, Wang et al. [10] experimentally showed that by increasing the gas temperature above 200 °C, a dense and thick coating layer of doped lanthanum gallate (i.e., electrolyte material for the intermediate temperature-solid oxide fuel cell) with higher conductivity will be formed. This improved interface bonding was achieved through the collision of particles at elevated velocity and temperature. Preheated gas not only results in higher particle velocity, but also increased particle temperature. At elevated gas temperatures, a decrease in crystallite size and grain diameter was observed which resulted in an enhanced bonding and consolidation.
Suzuki et al. and Kim et al. [15,16] showed that particle shape has significant influence on the coating’s microstructure in the AD method, which can be due to the effects of particle shape on the in-flight particle velocity and mechanisms of impact. There have been several studies about the influence of particle shape on the particle velocity and mechanisms of impact in cold spray system which is a similar process to the AD method but with much higher inlet/outlet pressures and relatively larger particles. Jodoin et al. [20] experimentally showed that a non-spherical particle undergoes early boundary layer separation compared with the spherical particle due to a negative pressure gradient present on the particle surface. As a result, non-spherical shape particle presents higher in-flight and impact velocities than the spherical particle under the same operating conditions [21]. Özdemir et al. [22] numerically showed that the impact of particle sphericity on the acceleration of particles larger than 3 µm is significant. The effects of particle shape on the mechanisms of impact in the cold spray system were studied by Jami and Jabbarzadeh [23]. They found that the local temperature and stress during impact strongly depends on the particle shape. It is worth mentioning that to fully understand the effects of particle shape in the AD method, more numerical and experimental studies should be conducted.
Besides adjusting the operating parameters, another approach to improve the coating quality is to optimize the nozzle shape and configuration. Park. et al. [14] studied the effect of nozzle throat width on deposition of α-alumina films of granule spray in vacuum using a modified aerosol deposition system equipped with a supplemental gas flow line in addition to the carrier gas flow line. The results of their measurement showed that a thicker film was formed using a wide throat nozzle in spite of the smaller pressure difference. Lee et al. [24] investigated the effect of the nozzle exit diameter and diverging spray angle on the coating layer quality. They developed an optimized nozzle geometry so that the pressure at the nozzle exit was equal to the deposition chamber pressure (to reduce shock strength outside the nozzle). The results obtained from CFD computation showed that the optimized nozzle yielded substantially better coating quality over non-optimized nozzles.
One of the challenges of utilizing the AD process is its low deposition efficiency (often less than 1%) [1]. In the work of Naoe et al. [25], the relationship between the particle impact velocity and deposition efficiency in the AD method was investigated. In this work, the deposition of α-Al2O3 powder on copper substrates was studied. It was found that by increasing the particle impact velocity, the deposition efficiency increases, reaches a maximum value, and then dramatically decreases where the erosion of the film can be observed. However, it should be noted that the deposition efficiency was 0.104% at most which is much lower than that of cold spray [1,23,26]. Shahien et al. [27] improved the deposition efficiency of ceramic particles on AISI 304 stainless steel substrate using the plasma-assisted aerosol deposition to activate the surface of the particles. The activated surface acts as a glue while strengthening the binding between deposited particles. In the work of Wang et al. [10] (described above), the deposition efficiency was also improved by increasing the gas temperature. However, a deeper understanding of the process (including particle in-flight behavior and coating buildup mechanisms) and materials recycling or recirculation in the process is necessary to overcome this issue.
Today, CFD is a powerful tool to tackle complex engineering problems and to control and optimize various processes. However, the accuracy and reliability of the results strongly depend on the employed sub-models and assumptions, the mesh size and quality, the numerical schemes, etc. For instance, to model the AD process, in most of the past studies [2,13,19,28,29], incompressible drag coefficients were used which solely depend on Reynolds number ( R e ). In addition, the Ranz–Marshall correlation which only accounts for Reynolds and Prandtl ( P r ) numbers was utilized to estimate the heat transfer coefficient [28,29,30]. In other words, the effects of compressibility and rarefaction on the particle velocity and temperature were not taken into account. Since the back pressure is low and the particle size is small, the effects of compressibility and rarefaction might be important to better predict the in-flight particle velocity and temperature.
The compressibility and rarefaction effects can be evaluated by the Mach ( M ) and Knudsen ( K n ) numbers. For suspension high velocity oxy fuel (HVOF) thermal spray processes, the effects of M and K n numbers on the particle velocity and temperature were modeled by Jadidi et al. [31] and Chadha et al. [32]. In the work of Jadidi et al. [31], the drag coefficient was assumed to be a function of R e , M and K n , while the effects of M and K n on the heat transfer coefficient were ignored. Consequently, the particle temperature was underestimated (compared to the Accuraspray measurements) by around 500 K (20%). Chadha et al. [32] developed the model and considered the effects of compressibility and rarefaction on both the drag coefficient and the heat transfer coefficient. It was shown that prediction of particle temperature was significantly improved in their study. It is worth mentioning that in the suspension HVOF, the particle size is less than 10 μm, which is similar to the particle size in the AD method.
The effect of M and K n numbers on the particle velocity in the AD method was studied by Zabihi et al. [30]. They used the incompressible drag coefficient as well as a drag coefficient introduced by Loth [33] which considers the effects of compressibility and rarefaction. However, the dependency of the heat transfer coefficient on the M and K n numbers were ignored. By comparing the results, Zabihi et al. showed that the predictions of particle velocity can be significantly improved by using Loth’s drag coefficient.
In the present work, the motivation is to consider the influence of compressibility and rarefaction on both particle dynamics and heat transfer in the AD process. Developing such a model is necessary to understand the physical phenomena involved in the AD process and to better estimate the particle temperature and velocity upon impact. Moreover, in order to understand the impact process and bonding mechanisms in the AD system, the present model is able to provide more accurate initial conditions for the proposed impact models (see for instance [34,35,36,37,38]).

2. Methodology and Numerical Analysis

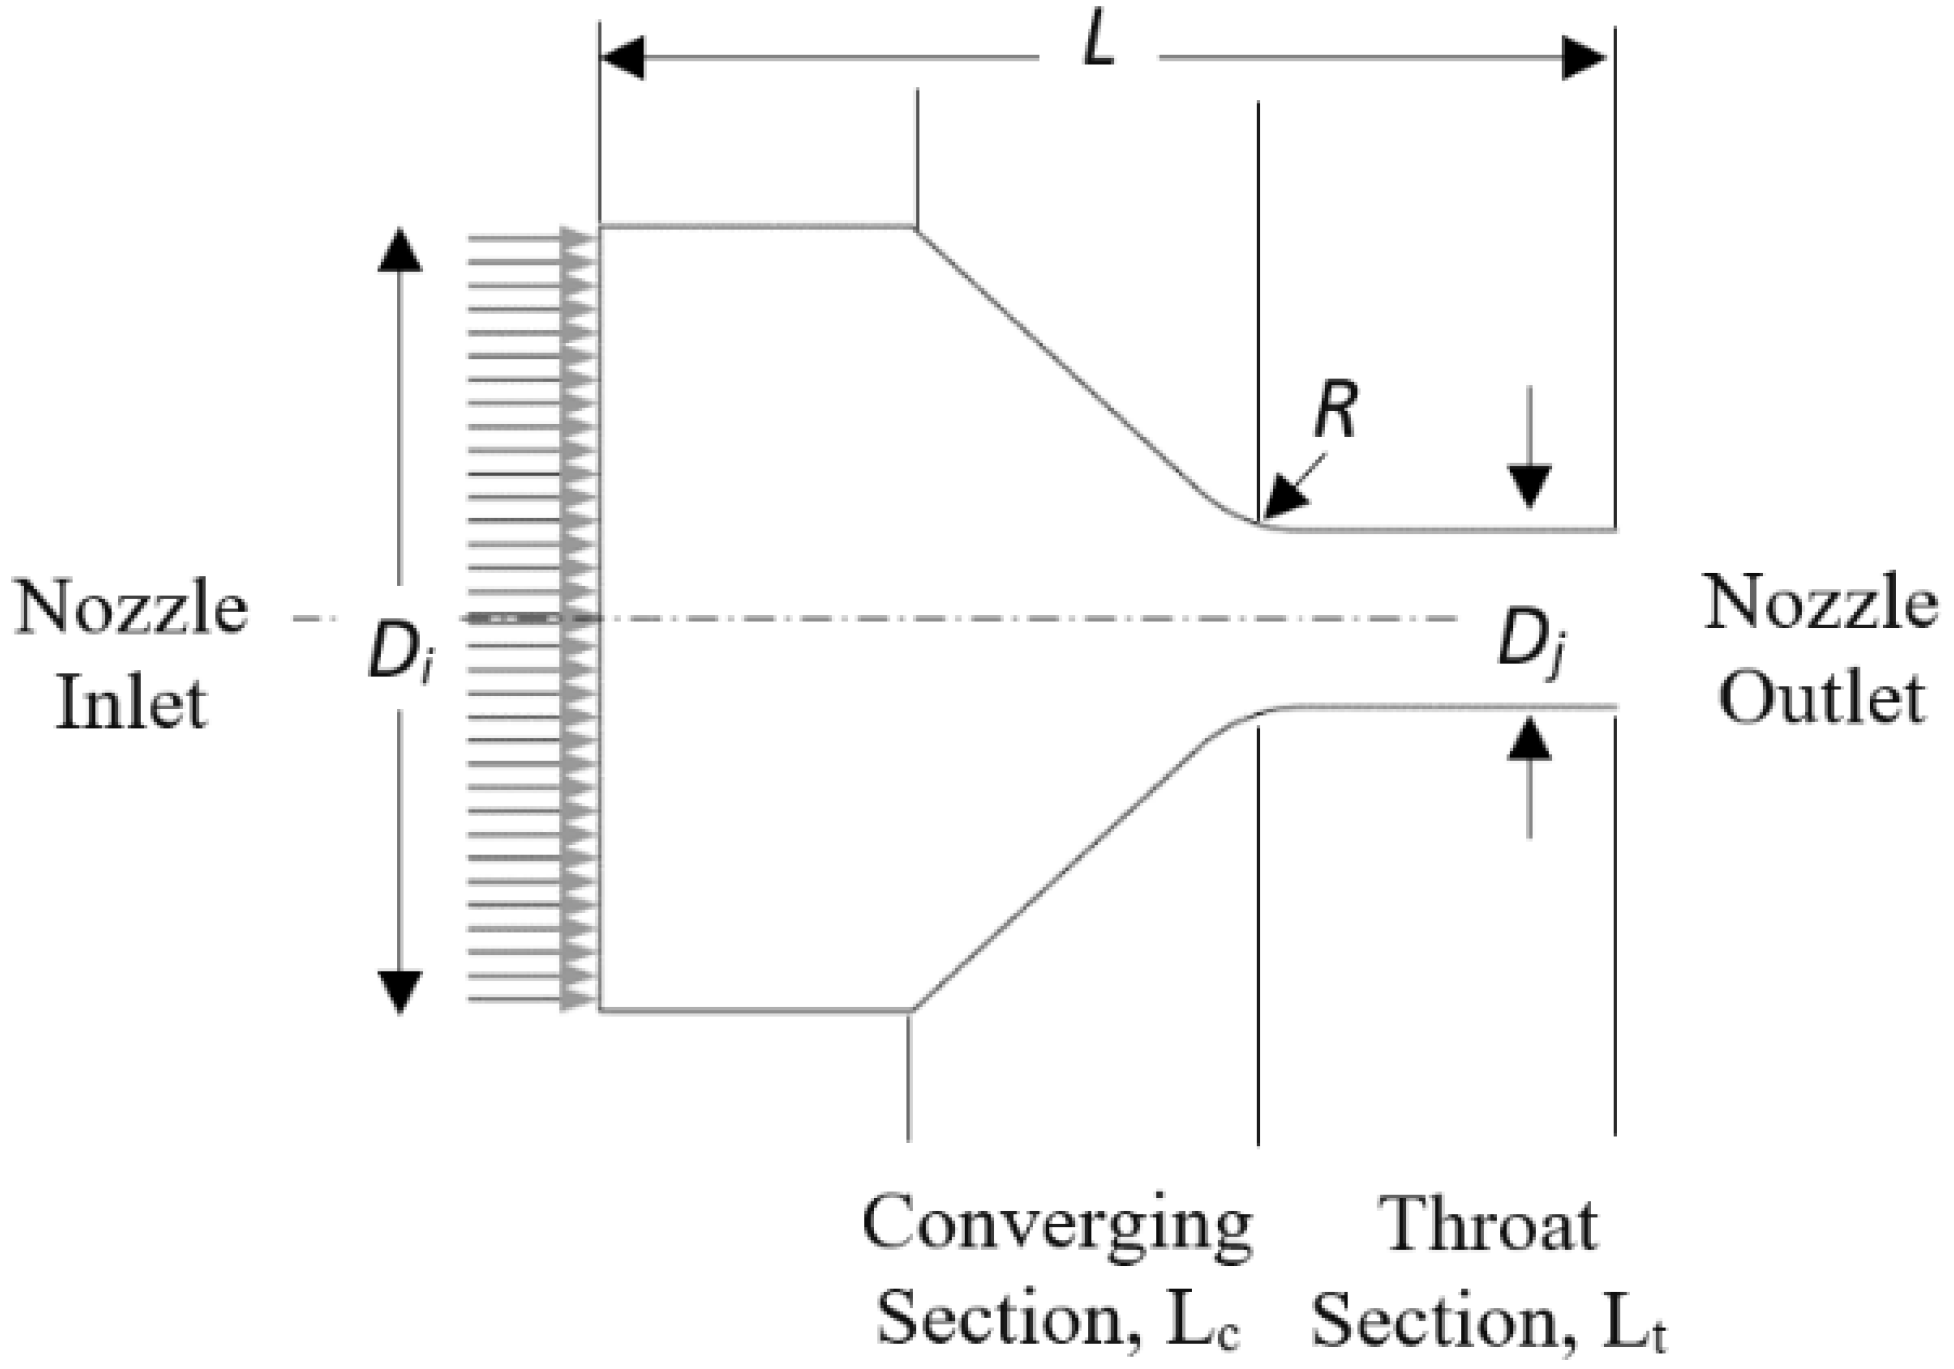
2.1. Geometry and Computational Domain

In the current study, helium gas with high pressure ratio is directed into the deposition chamber through a converging-barrel nozzle [28,39]. The pressure ratio is the ratio of aerosol chamber pressure ( P 0 ) to deposition chamber pressure ( P b ) and it is the driving force for gas and particle acceleration. Figure 2 illustrates the geometry of the nozzle and Table 1 lists the dimensions of the nozzle. Since the goal of this computational study is to develop more accurate sub-models for the particulate phase, without loss of generality, it is assumed that the gas flow is axisymmetric. Therefore, a two-dimensional axisymmetric nozzle with 4 mm 2 exit surface area is used. It should be noted that the surface area of the nozzles in different experimental and numerical studies are in the range of 2 to 5   mm 2 [13,18,28,40]. The slit nozzles with rectangular cross-sections, in which axis-switching phenomena for the gas phase can happen, were modeled using 3D geometries and meshes in the previous paper [30].
A structured 2D mesh of 394,000 cells is employed to model the fluid domain. A flat substrate is located at a standoff distance (SD) of 15 mm. The substrate, nozzle and the deposition chamber walls are modeled with a no-slip boundary condition and the temperature are fixed at 300 K. The gas outlet of the computational domain is considered as pressure outlet as shown in Figure 3. A refined mesh structure as shown in Figure 4 is considered for critical locations such as regions near the nozzle walls and in the vicinity of substrate where large variations of parameters are expected.

2.2. Flow Field Simulation

To model the gas phase, the compressible form of the mass, momentum, and energy equations is solved together with an ideal gas equation of state (as in other studies in this field [2,13,19,30]) using ANSYS Fluent solver release 2020 R2. The turbulence of the gas phase is described with the use of realizable k-ε turbulence model in combination with the enhanced wall treatment (EWT) function. The pressure-velocity coupling is handled by the coupled algorithm. The Green–Gauss node-based and the second order discretization scheme are enabled for gradient terms and pressure, respectively. The gas solver is steady state pressure-based, and the gravitational effects are ignored. The viscous heating is considered for the inclusion of viscous dissipation terms in the compressible flow. It should be noted that the Reynolds-averaged Navier–Stokes equations as well as the k-ε turbulence model are explained in detail in the previous papers [30,31,41] as well as several books such as those in references [42,43,44,45,46]. Therefore, to make this paper concise and coherent, only the key points and assumptions are mentioned here. Interested readers are referred to the stated references for more information about the methods and numerical schemes.
For simulating the behavior of carrier gas and trajectory of in-flight particles, the particle-laden flow is injected into the nozzle. For the gas phase, the inlet and outlet boundary conditions are set at 360 kPa ( P 0 ) and 1.22 ( P b ) kPa, respectively. In order to investigate the effect of gas temperature on the particle behavior, two temperature conditions of 300 K and 573 K are used [10] and the results are compared. The boundary conditions are defined as shown in Table 2.

2.3. Particle Transport Model and Governing Equations

After obtaining a converged solution for the gas phase, copper particles are injected into the computational domain to study the behavior of the in-flight particles upon impact with the substrate. The two-way coupled Eulerian–Lagrangian approach (the Lagrangian discrete phase model (DPM) in ANSYS Fluent [42]) is applied to compute the particle in-flight behavior in the AD system. Spherical micron-sized copper particles ( 5   μ m ) were released uniformly along the inlet boundary of the nozzle with an initial velocity of 10 m/s and mass flowrate of 0.002 g/s.
Newton’s second law of dynamics describes the acceleration of each in-flight particle as below:
d v p d t = v g v p τ r + F a
where relaxation time for a particle and Reynolds number are defined as τ r = 24 18 ρ g d p 2 μ g C D R e and R e = ρ g d p | v p v g | μ g , respectively. Here, C D is drag coefficient, d p is particle diameter, μ g is gas viscosity, ρ g is gas density, ρ p is particle density, F a is acceleration caused by additional forces affecting the particle, and v g and v p are gas and particle velocities, respectively. Three different empirical drag coefficients are used: spherical (incompressible) drag coefficient, as well as drag coefficients developed by Loth [33] and by Crowe [47]. The thermophoretic force is activated to consider the effect of temperature gradient on the in-flight particles. It should be noted that due to the significant decrease in the temperature during the travel of the gas through the nozzle, the in-flight particles experience a thermophoretic force in the opposite direction of the gas temperature gradient [30]. Stochastic collision model which is based on the algorithm of O’Rourke [48] are also included in the simulations. Furthermore, the discrete random walk model is applied to include the effects of instantaneous gas velocity fluctuations on the particle trajectories [42]. Detailed information about these models can be found in [42]. In this study, the unsteady particle tracking treatment is conducted, using the time step size of 10 5 s, to inject the inert spherical copper particles and to track the particles.
As it is shown in Equation (1), the equation of motion for particle in continuous phase consists of the drag force. The drag coefficient is calculated based on the following empirical correlations:
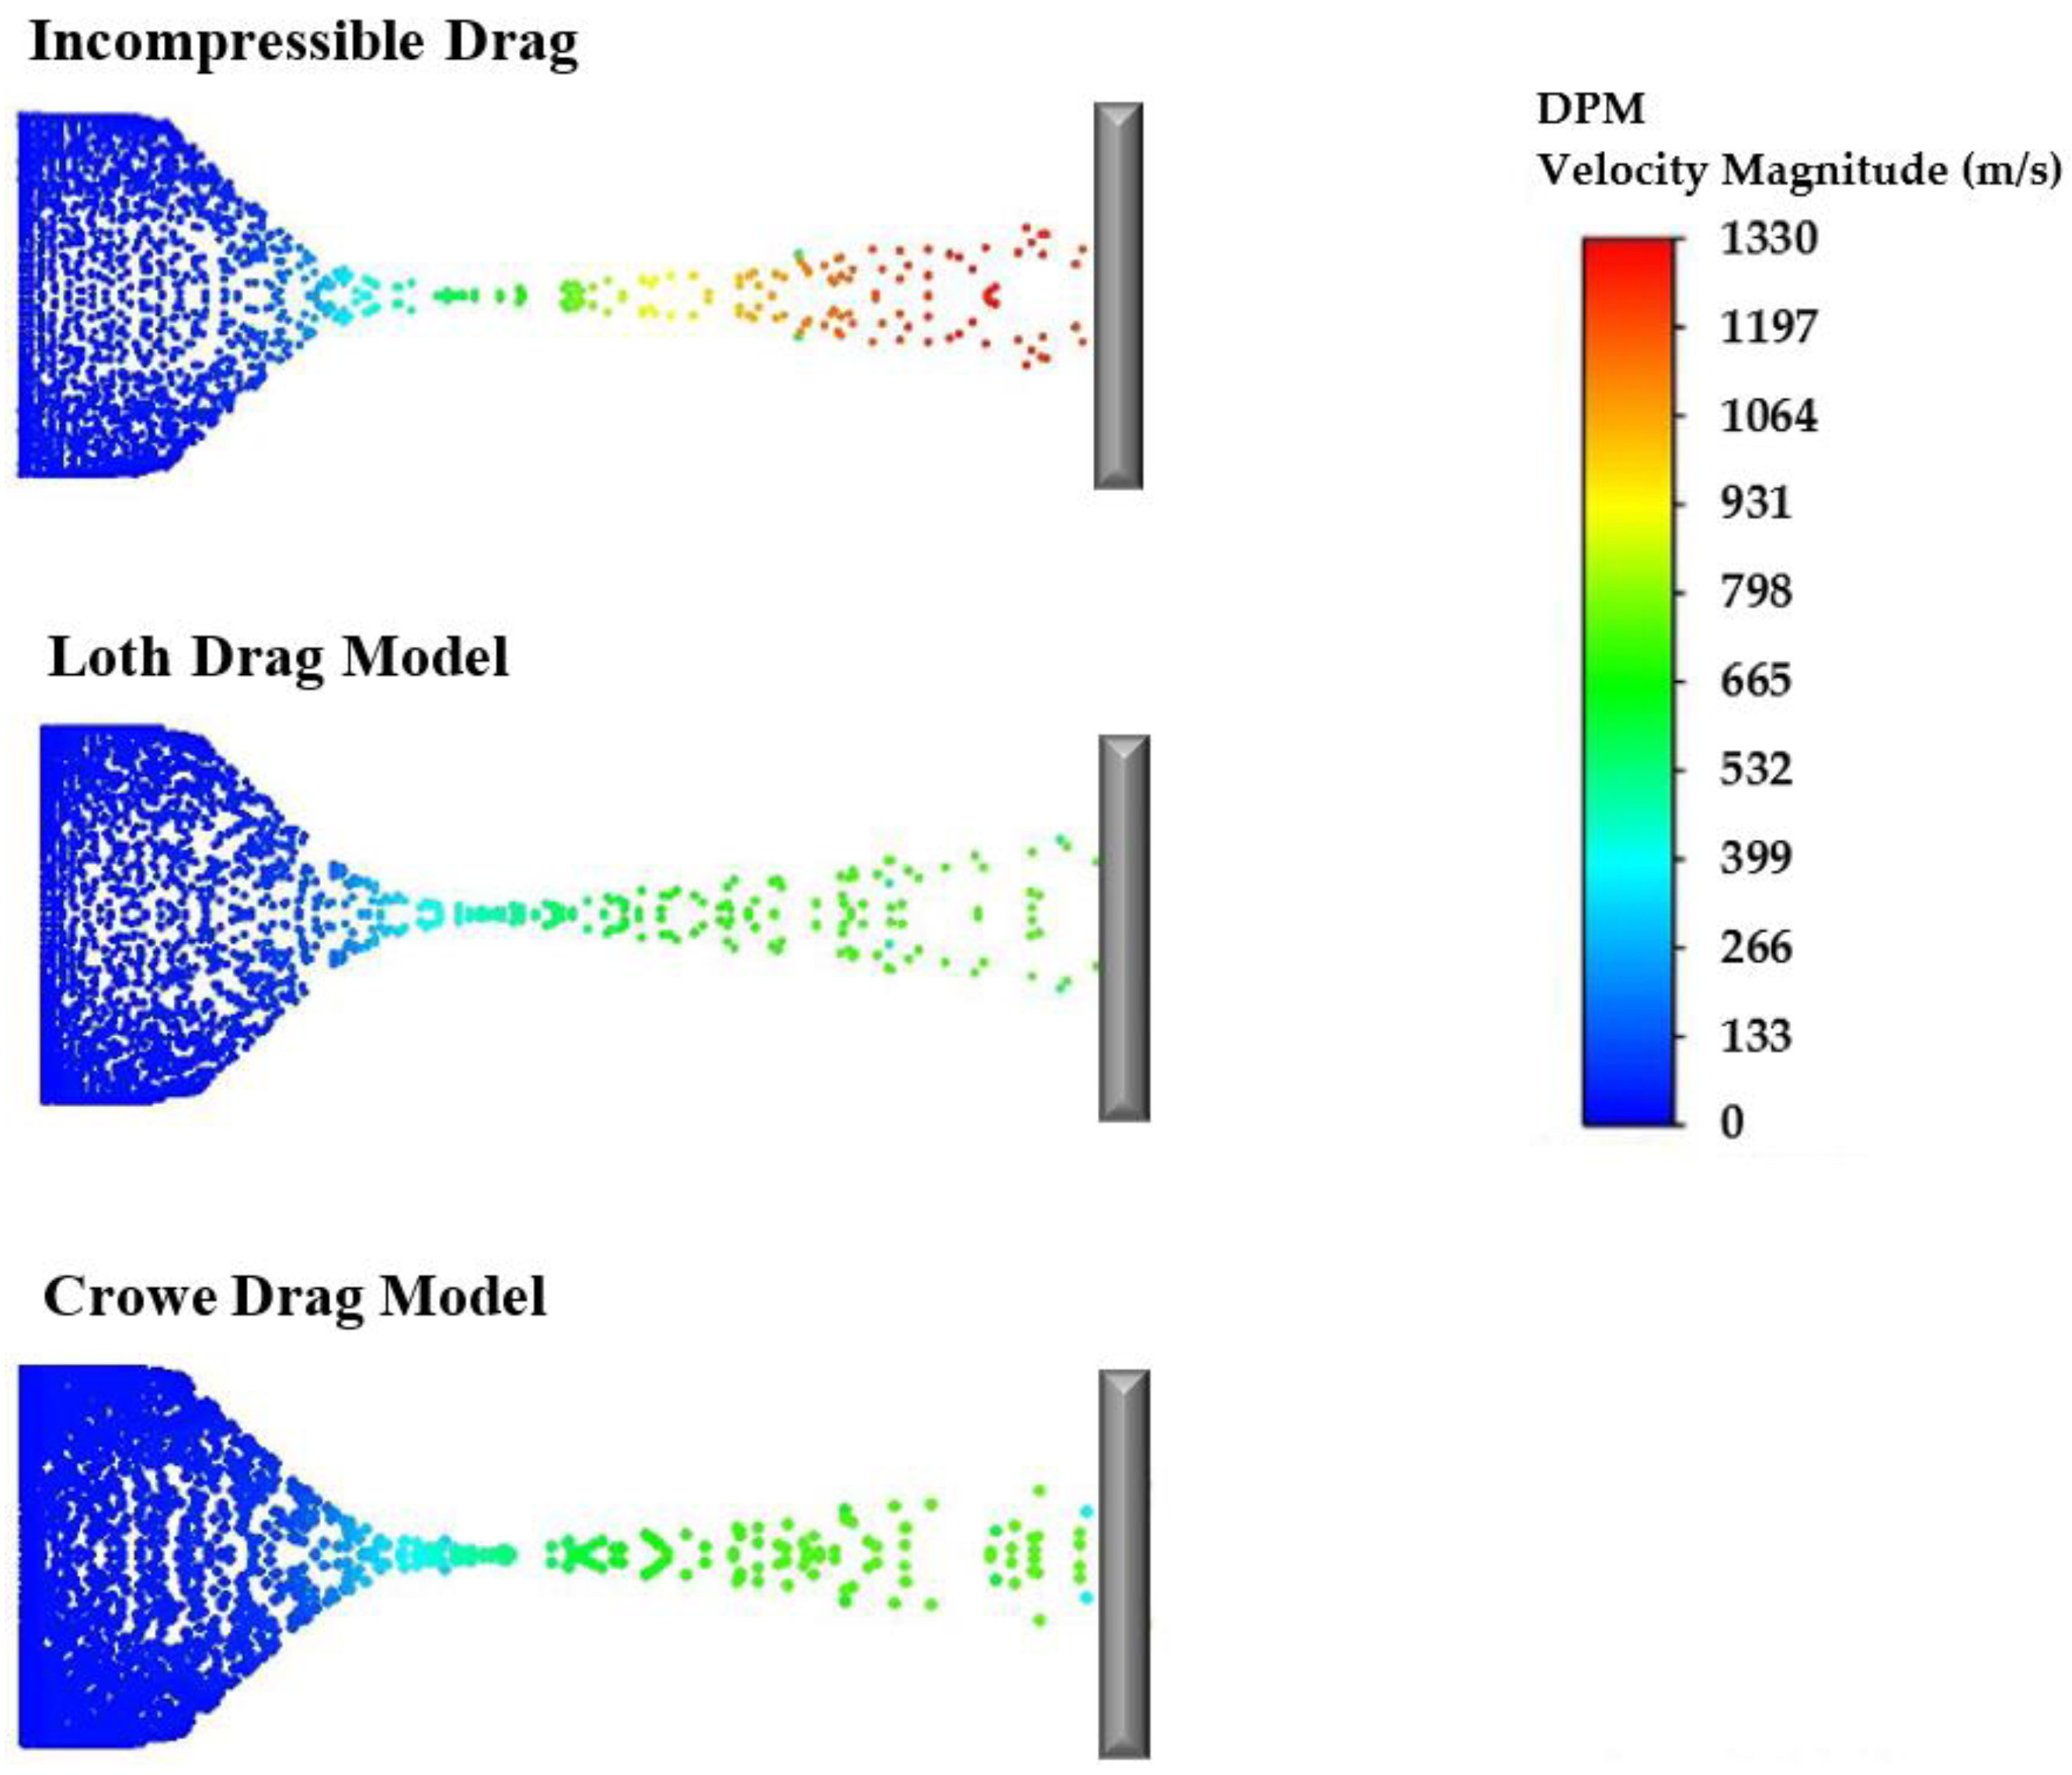
  • Spherical or incompressible drag coefficient developed by Morsi and Alexander [49]:
    C D = a 1 + a 2 R e + a 3 R e 2
    where a 1 , a 2 , and a 3 are constants.
  • Crowe et al.’s drag coefficient which is a function of M , K n , and R e [47,50,51]:
    C D = ( C D i n c 2 ) exp [ 3.07 γ   M p R e p   g ( R e p ) ] + h ( M p ) γ   M p e R e p 2 M p + 2.0
    l o g 10   g ( R e p ) = 1.25   [ 1 + tan   ( 0.77   l o g 10 R e p 1.92 ) ]
    h ( M p ) = [ 2.3 + 1.7 ( T p T g ) ] 2.3   tan h ( 1.17   l o g 10   M p )  
    where C D i n c is the drag coefficient in an incompressible flow taken from a correlation by Clift et al. [52], γ is ratio of specific heats, M p is Mach number, R e p is particle Reynolds number, T p is particle temperature, and T g is gas temperature. It should be noted that the above correlation is not valid beyond the critical Reynolds number (~ 3 × 10 5 ) where the boundary layer becomes turbulent [53].
  • Loth’s drag coefficient, which is more recent, considers the effects of compressibility and rarefaction on the particle behavior [33]. For R e p   45 where rarefaction effects are dominant due to small M values and for R e p   > 45 where compressibility effects are leading the particle behavior because of small K n p values, the two separate models are introduced.
    C D = C D ,   k n , R e 1 + M p 4 + M p 4 C D ,   f m , R e 1 + M p 4 R e p 45
    C D = 24 R e p [ 1 + 0.15 R e p 0.687 ] H M + 0.42 C M 1 + 42500 G M R e p 1.16 R e p > 45
    C M = 5 3 + 2 3 tanh [ 3 ln ( M p + 0.1 ) ] M p 1.45
    C M = 2.044 + 0.2 e x p { 1.8 [ ln ( M p 1.5 ) ] 2 } M p > 1.45
    G M = 1 1.525   M p 4 M p < 0.89
    G M = 0.0002 + 0.0008   tanh [ 12.77 ( M p 2.02 ) ] M p > 0.89
    H M = 1 0.258   C M 1 + 514   G M
    where C D ,   k n , R e and C D ,   f m , R e are Schiller–Naumann and free-molecular limit corrections, respectively [33].
To simulate the particle heat transfer, the lumped-heat-capacity method is used and two different Nusselt numbers are utilized:
  • The semi-empirical Ranz–Marshall correlation [54,55] ( N u i n c ) are determined using:
    N u i n c = h   d p k g = 2.0 + 0.6   R e p 1 / 2 P r 1 / 3
    where d p , k g , P r , and h are particle diameter, thermal conductivity of the gas, Prandtl number, and the heat transfer coefficient, respectively.
  • The correlation introduced by Kavanau [56] which considers the effects of rarefaction and compressibility on the Nusselt ( N u ) number and is valid for a wide range of K n number [53]:
    N u = N u i n c 1.0 + 3.42   M p R e p   P r   N u i n c
The effects of N u and C D are discussed in Section 3.

2.4. Numerical Validation Setup

To validate the continuous phase solver described in Section 2, a series of test cases for free jets are run, and the obtained Mach disk diameters and locations are compared with experimental data. A 2D axisymmetric nozzle with the dimensions explained in Table 1 is utilized. In fact, the nozzle geometry is similar to one of the nozzles used in the experimental work of Crist et al. [57] to study the highly under-expanded sonic jet. The deposition chamber dimensions are expanded to be 35 mm in length and 50 mm in height (Figure 5). The Dirichlet no-slip boundary condition is used at the walls and temperature is set to 300 K. The gas outlet of the computational domain is considered as pressure outlet and fixed at 1220 Pa for all cases. Nitrogen gas with different pressures at 573 K is injected into the nozzle. The comparison between numerical and experimental studies are discussed in the next section.

3. Results

3.1. Numerical Validation Results

For the case of free jet, when the back pressure is much lower than the stagnation pressure, the compression and expansion waves as well as a strong Mach disk (a highly under-expanded supersonic jet) form outside the nozzle. The greater the difference between the back pressure and the stagnation pressure, the further is the Mach disc located and shock forms. The expansion waves at the nozzle exit lip are reflected at jet boundary as compression waves and form a barrel shock. The reflected shock also compresses the flow downstream of the Mach disk where they become separated from the flow by the slip lines. Upstream the Mach disk, the gas pressure decreased along the centerline of the nozzle. Upon passing through the Mach disk, the pressure increases [57,58]. Notable features, including Mach disk, barrel shock, and reflected shock, diameter and location of the Mach disk are labeled in Figure 6.
The experimental work of Crist et al. [57] on the highly under-expanded jet is used as a basis for validating the modelling approach in which jets with various range of pressure ratios while the back pressure kept constant at 1220 Pa are modelled. As mentioned, realizable k-ε turbulence model is used to obtain the location and diameter of the Mach disk. The nozzle pressure ratio is plotted against the non-dimensionalized Mach disk diameter, D m / D j , and length, L m / D j , for the converging-barrel nozzle as illustrated in Figure 7 and Figure 8. Here, L m and D m are defined as the Mach disk location and diameter, respectively, and D j is the minimum diameter of the nozzle (i.e., the nozzle throat, see Table 1). The empirical formula developed by Addy [59], Equation (15), and Young [60], Equation (16), are also plotted for comparison.
D m D j = 0.36 ( P 0 P b 3.9 ) 0.5
L m D j = 0.72 ( P 0 P b ) 0.5
where P 0 is the stagnation pressure at the nozzle entrance and P b is the back pressure. As it can be seen from Figure 7 and Figure 8, a good agreement is achieved, validating our assumptions and numerical model.

3.2. Mesh Independence Study

For mesh independence study, the simulation with coarse, medium, and fine meshes has been performed for a free jet case. The results are shown in Table 3. Grid sensitivity studies confirmed that the numerical solution is not dependent on the grid resolution when the total number of nodes exceeds about 396,000. Therefore, for the case with a substrate, where the deposition chamber and the computational domain are much smaller compared to the free jet case, a mesh of 394,000 cells is considered.

3.3. Continuous Phase

To study the gas velocity and temperature variations, helium gas enters the system and accelerate through a converging-barrel nozzle to reach a substrate located at 15 mm distance from the nozzle exit (see Table 2 for boundary conditions). As shown in Figure 9a, the gas flow injected at 573 K is gradually accelerated through the nozzle throat, then the gas is abruptly accelerated in the downstream direction. After passing through the normal shock wave, the gas flow is suddenly decelerated close to the substrate inside the stagnation region. Figure 9b illustrates how the gas flow is accelerated to supersonic flow through the throat in the deposition chamber, and due to the existence of a highly under-expanded supersonic jet the Mach number changes noticeably and is much more than 1 upstream the normal shock wave. Furthermore, Figure 9c shows that the gas temperature is slightly dropped from 400 K to around 340 K in the vicinity of nozzle exit due to gas expansion and it increases to around 530 K in the stagnation region. Therefore, material susceptible to heat can be utilized as feedstock powders and substrates without undergoing thermal damage.

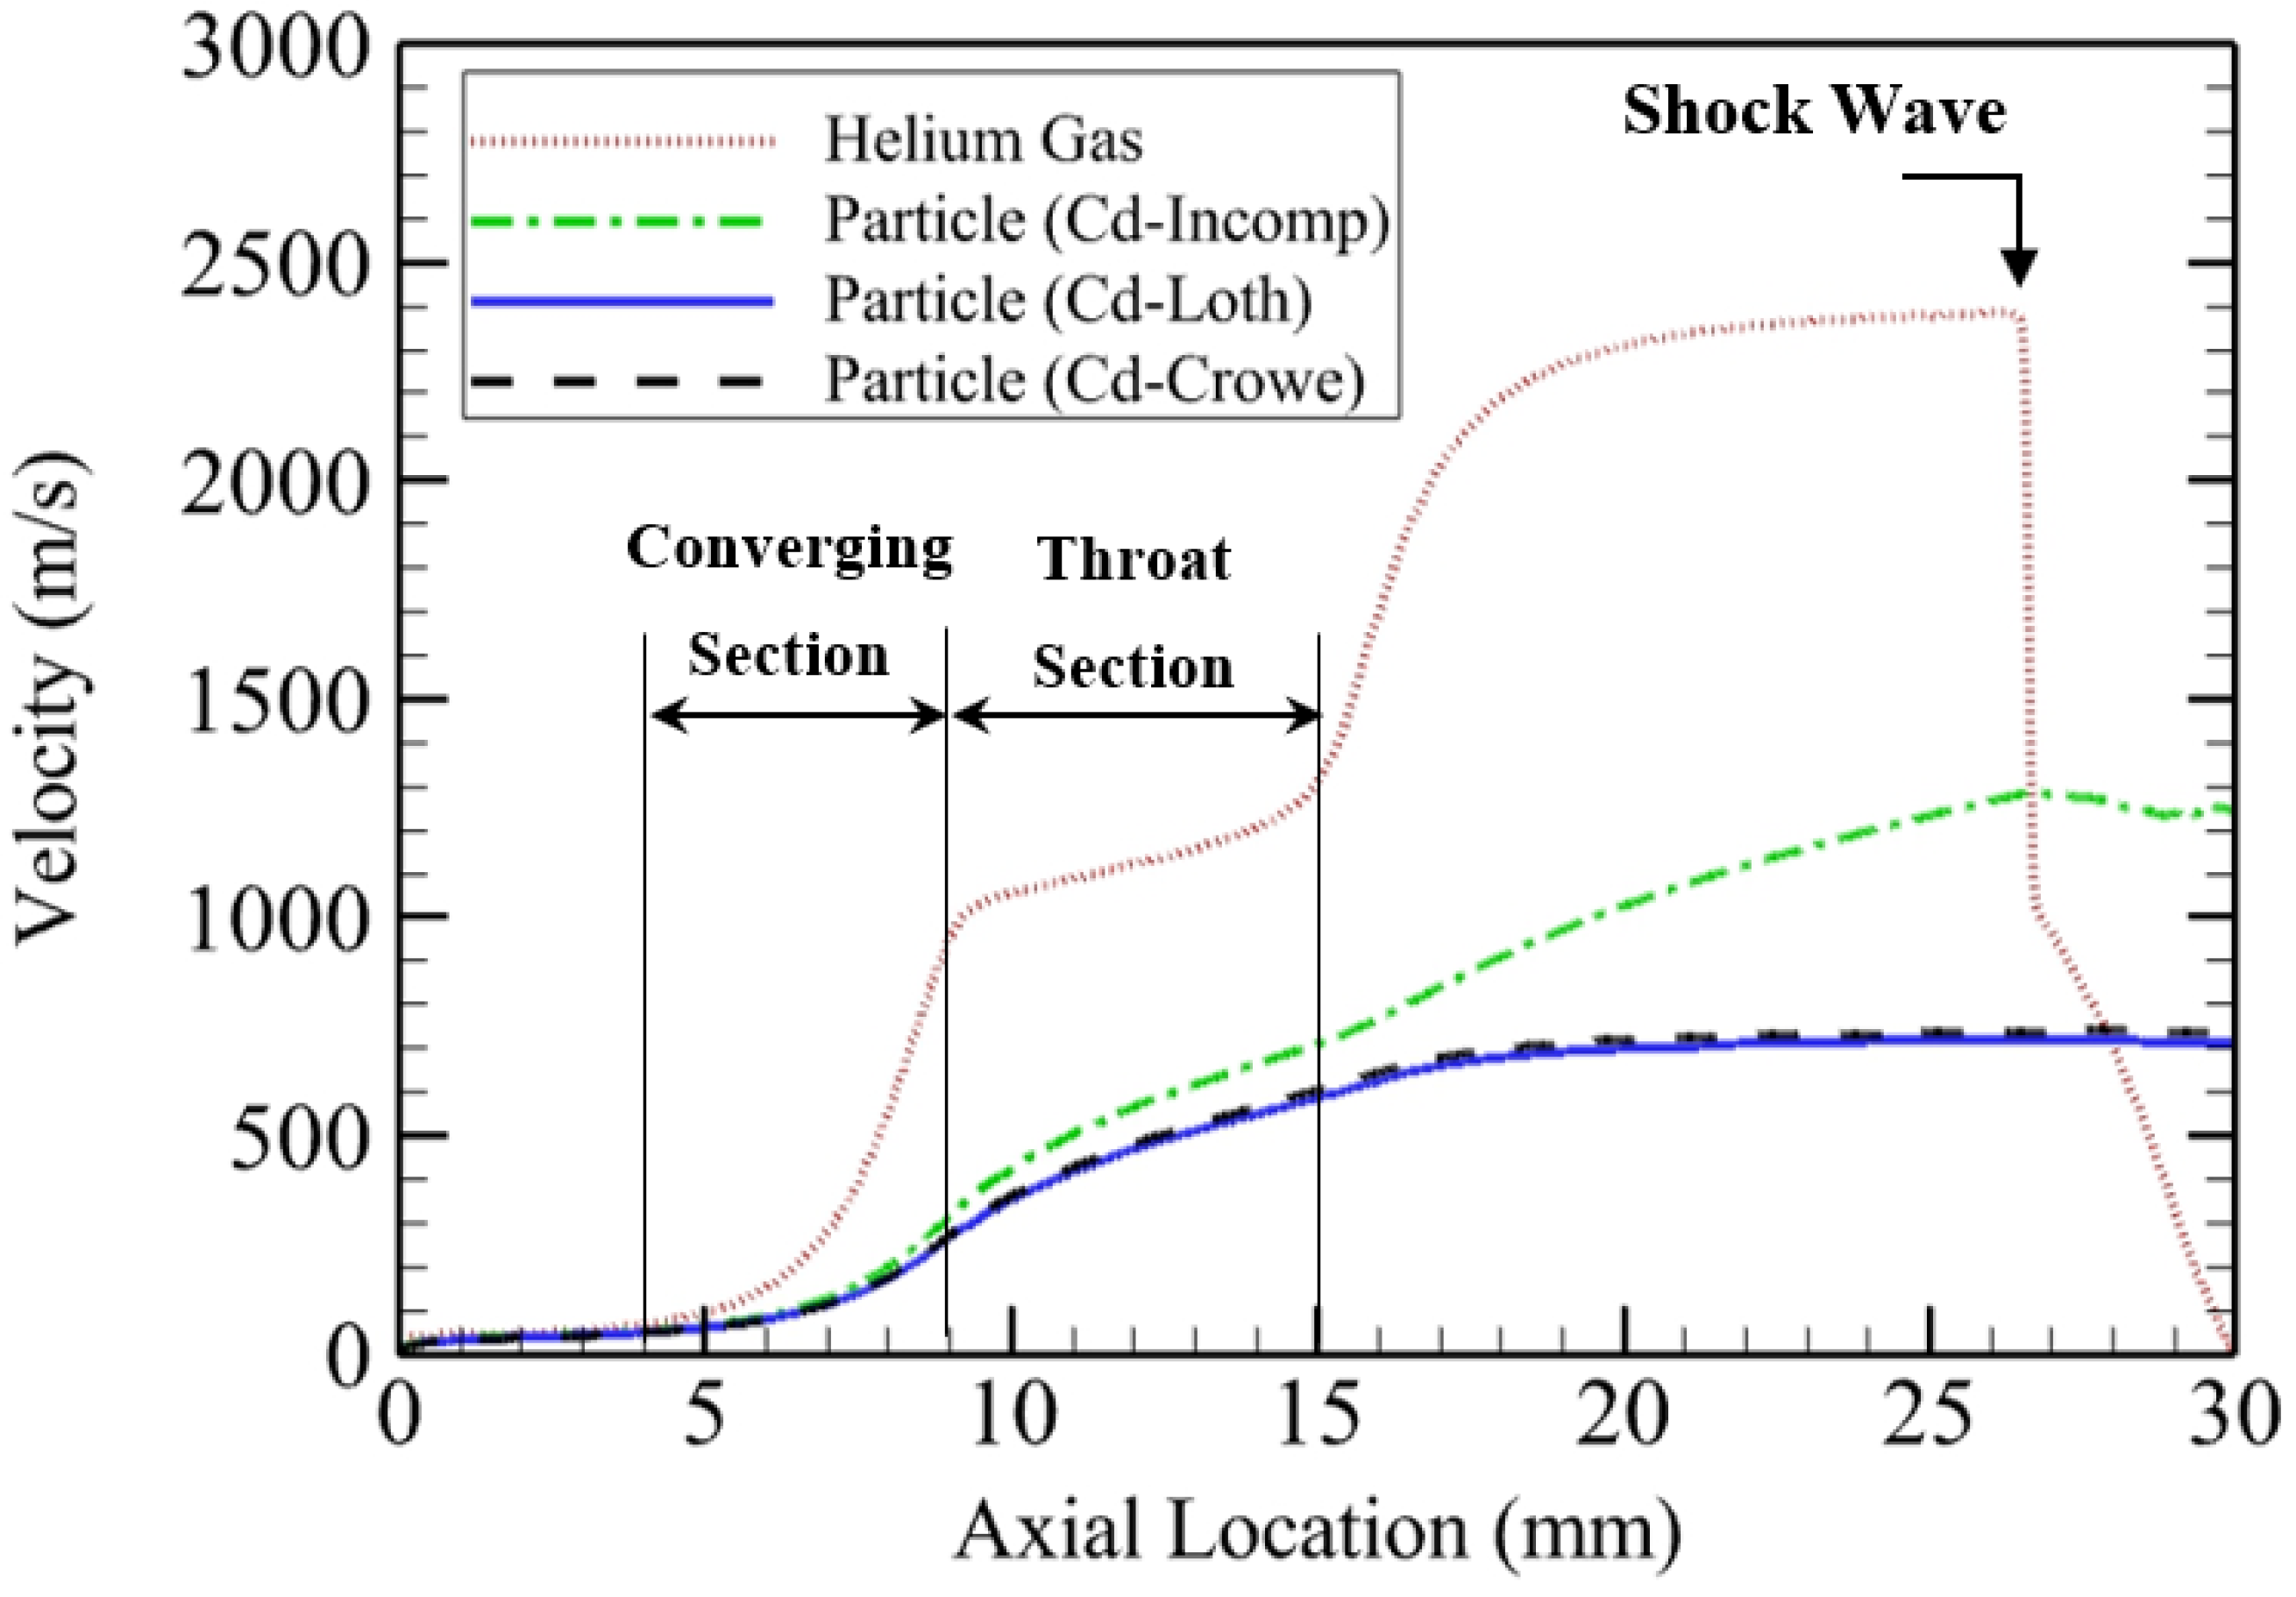
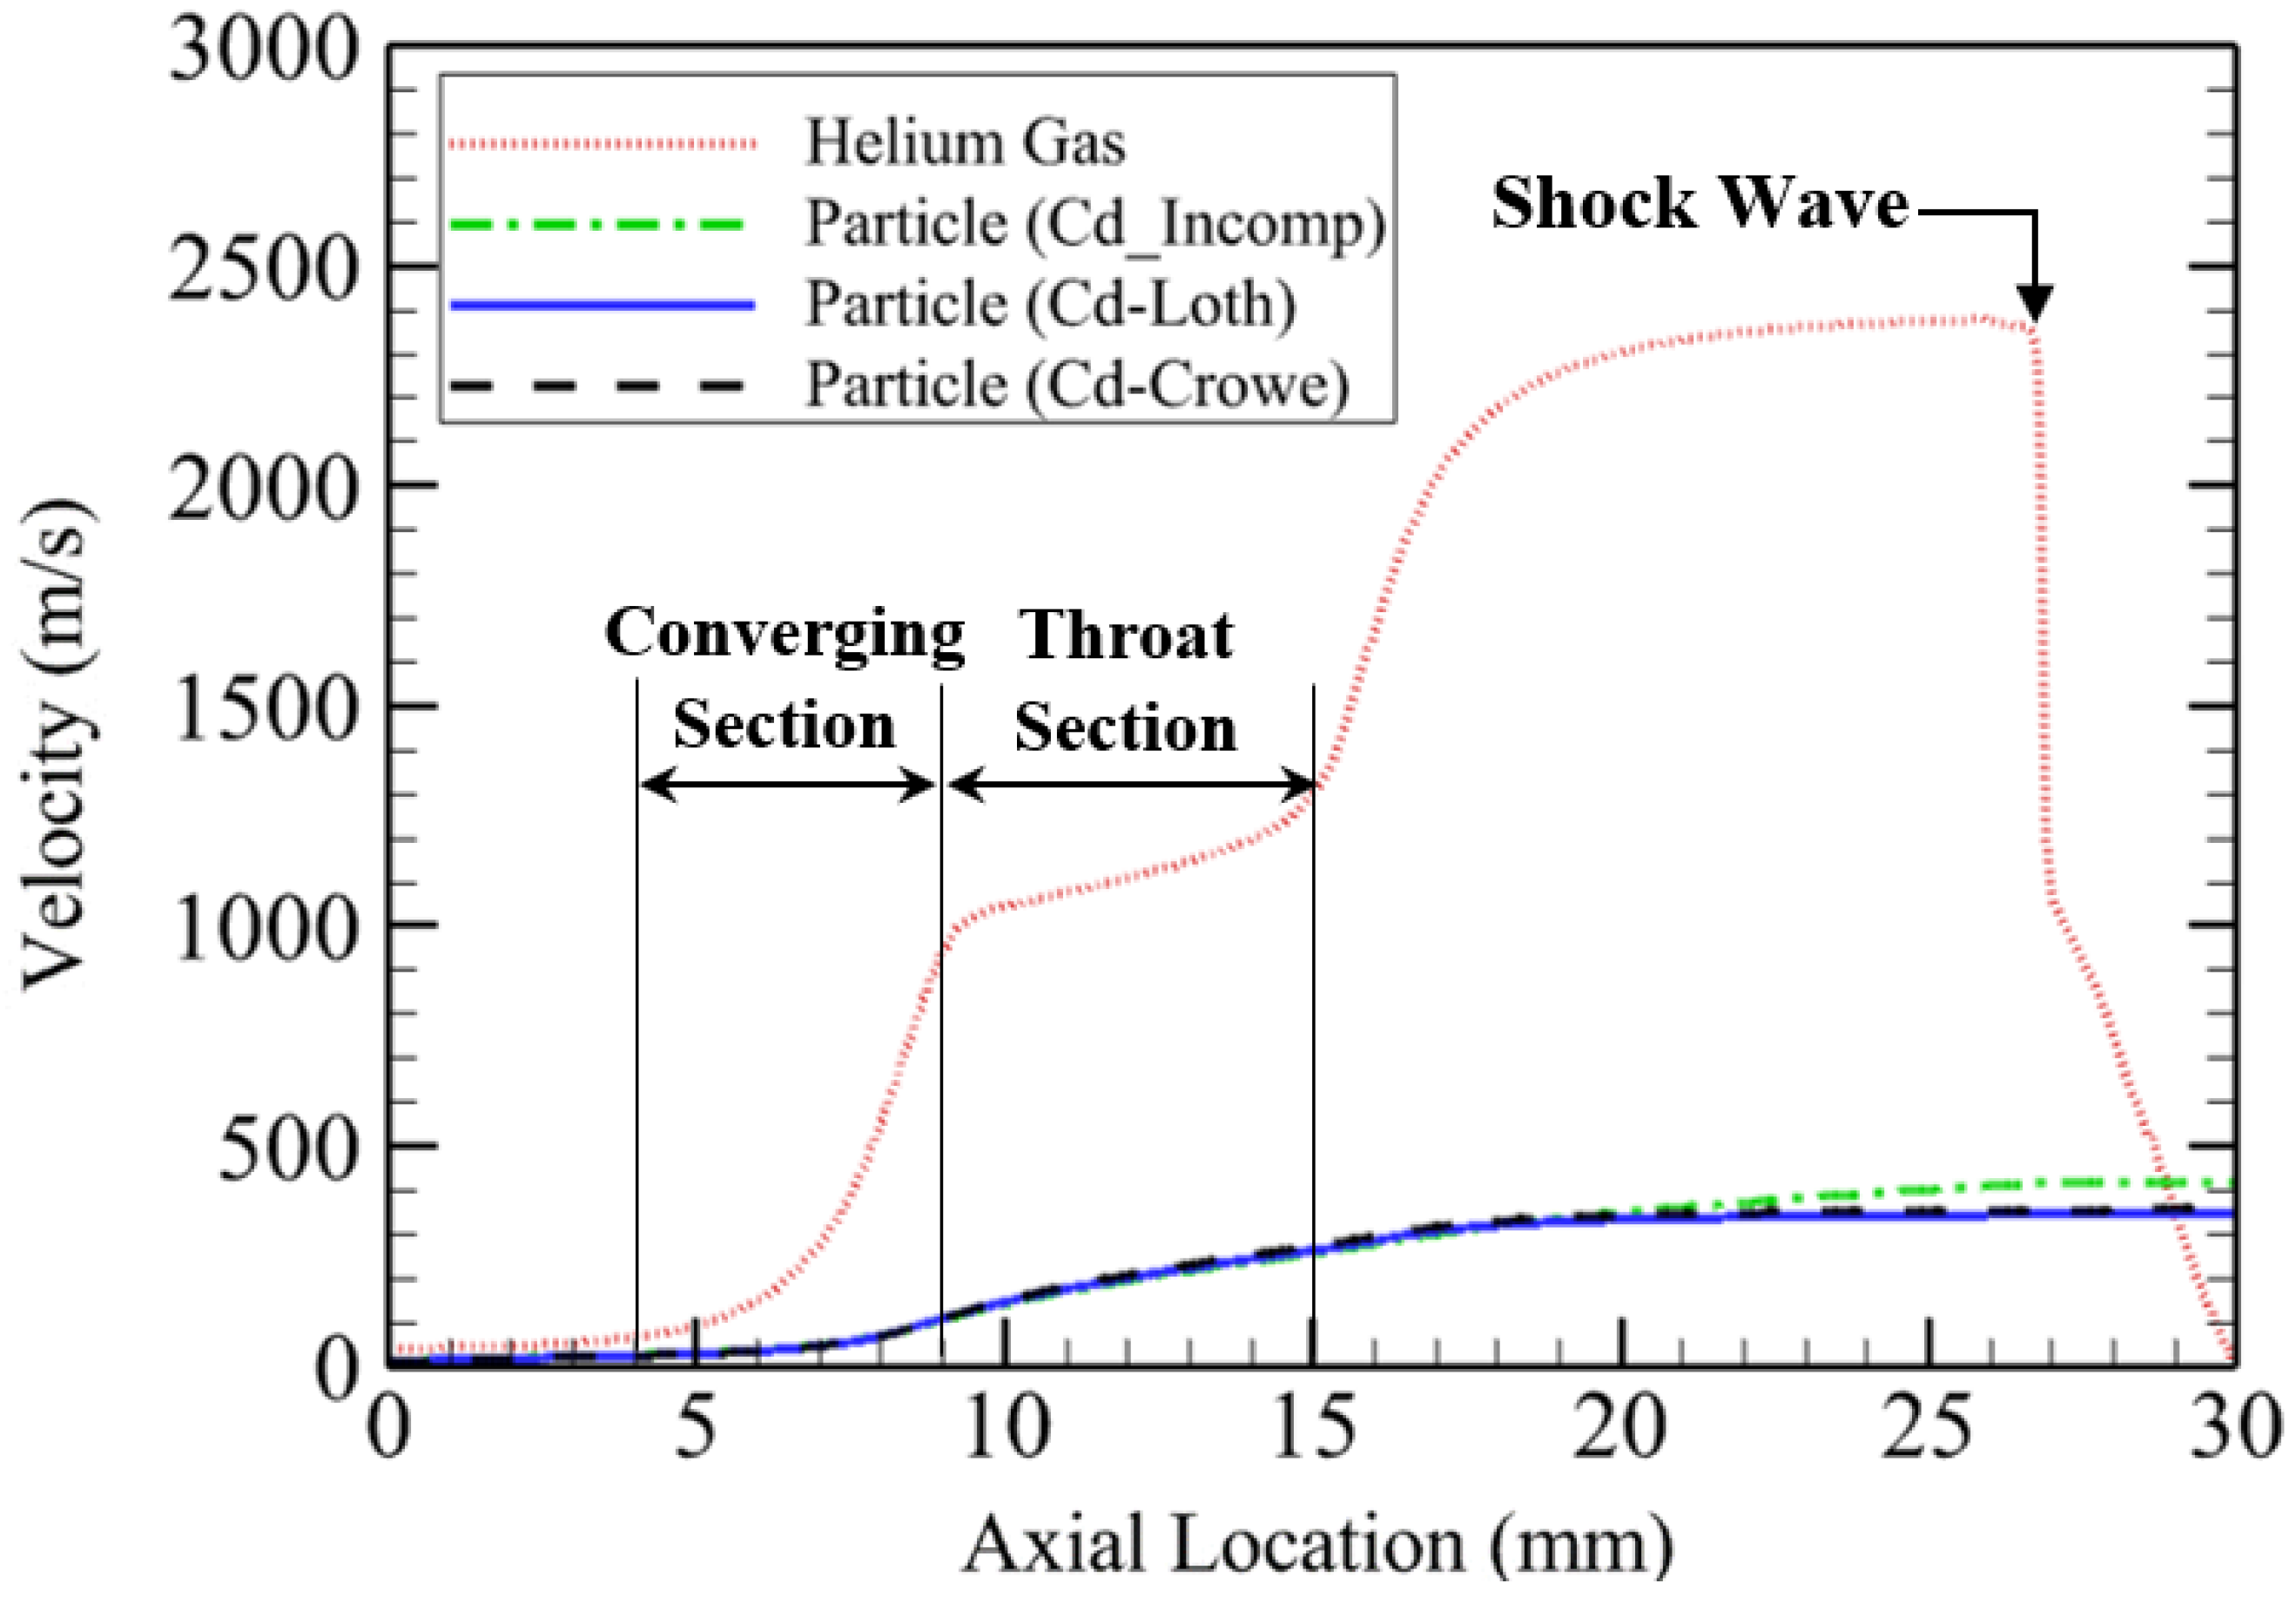
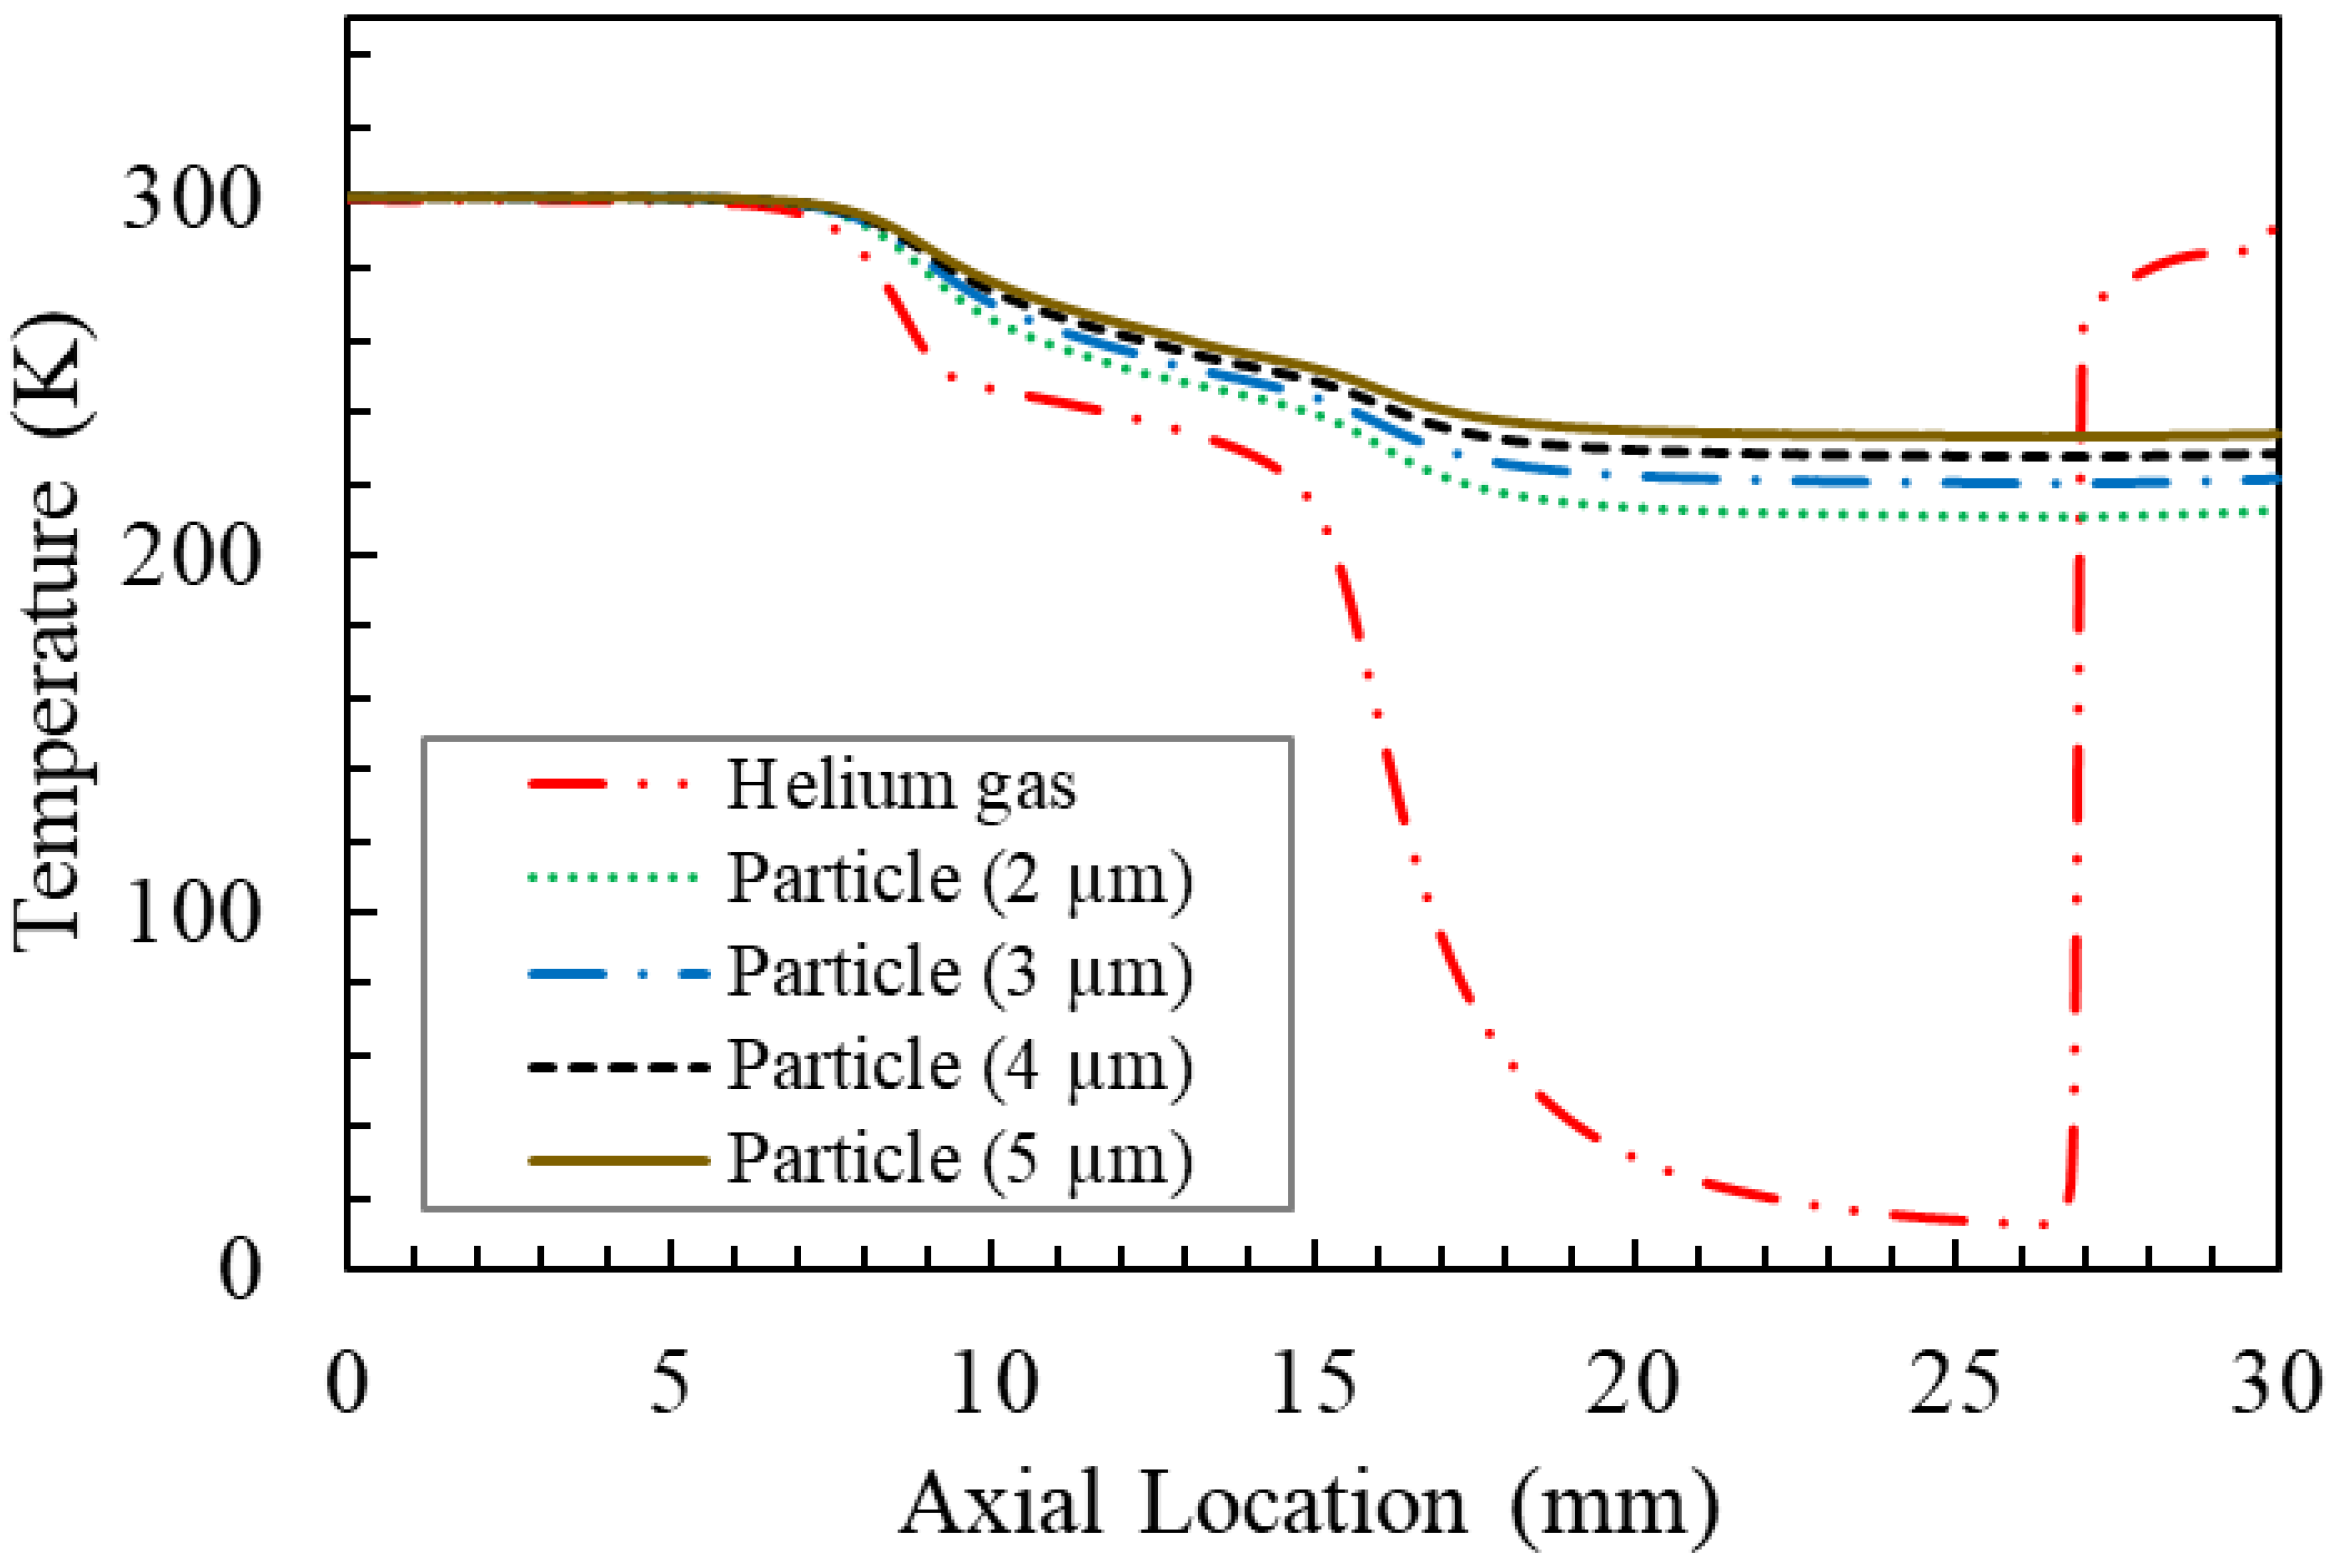
3.4. Effect of Drag Coefficient on Particle Velocity and Temperature

In order to study the effect of compressibility and rarefaction on variation of particle velocity along the jet centerline (x-axis), helium gas and copper particles enter the system at 573 K and accelerate through a converging-barrel nozzle. Figure 10 and Figure 11 display the velocity of the gas and particles with particle size of 1 and 5 μm, respectively, along a 30 mm path length using three drag coefficients: Loth [33], Crowe [47], and incompressible model [49].
In general, the acceleration of the particles can be divided into three stages: first, the particles are accelerated by the carrier gas inside the nozzle where the gas velocity is higher than the particle velocity. In the second stage, in-flight particles are accelerated by the supersonic jet in the vacuum chamber and reach their velocity plateau before the shock wave occurs. In this stage the velocity of the gas is still more than the velocity of the particles. Finally, the particles travel through the normal shock wave. A bow shock forms near the substrate when the gas jet hits the substrate. The bow shock comprises a high-pressure and low-velocity region. The gas velocity drops below the particle velocity in the vicinity of the substrate and abruptly reaches zero inside the stagnation region. Due to the presence of bow shock near the substrate, the particles experience a small deceleration or deflection. The results show that compared to the incompressible drag coefficient, the Crowe and Loth’s drag coefficients predict much lower in-flight and impact velocities for smaller particles (1 μm). The results of Loth model are similar to the fit given by Crowe since the Reynolds number in the computational domain is more than 45 and less than the critical Reynolds number. Increasing the size and mass of particles decreases the effects of Knudsen, Mach and Nusselt numbers on the gas-particle interaction. For larger size particles, the change in particle velocity between different drag expressions becomes smaller. In particular, for 5 μm particle, the impact velocity difference between Crowe and incompressible drag expressions is approximately 16%. The figures also show that the particles with diameter ranging from 1 to 5 μm would not slow down significantly before impact. In addition, the acceleration of small particles in the nozzle section is more than the large particles. As it can be seen from Figure 11, although the effect of compressibility is not significant for larger particles, ignoring the compressibility effect results in overestimating impact velocity. Figure 11 also shows that the velocity of 5 μm particles is about 330 m/s upon impact. To form a deposition layer, the impact velocity must exceed the critical velocity of several hundreds of meters per second. The critical velocity is a function of particle material and for the metal materials due to the microstructure of the metal, impact velocity needs to be much higher than ceramic impact velocity of 150 m/s [19].
Figure 12 and Figure 13 show the particle and gas temperature variations using different drag expressions for 1 μm and 5 μm particle sizes, respectively. In the converging section and upstream of the shock wave, gas temperature is less than the particle temperature. The gas temperature decreases due to gas expansion and heat is transferred from particles to the gas flow. The temperature downstream of the shock wave increases while the particles travel through the normal shock wave in the vacuum chamber. The heat transfer direction is from gas flow to the particles.
For particle size of 1 μm, Figure 12 shows the gas temperature drops below the particle temperature very close to the substrate. Using the Loth and Crowe expressions yields the same temperature change for particles along the centerline. The incompressible drag coefficient does not account the impact of compressibility of the flow, therefore it results in a higher particle temperature upstream of the shock wave for smaller particles while this temperature difference is trivial for larger particles. In addition, for particles with 1 μm diameter once the particles pass through the shock wave the estimated particle temperature using incompressible drag expression results in lower particle temperature and higher particle velocity as shown in Figure 10 and Figure 12.
In Figure 14, a side view of particle distribution as well as particle velocity magnitude inside and outside the nozzle, and near the substrate for three drag models are presented. As can be seen, ignoring the effects of compressibility and rarefaction on drag coefficient overestimates the particle velocity. However, the particle distribution is not significantly affected. For the range of particle size used in this study, Crowe and Loth expressions provide comparable results. Hereafter in this study, the results of the simulation using Crowe drag coefficient will be presented.

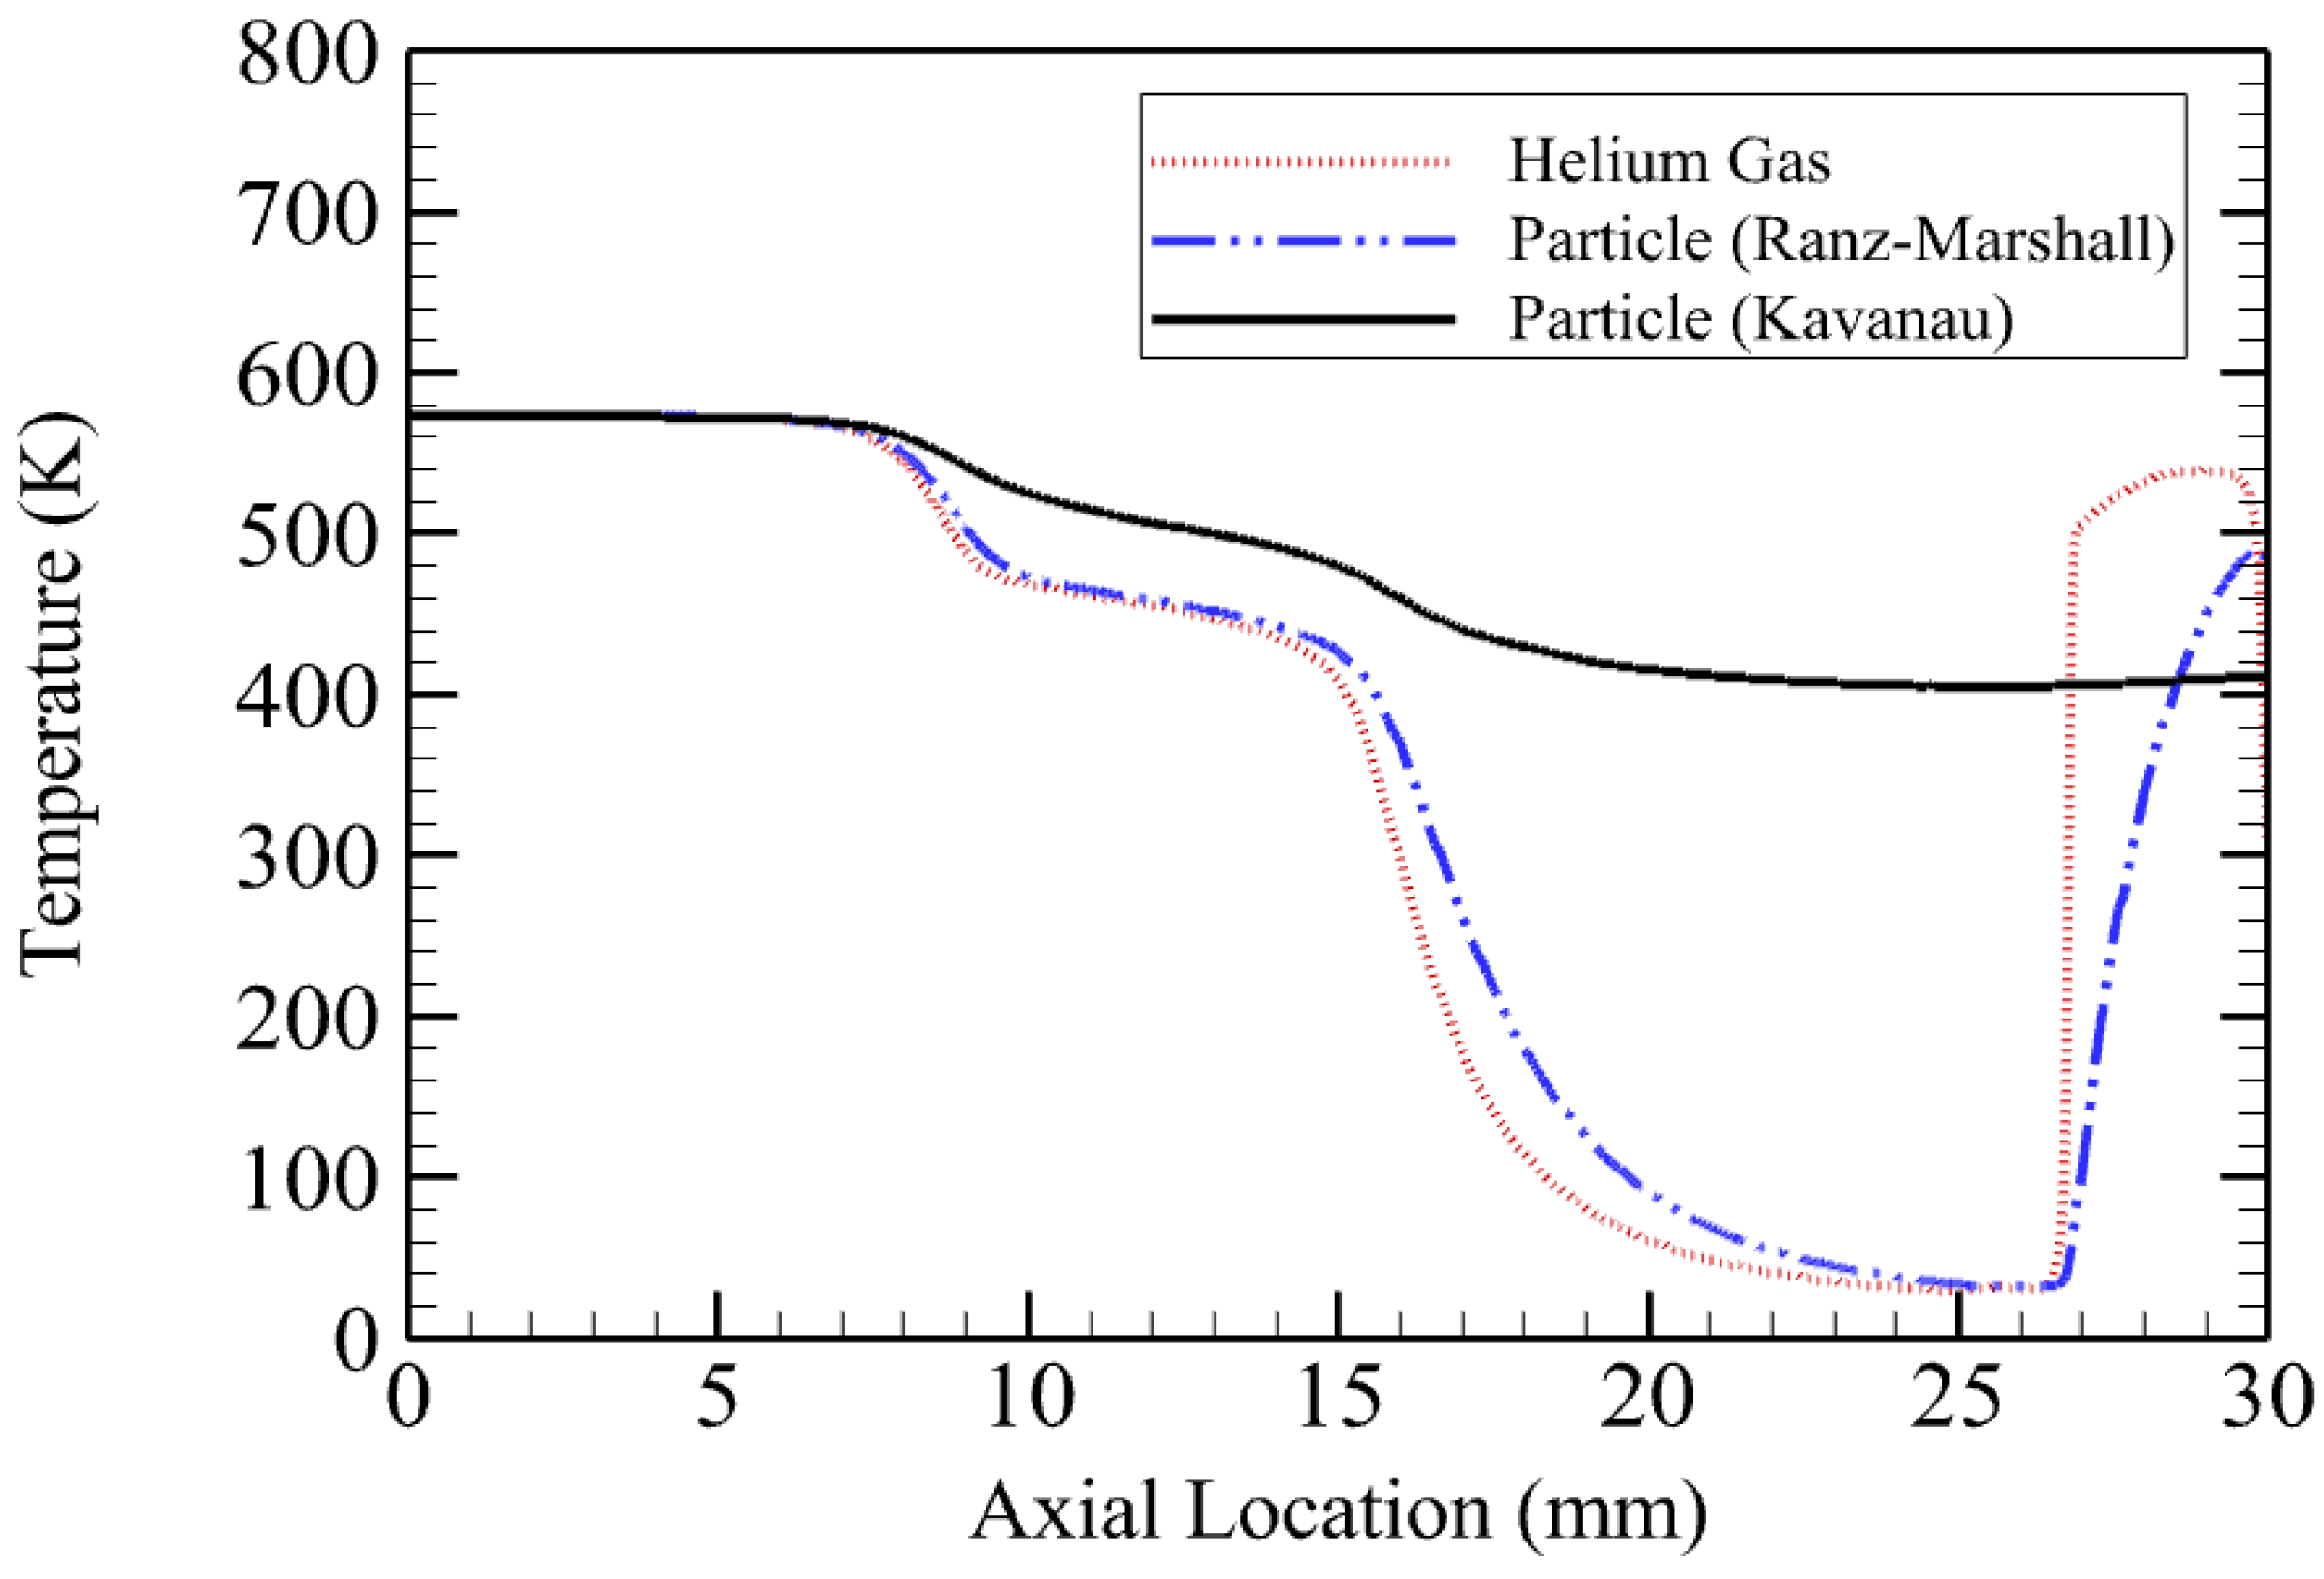
3.5. Effect of Nusselt Number on Particle Temperature

Figure 15 illustrates the temperature change of 1 μm size particle using Ranz–Marshall and Kavanau correlations for Nusselt number. The particle temperature obtained from the Ranz–Marshall correlation is very similar to the gas temperature. It predicts that the particle temperature significantly reduces inside and outside the nozzle, and before the shock wave it reaches around 50 K. After the shock wave, the particle temperature increases considerably. In contrast to Ranz–Marshall correlation, the particle temperature drops gradually while leaving the nozzle exit using Kavanau. As it can be seen, the particle temperature does not fluctuate significantly due to the shock wave. Moreover, the temperature of the particles upon impact is less when the compressibility and rarefaction factors are considered in the model.
As mentioned, increasing the size of the particles to 5 μm reduces the temperature gradient in the particles while passing through the shock wave and in the vicinity of the substrate. Figure 16 presents the trend of temperature change of particles when Ranz–Marshall and Kavanau correlations are used. The trend is similar to what we observed in Figure 15. However, by using the Ranz–Marshall correlation, the particle temperature is reduced to 200 K before the shock wave. It is obvious that the gas temperature rises after the shock, but the gas temperature increase has a low impact on the particle properties when the compressibility and rarefaction factors are included in the heat transfer equation.
Figure 17 and Figure 18 show the particle temperature and velocity variations, respectively, when the particle and gas enter the AD system at a temperature close to the ambient temperature (i.e., T i n j = 300 K) and the correlation of Kavanau is used. As can be seen, the trends in Figure 15, Figure 16 and Figure 17 are similar. However, the particle temperature upon impact in Figure 17 is less than 240 K. In general, Figure 15, Figure 16 and Figure 17 show that the particle temperature upon impact is around 20%–30% (depending on the particle size) less than the inlet temperature. Figure 17 also shows the effect of particle size on particle temperature. As demonstrated, increasing the particle size from 2 to 5 μm results in a higher particle temperature upon impact with the substrate. In general, smaller particles are more sensitive to the temperature gradient upstream the shock wave.
Figure 18 shows the particle velocity change in various particle sizes under a standoff distance of 15 mm. The impact velocity decreases slightly as particle size increases. Small particles accelerate more in the nozzle section than the large particles. For larger size particle, the velocity is more stable, and the rate of deceleration is less than the small particle. Figure 19 demonstrates the effect of inlet temperature on particle velocity for 5 μm particles. By preheating the carrier gas from 300 to 573 K, the impact velocity increases from 324 m/s to 355 m/s. Therefore, increasing the inlet temperature causes the particle velocity upon impact to increase.
Since it is not easy to accurately measure the velocity and temperature of particles under vacuum conditions, the experimental data are very limited, especially for particle temperature through the deposition chamber. However, in the work of Ma et al. [19], the temperature and velocity of copper particles in the AD process were numerically predicted. In their study, the incompressible drag coefficient (see Equation (2) in the present work) and the Ranz–Marshall correlation for Nusselt number (see Equation (13) in the present study) were used. In other words, the effects of compressibility and rarefaction were ignored. They found that the particle temperature reaches as low as 25–50 K before the shock wave. For a 2 μm particle, the temperature upon impact was about 160 K. In addition, for a 1 μm particle, both the maximum and the impact velocity were around 830 m/s. These findings are very similar to the results we reported here when the incompressible drag coefficient and the Ranz–Marshall correlation for Nusselt number were employed (for instance, see Figure 15. However, Lee et al. [38] and Saunders et al. [61] discussed that when the inlet temperature is 300 K, the impact velocity of copper particles in the AD process should be around 300–420 m/s, depending on the particle size. As shown above, when the effects of compressibility and rarefaction are considered, the particle velocity falls in the mentioned range (see Figure 18). Moreover, it should be noted that changing the particle temperature from 300 K to 50 K and then to 160 K in a short distance (~20 mm) with such a high velocity does not seem reasonable and physical. We showed in this paper that by considering the effects of compressibility and rarefaction on the particle dynamics and heat transfer, the particle temperature gradually decreases. As demonstrated, the particle temperature upon impact is only 20% less than the injection temperature and there are no fluctuations in the particle temperature. Furthermore, in the work of Ma et al. [19], the stated values of particle impact velocity and temperature were simply used as inputs to simulate the impact behavior of a copper particle using finite element analysis. This point clarifies that to improve the results of finite element simulations and to understand the coating buildup mechanisms in the AD process, the first step is to estimate the impact velocity and temperature of the particles correctly. In the present work, we showed that to achieve this goal, considering the influence of compressibility and rarefaction on both particle dynamics and heat transfer in the AD process is necessary.

4. Conclusions

In this study, a two-way coupled Eulerian–Lagrangian approach was used to simulate the gas flow as well as the particle in-flight behavior in the aerosol deposition (AD) process. The aim was to understand the effects of compressibility and rarefaction on the particle temperature and velocity in this process. The realizable k-ε turbulence model was used to model the gas flow field. The Mach disk location and width at different pressure ratios were numerically obtained and compared with the experimental data in the literature for validating the model and the assumptions. Different drag coefficients and Nusselt number correlations were implemented into a CFD code to analyze the effects of Reynolds ( R e ), Mach ( M ) and Knudsen ( K n ) numbers (which determine the compressibility and rarefaction effects) on the particle behavior. The spherical/incompressible drag coefficient correlation which is only a function of R e number as well as drag coefficient correlations developed by Loth [33] and Crowe [47] which consider the effects of R e , M and K n numbers were examined. For the particle heat transfer coefficient, two Nusselt number correlations, the Ranz–Marshall correlation which is a function of the R e and Prandtl ( P r ) numbers as well as the Nusselt number correlation of Kavanau [56] which takes into account the effects of R e , M , P r and K n numbers, are considered. It is found that the compressibility and rarefaction significantly affect the predictions of particle temperature and velocity. Ignoring these terms causes the particle velocity to be overestimated. In addition, the particle temperature is a strong function of M and K n numbers. Including the effects of these numbers results in a gradual decrease in particle temperature in the domain. Without these terms, the particle temperature reduces and increases significantly before and after the bow shock, respectively. Generally speaking, it was found that the particle temperature upon impact is 20%–30% less than the injection temperature and the particle impact velocity is between 300–500 m/s depending on the particle size. For validating the numerical results, the particle temperature and velocity trends were compared with the numerical and experimental data in the literature as well. In addition, it was shown that as the particle size reduces the effects of compressibility and rarefaction become more important. Moreover, it was found that increasing the particle size and/or the inlet temperature cause the particle temperature upon impact to increase. Furthermore, increasing the inlet temperature and/or decreasing the particle size result in an increase in the particle impact velocity.

Author Contributions

Conceptualization, M.J. and S.M.; Investigation, B.F.; Methodology, B.F., M.J. and S.M.; Software, B.F.; Supervision, S.M.; Writing—original draft, B.F.; Writing—review and editing, M.J. and S.M. All authors have read and agreed to the published version of the manuscript.

Funding

This research received no external funding.

Institutional Review Board Statement

Not applicable.

Informed Consent Statement

Not applicable.

Data Availability Statement

Not applicable.

Conflicts of Interest

The authors declare no conflict of interest.

References

  1. Hanft, D.; Exner, J.; Schubert, M.; Stöcker, T.; Fuierer, P.; Moos, R. An Overview of the Aerosol Deposition Method: Process Fundamentals and New Trends in Materials Applications. J. Ceram. Sci. Technol. 2015, 6, 147–182. [Google Scholar] [CrossRef]
  2. Park, H.; Kwon, H.; Lee, C. Inflight Particle Behavior in the Vacuum Kinetic Spray Process. J. Therm. Spray Technol. 2017, 26, 1616–1631. [Google Scholar] [CrossRef]
  3. Erilin, I.S.; Burmistrov, I.N.; Agarkov, D.A.; Agarkova, E.A.; Yalovenko, D.V.; Solovyev, A.A.; Rabotkin, S.V.; Pukha, V.E.; Lyskov, N.V.; Bredikhin, S.I. Aerosol Deposition of Anode Functional Layer for Metal-Supported Solid Oxide Fuel Cells. Mater. Lett. 2022, 306, 130924. [Google Scholar] [CrossRef]
  4. Huang, R.; Fukanuma, H. Future Trends in Cold Spray Techniques. In Future Development of Thermal Spray Coatings; Woodhead Publishing: Sawston, UK, 2015; pp. 143–162. ISBN 978-0-85709-769-9. [Google Scholar]
  5. Smith, M.F. Comparing Cold Spray with Thermal Spray Coating Technologies. In The Cold Spray Materials Deposition Process; Elsevier: Amsterdam, The Netherlands, 2007; pp. 43–61. ISBN 978-1-84569-181-3. [Google Scholar]
  6. Akedo, J. Aerosol Deposition of Ceramic Thick Films at Room Temperature: Densification Mechanism of Ceramic Layers. J. Am. Ceram. Soc. 2006, 89, 1834–1839. [Google Scholar] [CrossRef]
  7. Akedo, J. Room Temperature Impact Consolidation (RTIC) of Fine Ceramic Powder by Aerosol Deposition Method and Applications to Microdevices. J. Therm. Spray Technol. 2008, 17, 181–198. [Google Scholar] [CrossRef]
  8. Akedo, J. The AD Method: An Innovative Coating Technology That Defies Conventional Wisdom, AIST Stories: From AIST to the Innovative World. Natl. Inst. Adv. Ind. Sci. Technol. 2014, 2, 2–7. [Google Scholar]
  9. Vardelle, A.; Moreau, C.; Akedo, J.; Ashrafizadeh, H.; Berndt, C.C.; Berghaus, J.O.; Boulos, M.; Brogan, J.; Bourtsalas, A.C.; Dolatabadi, A.; et al. The 2016 Thermal Spray Roadmap. J. Therm. Spray Technol. 2016, 25, 1376–1440. [Google Scholar] [CrossRef]
  10. Wang, L.-S.; Li, C.-X.; Ma, K.; Zhsng, S.-L.; Yang, G.-J.; Li, C.-J. Microstructure and Electrochemical Properties of LSGM Thin Film Deposited by Vacuum Cold Spray for Solid Oxide Fuel Cells. Electrochem. Soc. 2017, 78, 405–412. [Google Scholar]
  11. Katanoda, H.; Fukuhara, M.; Iino, N. Numerical Simulation on Impact Velocity of Ceramic Particles Propelled by Supersonic Nitrogen Gas Flow in Vacuum Chamber. Mater. Trans. 2007, 48, 1463–1468. [Google Scholar] [CrossRef] [Green Version]
  12. Park, J.-J.; Lee, M.-W.; Yoon, S.S.; Kim, H.-Y.; James, S.C.; Heister, S.D.; Chandra, S.; Yoon, W.-H.; Park, D.-S.; Ryu, J. Supersonic Nozzle Flow Simulations for Particle Coating Applications: Effects of Shockwaves, Nozzle Geometry, Ambient Pressure, and Substrate Location upon Flow Characteristics. J. Therm. Spray Technol. 2011, 20, 514–522. [Google Scholar] [CrossRef]
  13. Park, H.; Kwon, H.; Kim, Y.; Lee, C. Computational Research on Factors Affecting Particle Velocity in a Vacuum Kinetic Spray Process. J. Therm. Spray Technol. 2019, 28, 1945–1958. [Google Scholar] [CrossRef]
  14. Park, Y.; Park, D.-S.; Johnson, S.D.; Yoon, W.-H.; Hahn, B.-D.; Choi, J.-J.; Ryu, J.; Kim, J.-W.; Park, C. Effect of Gas Flow Rates and Nozzle Throat Width on Deposition of α-Alumina Films of Granule Spray in Vacuum. J. Eur. Ceram. Soc. 2017, 37, 2667–2672. [Google Scholar] [CrossRef]
  15. Suzuki, M.; Tsuchiya, T.; Akedo, J. Effect of Starting Powder Morphology on Film Texture for Bismuth Layer-Structured Ferroelectrics Prepared by Aerosol Deposition Method. Jpn. J. Appl. Phys. 2017, 56, 06GH02. [Google Scholar] [CrossRef] [Green Version]
  16. Kim, I.-S.; Ko, P.-J.; Cho, M.-Y.; Lee, Y.-S.; Sohn, H.; Park, C.; Shin, W.H.; Koo, S.-M.; Lee, D.-W.; Oh, J.-M. Fabrication of High-Quality Alumina Coating through Novel, Dual-Particle Aerosol Deposition. Ceram. Int. 2020, 46, 23686–23694. [Google Scholar] [CrossRef]
  17. Moore, B.; Asadi, E.; Lewis, G. Deposition Methods for Microstructured and Nanostructured Coatings on Metallic Bone Implants: A Review. Adv. Mater. Sci. Eng. 2017, 2017, 5812907. [Google Scholar] [CrossRef] [Green Version]
  18. Glosse, P.; Denneler, S.; Stier, O.; Moos, R. Investigation of the Powder Aerosol Deposition Method Using Shadowgraph Imaging. Materials 2021, 14, 2502. [Google Scholar] [CrossRef]
  19. Ma, K.; Li, C.-J.; Li, C.-X. Narrow and Thin Copper Linear Pattern Deposited by Vacuum Cold Spraying and Deposition Behavior Simulation. J. Therm. Spray Technol. 2021, 30, 571–583. [Google Scholar] [CrossRef]
  20. Jodoin, B.; Ajdelsztajn, L.; Sansoucy, E.; Zúñiga, A.; Richer, P. Lavernia Effect of Particle Size, Morphology, and Hardness on Cold Gas Dynamic Sprayed Aluminum Alloy Coatings. Surf. Coat. Technol. 2006, 201, 3422–3429. [Google Scholar] [CrossRef]
  21. Ning, X.-J.; Jang, J.-H.; Kim, H.-J. The Effects of Powder Properties on In-Flight Particle Velocity and Deposition Process during Low Pressure Cold Spray Process. Appl. Surf. Sci. 2007, 253, 7449–7455. [Google Scholar] [CrossRef]
  22. Özdemir, O.Ç.; Conahan, J.M.; Müftü, S. Particle Velocimetry, CFD, and the Role of Particle Sphericity in Cold Spray. Coatings 2020, 10, 1254. [Google Scholar] [CrossRef]
  23. Jami, H.; Jabbarzadeh, A. Effect of Particle Shape on Mechanics of Impact in the Deposition of Titanium Nanoparticles on a Titanium Substrate. Surf. Coat. Technol. 2020, 394, 125880. [Google Scholar] [CrossRef]
  24. Lee, M.W.; Park, J.J.; Kim, D.Y.; Yoon, S.S.; Kim, H.Y.; Kim, D.H.; James, S.C.; Chandra, S.; Coyle, T.; Ryu, J.H.; et al. Optimization of Supersonic Nozzle Flow for Titanium Dioxide Thin-Film Coating by Aerosol Deposition. J. Aerosol Sci. 2011, 42, 771–780. [Google Scholar] [CrossRef]
  25. Naoe, K.; Nishiki, M.; Yumoto, A. Relationship between Impact Velocity of Al2O3 Particles and Deposition Efficiency in Aerosol Deposition Method. J. Therm. Spray Technol. 2013, 22, 1267–1274. [Google Scholar] [CrossRef]
  26. Fukumoto, M.; Wada, H.; Tanabe, K.; Yamada, M.; Yamaguchi, E.; Niwa, A.; Sugimoto, M.; Izawa, M. Effect of Substrate Temperature on Deposition Behavior of Copper Particles on Substrate Surfaces in the Cold Spray Process. J. Therm. Spray Technol. 2007, 16, 643–650. [Google Scholar] [CrossRef]
  27. Shahien, M.; Suzuki, M.; Shinoda, K.; Akedo, J. Ceramic Coatings Deposited from Fine Particles by Different Spraying Processes. J. Therm. Spray Technol. 2020, 29, 2033–2047. [Google Scholar] [CrossRef]
  28. Chun, D.-M.; Choi, J.-O.; Lee, C.S.; Ahn, S.-H. Effect of Stand-off Distance for Cold Gas Spraying of Fine Ceramic Particles (<5 μm) under Low Vacuum and Room Temperature Using Nano-Particle Deposition System (NPDS). Surf. Coat. Technol. 2012, 206, 2125–2132. [Google Scholar] [CrossRef]
  29. Faizan-Ur-Rab, M.; Zahiri, S.H.; Masood, S.H.; Phan, T.D.; Jahedi, M.; Nagarajah, R. Application of a Holistic 3D Model to Estimate State of Cold Spray Titanium Particles. Mater. Des. 2016, 89, 1227–1241. [Google Scholar] [CrossRef]
  30. Zabihi Yeganeh, A.; Jadidi, M.; Moreau, C.; Dolatabadi, A. Numerical Modeling of Aerosol Deposition Process. Surf. Coat. Technol. 2019, 370, 269–287. [Google Scholar] [CrossRef]
  31. Jadidi, M.; Moghtadernejad, S.; Dolatabadi, S. Numerical Modeling of Suspension HVOF Spray. J. Therm. Spray Technol. 2016, 25, 451–464. [Google Scholar] [CrossRef]
  32. Chadha, S.; Jefferson-Loveday, R.; Hussain, T. Modelling Knudsen Number Effects in Suspension High Velocity Oxy Fuel Thermal Spray. Int. J. Heat Mass Transf. 2020, 152, 119454. [Google Scholar] [CrossRef]
  33. Loth, E. Compressibility and Rarefaction Effects on Drag of a Spherical Particle. AIAA J. 2008, 46, 2219–2228. [Google Scholar] [CrossRef]
  34. Daneshian, B.; Gaertner, F.; Assadi, H.; Hoeche, D.; Weber, W.; Klassen, T. Size Effects of Brittle Particles in Aerosol Deposition—Molecular Dynamics Simulation. J. Therm. Spray Technol. 2021, 30, 503–522. [Google Scholar] [CrossRef]
  35. Kwon, H.; Kim, Y.; Park, H.; Lee, C. Impact Behavior for Successful Particle–Particle Bonding in Vacuum Kinetic Spraying. J. Therm. Spray Technol. 2021, 30, 542–557. [Google Scholar] [CrossRef]
  36. Park, H.; Kwon, H.; Kim, J.; Lee, C. Shock Absorption Effect on Particle Fragmentation and Microstructural Features of Vacuum-Kinetic-Sprayed Al2O3 Film on Polycarbonate Substrate. J. Therm. Spray Technol. 2021, 30, 558–570. [Google Scholar] [CrossRef]
  37. Park, H.; Kwon, J.; Lee, I.; Lee, C. Shock-Induced Plasticity and Fragmentation Phenomena during Alumina Deposition in the Vacuum Kinetic Spraying Process. Scr. Mater. 2015, 100, 44–47. [Google Scholar] [CrossRef]
  38. Lee, D.-W.; Cho, M.-Y.; Kim, I.-S.; Kim, Y.-N.; Lee, D.; Koo, S.-M.; Park, C.; Oh, J.-M. Experimental and Numerical Study for Cu Metal Coatings at Room Temperature via Powder Spray Process. Surf. Coat. Technol. 2018, 353, 66–74. [Google Scholar] [CrossRef]
  39. Gilmore, D.L.; Dykhuizen, R.C.; Neiser, R.A.; Roemer, T.J.; Smith, M.F. Particle Velocity and Deposition Efficiency in the Cold Spray Process. J. Therm. Spray Technol. 1999, 8, 576–582. [Google Scholar] [CrossRef]
  40. Mishra, T.P.; Singh, R.; Mücke, R.; Malzbender, J.; Bram, M.; Guillon, O.; Vaßen, R. Influence of Process Parameters on the Aerosol Deposition (AD) of Yttria-Stabilized Zirconia Particles. J. Therm. Spray Technol. 2021, 30, 488–502. [Google Scholar] [CrossRef]
  41. Jadidi, M.; Moghtadernejad, S.; Dolatabadi, A. A Comprehensive Review on Fluid Dynamics and Transport of Suspension/Liquid Droplets and Particles in High-Velocity Oxygen-Fuel (HVOF) Thermal Spray. Coatings 2015, 5, 576–645. [Google Scholar] [CrossRef] [Green Version]
  42. ANSYS Fluent Theory Guide; ANSYS Inc.: Canonsburg, PA, USA, 2013.
  43. Versteeg, H.; Malalasekera, W. An Introduction to Computational Fluid Dynamics: The Finite Volume Method, 2nd ed.; Pearson Education Limited: Edinburgh, UK, 2007. [Google Scholar]
  44. Pope, S. Turbulent Flows; Cambridge University Press: New York, NY, USA, 2000; ISBN 978-0-521-59886-6. [Google Scholar]
  45. Lilley, G.M. Turbulence Modelling for CFD; D.C. Wilcox DCW Industries: La Canada, CA, USA, 1993. [Google Scholar]
  46. Bradshaw, P. An Introduction to Turbulence and Its Measurement; Elsevier Science & Technology: Amsterdam, The Netherlands, 1971. [Google Scholar]
  47. Crowe, C.T. Drag Coefficient of Particles in a Rocket Nozzle. AIAA J. 1967, 5, 1021–1022. [Google Scholar] [CrossRef]
  48. O’Rourke, P.J. Collective Drop Effects on Vaporizing Liquid Sprays. Ph.D. Thesis, Princeton University, Princeton, NJ, USA, 1981. [Google Scholar]
  49. Morsi, S.A.; Alexander, A.J. An Investigation of Particle Trajectories in Two-Phase Flow Systems. J. Fluid Mech. 1972, 55, 193–208. [Google Scholar] [CrossRef]
  50. Crowe, C.T.; Babcock, W.R.; Willoughby, P.G. Drag Coefficient for Particles in Rarefied, Low Mach–Number Flows. Proc. Int. Symp. Two-Phase Syst. 1972, 6, 419–431. [Google Scholar] [CrossRef]
  51. Hermsen, R.W. Review of Particle Drag Models. In Proceedings of the JANAF Performance Standartization Subcommittee 12th Meeting Minutes, Chemical Propulsion Information Agency, Columbia, MD, USA; 1979; p. 113. [Google Scholar]
  52. Clift, R.; Grace, J.R.; Weber, M.E. Bubbles, Drops, and Particles; Academic Press: New York, NY, USA, 1978; ISBN 978-0-486-31774-8. [Google Scholar]
  53. Crowe, C.T.; Schwarzkopf, J.D.; Sommerfeld, M.; Tsuji, Y. Multiphase Flows with Droplets and Particles, 2nd ed.; CRC Press: Boca Raton, FL, USA, 2011. [Google Scholar]
  54. Ranz, W.E.; Marshall, W.R. Evaporation from Drops, Part I. In Chemical Engineering Progress; American Institute of Chemical Engineers: New York, NY, USA, 1952; Volume 48, pp. 141–146. [Google Scholar]
  55. Ranz, W.E.; Marshall, W.R. Evaporation from Drops, Part II. In Chemical Engineering Progress; American Institute of Chemical Engineers: New York, NY, USA, 1952; Volume 48, pp. 173–180. [Google Scholar]
  56. Kavanau, L.L. Heat Transfer from Spheres to a Rarefied Gas in Subsonic Flow. Trans. Am. Soc. Mech. Eng. 1955, 77, 617–623. [Google Scholar] [CrossRef]
  57. Crist, S.; Glass, D.R.; Sherman, P.M. Study of the Highly Underexpanded Sonic Jet. AIAA J. 1966, 4, 68–71. [Google Scholar] [CrossRef]
  58. Hatanaka, K.; Saito, T. Influence of Nozzle Geometry on Underexpanded Axisymmetric Free Jet Characteristics. Shock Waves 2012, 22, 427–434. [Google Scholar] [CrossRef]
  59. Addy, A.L. Effects of Axisymmetric Sonic Nozzle Geometry on Mach Disk Characteristics. AIAA J. 1981, 19, 121–122. [Google Scholar] [CrossRef]
  60. Young, W.S. Derivation of the Free-jet Mach-disk Location Using the Entropy-balance Principle. Phys. Fluids 1975, 18, 1421–1425. [Google Scholar] [CrossRef]
  61. Saunders, R.; Johnson, S.D.; Schwer, D.; Patterson, E.A.; Ryou, H.; Gorzkowski, E.P. A Self-Consistent Scheme for Understanding Particle Impact and Adhesion in the Aerosol Deposition Process. J. Therm. Spray Technol. 2021, 30, 523–541. [Google Scholar] [CrossRef]
Figure 1. Schematic diagram of the aerosol deposition system.
Coatings 12 01578 g001
Figure 2. Geometry of the converging-barrel nozzle.
Coatings 12 01578 g002
Figure 3. Boundary conditions.
Coatings 12 01578 g003
Figure 4. Computational domain and mesh for the numerical simulation.
Coatings 12 01578 g004
Figure 5. Computational domain and boundary conditions for the validation case.
Coatings 12 01578 g005
Figure 6. Contour of a highly under-expanded jet and barrel shock.
Coatings 12 01578 g006
Figure 7. Pressure ratios vs. non-dimensional Mach disk diameter [57,59].
Coatings 12 01578 g007
Figure 8. Pressure ratios vs. non-dimensional Mach disk location from nozzle exit [57,60].
Coatings 12 01578 g008
Figure 9. Contour of helium gas velocity (a), Mach number (b), and temperature (c) for a circular converging-barrel nozzle.
Coatings 12 01578 g009
Figure 10. Effect of drag coefficients on centerline particle velocity, d p = 1 μm.
Coatings 12 01578 g010
Figure 11. Effect of drag coefficients on centerline particle velocity, d p = 5 μm.
Coatings 12 01578 g011
Figure 12. Effect of drag coefficients on centerline particle temperature, d p = 1 μm.
Coatings 12 01578 g012
Figure 13. Effect of drag coefficients on centerline particle temperature, d p = 5 μm.
Coatings 12 01578 g013
Figure 14. Effect of drag coefficients on particle velocity, d p = 1 μm.
Coatings 12 01578 g014
Figure 15. Effect of Nusselt number correlation on centerline particle temperature, d p = 1 μm.
Coatings 12 01578 g015
Figure 16. Effect of Nusselt number correlation on centerline particle temperature, d p = 5 μm.
Coatings 12 01578 g016
Figure 17. Effect of particle size on centerline particle temperature.
Coatings 12 01578 g017
Figure 18. Effect of particle size on centerline particle velocity, T = 300 K.
Coatings 12 01578 g018
Figure 19. Effect of inlet temperature on particle velocity upon impact, d p = 5 μm.
Coatings 12 01578 g019
Table 1. Main dimensions of the converging-barrel nozzle.
ConfigurationDimension, mm
Inlet   diameter   ( D i )10
Throat   diameter   ( D j )2.25
Convergent   length   ( L c )5
Throat   length   ( L t )6
Total   length   ( L )15
Table 2. Deposition parameters of the AD simulation model.
ParameterValue (Unit)
Deposition chamber pressure1.22 (kPa)
Aerosol chamber pressure360 (kPa)
Helium Gas temperature300 and 573 (K)
Maintained substrate temperature300 (K)
Table 3. The results of mesh independence study for simulation of a free jet.
RunNo. of NodesVmax, m/sMachmaxDm, mmLm, mm
a. Coarse Mesh396,6501053.08.6313.9625.6
b. Fine Mesh505,4261052.98.5613.6925.7
c. Ultrafine Mesh719,3621052.88.4913.6325.4
Publisher’s Note: MDPI stays neutral with regard to jurisdictional claims in published maps and institutional affiliations.

