Article

Establishment and Analysis of the Relationship Model between Macro-Texture and Skid Resistance Performance of Asphalt Pavement

1
School of Civil and Transportation Engineering, Beijing University of Civil Engineering and Architecture, Beijing 100044, China
2
Collaborative Innovation Center of Energy Conservation & Emission Reduction and Sustainable Urban-Rural Development in Beijing, Beijing 100044, China
3
China Civil Engineering Construction Corporation, Beijing 100038, China
4
China Highway Engineering Consulting Corporation Highway Maintenance and Test Technology Co., Ltd., Beijing 100089, China
5
School of Humanities, Beijing University of Civil Engineering and Architecture, Beijing 100044, China
*
Author to whom correspondence should be addressed.
Coatings 2022, 12(10), 1464; https://doi.org/10.3390/coatings12101464
Submission received: 15 August 2022 / Revised: 19 September 2022 / Accepted: 29 September 2022 / Published: 4 October 2022

Abstract

:
Pavement surface texture evaluation is mainly analyzed based on elevation data in previous research, and attention also need to be paid to wavelength information. Furthermore, a well-established relationship model between surface texture and skid resistance for real road sections still needs further investigation to help provide useful information on appropriate maintenance time considering skid resistance attenuation. In this research, the macro-texture of asphalt pavement was evaluated from different aspects, including elevation, wavelength information, and geometry, and the relationship models between the macro-texture and skid resistance (at both low and high speeds) were established and compared using the multiple linear regression (MLR) and back propagation (BP) neural network to recommend a suitable one. In order to achieve this, this study monitored anti-skidding performance and the macro-texture of six road sections for 18 months. Firstly, the Dynamic Friction Coefficient (DFC) test and core drilling were conducted on site at three different service times. Additionally, a laboratory accelerated loading test was carried out on specimens prepared by similar material composition to one of the road sections, and the British Pendulum Number (BPN) was tested after different passes of loading. Secondly, 3D laser scanning was carried out on core samples from road sections and laboratory specimens after different passes of loading. The correlation degree between macro-texture indexes and anti-skidding performance was analyzed with the grey correlation entropy analysis method. Finally, the relationship models between the anti-skidding performance at high and low speeds and macro-texture were established based on the MLR and BP neural network. The results indicate that the macro-texture indexes calculated based on elevation data to characterize vertical irregularities have a good correlation with the skid resistance despite the different service times and pavement types. Compared with the BP neural network model, the MLR model has low correlation and noticeable error. The relationship model between F60 (DFC at the speed of 60 km/h) and macro-texture could be well established by the BP neural network. In addition, the relationship between F20, BPN, and pavement surface macro-texture is poor, making it impossible to establish a model with good correlation. Generally, it is recommended to use the BP neural network to establish the relationship model between macro-texture and skid resistance.

1. Introduction

Previous studies [1,2,3] have shown that pavements generally have good anti-skidding performance at the early stage after construction, yet with the increase of service time, the skid resistance performance demonstrates varying degrees of decline, even to the extent of failing to meet the requirements of safe driving. Surface texture is a vital factor affecting pavement skid resistance [4,5]. To be more specific, it is generally believed that the anti-skidding performance of vehicles at low speeds is mainly determined by pavement micro-texture, whereas its counterpart at high speeds tends to be significantly influenced by pavement macro-texture [6,7,8]. Therefore, pavement surface texture could be used to effectively represent pavement anti-skidding performance [9]. In addition, the anti-skidding performance is mainly derived from energy dissipation produced by the cutting effect of surface fluctuations on the tires, which could be expressed by pavement surface macro-texture [10]. Field tests show a rapid decrease of the pavement skid resistance performance within the first two years after construction, before the decline grows stable. It should also be noted that there exists a minor increase before the rapid decrease due to asphalt wear, which can be difficult to observe. An effective relationship model between the pavement macro-texture and skid resistance performance cannot be well established due to many influencing factors of the anti-skidding performance, long service time, and lack of a suitable simulation method of driving conditions, etc. Therefore, it is necessary to carry out a long-term tracking of actual road sections to observe anti-skidding performance and surface macro-texture. In particular, high-precision test methods should be employed to accurately characterize the pavement macro-texture and to establish the relationship model between the pavement macro-texture and anti-skidding performance by various reasonable means. Then, a more accurate pavement anti-skidding performance model based on surface texture could be built, which could provide highway authorities with useful decision-making information on appropriate maintenance time with the help of high-precision texture measurement devices.
In recent years, scholars around the globe have investigated the attenuation law of pavement anti-skidding performance. In terms of laboratory simulation by accelerated loading devices, some scholars initially used the Wheel Tracking Tester to simulate the effect of vehicle loads on pavement. However, the obtained wheel track size appears to be too small to meet test requirements of skid resistance. Presently, most laboratory simulation devices are accelerated loading equipment or self-developed accelerated abrasion machines, which boast the advantages of higher efficiency and the ability to impose loads that are more consistent with actual loads [11,12,13], whereas skid resistance attenuation in the laboratory is not consistent with that on road sections, which is far from the needs of pavement maintenance. With regards to anti-skidding attenuation, some have proposed prediction models, such as the asymptotic model, exponential model, logarithmic model, and Penn State model, and verified their effectiveness by testing the Dynamic Friction Coefficient (DFC), British Pendulum Number (BPN), or texture depth [14,15]. In this case, the measured skid resistance may differ from that predicted by the models when the environmental change or maintenance of the actual pavement appears. It is more convenient and flexible in practical use to establish a prediction model from the surface texture that can be measured when necessary.
In terms of the relationship between the macro-texture and skid resistance performance, studies have demonstrated that the correlation between the anti-skidding performance and traditional macro-texture evaluation indexes, such as Mean Profile Depth (MPD) and Mean Texture Depth (MTD), remain to be discussed. However, in recent years, great progress has been made in the following aspects, namely, the data acquisition of the macro- and micro-texture of pavement surface by high-precision and non-contact measurement methods, as well as their application in the investigation of the surface texture evolution and pavement anti-skidding performance prediction [16,17,18,19,20]. This contributes to the fast acquisition and precise characterization of surface texture. Much research focuses on the surface evaluation from aspects of elevation data [9,10], and more attention should also be paid to the texture wavelength.
When establishing the relationship model between pavement surface texture and skid resistance, various methods can be used. Correlation analysis has always been employed in previous research [21,22], whereas only the correlation degree can be obtained in this way and quantitative prediction cannot be achieved. Research has also been conducted using the multiple linear regression (MLR) method to develop a model between anti-skidding performance and pavement surface texture [23,
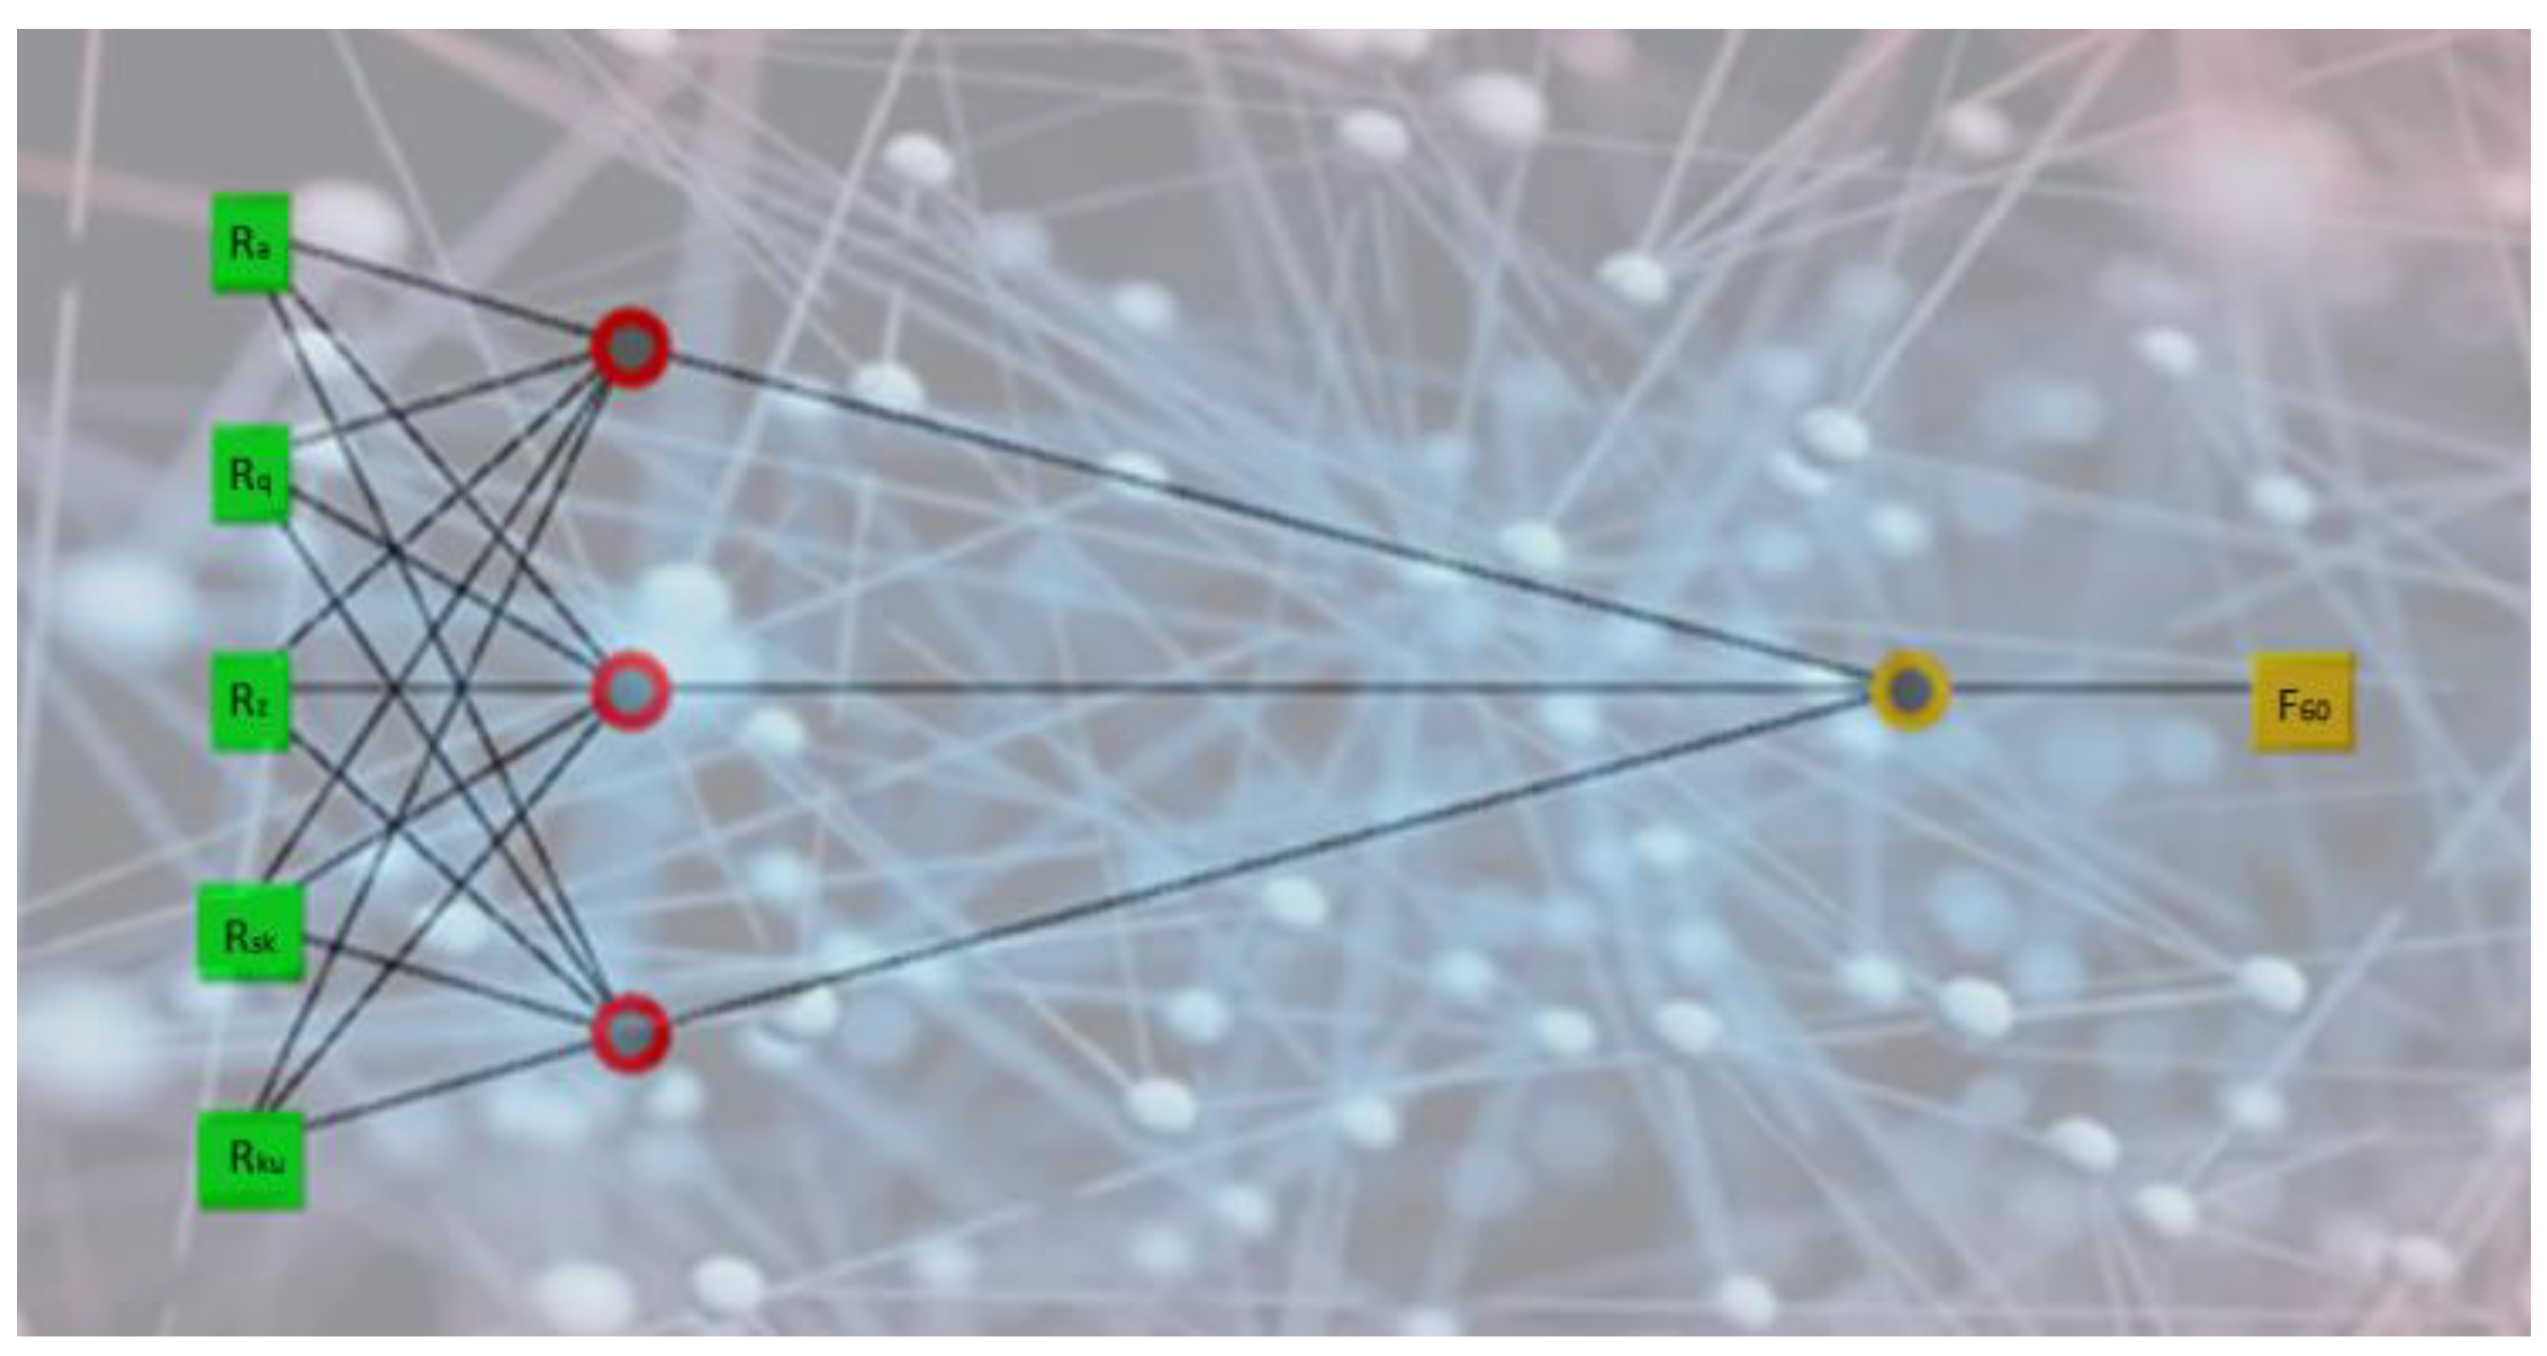
24]. In fact, it is still unknown whether the relationship between them is linear and nonlinear information may be lost when MLR is used. In recent years, nonlinear methods have been employed to explore the relationship model between pavement surface texture and skid resistance. The back propagation (BP) neural network has been demonstrated to exhibit excellent ability in predicting nonlinear and complicated models, so it has been utilized in many aspects in pavement engineering, such as pavement design and performance prediction [8,25,26]. Hence, the BP neural network can be attempted to establish a relationship model between pavement surface texture and skid resistance.
In summary, the current laboratory simulation of vehicle loads on pavement surface mainly depends on the Wheel Tracking Tester, accelerated loading facilities, Wehner/Schulz polishing, self-developed equipment, etc. Yet, it has to be noted that laboratory simulation by accelerated abrasion/polish devices could only simulate the number of axle load actions by equivalent conversion. However, environmental factors, such as temperature, humidity, rain, and snow, cannot be completely recreated, making it difficult to establish a prediction model that fits the actual roads. Nowadays, the commonly used relationship model between skid resistance and macro-texture mainly relies on the traditional texture depth evaluation indexes, MTD and MPD, and other statistical indexes, and further research is still pending on in-depth characterization of pavement surface texture, especially from the view of wavelength, and the model establishment of its relationship with pavement anti-skidding performance.
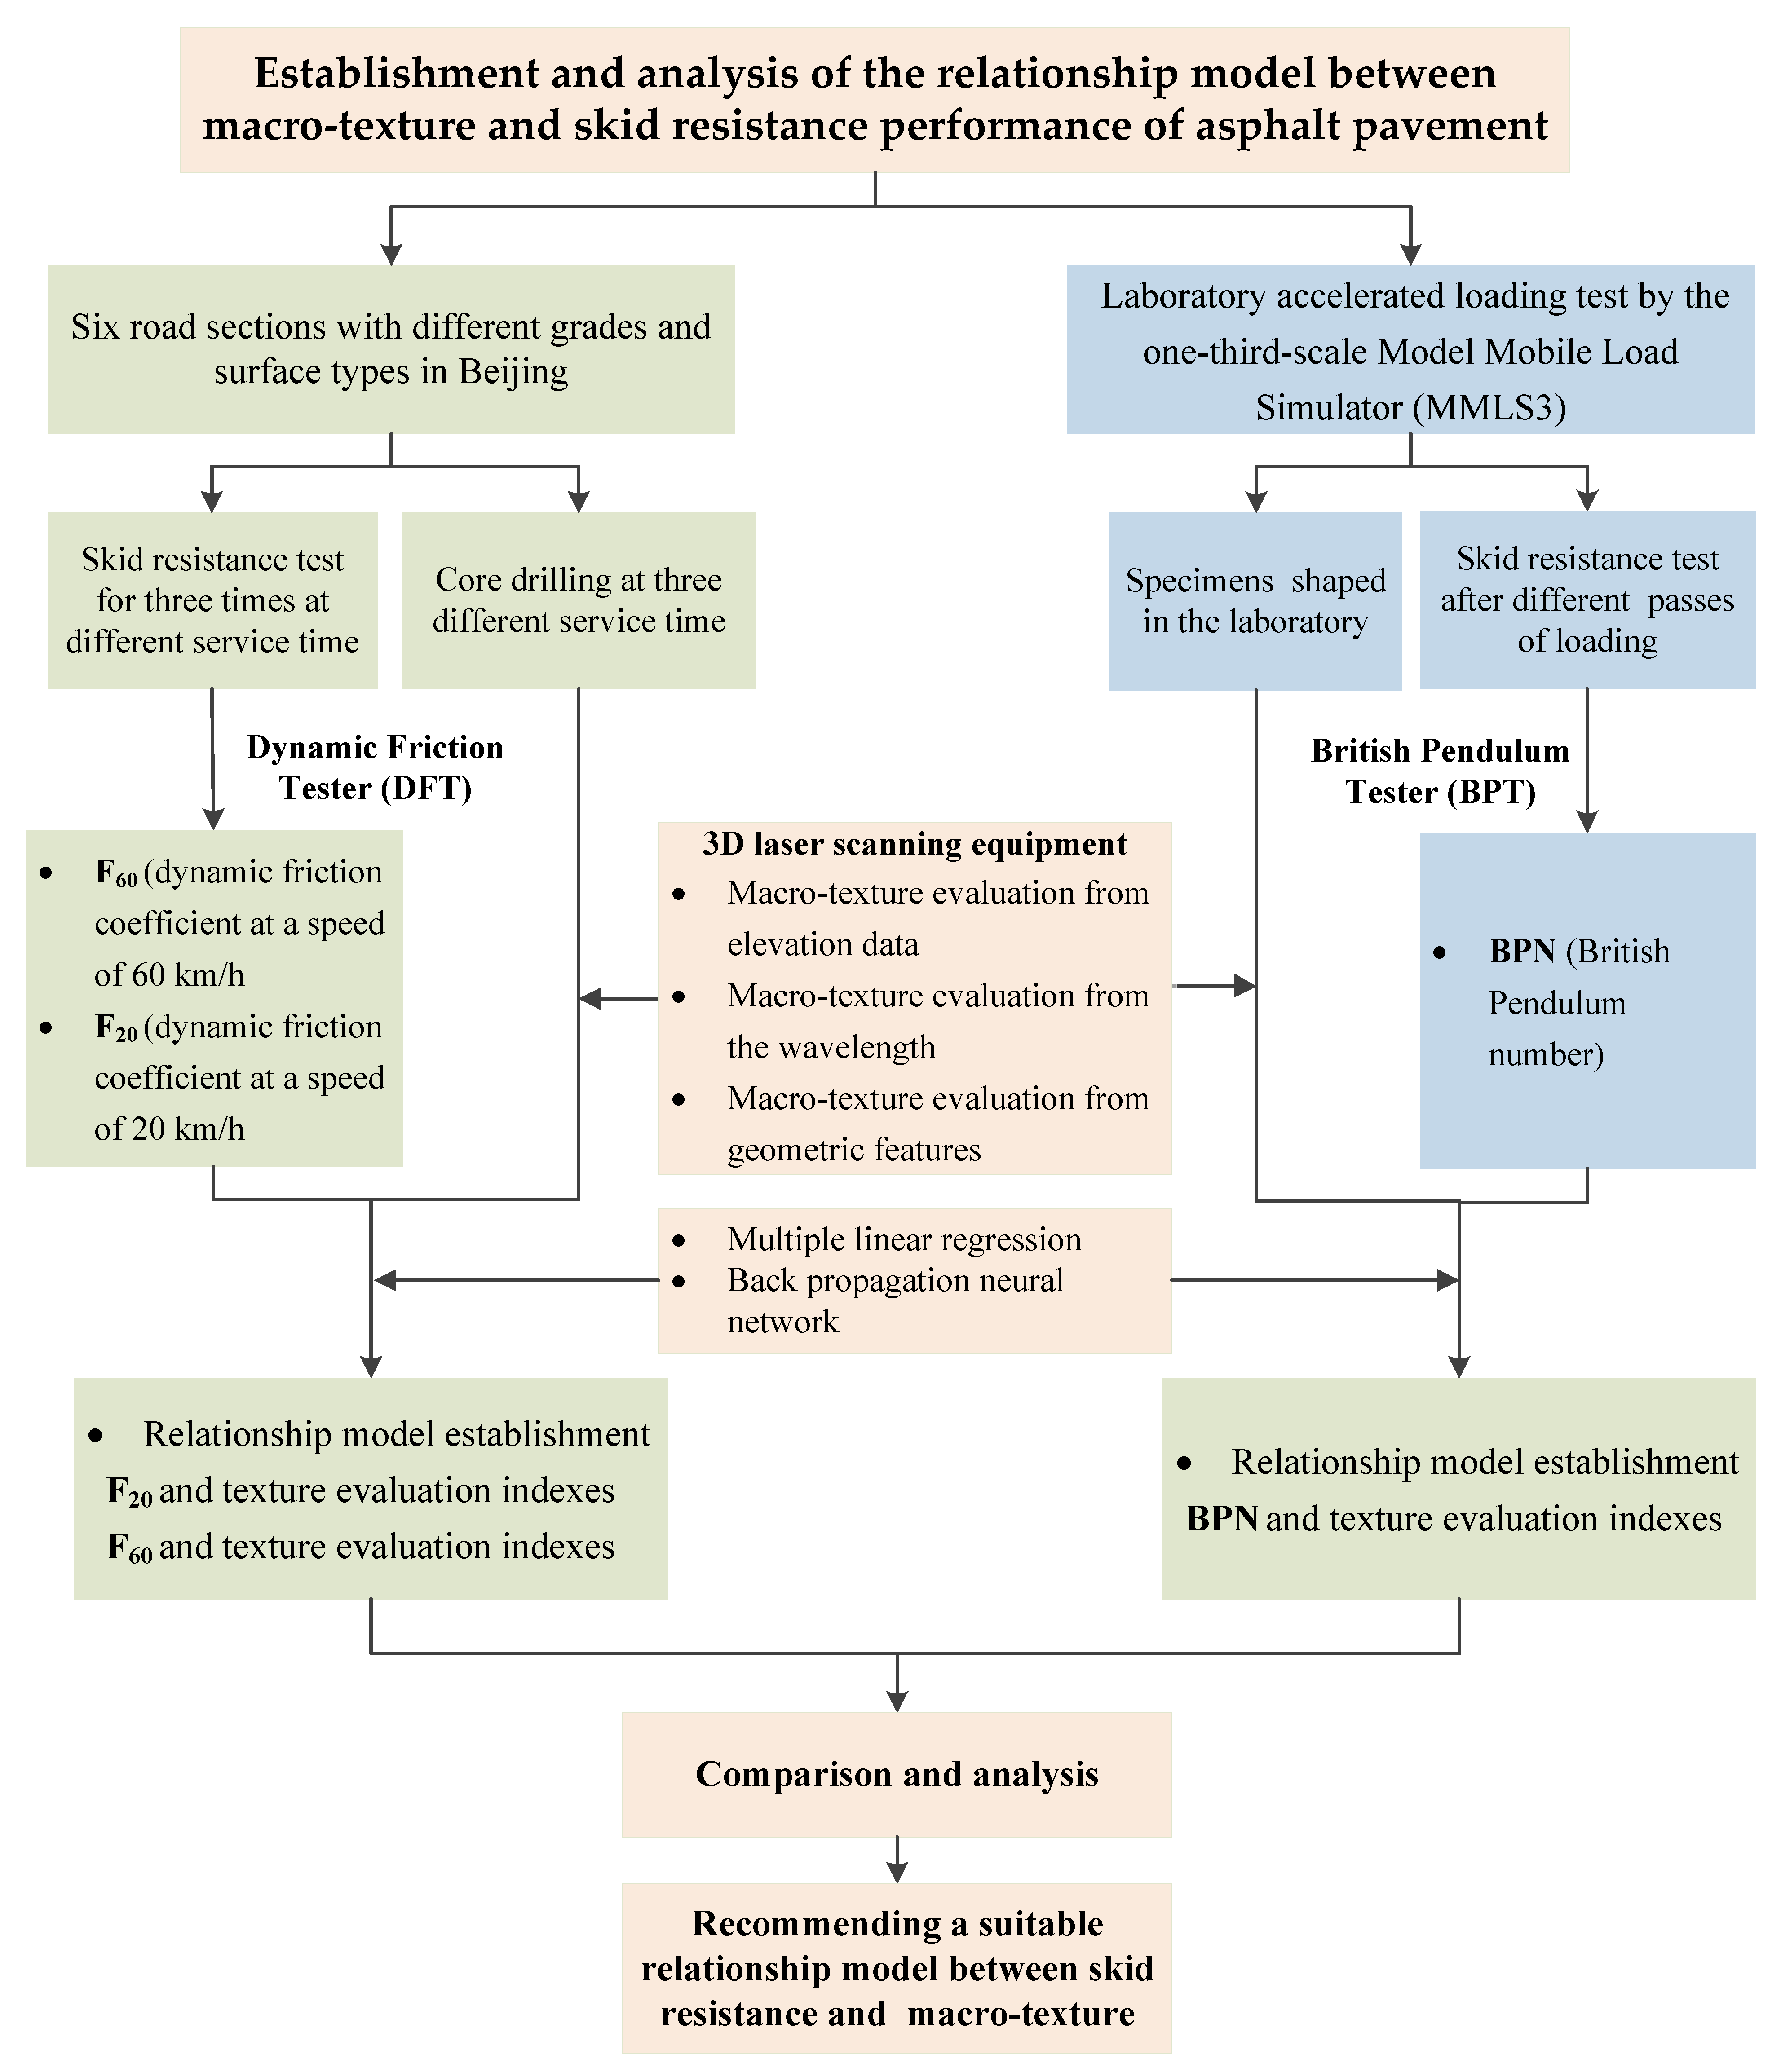
This research aims to evaluate the surface macro-texture from aspects of both elevation data and wavelength based on 3D laser scanning technology, and to establish the relationship model between surface texture and skid resistance measured on real road sections and in the laboratory using MLR and BP neural network methods, and, finally, to recommend a suitable relationship model. Based on this, a more accurate pavement anti-skidding performance prediction model based on surface texture can be built, which could provide highway authorities and engineers with useful decision-making information on appropriate maintenance time by measuring surface texture when necessary.
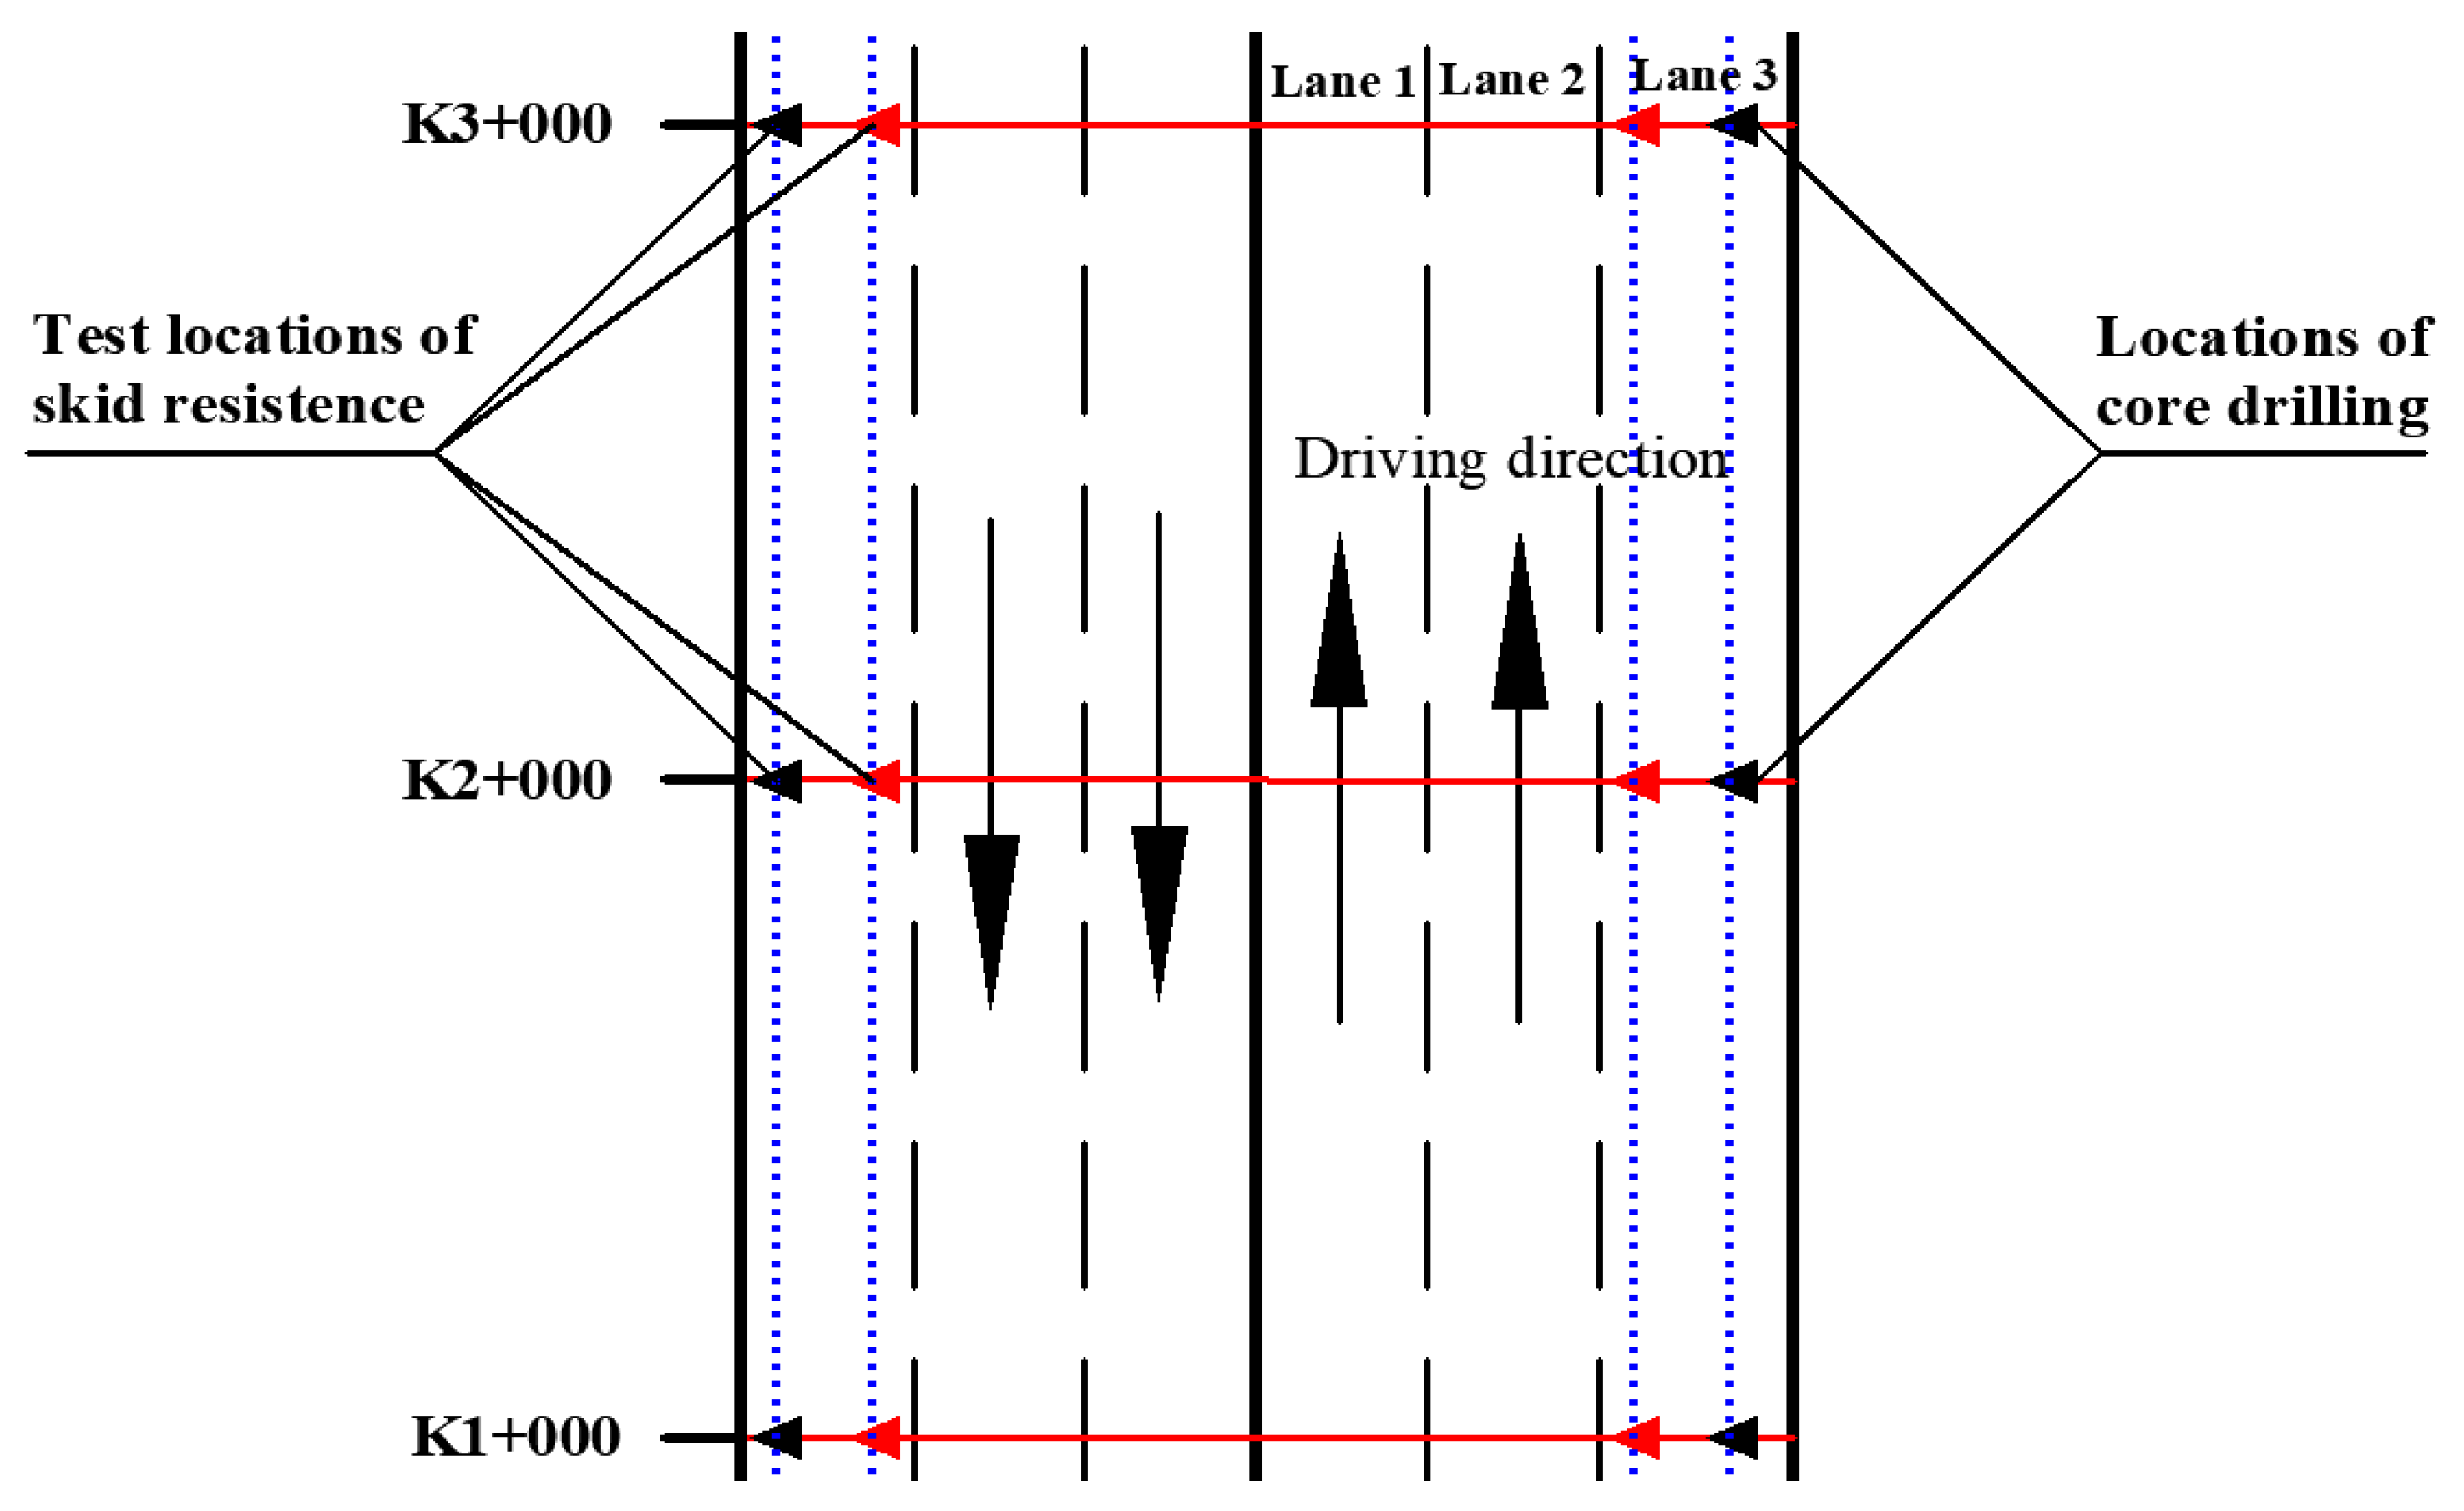
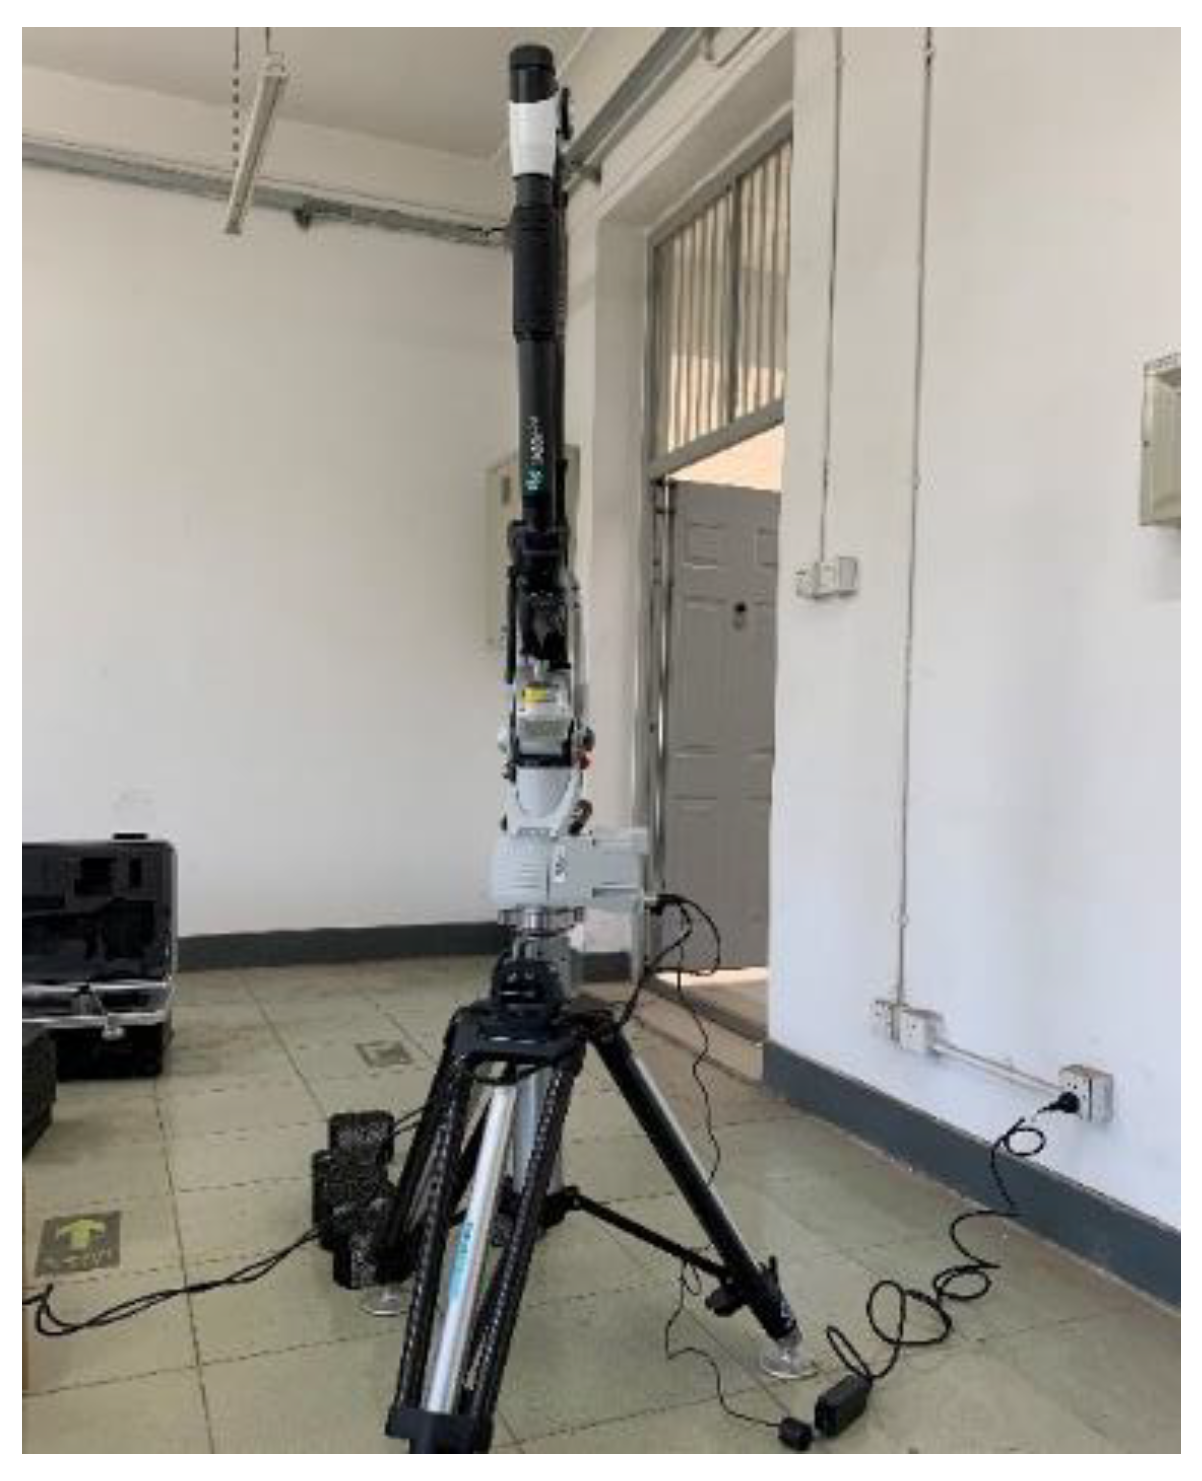
In order to achieve the objective of this research, firstly, six road sections with different grades and surface types in Beijing were selected to conduct performance tracking for one and a half years. Their skid resistance was tested by DFT at three different service times, and core sampling was conducted on site after each DFT test. Secondly, in order to compare the relationship model between macro-texture and anti-skidding performance measured on site and in the laboratory, the Yangyan Road section was selected to carry out the laboratory accelerated loading test by the one-third-scale Model Mobile Load Simulator (MMLS3). Thirdly, 3D laser texture scanning technology was utilized to obtain surface information of the drilled core samples and laboratory specimens, and to rebuild the digital model, which was employed to calculate the macro-texture indexes from different aspects by importing into MATLAB software. Finally, the correlation degree of each macro-texture index and skid resistance performance was calculated, based on which, the relationship model between macro-texture and skid resistance at both low speeds and high speeds was established with two different methods, namely, multiple linear regression (MLR) and back propagation (BP) neural networks. The feasibility of evaluating pavement skid resistance performance from the aspect of macro-texture were explored. The flowchart of this research is shown in Figure 1.

2. Experimental Equipment and Test Methodology

2.1. Basic Information of Road Sections and Determination of Measurement Locations

Six actual roads with different surface types and grades in Beijing were chosen to carry out long-term tracking of skid resistance and macro-texture. Their construction was finished in the same period around October 2019. The detailed test procedure and precautions are illustrated in Section 2.2 and Section 2.3. The basic information of the six road sections tested, which was obtained from their construction company, are listed in Table 1, and their mixture gradations are shown in Table 2.
Each test location of skid resistance was a relatively flat and uniform surface without rutting, potholes, and bumps. According to the specification, JTG 3450-2019 [27], test locations for the DFT test were randomly selected, and they were distributed on the two wheel tracks of the outside traffic lanes in two driving directions. As shown in Figure 2, Lane 1 is a passing lane, whereas Lane 2 and Lane 3 are traffic lanes, and Lane 3 is the outside traffic lane where skid resistance was measured on site on the two wheel tracks (indicated by blue lines). This indicated that skid resistance was tested at test locations marked by red and black triangles. Core samples were taken on the outside wheel track (the track a little farther from the road centerline) of the outside traffic lane, as marked by the black triangle. During the one and a half years of performance tracking, the DFT test and core sampling were conducted for three times, with a total of at least 26 test locations each time.

2.2. Macro-Texture Test

2.2.1. 3D Laser Scanning Equipment

The 3D laser texture scanning equipment used, as shown in Figure 3, was a Hexagon Metrology Rommer six-axis articulated measuring arm and a Hexagon Probe Laser 20.8 (HP-L-20.8) high-efficiency external laser scanning head. The specific parameters of the scanning equipment are a scanning distance of 180 ± 40 mm, a minimum pitch of 0.013 mm, a shape error of 9 μm, and a dispersion value of 36 μm. The HP-L-20.8 can offer excellent performance even on complex surfaces. It is fully integrated with the six-axis articulated measuring arm, with no requirement for additional cables due to a feature pack. The laser power can be adapted automatically in real time according to the surface color or reflectivity.

2.2.2. Test Procedure of the 3D Laser Scanning

The 3D laser scanning device was utilized to acquire the texture data of core samples from the six roads and laboratory specimens after different passes of loading in the accelerated loading test conducted with the one-third-scale Model Mobile Load Simulator (MMLS3). When conducting texture scanning, the disordered point mode and a sample spacing of 0.05 mm were selected. In order to acquire the 3D topography of the pavement surface clearly, especially with regards to deep voids on the pavement surface, each specimen/sample was scanned back and forth from different angles and directions, along three diameters, with an angle of 60° on the surface and two directions spatially, including the normal direction and a 45-degree angle with the normal direction. By doing so, complete point cloud data (over 20 million) of the pavement surface were obtained. After removing point cloud data from the edge part of the specimens to eliminate its effects on subsequent texture index calculation, a 3D model of pavement texture was reconstructed using Geomatic Wrap software. To fully reflect the surface topography of samples while avoiding extreme calculation, 15 surface profiles were taken from each sample at an equal space of 4 mm, and the profiles were converted into continuous points in order to acquire the coordinates of each point. In the meantime, inclination and offset suppression were carried out on the obtained profiles by subtracting a least-squares fit from the profile to calculate texture indexes. A schematic diagram of profile error elimination is shown in Figure 4a,c.

2.3. Anti-Skidding Performance Test

The anti-skidding performance test is classified into on-site tests on roads and laboratory tests on the specimens. DFT was employed to test the Dynamic Friction Coefficient (DFC) of road sections at different vehicle speeds on site considering its features of being highly automated and having stable test results. During the DFT test process, the DFC at different speeds could be recorded at an interval of 1 km/h within a range of 0–80 km/h. The DFC at the speed of 20 km/h, which is named F20, is commonly used to represent skid resistance at low speeds [28], and the DFC at the speed of 60 km/h, named F60, is generally regarded as the representative value of anti-skidding performance at high speeds [29]. In this research, the measurement locations for the DFT test were randomly selected on the two wheel tracks of the outside traffic lanes in two driving directions on each actual road, according to Appendix A in the Chinese specification [27]. They were marked in order to ensure that the same tests could be carried out as close as possible to the initial measurement locations during the long-term performance observation. Core samples were drilled at the same locations where DFT was conducted, which were utilized to obtain surface texture information by the laser scanning equipment. The core samples obtained were cylinders with a dimension of 101.6 mm in diameter and a height of the thickness of the surface layer. Both the skid resistance measurement and core drilling were carried out three times, corresponding to three different service times, in November 2019, September 2020, and December 2020, respectively.
Laboratory accelerated loading was conducted using MMLS3. The specimens employed were fabricated with the same materials as that of the Yangyan Road section to ensure the test results in the laboratory and on the real road would be comparable after the same passes of loading. Specimens were fabricated using the gyratory compaction, which is more consistent with the compaction effects on real roads. Since the limited wear width of laboratory specimens in the accelerated loading test is insufficient for the DFT test, considering the sliding length during the standard British Pendulum Number (BPN) test, BPN was utilized to represent the skid resistance of laboratory gyratory specimens with a diameter of 150 mm in the MMLS3 test [7]. Since BPN could only reflect anti-skidding performance at the speed of 10 km/h [29], it is generally regarded as an evaluation index of anti-skidding performance at low speeds. Therefore, the two evaluation indexes of skid resistance at low speeds, F20 obtained on site and BPN tested in the MMLS3 test, were compared.

2.4. Grey Correlation Analysis

Being a vital part of Grey System Theory, the grey correlation analysis method has been widely used thanks to its low requirement for sample size and straightforward calculation [30]. Based on the traditional grey correlation analysis method, the grey correlation entropy analysis method improves defects in the grey correlation tendency governed by local points and information loss caused by the mean normalization. It can also determine the influence of each factor sequence on the overall correlation. Generally, the important factors corresponding to correlation degree are higher than 70%, relatively important factors lie between 50% and 70%, and the rest can be considered as unimportant factors [31].

2.5. BP Neural Network Model

Waikato Environment for Knowledge Analysis (WEKA) is a commonly used data mining and machine learning software, which has a complete set of learning algorithms, data processing tools, and evaluation methods [32]. The BP neural network is a multi-layer feed-forward neural network. Its transfer function of neurons is a nonlinear function, in which the information flows from the input layer to the output layer. Its learning process is mainly divided into two stages. The first stage is to input known samples and calculate the output results of neurons in the next layer through the network architecture and the weight and threshold of the last iteration. In the second stage, the weight and threshold are corrected based on the errors obtained by the backward calculation according to the last layer, and a reliable model is completed by repeating the aforementioned two steps until convergence [33]. Using WEKA software, a BP neural network model could be established and verified easily. The BP neural network boasts the ability to conduct precise prediction in case of nonlinear problems. Therefore, in order to find a better prediction model, the BP neural network was utilized to establish the relationship model between pavement surface texture and skid resistance, which was compared with that by MLR.

3. Pavement Macro-Texture Indexes

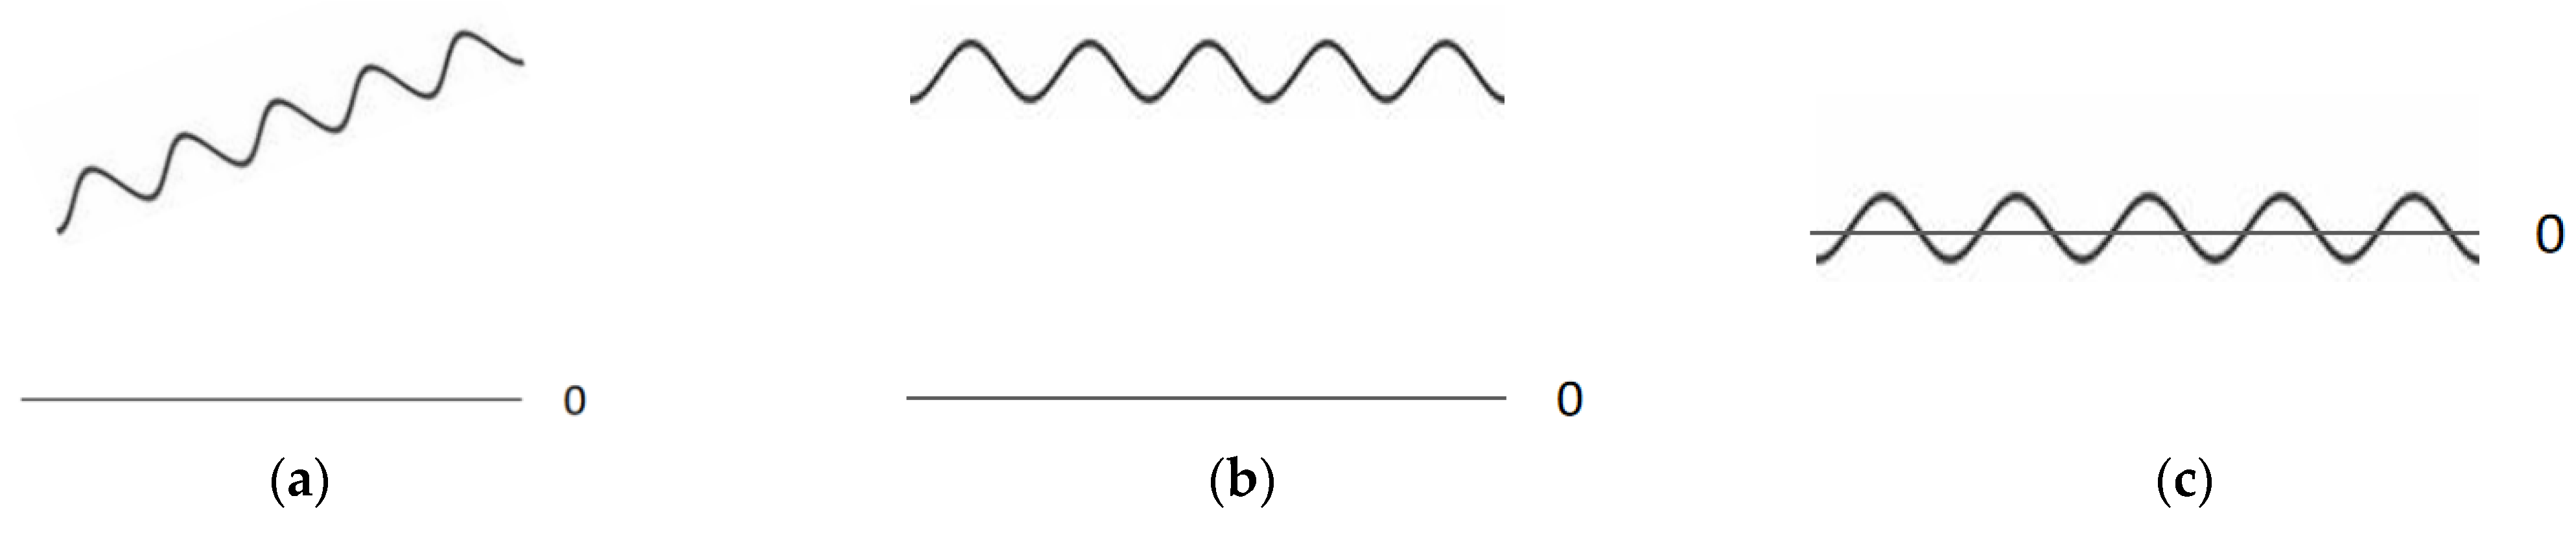
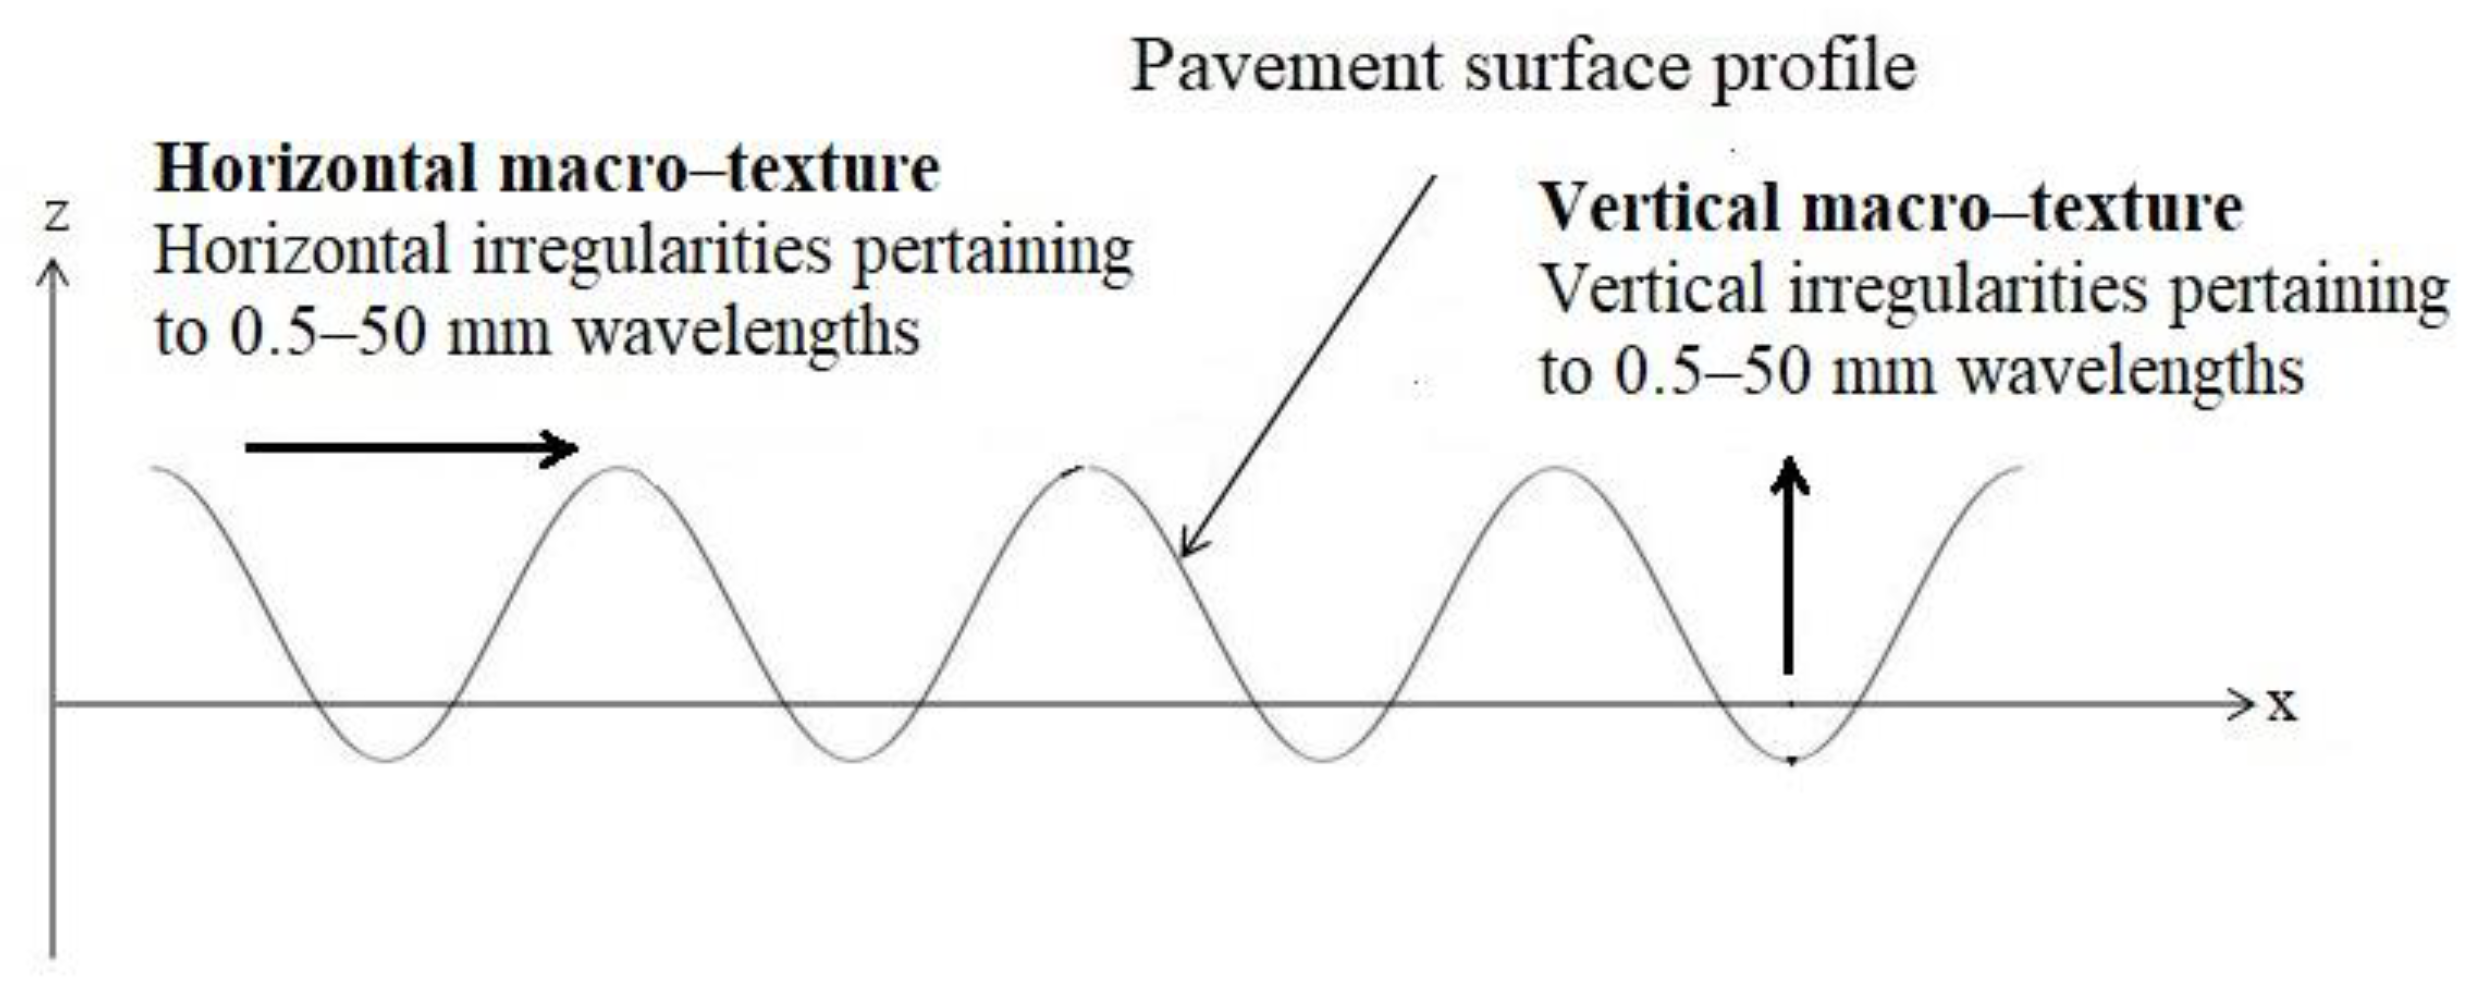
In order to characterize the macro-texture characteristics of the pavement surface accurately, the distribution of macro-texture was described from aspects of the elevation, wavelength, and geometry. The vertical and horizonal macro-texture refers to the vertical and horizontal irregularities, respectively, and pertains to 0.5–5 mm wavelengths. Evaluation indexes calculated based on surface elevation data in the vertical direction to describe vertical irregularities, as shown in Figure 5, were named vertical macro-texture indexes. The evaluation indexes calculated based on wavelength data in the horizontal direction to describe horizontal irregularities, as shown in Figure 5, were named horizontal macro-texture indexes [34]. Vertical and horizontal irregularities and the geometric characteristics of the pavement surface were characterized. The schematic diagram of the vertical and horizontal macro-texture distribution is shown in Figure 5.
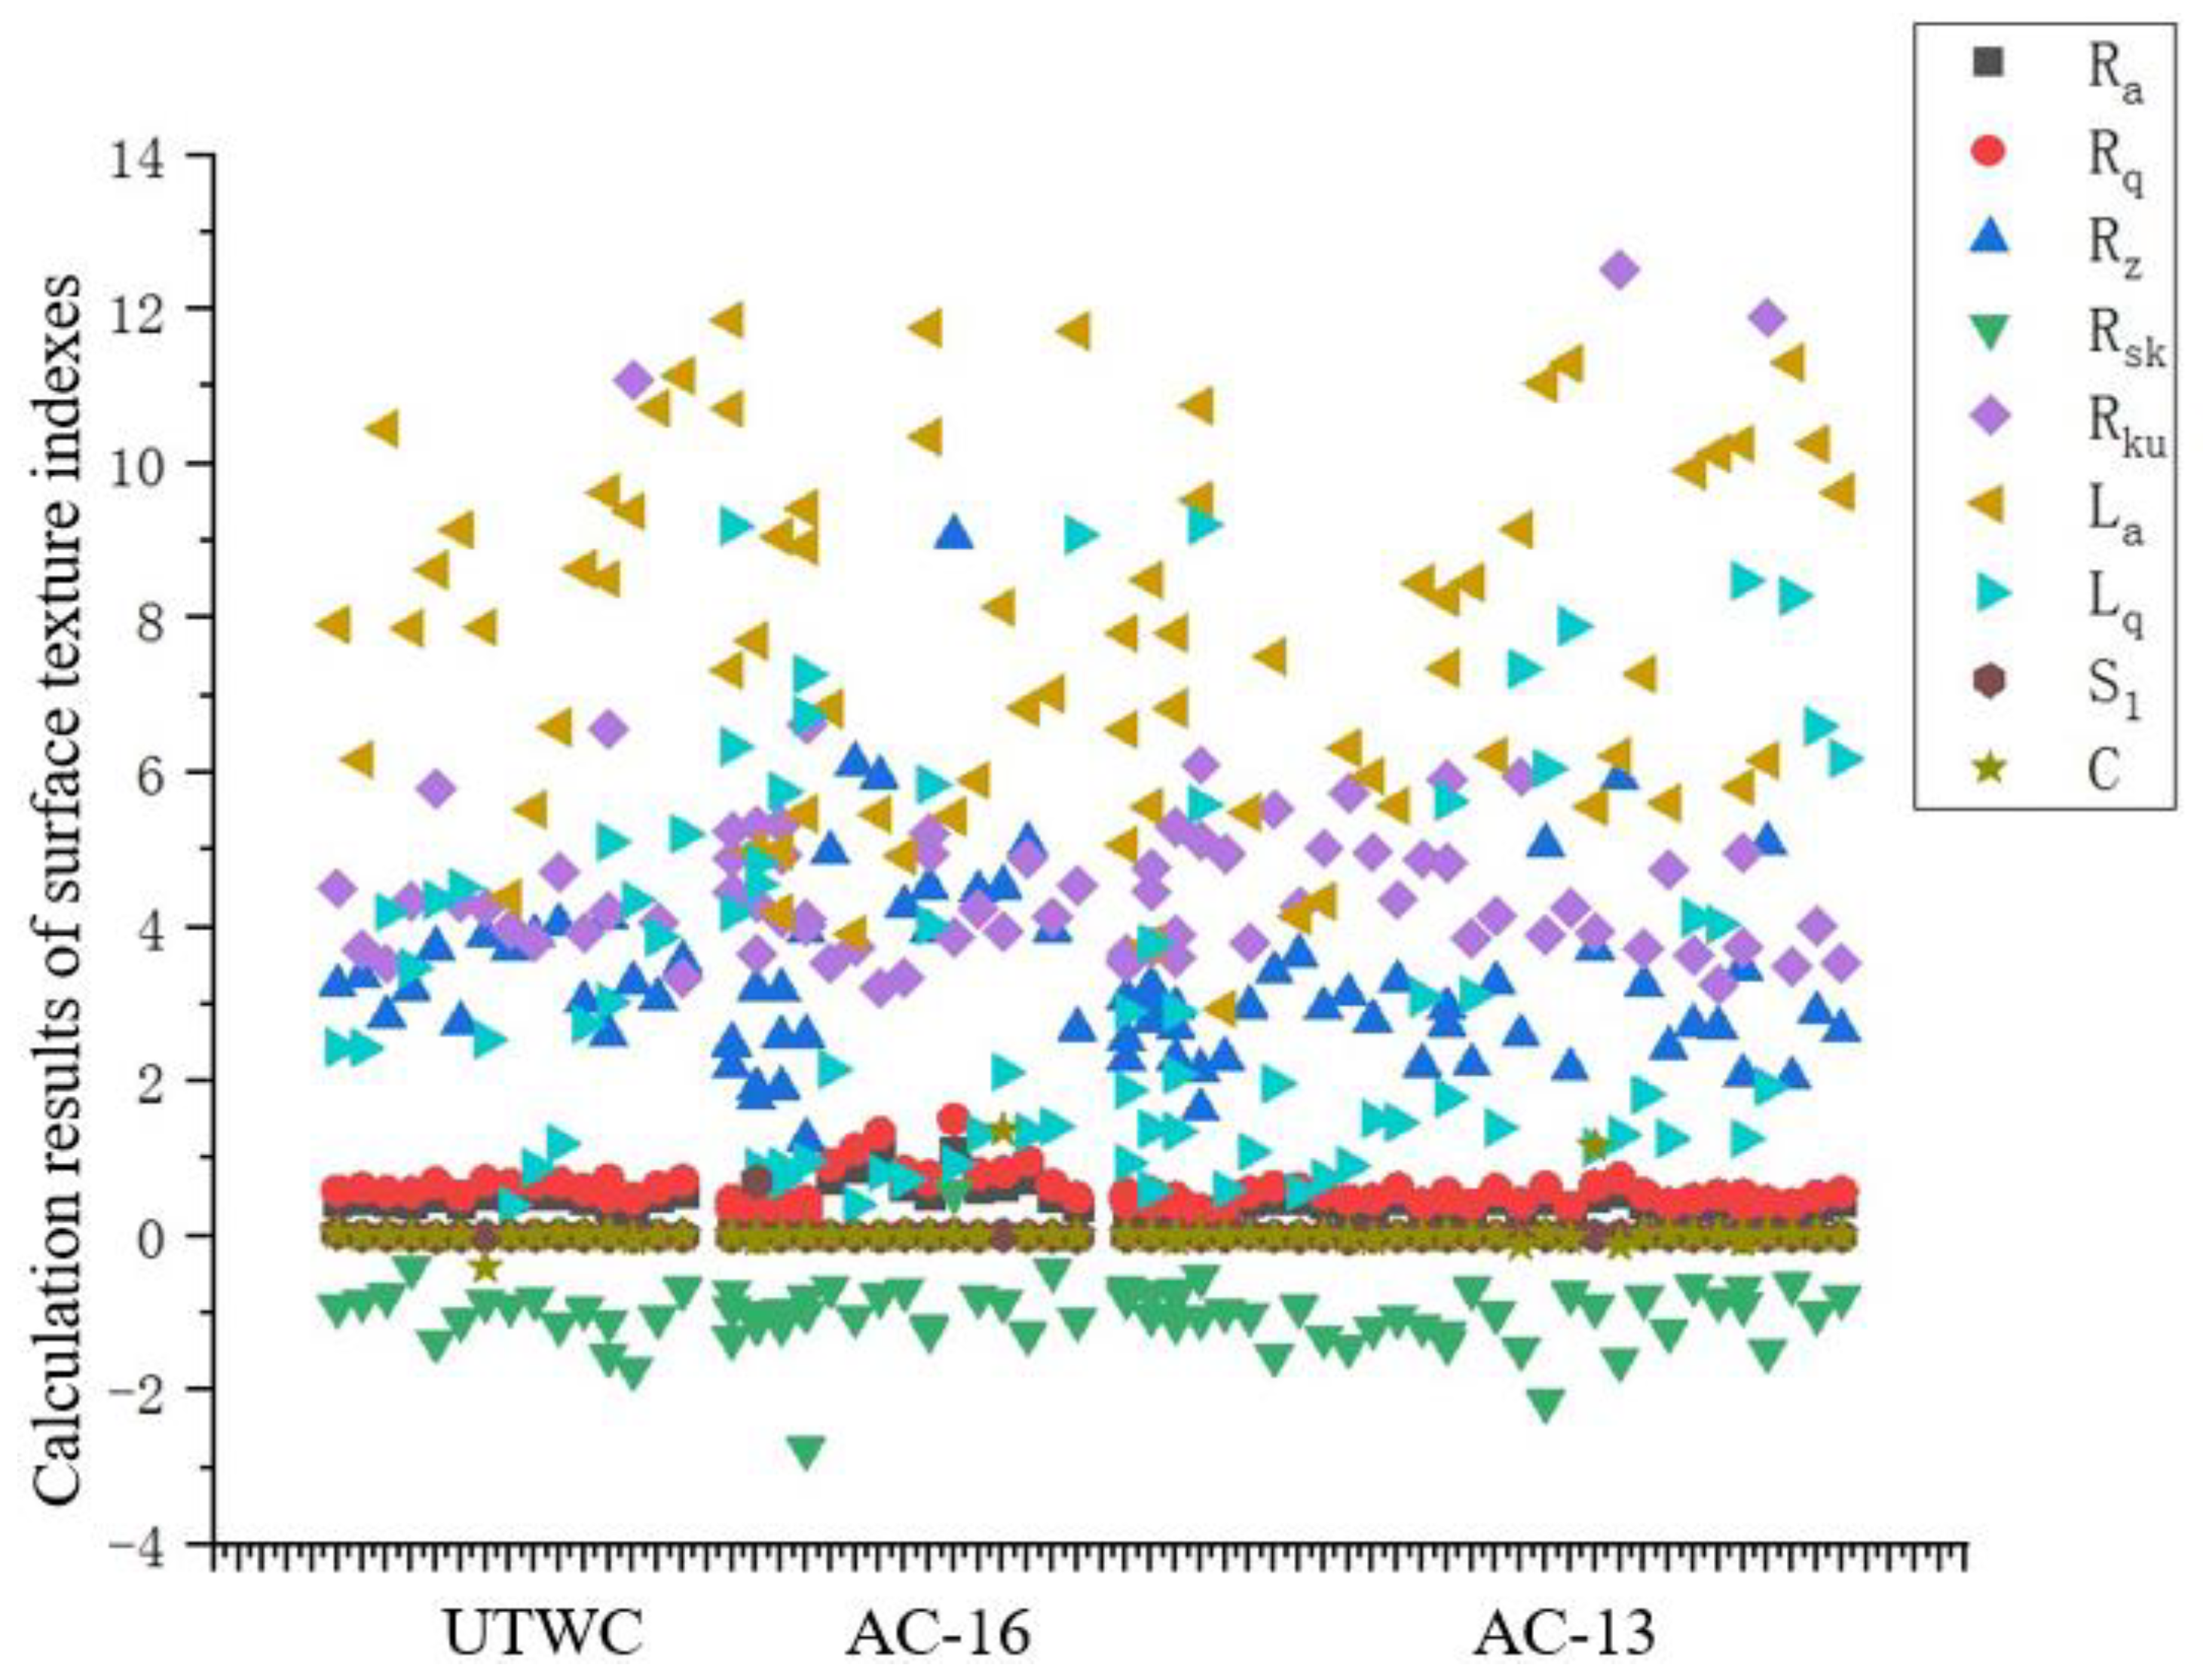
The vertical macro-texture indexes mainly describe the texture distribution of pavement surface along the z axis, i.e., in the amplitude direction, as shown in Figure 5. The indexes utilized in this research include arithmetic mean value (Ra), standard deviation (Rq), range (Rz), skewness (Rsk), and kurtosis (Rku), which could describe the difference degree of texture depth, skew degree, kurtosis degree, and even the texture orientation [35] of pavement surface, and reflect the changes of pavement vertical macro-texture under different conditions. They were calculated according to the equations reported in similar research [36].
As demonstrated in Figure 5, the horizontal macro-texture indexes were used to describe the horizontal distribution and distribution deviation, i.e., in the driving direction, while reflecting the changes of the horizontal macro-texture of actual roads under different conditions. The horizontal macro-texture indexes used include average wavelength, La, and root mean square of wavelength, Lq, of the profile. They were calculated according to a published a master dissertation [34].
Geometric features refer to the shape characteristics of a certain object. In this research, geometric indexes, including the average slope, S1, and the average curvature, C, were used to describe the contour shape of the outside edge of pavement surface profiles. They were calculated according to previous research [36]. All the indexes involved are summarized in Table 3.

4. Results and Discussions

4.1. Laboratory Accelerated Loading Test and Determination of Laboratory Test Time

In order to compare the relationship model between pavement macro-texture and skid resistance established by the data obtained from on-site measurement and in the laboratory, the Yangyan Road section was selected as a representative road section for the laboratory accelerated loading test. Firstly, an AC-13 asphalt mixture with the same material composition as Yangyan Road section was designed, and specimens were fabricated using gyratory compaction. Secondly, a laboratory accelerated loading test was conducted with MMLS3 to simulate vehicle loads on the pavement surface. The loading frequency was set as 5200 cycles per hour with a contact pressure of 0.7 MPa. During this process, the number of loading passes was recorded. According to the annual average traffic volume and the accumulated traffic volume data of the Yangyan Road section during the tracking test period, the connection between the number of laboratory loading passes and real vehicle loading was established. Finally, the macro-texture and skid resistance of laboratory specimens were tested after a set number of months since the road construction was completed: 0, 1, and 2 months (corresponding to the on-site test for the first time); 3, 4, 5, 6, 8, and 11 months (corresponding to the on-site test for the second time); and 14 months (corresponding to the on-site test for the third time).

4.2. Selection and Determination of Pavement Macro-Texture Indexes

Up to now, both the skid resistance and pavement macro-texture have been measured three times during the one and a half years of tracking, with a total of 83 groups of data acquired. The calculation results of macro-texture indexes are shown in Figure 6. In order to improve the accuracy of the relationship model and eliminate the influence of redundant indicators on its establishment, the grey correlation entropy analysis method was utilized to select the appropriate macro-texture indexes.

4.2.1. Correlation Degree between Macro-Texture Indexes and Skid Resistance at Different Service Time

When calculating the grey entropy correlation degree, the research targets are regarded as reference sequences, whereas the factors affecting research targets are always regarded as the comparison sequences. Aiming to investigate the changes of the correlation degree between different macro-texture indexes and skid resistance at different pavement service times, F60 was taken as the reference sequence, and the calculated value of each macro-texture index was used as the comparison sequence to calculate the grey entropy correlation degree between each texture index and anti-skidding performance. The calculation results are listed in Table 4.
Table 4 shows that the correlation between vertical macro-texture indexes and the pavement skid resistance performance is the highest, indicating that anti-skidding performance of pavement is significantly affected by vertical macro-texture. This is because anti-skidding performance is mainly derived from the energy dissipation and cutting action produced by the contact between the tire and pavement surface, and the vertical macro-texture indexes can describe the vertical fluctuation and distribution. As for the horizontal macro-texture indicators and geometric indexes of the pavement surface, their correlation with the skid resistance performance appears to be lower than that of the vertical macro-texture.
As shown in Table 4, during different service periods, the correlation degree between each texture index and anti-skidding performance demonstrates little alteration, indicating that the pavement macro-texture could reflect the pavement anti-skidding performance across different service times stably. As a result, pavement macro-texture could be used to evaluate the pavement anti-skidding performance to a great degree.

4.2.2. Correlation Degree between Macro-Texture Indexes and Skid Resistance in Different Mixture Types

In order to investigate the effect of mixture types on the correlation degree between different macro-texture indexes and skid resistance, 83 groups of texture data obtained on the six roads were classified into three types, Ultra-Thin Wear Course (UTWC), AC-13, and AC-16. F60 was considered as a reference sequence, and the calculated value of each macro-texture index was a comparison sequence to calculate the grey entropy correlation degree between each texture index and the anti-skidding performance. The correlation of UTWC data is not considered here, since its amount is too small. The calculation results of correlation degree are shown in Table 5.
Table 5 shows that the correlation between the vertical macro-texture indexes of pavement surface and the anti-skidding performance is the highest for different mixture types, which is consistent with the above conclusions. Pavement vertical macro-texture affects the pavement anti-skidding performance significantly. The correlation degree between vertical macro-texture indexes and pavement skid resistance is high and stable across different service times and mixture types with different NMAS, indicating that pavement vertical macro-texture indexes could be used to evaluate pavement skid resistance. The correlation degree between skid resistance and horizontal texture indexes and geometric indexes remains lower than that of vertical macro-texture.
Consistent law is obtained based on the analysis from aspects of service time and mixture types; that is, the correlation between the vertical macro-texture indexes of pavement surface and the skid resistance is the highest, followed by the horizontal macro-texture indexes, and the correlation with the geometric indexes is the smallest, which is consistent with previous literature [37]. Therefore, in the subsequent analysis, the pavement vertical macro-texture indexes are regarded as the main influencing indexes, and attempts should be made to establish a relationship model between them and the pavement skid resistance. The horizontal macro-texture indexes and geometric characteristics would not be considered in the following model establishment.

4.3. Establishment of the Relationship Model between Macro-Texture and Skid Resistance

In order to establish the relationship model between the macro-texture of pavement surface and skid resistance accurately, the machine learning technology of an artificial neural network was utilized for data fitting. It should be noted that F60 and BPN represent the test results of skid resistance at high speeds and low speeds, respectively, which lack reliable conversion methods. F20 and BPN both represent skid resistance at low speeds and have a certain correlation [28]. Therefore, the relationship model between macro-texture and high-speed skid resistance (i.e., F60), as well as the relationship model between macro-texture and low-speed resistance (i.e., F20 and BPN), were established separately. For each model, both the multiple linear regression (MLR) method and nonlinear multi-layer perceptron method software were utilized by WEKA for data fitting.

4.3.1. Establishment of Multiple Linear Regression Model

An MLR model can be used to explore the linear relationship between one dependent variable and multiple independent variables, and to evaluate the influence degree of each independent variable on the dependent variable. The MLR model between F60 and pavement vertical macro-texture is shown in Equation (1):
F 60 = 0.1117 R q + 0.0427 R z 0.1068 R sk 0.076 R k u + 0.225
The correlation coefficient (R2) of Equation (1) is 0.6108, the mean absolute error is 0.452, and the Root Mean Squared Error (RMSE) is 0.0586. It can be seen that the skid resistance is related to Rku, Rq, Rsk, and Rz in the multiple linear relationship model.
In order to survey the relationship between surface macro-texture and skid resistance at low speeds, the regression result was obtained by taking F20 as the dependent variable and each macro-texture index as the independent variable, as shown in Equation (2):
F 20 = 0.5881 R a + 0.4651 R q + 0.0421 R z + 0.0614 R sk + 0.3639
The R2 of Equation (2) is 0.4464, the mean absolute error is 0.69, and the RMSE is 0.0823. It can be seen that the skid resistance of actual roads at low speeds characterized by F20 remains to be affected by the pavement vertical macro-texture. However, the R2 of the relationship model at low speeds appears lower, and the error is higher than at high speeds, which also proves that the pavement macro-texture mainly affects the anti-skidding performance at high speeds to some degree [38,39].
With BPN measured in the laboratory accelerated loading test with MMLS3 as the dependent variable and each vertical macro-texture index as the independent variable, the regression result is shown in Equation (3):
BPN = 27.6308 R q + 12.2667 R z + 114.0228 R s k + 52.7297
The R2 of Equation (3) is 0.404, the mean absolute error is 0.521, and the RMSE is 0.164. It can be seen that the skid resistance at low speeds characterized by BPN is still greatly affected by the vertical macro-texture. Compared with Equation (2), the independent variable indexes in Equation (3) are roughly the same, except that Ra is excluded and the R2 is close, indicating that there exists a certain correlation between BPN and F20. However, the R2 are both lower than Equation (1), indicating that the skid resistance at low speeds is less affected by the macro-texture of pavement surface, and the correlation between macro-texture and anti-skidding performance at low speeds is low. This is also demonstrated by the scatterplots of the measured and predicted skid resistance based on Ts (1)~(3), as shown in Figure 7. Therefore, it should be considered together with pavement micro-texture when describing the skid resistance at low speeds.
The R2 of all three equations obtained by MLR merely shows a medium level of correlation, presumably due to the fact that MLR could only reflect the linear relationship between variables, whereas the relationship between the pavement macro-texture and the anti-skidding performance may be nonlinear. In the subsequent analysis, the nonlinear method would be explored to investigate the relationship between macro-texture indexes and the anti-skidding performance by the BP neural network.

4.3.2. Establishment of BP Neural Network Model

The BP neural network is composed of a large number of neural elements and mutual connections, and its general architecture includes the input layer, the hidden layer, and the output layer. In order to establish the BP neural network model, the architecture of the BP neural network needs to be determined first.
During BP neural network processing, some investigated data are needed to train the network until it satisfies the designated requirements. Therefore, 70% of the data were randomly selected as the training set, whereas the remaining 30% were used as the test set for model verification. The model was established with the vertical macro-texture indexes serving as the input layer, and F60 (F20 or BPN when investigating the anti-skidding performance at low speeds) as the output layer. As for the hidden layer, both the number of hidden layers and the number of hidden nodes affect the model accuracy and learning efficiency. The former is generally determined empirically, whereas there is no scientific and reasonable method for the latter. Given the lack of experience in establishing the relationship between pavement macro-texture and skid resistance using the BP neural network, it is deemed necessary to obtain the appropriate number of hidden layers and hidden nodes through experimental verification. In general, R2 and RMSE were used to represent the correlation between the predicted results and variables. They were also utilized as network training effect criteria to determine the number of hidden layers and the number of hidden nodes in this research. The closer the R2 is to one, the better the correlation between the independent variable and the dependent variable will be, whereas the smaller the RMSE is, the higher the accuracy of the model tends to be. When determining the hidden layer, the F60 was regarded as the output layer. Firstly, the number of hidden nodes was fixed, and the number of hidden layers varied between one and three. The analysis results under each number of hidden layers using the BP neural network are displayed in Table 6.
As can be seen from Table 6, when the number of hidden layers is one, the correlation and accuracy of the relationship model, characterized by the R2 and RMSE, appear to be the highest among the three different hidden layers. Increasing the number of hidden layers not only reduces the accuracy of the relationship model, but also increases the training time. Therefore, the optimal number of hidden layers was determined to be one.
When determining the optimal number of hidden nodes, the number of hidden layers was fixed as one, and the number of hidden nodes varied between two and four, based on experience and data amount. The analysis results under each number of hidden nodes using the BP neural network are shown in Table 7.
It can be seen from Table 7 that a more accurate relationship model could be obtained when the number of hidden nodes is three. At this time, the R2 was the largest and the RMSE was smallest, indicating the best training effect among three different nodes. Thus, the optimal combination of the BP neural network architecture is determined as one hidden layer and three hidden nodes, as illustrated in Figure 8. This shows that vertical macro-texture indexes, including Ra, Rq, Rz, Rsk, and Rku, were reflected by the five nodes in the input layer, and F60 was reflected by the only node in the output layer. The nodes of the network in each layer were fully connected to the nodes in the adjacent layers by the weights. Owing to the characteristics of the feed-forward network, the algorithm processed the information in the input layer forward propagation to the hidden layer, and then to the output. After the output value and the actual value were compared, the error was back-propagated. Additionally, the weights between nodes in the adjacent layers were adjusted. The calculation was ended when the output layer met the designated accuracy requirements. The weight values obtained according to the optimal network architecture are shown in Table 8.
Data in the test set were put into the relationship model to verify the accuracy, and the accuracy of the test set was 0.701. The results showed that 70.6% of the test set data appeared suitable for the relationship model between macro-texture and skid resistance, and that the accuracy of the training set and the test set was close to 70%, indicating the superiority of the relationship model. In this way, more potential and valuable knowledge were discovered behind the pavement surface texture and anti-skidding resistance at high speeds, characterized by F60.
In order to explore the accuracy of the relationship model between macro-texture and skid resistance at low speeds, F20 and BPN were taken as the dependent variable (output layer), respectively, and the macro-texture indexes served as the independent variable (input layer). The weight values calculated using the optimal network architecture, similar to Figure 8 (one hidden layer and three hidden nodes), are displayed in Table 9 for F20 and Table 10 for BPN.
Thirty percent of the F20 data was used as the test set. It was put into the relationship model of F20 to verify the accuracy, which was 0.484. The results showed that 46.2% of the test set data was suitable for the relationship model between macro-texture and F20. The accuracy of the training set and the test set was close to 50%, indicating that the results of the relationship model were average.
Thirty percent of the BPN data, used as the test set, was put into the relationship model of BPN to verify the accuracy, and the accuracy of the test set was 0.597. The results demonstrated that 59.1% of the test set data was suitable for the relationship model between macro-texture and BPN. The accuracy of the training set and the test set was close to 60%, indicating that the results of the relationship model were average.
Judging from the above three models, when the anti-skidding performance at low speeds is regarded as the output node, the accuracy of the nonlinear model is still poor, which is consistent with the conclusion drawn by the MLR model, indicating that the pavement macro-texture mainly affects the skid resistance at high speeds.

4.4. Comparison and Analysis of the Relationship Model between Macro-Texture and Skid Resistance Characterized by Different Indicators

Based on the above analysis, it can be concluded that regardless of what kind of indicator is used to evaluate the skid resistance, which is taken as the dependent variable, the MLR model exhibits lower accuracy and higher error than the BP neural network model. The use of a nonlinear BP neural network could better establish the relationship between the pavement surface and anti-skidding performance at high speeds, with an accuracy rate of about 70%, which is significantly improved compared with the MLR model, indicating that the BP neural network model is suitable for the establishment of the relationship model.
Whether established with the MLR method or the BP neural network method, with F60 serving as the dependent variable, the accuracy of the relationship model between macro-texture and skid resistance at high speeds is higher than the accuracy of its counterpart at low speeds, indicating that the macro-texture mainly affects the pavement skid resistance at high speeds. For the relationship model between the surface texture and the skid resistance in the full speed range, comprehensive consideration should be given to both macro-texture and micro-texture.

5. Conclusions

In this research, the skid resistance of six roads was tested by the DFT three times, corresponding to three different service times. Moreover, core sampling was conducted to obtain the surface texture by 3D laser scanning. In the meantime, laboratory accelerated loading tests were conducted. BPN and surface texture were tested on specimens after different passes of loading. Based on the data, the relationship models between macro-texture and skid resistance at both high and low speeds were established using the MLR method and BP neural network method. In view of the test results and analysis, the following conclusions could be drawn.
The correlation between the vertical macro-texture of pavement surface and the skid resistance is higher than that of the horizontal macro-texture and geometric characteristics, indicating that pavement vertical macro-texture holds considerable influence over the pavement skid resistance.
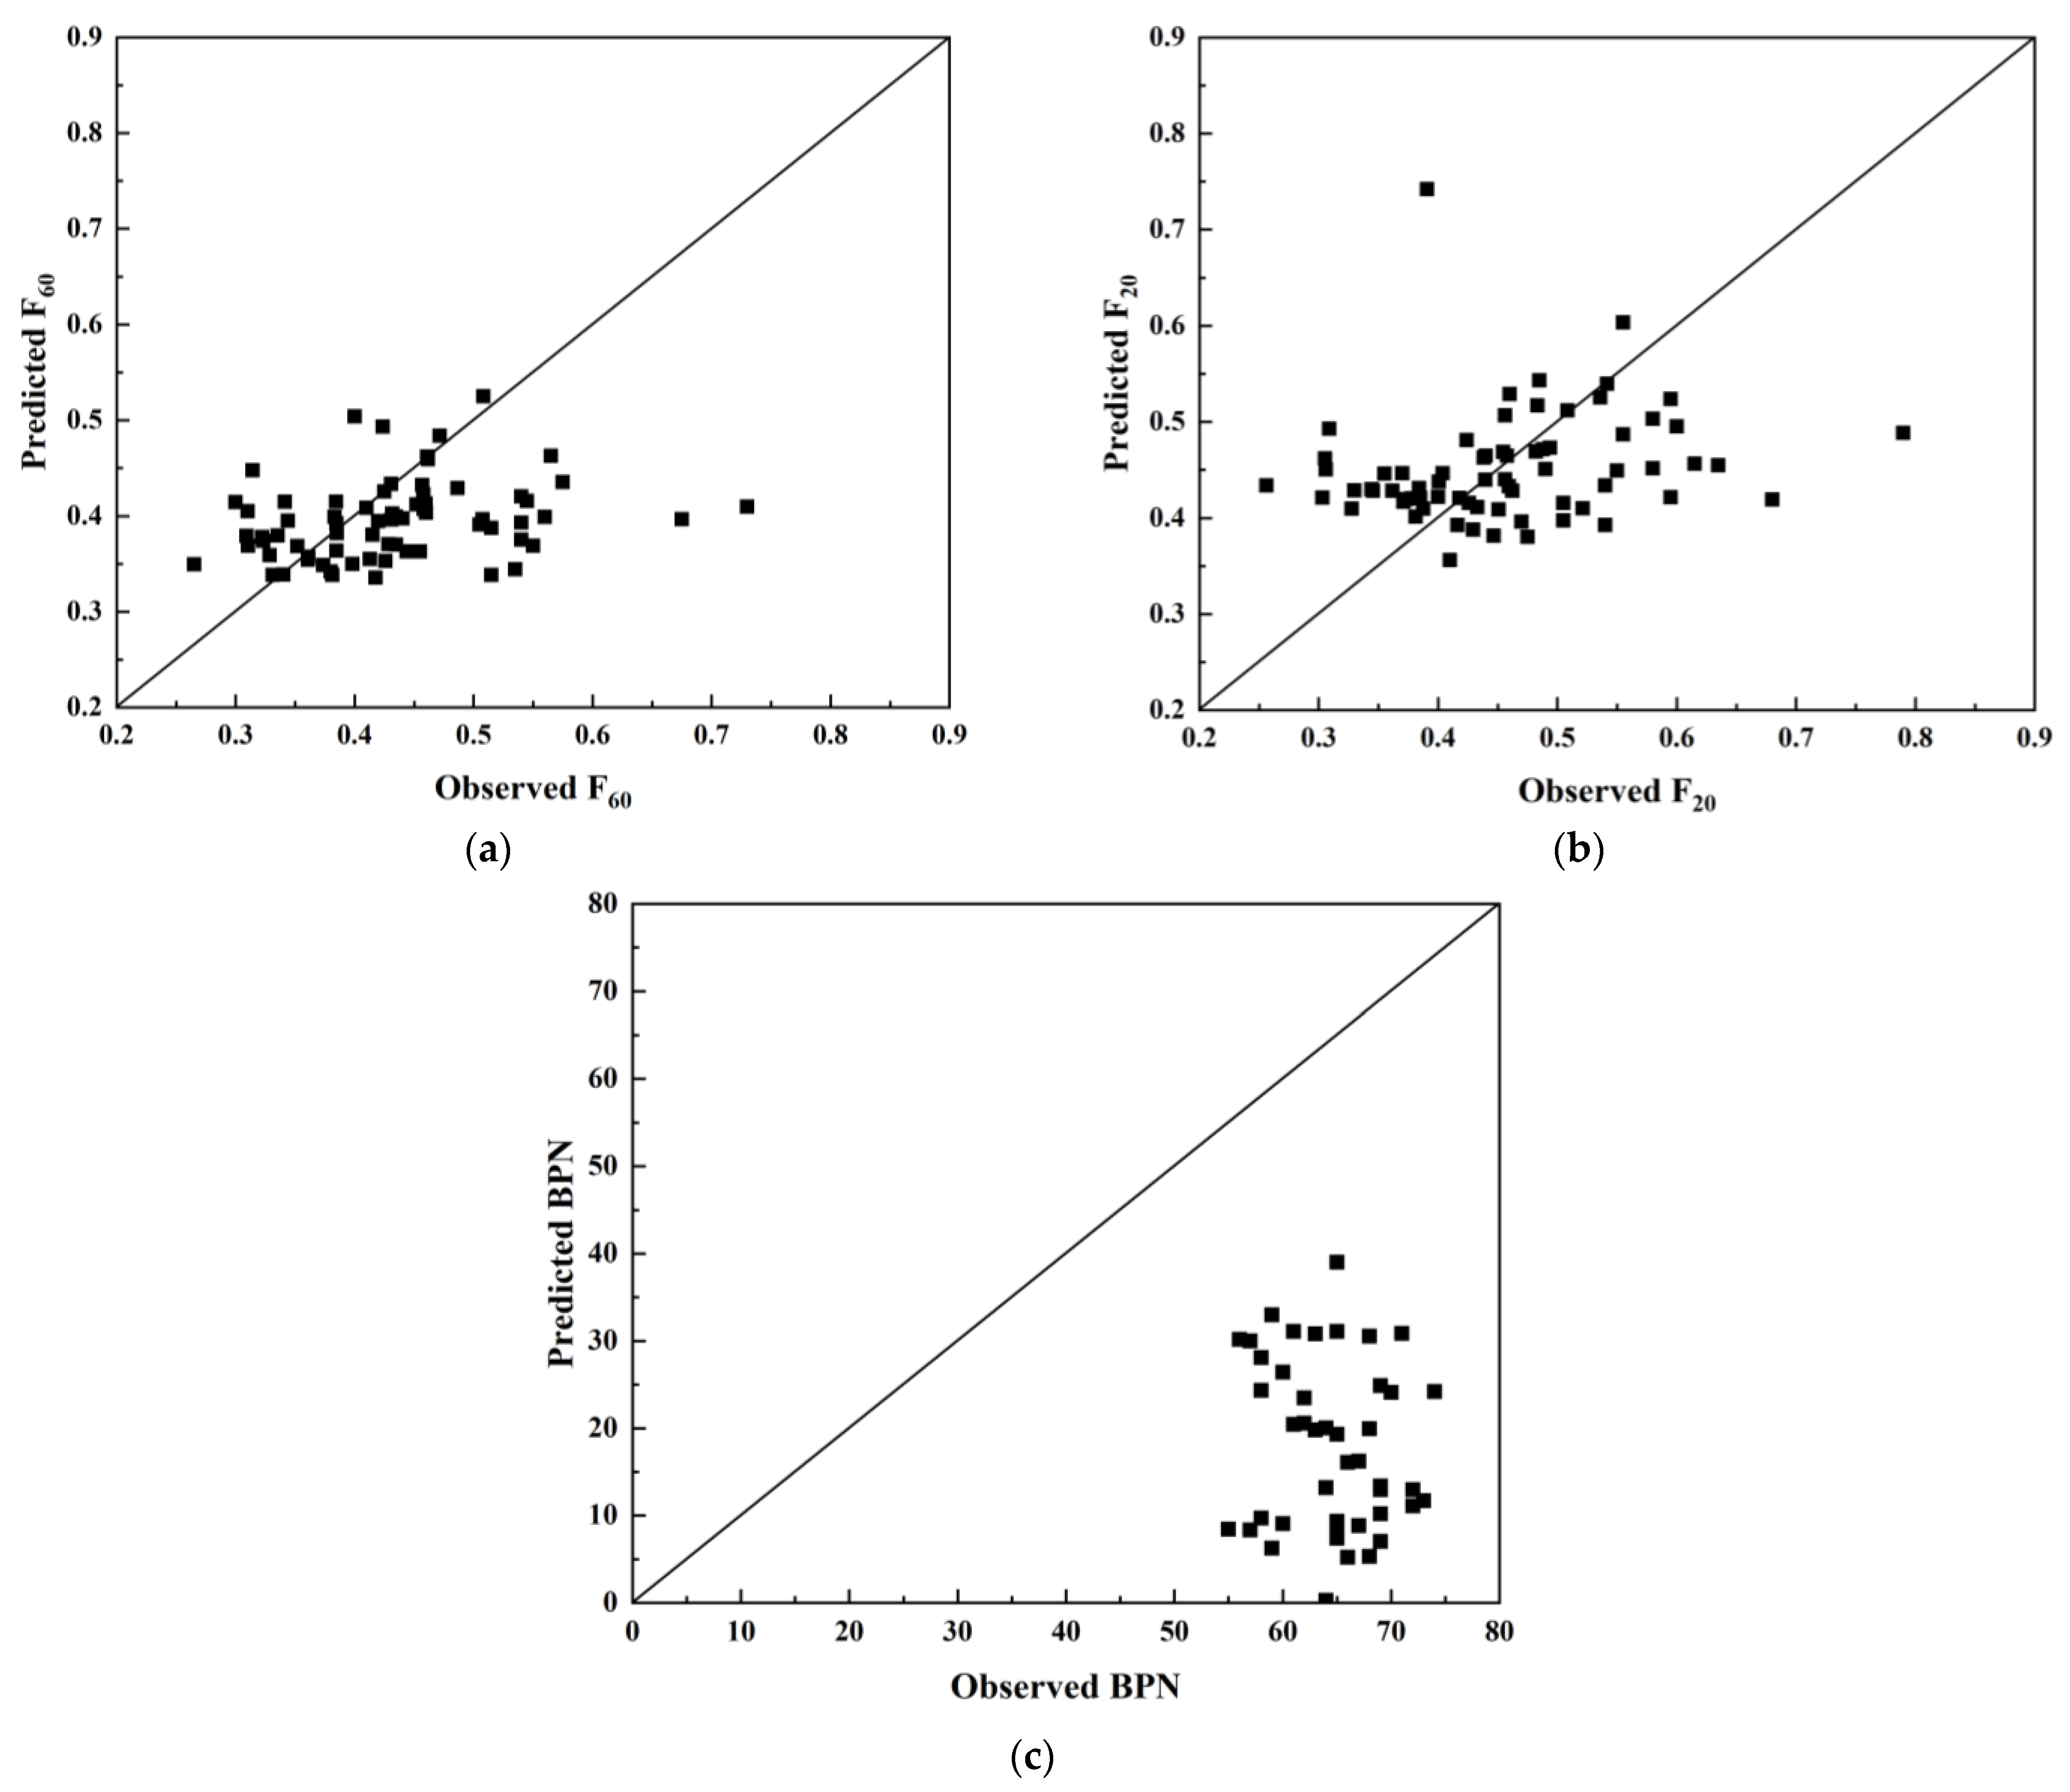
The MLR model has low correlation and appears insufficient to fully characterize the relationship between macro-texture and pavement skid resistance. When the BP neural network is employed to establish the relationship model between macro-texture and skid resistance at high speeds, the correlation reaches 70.6%. Thus, it is recommended to use the BP neural network for the establishment of a relationship model between macro-texture and skid resistance.
The accuracy of the relationship model between macro-texture and skid resistance at low speeds characterized by F20 and BPN using the MLR and BP neural network is lower than that of the relationship model with F60 as the dependent variable, indicating that the correlation between the macro-texture and skid resistance at low speeds is low, and the macro-texture of pavement surface mainly affects pavement skid resistance at high speeds. The establishment of the relationship model between surface texture and the skid resistance in the full speed range requires a comprehensive consideration of both macro-texture and micro-texture.

6. Future Research

This study evaluates the macro-texture from aspects of the elevation, wavelength, and geometry, and analyzed their correlation with skid resistance. Furthermore, the relationship models between macro-texture indexes and skid resistance, characterized by F60, F20, and BPN, were established using both the multiple linear regression (MLR) and back propagation (BP) neural network methods. By comparing them, the appropriate model was recommended finally. All the results were based on data obtained on six roads within an 18-month observation and a laboratory accelerated loading test by MMLS3; however, the data for use was limited to the dozen-level. A more reliable model between pavement macro-texture and skid resistance can be completed with hundreds of data or even more, and further investigation will be conducted on this. Moreover, it is also important to take the micro-texture into consideration when establishing skid resistance prediction models from the perspective of pavement surface.

Author Contributions

Conceptualization, J.J.; methodology, J.J. and W.R.; formal analysis, J.J., W.R. and T.J.; investigation, W.R. and T.J.; resources, J.J.; data curation, J.J.; writing—original draft preparation, J.J., W.R., T.J. and H.L.; writing—review and editing, J.J. and W.R.; visualization, T.J.; supervision, Y.D. and Y.H.; project administration, Y.D. and Y.H.; funding acquisition, J.J. All authors have read and agreed to the published version of the manuscript.

Funding

This research was funded by the National Natural Science Foundation of China (grant numbers 52108391, 52078025); the Beijing Natural Science Foundation (grant numbers KZ201910016017, 8222014); the Program for Chang-jiang Scholars and Innovative Research Team in Universities (grant number IRT-17R06); the Pyramid Talent Training Project of Beijing University of Civil Engineering and Architecture (grant number JDYC20220810); the Research Capacity Enhancement Program for Young Teachers of BUCEA (grant number X21065); the Beijing Postdoctoral Research Foundation (grant number 2020-zz-096); the China Highway Engineering Consulting Corporation (grant number YFZX-2019-06); and the National Key R&D Program of China (grant number 2021YFB2601200).

Institutional Review Board Statement

Not applicable.

Informed Consent Statement

Not applicable.

Data Availability Statement

All data, models, and codes generated or used in this study are included in the submitted manuscript.

Conflicts of Interest

The authors declare no conflict of interest.

References

  1. Huang, X.; Zheng, B. Research status and progress for skid resistance performance of asphalt pavements. China J. Highw. Transp. 2019, 32, 32–49. [Google Scholar] [CrossRef]
  2. Wang, Y.; Liu, Y.; Cheng, Y.; Xue, J. Evaluation of the decay characteristics of pavement skid resistance using three-dimensional texture from accelerated abrasion test. J. Transp. Eng. Part B Pavements 2020, 146, 04020073. [Google Scholar] [CrossRef]
  3. Zhu, X.; Yang, Y.; Zhao, H.; Jelagin, D.; Chen, F.; Gilabert, F.A.; Guarin, A. Effects of surface texture deterioration and wet surface conditions on asphalt runway skid resistance. Tribol. Int. 2021, 153, 106589. [Google Scholar] [CrossRef]
  4. Li, S.; Harris, D.; Wells, T. Surface texture and friction characteristics of diamond-ground concrete and asphalt pavements. J. Traffic Transp. Eng. (Engl. Ed.) 2016, 3, 475–482. [Google Scholar] [CrossRef] [Green Version]
  5. Praticò, F.; Briante, P. Prediction of surface texture for better performance of friction courses. Constr. Build. Mater. 2020, 230, 116991. [Google Scholar] [CrossRef]
  6. Yun, D.; Sha, A.; Hu, L.; Tang, C.; Gao, J. Laboratory study on the relationship between pavement texture and tread rubber penetration depth. Int. J. Pavement Eng. 2020, 23, 1645–1658. [Google Scholar] [CrossRef]
  7. Praticò, F.G.; Astolfi, A. A new and simplified approach to assess the pavement surface micro-and macrotexture. Constr. Build. Mater. 2017, 148, 476–483. [Google Scholar] [CrossRef]
  8. Liu, T.; Zhang, P.; Wang, J.; Ling, Y. Compressive strength prediction of PVA fiber-reinforced cementitious composites containing nano-SiO2 using BP neural network. Materials 2020, 13, 521. [Google Scholar] [CrossRef] [Green Version]
  9. Chou, C.P.; Lee, C.C.; Chen, A.C.; Wu, C.Y. Using a constructive pavement texture index for skid resistance screening. Int. J. Pavement Res. Technol. 2017, 10, 360–368. [Google Scholar] [CrossRef]
  10. Torbruegge, S.; Wies, B. Characterization of pavement texture by means of height difference correlation and relation to wet skid resistance. J. Traffic Transp. Eng. (Engl. Ed.) 2015, 2, 59–67. [Google Scholar] [CrossRef]
  11. Ren, W.; Han, S.; He, Z.; Li, J.; Wu, S. Development and testing of a multivariable accelerated abrasion machine to characterize the polishing wear of pavement by tires. Surf. Topogr. Metrol. Prop. 2019, 7, 035006. [Google Scholar] [CrossRef]
  12. Yu, M.; Xiao, B.; You, Z.; Wu, G.; Li, X.; Ding, Y. Dynamic friction coefficient between tire and compacted asphalt mixtures using tire-pavement dynamic friction analyzer. Constr. Build. Mater. 2020, 258, 119492. [Google Scholar] [CrossRef]
  13. Zheng, D.; Qian, Z.; Liu, Y.; Liu, C. Prediction and sensitivity analysis of long-term skid resistance of epoxy asphalt mixture based on GA-BP neural network. Constr. Build. Mater. 2018, 158, 614–623. [Google Scholar] [CrossRef]
  14. Do, M.T.; Kane, M.; Tang, Z.; Larrard, F.D. Physical model for the prediction of pavement polishing. Wear 2009, 267, 81–85. [Google Scholar] [CrossRef]
  15. Li, Z.; Dong, L.; Hao, P. Study on the decay law of skid resistance of High Friction Surfaces. In Functional Pavement Design, 1st ed.; Erkens, S., Liu, X., Anupam, K., Tan, Y., Eds.; CRC Press: London, UK, 2016; pp. 1571–1575. [Google Scholar]
  16. Kargah-Ostadi, N.; Howard, A. Monitoring pavement surface macrotexture and friction: Case study. Transp. Res. Rec. 2015, 2525, 111–117. [Google Scholar] [CrossRef]
  17. Yu, M.; You, Z.; Wu, G.; Kong, L.; Liu, C.; Gao, J. Measurement and modeling of skid resistance of asphalt pavement: A review. Constr. Build. Mater. 2020, 260, 119878. [Google Scholar] [CrossRef]
  18. Chen, S.; Liu, X.; Luo, H.; Yu, J.; Chen, F.; Zhang, Y.; Ma, T.; Huang, X. A state-of-the-art review of asphalt pavement surface texture and its measurement techniques. J. Road Eng. 2022, 2, 156–180. [Google Scholar] [CrossRef]
  19. Liu, C.; Li, J.; Gao, J.; Yuan, D.; Gao, Z.; Chen, Z. Three-dimensional texture measurement using deep learning and multi-view pavement images. Measurement 2021, 172, 108828. [Google Scholar] [CrossRef]
  20. Jain, S.; Das, A.; Venkatesh, K. Automated and contactless approaches for pavement surface texture measurement and analysis–A review. Constr. Build. Mater. 2021, 301, 124235. [Google Scholar] [CrossRef]
  21. Ji, J.; Jiang, T.; Ren, W.; Dong, Y.; Hou, Y.; Li, H. Precise characterization of macro-texture and its correlation with anti-skidding performance of pavement. J. Test. Eval. 2022, 50, 1934–1946. [Google Scholar] [CrossRef]
  22. Yu, M.; Kong, Y.; Wu, C.; Xu, X.; Li, S.; Chen, H.; Kong, L. The effect of pavement texture on the performance of skid resistance of asphalt pavement based on the Hilbert-Huang transform. Arab. J. Sci. Eng. 2021, 46, 11459–11470. [Google Scholar] [CrossRef]
  23. Li, Q.J.; Zhan, Y.; Yang, G.; Wang, K.C. Pavement skid resistance as a function of pavement surface and aggregate texture properties. Int. J. Pavement Eng. 2020, 21, 1159–1169. [Google Scholar] [CrossRef]
  24. Kogbara, R.B.; Masad, E.A.; Woodward, D.; Millar, P. Relating surface texture parameters from close range photogrammetry to Grip-Tester pavement friction measurements. Constr. Build. Mater. 2018, 166, 227–240. [Google Scholar] [CrossRef]
  25. Yang, X.; Guan, J.; Ding, L.; You, Z.; Lee, V.C.; Hasan, M.R.M.; Cheng, X. Research and applications of artificial neural network in pavement engineering: A state-of-the-art review. J. Traffic Transp. Eng. (Engl. Ed.) 2021, 8, 1000–1021. [Google Scholar] [CrossRef]
  26. Zhang, H.; Yu, T. Prediction of subgrade elastic moduli in different seasons based on BP neural network technology. Road Mater. Pavement Des. 2018, 19, 271–288. [Google Scholar] [CrossRef]
  27. MTPRC. Field Test Methods of Highway Subgrade and Pavement; JTG 3450-2019: 2019; China Communications Press Co., Ltd.: Beijing, China, 2019. [Google Scholar]
  28. Han, S.; Liu, M.; Fwa, T. Testing for low-speed skid resistance of road pavements. Road Mater. Pavement Des. 2020, 21, 1312–1325. [Google Scholar] [CrossRef]
  29. Wasilewska, M.; Gardziejczyk, W.; Gierasimiuk, P. Evaluation of skid resistance using CTM, DFT and SRT-3 devices. Transp. Res. Procedia 2016, 14, 3050–3059. [Google Scholar] [CrossRef] [Green Version]
  30. Ren, W. Study on the Abrasion Characteristic of Surface Texture and Its Effect on Noise for Asphalt Pavements. Ph.D. Dissertation, Chang’an University, Xi’an, China, 2019. [Google Scholar]
  31. Škrinjarić, T. Dynamic portfolio optimization based on grey relational analysis approach. Expert Syst. Appl. 2020, 147, 113207. [Google Scholar] [CrossRef]
  32. Frank, E.; Hall, M.; Holmes, G.; Kirkby, R.; Pfahringer, B.; Witten, I.H.; Trigg, L. Weka-A machine learning workbench for data mining. In Data Mining and Knowledge Discovery Handbook, 2nd ed.; Maimon, O., Rokach, L., Eds.; Springer: Boston, MA, USA, 2010; pp. 1269–1277. [Google Scholar]
  33. Yegnanarayana, B. Artificial Neural Networks; PHI Learning Pvt. Ltd.: New Delhi, India, 2009. [Google Scholar]
  34. Wang, S. Digital Simulation Methods for Surface Texture of Asphalt Pavement. Master’s Thesis, Southeast University, Nanjing, China, 2016. [Google Scholar]
  35. Ren, W.; Han, S.; Ji, J.; Han, X.; Jiang, T.; Yang, Y. Research on the texture orientation characteristics of pavement surface. In Funct. Pavement-Proc. 6th Chin.–Eur. Workshop Funct. Pavement Des. 18–21 October 2020 Virtual, Online, China, 1st ed.; Chen, X., Yang, J., Oeser, M., Wang, H., Eds.; CRC Press: Boca Raton, FL, USA, 2020; pp. 303–307. [Google Scholar]
  36. Yang, Y. Accurate Characterization of Asphalt Pavement Macro Texture and Study on Attenuation Law of Skid Resistance. Master’s Thesis, Beijing University of Civil Engineering and Architecture, Beijing, China, 2021. [Google Scholar]
  37. Miao, Y.; Cao, D.; Liu, Q. Relationship between surface macrotexture and skid resistance of asphalt pavement. J. Beijing Univ. Technol. 2011, 37, 547–553. [Google Scholar]
  38. Henry, J.J. Evaluation of Pavement Friction Characteristics; National Academy Press: Washington, DC, USA, 2000. [Google Scholar]
  39. Kouchaki, S.; Roshani, H.; Prozzi, J.A.; Garcia, N.Z.; Hernandez, J.B. Field investigation of relationship between pavement surface texture and friction. Transp. Res. Rec. 2018, 2672, 395–407. [Google Scholar] [CrossRef]
Figure 1. Flowchart of this study.
Coatings 12 01464 g001
Figure 2. Schematic diagram of the test locations of skid resistance and core drilling.
Coatings 12 01464 g002
Figure 3. 3D laser scanning equipment.
Coatings 12 01464 g003
Figure 4. Schematic diagram of profile error elimination: (a) original profile, (b) elimination of slope, and (c) elimination of offset.
Coatings 12 01464 g004
Figure 5. Schematic diagram of pavement macro-texture distribution.
Coatings 12 01464 g005
Figure 6. Test results of pavement surface texture. Arithmetic mean value (Ra), standard deviation (Rq), range (Rz), skewness (Rsk), and kurtosis (Rku) are vertical macro-texture indexes; average wavelength (La) and root mean square of wavelength (Lq) are horizontal macro-texture indexes; average slope (S1) and average curvature (C) are geometric indexes.
Coatings 12 01464 g006
Figure 7. Scatterplots of the measured and predicted skid resistance: (a) F60, (b) F20, and (c) BPN.
Coatings 12 01464 g007
Figure 8. Schematic diagram of BP neural network model.
Coatings 12 01464 g008
Table 1. Main information of the six actual tested roads.
Road NameLuanchi (LC)Shuinan (SN)Yangyan (YY)Xiyuan (XY)Shunping Side (SP)Shidan (SD)
Mixture typeWAC-16CAC-16CAC-13RAC-13RAC-13CUTWC
Void (%)5.44.84.54.64.313.8
Aggregate typeLimestoneLimestoneLimestoneLimestoneLimestoneBasalt
GradeSecondarySecondaryArterialSecondaryArterialArterial
Note: WAC-16C denotes Warm Asphalt Concrete with nominal maximum aggregate size of 16.0 mm and coarse gradation; and the naming rule is applied to other similar abbreviations; RAC denotes Recycled Asphalt Concrete; UTWC denotes Ultra-Thin Wearing Course.
Table 2. Gradation compositions of asphalt mixtures of the six roads tested.
Sieve Size (mm)Percentage Passing through Different Sieve Size (%)
LC-WAC-16CSN-AC-16CYY-AC-13XY-RAC-13SP-RAC-13CSD-UTWC
19100100----
169696.9100100100-
13.283.98495.499.497.1100
9.572.469.674.376.276.790
4.7544.845.544.250.352.730
2.3628.229.529.230.636.426.5
1.1816.719.921.323.724.817
0.612.613.414.915.916.912
0.38.310.411.110.112.29
0.155.787.77.387.5
0.0754.95.55.564.85.5
Table 3. All the evaluation indexes of pavement surface macro-texture involved in this research.
Texture Index Classification Evaluation IndexCalculation FormulaDefinition Details
Vertical macro-texture indexes Arithmetic   mean   value   R a R a = 1 n i = 1 n | z i Z ¯ | n   is   the   number   of   elevation   data ,   i . e . ,   sampling   points   in   the   section ;   z i   denotes   the   texture   elevation   of   the   i - th   sampling   point ;   Z   ¯ denotes the average of elevation data of all the sampling points;
σ   denotes   the   standard   deviation   of   elevation   data   of   all   the   sampling   points ;   Δ x represents sampling interval.
Standard   deviation   R q R q = 1 n 1 i = 1 n ( z i Z ¯ ) 2
Range   R z R Z = max ( z i ) min ( z i )
Skewness   R s k R s k = 1 σ 3 n i = 1 n ( z i Z ¯ ) 3
Kurtosis   R k u R k u = 1 σ 4 n i = 1 n ( z i Z ¯ ) 4
Horizontal macro-texture indexes Average   wavelength   L a L a = 2 π R a / D a
D a = 1 n 1 i = 1 n 1 | z i + 1 z i Δ x |
Root   mean   square   of   wavelength   L q L q = 2 π R q / D q
D q = i = 1 n 1 1 n 1 ( z i + 1 z i Δ x ) 2
Geometric indexes Average   slope   S 1 S 1 = 1 n 1 i = 1 n 1 z i + 1 z i Δ x
Average curvature C C = 1 n 2 i = 2 n 1 2 z i z i 1 z i + 1 Δ x 2
Table 4. Grey entropy correlation degree at different pavement service times between different macro-texture indexes and F60.
Test DateRaRqRzRskRkuLaLqS1C
December 20190.97050.96820.98660.95850.96200.93010.94290.92400.9121
September 20200.96900.96940.96850.96020.95420.95470.91770.95810.9212
December 20200.98510.95530.96420.95870.95990.93780.92770.92490.8343
Table 5. Grey entropy correlation degree of different mixtures between different macro-texture indexes and F60.
Mixture TypesRaRqRzRskRkuLaLqS1C
AC-130.98510.98530.98420.97870.98990.96780.96770.92490.8343
AC-160.97410.97460.97720.97280.97540.97130.94190.91100.9006
Table 6. Analysis results under different numbers of hidden layers using BP neural network with the F60 as the output node.
Number of Hidden LayersR2 ResultRMSE Result
10.80510.419
20.74030.439
30.41430.683
Table 7. Analysis results under different numbers of hidden nodes using BP neural network with the F60 as the output node.
Number of NodesR2 ResultRMSE Result
20.81600.461
30.81830.418
40.80450.434
Table 8. Calculated model weights with F60 as the output node.
Input Value WeightNodes
Node1Node2Node3
Ra0.5470.8532.572
Rq−1.4711.9321.321
Rz−1.5220.208−0.999
Rsk−6.368−3.253−4.385
Rku−3.5570.341−3.777
Constant−4.098−0.780−0.754
Hidden layer weightNode1Node2Node3Constant
3.0391.8830.488−0.570
Table 9. Calculated model weights with F20 as the output node.
Input Value WeightNodes
Node1Node2Node3
Ra0.496 3.935 0.869
Rq0.552 2.224 0.573
Rz0.541 −1.384 −0.513
Rsk−0.586 4.272 −0.839
Rku0.817 5.958 0.168
Constant−0.880 −0.627 −0.944
Hidden layer weightNode1Node2Node3Constant
0.0261.5880.882−0.536
Table 10. Calculated model weights with BPN as the output node.
Input Value WeightNodes
Node1Node2Node3
Ra1.862 −0.361 −0.977
Rq0.301 −0.207 −1.380
Rz−0.696 0.461 −0.019
Rsk−3.154 −0.255 −2.951
Rku−2.743 −0.645 3.470
Constant−3.537 −1.141−3.463
Hidden layer weightNode1Node2Node3Constant
−4.1971.4643.483−0.761
Publisher’s Note: MDPI stays neutral with regard to jurisdictional claims in published maps and institutional affiliations.

