
Effect of Corrosion and Wall Textures on Wettability and Heat Flux at Non-Isothermal Conditions

Kutateladze Institute of Thermophysics Siberian Branch, Russian Academy of Sciences, 1 Lavrentyev Ave., 630090 Novosibirsk, Russia
Coatings 2022, 12(1), 46; https://doi.org/10.3390/coatings12010046
Submission received: 1 December 2021
/
Revised: 23 December 2021
/
Accepted: 27 December 2021
/
Published: 31 December 2021
(This article belongs to the Special Issue 10th Anniversary of Coatings: Invited Papers in Corrosion, Wear and Erosion Section)
Abstract
:The corrosion behavior, evaporation and heat transfer of aluminum alloy during droplet evaporation of an aggressive solution of NaCl and hydrogen peroxide in water have been studied experimentally. To date, the effect of corrosion on the evaporation and heat transfer of droplet salt solutions on textured surfaces remains insufficiently explored. The corrosion resistance of the material and the contact angle increase with an increase in the number of laser penetrations after laser texturing. Studies conducted using an electron microscope and Energy-Dispersive X-ray Spectroscopy (EDS) mapping show that the maximum amount of adsorbed hydrocarbon impurities falls on areas with a large number of pits. In the process of metal corrosion, wettability and heat transfer change. In spite of the fact that laser exposure significantly increases the corrosion resistance, the wettability of the wall changes significantly due to corrosion. The wetted diameter of a droplet changes over time, which leads to an increase in the evaporation rate and heat flux. The heat flux during evaporation of a droplet on a heated wall depends on the water droplet diameter, the texture of the wall and the corrosion resistance.
1. Introduction
Atmospheric corrosion causes significant economic damage to materials and technical devices. Sea water deteriorates ships’ equipment. High-temperature evaporation of solution droplets is widely used in modern technologies. Rapid corrosive destruction of the material is realized when using aqueous salt solutions. The droplet evaporation of water–salt solutions leads to the destruction of rocks, buildings and monuments [1]. Salt solution droplets can grow and crystallize in cracks of stones due to fluctuations in air humidity and air temperature. It is worth noting the use of the aqueous salt droplets in pharmacology and microbiology. Droplet evaporation and crystallization of proteins containing NaCl salt are studied in Ref. [2]. The droplet evaporation is used in the following technologies: lab-on-a-chip-processes [3], inkjet printing [4,5], self-assembled coating [6] and spray cooling [7]. Most pharmaceuticals and fine chemicals require drying before packaging [3]. The evaporative cooling systems with diffusion-based evaporation of sessile droplets can provide sufficient cooling for microprocessors with various configurations [4].
The droplet evaporation of water solutions depends on a large number of interrelated factors [8,9,10]. The pitting corrosion leads to local damages to structures and can significantly reduce the service life of technical devices. The effect of the droplet-wetted diameter on the corrosion is shown in Ref. [11]. The rate of oxygen diffusion in the aqueous solution is high if the droplet height is less than 20 µm. The corrosion rate is affected by the key factors: the liquid solution temperature [12], the acidity of aqueous solution [12,13], the presence of surface surfactants and pollutants in the liquid [14,15] and the salt concentration [16,17,18].
To increase the corrosion resistance, the following methods are used: the graphene coating on a substrate [19], the corrosion inhibitors [20] and the superhydrophobic surfaces [21]. To reduce the effect of the pitting corrosion, the following inhibitors are used: cerous, vanadate and chromate ions [20]. The specified inhibitors cause substantial cathodic inhibition and reduce the corrosion rate. Chromate, molybdate and heptamolybdate ions affect both the nucleation of pitting and metastable pitting [21,22]. The inhibition efficiency of molybdate and tungstate are comparable [23]. The effect of some α-amino acids on the inhibition of the pitting corrosion of Al in NaCl solution is studied in [24].
One of the methods used for corrosion protection is laser surface texturing. The surfaces after the laser exposure have the following functional properties: hydrophobicity [25,26], counteraction of biogrowth [27,28] and reduction in abrasive wear [29,30,31]. The anti-icing mechanism of a superhydrophobic textured coating is considered in [32]. Features of laser texturing for different alloys are considered in the following works: copper [33]; tungsten [34], titanium and zinc [35,36] and aluminum alloys [25]. The aluminum–magnesium alloys are widely used in engineering. The corrosion resistance of the textured surface of aluminum alloy is considered in Refs. [37,38,39,40]. Today, it is generally accepted that laser texturing increases the corrosion resistance by forming a thick oxide layer [30,31,32,39,40]. The deep oxygen penetration and formation Al2O3 is realized due to metal convection during the plasma melting of a metal by a laser beam.
It is worth mentioning other surface treatment methods including the surface mechanical attrition treatment, the shot peening method and ultrasonic shot peening. Nanostructured surfaces are produced on Al alloy plates using the surface mechanical attrition treatment technique [41]. The nanocrystalline grains that are associated with the high angle grain boundaries have higher thermal stability than grains that are separated by the low angle grain boundaries. The plasma electrolytic oxidation treatments reduce the corrosion fatigue life of aluminum alloy [42]. With shot peening as a pretreatment of the plasma electrolytic oxidation, the corrosion fatigue resistance of multiple treated sample is improved [42]. The effect of ultrasonic shot peening on the environmental hydrogen embrittlement behavior of the 7075-T6 aluminum alloy is investigated in [43]. The results of this work show that the ultrasonic shot-peened specimen has a superior hydrogen embrittlement resistance.
An increase in the salt concentration leads to a decrease in the oxygen solubility in a liquid layer [44]. Two characteristic corrosion modes are observed at droplet evaporation of solutions of NaCl, NH4SO4, H2SO4 and HNO3 [45]. The superhydrophobic textured surfaces of aluminum alloy have enhanced resistance to the pitting corrosion [46]. To study the corrosion behavior and to conduct rapid analysis, hydrogen peroxide is widely used [47,48,49,50,51]. The use of H2O2 results in an increased dissolution/oxidation rate.
Droplet evaporation is considered in [52,53,54,55]. The study of the effect of salt crystallization on evaporation and heat transfer is performed in Ref. [56]. Laser texturing changes both the surface wettability and the droplet evaporation rate [57,58].
Analysis of the literature shows that most of the works deal with a low concentration of NaCl salt (less than 3%) in the absence of wall heating. The combined effect of corrosion, evaporation and the diameter of the wetted spot of drops in a wide range of diameters from 1 to 20 mm has not been thoroughly investigated. In previous studies, there are practically no data on the effect of corrosion on the change in wettability and evaporation of large droplets located on walls with different textures over time.
2. Measurement Methods
2.1. Droplet Evaporation
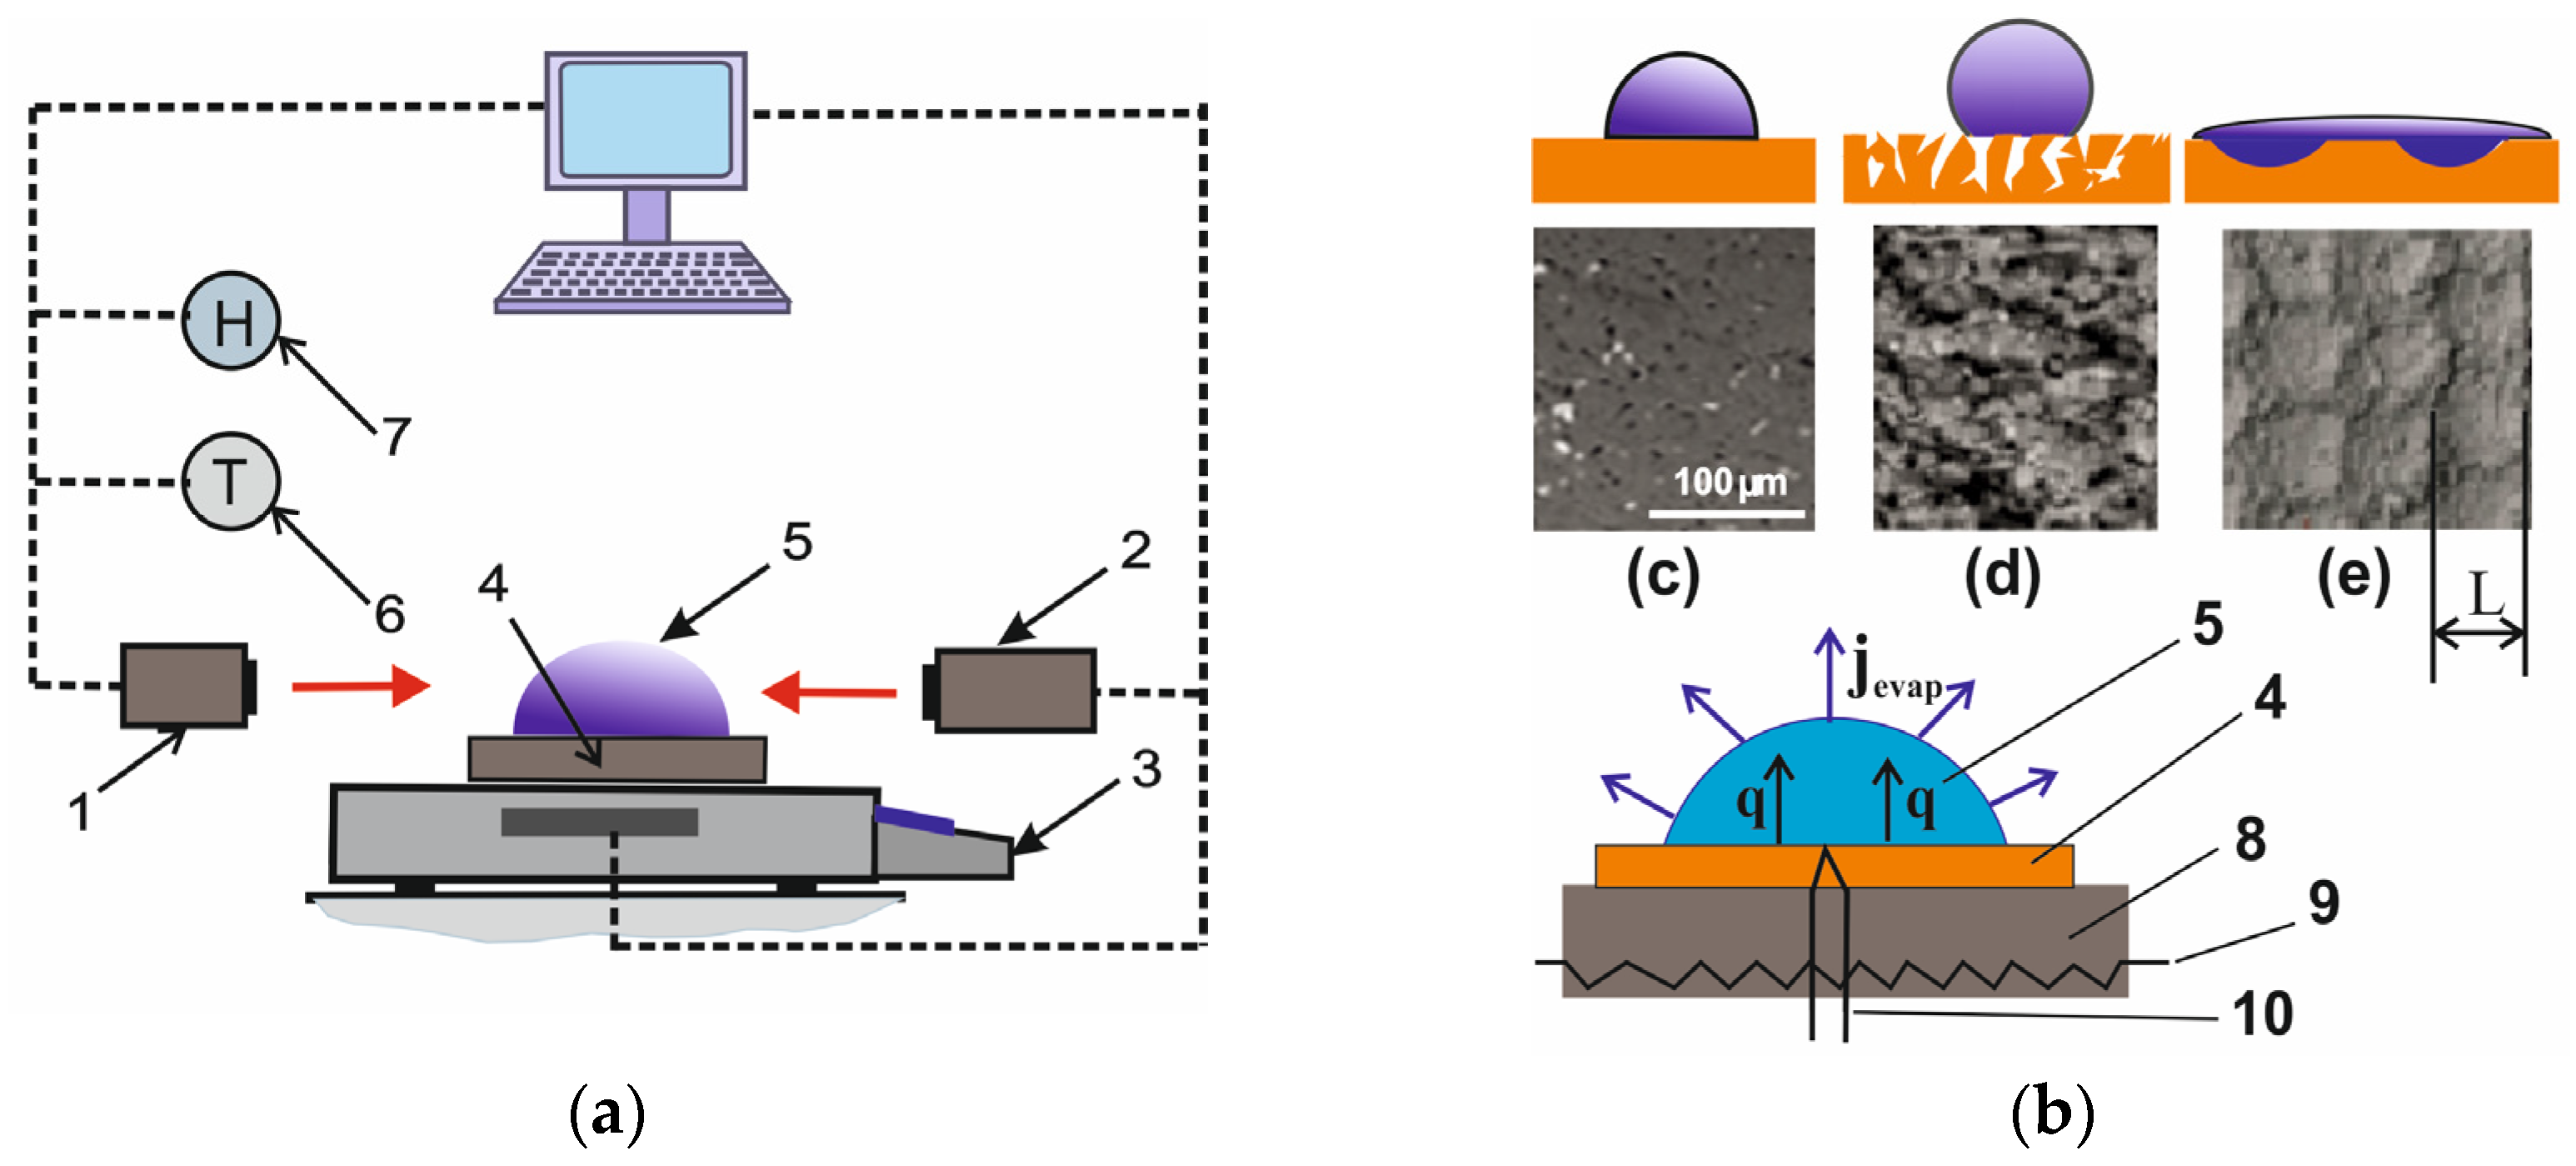
The experimental setup diagram and characteristic surface textures are shown in Figure 1. Experiments were conducted with two types of liquids: (1) the degassed distillate and (2) the aqueous solution of NaCl salt (the initial mass concentration of salt is 6%) with hydrogen peroxide (the initial mass concentration of H2O2 is 1.5%).
The evaporating droplet (5) was located on the horizontal surface of the substrate of aluminum–magnesium alloy (AlMg6) with the specified surface texture. The substrate (4) was heated by the copper cylinder (8) (the electric heater located near the lower wall of the cylinder (9); Figure 1b). The substrate with a drop was located on electronic scales (3) with a discreteness of 0.001 g. The optical system for measuring the geometric parameters of the drop consists of the photo camera (1) and the telecentric pipe (2).
The outside air temperature was 25 °C, and the air humidity was 40%. To exclude the influence of external convection, side walls were located around the measuring unit, the height of which significantly exceeded the height of the working area. The temperature of the wall under a droplet for all experiments was Tw = 41 °C. The temperature Tw was measured by the thermocouple located in the center of the drop base. All experiments were carried out at low heating of the wall. High temperature and intense heating of the liquid would lead to rapid droplet evaporation and no effect of corrosion. In this case, the evaporation time of the solution would be significantly less than the typical time of corrosion.
The droplet evaporation rate j = Δm/Δt was measured using the gravimetric method (m is the droplet current mass and t is the evaporation time). When determining Δm/Δt, the time interval (Δt) was chosen for the error j not to exceed 8%–10%. The error in measuring the diameter of the droplet base did not exceed 3%–4%. The wetted droplet diameter was determined as the average over two perpendicular axes. The droplet was applied to the substrate using dispensers. The initial salt concentration was determined using densimeters.
2.2. Laser Texturing of the Surfaces
The aluminum–magnesium alloy (AlMg6) has the following chemical composition (wt.%): Al (91.3), Mg (6.6), Mn (0.9), Fe (0.4), Si (0.4), Zn (0.2), Ti (0.1) and Cu (0.1). The experiments were performed using a polished (smooth) surface (Wuxi Taixie Metal Material Co., Ltd., Wuxi, China), as well as textured surfaces. The polished smooth wall (Figure 1c) had a wall roughness with mean square deviation of 0.1–0.2 µm. The polished and textured surfaces were ultrasonically cleaned and dried in air under laboratory environmental conditions (temperature of 23–25 °C, atmospheric pressure and relative humidity of 40%–45%). The textured surfaces of the sample walls were created with laser technology: the ytterbium nano-second pulsed fiber laser (IPG-Photonics, NTO IRE-Polyus, Russia) with a wavelength of 1064 nm. The laser lens had dimensions of 110 mm × 110 mm. A laser pulse was focused into a spot with a radius of about 30 µm. The textures were created by a laser beam, both without craters (Figure 1d) and with periodic structures (craters) with a diameter L = 50–60 µm (Figure 1e). The distance between the centers of the craters was equal to the diameter of the crater. At laser texturing of the surfaces, the following characteristics were constant: the repetition rate of 20 kHz, the duration of 200 ns and the pulse energy of 1 mJ. The roughness topology of the samples during laser texturing changed due to the variation of the following parameters: the beam linear speed (v) and the number of lines (n). The laser moved in a horizontal plane parallel to the surface of the sample. For the textured hydrophobic surface (without craters), v = 1000 mm/s and n = 20 mm−1. For the textured hydrophilic (with craters) surface, v = 1320 mm/s and n = 50 mm−1.
2.3. Static Contact Angle
Measurement of the initial static contact angle of a droplet θ0 was carried out using the optical system (the plane-parallel light generation system): the source MI-150, the telecentric backlight illuminator 62–760 (Edmund Optics, Barribgton, IL, USA), the glass fiber optics cable (BX4 type Dolan-Jenner) and the video camera Fast Video 500 M (NPO ASTEK, Moscow, Russia) with the macro lens Sigma (105 mm f/2.8 G IF-ED AF-S 9). The textured hydrophobic sample in Figure 1d was applied after long-term storage for several months following laser treatment. It is known that a long storage period leads to a change in wettability (the contact angle increases from the values below 5° up to 90–110°) [39,40]. Additional short-term annealing at a temperature of 90 °C resulted in an increase in the static contact angle to 134–136°. The use of multiple laser beam passes and additional short-term annealing (sample 3, Table 1) resulted in an increase in the droplet angle to 149–152°. The superhydrophilic textured surface with craters was applied immediately after laser texturing, rather than a week after manufacturing, when the contact angle would have reached 8–11°. The values of initial static contact angles are given in Table 1.
2.4. Electrochemical Measurements
A thermostatically controlled three-electrode cell, including a working, auxiliary and reference electrode, was used for electrochemical measurements. An electrolyte of 0.5 M NaCl was used for the studies (at a liquid temperature of 24 °C). The temperature of the liquid in the measuring cell was kept constant using the Julabo F25 thermostat. A plate (10 mm × 10 mm) was used as a working electrode. The auxiliary electrode was a Pt plate. The reference electrode was a silver chloride electrode (Ag/AgCl), which was immersed in a saturated water–salt solution of KCl. Before the start of electrochemical measurements, samples 1–4 (Table 1) were cleaned in an ultrasonic bath for 10 min (the bath was successively filled with isopropanol and ultrapure water). After placing the working electrode in an aqueous salt solution (electrolyte), the open circuit potential was recorded for 30 min until the stationary potential was established. The potentiodynamic polarization curves had a potential frequency of 1 mV/s towards positive values in the range of potential values from −0.25 to 0.25 V relative to the open circuit potential.
3. Experimental Data and Analysis
3.1. The Effect of the Droplet Diameter and the Substrate Temperature on the Corrosion of Aluminum–Magnesium Alloy
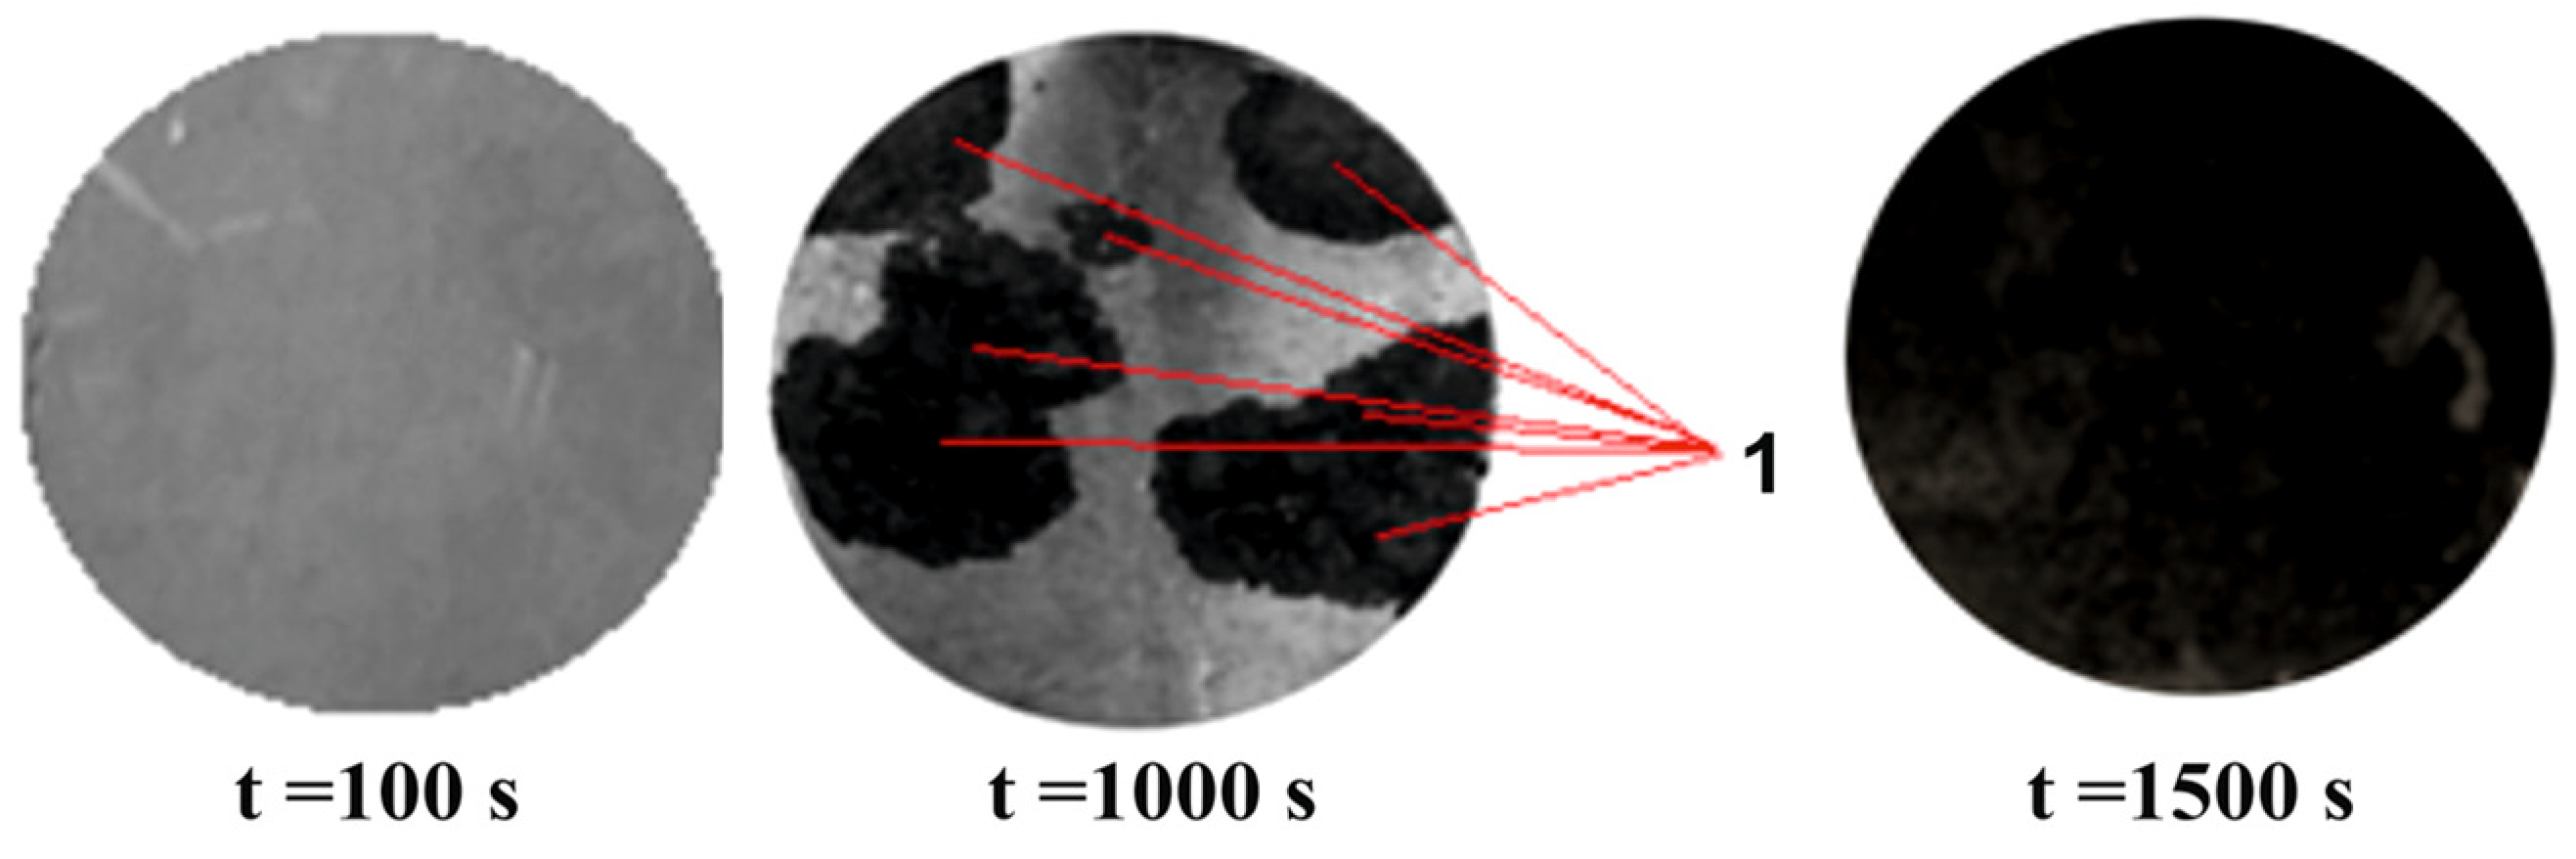
The experiments were carried out at wall temperatures (under a droplet) of 18 and 42 °C. As a result of corrosion, the material surface changed color dramatically. Figure 2 shows photographs of the wall surface under a droplet of salt solution (H2O + NaCl + H2O2). Area 1 (black) reflects regions of corrosion. After t = 1500–2000 s, the entire surface of the wetted drop spot had a black color.
3.2. The Effect of Droplet Diameter on Corrosion Kinetics
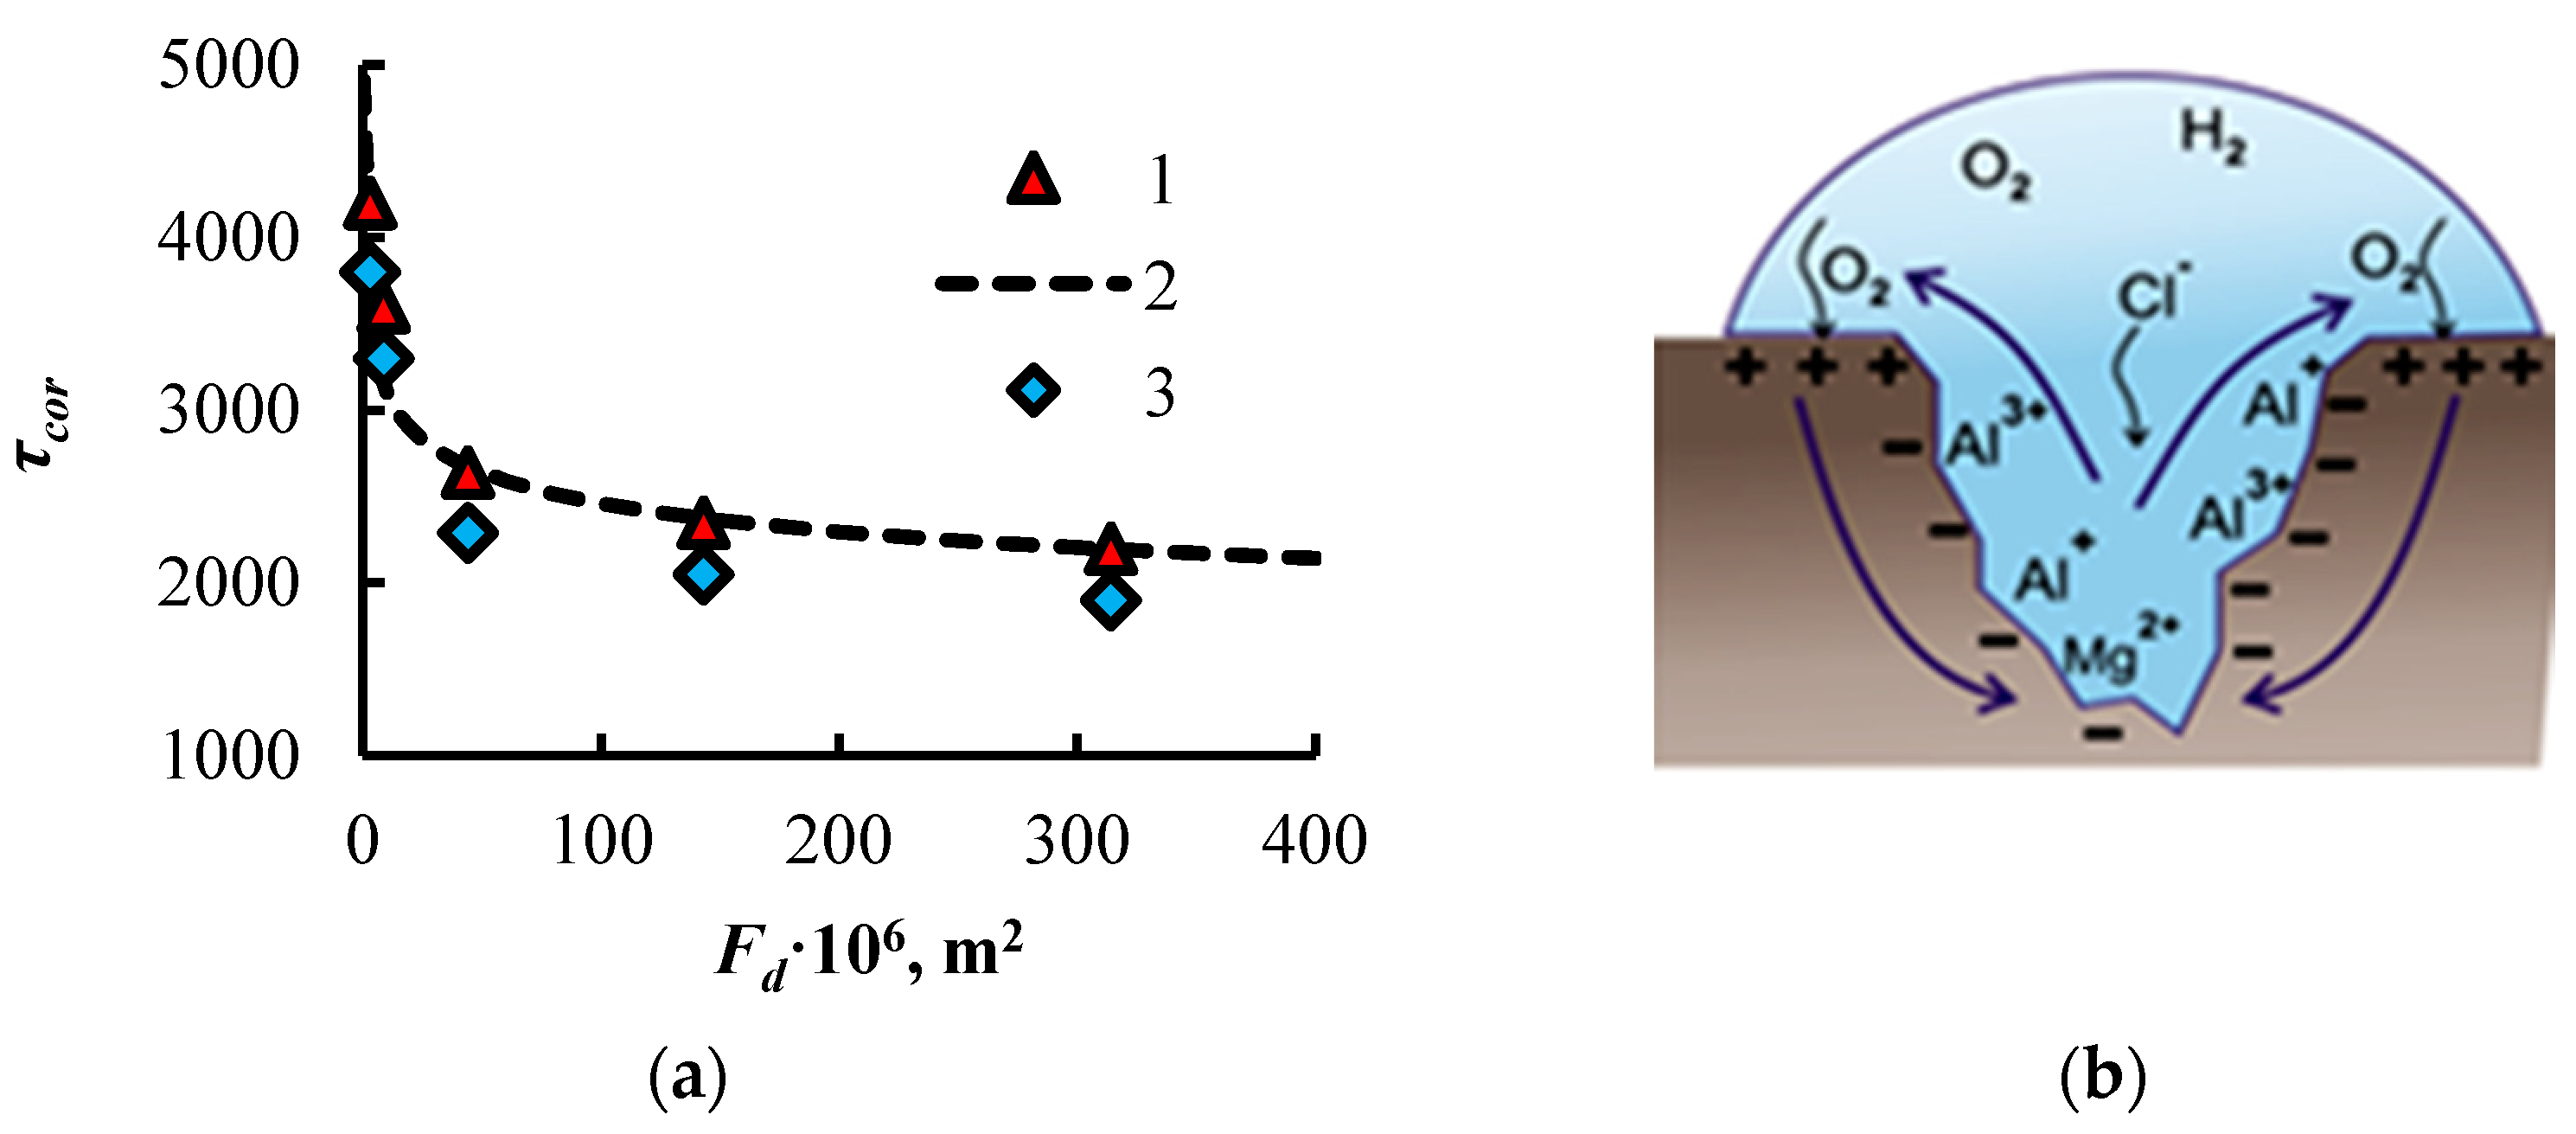
The areas of intense corrosion (areas 1) were non-uniformly distributed over the metal surface. Figure 3a shows the curves of the dependence of the conditional corrosion time (τcor) on the initial area of change of the wetted spot of the drop Fd. The time τcor corresponds to the time when the entire surface became black. The diameter of the drop (Dw) varied in the range of 2–20 mm. At a higher wall temperature (curve 3), the time τcor decreased throughout the investigated diameter range.
Let us consider the geometric and physical–chemical parameters that affect the kinetics of corrosion [59]. When pitting corrosion occurs, there is a potential difference between the cathode (the wall surface in the vicinity of the pit, Figure 3b) and the anode (surface inside the pit, where the dissolution reaction is implemented). The limiting factors of the corrosion rate are: the rate of dissolution of the oxide layer (anode and cathode factors), the rate of removal of reaction products inside the pit (anode factor; a layer of reaction products is formed near the surface of the cavity; the diffusion of the reaction products regulates the rate of metal dissolution, limiting the speed of the anode process), the rate of oxygen dissolution in water, and the rate of oxygen diffusion in the solution (cathode factors). Hydrogen peroxide eliminates the cathode-limiting factors. The dependence of the cathodic limiting current Icath on the drop height h (liquid layer height) is defined by the Fick’s First Law Equation (1),
where n is the number of electrons in the oxygen reduction reaction, D1 is the oxygen diffusion coefficient, C is the oxygen concentration, S (S = πRw2) is the contact area covered by the droplet, F is the Faraday constant and Rw is the droplet-wetted radius.
Icath = nFD1CS/h
If the rate of oxygen diffusion played a key role, then primary corrosion would have occurred at the edges of the drop. The experimental results show that the area of corrosion was almost unrelated to the droplet height. The rate of dissolution decreased many times with the increasing of the salt concentration. However, the corrosion rate did not decrease with time, but rather increased. The concentration of salt increased markedly over time due to water evaporation. Thus, the dissolution of oxygen also did not limit the rate of corrosion. Therefore, the regulating factors were the anode processes. Let the corrosion current Icor be related to the corrosion time τcor (τcor corresponds to the time at which the entire metal surface under the drop becomes black (Figure 2)) in the form of Equation (2).
Icor~k1/(τcor)n1
The rate of corrosion is inversely proportional to the characteristic time of corrosion in power form. According to the experimental data, τcor is inversely proportional to the area of the droplet base in the form of Equation (3), where the constants (k2 = 0.0038, n2 = 0.1) are obtained by generalizing the experimental points.
τcor~k2/(Fd)n2 = 0.0038/(Fd)0.1
For large drops, τcor and Icor change slightly with increasing diameter. For small droplets, the rate of corrosion will depend more on the droplet diameter. Taking into account Equations (2) and (3), Equation (4) can be obtained, which relates the corrosion rate to Fd.
Icor~k3(Fd)n3
The proportionality of the corrosion current to the area Fd implies (in the absence of restrictions for the cathode reaction) that the active (primary) pits are distributed unevenly over the surface, and the average distance between the pits (L) is much larger than the droplet diameter (Dw) (Y = L/Dw >> 1 for small droplets). The smaller the area of a droplet, the less likely it is that the active pit will enter the area of the wetted droplet. The rate of corrosion will depend on the distribution density of active pits and is inversely proportional to the parameter Y. Obviously, Y will depend on the surface treatment method (for example, polishing), the aging of the material and the types of its storage and operational use.
The uneven occurrence of primary corrosion (dark areas in Figure 2) persisted during repeated experiments. This nonuniformity was associated with the random nature of distribution of active corrosive centers. Each new sample was polished under identical conditions. The places where drops were applied to the metal surface also differed. There is a need in further studies on the influence of the degree of roughness, its topology, and the surface treatment method on the distribution of active corrosion centers, as well as on the nature of the τcor curve in Figure 3a.
3.3. EDS Mapping after the Corrosive Effect of a Droplet of Salt Solution
Let us consider the results of research using Energy-dispersive X-ray spectroscopy (EDS mapping). To study corrosion, three types of samples from Table 1 were used: (1) sample 1, the smooth surface; (2) sample 2, the hydrophobic surface without craters; and (3) sample 4, the super hydrophilic surface with craters. The samples were stored in solution (H2O + NaCl + H2O2) for 20 h. Since the salt concentration increased during the drop evaporation, the solution was periodically (with a frequency of 20–30 min) removed by the dispenser and a new drop with a diameter of 20 mm was applied to the same surface of the substrate.
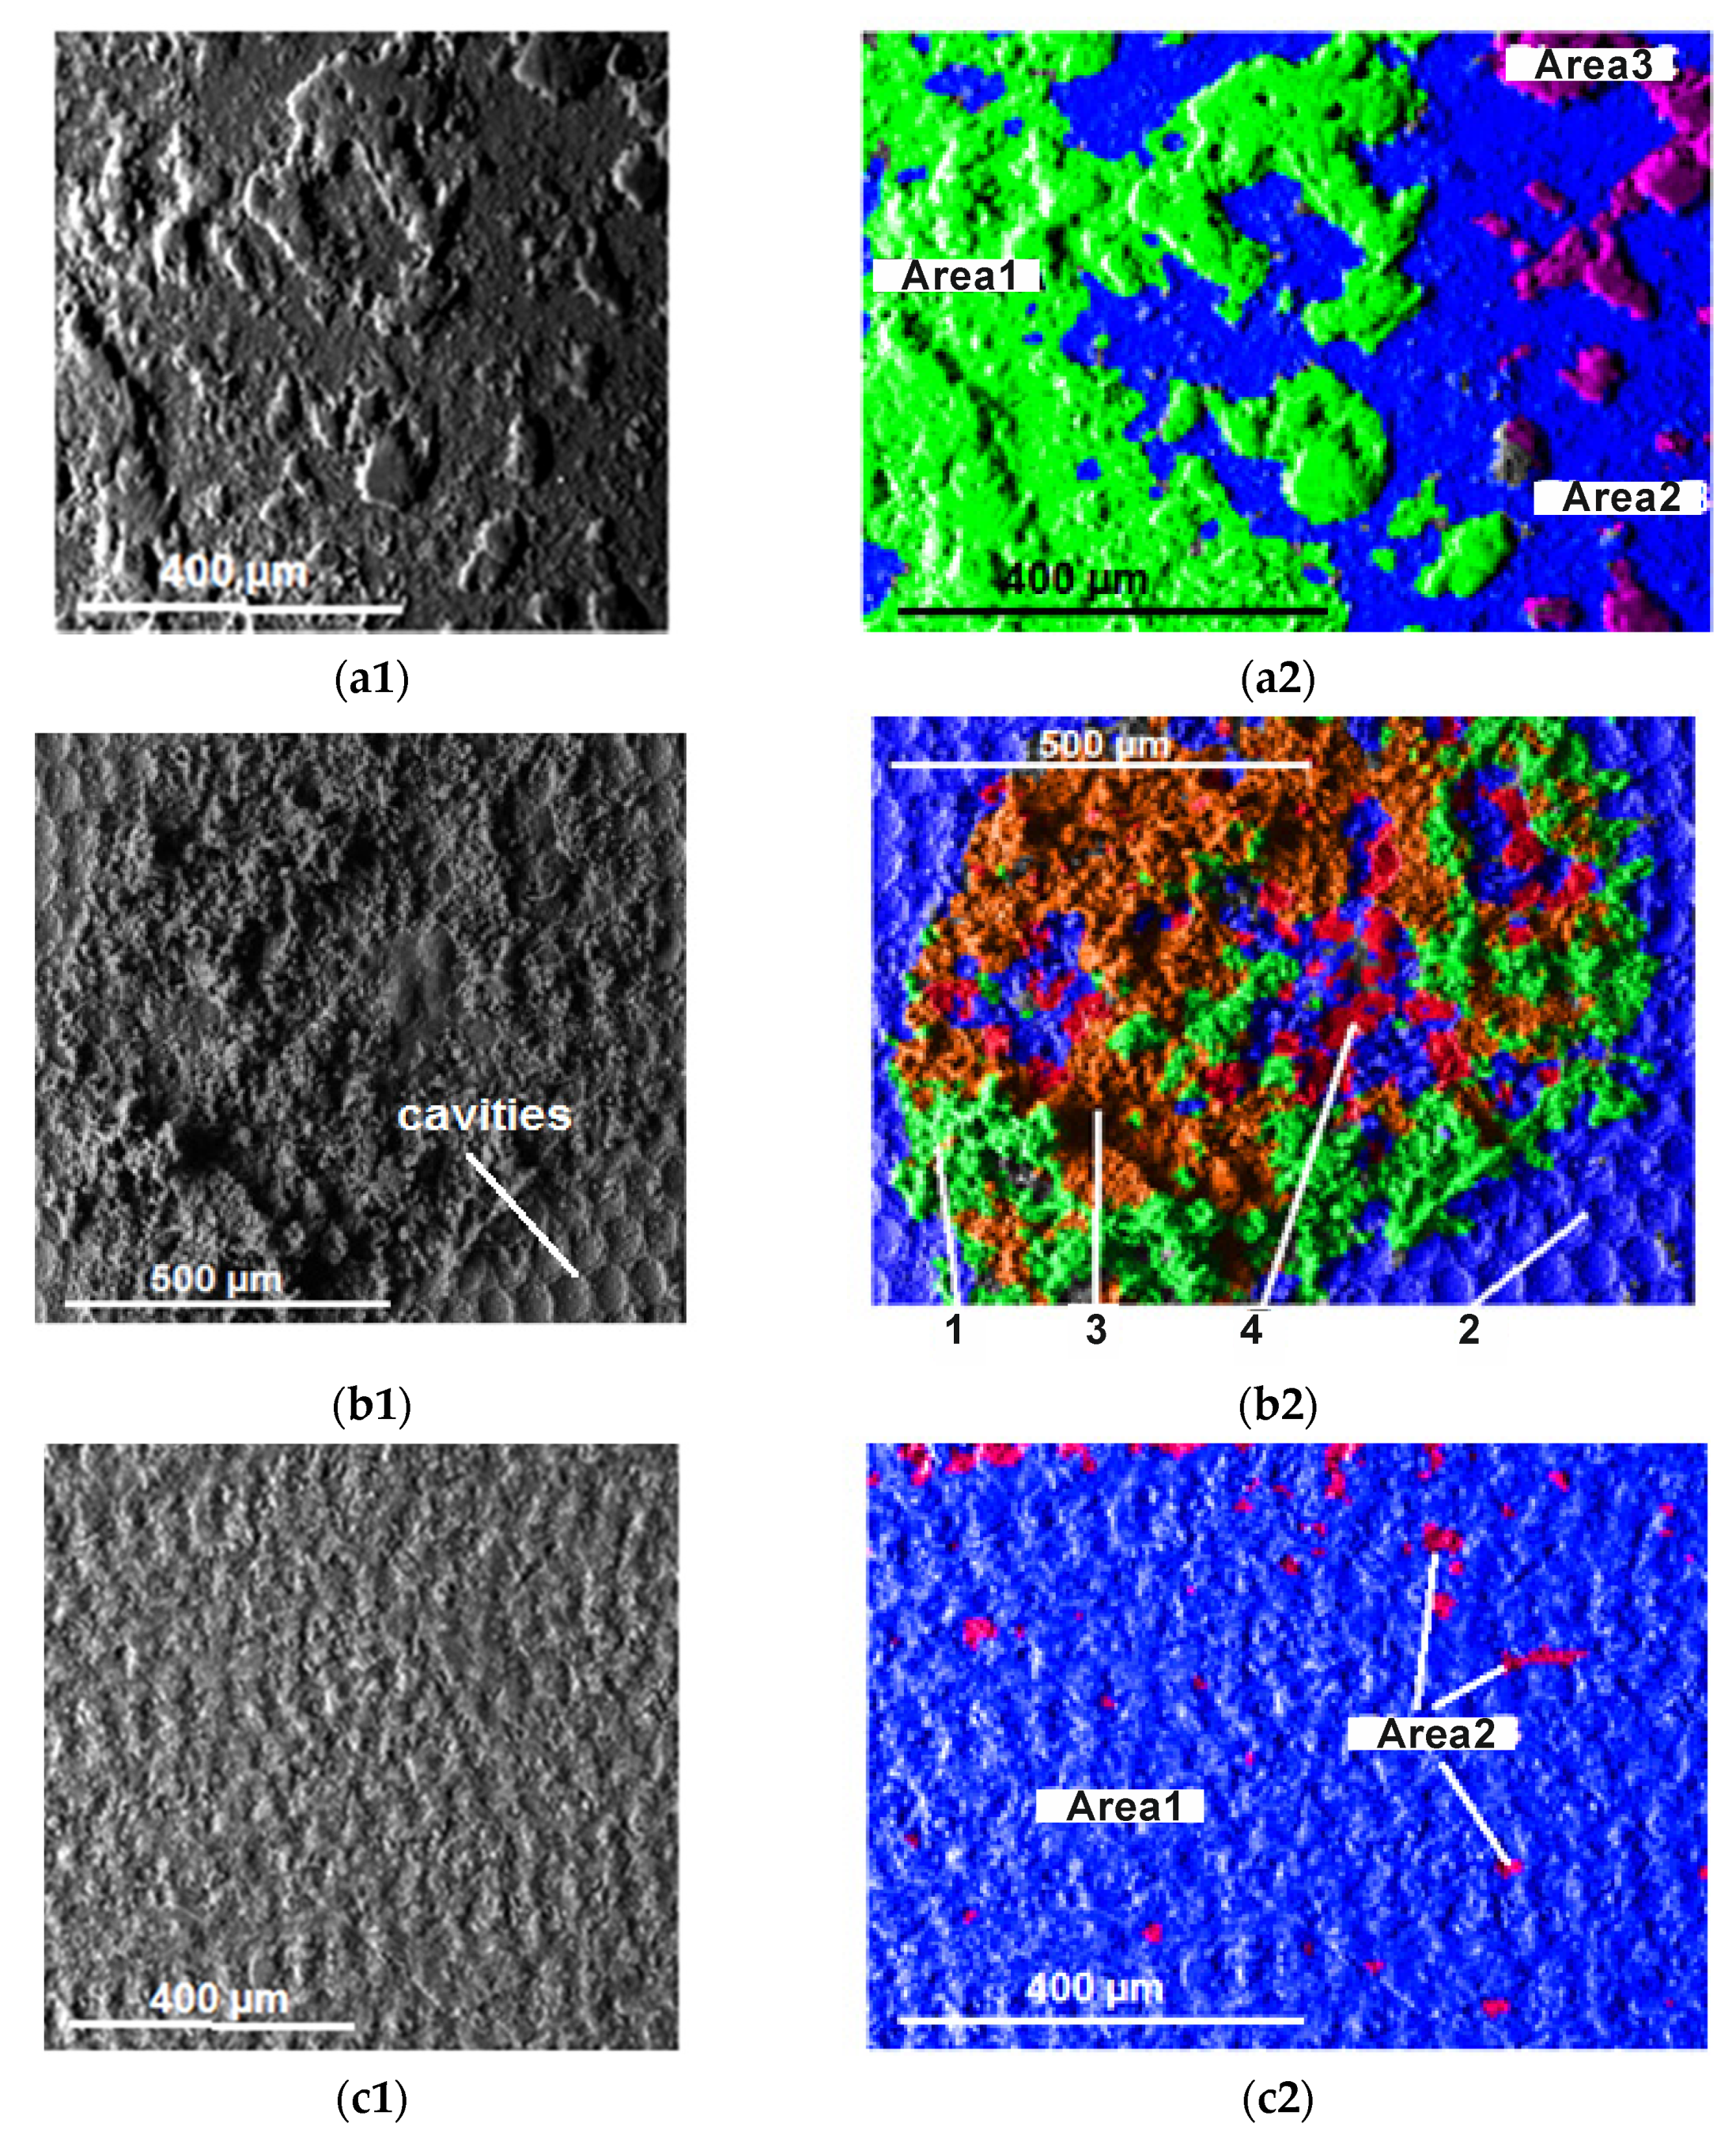
SEM photos of the surfaces are shown in Figure 4(a1,b1,c1). The entire surface corroded only for sample 1. It can be seen that the surface of sample 2 was not subjected to corrosive destruction, i.e., it retained its texture. For sample 4, the textures (cavities) were mostly destroyed due to corrosion. However, the given area (1 mm × 1 mm) was only a small part of the total corrosion surface (d = 20 mm). On the rest of the surface, the shape of the cavities was preserved.
Figure 4(a2,b2,c2) shows the EDS mapping data. Table 2 presents the distribution of the different areas. Table 3 gives the component compositions of the corrosion products.
It is characteristic that for sample 1, there was a rather high content of NaCl salt on the surface (despite careful washing of the surface). There was also a noticeable salt content for area 1 (sample 4, superhydrophilic). A low salt content was specific for sample 2 with the texture remaining almost intact (unmodified by corrosion).
The high salt content in these areas is associated with more favorable conditions for crystallization. It is known that the induction period of crystallization on superhydrophobic textured surfaces is much longer than on hydrophilic surfaces [32]. The hydrophobic sample 2, after laser texturing, had a porous surface structure with a very low pore diameter.
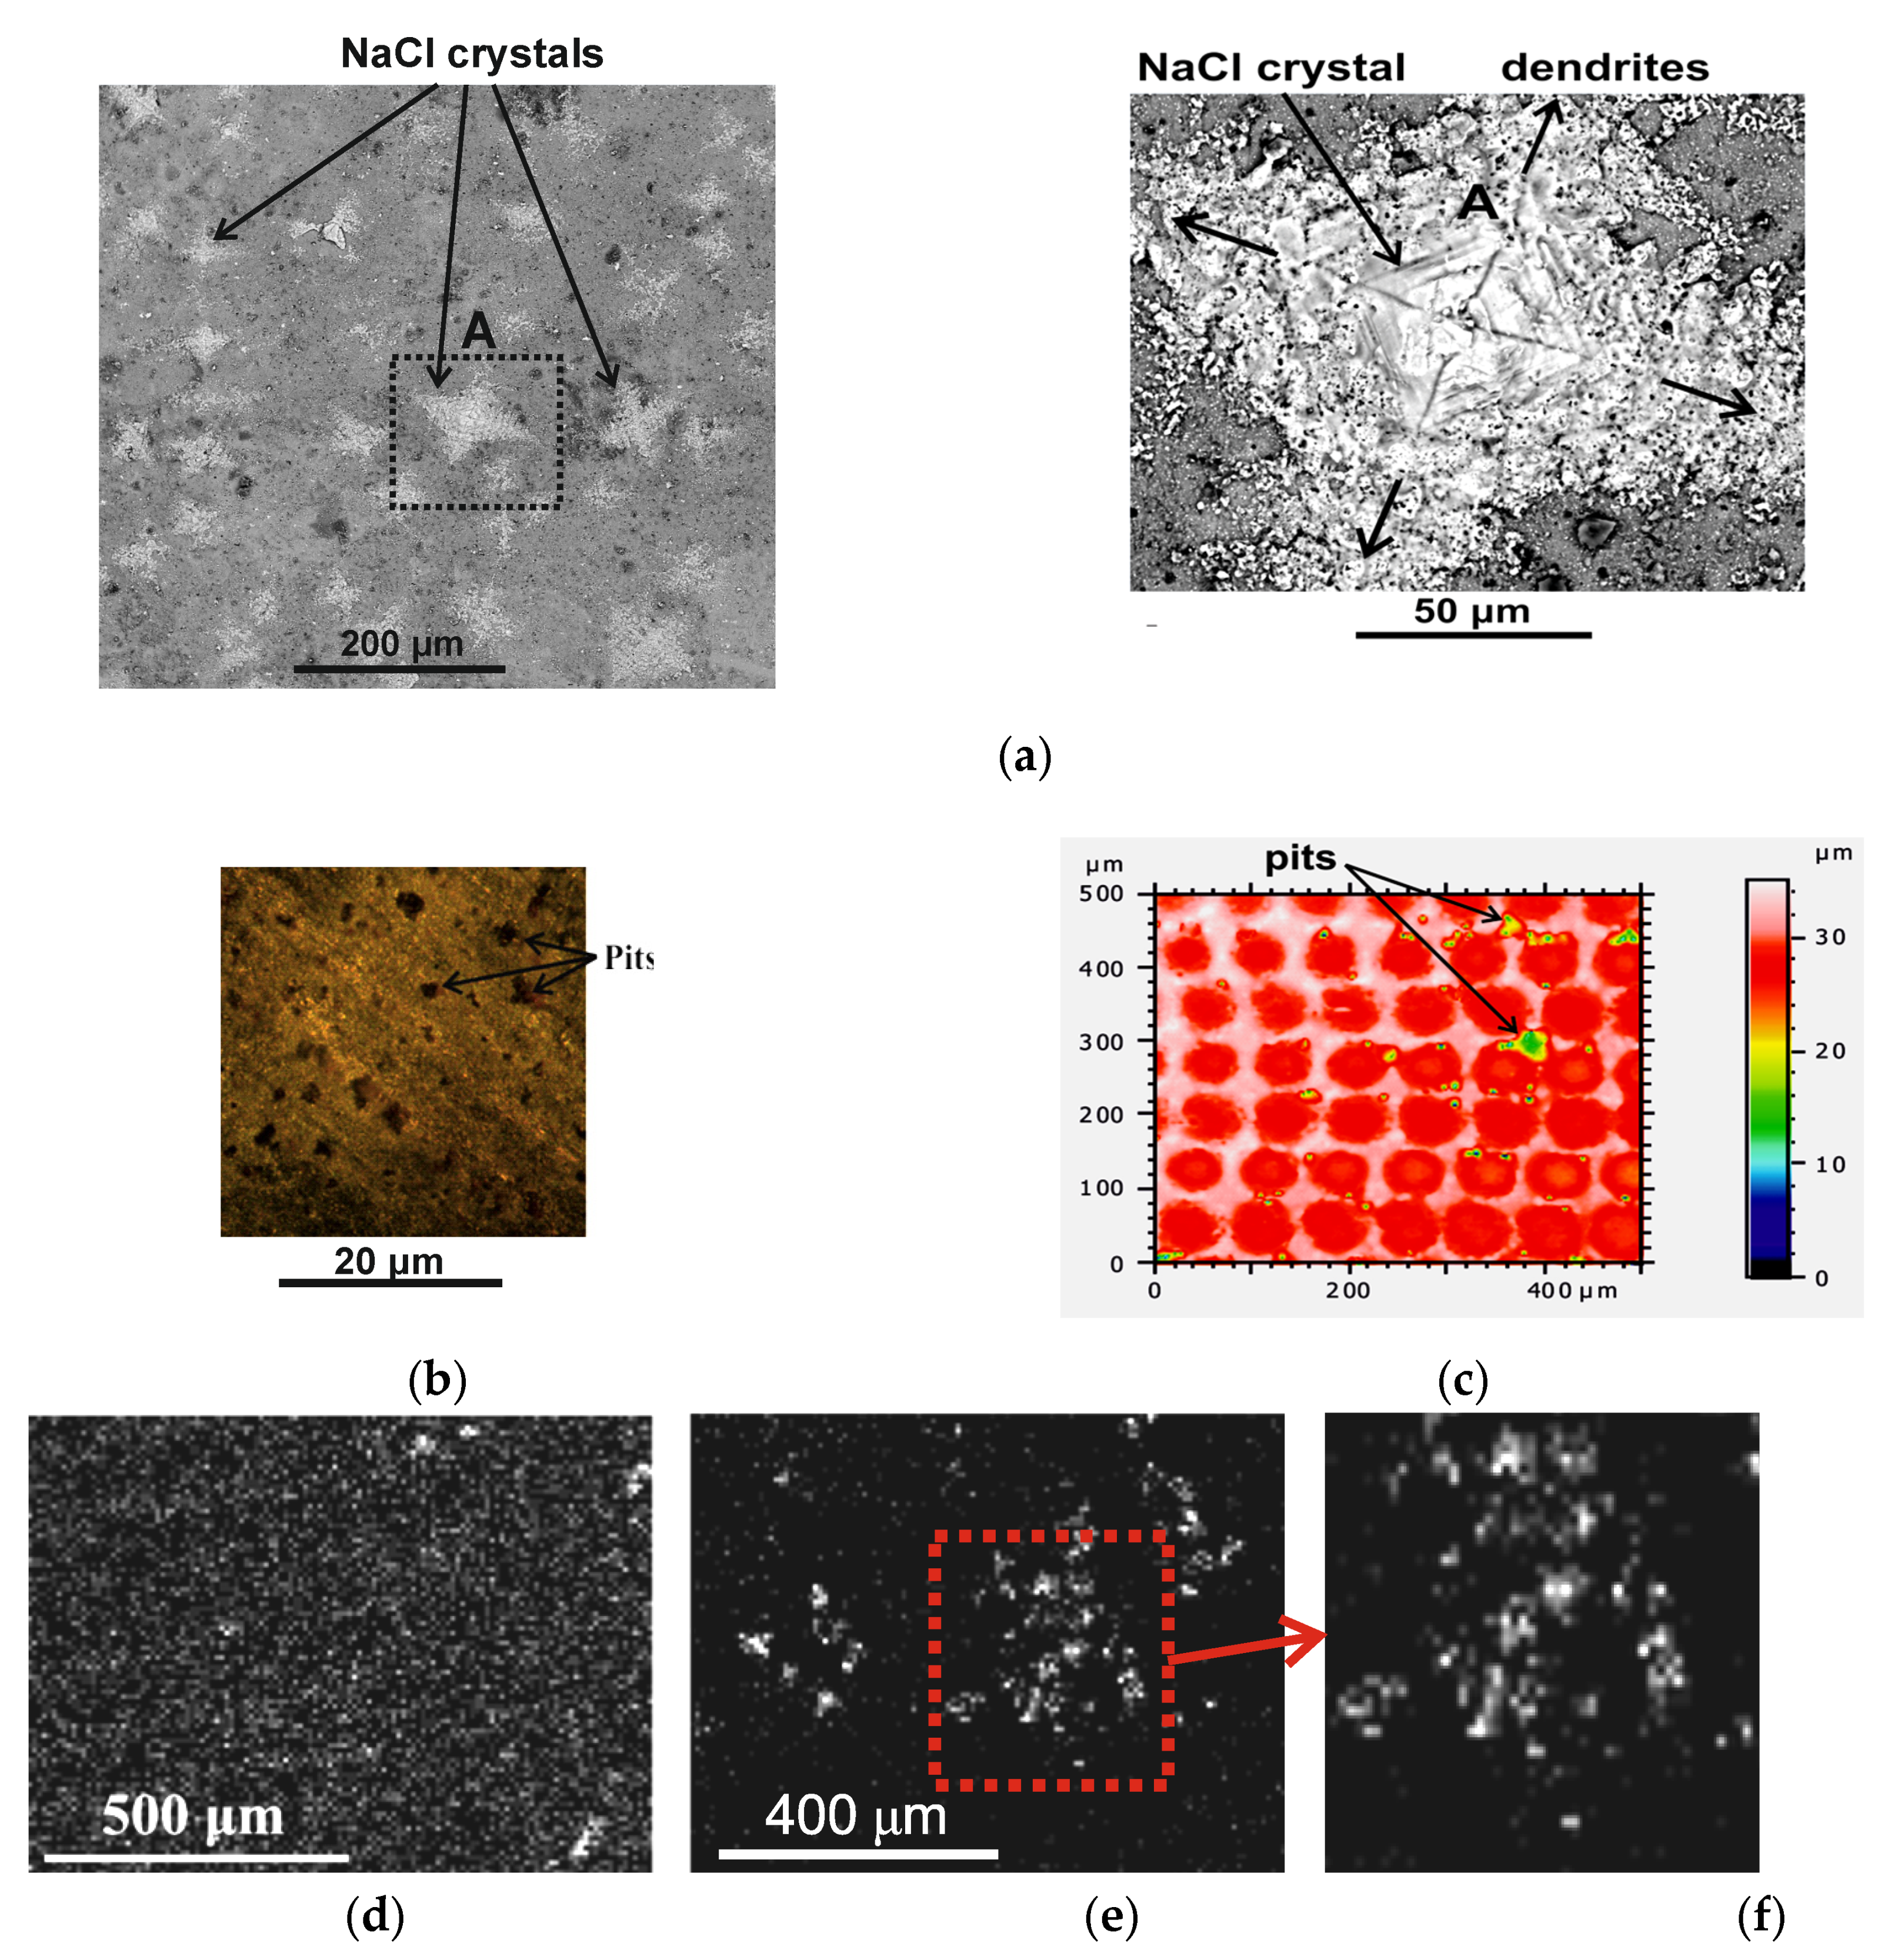
On the surface of samples 1 and 4, there were many active crystallization centers around which crystals were growing (Figure 5a (on the left)). Corrosion of samples 1 and 4 led to an increase in hydrophilicity, especially in areas of intense corrosion, which contributed to crystallization. The contact angle of the droplet decreased with increasing time of exposure to an aggressive solution. Figure 5a (on the right) shows an enlarged photo of a salt crystal. Dendrites were growing from the crystal vertices both in the direction of the axes and in the perpendicular direction. The EDS mapping (the elemental composition after corrosion) in Figure 5 corresponds to Figure 4 and Table 2 and Table 3.
It follows from Table 3 that for the major part of the surface of sample 2 (area 1), the stoichiometric ratio of aluminum oxide Al2O3 was obtained with high accuracy (deviation of less than 0.1%). For area 2 of this sample (as a result of corrosion), the oxygen content exceeded the stoichiometric ratio by almost two times. Thus, even for the surface with very low wettability, there were local defective areas with high rates of corrosion. However, these active corrosion centers were localized and practically did not expand over time.
For the superhydrophilic sample 4, as well as for the smooth surface 1, the corrosive areas expanded rapidly (not localized on the surface). Figure 5b shows photos of pits on the surface of sample 1. Visually, it may be inferred that there was an absence of corrosion for area 2 of sample 4 (superhydrophilic surface). However, a violation of the stoichiometric ratio for Al2O3 by about 4%–5% indicates that this area was also partially susceptible to corrosion. The maximum corrosion rate and the maximum deviation from stoichiometry (almost five times) of the composition of Al2O3 can also be observed for area 3 (sample 4). In this area, a high concentration of pits led to rapid destruction of the metal surface. The adsorption of hydrocarbons from the air on the metal surface led to a decrease in wettability.
From Figure 5c, it can be seen that all corrosion areas (pits) were concentrated at the edges of cavities and between cavities (the green areas had a depth of pits of the order of 20 µm, which was ten times higher than the surface roughness). At these points, there were no pits inside the cavities themselves. There may be two reasons for this corrosive behavior. The laser affected the space inside the cavity, but in practical terms, did not melt the material between the cavities. A thick oxide layer protecting against corrosion may not have formed between the cavities. In addition, the metal ejected from the cavities formed elevations at the edges of the cavity (along its circumference). With rapid crystallization (when the metal cools), this thick layer may have formed deep cracks. Further studies of this process are needed. It is also important to recall that this corrosive behavior is characteristic only for a sample that has been corroded immediately after laser texturing. In this case, there was a very high surface energy contributing to the chemical reaction. One more important contradiction can also be noted. Experimental data show that the adsorption of hydrocarbons, leading to a change in wetting modes, was realized on a smooth wall for about one hour and then the contact angle did not change [60]. Based on the simulation results, it may be assumed that 3–4 adsorbed molecular layers were already sufficient for external molecules (for example, hydrocarbon molecules) to cease interaction with the metal wall [60]. It is well known that after laser texturing, the wettability changes within weeks or months. It is likely that these long-term changes in wettability are associated with nano-microporosity, with a recrystallization of the surface layer, with the diffusion of hydrocarbons inside the pores (hydrocarbons adsorbed from the air), as well as with the diffusion of hydrophobic impurities inside the textured surface layer of the metal.
This specific corrosion behavior for sample 2 is probably related to its surface nano-micro porous structure. It is interesting to note that the hydrophobic sample 2 for areas 1 and 2 shows (Figure 5c) a relatively high carbon content, which was probably due to the presence of a highly porous surface layer of the hydrocarbons’ contaminants (on the metal surface, there were carbon atoms with C-H (CC-H) bonds, the C-O group (CC-O) and the carbonate group (C2-CO3)) [61]. Carbon distribution was uniform over the entire surface of the sample. Only in some local places was there an increased content of C compared to the average composition on the surface (Figure 5c). However, area 2 of the hydrophilic sample 4 does not show the presence of carbon, which may be associated with a very low C content on the surface of cavities that did not have a branched hierarchical pore structure (smooth surface inside the cavity). As a result, the resolution of the device did not allow the determination of carbon. However, intense corrosion (area 4 of sample 4) resulted in a local porous surface. After corrosion, the samples were dried from the solution and were exposed to the open air for a long time, which led to the formation of a surface layer of the hydrocarbons’ contaminants. Due to the porous structure of the material after corrosion, relatively high carbon content (due to the enlarged pore surface) was well diagnosed by the EDS method. A photo of the carbon regions (white) is shown in Figure 5d,e. It is clearly seen that the carbon composition was extremely uneven on the surface, which was probably due to the highly uneven porosity of the reaction products after corrosion. An interesting feature is that the carbon concentration for the specified area 4 became much higher than for the porous surface of the hydrophobic sample 2. It is likely that the increase in the amount of carbon is associated not only with the porous nature, but also with the thickness of the surface film of the airborne contaminations. The thickness may have increased with the increasing of the hydrophilicity of the surface (the growth of intermolecular interaction), and may have also depended on the morphology of the textures of the film itself.
The chemical composition of aluminum–magnesium alloy (AlMg6) has the following chemical composition (wt.%): Al (91.3), Mg (6.6), Mn (0.9), Fe (0.4), Si (0.4), Zn (0.2), Ti (0.1), Cu (0.1)) correlating with the areas in Figure 4. Different elemental compositions on the surface of the samples may be associated with the nonuniform distribution of chemical elements, differences in the distribution of defects and roughness, and, accordingly, the nonuniform distribution of excess surface energy, as well as differences in the crystal structure (grain size and orientation). The nonuniformity of the surface concentration of salt may have been due to the uneven distribution of active crystallization centers, the presence of which is associated with most of the above factors. The maximum concentration of NaCl was specific for a smooth non-textured surface, since in this case, there was a high concentration of pits with local areas of high excess surface energy. Conversely, a textured hydrophobic sample would have low surface energy and practically no pits. Nano-micropores of the sample with low wettability were not filled with water and air pockets were formed, which also counteracted crystallization. It was previously shown that the hydrophobic coating leads to a significant deicing effect (the induction period of the onset of crystallization essentially increases) [30,31,32].
3.4. Electrochemical Properties of AlMg6 Alloy Surfaces
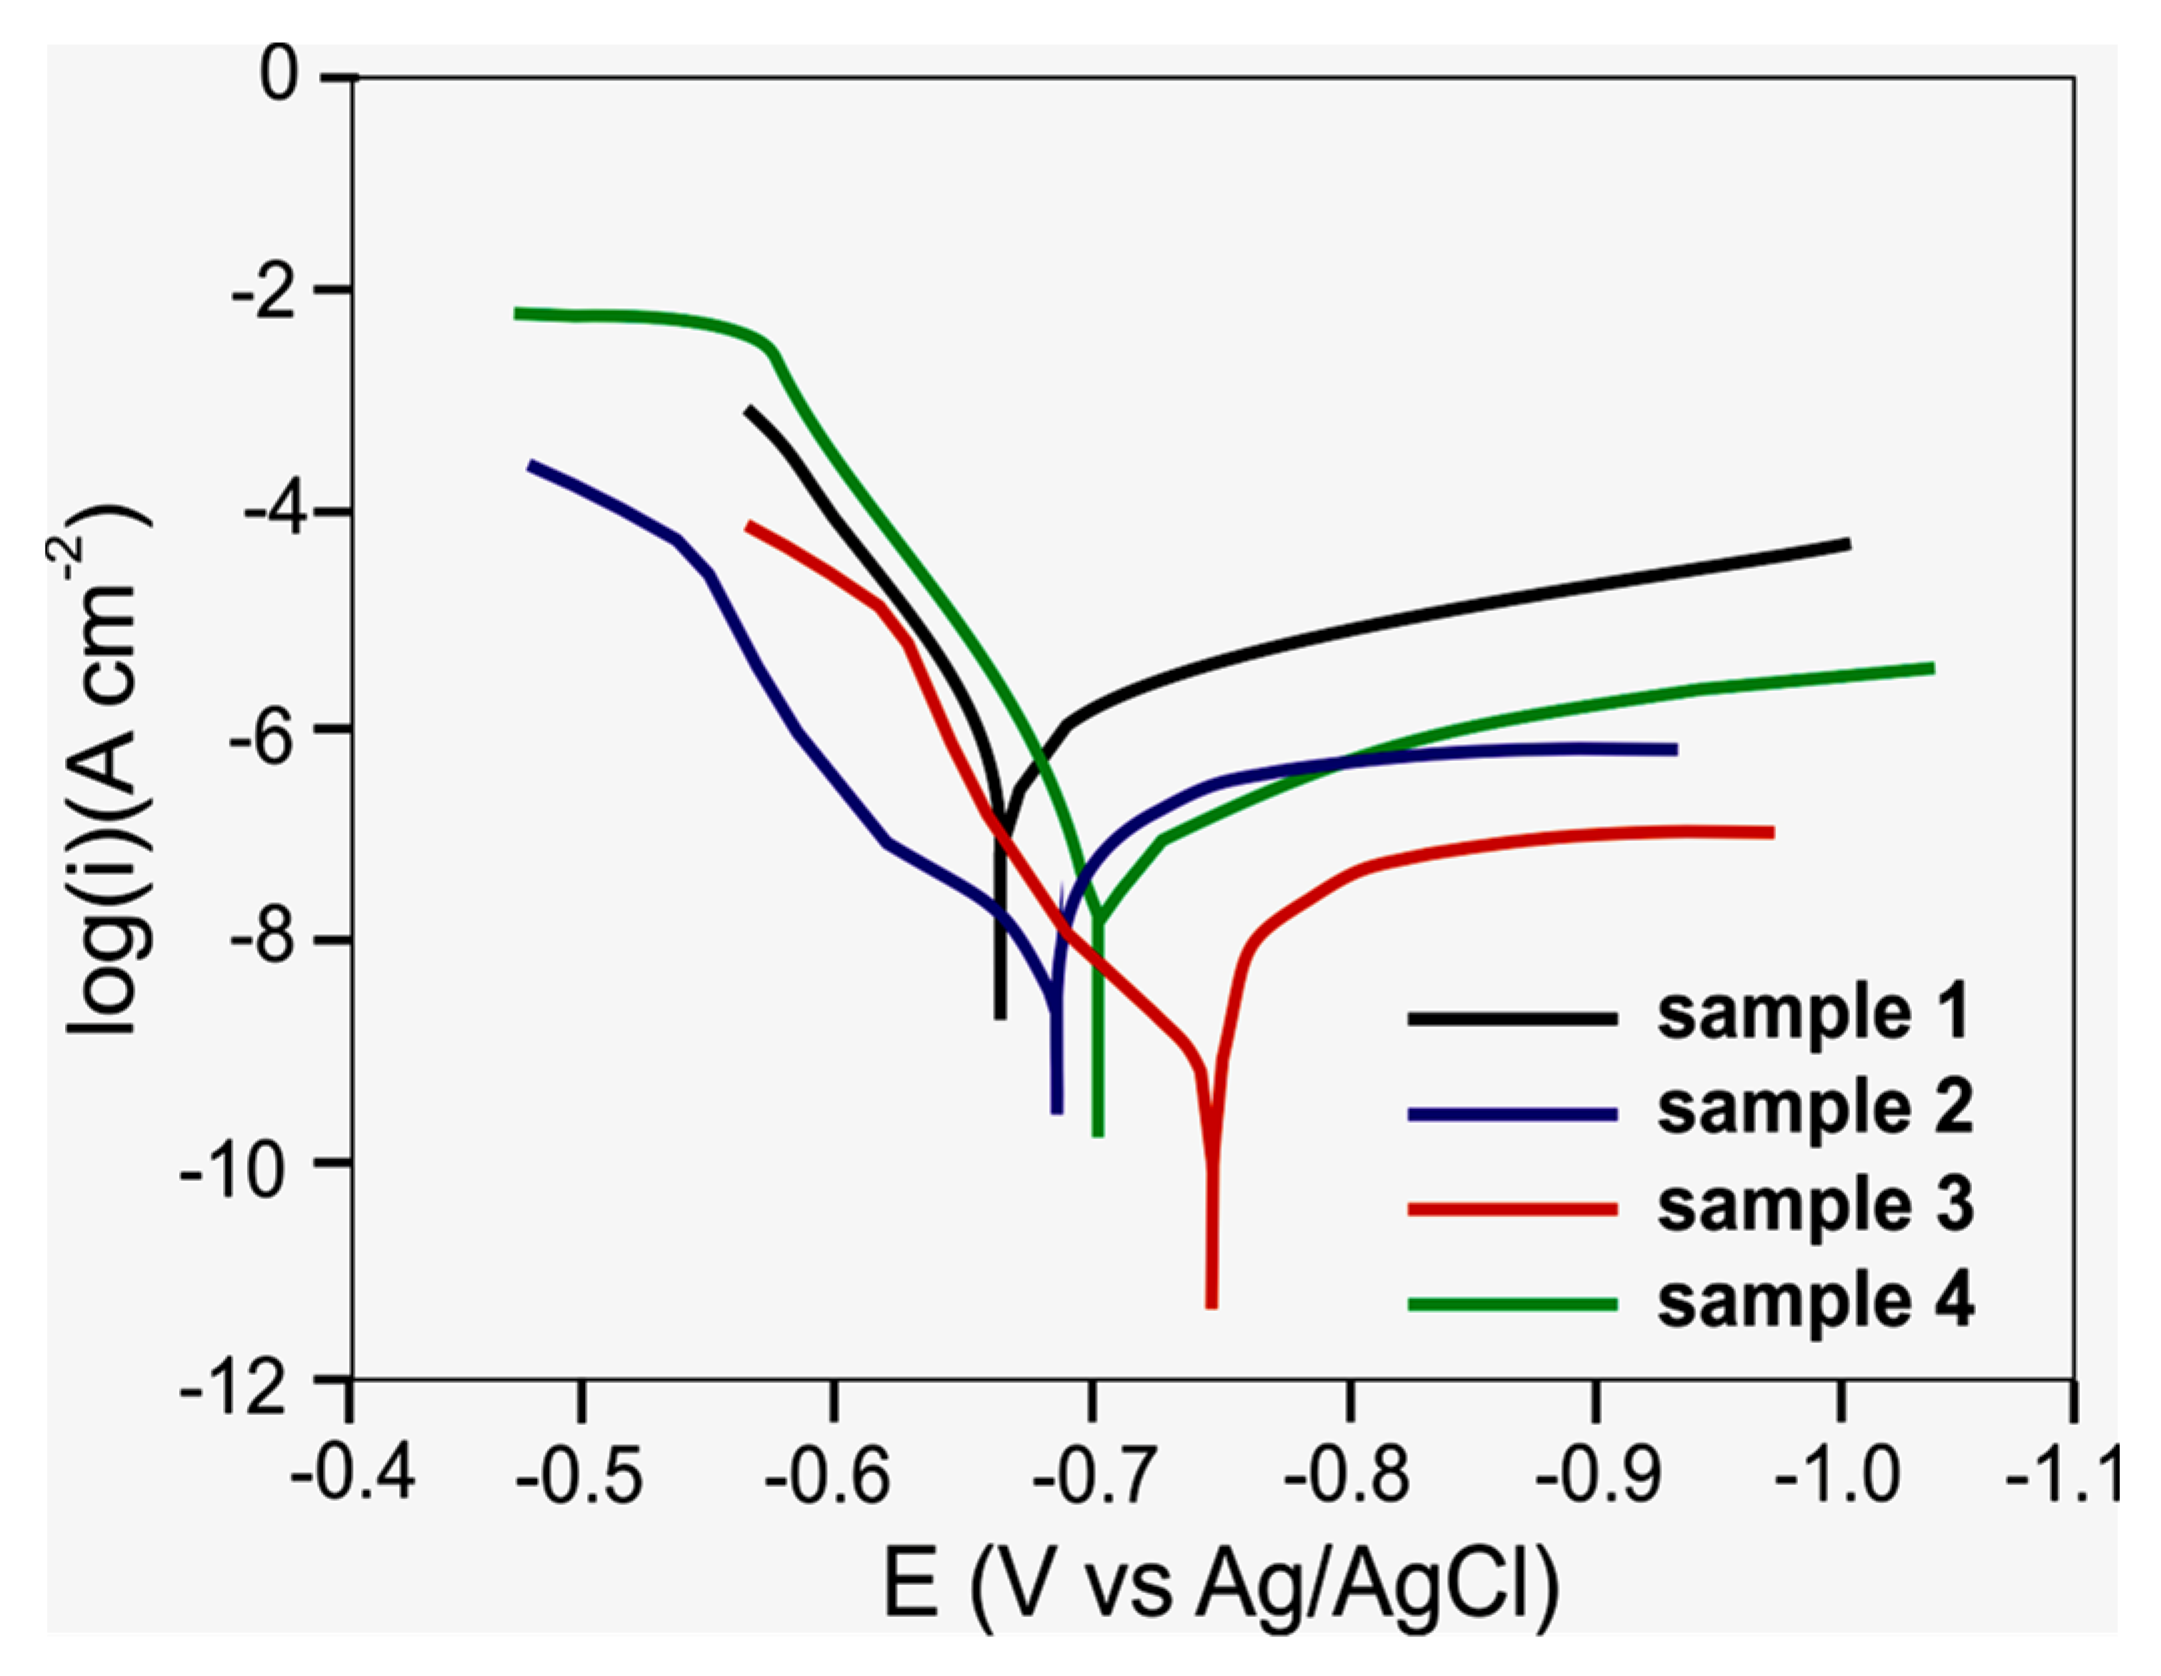
To obtain a corrosive current and a corrosive potential, the Tafel equation processing was used. The measurement results are shown in Figure 6, as well as in Table 4. The corrosion current was significantly higher for the polished sample 1 without laser texturing. The superhydrophilic textured sample 4 demonstrates a higher corrosion resistance than sample 1 (smooth surface), which corresponds to the known results of previous studies. However, the presence of a large number of pits (Figure 5b) led to a decrease in corrosion resistance. Moreover, defects were localized in some places of the surface (area 2, Figure 4b2, Table 4). In other places, pits grew and large areas of intense corrosion appeared (areas 1, 3 and 4, Figure 4(b2), Table 4).
The hydrophobic surface shows a significantly lower corrosion current compared to the hydrophilic wall. It follows from previous works that after laser texturing, the hydrophilic properties turned into hydrophobic ones. The change of the wetting mode (from several weeks to months) was associated with the adsorption of airborne contaminants. Thus, the hydrophobic layer of the hydrocarbons played a protective anticorrosive role. Moreover, the maximum corrosion resistance was realized with multiple laser penetration and was associated with both the porous structure of the surface and the high content of hydrocarbons in the surface layer (areas 1 and 2, Figure 4(c2), Table 4). It should also be noted that the specified layer of hydrocarbons was quite resistant to external influences and was removed at temperatures of about 400 °C.
3.5. Effect of Corrosion on the Droplet Wetting Diameter
Droplet evaporation kinetics depends on wettability and the mode of the droplet contact line. For most practical examples, the evaporation mode of sessile droplets is characterized as either the constant contact radius (the CCR mode) or the constant contact angle (the CCA mode). However, for poly(ethylene oxide) (PEO) polymer solutions, blood, binary liquids and colloidal suspensions for a suspension, two other modes can be realized where the contact line speed is either constant or inversely proportional to the droplet radius [62]. The receding radius speed is inversely proportional to the three-phase contact radius R, with a constant of proportionality a, which is dependent on the drying conditions and a droplet shape, but independent of a droplet volume. The evaporation dynamics of multicomponent droplets on a heated chemical patterned surface were presented in Ref. [63]. In this work, the mechanism of the stepwise movement of the contact line in the moving contact line regime was investigated. The location of the pattern (microrelief shape) was found to affect the droplet evaporation in Ref. [64]. In this work, the parameter of “eccentricity” was proposed. The eccentricity quantitatively characterized the location of micro-holes. The contact angle hysteresis and the droplet evaporation were characterized by the eccentricity.
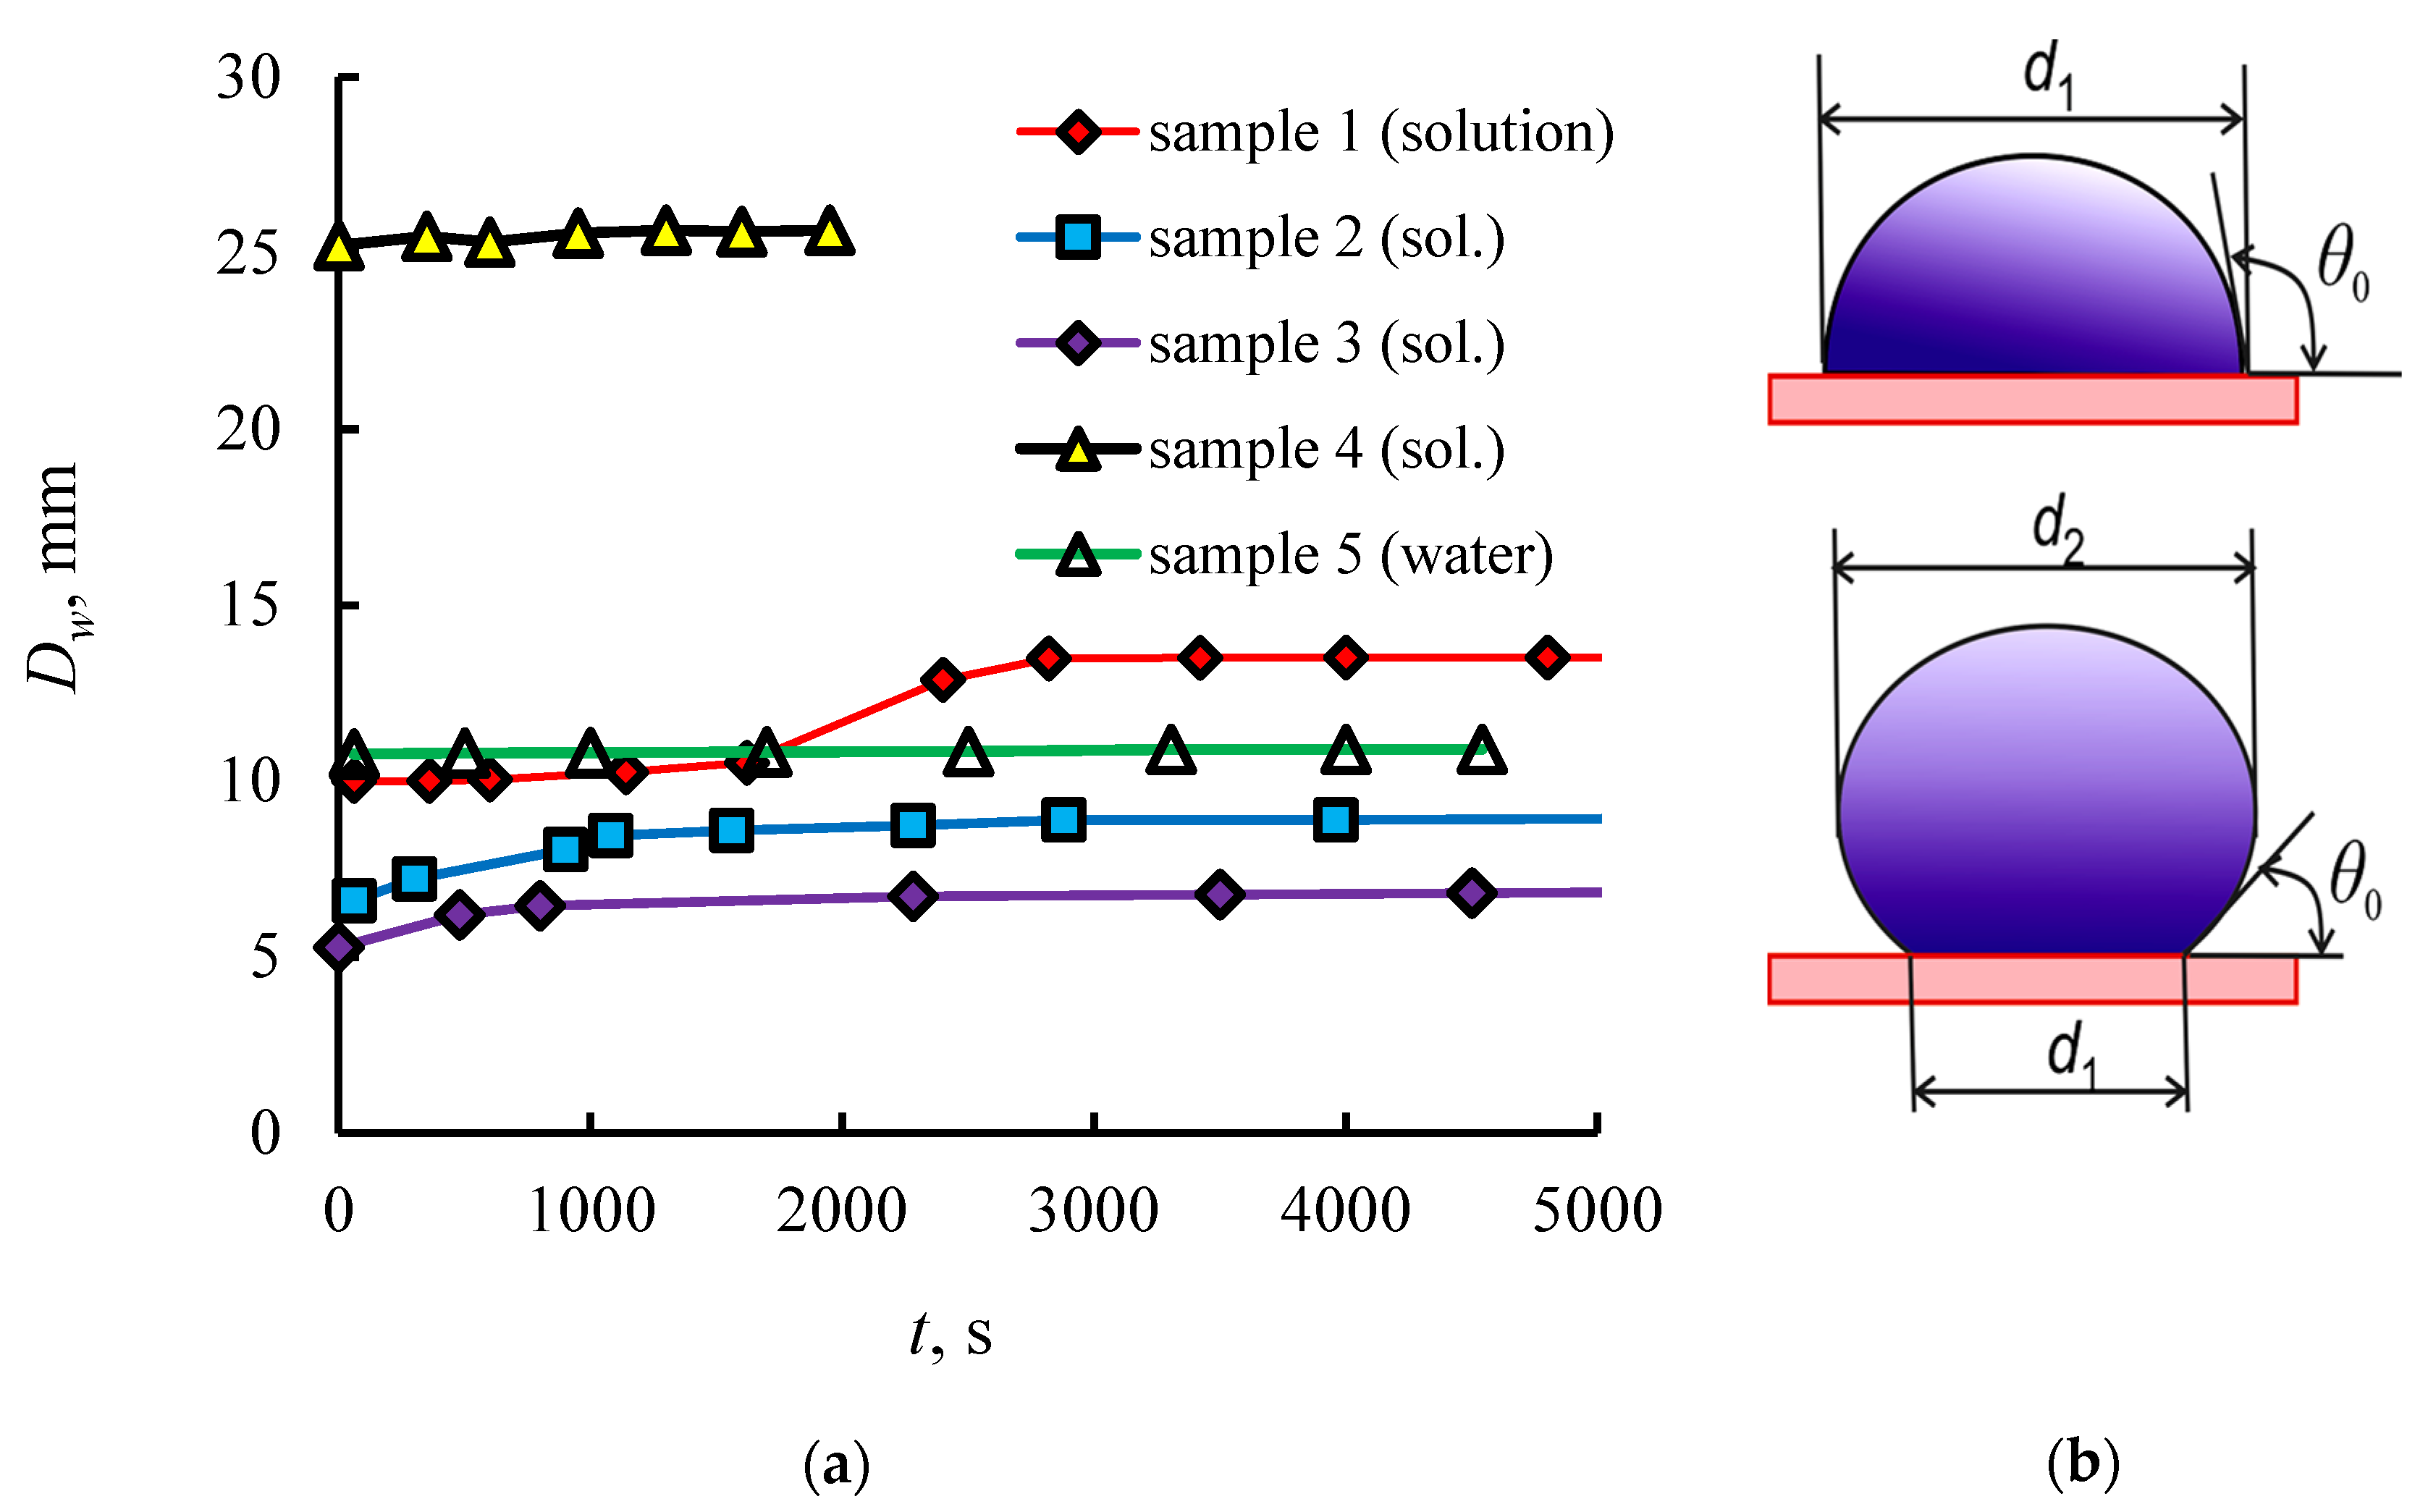
Modes of behavior of the droplet contact line during corrosion were insufficiently studied previously and are of technical interest. The experimental results in this study demonstrate that during the initial evaporation period, the droplet diameter increased and then stabilized around a certain equilibrium value (the CCR mode) (Figure 7). At this point, the wettability of the wall in the vicinity of the contact line of a droplet would change, and the surface tension of the salt solution would decrease. The droplet-wetted diameter was found to be a function of the corrosion rate (Jcor) and the parameter U, i.e., Dw = f(Jcor, U), where U is the energy barrier of the triple contact line [65]. At a high corrosion rate, the parameter U decreased and the equilibrium diameter increased (the first time mode in Figure 7a). If the corrosion rate was very low and U was high, then the CCR mode with Dw = const would have been implemented (the second time mode). The attachment of the droplet contact line is associated with crystallization in the vicinity of the contact line. The maximum diameter growth over time corresponds to a smooth wall (curve 1). In this case, the maximum corrosion current was realized (Table 4), i.e., there was a maximum rate of chemical reaction. For textured surfaces, the corrosion current decreased significantly and the diameter became quasi-constant. The wetting mode for samples 1 and 4 corresponds to Wenzel’s law, and for samples 2 and 3, it corresponds to the Cassie–Baxter law.
3.6. The Droplet Rate Evaporation and the Evaporative Heat Flux during Corrosion
In experiments with evaporation of a water droplet on a smooth wall (curve 5), the wetted droplet diameter was constant. The dependence of the evaporation rate on the droplet radius Rw and the contact angle θ for θ < 20–30° can be represented as Equation (5) [52,53,54], where ∆ρ = ρs − ρa, ρs is the equilibrium water vapor density, ρa is the water vapor density in external air and D is the vapor diffusion coefficient.
Jev = ∆m/∆t = −Rw Df(θ)∆ρ ≈ −4RwD∆ρ
For large-diameter drops (the drop diameter over 10 mm), one may also neglect the change in θ and use Equation (5).
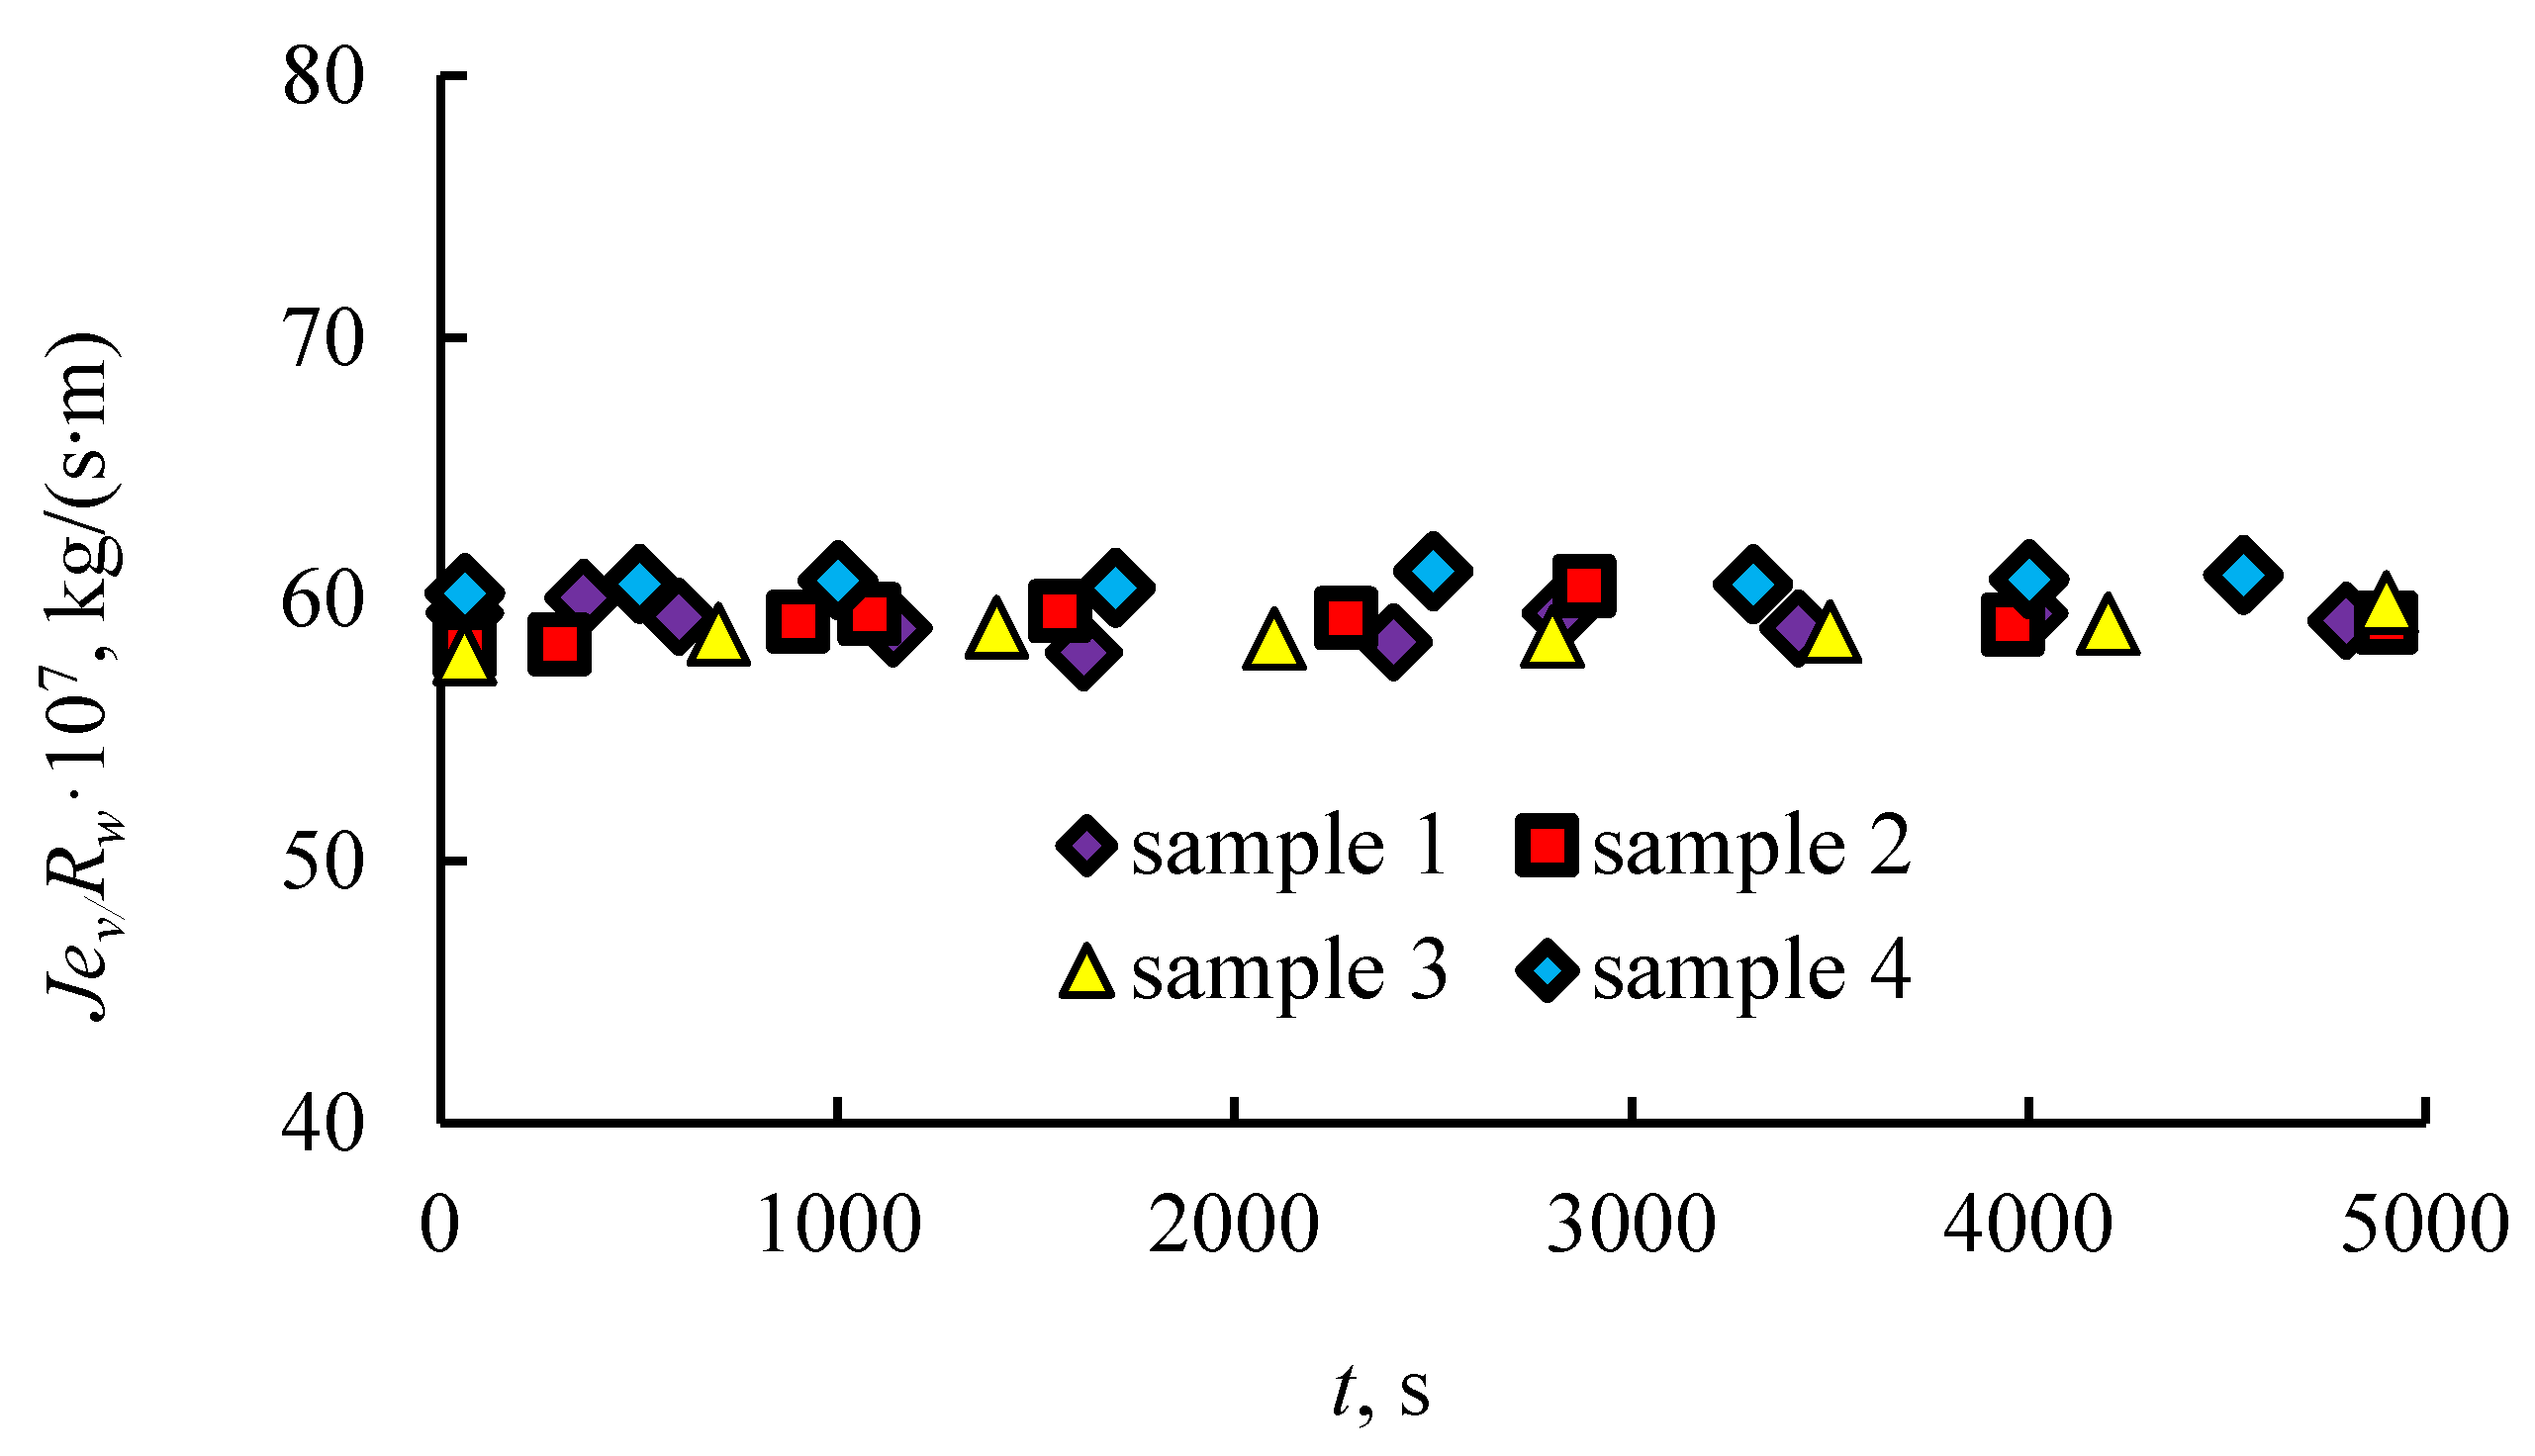
From Equation (5) it follows that with an increase in the droplet diameter, the Jev increases. To exclude the influence of the droplet diameter, let us divide the current value of the evaporation rate by the current radius Rw (Equation (6)).
Jev/Rw = −4D(ρs − ρa)
Figure 8 shows the experimental results in the form of Jev/Rw dependence on t. As can be seen from the graph, the experimental curves for different samples, for both textured and smooth surfaces, were satisfactorily generalized in Equation (6). At this point, for the hydrophilic wetting, Dw corresponded to d1 (the wetted droplet diameter, Figure 7b). In the hydrophobic mode of wetting, Dw corresponded to d2 (the maximum droplet diameter).
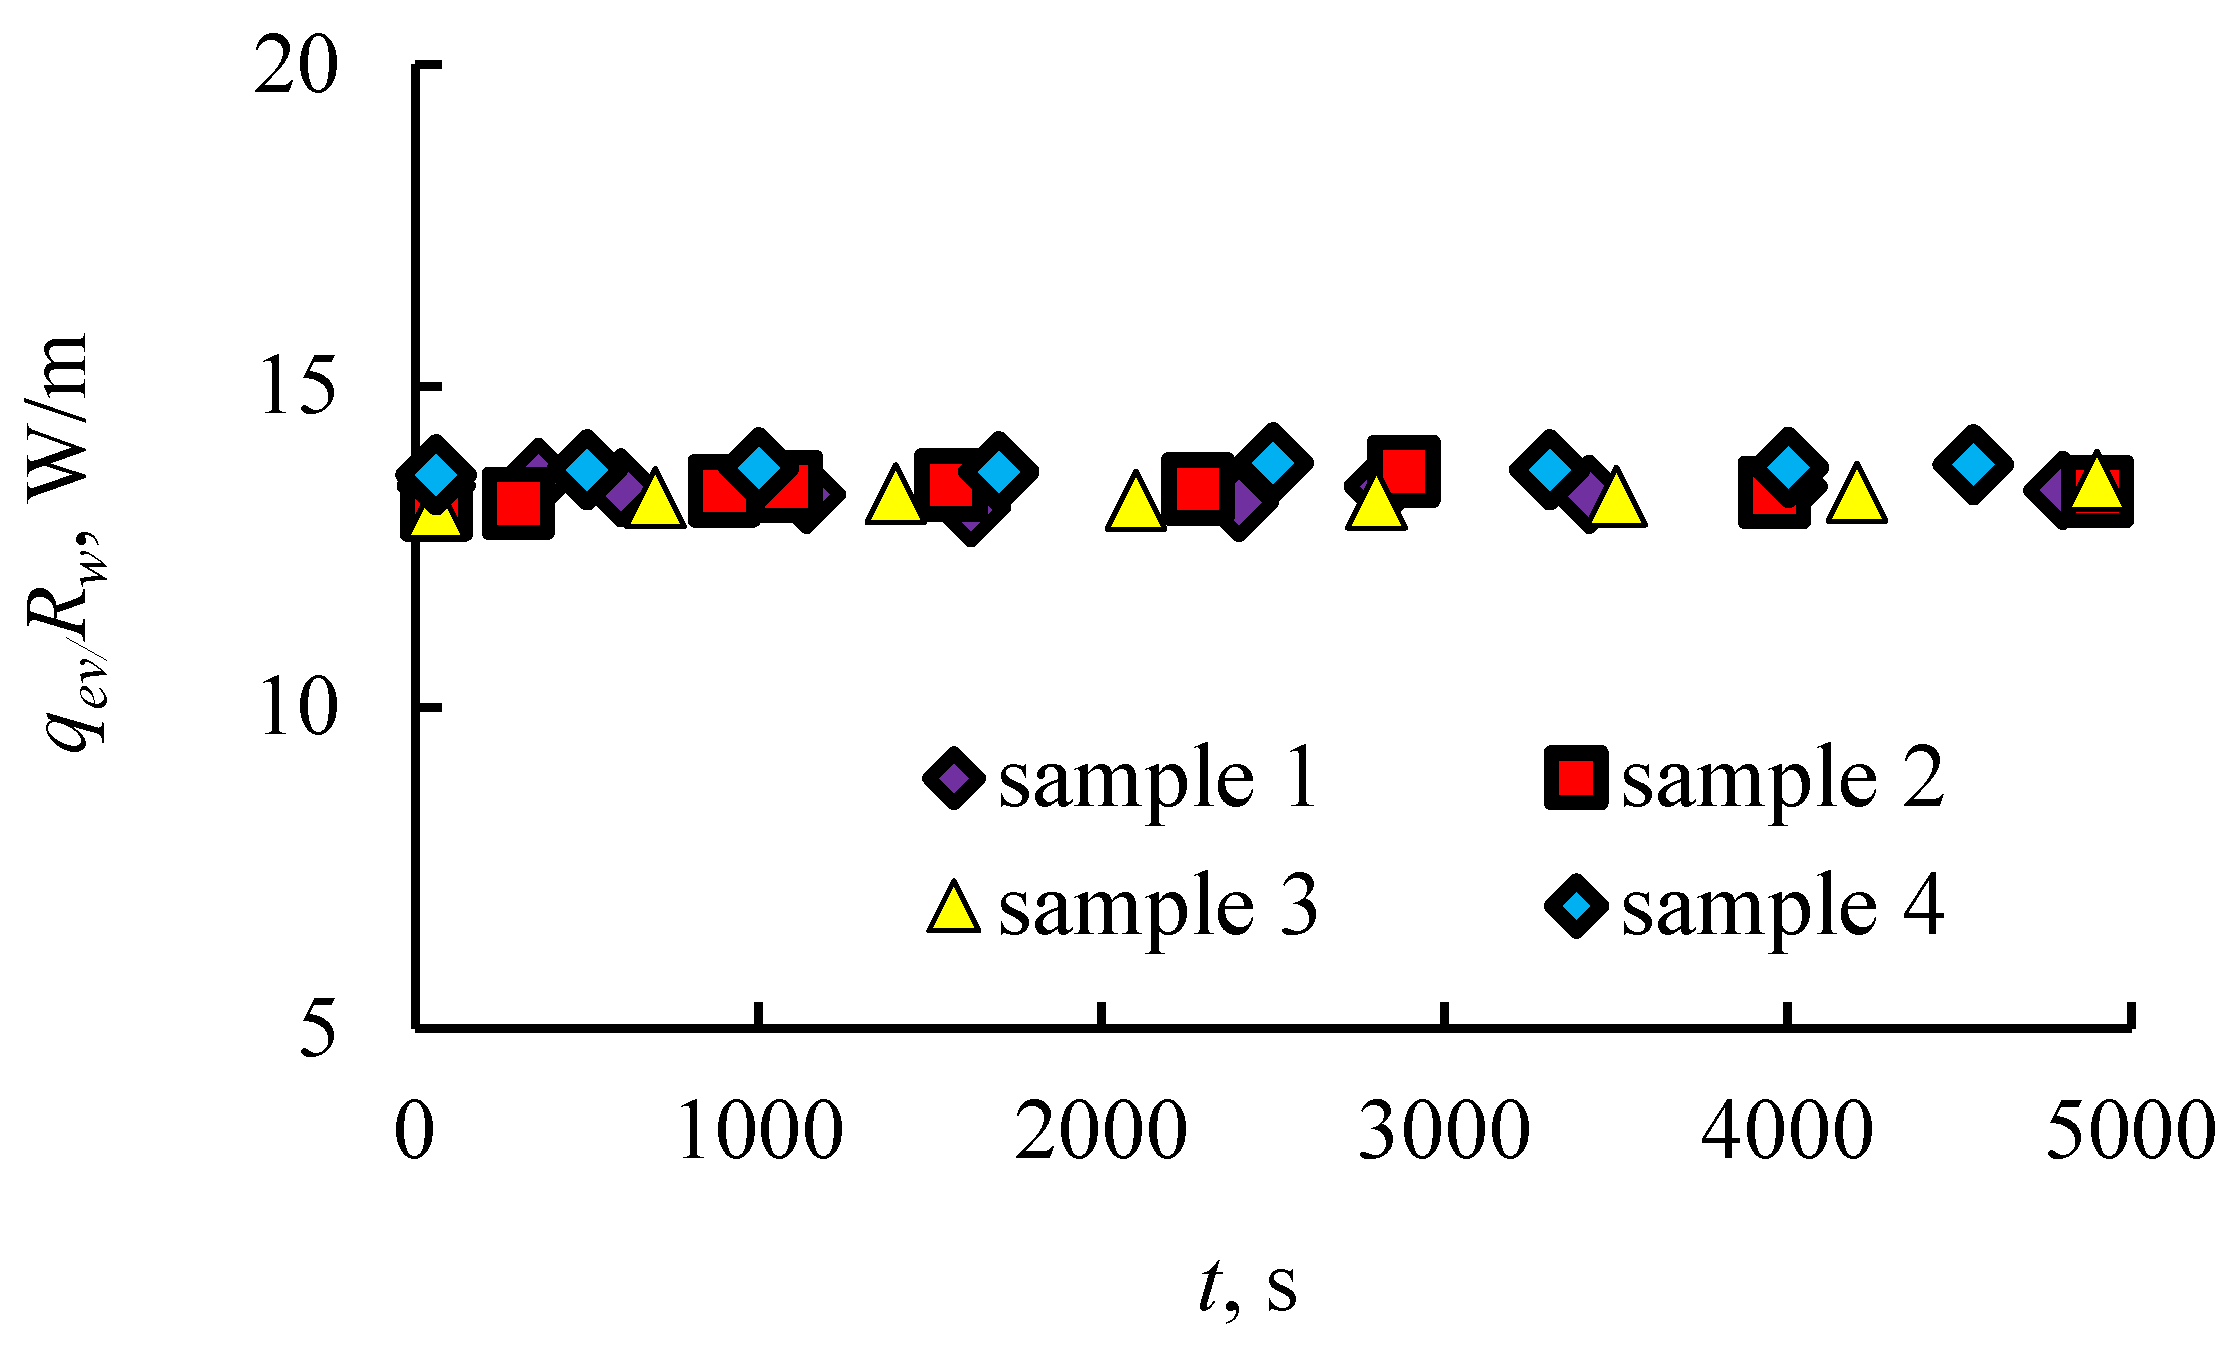
The rate of evaporation led to liquid cooling and to the creation of a temperature difference between the wall and the droplet interface. As a result of evaporation, the heat flux of evaporation (qev) was formed. The heat flux qev was directed from the wall to the liquid (qev = Jevr, where r is the specific heat of water evaporation).
Figure 9 shows the experimental results in the form of the qev/Rw dependence on t. Equation (7) shows the dependence of the evaporation heat flux.
qev/Rw = −4rD(ρs − ρa)
When dividing qev by the current value of the droplet radius, the experimental results ceased to depend on the kinetics of corrosion. Thus, in order to predict the evaporation rate and the heat flux of the droplet in the presence of corrosion, it was necessary to determine the nature of the dependence of the droplet diameter on a smooth and textured surface on the corrosion current. The corrosion current varied greatly during the transition from a superhydrophilic to a superhydrophobic surface and affected the equilibrium value of the contact angle of the droplet in different ways.
4. Conclusions
The corrosion behavior of aluminum–magnesium alloy (AlMg6), as a result of the action of a droplet of H2O/NaCl/H2O2 aqueous solution, was studied experimentally. The studies were performed both for a smooth non-textured wall and for hydrophilic and hydrophobic samples after laser texturing.
- The corrosive behavior depended on the droplet diameter. For large droplets, the kinetics of corrosion ceased to depend on the diameter.
- The aggressive effect of the H2O/NaCl/H2O2 solution led to an increase in the droplet base diameter on the smooth wall. As a result, the evaporation rate and the heat flux of evaporation increased over time.
- Adsorption of hydrocarbon impurities from the air after corrosion led to a different pattern of carbon distribution on the surface of hydrophobic and hydrophilic textured samples. Carbon was evenly distributed on the surface of the hydrophobic sample and was extremely inhomogeneously distributed for a hydrophilic textured surface.
- On the surface of a smooth (non-textured) wall and a hydrophilic (textured) one, there was an inhomogeneous distribution of NaCl salt (after corrosion). Some places showed a high concentration of salt due to the growth of salt crystals, which had the shape of dendrites.
Funding
This research received no external funding.
Institutional Review Board Statement
Not applicable.
Informed Consent Statement
Not applicable.
Acknowledgments
This work was carried out within the framework of the state assignment for the IT SB RAS.
Conflicts of Interest
The author declares no conflict of interest.
References
- Shahidzadeh, N.; Desarnaud, J. Damage in porous media: Role of the kinetics of salt (re)crystallization. Eur. Phys. J. Appl. Phys. 2012, 60, 24205. [Google Scholar] [CrossRef]
- Carreón, Y.J.P.; Ríos-Ramírez, M.; Moctezuma, R.E.; Gonzalez-Gutierrez, J. Texture analysis of protein deposits produced by droplet evaporation. Sci. Rep. 2018, 8, 9580. [Google Scholar] [CrossRef] [Green Version]
- Filkova, I.; Mujumdar, A.S. Industrial Spray Drying Systems. In Handbook of Industrial Drying, 2nd ed.; Mujumdar, A.S., Ed.; Marcel Dekker, Inc.: New York, NY, USA, 1995; pp. 263–308. [Google Scholar]
- Chakraborty, S.; Rosen, M.A.; MacDonald, B.D. Analysis and feasibility of an evaporative cooling system with diffusion-based sessile droplet evaporation for cooling microprocessors. Appl. Therm. Eng. 2017, 125, 104–110. [Google Scholar] [CrossRef]
- Singh, M.; Haverinen, H.M.; Dhagat, P.; Jabbour, G.E. Inkjet Printing—Process and Its Applications. Adv. Mater. 2010, 22, 673–685. [Google Scholar] [CrossRef] [PubMed]
- Marin, A.G.; Gelderblom, H.; Lohse, D.; Snoeijer, J.H. Order-to-disorder transition in ring-shaped colloidal stains. Phys. Rev. Lett. 2011, 107, 085502. [Google Scholar] [CrossRef] [Green Version]
- Wachters, L.H.J.; Westerling, N.A.J. The heat transfer from a hot wall to impinging water drops in the spheroidal state. Chem. Eng. Sci. 1966, 21, 1047–1056. [Google Scholar] [CrossRef]
- Semenov, S.; Trybala, A.; Agogo, H.; Kovalchuk, N.; Ortega, F.; Rubio, R.G.; Starov, V.M.; Velarde, M.G. Evaporation of droplets of surfactant solutions. Langmuir 2013, 29, 10028–10036. [Google Scholar] [CrossRef] [Green Version]
- Misyura, S.Y. High temperature nonisothermal desorption in a water-salt droplet. Int. J. Therm. Sci. 2015, 92, 34–43. [Google Scholar] [CrossRef]
- Misyura, S.Y.; Volkov, R.S.; Filatova, A.S. Interaction of two drops at different temperatures: The role of thermocapillary convection and surfactant. Colloids Surf. A Physicochem. Eng. Asp. 2018, 559, 275–283. [Google Scholar] [CrossRef]
- Tsutsumi, Y.; Nishikata, A.; Tsuru, T. Pitting corrosion mechanism of Type 304 stainless steel under a droplet of chloride solutions. Corros. Sci. 2007, 49, 1394–1407. [Google Scholar] [CrossRef]
- Ladan Khaksar, G.W.; Shirokoff, J. Electrochemical and microstructural analysis of FeS films from acidic chemical bath at varying temperatures, pH, and immersion time. Int. J. Corros. 2016, 2016, 1025261. [Google Scholar]
- Mohamed, A.M.A.; Abdullah, A.M.; Younan, N.A. Corrosion behavior of superhydrophobic surfaces: A review. Arab. J. Chem. 2015, 8, 749–765. [Google Scholar] [CrossRef] [Green Version]
- Wang, X.T.; Hou, B.R. Effect of sulphide pollutants on mild steel corrosion in 3.5% NaCl solutions. Corros. Eng. Sci. Technol. 2010, 45, 57–60. [Google Scholar] [CrossRef]
- Brown, P.W.; Masters, L.W. Atmospheric Corrosion; Ailor, W.J., Ed.; Wiley: New York, NY, USA, 1982; p. 31. [Google Scholar]
- Misyura, S.Y.; Kuznetsov, G.V.; Feoktistov, D.V.; Volkov, R.S.; Morozov, V.S.; Orlova, E.G. The influence of the surface microtexture on wettability properties and drop evaporation. Surf. Coatings Techn. 2019, 375, 458–467. [Google Scholar] [CrossRef]
- Zakowski, K.; Narozny, M.; Szocinski, M.; Darowicki, K. Influence of water salinity on corrosion risk-the case of the southern Baltic Sea coast. Environ. Monit. Assess. 2014, 186, 4871–4879. [Google Scholar] [CrossRef] [Green Version]
- Park, B.; Hwang, W. A facile fabrication method for corrosion-resistant micro/nanostructures on stainless steel surfaces with tunable wettability. Scr. Mater. 2016, 113, 118–121. [Google Scholar] [CrossRef]
- Cui, G.; Bi, Z.; Zhang, R.; Liu, J.; Yu, X.; Li, Z. A comprehensive review on graphene-based anti-corrosive coatings. Chem. Eng. J. 2019, 373, 104–121. [Google Scholar] [CrossRef]
- Morton, S.C.; Frankel, G.S. Atmospheric pitting corrosion of AA7075-T6 under evaporating droplets with and without inhibitors. Mater. Corros. 2014, 65, 351–361. [Google Scholar] [CrossRef]
- Ilevbare, G.O.; Burstein, G.T. The inhibition of pitting corrosion of stainless steels by chromate and molybdate ions. Corros. Sci. 2003, 45, 1545–1569. [Google Scholar] [CrossRef]
- Albrimi, Y.A.; Addi, A.A.; Douch, J.; Souto, R.M.; Hamdani, M. Inhibition of the pitting corrosion of 304 stainless steel in 0.5 M hydrochloric acid solution by heptamolybdate ions. Corros. Sci. 2015, 90, 522–528. [Google Scholar] [CrossRef]
- Boucherit, M.N.; Amzert, S.; Arbaoui, F.; Hanini, S.; Hammache, A. Pitting corrosion in presence of inhibitors and oxidants. Anti-Corros. Methods Mater. 2008, 55, 115–122. [Google Scholar] [CrossRef]
- El-Shafei, A.A.; Moussa, M.N.H.; El-Far, A.A. Inhibitory effect of amino acids on Al pitting corrosion in 0.1 M NaCl. J. Appl. Electrochem. 1997, 27, 1075–1078. [Google Scholar] [CrossRef]
- Wu, R.; Liang, S.; Pan, A.; Yuan, Z.; Tang, Y.; Tan, X.; Guan, D.; Yu, Y. Fabrication of nano-structured super-hydrophobic film on aluminum by controllable immersing method. Appl. Surf. Sci. 2012, 258, 5933–5937. [Google Scholar] [CrossRef]
- Ta, V.D.; Dunn, A.; Wasley, T.J.; Li, J.; Kay, R.W.; Stringer, J.; Smith, P.J.; Esenturk, E.; Connaughton, C.; Shephard, J.D. Laser textured superhydrophobic surfaces and their applications for homogeneous spot deposition. Appl. Surf. Sci. 2016, 365, 153–159. [Google Scholar] [CrossRef] [Green Version]
- Sun, K.; Yanga, H.; Xue, W.; He, A.; Zhu, D.; Liu, W.; Adeyemi, K.; Cao, Y. Anti-biofouling superhydrophobic surface fabricated by picosecond laser texturing of stainless steel. Appl. Surf. Sci. 2018, 436, 263–267. [Google Scholar] [CrossRef]
- Chebolu, A.; Laha, B.; Ghosh, M.; Nagahanumaiah. Investigation on bacterial adhesion and colonisation resistance over laser-machined micro patterned surfaces. Micro Nano Lett. 2013, 8, 280–283. [Google Scholar] [CrossRef]
- Liu, W.; Cai, M.; Luo, X.; Chen, C.; Pan, R.; Zhang, H.; Zhong, M. Wettability transition modes of aluminum surfaces with various micro/nanostructures produced by a femtosecond laser. J. Laser Appl. 2019, 31, 022503. [Google Scholar] [CrossRef]
- Emelyanenko, A.M.; Shagieva, F.M.; Domantovsky, A.G.; Boinovich, L.B. Nanosecond laser micro- and nanotexturing for the design of a superhydrophobic coating robust against long-term contact with water, cavitation, and abrasion. Appl. Surf. Sci. 2015, 332, 513–517. [Google Scholar] [CrossRef]
- Boinovich, L.B.; Emelyanenko, A.M.; Modestov, A.D.; Domantovsky, A.G.; Emelyanenko, K.A. Not simply repel water: The diversified nature of corrosion protection by superhydrophobic coatings. Mendeleev Commun. 2017, 27, 254–256. [Google Scholar] [CrossRef]
- Boinovich, L.B.; Emelyanenko, A.M.; Emelyanenko, K.A.; Modin, E.B. Modus operandi of protective and anti-icing mechanisms underlying the design of longstanding outdoor icephobic coatings. ACS Nano 2019, 13, 4335–4346. [Google Scholar] [CrossRef] [PubMed]
- Wang, G.; Zhang, T.-Y. Oxygen adsorption induced superhydrophilic-to-superhydrophobic transition on hierarchical nanostructured CuO surface. J. Colloid Interface Sci. 2012, 377, 438–441. [Google Scholar] [CrossRef]
- Wang, S.; Feng, X.; Yao, J.; Jiang, L. Controlling wettability and photochromism in a dual-responsive tungsten oxide film. Angew. Chem. Int. Ed. 2006, 45, 1264–1267. [Google Scholar] [CrossRef]
- Sun, R.-D.; Nakajima, A.; Fujishima, A.; Watanabe, T.; Hashimoto, K. Photoinduced surface wettability conversion of ZnO and TiO2 thin films. J. Phys. Chem. B. 2001, 105, 1984–1990. [Google Scholar] [CrossRef]
- Stepien, M.; Saarinen, J.J.; Teisala, H.; Tuominen, M.; Aromaa, M.; Kuusipalo, J.; Makela, J.M.; Toivakka, M. Surface chemical analysis of photocatalytic wettability conversion of TiO2 nanoparticle coating. Surf. Coat. Technol. 2012, 208, 73–79. [Google Scholar] [CrossRef]
- Liu, S.Y.; Hu, J.D.; Yang, Y.; Guo, Z.X.; Wang, H.Y. Microstructure analysis of magnesium alloy melted by laser irradiation. Appl. Surf. Sci. 2005, 252, 1723–1731. [Google Scholar] [CrossRef]
- Li, J.F.; Maier, B.; Frankel, G.S. Corrosion of an Al-Mg-Si alloy under MgCl2 solution droplets. Corros. Sci. 2011, 53, 2142–2151. [Google Scholar] [CrossRef]
- Boinovich, L.B.; Emelyanenko, A.M.; Modestov, A.D.; Domantovsky, A.G.; Emelyanenko, K.A. Synergistic effect of superhydrophobicity and oxidized layers on corrosion resistance of aluminum alloy surface textured by nanosecond laser treatment. ACS Appl. Mater. Interfaces 2015, 7, 19500–19508. [Google Scholar] [CrossRef] [Green Version]
- Boinovich, L.B.; Emelyanenko, A.M.; Modestov, A.D.; Domantovsky, A.G.; Shiryaev, A.A.; Emelyanenko, K.A.; Dvoretskaya, O.V.; Ganne, A.A. Corrosion behavior of superhydrophobic aluminum alloy in concentrated potassium halide solutions: When the specific anion effect is manifested. Corros. Sci. 2016, 112, 517–527. [Google Scholar] [CrossRef]
- Chang, H.-W.; Kelly, P.M.; Shi, Y.-N.; Zhang, M.-X. Thermal stability of nanocrystallized surface produced by surface mechanical attrition treatment in aluminum alloys. Surf. Coat. Technol. 2012, 206, 3970–3980. [Google Scholar] [CrossRef]
- Ye, Z.; Liu, D.; Zhang, X.; Wu, Z.; Long, F. Influence of combined shot peening and PEO treatment on corrosion fatigue behavior of 7A85 aluminum alloy. Appl. Surf. Sci. 2019, 486, 72–79. [Google Scholar] [CrossRef]
- Safyari, M.; Moshtaghi, M. Role of ultrasonic shot peening in environmental hydrogen embrittlement behavior of 7075-T6 alloy. Hydrogen 2021, 2, 377–385. [Google Scholar] [CrossRef]
- Maier, B.; Frankel, G.S. Pitting corrosion of bare stainless steel 1.4301 under chloride solution droplets. J. Electrochem. Soc. 2010, 157, C302–C312. [Google Scholar] [CrossRef] [Green Version]
- El-Mahdy, G.A.; Abdel-Reheem, M.; El-Roudi, O.M.; Atta, A.M.; Issa, Z.; Al-Lohedan, H.A. Assessment of salt and acid droplets evaporations on the corrosion mechanism of aluminum. J. Electrochem. Sci. 2015, 10, 6392–6404. [Google Scholar]
- Yang, Z.; Liu, X.; Tian, Y. Insights into the wettability transition of nanosecond laser ablated surface under ambient air exposure. J. Colloid Interface Sci. 2019, 533, 268–277. [Google Scholar] [CrossRef] [Green Version]
- Braun, R. On the stress corrosion cracking behaviour of aluminium alloy sheet in an aqueous solution of 3% NaCl + 0.3% H2O2. Werkst. Korros. 1994, 45, 255–263. [Google Scholar] [CrossRef]
- Braun, R. Investigations on the long-term stability of 6013-T6 sheet. Mater. Charact. 2006, 56, 85–95. [Google Scholar] [CrossRef]
- Conde, A.; Fernandez, B.J.; De Damborenea, J.J. Characterization of the SCC behavior of 8090 Al-Li alloy by means of the slow-strain-rate technique. Corros. Sci. 1998, 40, 91–102. [Google Scholar] [CrossRef] [Green Version]
- Speidel, M.O. Stress corrosion cracking of aluminum alloys. Metall. Trans. A 1975, 6, 632–651. [Google Scholar] [CrossRef]
- Pan, J.; Thierry, D.; Leygraf, C. Hydrogen peroxide toward enhanced oxide growth on titanium in PBS solution: Blue coloration and clinical relevance. J. Biomed. Mater. Res. 1996, 30, 393–402. [Google Scholar] [CrossRef]
- Kuznetsov, G.V.; Misyura, S.Y.; Volkov, R.S.; Morozov, V.S. Marangoni flow and free convection during crystallization of a salt solution droplet. Colloids Surf. A 2019, 572, 37–46. [Google Scholar] [CrossRef]
- Carle, F.; Semenov, S.; Medale, M.; Brutin, D. Contribution of convective transport to evaporation of sessile droplets: Empirical model. Int. J. Therm. Sci. 2016, 101, 35–47. [Google Scholar] [CrossRef]
- Volkov, R.S.; Strizhak, P.A.; Misyura, S.Y.; Lezhnin, S.I.; Morozov, V.S. The influence of key factors on the heat and mass transfer of a sessile droplet. Exp. Therm. Fluid Sci. 2018, 99, 59–70. [Google Scholar] [CrossRef]
- Misyura, S.Y. The influence of characteristic scales of convection on non-isothermal evaporation of a thin liquid layer. Sci. Rep. 2018, 8, 11521. [Google Scholar] [CrossRef] [PubMed] [Green Version]
- Misyura, S.Y. The anomalously high rate of crystallization, controlled by crystal forms under the conditions of a limited liquid volume. Cryst. Growth Des. 2018, 18, 1327–1338. [Google Scholar] [CrossRef]
- Misyura, S.Y. The influence of convection on heat transfer in a water layer on a heated structured wall. Int. Commun. Heat Mass Transf. 2019, 102, 14–21. [Google Scholar] [CrossRef]
- Misyura, S.Y. Dependence of wettability of microtextured wall on the heat and mass transfer: Simple estimates for convection and heat transfer. Int. J. Mech. Sci. 2020, 170, 105353. [Google Scholar] [CrossRef]
- Uhlig, H.H.; Revie, R.W. Corrosion and Corrosion Control, 3rd ed.; A Wiley-Interscience Publication: New York, NY, USA, 1989. [Google Scholar]
- Misyura, S.Y.; Andryushchenko, V.A.; Smovzh, D.V.; Morozov, V.S. Graphene wettability control: Texturing of the substrate and removal of airborne contaminants in the atmosphere of various gases. J. Mol. Liq. 2021, 118116. [Google Scholar] [CrossRef]
- Nesterov, A.N.; Reshetnikov, A.M.; Manakov, A.Y.; Rodionova, T.V.; Paukshtis, E.A.; Asanov, I.P.; Bardakhanov, S.P.; Bulavchenko, A.I. Promotion and inhibition of gas hydrate formation by oxide powders. J. Mol. Liq. 2015, 204, 118–125. [Google Scholar] [CrossRef]
- Baldwin, K.A.; Fairhurst, D.J. Classifying dynamic contact line modes in drying drops. Soft Matter 2015, 11, 1628–1633. [Google Scholar] [CrossRef] [Green Version]
- He, M.; Liao, D.; Qiu, H. Multicomponent droplet evaporation on chemical micro-patterned surfaces. Sci. Rep. 2017, 7, 41897. [Google Scholar] [CrossRef] [Green Version]
- Kashaninejad, N.; Nguyen, N.-T.; Chan, W.K. Engineering micropatterned surfaces for controlling the evaporation process of sessile droplets. Technologies 2020, 8, 29. [Google Scholar] [CrossRef]
- Shanahan, M.E.R. Simple theory of “Stick-Slip” wetting hysteresis. Langmuir 1995, 11, 1041–1043. [Google Scholar] [CrossRef]
Figure 1.
(a) Experimental scheme: 1—photo camera; 2—telecentric pipe; 3—scales; 4—substrate; 5—droplet; 6—air temperature meter; 7—hygrometer. (b) The scheme of the electrical heating: 8—copper cylinder; 9—heater; 10—thermocouple. (c) The wall surface without textures. (d) The textured surface without craters. (e) The textured surface with craters (L—crater diameter; L = 50–60 µm).

Figure 2.
The development of corrosion on the surface of a smooth (non-textured) substrate under a droplet of salt solution.
Figure 2.
The development of corrosion on the surface of a smooth (non-textured) substrate under a droplet of salt solution.

Figure 3.
(a) The dependence of the conditional corrosion time τcor on the droplet-wetted area Fd (τcor) corresponds to the time at which the entire surface became black (Figure 2): 1—the experimental data (the wall temperature Tw =25 °C); 2—the curve constructed from Equation (3), Tw =25 °C; 3—the experimental data (Tw =41 °C). (b) Scheme of the potential difference between the cathode (wall surface) and the anode (pit).

Figure 4.
SEM images (a1,b1,c1) and EDS mapping (a2,b2,c2) of corrosion products. Photos (a1,a2) correspond to sample 1 (Table 1), (b1,b2) sample 4 and (c1,c2) sample 2.
Figure 4.
SEM images (a1,b1,c1) and EDS mapping (a2,b2,c2) of corrosion products. Photos (a1,a2) correspond to sample 1 (Table 1), (b1,b2) sample 4 and (c1,c2) sample 2.

Figure 5.
(a) The growth of salt crystals on the metal surface in the presence of corrosion. (b) The development of pits on the smooth surface (sample 1). (c) Pits on the superhydrophilic textured surface. (d–f) Carbon distribution over the samples surface (white areas): (d) sample 2; (e) sample 4; (f) magnified image.

Figure 6.
The polarization curves of samples 1–4 (Table 1) in O2-saturated 0.5 M NaCl obtained at a sweep rate of 1 mV/s.
Figure 6.
The polarization curves of samples 1–4 (Table 1) in O2-saturated 0.5 M NaCl obtained at a sweep rate of 1 mV/s.

Figure 7.
(a) The wetted droplet diameter Dw with time t (Tw = 41 °C, samples correspond to Table 1). (b) The droplet diameters for different droplet shapes (d1 = Dw).
Figure 7.
(a) The wetted droplet diameter Dw with time t (Tw = 41 °C, samples correspond to Table 1). (b) The droplet diameters for different droplet shapes (d1 = Dw).

Figure 8.
Dependence of Jev/Rw with time t for the droplet evaporation (Tw = 41 °C, Rw is the droplet radius).
Figure 8.
Dependence of Jev/Rw with time t for the droplet evaporation (Tw = 41 °C, Rw is the droplet radius).


Table 1.
Static contact angles of water droplets for various surfaces.
| No Sample | Surface | θ0, ° |
|---|---|---|
| 1 | smooth (Figure 1c) (solution) | 83–85 |
| 2 | textured hydrophobic, without craters (Figure 1d) (1 laser penetration) (solution) | 134–136 |
| 3 | textured superhydrophobic, without craters (Figure 1d) (7 laser penetration) (solution) | 149–152 |
| 4 | hydrophilic, with craters (Figure 1e) (solution) | 8–11 |
| 5 | smooth (Figure 1c) (water) | 78–80 |
Table 2.
Distribution of the area share (%) for different characteristic areas of elements: sample 1 (Figure 4(a2)), sample 4 (Figure 4(b2)), sample 3 (Figure 4(c2)).
| Area | Sample 1, Area Share, % | Area | Sample 2, Area Share, % | Area | Sample 3, Area Share, % |
|---|---|---|---|---|---|
| A (green) | 45.2 | A (green) | 26 | A (blue) | 97.41 |
| B (blue) | 48.1 | B (blue) | 37.1 | B (red) | 2.59 |
| C (red) | 6.7 | C (brown) | 28.3 | ||
| D (red) | 8.6 |
Table 3.
Component composition of corrosion products (samples 1, 2 and 4 correspond to Table 1).
Table 3.
Component composition of corrosion products (samples 1, 2 and 4 correspond to Table 1).
| Sample 1 | ||||||||||||
| Element | O | Na | Mg | Al | Cl | Cu | Mn | Fe | Si | C | Ti | |
| Area A, % | weight | 25,60 | 22.26 | 1.24 | 16.74 | 33.51 | 0.31 | 0.18 | 0.16 | |||
| atomic | 38.11 | 23.06 | 1.22 | 14.77 | 22.51 | 0.19 | 0.08 | 0.07 | ||||
| Area B, % | weight | 37.67 | 3.64 | 3.78 | 48.97 | 4.93 | 0.14 | 0.39 | 0.19 | 0.30 | ||
| atomic | 50.67 | 3.41 | 3.34 | 39.06 | 2.99 | 0.07 | 0.15 | 0.07 | 0.23 | |||
| Area C, % | weight | 58.17 | 0.52 | 3.73 | 25.32 | 0.61 | 0.26 | 11.39 | ||||
| atomic | 63.56 | 0.40 | 2.68 | 16.40 | 0.30 | 0.08 | 16.57 | |||||
| Sample 4 | ||||||||||||
| Element | O | Na | Mg | Al | Cl | Cu | Mn | Fe | Si | C | Ti | |
| Area A, % | weight | 52.49 | 8.53 | 11.50 | 12.95 | 13.59 | 0.45 | 0.21 | 0.28 | |||
| atomic | 65.44 | 7.41 | 9.44 | 9.57 | 7.65 | 0.22 | 0.07 | 0.20 | ||||
| Area B, % | weight | 37.93 | 4.07 | 5.35 | 44.26 | 6.05 | 0.32 | 0.4 | 0.42 | 0.98 | 0.07 | 0.14 |
| atomic | 51.08 | 3.81 | 4.74 | 35.34 | 3.68 | 0.10 | 0.16 | 0.16 | 0.76 | 0.11 | 0.06 | |
| Area C, % | weight | 60.42 | 3.54 | 16.48 | 14.14 | 4.73 | 0.46 | 0.24 | ||||
| atomic | 71.51 | 2.91 | 12.83 | 9.92 | 2.53 | 0.22 | 0.08 | |||||
| Area D, % | weight | 44.06 | 1.69 | 2.97 | 11.01 | 1.78 | 0.39 | 0.53 | 1.51 | 36.08 | ||
| atomic | 42.47 | 1.13 | 1.88 | 6.29 | 0.77 | 0.15 | 0.15 | 0.83 | 46.33 | |||
| Sample 2 | ||||||||||||
| Element | O | Na | Mg | Al | Cl | Cu | Mn | Fe | Si | C | Ti | |
| Area A, % | weight | 37.23 | 0.24 | 2.85 | 41.88 | 0.26 | 0.18 | 0.33 | 0.16 | 0.19 | 16.58 | |
| atomic | 42.95 | 0.2 | 2.16 | 28.65 | 0.14 | 0.08 | 0.11 | 0.05 | 0.12 | 25.47 | ||
| Area B, % | weight | 53.63 | 0.75 | 2.21 | 28.86 | 0.83 | 0.52 | 0.53 | 12.69 | |||
| atomic | 59.36 | 0.58 | 1.61 | 18.94 | 0.42 | 0.23 | 0.17 | 18.71 | ||||
Table 4.
Electrochemical parameters of the samples (samples correspond to Table 1).
Table 4.
Electrochemical parameters of the samples (samples correspond to Table 1).
| Unit | Sample 1 (Smooth) | Sample 2 (Hydrophobic, 1 Laser Penetration) | Sample 3 (Hydrophobic, 7 Laser Penetration) | Sample 4 (Hydrophilic) |
|---|---|---|---|---|
| Icor, A cm−2 | 1.3 × 10⁻⁶ | 2 × 10⁻⁸ | 0.79 × 10⁻⁹ | 7.9 × 10⁻⁸ |
| Ecor, V | −0.66 | −0.68 | −0.74 | −0.7 |
Publisher’s Note: MDPI stays neutral with regard to jurisdictional claims in published maps and institutional affiliations. |
© 2021 by the author. Licensee MDPI, Basel, Switzerland. This article is an open access article distributed under the terms and conditions of the Creative Commons Attribution (CC BY) license (https://creativecommons.org/licenses/by/4.0/).
Share and Cite
MDPI and ACS Style
Misyura, S.Y. Effect of Corrosion and Wall Textures on Wettability and Heat Flux at Non-Isothermal Conditions. Coatings 2022, 12, 46. https://doi.org/10.3390/coatings12010046
AMA Style
Misyura SY. Effect of Corrosion and Wall Textures on Wettability and Heat Flux at Non-Isothermal Conditions. Coatings. 2022; 12(1):46. https://doi.org/10.3390/coatings12010046
Chicago/Turabian StyleMisyura, Sergey Y. 2022. "Effect of Corrosion and Wall Textures on Wettability and Heat Flux at Non-Isothermal Conditions" Coatings 12, no. 1: 46. https://doi.org/10.3390/coatings12010046
Note that from the first issue of 2016, this journal uses article numbers instead of page numbers. See further details here.