1. Introduction
The foundation treatment method of dynamic compaction (DC) mainly involves a free-falling heavy tamper to impact the soil foundation. Compared with a dynamic roller, jet grouting, and a pile foundation, DC has outstanding advantages in reinforcement depth, efficiency, and cost [
1,
2,
3]. Therefore, DC has been widely adopted all over the world to strengthen soil foundations, especially in high-fill engineering projects such as earth dams, mountainous airports, and the fill subgrade of roads [
4,
5].
The topics of DC have been studied experimentally and numerically since DC was first proposed by Ménard in 1969. Particular attention has mainly focused on the following areas: the consolidation mechanism of DC [
6,
7]; the degree and depth of improvement of DC [
8,
9,
10]; the factors affecting the DC efficiency [
11,
12]; and the dynamic behavior of soil [
13,
14,
15].
However, the soil reactions in an impact load are extremely complex. From the micro point of view, the moving and recombination of granular soil leads to the dynamic consolidation of soil [
16,
17]. From the macro point of view, the energy propagates and dissipates in the form of stress waves [
18,
19]. The foundation undergoes plastic deformation and improvement of the bear capacity in the DC process. Theoretically, DC involves a series of complex scientific issues, including soil impact mechanics, large-strain constitutive theory, and the mechanism of a three-phase medium [
20,
21]. The theoretical literature about DC is difficult to use to guide the engineering practice.
Presently, the design and construction of DCs still rely on experience [
5,
22]. Field tests of DC must be carried out to obtain key parameters of the DC practice such as the optimum tamping times, the filler thickness of each layer, and the spacing of tamping points. These tests are common on large scales and they cost a large amount. Indeed, there is a need for a simple method to provide some indication to determine the key parameters of the DC practice.
The DC process can be summarized as a soil foundation suffering a series of responses with the impact load of the tamper. The three key elements in studying the DC process are: (i) the time-domain characteristics of the input affecting the soil changes; (ii) the regular pattern of the soil response with the impact load; and (iii) the method for evaluating the foundation reinforcement level. The first element is the foundation of the second and the third elements. This paper presents mathematical results concerning the first element: the time-domain of the tamper.
Prior studies have attempted to characterize the time-domain of a tamper using mathematical models. Scott and Pearce [
23] first presented a time-domain model to study the behavior of the tamper displacement. Based on this study, Qian et al. [
24] proposed an improved method to determine the time-domain characteristics of the impact stress, the time needed, and the residual deformation in a DC tamping. However, he failed to consider the influence of soil damping in the loading stage, and the law of crater depth evolution with multiple DCs was also not analyzed.
In this study, the tamper was taken as the research object and the whole process of DC was regarded as an incomplete elastic collision process between the tamper and the foundation soil. Based on the theory of automatic control, a mathematical time-domain model of the tamper displacement was established. The concept of a modified tamping ratio was proposed, which could provide reference for the determination of the optimal tamping times. The revised mathematical model was also verified through a series of large-scale DC tests.
2. Time-Domain Model for a Single Tamping of DC
For a single process of DC tamping, the tamper with a mass of M drops freely from a certain height of H with an initial velocity of zero. Once the tamper collides with the foundation, the speed of the tamper decreases rapidly because of the combined influence of self-weight and reaction. The tamper reaches the lowest point when its speed drops to zero for the first time. Then, the tamper will produce a tiny rebound. The tamper stabilizes eventually, and a single tamping of DC is finished. The single tamping of a DC process contains two parts: (i) the impact loading stage that is from the tamper colliding with the soil foundation to the lowest point; and (ii) the unloading rebound stage that is the subsequent rebound of the tamper.
2.1. Impact Loading Stage
The impact loading stage mainly focuses on the stage from the beginning of the tamper-soil interaction to the lowest point of tamper.
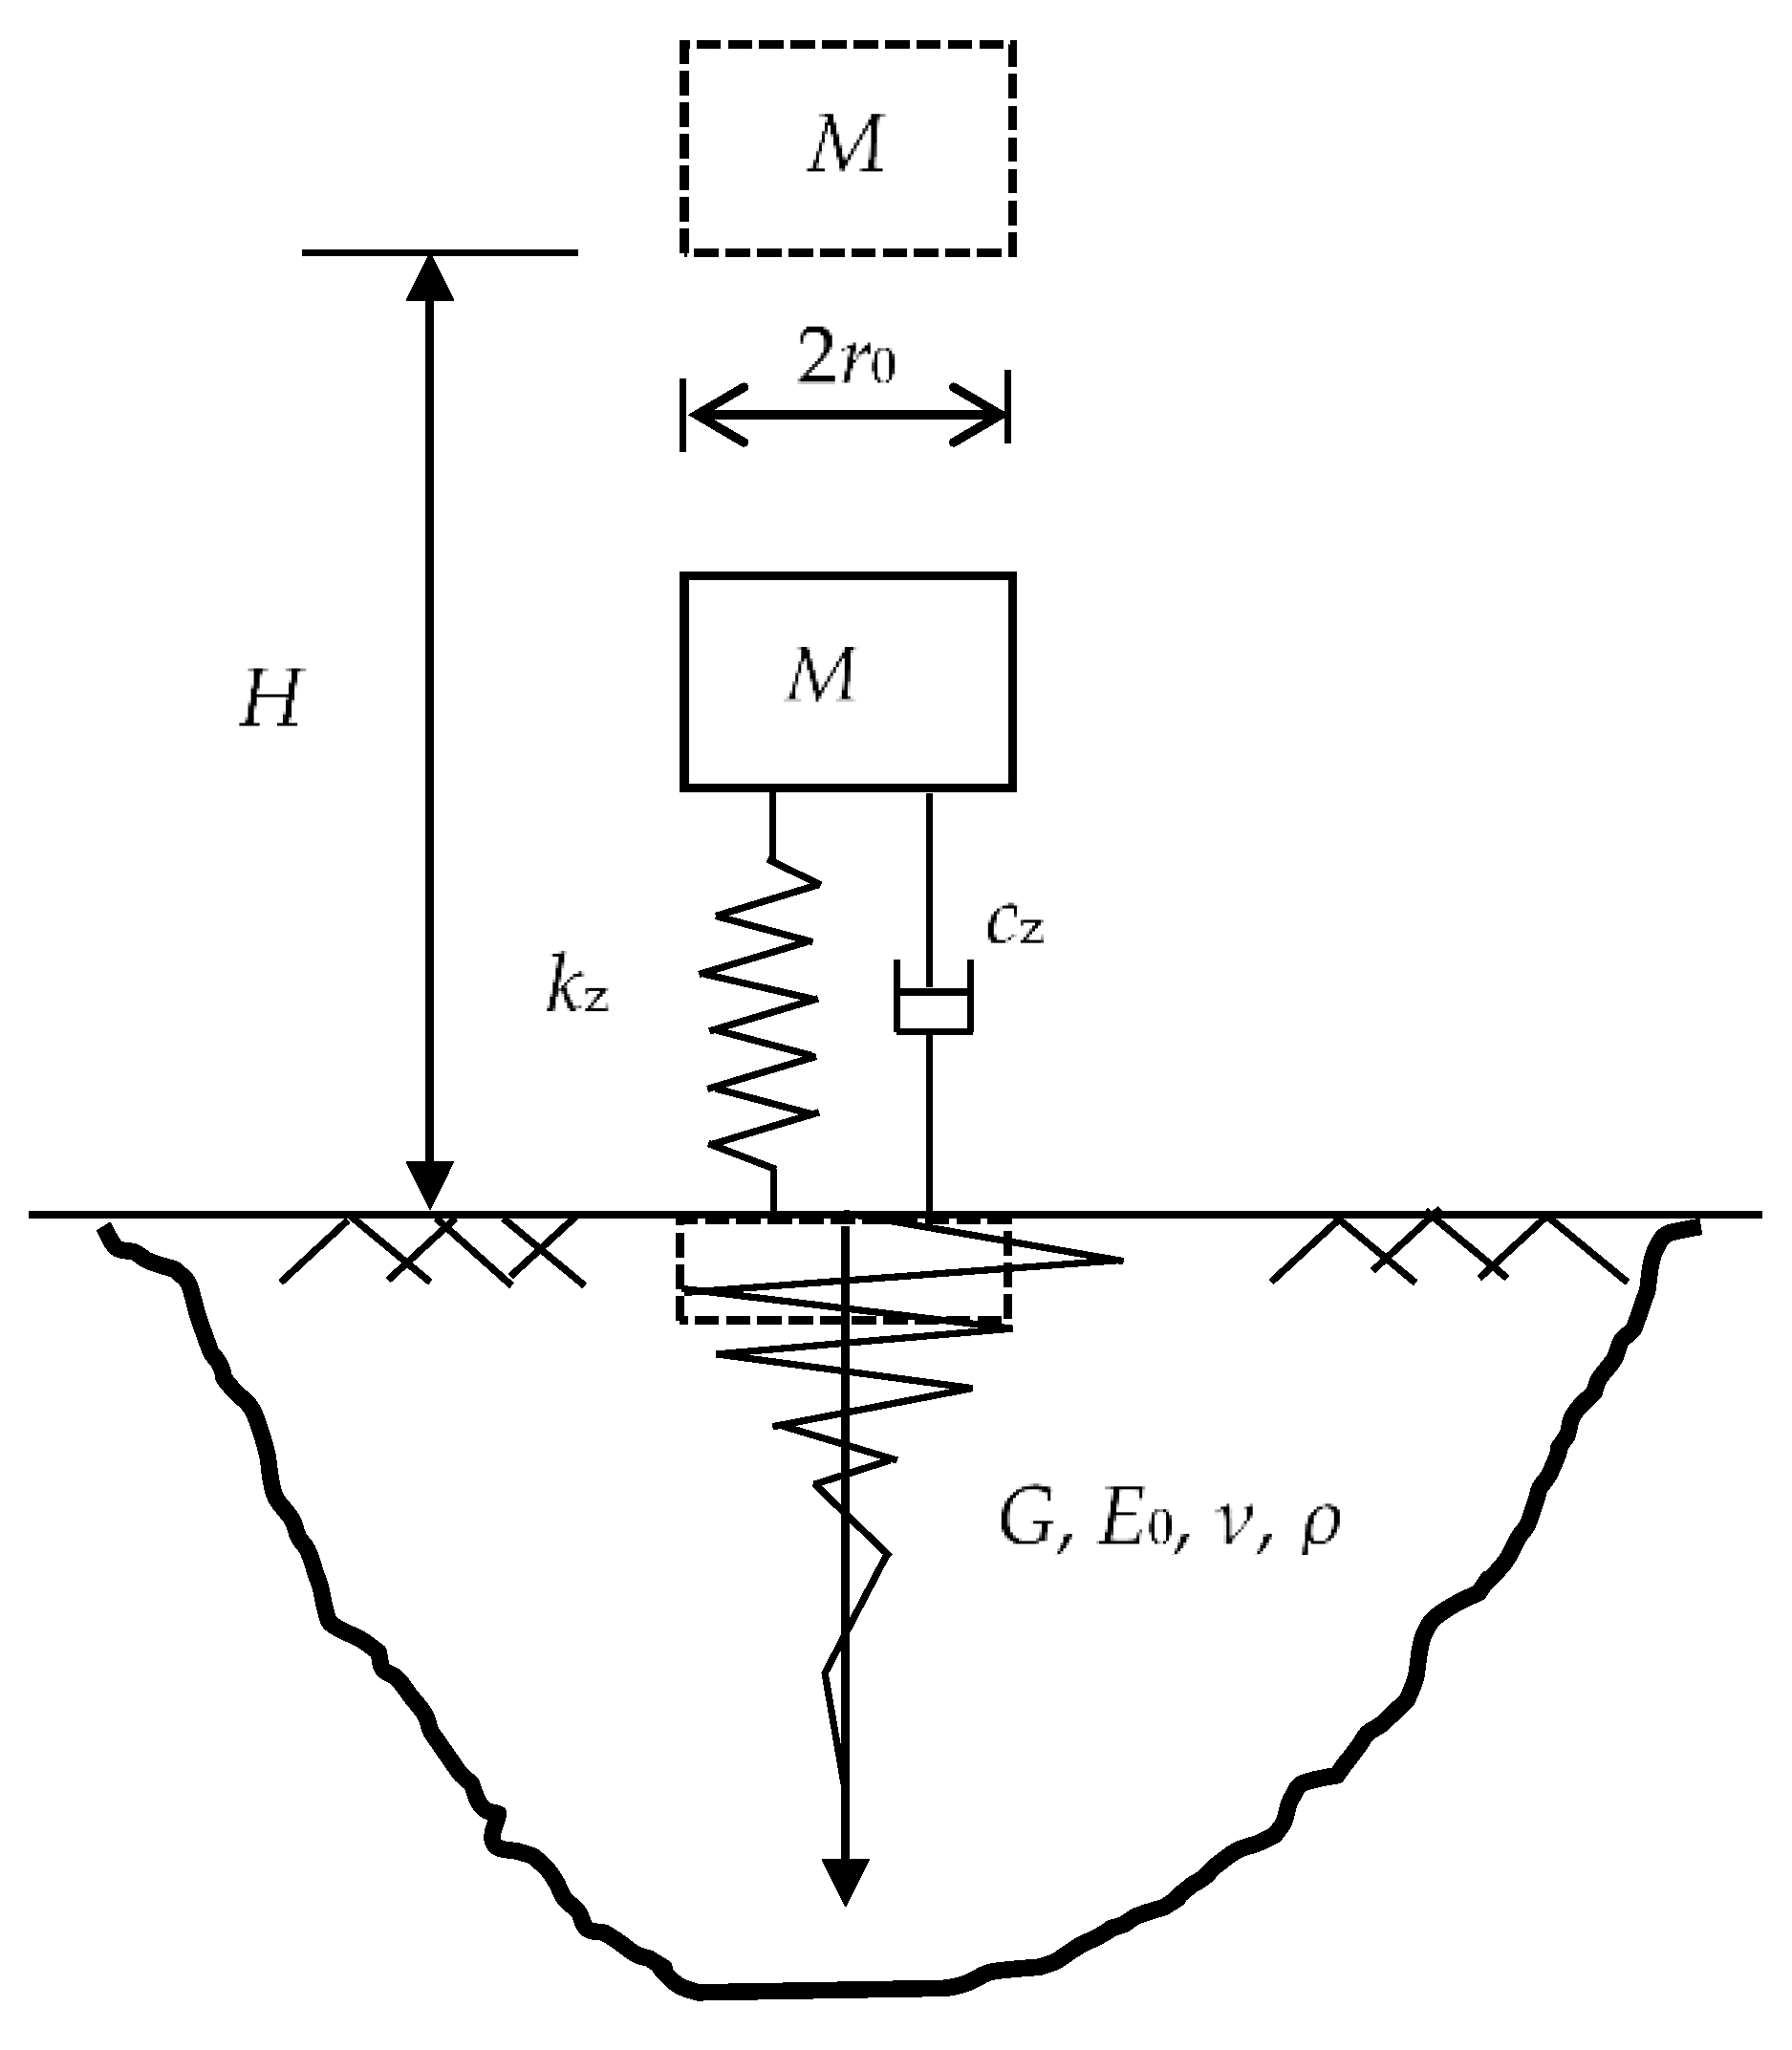
Figure 1 shows the DC process that was simplified into a spring-damper system. The basic assumptions included:
(1) The soil was elastic in the stages of impact loading and unloading rebound, but the value of the elastic modulus during the unloading rebound was larger than that of the loading process;
(2) The apparent density of the soil particles remained unchanged.
The tamper was selected as the research object. According to Newton’s second law of motion, the dynamic equilibrium equation of the tamper was obtained as:
where
M,
u,
, and
are the mass, displacement, velocity, and acceleration of the tamper, respectively,
cz is the vertical damping coefficient of the soil, and
kz is the elastic constant of the soil load.
According to the half-space theory [
23], the vertical damping coefficient
cz and the loading elastic constant
kz of the soil were expressed as:
where
r0 is the tamper radius,
E is the deformation modulus of the soil,
G is the shear modulus of the soil,
ν is the Poisson’s ratio of the soil, and
ρ is the bulk density of the soil.
Considering the fact that soil is generally regarded as an underdamped system [
25,
26], the general solution of Equation (1) was:
where
is the undamped oscillation frequency, and
is the oscillation frequency with damping. A and B are undetermined coefficients.
ξ is the damping ratio of the soil, whose value was between 0 and 1.
ξ could be calculated with the following equation:
Taking the first contact between the tamper and the soil foundation as the timing starting point, the boundary conditions of Equation (4) were:
where
v0 is the velocity of the tamper freely dropping from the height of
H. The displacement time history equation of the tamper could be obtained:
In the impact loading, the displacement of the tamper increased and the velocity decreased with time. When the tamper speed decreased to zero for the first time, the tamper displacement was at a maximum. The maximum displacement
up in a single tamping was written as:
where
tp is the time needed for the tamper velocity to decrease to zero at first and the value of
tp could be determined easily with
, as shown by Equation (9).
As presented above, the time history expressions of the tamper displacement during the impact loading were established.
2.2. Unloading Rebound Stage
When the tamper reached the lowest point, the soil had been densified and it exerted a reaction load to the tamper. A certain amount of unloading rebound occurred. In the unloading stage, the dynamic equilibrium equation of the tamper was as shown by Equation (11):
where
uf is the residual settlement, i.e., the final crater depth after a single DC tamping.
and
are the vertical damping coefficient and the elastic constant of the soil in the tamping unloading stage, respectively.
The value of the vertical damping coefficient
and the loading elastic constant
of the soil could be determined based on the half-space theory:
where
and
are the shear modulus and the deformation modulus and of the soil during the unloading stage, respectively.
The boundary condition was the continuity of the tamper displacement and the velocity at the lowest point (
tp moment). Therefore, the time-domain of the tamper in the unloading stage could be obtained as follows:
where
, and
are the oscillation frequency with damping and the damping ratio of the soil in the ramming unloading stage, respectively.
is the undamped oscillation frequency in the ramming unloading stage. The value of
belonged to (0,1) and it could be calculated with the following equation:
is an index that could be calculated with the following equations:
with
where
and
.
As presented above, the time-domain model of the tamper displacement for a whole DC tamping process was established. The crater depth after a single DC tamping could be obtained with the continuity condition of the force at the lowest point:
According to Equation (16), the crater depth with a single tamping was closely related to the elastic constant of the soil both in the loading and unloading stages. It was easier to obtain a larger crater depth when the elastic constant kz was smaller, which meant that the soil was in a looser state before the DC. When the elastic constant was larger, it meant that the soil was densified after the DC. The values of kz and can be calculated according to Equations (3) and (13), respectively. The parameters involved are easy to obtain, and the most critical one is the elastic modulus in the impact loading stage E and the unloading stage .
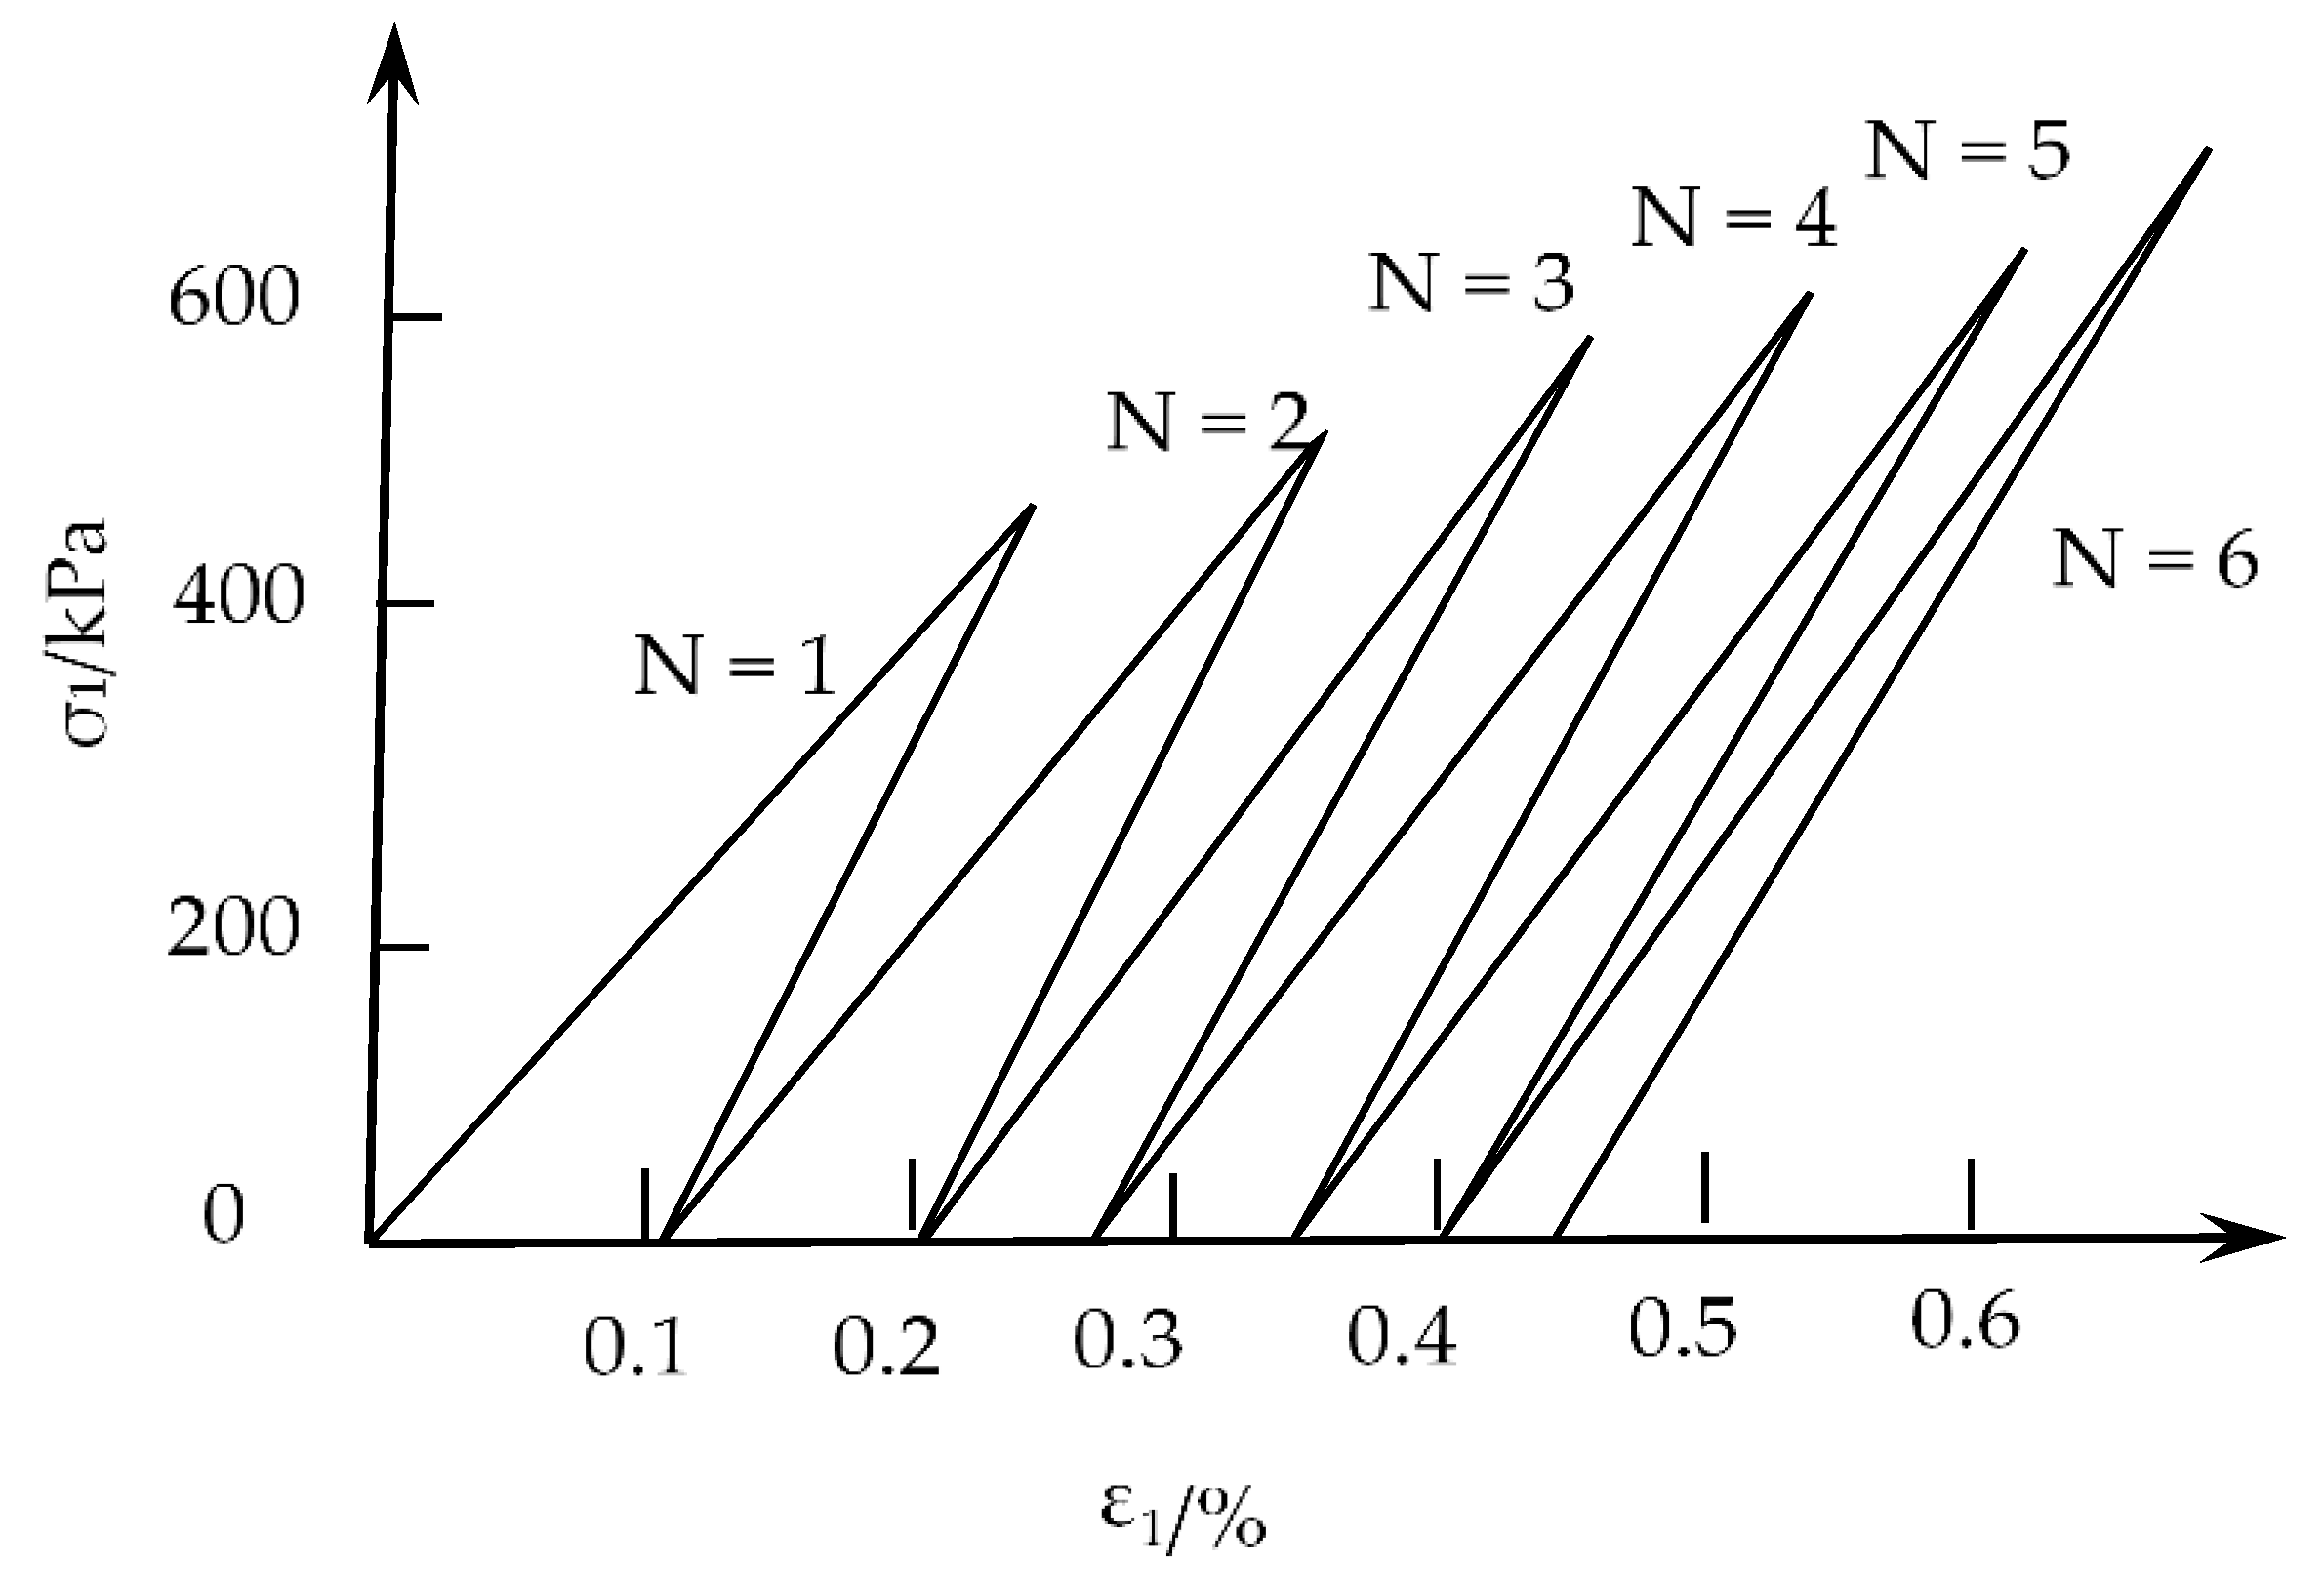
Under multiple tamping conditions, the soil was denser, and the values of
kz and
increased accordingly [
24], whereas comparatively, the value of
increased more slowly, as shown in
Figure 2. Thus, the difference between the values of
kz and
decreased. This was the essential reason why DC repeated at the same point could not increase the accumulated crater depth and the soil was densified constantly. The time-domain characteristics of the tamper displacement and the law of crater depth development under multiple tamping was analyzed further.
3. Tamper Displacement during Multiple Tamping
In the DC conduction, we commonly tamp repeatedly until the soil is densified enough, and then move to the next tamping point. The most key parameters in the theoretical analysis on the time-domain characteristics of DC are E and and their evolution with tamping times. However, the physical and mechanical properties of the soil varied with DC tamping times. Even for the same tamping, the dynamic mechanical properties were different between the impact loading stage and the unloading rebound stage. Furthermore, the dense degree of the strengthened foundation was variant with the distance to the tamping point. The closer to the tamping point, the foundation is denser and better densified in general. Therefore, we still face a great challenge to develop accurate formulas to determine the specific value of the elastic modulus and it is harder to determine its variation with the tamping times. Previously, some scholars have put forward the empirical methods to determine the elastic modulus.
Pourjenabi et al. [
27] studied the variation of soil compactness under different constitutive models by a numerical method. They put forward formulas that characterized the relationship between the soil modulus and density dynamic compaction. Zhou et al. [
28] analyzed the improvement on a saturated foundation under dynamic compaction incorporating the soil-cap yield-hardening model. The proposed methods are meaningful and showed a reasonably good agreement with the existing analytical solutions and field measurement of DC. However, these methods can only be used by means of a numerical simulation and more practical and simpler methods are needed.
Qian et al. [
24] carried out a series of DC tests on Tanggu clay and Qinhuangdao sandy soil with a self-made DC model instrument. The impact load waveform was similar to that of DC, and the following formula for the soil deformation modulus with the number of tamping times was proposed:
where
E0 and
EN are the initial deformation modulus and the deformation modulus at the tamping number of
N times, respectively, and
β is an empirical coefficient. Equation (20) could successfully capture the basic rule that the soil deformation modulus varied with the tamping times. Additionally, the value of parameter
β was easy to obtain with a DC model test. Therefore, Equation (20) was adopted in this study and the shear modulus at the tamping number of
N could be obtained:
By bringing Equations (20) and (21) to Equations (2), (3), (5), (12), (13) and (15), we could calculate the vertical damping coefficient, the elastic constant, and the undamped oscillation frequency for every tamping time. In addition, we further obtained the time-domain model of the tamper displacement for every tamping time.
Based on the principle of automatic control and taking the tamper as the research object, as shown above, the time-domain mathematical model of the tamper displacement in DC was developed. The key parameters involved in this model included the tamper parameters (tamper mass M, drop height H and radius r0), soil basic parameters (Poisson’s ratio ν, initial deformation modulus E0, and the density ρ of the soil), and an empirical coefficient β describing the variation in the deformation modulus for multiple tamping times.
4. Model Performance and Application
4.1. Large-Scale DC Tests
In order to validate the performance of the model, a series of three large-scale DC tests were completed. The test area was located in an artificial island project that had been filled for a new airport. The test area was a quadrangle made up of fillers layer-by-layer with a total height of about 12 m. The length and width of the test area were equal at about 38 m, and the test area was large enough to overcome the influence of boundary conditions. The filler was evenly distributed in each layer to ensure a similar soil foundation in the mechanical characteristics. The initial deformation modulus E0 was about 7880 kPa.
The adopted filler was mainly clay from local excavation. Its water content was 5% in mass. Some coarse aggregate was mixed in the filler. The coarse aggregate in mass was less than 20% with the maximum particle size of less than 20 cm.
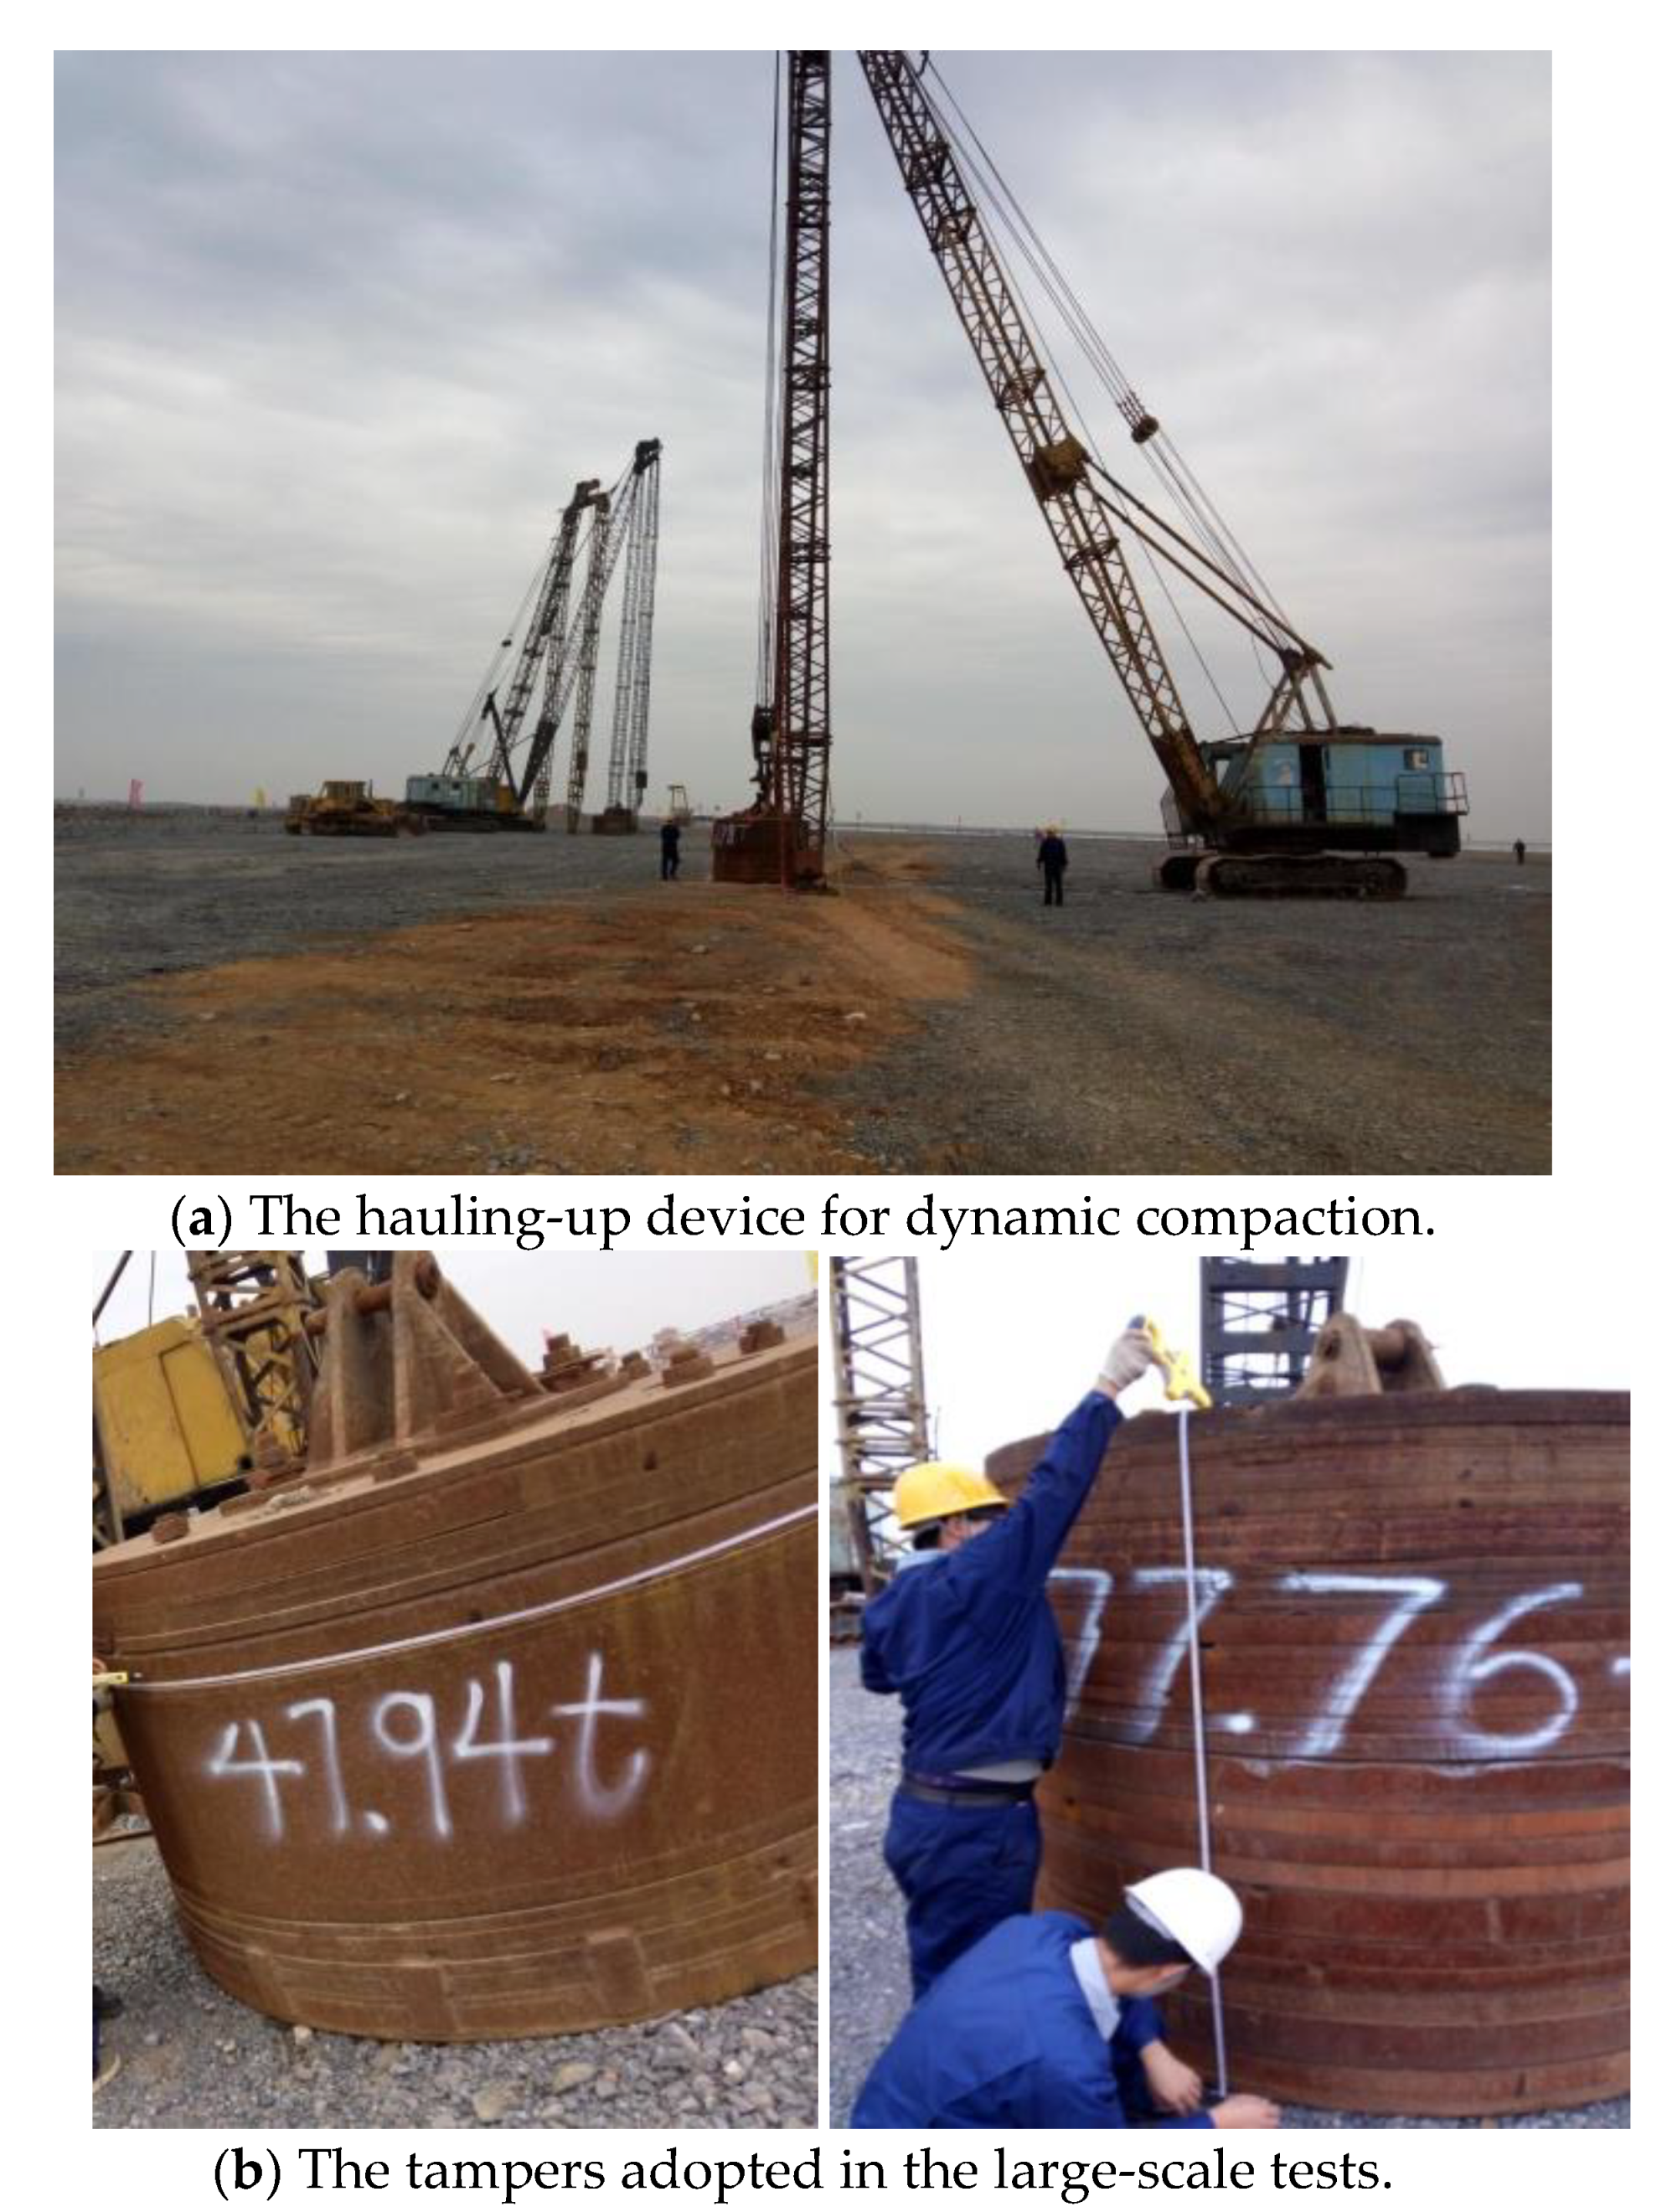
The adopted energy level was 10,000 kN m and the tamper radius was 1.25 m. The tamper was composed of several steel plates with identical diameters, and the weight of the tamper could be adjusted by controlling the number of steel plates, as shown in
Figure 3b. The exact drop distance was controlled by a cable with a certain length. Once the tamper reached the required height, the cable was tightened to activate the decoupling device, which caused the tamper to freely fall. The hauling-up device and tampers adopted in the large-scale tests of dynamic compaction are shown in
Figure 3.
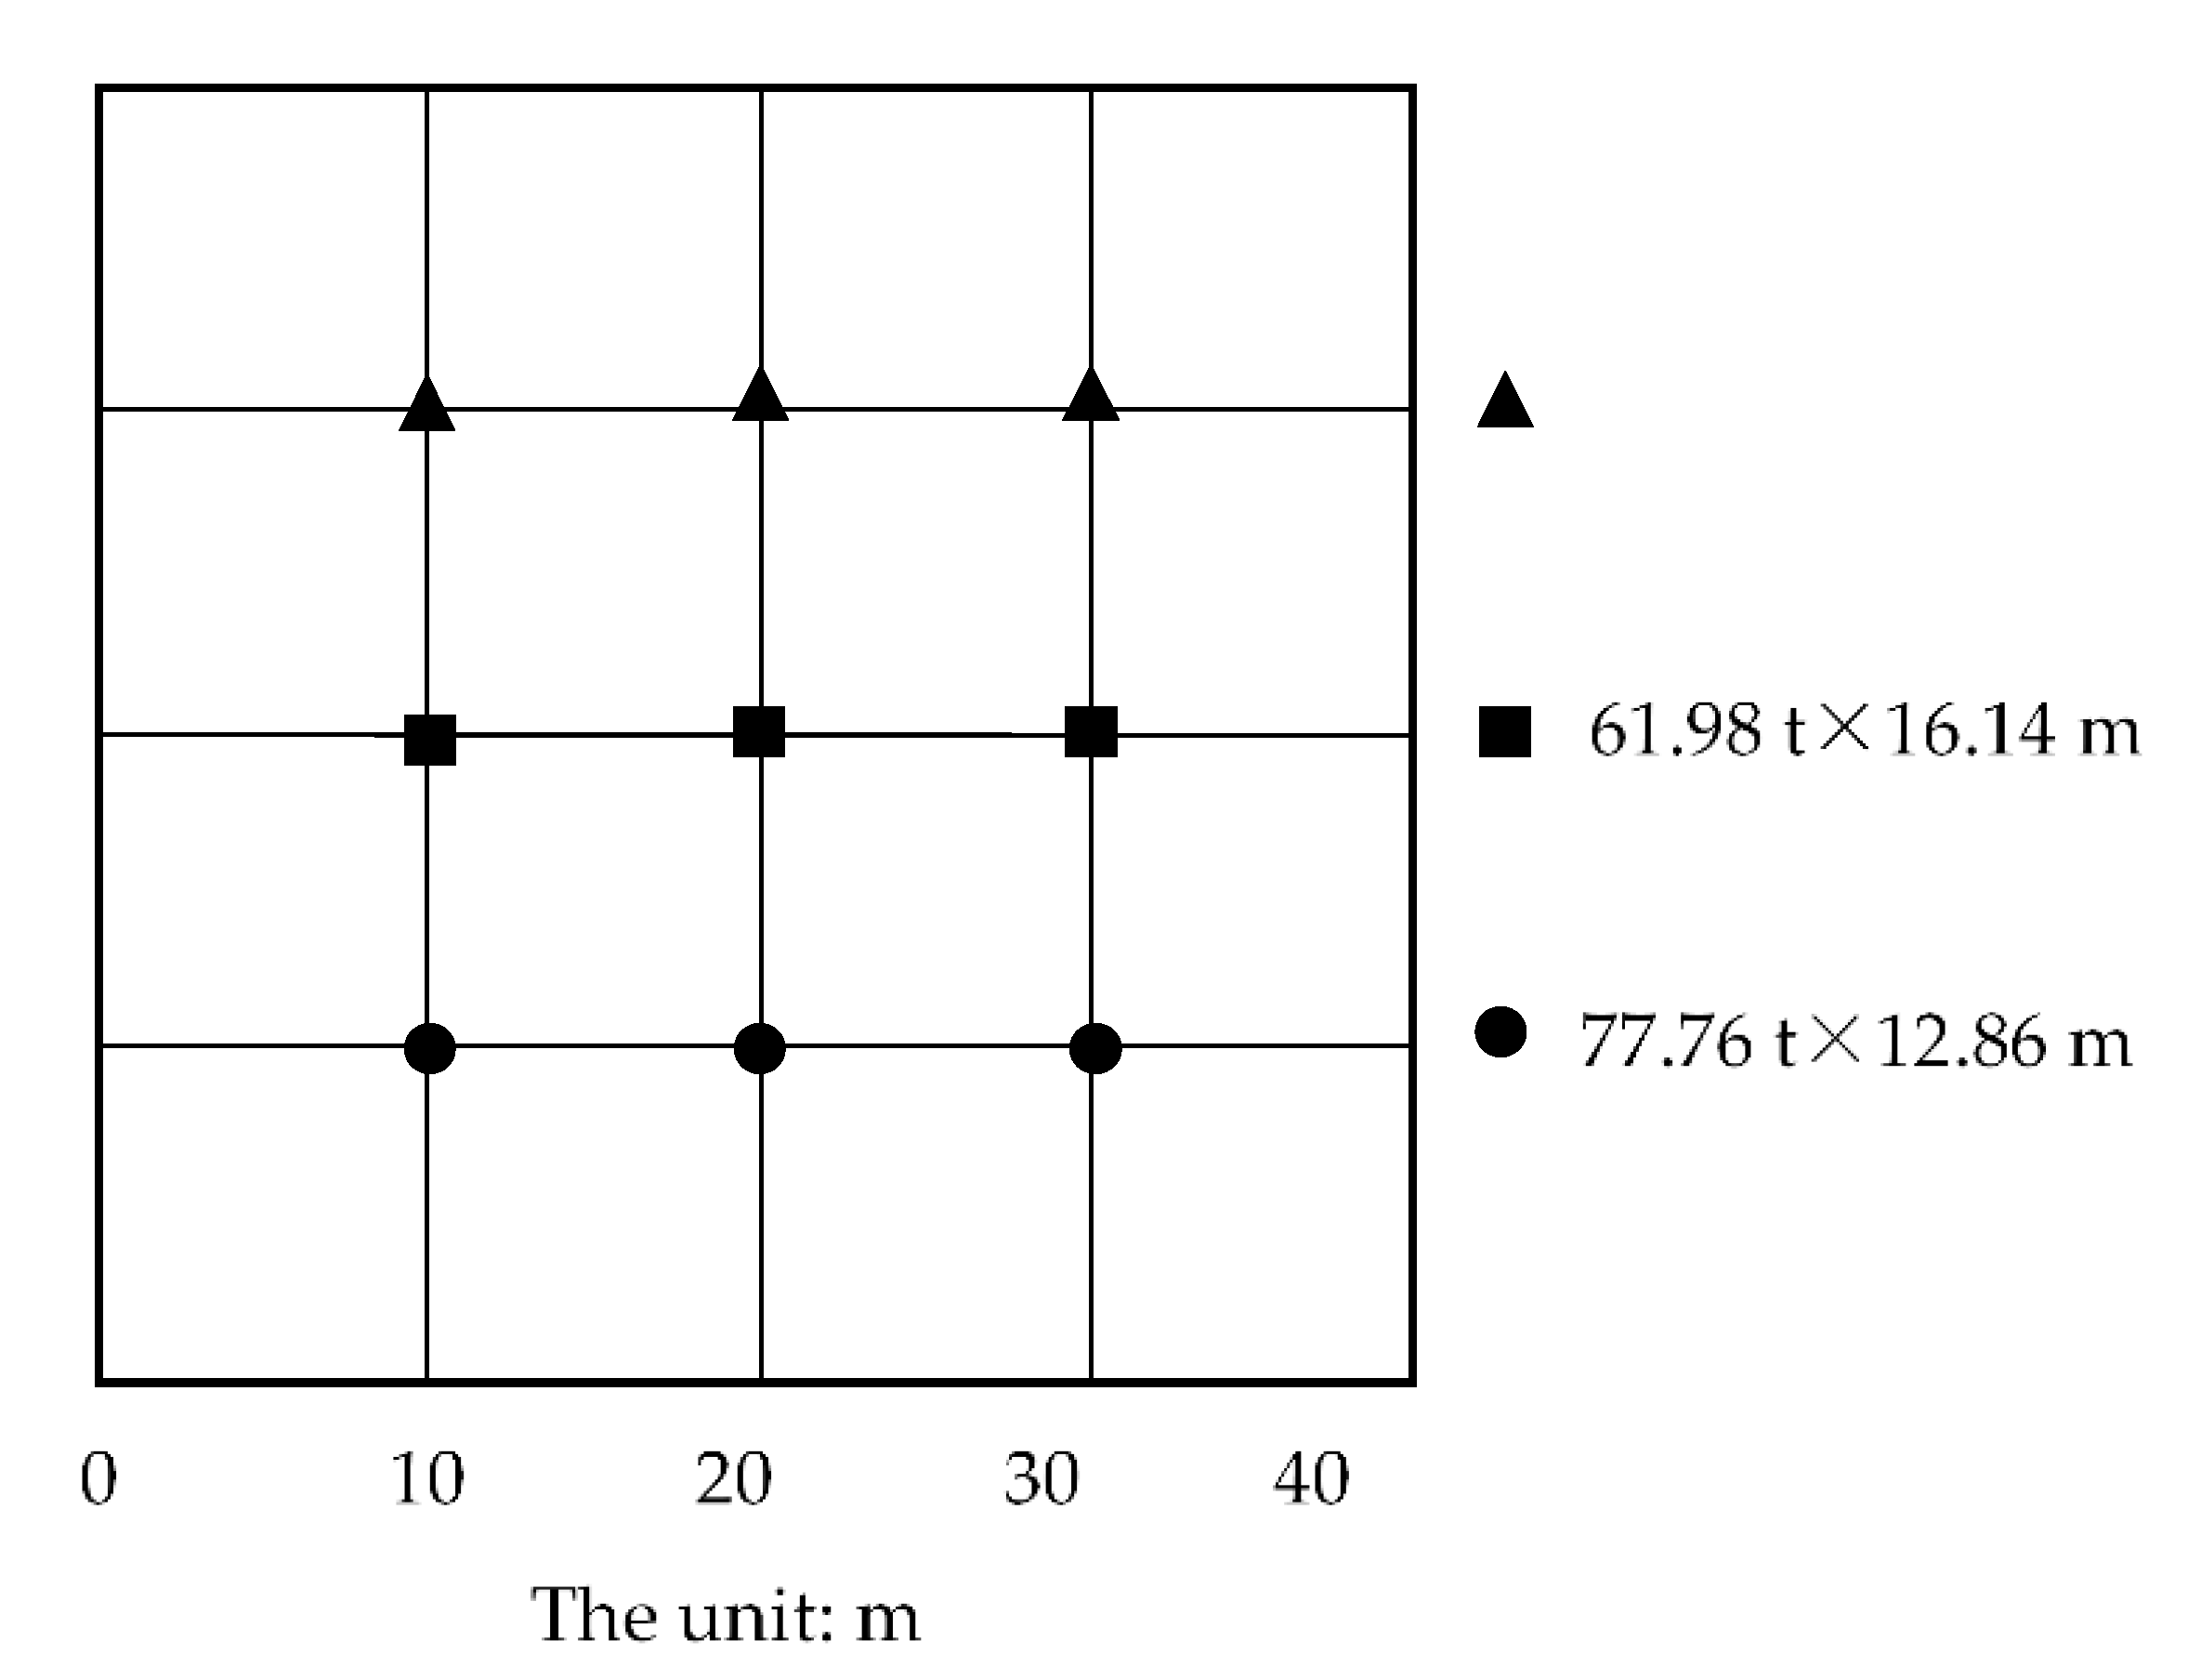
Considering the effect of different combinations of tamper weight and falling height on the DC efficiency [
5,
29], three groups of the tamper weight and the drop distance were adopted. They were 47.94 t × 20.86 m, 61.98 t × 16.14 m, and 77.76 t × 12.86 m. The tamping points were spaced 10 m and arranged in a square shape, as shown in
Figure 4. Each tamping point was tamped ten times for each group and the crater depth in each tamping was detected with a levelling instrument.
4.2. Comparison of the Crater Depth for the DC Tests and the Theoretical Analysis
A number of studies have reported that a heavier tamper with a lower dropping distance tends to result in a higher value of crater depth with the same energy level [
18,
29,
30]. Therefore, the empirical coefficients
β were 0.4, 0.5, and 0.52 in the DC group of 47.94 t × 20.86 m, 61.98 t × 16.14 m, and 77.76 t × 12.86 m, respectively.
The crater depth of each tamping was detected during the large-scale DC tests.
Figure 5 displays the comparison between the crater depth obtained by three groups of large-scale DC tests and the theoretical model proposed above. From
Figure 5, it can be seen that the theoretical crater depth was consistent with the experimental value. For the field tests of the tamping groups of 61.98 t × 16.14 m and 77.76 t × 12.86 m, the cumulative crater depths after tamping 10 times were 2.22 m and 2.36 m, and the corresponding theoretical values were 2.35 m and 2.19 m, respectively. For the tamping group of 47.94 t × 20.86 m, the theoretical value of the crater depth from the first eight tampings was consistent with the DC field test. After tamping 10 times, the theoretical cumulative crater depth was 1.94 m, and the actual value was 1.99 m.
4.3. Application of the DC Model
The proposed DC will benefit to revel in the time-domain characteristic of the whole DC progress. Shown in
Figure 6 is the time-domain of the tamper displacement obtained from the mathematical model. It showed that the displacement of the tamper increased rapidly at the initial stage of tamping, and then a certain amount of rebound occurred after the tamper reached the lowest point. For tamping repeatedly, the calculated crater depth increased accordingly. However, the increment of each tamping decreased, indicating the decreasing reinforcement efficiency in each tamping. The proposed model captured typical trends in the time-history curve of the tamper displacement by single and multiple impacts.
As seen from
Figure 5 and
Figure 6, the increment of the crater depth decreased with the tamping numbers, meaning that the efficiency of DC decreased as the tamping number increased. Therefore, the least number of tamping times that meet the demands for strengthening the foundation should be determined first. The least number of tamping times is the optimum number of tamping times of DC. The optimum number is always one of the most important issues in the construction of DC because it plays a decisive role in the DC schedule and cost.
The experimental method provided guidance that two adjacent crater depths should be less than 5 mm to determine the optimum number of tamping times. Nevertheless, it lacked a sufficient theoretical basis. Furthermore, the adjacent crater depths may be different due to different soil, the energy level of DC and the value of a heavier tamper and dropping distance. Therefore, the method [
31] does not have universal applicability and is more difficult to guide the DC practice.
The relationship of the crater depth and the tamping number was analyzed further according to the result of the DC mathematical model and the large-scale tests. Additionally, a method for determining the optimal number of tamping times for DC was presented in this research. Taking the group of 47.94 t × 20.86 m as an example, the theoretical and actual values of the crater depth for 10 tamping times was as shown in
Table 1. In order to evaluate the DC efficiency of each tamping, an index of the crater depth ratio could be defined with Equation (22):
where
λi is the
ith tamping ratio,
i = 1, 2, 3 ……, and
si is the crater depth of the
ith tamping.
Si is the cumulative crater depth for the total tamping of
i times.
Table 1 shows that the crater depth ratio decreased with the tamping times. After six tamping times, the crater depth with further tamping was less than 10 cm and the tamping ratio of the seventh tamping time was only 4.263%. This meant that the contribution of the seventh tamping to the total crater depth of the first seven times was less than 5%, and the contribution of the later tamping to the whole DC was lower. Therefore, the conclusion could be made that tamping six times was the optimal number of tamping times in this project. The crater depth ratio in this study was defined by the current cumulative crater depth, which was much easier to calculate and analyze. Moreover, this also agreed with the objective fact that the efficiency of the DC decreased for multiple tamping times.
5. Conclusions
Based on the principle, a simple mathematical model has been developed in this study to analyze the time-domain displacement of the tamper in the DC progress. Combined with a series of large-scale DC tests, the accuracy and application of the model has been verified. The conclusions are as follows:
(1) The mathematical model proposed is simple in form and clear in concept. The basic parameters, which are easy to obtain, cover the main factors of the DC practice;
(2) The proposed mathematical model can better reveal the time-domain characteristics of the tamper displacement in a single and multiple tamping setting. Whereas the cumulative crater depth increases with tamping times, the increments and DC efficiency decrease with repeated impacts;
(3) A simple index of the crater depth ratio is presented to facilitate the evaluation of the efficiency of single tamping and to determine the optimal number of tamping times;
(4) In this study, the tamper that was chosen as the research object and the DC progress was simplified to a spring-damping model. It is true that the series responses of the soil during DC including deformation characteristics, stress distribution, and propagation were not involved in this study. Further study may be carried out for these aspects. However, the proposed model can be useful for predicting and analyzing the development of the crater depth, which benefits the DC practice.
Author Contributions
Conceptualization, X.L. and H.Y. (Hui Yang); methodology, X.L.; validation, J.Z., H.Y. (Huanan Yu) and J.C.; for-mal analysis, X.L.; investigation, G.Q.; resources, H.Y. (Huanan Yu).; data curation, J.C.; writing—original draft preparation, X.L.; writing—review and editing, H.Y. (Hui Yang); visualization, J.Z.; funding acquisition, G.Q. All authors have read and agreed to the published version of the manuscript.
Funding
This research was supported by the National Key R&D Program of China (No. 2018YFB1600100), the National Natural Science Foundation of China (No. 51908066, 52008042), the National Science Foundation of Hunan Province, China (No. 2020JJ5576), and the Excellent Youth Project of Hunan Providence Department of Education (No. 19B030). The first author would like to acknowledge the support of the China Scholarship Council.
Institutional Review Board Statement
“Not applicable” for studies not involving humans or animals.
Informed Consent Statement
“Not applicable” for studies not involving humans.
Data Availability Statement
Some or all data, models, or code that support the findings of this study are available from the corresponding author upon reasonable request.
Acknowledgments
We would like to thank all our colleagues, editors and reviewers who provided guidance and advice on this article.
Conflicts of Interest
The authors declare no conflict of interest.
References
- Wu, S.F.; Wei, Y.Q.; Zhang, Y.; Cai, H.; Du, J.; Wang, D.; Yan, J.; Xiao, J. Dynamic compaction of a thick soil-stone fill: Dynamic response and strengthening mechanisms. Soil Dyn. Earthq. Eng. 2020, 129, 105944. [Google Scholar] [CrossRef]
- Shen, M.F.; Martin, J.R.; Ku, C. A case study of the effect of dynamic compaction on liquefaction of reclaimed ground. Eng. Geol. 2018, 240, 48–61. [Google Scholar] [CrossRef]
- Yu, H.; Zhu, X.; Qian, G.; Gong, X.; Nie, X. Evaluation of phosphorus slag (PS) content and particle size on the performance modification effect of asphalt. Constr. Build. Mater. 2020, 256, 119334. [Google Scholar] [CrossRef]
- Rollins, K.M.; Kim, J. Dynamic Compaction of Collapsible Soils Based on US Case Histories. J. Geotech. Geoenviron. Eng. 2010, 136, 1178–1186. [Google Scholar] [CrossRef]
- Li, X.; Zhang, K.F.; Ma, X.Y. New Method to Evaluate Strengthen Efficiency by Dynamic Compaction. Int. J. Geomech. 2020, 20, 04020024. [Google Scholar] [CrossRef]
- Hu, R.L.; Yue, Z.Q.; Tham, L.G.; Wang, L.C. Digital Image Analysis of Dynamic Compaction Effects on Clay Fills. J. Geotech. Geoenviron. Eng. 2005, 131, 1411–1422. [Google Scholar] [CrossRef]
- Feng, S.J.; Du, F.L.; Chen, H.X.; Mao, J.Z. Centrifuge modeling of preloading consolidation and dynamic compaction in treating dredged soil. Eng. Geol. 2017, 226, 161–171. [Google Scholar] [CrossRef]
- Ménard, L.; Broise, Y. Theoretical and practical aspect of dynamic consolidation. Géotechnique 1975, 25, 3–18. [Google Scholar] [CrossRef]
- Zekkos, D.; Kabalan, M.; Flanagan, M. Lessons Learned from Case Histories of Dynamic Compaction at Municipal Solid Waste Sites. J. Geotech. Geoenviron. Eng. 2013, 139, 738–751. [Google Scholar] [CrossRef]
- Lenards, G.A.; Cutter, W.A.; Holtz, R.D. Dynamic Compaction of Granular Soil. Transp. Res. Rec. 1980, 106, 35–44. [Google Scholar]
- Zhang, R.Y.; Sun, Y.J.; Song, E.X. Simulation of dynamic compaction and analysis of its efficiency with the material point method. Comput. Geotech. 2019, 116, 103218. [Google Scholar] [CrossRef]
- Karray, M.; Lefebvre, G.; Ethier, Y.; Bigras, A. Influence of particle size on the correlation between shear wave velocity and cone tip resistance. Can. Geotech. J. 2011, 48, 599–615. [Google Scholar] [CrossRef]
- Nazhat, Y.; Airey, D. The kinematics of granular soils subjected to rapid impact loading. Granul. Matter 2015, 17, 1–20. [Google Scholar] [CrossRef]
- Jia, M.C.; Yang, Y.; Liu, B.; Wu, S. PFC/FLAC coupled simulation of dynamic compaction in granular soils. Granul. Matter 2018, 20, 76. [Google Scholar] [CrossRef]
- Jia, M.; Liu, B.; Xue, J.; Ma, G. Coupled three-dimensional Discrete Element–finite Difference Simulation of Dynamic Compaction. Acta Geotech. 2021, 16, 731–737. [Google Scholar] [CrossRef]
- Hu, R.; Yeung, M.R.; Lee, C.F.; Wang, S. Mechanical behavior and microstructural variation of loess under dynamic compaction. Eng. Geol. 2001, 59, 203–217. [Google Scholar] [CrossRef]
- Wang, W.; Chen, J.J.; Wang, J.H. Estimation method for ground deformation of granular soils caused by dynamic compaction. Soil Dyn. Earthq. Eng. 2017, 92, 266–278. [Google Scholar] [CrossRef]
- Lee, F.H.; Gu, Q. Method for Estimating Dynamic Compaction Effect on Sand. J. Geotech. Geoenviron. Eng. 2004, 130, 139–152. [Google Scholar] [CrossRef]
- Feng, S.-J.; Du, F.-L.; Shi, Z.-M.; Shui, W.H.; Tan, K. Field study on the reinforcement of collapsible loess using dynamic compaction. Eng. Geol. 2015, 185, 105–115. [Google Scholar] [CrossRef]
- Indraratna, B.; Chu, J.; Rujikiatkamjorn, C. Ground Improvement Case Histories: Compaction, Grouting and Geosynthetics; Butterworth-Heinemann: Oxford, UK, 2015. [Google Scholar] [CrossRef]
- Li, X.; Li, J.; Ma, X.Y. Numerical Study of the Dynamic Compaction Process considering the Phenomenon of Particle Breakage. Adv. Civ. Eng. 2018, 2018, 1–10. [Google Scholar] [CrossRef]
- Feng, S.J.; Tan, K.; Shui, W.H. Dynamic compaction of ultra-high energy in combination with ground replacement in coastal reclamation areas. Mar. Georesour. Geotechnol. 2014, 33, 109–121. [Google Scholar] [CrossRef]
- Scott, R.A.; Pearce, R.W. Soil Compaction by Impact. Géotechnique 1975, 25, 19–30. [Google Scholar] [CrossRef]
- Qian, J.H.; Qian, X.D.; Zhao, W.B.; Shuai, F. Theory and Practice of Dynamic Conslidation. Chin. J. Geotech. Eng. 1986, 8, 1–17. (In Chinese) [Google Scholar]
- Gómez, S.S.; Geurts, C.P.W.; Metrikine, A. On the importance of soil damping for tall buildings loaded by wind. Eng. Struct. 2018, 163, 426–435. [Google Scholar] [CrossRef] [Green Version]
- Tsang, H.; Chandler, A.M.; Lam, N. Simple models for estimating period-shift and damping in soil. Earthq. Eng. Struct. Dyn. 2006, 35, 1925–1947. [Google Scholar] [CrossRef]
- Pourjenabi, M.; Ghanbariand, M.; Hamidi, E. Numerical modelling of dynamic compaction by sand using different constitutive models. In Proceedings of the 4th ECCOMAS Thematic Conference on Computational Methods in Structural Dynamics and Earthquake Engineering, Rethymno, Greece, 12–14 June 2013; pp. 3195–3202. [Google Scholar]
- Zhou, C.; Jiang, H.; Yao, Z.; Li, H.; Yang, C.; Chen, L.; Geng, X. Evaluation of dynamic compaction to improve saturated foundation based on the fluid-solid coupled method with soil cap model. Comput. Geotech. 2020, 125, 103686. [Google Scholar] [CrossRef]
- Oshima, A.; Takada, N. Evaluation of compacted area of heavy tamping by cone point resistance. In Centrifuge 98, Proceedings of the International Conference Centrifuge 98, Tokyo, Japan, 23–25 September 1998; Kimura, T., Kusakabe, O., Takemura, J., Eds.; A.A. Balkema: Rotterdam, The Netherlands, 1998; pp. 813–818. [Google Scholar]
- Mikasa, M.; Takada, N.; Ikeda, M.; Takeuchi, I. Centrifuge model test of dynamic consolidation. In Centrifuge 88: Proceedings of the International Conference on Geotechnical Centrifuge Modelling, Paris, France, 25–27 April 1988; Corte, J.F., Ed.; CRC Press: Boca Raton, FL, USA, 1988; pp. 185–192. [Google Scholar]
- CECS. Technical Specification for Ground Treatment by Heavy Tamping; CECS 279: 2010; China Association for Engineering Construction Standardization: Beijing, China, 2010. [Google Scholar]
| Publisher’s Note: MDPI stays neutral with regard to jurisdictional claims in published maps and institutional affiliations. |
© 2021 by the authors. Licensee MDPI, Basel, Switzerland. This article is an open access article distributed under the terms and conditions of the Creative Commons Attribution (CC BY) license (https://creativecommons.org/licenses/by/4.0/).


