Article

Performance and Fracture Analysis of Composite Interfaces for Semi-Flexible Pavement

School of Civil Engineering, Guangzhou University, Guangzhou 510006, China
*
Author to whom correspondence should be addressed.
Coatings 2021, 11(10), 1231; https://doi.org/10.3390/coatings11101231
Submission received: 16 September 2021 / Revised: 5 October 2021 / Accepted: 6 October 2021 / Published: 9 October 2021

Abstract

:
Semi-flexible pavement is widely used in pavement engineering due to its excellent rutting resistance; however, it mainly fails due to cracking. Therefore, it is important to understand the properties of the aggregate–mortar–asphalt interfacial transition zone, to better understand the cracking mechanism of the semi-flexible pavement. In this work, we used pull-off tests and digital image analysis technology to compare and analyze the interfacial tensile strength and granite–bitumen–mortar interactions in three types of asphalt (70# matrix asphalt, PG76-22 modified asphalt and S-HV modified asphalt) at different curing ages. The analysis results showed that, for the three different bitumen materials, with settled mortar, the peak interfacial tensile strength values all occurred at approximately 14 d of curing. In addition, the order of the tensile strength followed the order of asphalt penetration degree; the order of the interfacial water damage resistance from weak to strong was 70# asphalt cementation specimen, PG76-22 modified asphalt cementation specimen, and S-HV modified asphalt cementation specimen. The results of this analysis highlight the original contributions of the optimum curing time for the composite interface of semi-flexible pavement materials prepared with different asphalts to reach optimum crack resistance.

1. Introduction

Semi-flexible pavement (SFP) refers to composite pavements that have characteristics of both asphalt and cement concrete, and are formed by filling a special slurry with cement as the main component in the open-graded asphalt mixture with a large void matrix [1,2,3,4]. Semi-flexible pavements are also known as semi-rigid pavements, grouted macadam composite materials, cement grout asphalt composites, asphalt–Portland cement concrete composites (APCCC), and composite cement–asphalt mixtures [5]. The SFP is constructed without the use of expansion, contraction, and construction joints and demonstrates prominent rutting and shoving-corrugation resistance. These new pavement materials possess both the flexible characteristics of asphalt pavement and the high strength (hardness) of concrete pavement [5]. As a result, they have broad application prospects, such as overloaded road surfaces, intersections, and bus stations [6]. However, cracking is the main problem that hinders the acceptance of semi-flexible pavements [7]. In addition, the interfacial bonding strength of the composite material will affect its overall performance [8], and the semi-flexible pavement mortar–asphalt interface is considered the weak link.
In 1960, SFP was first successfully used as airport pavement in France [2,9]. Ever since, there have been numerous studies on the structural design and engineering properties of SFP materials, and the corresponding grouting cement mortar [6,10,11,12,13,14]. Cihackova [15] used wheel tracking, stiffness modules, skid resistance, and low-temperature cracking tests and found that the resistance of SFP against rutting is considerably higher than asphalt mixtures. However, the resistance of SFP against low-temperature cracking is lower than asphalt mixtures. Corradini [16] et al. studied the fatigue properties of SFP by indirect tensile testing, utilizing cylindrical specimens that were directly cored from the existing pavement. This method evaluated the in situ behavior of the materials and found that the SFP had a remarkably longer fatigue life compared to regular asphalt mixtures. Read and Collop also found that, under the recommended test conditions (120 ms loading time and test temperature less than 30 °C), tensile failure was the dominant failure mode in the asphalt mixture specimens [17].
The formation of low-temperature cracks can affect pavement performance, as well as lead to a serious reduction in service life [15,18,19,20]. Semi-flexible pavement materials are a combination of organic and inorganic composite materials, and the SFP interface will directly affect its mechanical properties and road performance. In practical applications, this type of pavement structure will easily crack and have poor fatigue resistance, mainly due to weak interfacial bonding [21]. However, there have been few studies on SFP interfaces and how they affect its material properties. Hou et al. showed that the crack paths will appear along the interface between the asphalt-coated aggregates and the hardened CP. This was attributed to a poor bonding strength between the hardened CP and bitumen binder [22]. Xu et al. also used three types of interface modifiers to optimize the asphalt-mortar interface, showing that the pavement performance of the SFP was affected by the bond strength of the cement–asphalt interface, and poor contact at the interface caused insufficient strength and poor deformation [23]. Zhou analyzed the failure mode of SFPM, and showed that damage in SFP usually occurs at the interface between the cement and asphalt, and damage from the cement itself [23,24]. Hou et al. also found that the cement paste is stiffer than the asphalt mixture, resulting in a significant difference in the interfacial bonding properties and the elastic modulus of the matrix asphalt mixture in the SFP, leading to a reduction in the strength and tensile strain of the SFP [22]. Cai et al. identified two characteristics in SFP by employing micromechanical models and nanotechniques, including nanoindentation (NI), scanning electron microscopy (SEM), and energy dispersive spectrum analysis (EDS). The results showed there were four different layers in the asphalt phase of the SFP, and the interface of the asphalt–cement phase was more complex than the aggregate–asphalt mastic phase [21].
According to the previous studies, the SFP will have high resistance to rutting and better moisture stability than conventional asphalt mixture; however, its low-temperature cracking resistance will decrease due to the brittleness of the hardened cement paste [24]. Hence, the adhesion between the grouting materials and the bituminous binder is a crucial parameter for evaluating the resistance of crack-induced damages. Owing to its poor low-temperature cracking resistance, SFP is only suitable for use in some regions. Therefore, to utilize SFP in more areas of the world, the bonding performance of the composite interface in the SFP needs to be investigated.
To assess the interfacial bonding performance of the SFP, this study used a pull-off test and digital image analysis technology to analyze the granite–asphalt mortar specimens at different curing times to assess the interface interactions and tensile strength. In addition, we determine bonding strength changes with the curing age of the asphalt–mortar interface, to determine the best curing time for the different asphalts used in SFP.

2. Experimental

The materials used in this study consisted of bitumen, granite, and cement mortar.

2.1. Raw Materials

2.1.1. Bitumen

The bitumen materials used for the surface of aggregate were 70# petroleum bitumen, PG76-22 modified asphalt, and S-HV modified asphalt, all produced by Shell Xinyue (Foshan) Asphalt Co., Ltd. (Guangzhou, China). The basic properties of three bitumen materials are given in Table 1, Table 2 and Table 3 [25].

2.1.2. Test Aggregates

Granite was selected as the test aggregate. As a type of magmatic rock, granite is mainly composed of feldspar, quartz, biotite, and other minerals and, owing to its high density, it has a denser texture and good thermal stability. When heated in an oven, some of the water was removed before reacting, as the material exhibits poor physical permeability and poor water absorption. When placed in a curing box at greater than 80% humidity, the material will not absorb a considerable amount of water. Thus, the moisture will not penetrate the asphalt interface from the aggregate; otherwise, it could affect the test results. The basic physical properties of granite are shown in Table 4, and the granite used in this work were pitted granite, which was purchased from the Guangzhou Stone Market. The granite specimens were formed by a double-sided cutting machine in the laboratory, and the cutting machine is shown in Figure 1. The molded granite specimen was 4 cm × 3 cm × 3 cm in size, and the specimen is shown in Figure 2.

2.1.3. Cement Mortar

The mortar was prepared using water, cement, and special additives (including sand), which was provided by Guangdong Longhu Technology Co., Ltd. (Shantou, China) [26], using a ratio of 0.23 of water to powder (cement and additives), and a cement/additive ratio of 45:55 to produce the cement mortar. An image of the prepared mortar is shown in Figure 3.
This work utilized white Portland cement, and the initial setting time of the test piece was no longer than 45 min, with a final setting time of no longer than 390 min, and a standard strength grade of 42.5R. The chemical composition and physical properties are shown in Table 5, Table 6 and Table 7.

2.2. Specimen Preparation

2.2.1. Forming the Asphalt Film on the Granite Surface

After using a cutting machine (TNS Infratest Testing Systems CO., LTD., Munich, Germany) to shape the specimen, we used a high-pressure water gun to rinse the surface. We then placed the granite specimen in an oven at 135 °C and dehydrated it for 6 h. The specimen was then marked and weighed as granite specimen m 0 . Then, the temperature was adjusted to 175 °C and the specimen was heated for 2 h.
The 70# petroleum asphalt, PG76-22-modified asphalt, and S-HV-modified asphalt were prepared and placed in the oven for the test. The upper surface of the heated granite specimen was placed on the asphalt for 3–5 s. Then, the upper surface of the granite specimen was attached to a layer of asphalt.
We then placed the granite specimen with the accompanying asphalt layer in the oven, and placed the 70# petroleum asphalt specimen in the oven at 135 °C. In addition, the S-HV modified asphalt and PG76-22 modified asphalt specimens attached were placed in the oven at 165 °C and heated for 20 min, causing the asphalt to flow freely and evenly on the upper surface of the granite specimen, forming a relatively uniform asphalt film.
Finally, the asphalt-coated granite specimen was cooled for one hour. Then, we weighed the asphalt-coated granite specimen ( m 1 ), using Equation (1) to calculate the asphalt film thickness (d)
d = m 1 m 0 A ρ
where d is the asphalt film thickness ( μ m ), m 0 is the weight of the granite specimen ( g ), m 1 is the weight of the granite specimen with the asphalt film ( g ), A is the area of granite covered with asphalt ( cm 2 ), and ρ is the density of the asphalt ( g / cm 3 ). The film thickness is shown in Table 8, and the molded test piece is shown in Figure 4.

2.2.2. Preparing Mortar and Test Specimen

Cement mortar samples were prepared according to the JGJ/T 70-2009 standard [27]. First, we formed the mold before pouring the mixture, which was cut into a square piece with a side length of 3 cm using a sandwich wood board, as shown in Figure 5a. We then used an oil-based pen and a steel ruler to measure 1.1 cm on the small wooden block and marked the scale. Then, a 0.5 cm wide tape was used to fix the small wooden block and form the mold according to the scale line. Note that the small wooden blocks were sealed without leaving any gaps during splicing; otherwise, the mortar would leak out of the gap when pouring the mortar. The test piece is shown in Figure 5b.
Then, we poured the prepared cement mortar into the mold and allowed it to cure at room temperature for 24 h. Afterward, it was placed in a constant temperature curing box with greater than 95% humidity, and at a temperature of 20 °C for 24 h. The mold was then removed, and the test piece was placed in the curing box. After aging for a prescribed time, the test piece was removed, and a layer of mortar was scraped off the surface of the test piece with a utility knife. Then, we used sandpaper to reduce the mortar to a thickness of 1 cm ± 0.1 cm, as shown in Figure 5b. Afterward, we used AB glue to glue the mold at both ends of the test piece, as shown in Figure 5c. The final test specimen is shown in Figure 5d.

2.3. Methods

2.3.1. Pull-Off Test

As shown in Figure 6, we used a universal testing machine (MTS SYSTEMS (CHINA) CO., LTD. Shenzhen, China) to perform the uniaxial tensile test with a pull rate of 1 mm/min, and we measured the peak force.
To control for errors, three sets of tests were conducted for each test condition in this work, and we calculated the average of three test results. If the ratio of the average to the maximum and minimum was greater than 15%, the test value was considered invalid and the test was rerun, especially if one of the ratios was greater than 10%, and the other was less than 10%, whichever was smaller. The average of each value was used as the test result, and when the ratio was between 15% and 10%, the median of the three values was taken as the test result. If the ratio was less than 10%, the average of the three values was taken as the test result.
Before starting the test, we placed the test specimen in a 25 °C constant-temperature curing box for 12 h to control the test variables to reduce error. The specimen interface stress, Rm, was calculated by Equation (2):
R m = F p A
where R m is the stress at the interface ( MPa ), F p   is the peak force at the interface ( N ), and A is the interface area ( cm 2 ).

2.3.2. Digital Image Processing Technology

To evaluate the adhesion behavior of the asphalt–mortar on the fractal surface more accurately, we used digital image-processing technology to count the area ratios of the mortar and asphalt on the fracture surfaces.
Digital imaging uses numerical values to represent the surface of an object, and pixel points divide the object surface into discrete units, where the quantized gray numerical values represent the gray level. Digital image-processing consists of processing a series of values in the digital imager to obtain the desired result. Numerical image-processing technology can be used to perform image preprocessing, image segmentation, image expression, image pattern recognition, and feature extraction to analyze digital images. This analysis technique uses two main methods: spatial processing and frequency domain processing. In spatial processing, the operation is conducted on the pixels in the image, while in frequency domain processing, the numerical image is converted into a two-dimensional function to create other orthogonal coordinate bases for corresponding processing. In this study, we utilized airspace processing technology [28].

3. Results and Discussion

3.1. Pull-Off Test Results

In this work, 45 groups of pull-off tests were conducted, and the test results were as follows (Figure 7).
When the water/powder ratio of the cement mortar was 0.23, three types of asphalt were used as the cement agents for curing times of 3 and 7 d. The order of interfacial tensile strength followed: PG76-22 modified asphalt > 70# petroleum asphalt > S-HV modified asphalt. At curing times of 21–28 d, the interfacial tensile strength of the specimens with 70# petroleum asphalt as the cementing agent decreased rapidly, and the strength was the lowest among the three asphalt types. This was attributed to the 70# petroleum asphalt, which was not as dense and durable as the other two asphalts. Moisture can also penetrate the asphalt faster, causing asphalt emulsification and interfacial bonding failure. When the S-HV modified asphalt was used as an interfacial binder, the tensile strength of the interface increased rapidly during the early stages of curing, and reached an average standard after 14 d, which was the peak tensile strength.
In summary, we found that during the early stages of curing, moisture ingress into the mortar accelerated the hydration of the mortar and enhanced its strength. As a result, the tensile strength of the interface increased with increased aging time and, during the later stages of curing, moisture ingress caused the asphalt to emulsify. In addition to the failure of the asphalt–granite interfacial bond, both conditions can cause a decrease in the tensile strength of the interface.

3.2. Image Processing and Analysis of Fracture Surface

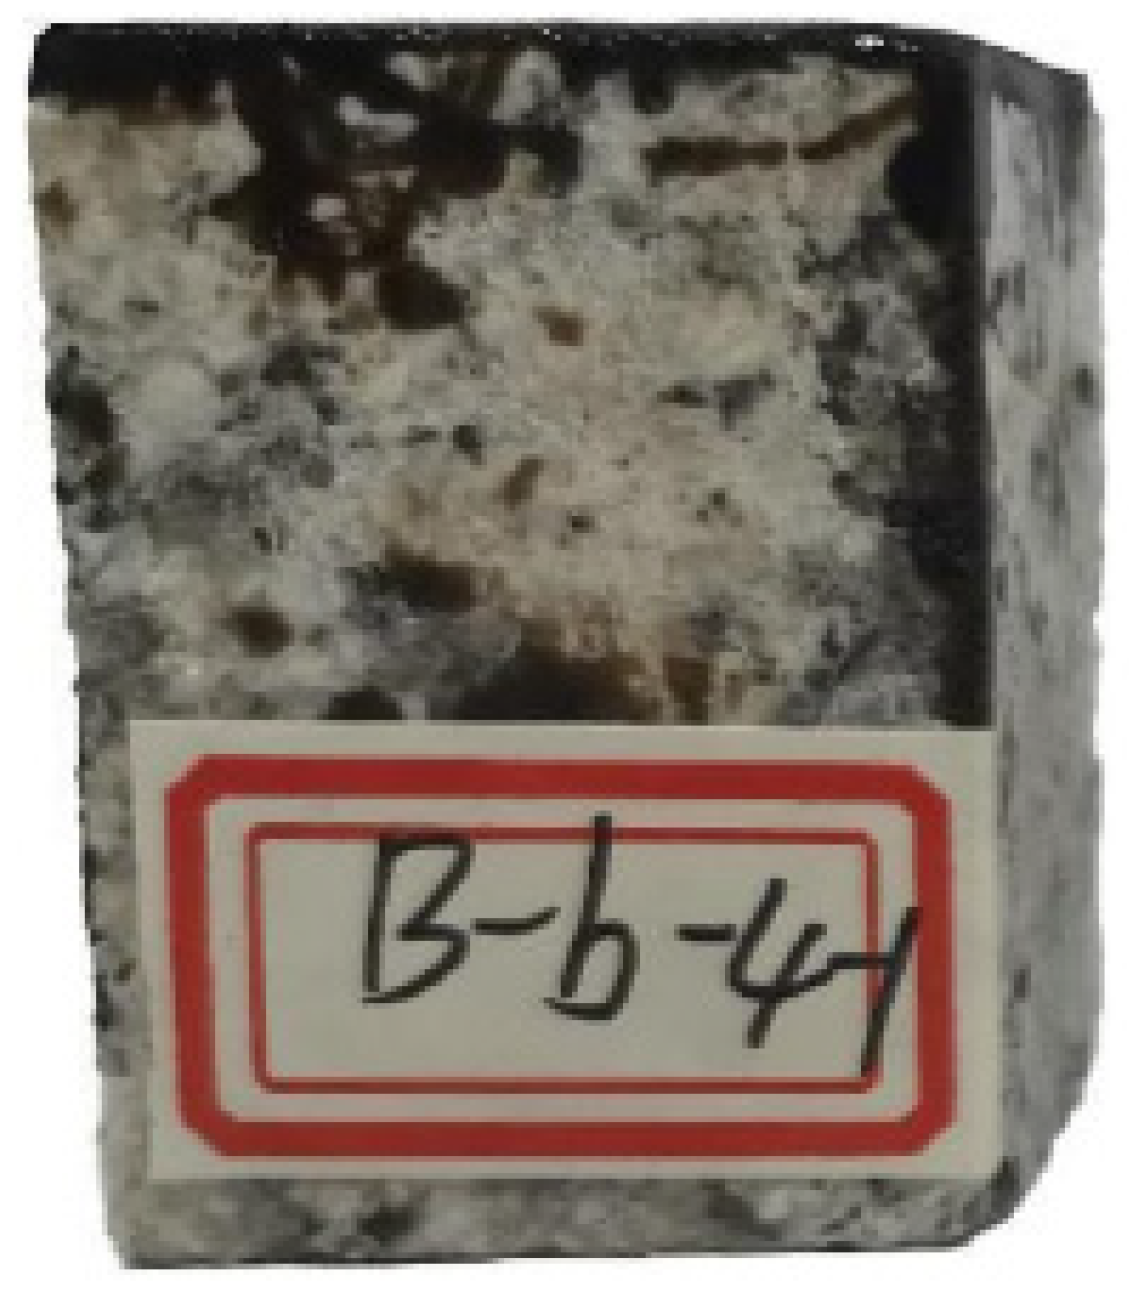
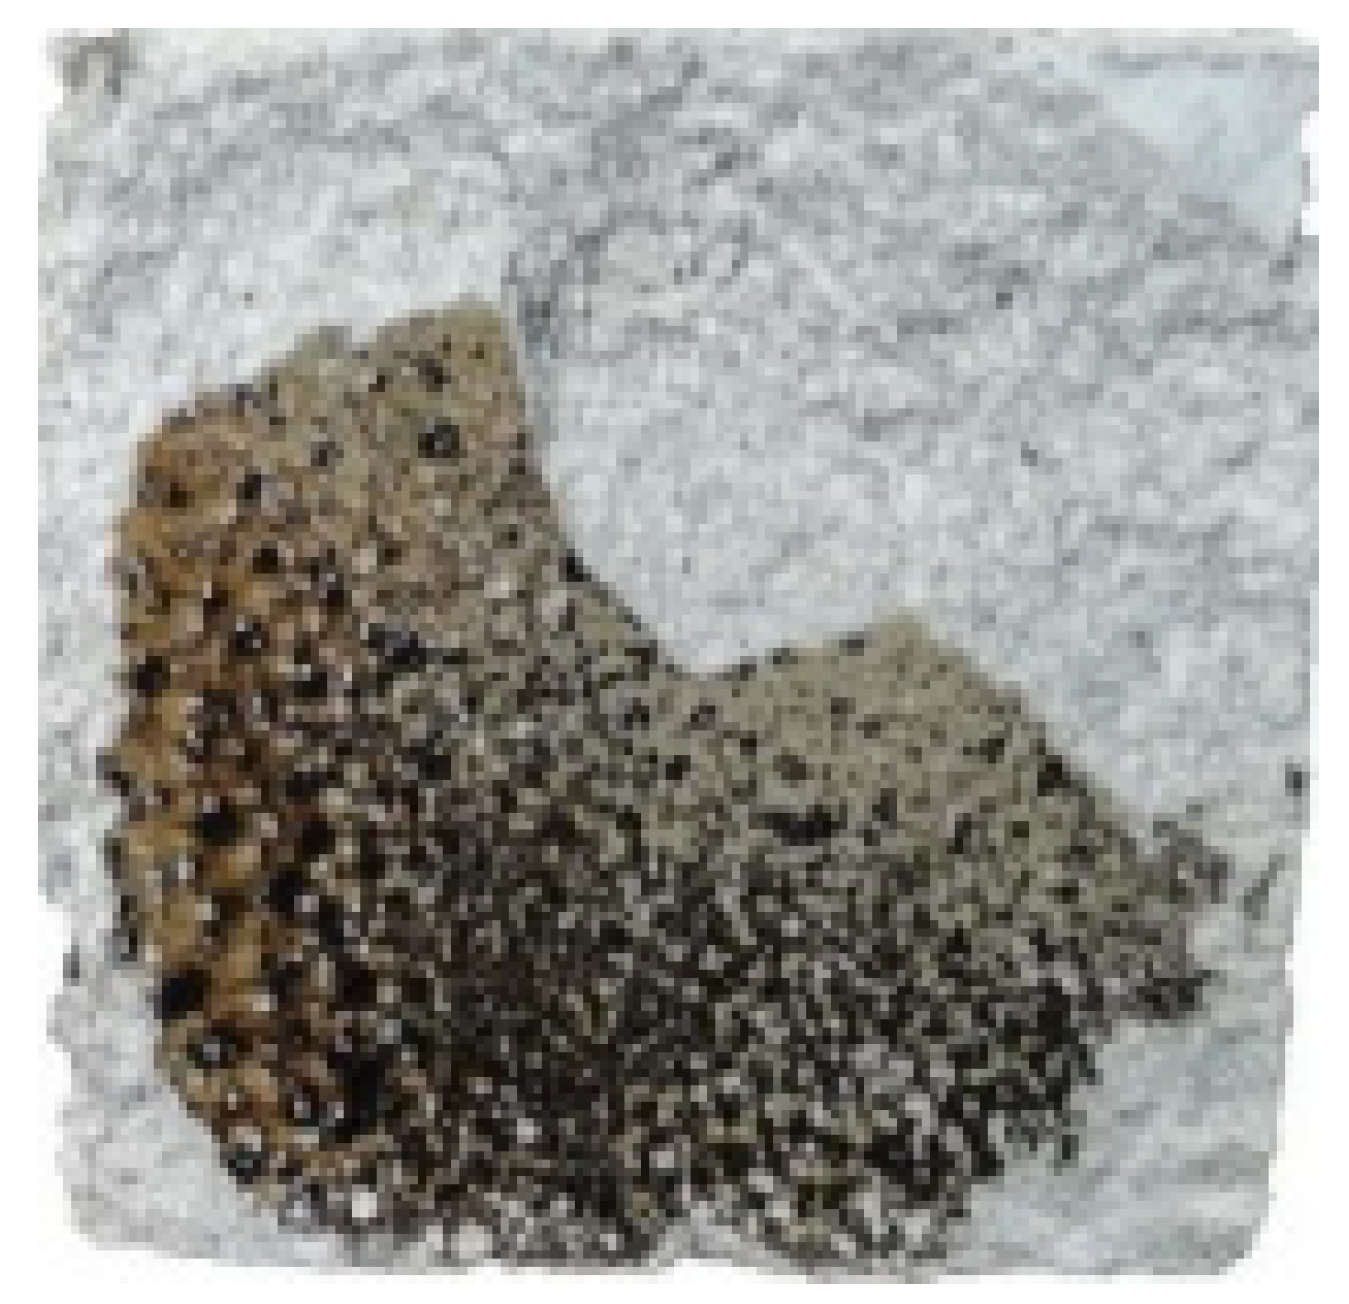
Three materials with different colors appeared on the fracture surface, namely, asphalt, the interface, and the mortar, as shown in Figure 8, where the gray–black dots in the image are asphalt, the interface is dark brown, and the gray–white material is the mortar.
We first conducted image preprocessing. Due to the noise in the spatial domain while acquiring the digital images, the images had distorted details, which caused large errors in image analysis. To reduce the effect of noise on the digital images, we preprocessed the digital images before conducting the analysis. In this work, we used denoising, image enhancement, and other imaging technologies to process the digital fracture surface image. Some studies have indicated that the use of wiener filtering and median filtering to denoise digital images may also provide a good denoising effect [29]. The image-processing results are shown in Figure 9. After image noise reduction, the images were blurred at the junction of the two substances, causing large errors in image segmentation. Therefore, after the denoising process, the images were enhanced, to remove irrelevant information and enhance regional contrast.
Next, we used image grayscale and threshold selection, using MATLAB 2018 software to analyze and process the digital images to show the fracture surface. The second-developed program, as well as the original software, were used to analyze and process the pixels in the images. A grayscale image was regarded as a two-dimensional function of f (x, y), where (x, y) represented the spatial plane coordinates, and the function value f represented image brightness, which was termed “gray”, to express the brightness of each image. Each (x, y) coordinate point in the image corresponded to a gray value, and image information and gray values for all the coordinate points in the image were used to form a digital image. This was denoted as a digitization of the coordinate values by sampling, and the digitization of the gray values was denoted by quantization.
The gray values for each coordinate point were divided into 266 small divisions, ranging from pure black to pure white, and were represented by values ranging from 0 to 255, where 0 indicated pure black and 255 indicated pure white. When taking a photo, the gray value displayed on the picture was different because of varying luminous flux, which was reflected by the different materials. On this basis, we analyzed the gray values on the coordinate point to determine the composition and area ratio of the materials in the photos. Non-linear, linear, and piecewise linear transformations were the most-used gray-scale transformation methods.
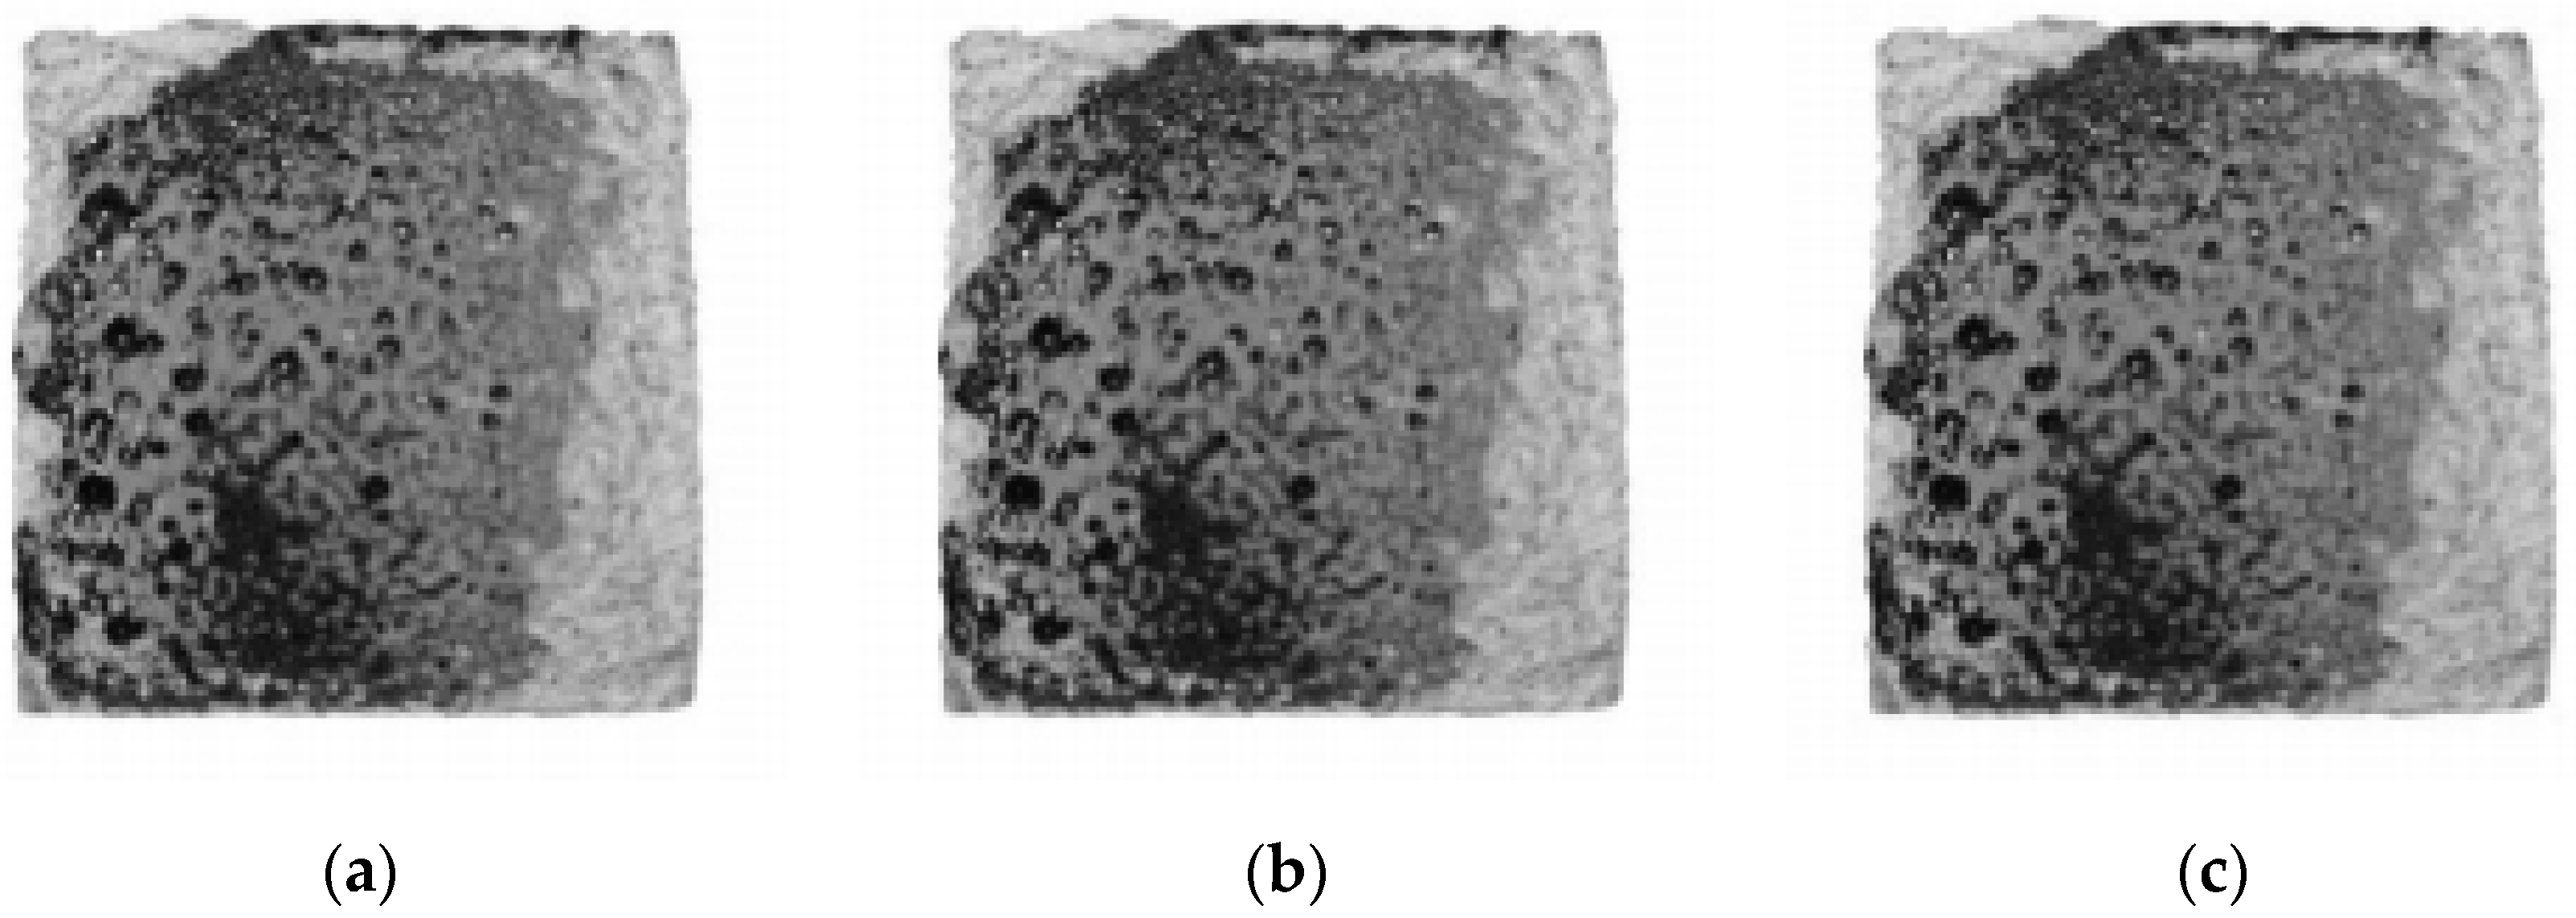
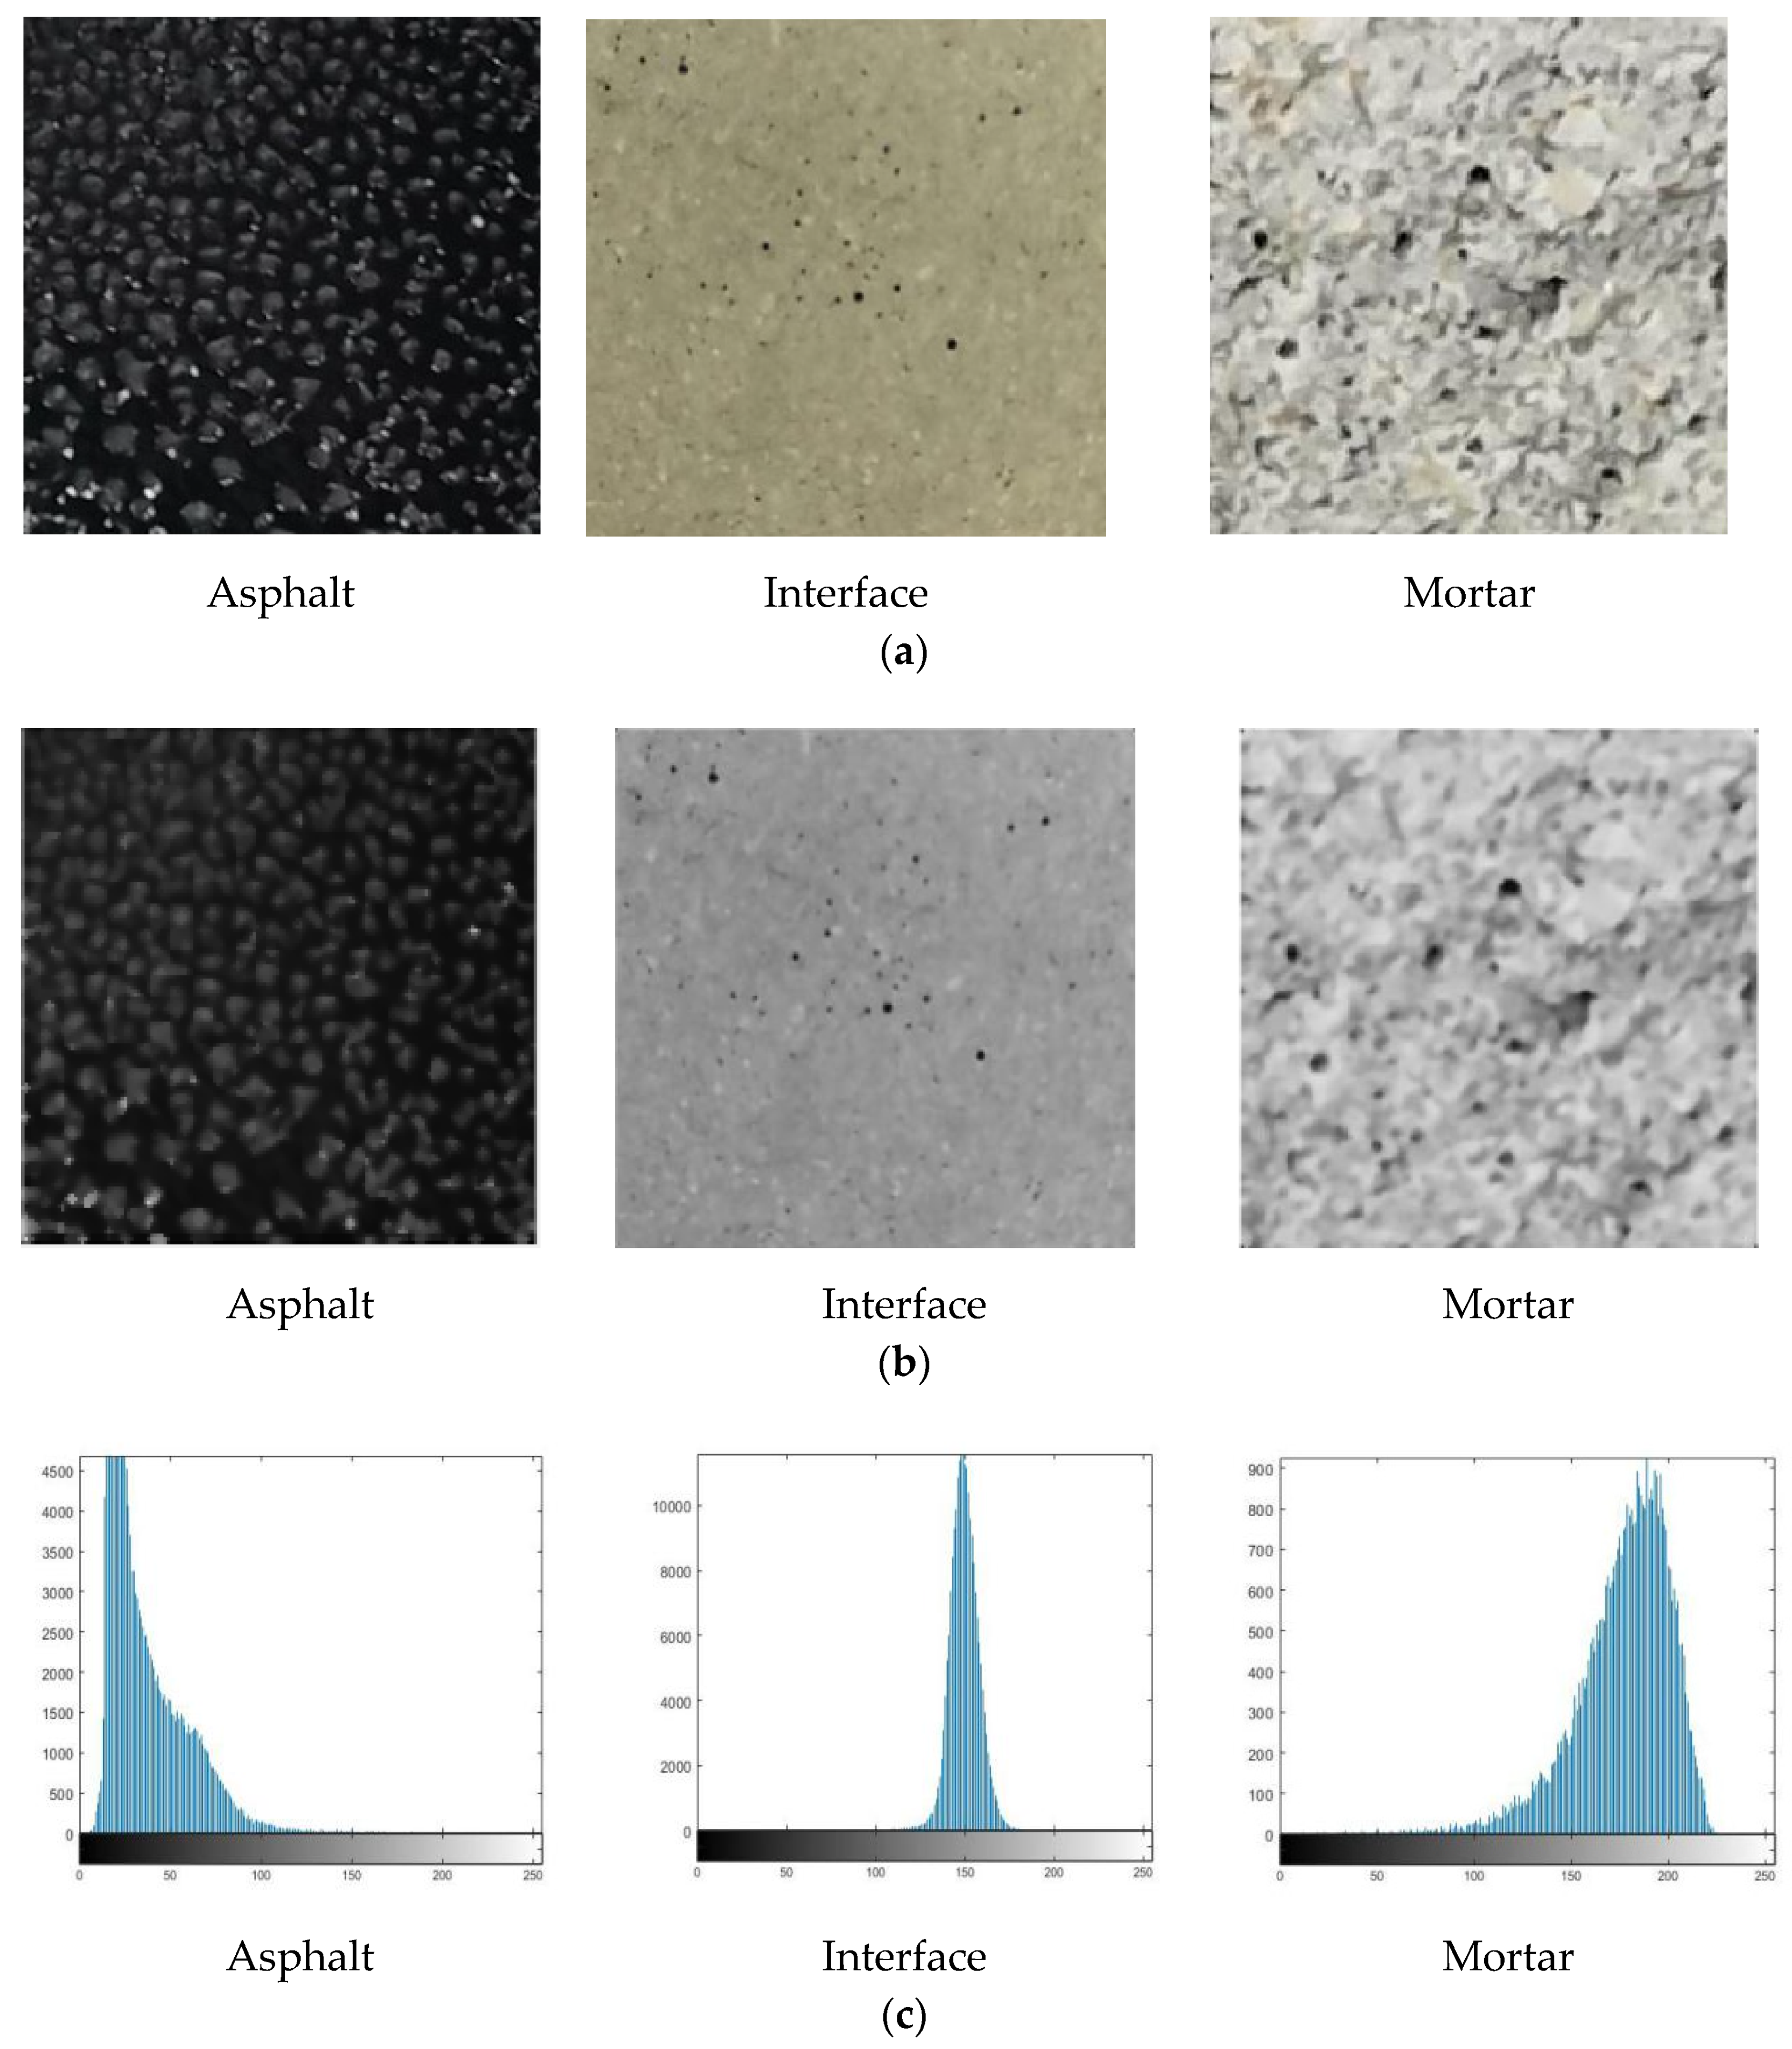
This work utilized the three-stage piecewise linear transformation method for piecewise linear transformation to divide the asphalt, interface, and mortar on the fracture surface into different gray levels. We obtained 10 pictures of the mortar, interface, and asphalt sections in the different fracture surfaces, as shown in Figure 10. The statistical analysis results showed that the mortar on the fracture surface was gray–white, with a gray range of ~160–255, and the interface was gray, with a gray range of 100–160, and the asphalt was gray–black, with a gray range of 0–100.
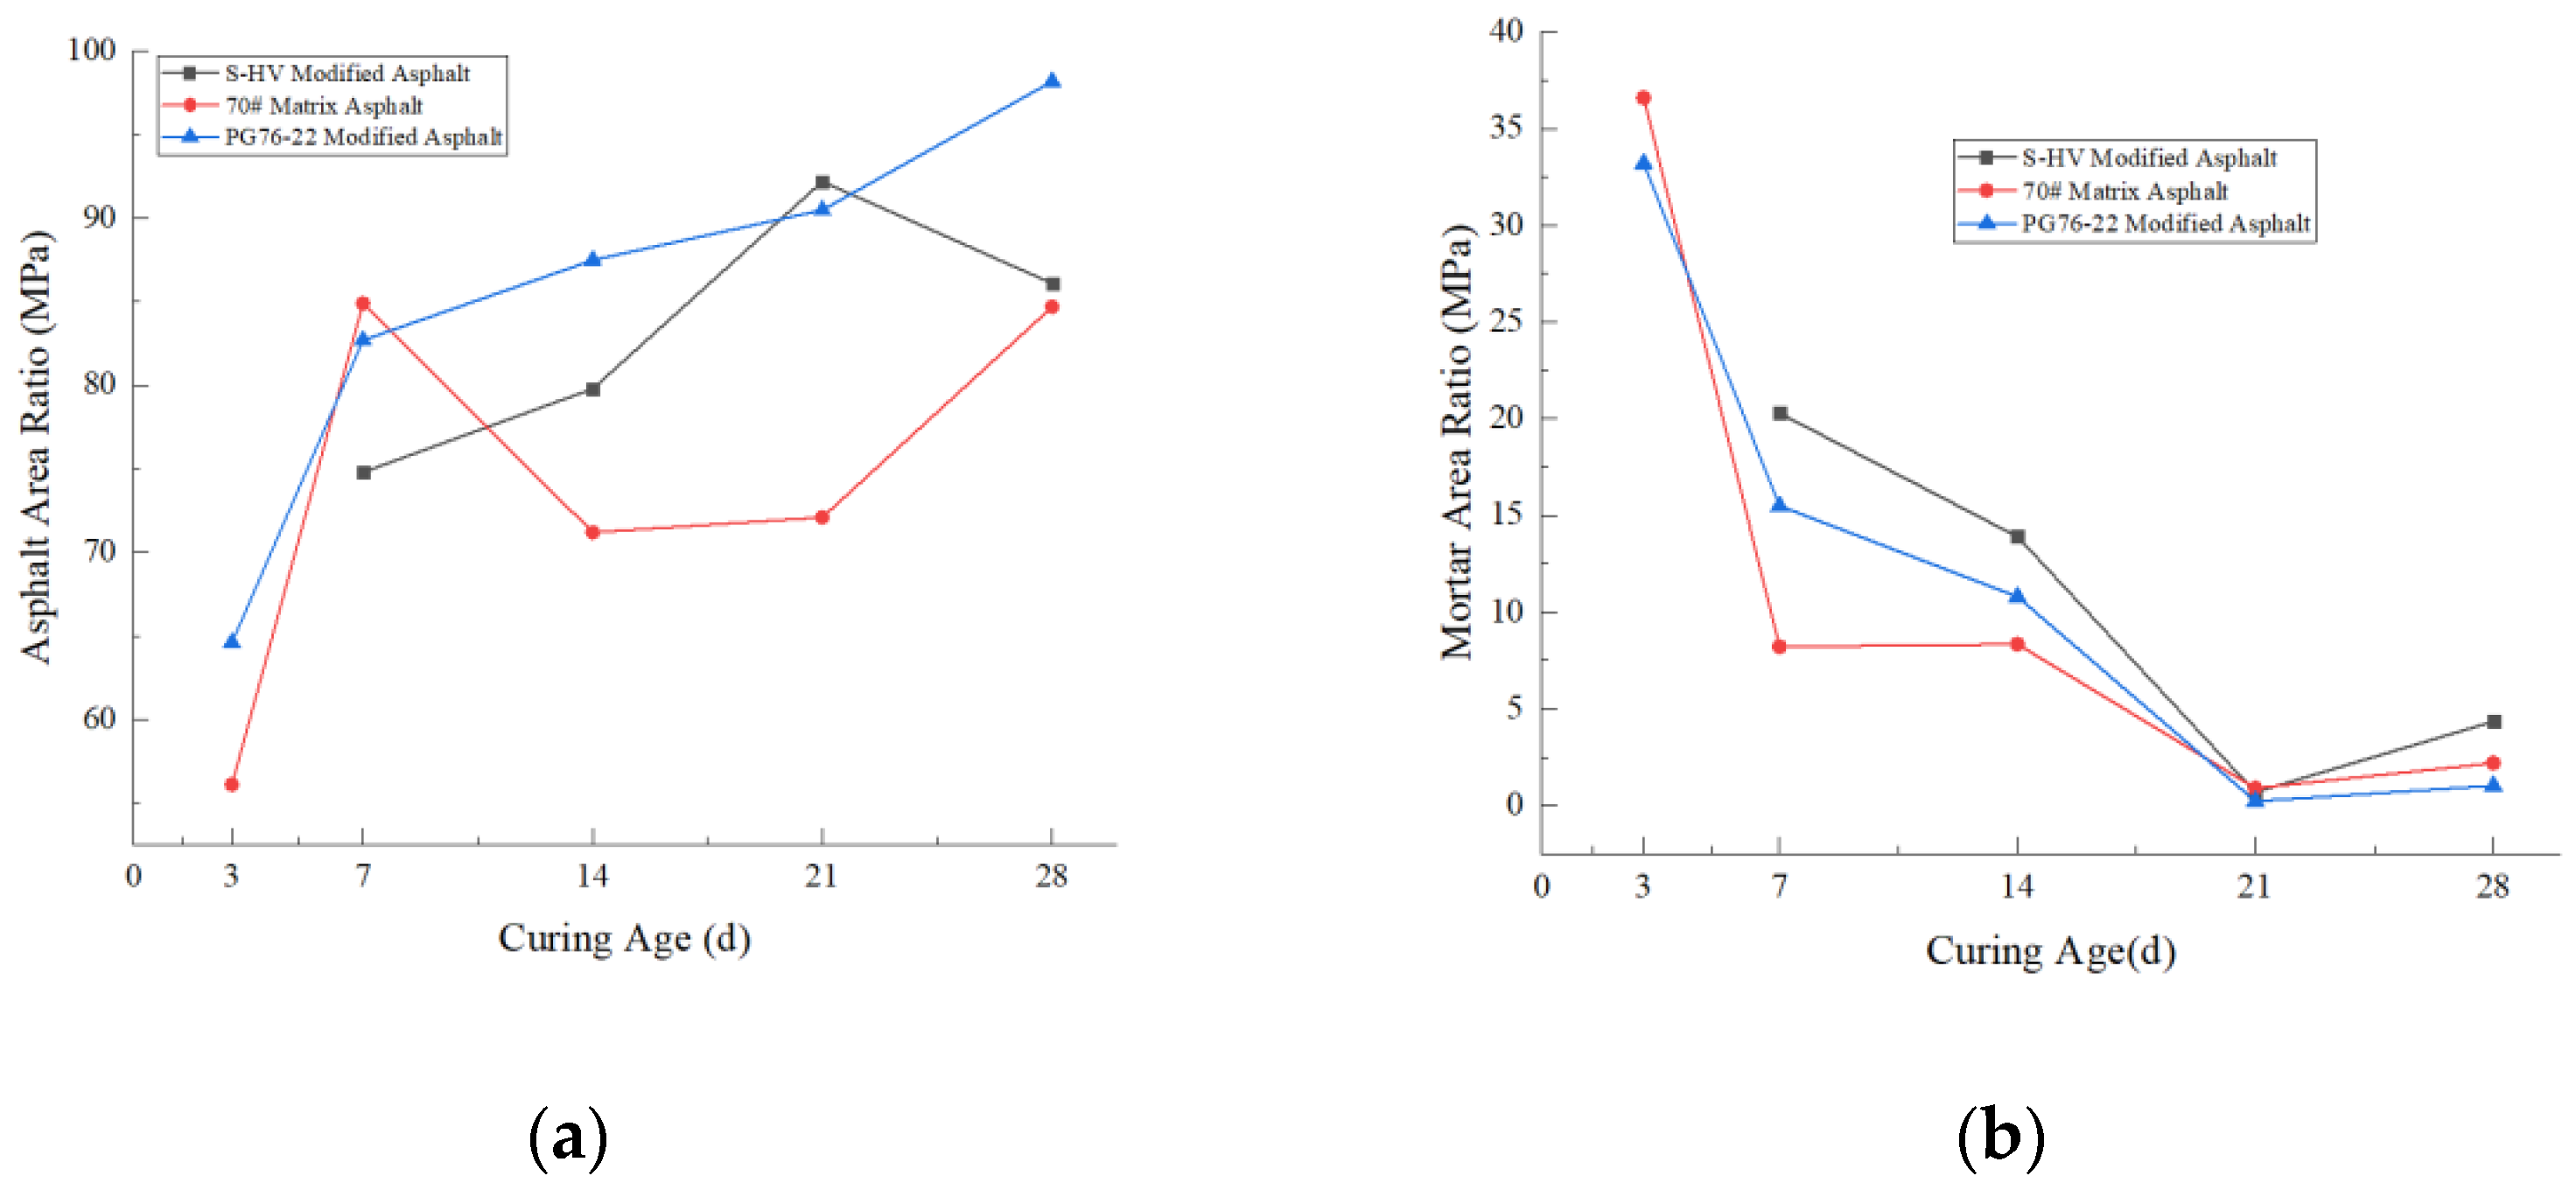
This work also calculated the proportion of the asphalt and mortar area, showing that the three types of asphalt binder on the granite fracture surfaces varied with curing age, as shown in Figure 11. After three days, the specimens with 70# petroleum asphalt and mortar fractured during the test, because of the insufficient tensile strength of the mortar.
As shown in Figure 11, for the specimens cured for three days, the mortar accounted for the largest area. Except when using PG76-22 as a binder, the asphalt area accounted for the smallest proportion. The mortar area proportion continued to decline with increasing curing age [30,31], possibly for the following reasons. As the curing age increased, the hydration reactions in the cement mortar continued, and the tensile strength of the cement mortar increased, resulting in a decrease in the potential mortar fracture performance of the specimen when subjected to tensile testing. As the curing age increased, the interactions between the asphalt and mortar increased, which increased the stress range of the mortar, resulting in cracks at the interface. Finally, with prolonged curing time, the continuous intrusion of moisture caused the asphalt to emulsify, which caused the failure in interfacial bonding and caused the asphalt to crack at the interface.
The asphalt area accounted for the overall upward trend with prolonged aging time. The area ratio of asphalt dropped suddenly after 14 d, when PG76-22 was used as the interfacial binder. Quartz was present on the granite surface, and the adhesion of quartz and asphalt is poor; thus, the asphalt peeled off when the quartz was pulled, and the proportion of asphalt area suddenly decreased. Then, owing to the emulsification of the asphalt, the cohesive forces of the asphalt itself decreased, causing the asphalt to eventually fracture.
As noted in 
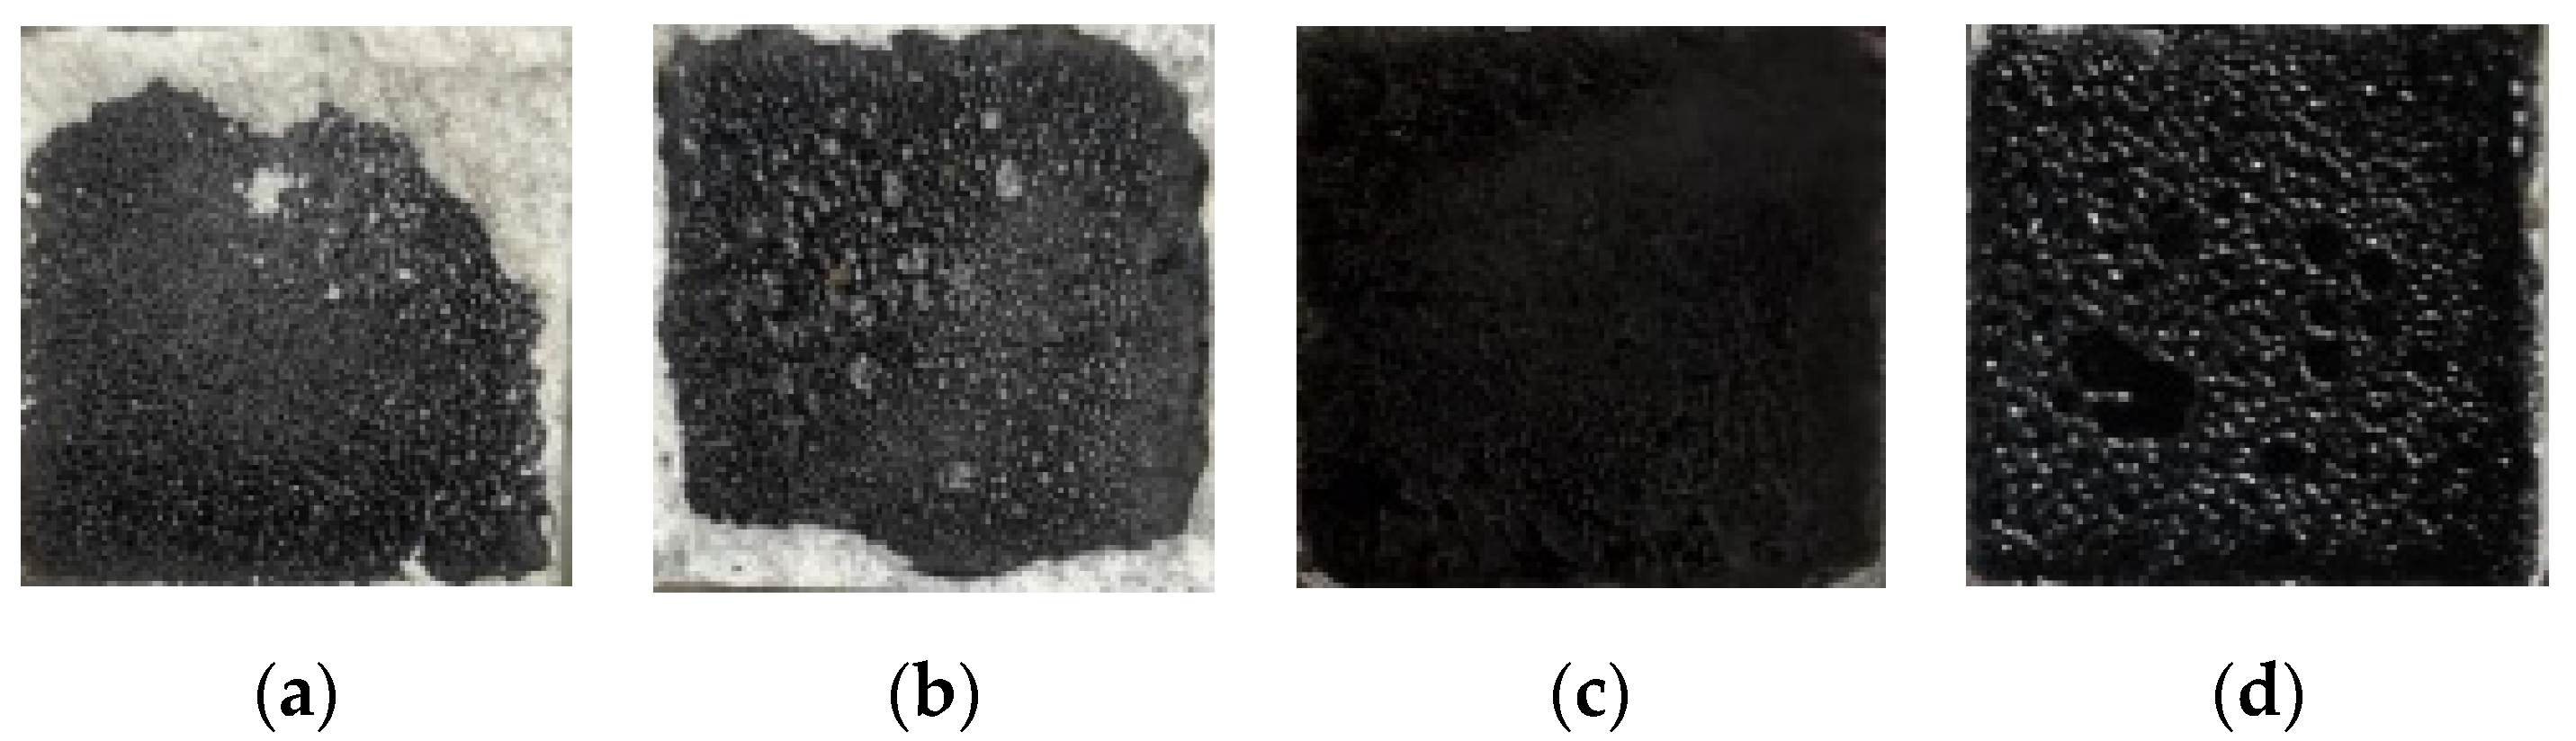
Figure 12, when we used 70# petroleum asphalt, many small folds were observed in the asphalt on the fracture surface of the specimen in the early stages, and the materials started to pull apart. This indicated that when the test piece was cured for three days, the cohesive forces of the mortar and 70# petroleum asphalt were already greater than the cohesive forces of the 70# petroleum asphalt. Therefore, for the specimens containing 70# petroleum asphalt, and at curing times of 3–14 d, the mortar strength controlled the tensile strength of the specimen interface. With a prolonged curing time, the strength of the mortar increased, and the tensile strength of the interface increased. After 14 d of curing, the interfacial tensile strength was dominated by the cohesion of the asphalt. With an increased curing time, moisture continued to invade the asphalt, causing the asphalt to emulsify and reducing its cohesive properties, causing a decrease in the tensile strength of the specimen interface. Therefore, when using 70# asphalt as a binder for semi-flexible pavement construction, it should be not applied to areas which receive an excessive amount of rain. As a result, we recommend that road access be restricted for at least three days, before the semi-flexible pavement is made accessible to traffic.
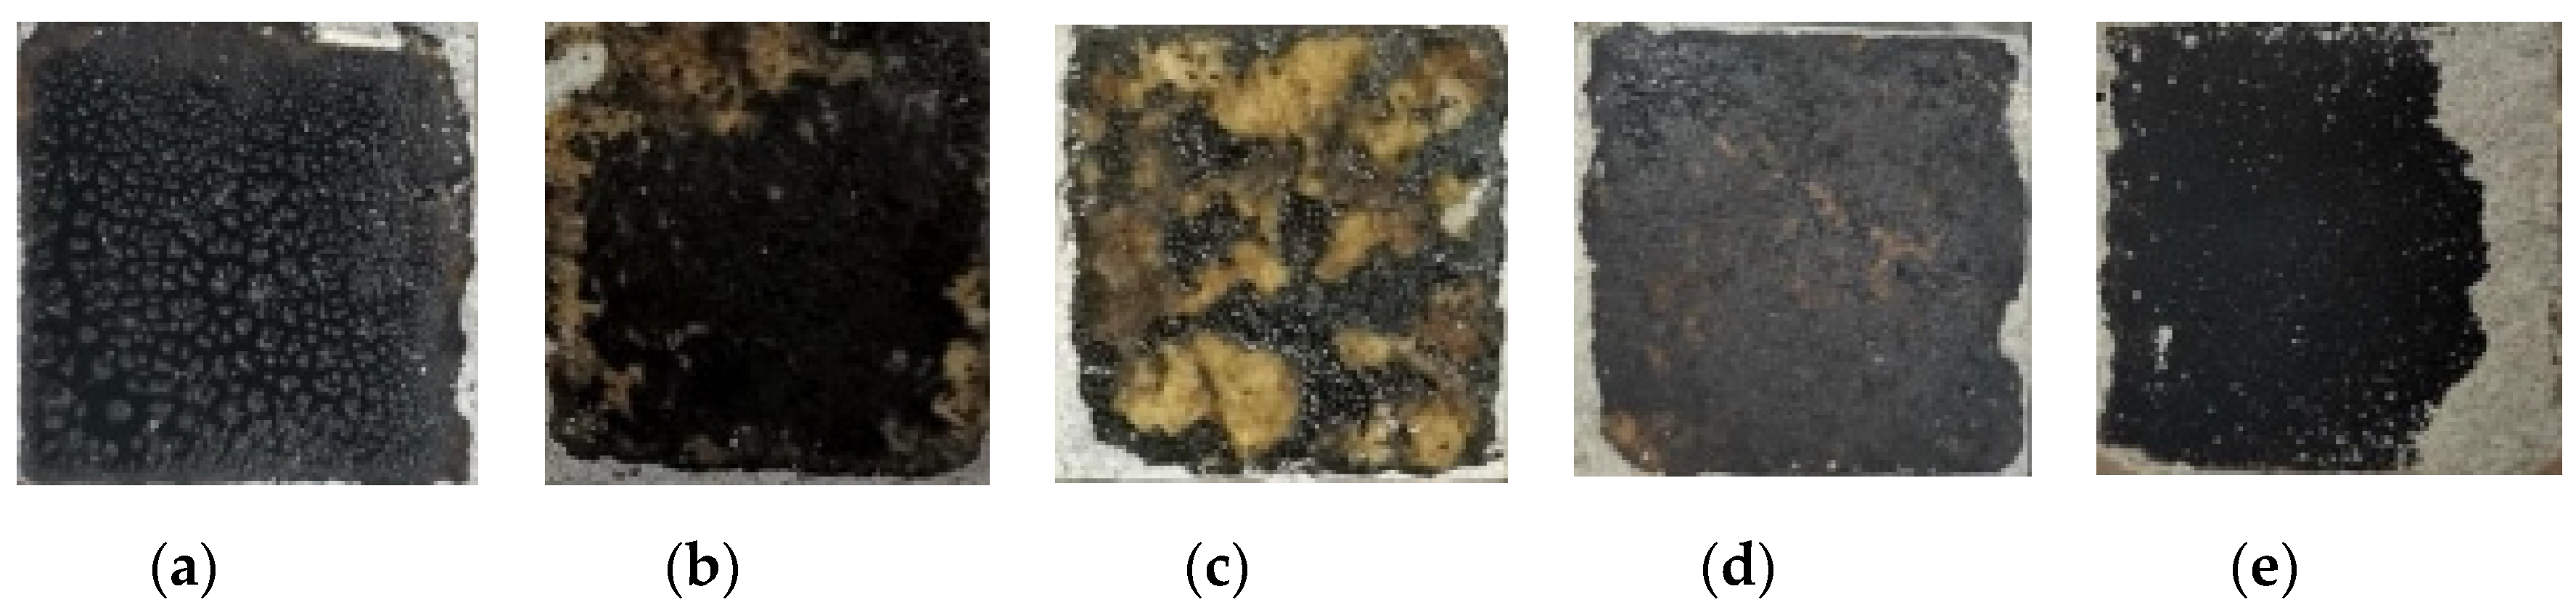
As shown in Figure 13, when we used PG76-22 modified asphalt, which was cured for three days, the asphalt surface on the fractured surface was still relatively smooth. This indicated that when the interface was cracked, the bonding and interactions of the asphalt and mortar were poor, and the interfacial tensile strength of the specimen was mainly dominated by the strength of the mortar. After curing for seven days, bonding failure of the asphalt and aggregate interface occurred, with wrinkles in the asphalt when the asphalt broke. In addition, the tensile strength of the specimen interface was mainly dominated by the adhesion of the asphalt and the aggregate interface. After curing for 14 d, interfacial failure between the asphalt and aggregate became more noticeable. At this point, the tensile strength of the interface was mainly controlled by the adhesion capacity of the asphalt and aggregate. As the cohesive forces of asphalt and mortar and the cohesive forces of the asphalt itself are greater than the cohesive forces between the asphalt and the granite, the proportion of asphalt area was reduced when the interface fractured. After 21 d of curing, the bonding failure of the asphalt and aggregate interface was reduced and, after 28 d, the bonding failure between the asphalt and the aggregate interface completely disappeared. The wrinkles were caused by the self-cohesive forces of the asphalt surface, which appeared when the asphalt cracked. In short, starting at 21 d of curing, the tensile strength of the specimen interface was mainly controlled by the cohesive forces of the asphalt. This result was attributed to two reasons. First, with the continuous ingress of moisture into the asphalt, the cohesion of the asphalt emulsification decreased. Second, with increased aging time, the interactions between mortar and asphalt increased. Therefore, when we used PG76-22-modified asphalt as a semi-flexible pavement interfacial binder, water damage resistance was stronger compared to the 70# petroleum asphalt, but was greatly affected by the adhesion of aggregate and asphalt. Therefore, the adhesion capacity between the aggregate and asphalt should be carefully considered when building roads, and after road construction, we recommend a curing time of more than seven days.
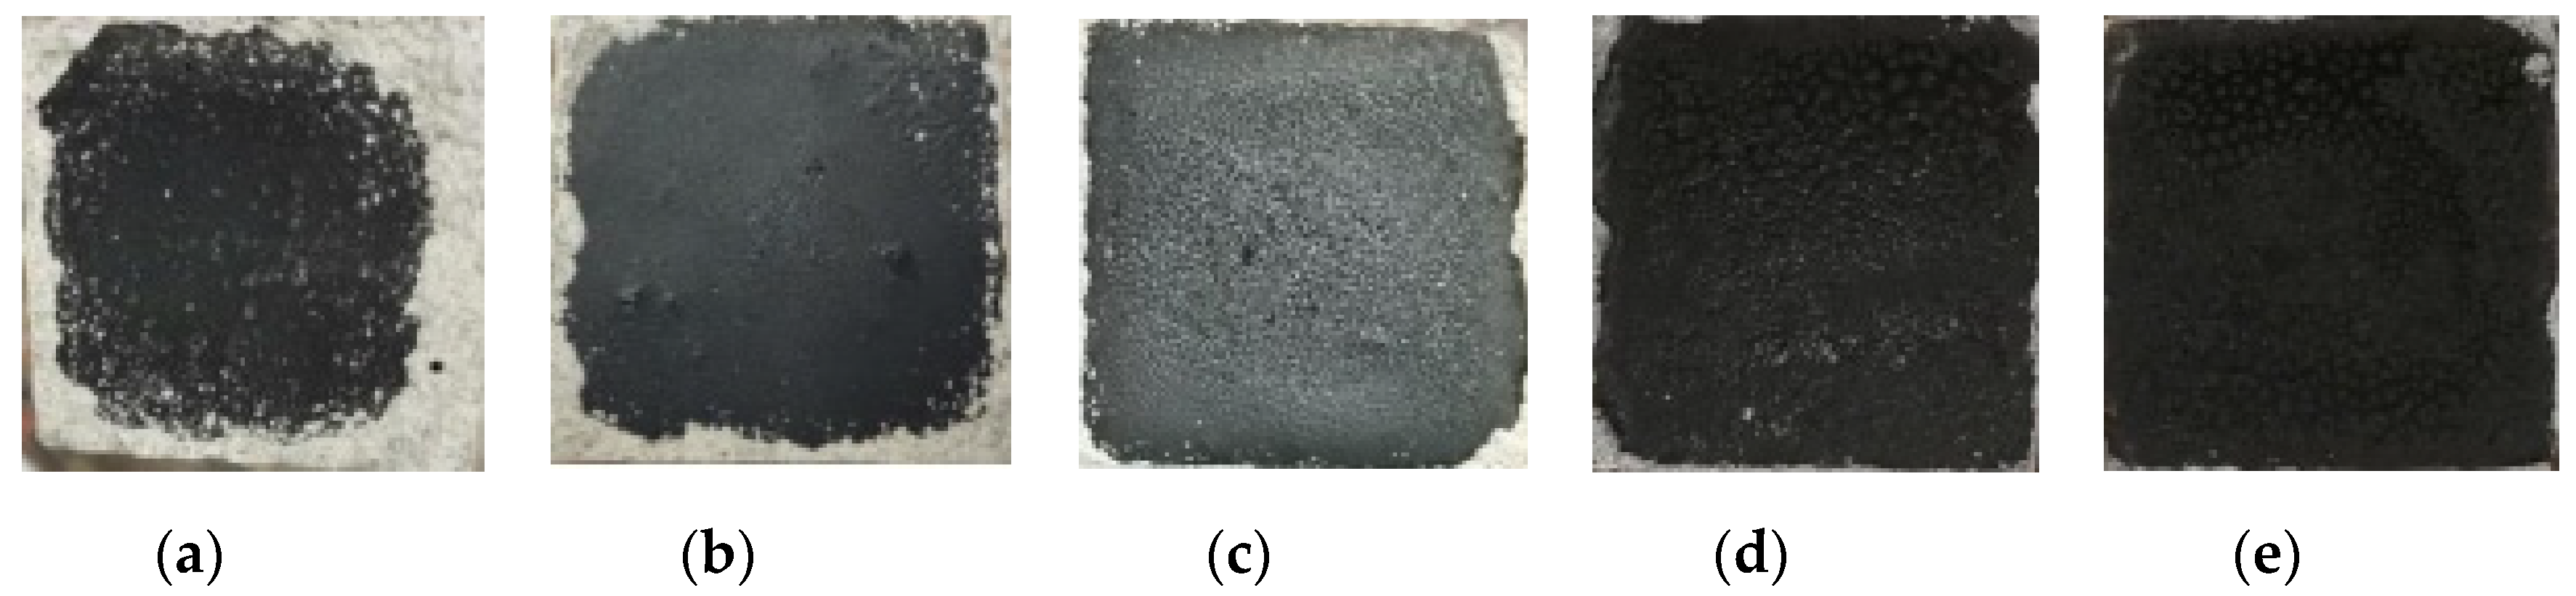
As shown in Figure 14, when the S-HV modified asphalt was used as a binder, the asphalt to mortar ratio curve was similar to curing age over time. Before seven days of curing, the interfacial tensile strength was mainly controlled by the strength of the mortar and the bonding forces between the asphalt and the mortar. After curing for 14 d, the asphalt portion in the fracture surface started to wrinkle, indicating that the interactions and adhesion between asphalt and mortar weakened. The wrinkles produced during the time were larger, but did not cover all the asphalt, indicating that the adhesion between the asphalt and the interface was less than the cohesive forces of the asphalt. Between 7 and 14 d of curing, the interfacial tensile strength was mainly dominated by the adhesion between the asphalt and the mortar, due to insufficient interfacial cohesion between the asphalt and the mortar. Starting at 14 d of curing, the interfacial tensile strength was mainly controlled by the cohesion between the asphalt. This was due to the increased interactions between the asphalt and the mortar and the ingress of water into the asphalt, which caused the asphalt to emulsify and reduced the cohesion of the asphalt. Therefore, when S-HV modified asphalt was used as a semi-flexible pavement interfacial binder, its ability to resist water damage was better than the 70# petroleum and PG76-22-modified asphalt. However, if the road is to be opened to traffic afterward, we recommend a curing time of longer than 14 d.
In summary, the curing times required for the three asphalt and mortar types to achieve better interactions and adhesion in the SFP were as follows. Before three days of curing, 70# petroleum asphalt and mortar achieved better interactions and adhesion. Between three and seven days of curing, PG76-22-modified asphalt and mortar achieved better interactions and adhesion. However, between 14 and 21 d of curing, the S-HV-modified asphalt and mortar exhibited better interactions and adhesion. Therefore, the order of interfacial water damage resistance of the specimens with different asphalt materials as binder was as follows: S-HV-modified asphalt > PG76-22-modified asphalt > 70# petroleum asphalt.

4. Conclusions

In this work, different types of asphalt were used as interfacial binders according to pull-off, tensile strength measurements, and fracture surface image analysis, and the following conclusions were drawn.
When using PG76-22-modified asphalt as the interface binder, the maximum tensile strength of the interface was larger than specimens with 70# asphalt as the binder. However, the interfacial tensile strength was lower with less curing time. When the S-HV modified asphalt was used as an interfacial binder, more curing time was required for the specimen interface to reach peak tensile strength. The order of peak tensile strength values for the interfacial materials was as follows: PG76-22-modified asphalt >70# petroleum asphalt >S-HV-modified asphalt.
On the fracture surface, the mortar was gray–white, the gray-scale range was 160–255, the interface was gray, with a gray-scale range of 100–160, and the asphalt was gray–black, with a gray-scale range of 0–100.
The curing times required for the three asphalts and mortar types to achieve improved interactions and adhesion were as follows: the 70# petroleum asphalt required 3 d of curing, PG76-22-modified asphalt required 7 d of curing, and S-HV-modified asphalt required 21 d of curing. In addition, the order of interfacial specimen water damage resistance, with different asphalt types was as follows: S-HV-modified asphalt >PG76-22-modified asphalt >70# petroleum asphalt.

Author Contributions

Funding acquisition, K.W.; Writing: Original draft preparation, X.L. and K.W.; Writing: Review and editing, W.H. and X.C.; Methodology, J.Y. and G.N. All authors have read and agreed to the published version of the manuscript.

Funding

This research was funded by the National Natural Science Foundation of China, grant number 51878193.

Informed Consent Statement

Not applicable.

Conflicts of Interest

The authors declare no conflict of interest.

References

  1. Ke Zhong, B.C. Summary of Research and Application of Pouring Semi-flexible Pavement Materials. J. China Foreign Highw. 2017, 37, 232–235. [Google Scholar]
  2. Mayer, J.; Thau, M. Jointless pavements for heavy-duty airport application the semi-flexible approach. Int. Air Transp. Conf. 2001, 87–100. [Google Scholar]
  3. Al-Qadi, I.L.; Gouru, H.; Weyers, R.E. Asphalt Portland Cement Concrete Composite: Laboratory Evaluation. J. Transp. Eng. 1994, 120, 94–108. [Google Scholar] [CrossRef]
  4. Ling, T.Q.; Zheng, X.W.; Ling, M.; Xiong, C.H.; Dong, Q. Research on Performance of Water-retention and Temperature-fall Semi-flexible Pavement Material. China J. Highw. Transp. 2010, 2. [Google Scholar]
  5. Hassani, A.; Taghipoor, M.; Karimi, M.M. A state of the art of semi-flexible pavements: Introduction, design, and performance. Constr. Build. Mater. 2020, 253, 119196:1–119196:25. [Google Scholar] [CrossRef]
  6. Larsen, P. Reinforced Semi Flexible Pavement. U.S. Patent Application US 20040101365 A1, 27 May 2004. [Google Scholar]
  7. Cai, X.; Fu, L.; Zhang, J.; Chen, X.; Yang, J. Damage analysis of semi-flexible pavement material under axial compression test based on acoustic emission technique. Constr. Build. Mater. 2020, 239, 117773:1–117773:10. [Google Scholar] [CrossRef]
  8. Matzenmiller, A.; Gerlach, S. Parameter identification of elastic interphase properties in fiber composites. Compos. Part B Eng. 2005, 37, 117–126. [Google Scholar] [CrossRef]
  9. Kawamura, N.; Morikawa, Y.; Murayama, M.; Hirato, T.; Maekawa, R. Durability of high-stability asphalt mixture under aircraft loading. In Proceedings of the 2014 FAA Worldwide Airport Technology Transfer Conference, Galloway, NJ, USA, 5–7 August 2014. Technical Papers. [Google Scholar]
  10. Hassan, K.; Setyawan, A.; Zoorob, S. Effect of cementitious grouts on the properties of semi-flexible bituminous pavement. In Performance of Bituminous and Hydraulic Materials in Pavements; Routledge: Abingdon, UK, 2002; pp. 113–120. [Google Scholar]
  11. De Beer, M.; Maina, J.W.; Netterberg, F. Mechanistic modelling of weak interlayers in flexible and semi-flexible road pavements: Part 2. J. South Afr. Inst. Civ. Eng. 2012, 54, 31–42. [Google Scholar]
  12. Hamid, N.B.A.A.; Koting, S.; Karim, M.R.; And, H.B.M. Mechanical properties of cement-bitumen composites for semi-flexible pavement surfacing. Balt. J. Road Bridge Eng. 2014, 9, 191–199. [Google Scholar]
  13. Hamzani; Munirwansyah; Hasan, M.; Sugiarto, S. Determining the properties of semi-flexible pavement using waste tire rubber powder and natural zeolite. Constr. Build. Mater. 2021, 266, 121199:1–121199:8. [Google Scholar] [CrossRef]
  14. Afonso, M.L.; Dinis-Almeida, M.; Pereira-de-Oliveira, L.A.; Castro-Gomes, J.; Zoorob, S.E. Development of a semi-flexible heavy duty pavement surfacing incorporating recycled and waste aggregates—Preliminary study. Constr. Build. Mater. 2016, 102, 155–161. [Google Scholar] [CrossRef]
  15. Cihackova, P.; Hyzl, P.; Stehlik, D.; Dasek, O.; Šernas, O.; Vaitkus, A. Performance characteristics of the open-graded asphalt concrete filled with a special cement grout. Balt. J. Road Bridge Eng. 2015, 10, 316–324. [Google Scholar] [CrossRef]
  16. Corradini, A.; Cerni, G.; D’Alessandro, A.; Ubertini, F. Improved understanding of grouted mixture fatigue behavior under indirect tensile test configuration. Constr. Build. Mater. 2017, 155, 910–918. [Google Scholar] [CrossRef]
  17. Read, J.M.; Collop, A.C. Practical fatigue characterization of bituminous paving mixture. Asph. Yearb. 1997, 66, 74–108. [Google Scholar]
  18. Dave, E.V.; Hoplin, C. Flexible pavement thermal cracking performance sensitivity to fracture energy variation of asphalt mixtures. Road Mater. Pavement Des. 2015, 16, 423–441. [Google Scholar] [CrossRef]
  19. Jiang, Y.; Xue, J.; Chen, Z. Influence of volumetric property on mechanical properties of vertical vibration compacted asphalt mixture. Constr. Build. Mater. 2017, 135, 612–621. [Google Scholar] [CrossRef]
  20. Jahanbakhsh, H.; Karimi, M.M.; Nejad, F.M.; Jahangiri, B. Viscoelastic-based approach to evaluate low temperature performance of asphalt binders. Constr. Build. Mater. 2016, 128, 384–398. [Google Scholar] [CrossRef]
  21. Cai, X.; Zhang, J.; Zhang, H.; Yao, Z.; Chen, X.; Yang, J. Identification of microstructural characteristics in semi-flexible pavement material using micromechanics and nano-techniques. Constr. Build. Mater. 2020, 246, 118426:1–118426:12. [Google Scholar] [CrossRef]
  22. Hou, S.; Xu, T.; Huang, K. Investigation into engineering properties and strength mechanism of grouted macadam composite materials. Int. J. Pavement Eng. 2015, 17, 878–886. [Google Scholar] [CrossRef]
  23. Xu, Y.; Jiang, Y.; Xue, J.; Tong, X.; Cheng, Y. High-Performance Semi-Flexible Pavement Coating Material with the Microscopic Interface Optimization. Coatings 2020, 10, 268. [Google Scholar] [CrossRef] [Green Version]
  24. Zhou, L. Temperature Adaptability and Failure Mode Analysis of Semi-Flexible Composite Pavement. Ph.D. Thesis, Chongqing Jiaotong University, Chongqing, China, 2016. [Google Scholar]
  25. Ministry of Transport. Standard Test Methods of Bitumen and Bituminous Mixtures for Highway Engineering; JTG E20-2011; China Communications Press: Beijing, China, 2011.
  26. Yang, Y.; Huang, S.L.; Ding, Q.J.; Peng, X.Y. The Property Research on Interfacial Modificated Semi-Flexible Pavement Material. Appl. Mech. Mater. 2011, 71–78, 1090–1098. [Google Scholar] [CrossRef]
  27. Shaanxi Academy of Building Research. Standard for Test Method of Basic Properties of Construction Mortar; JGJ/T 70-2009; China Construction Industry Press: Beijing, China, 2009. [Google Scholar]
  28. Wang, Y. Computer Image Processing and Recognition Technology; Higher Education Press: Beijing, China, 2001. [Google Scholar]
  29. Aliha, M.R.M.; Behbahani, H.; Fazaeli, H.; Rezaifarb, M.H. Rezaifar. Study of characteristic specification on mixed mode fracture toughness of asphalt mixtures. Constr. Build. Mater. 2014, 54, 623–635. [Google Scholar] [CrossRef]
  30. Han, S.; Li, W.; Liu, M.; Liu, Y.; Ma, Y. Analysis of Adhesion of Asphalt Mixed with Hydrated Lime Based on Surface Energy. J. Jiangsu Univ. Nat. Sci. Ed. 2020, 41, 6. [Google Scholar]
  31. Li, L. Road Engineering Materials, 5th ed.; China Communications Press: Beijing, China, 2010. [Google Scholar]
Figure 1. Cutting machine.
Coatings 11 01231 g001
Figure 2. The granite specimen.
Coatings 11 01231 g002
Figure 3. Cement mortar and raw materials.
Coatings 11 01231 g003
Figure 4. Granite specimen after pouring asphalt.
Coatings 11 01231 g004
Figure 5. Preparation of the mortar and test specimens. (a) Sandwich wood board, (b) Granite specimen covered with the mold, (c) Test specimen (d) Specimen ready for pull-off test.
Coatings 11 01231 g005
Figure 6. Universal testing machine.
Coatings 11 01231 g006
Figure 7. The tensile strengths of the three bitumen materials with the curing age.
Coatings 11 01231 g007
Figure 8. Fracture surface of the specimen.
Coatings 11 01231 g008
Figure 9. Image preprocessing, (a) Gray processing, (b) Wiener filtering, (c) Median filtering.
Coatings 11 01231 g009
Figure 10. Picture processing of the asphalt, interface, and mortar materials. (a) Original image, (b) Gray image, (c) Gray histogram.
Coatings 11 01231 g010
Figure 11. Changes in area ratio with curing age. (a) Changes in asphalt area with curing age, (b) Changes in mortar area with curing age.
Coatings 11 01231 g011
Figure 12. Changes in fracture surface with increased curing age (using 70# petroleum asphalt). (a) 3d, (b) 7d, (c) 14d, (d) 21d, (e) 28d.
Coatings 11 01231 g012
Figure 13. Changes in fracture surface with increased curing age (using PG76-22 modified asphalt). (a) 3 d, (b) 7 d, (c) 14 d, (d) 21 d, (e) 28 d.
Coatings 11 01231 g013
Figure 14. Changes in fracture surface with increased curing age (using S-HV modified asphalt). (a) 3 d, (b) 7 d, (c) 14 d, (d) 21 d, (e) 28 d.
Coatings 11 01231 g014
Table 1. Properties of the 70# petroleum bitumen.
PropertiesTechnical RequirementsTesting Results
Penetration @25 °C,100 g, 5 s, (0.1 mm)60–8071.8
Softening point R&B (°C)>4350
Ductility @10 °C, 5 cm/min, (cm)>2049.4
Flash point (°C)≥260328
Solubility in trichloroethylene (%)≥99.599.7
Density @15 °C (g/cm3)Measured record1.040
Table 2. Properties of the PG76-22-modified asphalt.
PropertiesTechnical RequirementsTesting Results
Penetration @25 °C,100 g, 5 s, (0.1 mm)40–6054.4
Softening point R&B (°C)>7088.6
Ductility @5 °C, 5 cm/min, (cm)>2032
Penetration index (PI)≥00.06
Elastic recovery ratio @25 °C (%)≥9095
Locomotion viscosity @135 °C (Pa.s)≤3.02.362
Evaporation residue (softening point) @163 °C for 48 h (°C)≤2.51
Flash point (°C)≥230 230
Solubility in trichloroethylene (%)≥99 99
Table 3. Properties of the S-HV-modified asphalt.
PropertiesTechnical RequirementsTesting Results
Penetration @25 °C,100 g, 5 s, (0.1 mm)≥4048.1
Softening point R&B (°C)≥8093
Ductility @5 °C, 5 cm/min, (cm)≥2031.5
Elastic recovery ratio @25 °C (%)≥85≥85
Locomotion viscosity @60 °C (Pa.s)>200,000>200,000
Evaporation residue (Softening Point) @163 °C 48 h (°C)≤2.51.5
Flash point (°C)≥230≥230
Solubility in trichloroethylene (%)≥99≥99
Table 4. Properties of the granite.
Physical PropertiesTechnical RequirementsTesting Results
Density (kg/m3)2790~30702860
Compressive strength (kg/m2)1000~30002756
Elastic modulus (Mpa)(1.3~1.5) × 10 6 1.37 × 10 6
Bibulous rate<0.130.08
Shore hardness>HS70HS89
Proportion2.6~2.752.64
Table 5. Properties of the Portland cement.
Mineral CompositionC3SC2SC3AC4AF
Proportion (%)50.1226.658.5314.7
Table 6. Properties of the Portland cement.
Chemical CompositionCaOAL2O3MgOSO3SiO2Na2OK2OFe2O3Insoluble MatterLoss on Ignition
Proportion (%)65.445.511.990.5021.510.120.484.880.090.48
Table 7. Properties of the Portland cement.
Physical PropertiesResults
Density (kg/m3)311
Specific surface area (m2/kg)345
Water requirement for normal consistency (%)23.8
Compressive strength (MPa)7 d40.1
28 d59.5
Flexural strength (MPa)7 d8.2
28 d16.6
Table 8. Asphalt film thickness on the granite surface.
Asphalt Type70# Petroleum AsphaltPG76-22 Modified AsphaltS-HV Modified Asphalt
Film thickness ( μ m )46.456.7147.3
Publisher’s Note: MDPI stays neutral with regard to jurisdictional claims in published maps and institutional affiliations.

