Article

Relationship between Friction Coefficient and Surface Roughness of Stone and Ceramic Floors

1
Ph.D. Program of Technology Management, Chung Hua University, Hsin-Chu 30012, Taiwan
2
College of Information Management, Nanjing Agricultural University, Nanjing 210095, China
3
Department of Information Management, Hsing Wu University, New Taipei 24452, Taiwan
*
Authors to whom correspondence should be addressed.
Coatings 2021, 11(10), 1254; https://doi.org/10.3390/coatings11101254
Submission received: 4 September 2021 / Revised: 10 October 2021 / Accepted: 11 October 2021 / Published: 15 October 2021
(This article belongs to the Section Ceramic Coatings and Engineering Technology)

Abstract

:
Slips and falls are common occupational incidents worldwide. The friction on a floor surface is one of the critical environmental factors affecting the risk of a slip. In this research, we conducted friction measurements on stone and ceramic floor tiles under dry, wet, and water–detergent (WD) solution covered conditions using a horizontal pull slip meter (HPS). Our purposes were to quantify the slip resistance of commonly used stone and ceramic floors under different surface conditions and to validate the curvilinear relationship between the coefficient of friction (COF) and surface roughness of the floors proposed in the literature. The COF data were analyzed together with a surface profile parameter (Ra) of the floor samples. The results showed that the COFs of the stone floors were significantly (p < 0.0001) higher than those of the ceramic floors. All the floors under the dry conditions were slip resistant when adopting the ANSI 1264.2 criterion. Two and five ceramic floors were not slip resistant under the wet and WD solution covered conditions, respectively. Three polynomial regression equations were established to describe the relationship between the COF and Ra. The curvilinear functions of these models indicate that the three-zone (initial growth, steady-growth, and plateau) concept concerning the COF–Ra relationship in the literature was valid when static COF values measured using an HPS were adopted. In addition, the three-zone concept was valid not only on WD solution covered surfaces but also on dry and wet surfaces.

1. Introduction

Slips and falls create significant safety and health problems for workers worldwide [1,2]. The official statistics in Taiwan indicate that there were 2,608 falls on the same level and 566 falls from height at the workplace in 2018, which accounted for 23% and 5% of all occupational incidents, respectively [3]. The national statistics in Singapore indicate that slips, trips, and falls have accounted for 34.3% and 28.2% of all major and minor injuries at the workplace, respectively [4]. The injuries statistics in Hong Kong indicated that same level falls have accounted for 29.6% of all injuries at workplaces [5]. Similar statistics may be found in other countries [6,7]. These statistics highlight the significance of slip and fall issues in the safety and health of workers and the need for efforts in understanding the mechanism and control of slips and falls.
A slip has been identified as the primary precedent event of a fall. Courtney et al. [8] indicated that slip contributed to 40% to 50% of all fall-related injuries in the USA. It is commonly accepted that people are more likely to slip when walking on slippery floor surfaces. Friction has been adopted as one of the measures of floor slipperiness [9]. Slip occurs because friction between the footwear and floor is inadequate to resist the movement of the shoe sole on the floor, especially at the moment of the heel landing on the floor. The friction between the footwear and floor may be quantified using the available coefficient of friction (COF) [10]. The friction required to resist the movement of the shoe sole on the floor, on the other hand, may be quantified using the required COF [11].
Measurements of both the required and available COF are complicated. The former requires the recruitment of human participants and the use of one or more force platforms so as to analyze the ground reaction force of the foot on the floor [12,13]. The latter, on the other hand, requires the use of a friction measurement device, also called a tribometer or a slipmeter, to measure the COF of the floor under certain footwear and floor conditions [9,14]. The required friction depends on the gait pattern of a walker and is dependent on human factors [11,15,16]. The available COF is influenced not only by the characteristics of the footwear and floor but also by the friction measurement device adopted [9,17,18].
Measurements of the available COF have been reported both in the field and in the laboratory. Field measurements were normally conducted to assess the risk of slip and fall in certain workplaces, such as restaurants and other jobs in public places [19,20,21]. Such assessments might be performed to compare the friction measurement results with the perceived floor slipperiness of human participants [22]. The friction measurements conducted in the laboratory were normally performed to explore the mechanisms of slipping of the shoe sole on the floor. Studies testing the effects of the floor, footwear, floor inclined angle, and floor surface contaminations on slipperiness have been reported [14,18,23,24,25,26,27,28,29,30,31,32]. There were also studies comparing the testing parameters, test methods, reliability, and validity of friction measurement devices [13,17,32,33,34,35].
There is a general awareness that rough floors are more slip resistant than the smooth ones. Floor roughness was found to be positively correlated with the COF of the floor [26,35,36]. The surface profile characteristics of the floor predominantly contribute to the friction at the footwear–floor interface in two aspects. The first one is that asperities on the floor surface could interlock with the tread on the shoe sole and, hence, impede the shoe sole from sliding on the floor. The second one is that floor roughness provides void space for drainage when the floor is covered by liquid, which allows faster contact of the shoe sole and the floor [26,36].
Many surface roughness parameters have been defined to depict the surface profiles of a floor surface. The correlations between more than 20 of these parameters and the slip resistance of floors have been discussed [37]. The parameter Ra, also known as the center line average of surface heights (CLA), is one of the most commonly used roughness parameters in discussing friction on the floor [38]. Li et al. [38] measured the Ra and subjective rating of floor slipperiness on their floor samples. They found these two measures were highly correlated (ρ = 0.79, p < 0.0001) with each other. They concluded that Ra may be adopted as one of the predictors of the perceived floor slipperiness of human participants. Grönqvist et al. [39] measured the dynamic COF of floor samples with varying floor roughness. The COF and Ra of their floor samples were highly correlated (r = 0.87, p < 0.001) with each other. They recommended Ra values of 7–9 μm and 16–22 μm for adequate (dynamic COF = 0.2) and very slip resistant (dynamic COF = 0.3) floors, respectively, on glycerol contaminated surfaces. Kim et al. [26] claimed that an Ra higher than 17 μm might be sufficient for proper slip resistance (dynamic COF = 0.4) on soapsuds contaminated floors. Chen et al. [36] reported that, when the floor was contaminated by viscous (38 mPa·s or higher) liquid, the frictions on all the floors they tested were extremely low (almost zero). When the viscosity of the liquid on the floor was low (2 mPa·s or less), the floor may still be slip resistant (static COF = 0.5) if the Ra of the floor surface was 40 μm or higher. The COF values in the above-mentioned studies were measured using different devices and protocols. The recommended floor roughness levels in those studies are, therefore, not comparable.
Kim et al. [26] introduced a concept of surface roughness zones in the mechanism of friction at the footwear–floor interface. They demonstrated that the slip resistance increases slowly with the increase of floor roughness when the surface roughness is low. In this “initial low-grow zone”, multiple friction mechanisms are involved between the shoe sole and floor while interlocking effects are not present. In the “steady-growth zone,” the interlocking of the floor asperities with the shoe sole dominating the friction and linear relationship between the floor roughness and COF is likely. In the “plateau zone,” the interlocking mechanisms become exhausted and increasing the floor roughness made no further benefits in increasing the COF of the floor. Based on a dynamic COF of 0.4, they recommended using Ra values of 17 and 50 μm as the lower and upper bounds of the steady-growth zone. They indicated that finding the floor roughness range in such a zone is critical in establishing a slip resistant floor environment. The study of Kim et al. [26] was performed using a pendulum-type friction tester, and they used a dynamic COF of 0.4 as a criterion of slip resistance. It is well known that the theoretical bases of using static and dynamic friction in assessing the risk of slip and fall are different. It has also been shown that the COF readings on a floor sample may be dependent on the friction measurement device [9]. Whether the concept of surface roughness zones will be valid or not is not clear when using both a different friction measurements device and a static COF in the criterion of slip resistance.
The main objective of the current study was to validate the three-zone concept of Kim et al. [26] using a different friction measurement device and criterion of slip resistance. Establishing regression models to predict the COF on the tested floors using their Ra values was also one of the objectives of this study. These models provide quantitative evidence to show the relationship between the COF and Ra. In addition, both stone and ceramic floorings are commonly used both indoors and outdoors. Friction measurements for these floors are essential to quantify the risk of slipping on these floors. Our third objective was to quantify the slip resistance of the commonly used stone and ceramic floors under different surface conditions.

2. Method

A friction measurement experiment was performed in the laboratory.

2.1. Friction Measurement Device

A horizontal pull slip meter (HPS, S.C.S Forces, Agawam, MA, USA) was used (see Figure 1). This slip meter encompasses a power unit and a weight unit. There are three circular footwear pads (Neolite, Akron, OH, USA, Ø12.7 mm) on the bottom of the weight unit. The Neolite footwear pads had an averaged specific gravity of 1.27 ± 0.02 and a Shore A hardness of 94. The total contact area of the footwear pad on the floor is approximately 3.8 cm2. The contact pressure between the footwear pads and floor surface is approximately 70.2 kPa. There is a motor inside the box of the power unit. This motor rotates to generate a horizontal pull force to drag the weight unit (2700 ± 34 g). The reading on the meter at the moment when the weight unit starts to move is the slip index [40]. This slip index is ten times the static COF at the footwear–floor interface. The rationale of the HPS is to determine the coefficient of friction by dividing the horizontal pull force by the gravity of the weight unit. This is similar to that of the sliding friction tester in the literature [41].

2.2. Floor Tiles

Twelve floor tiles were tested, including six ceramic and six stone floors. These floors are commonly used both indoors and outdoors. Table 1 shows these floors. The stone floors included four sandstones (S1, S2, S4, and S6) and two unpolished granites (S3 and S5). The Ra values of all the floor samples were measured using a Mitutoyo S301 profilometer [42] (Mitutoyo Inc., Sakado, Japan). This device uses a detector stylus tracing the surface of the floor sample. The direction of the stylus movement was parallel to that of friction measurement. The lengths of cut-off and measurement were 2.5 and 12.5 mm, respectively [38]. The Ra was determined based on the movements of the stylus. The literature has shown that friction correlates well with bandpass filtered profile parameters [43]. The Gaussian filter was adopted in processing the stylus tracing data [42]. On each floor, nine Ra readings were collected, each from one location. The average of these readings was used. The Ra of the ceramic and stone floors ranged from 8.9 to 30.4 μm and from 29.0 to 65.1 μm, respectively.

2.3. Surface Conditions

The surface conditions included dry, wet, and water–detergent (WD) covered conditions. For dry condition, dry and clean surface of the floor sample was measured. For wet measurements, all the stone floors were immersed in a container full of tap water for 24 h so that the floors were fully moisturized before measurement. For measurements of water–detergent (WD) solution covered condition, all the stone floors were immersed in WD solution also for 24 h before testing. This solution included 30 mL dishwashing detergent (purchased from a local market) mixed with 2 L tap water. For the friction measurement of each of the two liquid contaminated conditions, we poured a small cup (10 mL) of liquid on each of the three footwear pad contact points of the HPS on the floor sample.

2.4. Measurement Procedure

All the friction measurements were performed by the same operator. Prior to measurement, the operator wiped the floor samples with a 3% ammonium hydroxide (NH4OH) solution and dried them with a clean cloth. The floor sample was sanded using a No. 60 grit abrasive paper. After this, the sample was sanded again using a No. 400 abrasive paper. The operator then brushed the surface to remove loose particles. This procedure followed those in the ASTM [40].
On each floor sample, four locations were selected for friction measurements. These locations were evenly distributed on the floor samples. In other words, each of them was at a distance approximately one quarter of the way to the two adjacent sides of the floor sample. On each location, 6 measurements were performed. On each measurement, the units of the power and weight of the HPS were on the same level. The operator aligned the pulley on the power unit with the hook on the weight unit and then connected the string of the power unit to the hook on the weight unit. The string was parallel with the test surface and was in line with the pulley on the power unit. The operator pushed down the power unit to prevent its moving and then pressed the switch. When the weight unit started to move, the switch was turned off. The reading on the meter was the slip index. The COF was the slip index divided by 10.

2.5. Statistical Analysis

The order of friction measurements on each floor sample was randomized among the three surface conditions. There were a total of 864 COF readings (12 floors × 3 surface conditions × 4 locations × 6 repetitions). The normality of these data were ensured by checking the normal probability plot. Descriptive statistics and analysis of variance (ANOVA) were performed for the measured COF values. Duncan’s multiple range tests were performed to compare the differences between any two treatments in a factor if the main effects of the factor reached the α = 0.05 significance level. This test is powerful and is very effective at detecting differences between means when real differences do exist [44]. Regression analyses were performed to establish regression models showing the relationship between the COF and Ra using the readings of three out of the six repetitions on the same location of each floor and surface condition. In other words, half of the data were used in establishing the regression models. A mean absolute deviation (MAD) (see Equation (1)) was calculated to determine the prediction errors of the COF values for each of the floor, surface condition, and location. The measured COF values in Equation (1) were the COF readings not used in establishing the regression models. The statistical analyses were performed using the SPSS version 20 software (IBM®, Armonk, NY, USA).
MAD = 1 n   | predicted   COF measured   COF |
where n is the number of pairs of predicted and measured COF values used.

3. Results

3.1. ANOVA Results

Figure 2 shows the means and standard deviations of the COF of all the floor samples. The ANOVA results indicated that both the floor material and the surface condition significantly (p < 0.0001) affected the COF. The Duncan’s multiple range test results showed that the COF of the stone floors (0.71 ± 0.09) was significantly higher than that of the ceramic floors (0.53 ± 0.12). The COF on the dry surface (0.69 ± 0.11) was significantly (p < 0.05) higher than those of the wet (0.61 ± 0.13) and WD solution covered surfaces (0.55 ± 0.15). Duncan’s multiple range tests were also performed separately to compare the COFs of the three surface conditions for each of the stone and ceramic floors. For the stone floors, the COF on the dry surface (0.74 ± 0.08) was significantly (p < 0.05) higher than those of the wet (0.71 ± 0.07) and WD solution covered (0.67 ± 0.09) conditions. The COF of the wet condition was significantly (p < 0.05) higher than that of the WD solution covered condition. For the ceramic floors, the COF on the dry surface (0.63 ± 0.09) was significantly (p < 0.05) higher than those of the wet (0.52 ± 0.09) and WD solution covered (0.44 ± 0.09) conditions. The COF of the wet condition was also significantly (p < 0.05) higher than that of the WD solution covered condition.
Duncan’s multiple range tests were also performed separately for the wet and WD solution covered conditions to compare the COF values between any two floor samples. The results are shown in Table 2.

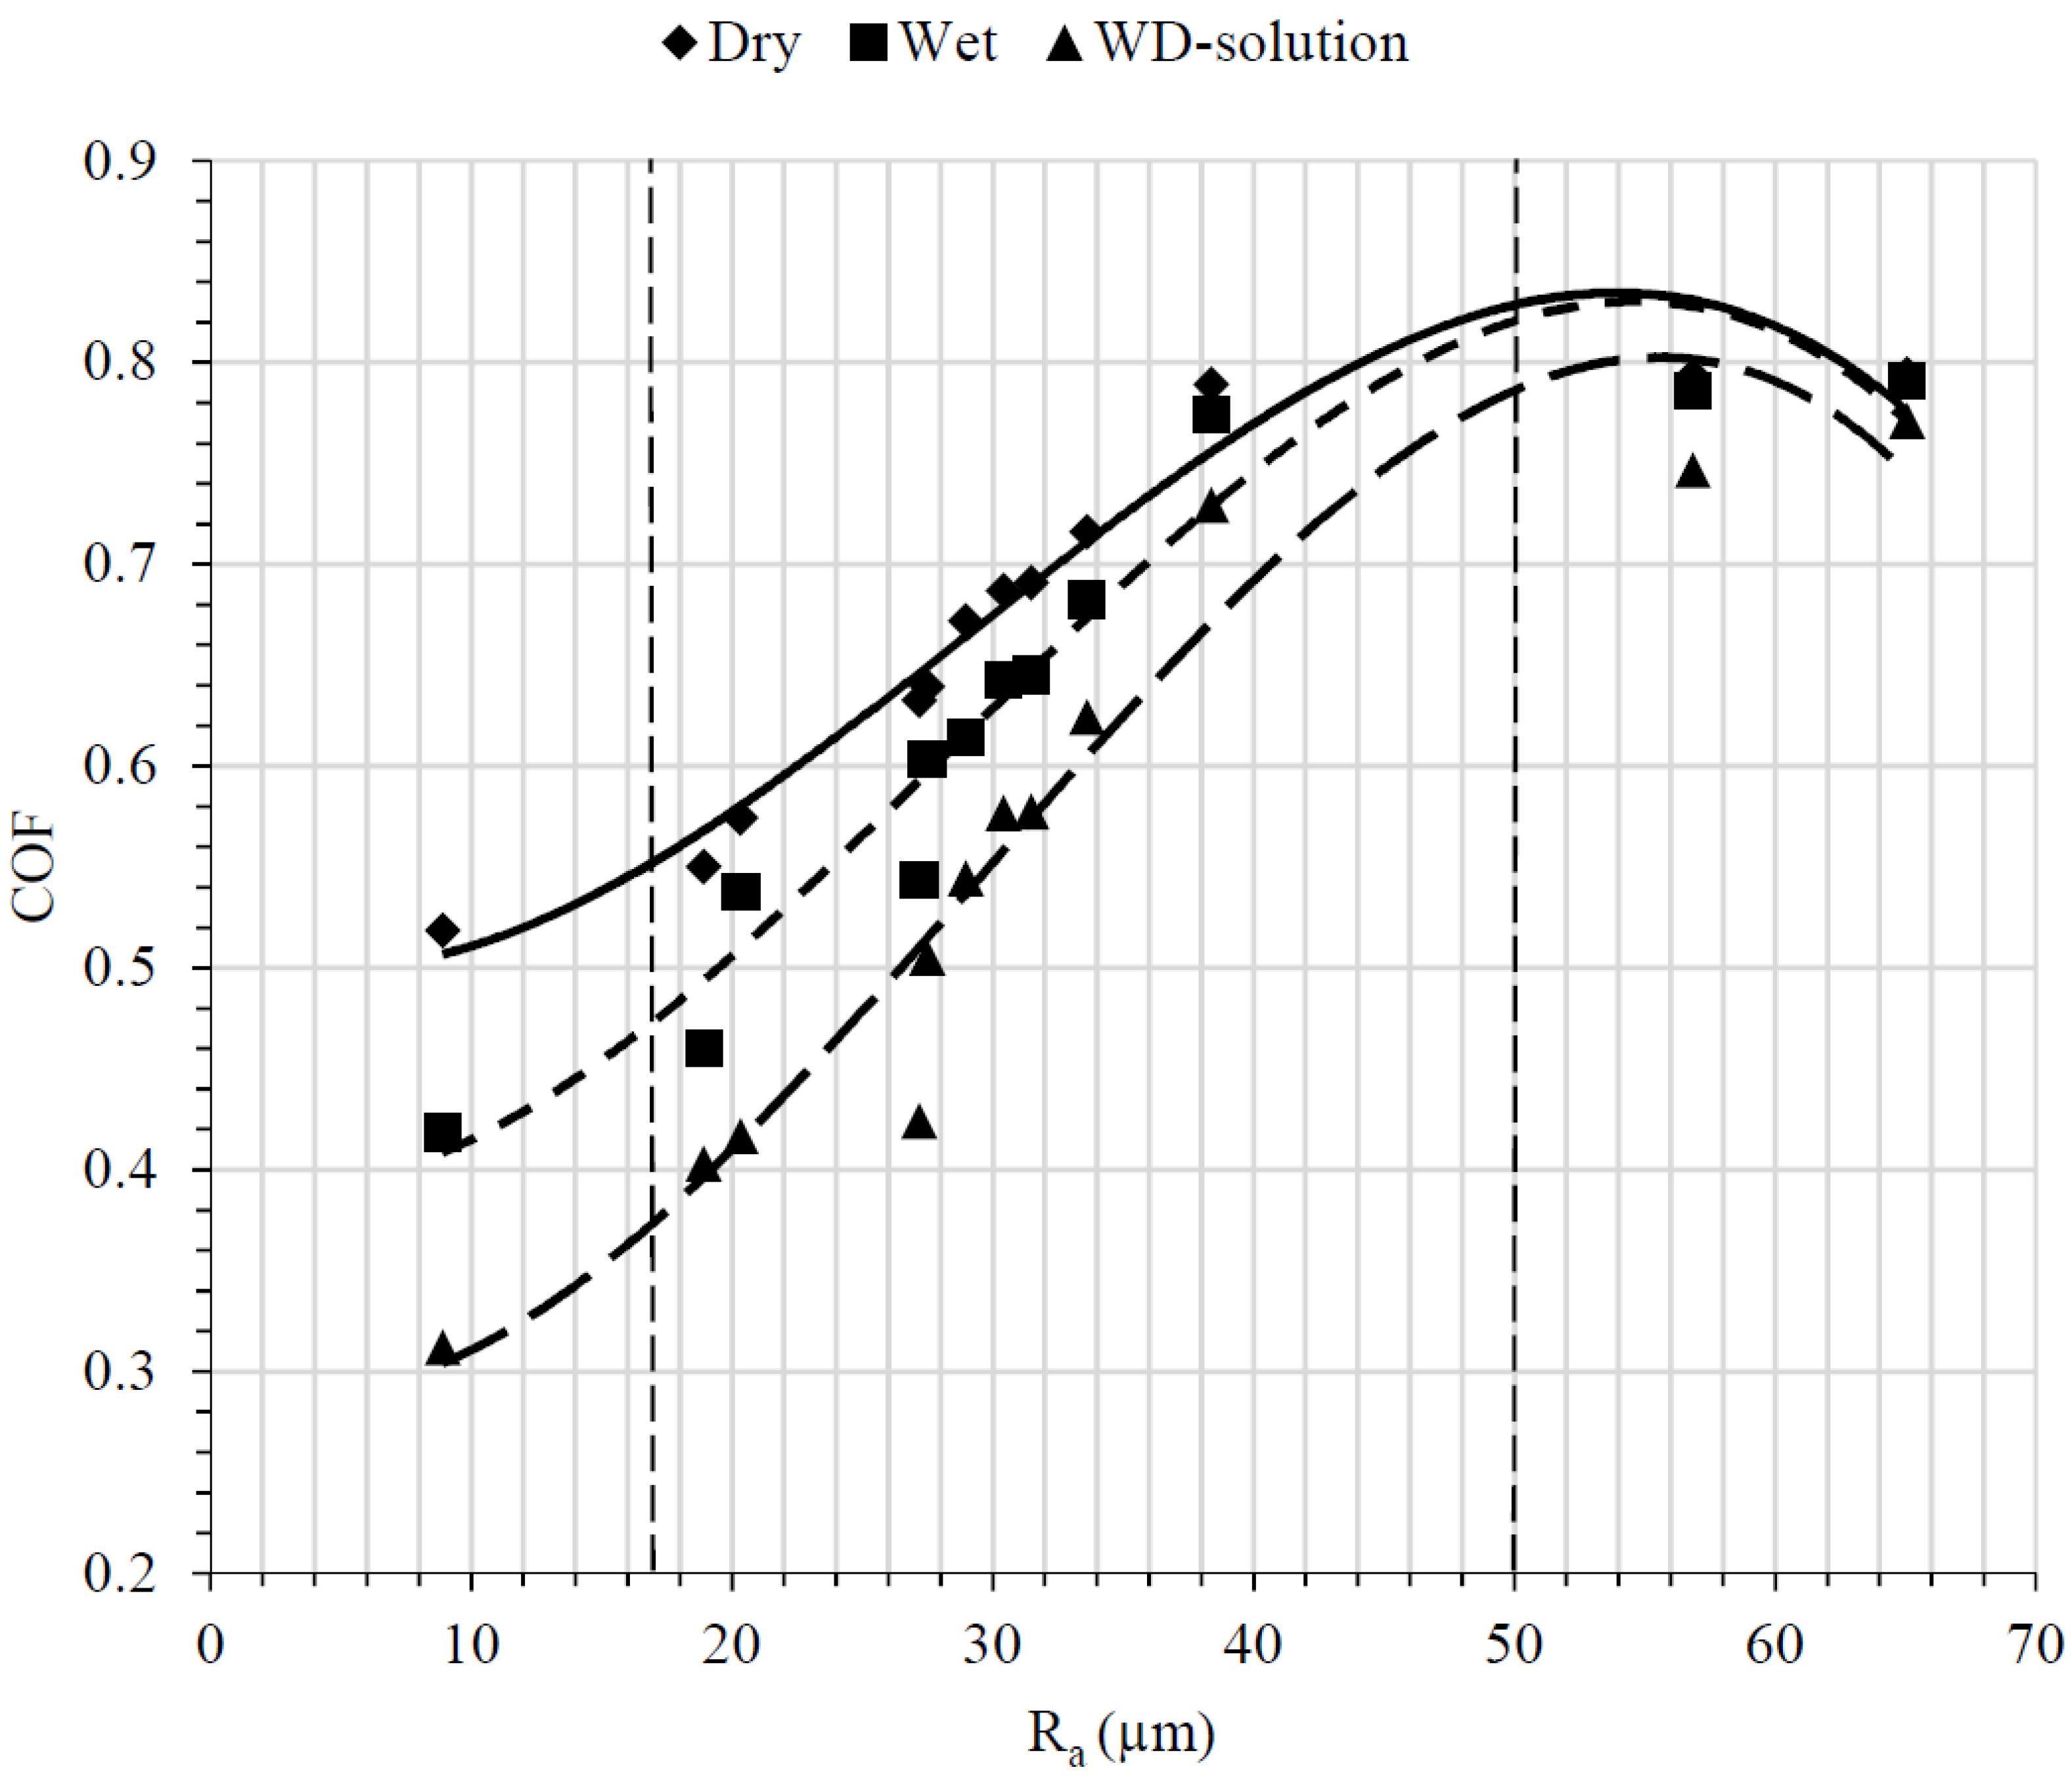
3.2. Correlation Analyses & Regression Modeling

The Pearson’s correlation coefficients between Ra and COF under dry, wet, and WD solution covered conditions were 0.63, 0.62, and 0.66, and all of them were statistically significant (p < 0.0001).
To establish the relationship between the COF and Ra under a surface condition, a regression analysis was performed using the COF as the dependent variable and the floor roughness parameter Ra and surface condition as the independent variables. It was assumed that the measured COF is a function of Ra under surface conditions, or alternatively:
COF = f(Ra/surface condition)
Initially, a simple linear regression model was fitted to predict the COF using Ra. However, it was found that the curvilinear model may be more appropriate. A polynomial regression model was then fitted (see Equation (3)):
COF = ß0 + ß1 Ra + ß2 Ra2+ ß3 Ra3
where ßi is the regression coefficient, i = 0, 1, 2, 3. The unit of Ra is μm.
The results of the regression analysis are shown in Table 3. The t-test results of the regression coefficients showed that all the regression coefficients were statistically significant at p < 0.0001.
The polynomial regression models and measured COF values of the dry, wet, and WD solution covered conditions are shown in Figure 3. The measured COF values are the means of the three readings not used in establishing the regression models. The MADs for the dry, wet, and WD solution covered surfaces were 0.014, 0.021, and 0.025, respectively.
The polynomial regression models in Figure 3 support the zones of initial low growth, steady-growth, and plateau concept of Kim et al. [26].

4. Discussion

Friction measurement is one of the major approaches to assess the risk of slip and fall. The result of such a measurement is the available COF. Numerous friction measurement devices have been developed. However, none of them have been accepted universally as a perfect one. All of them have pros and cons. Different friction measurement devices may report different readings. The readings on different devices may, therefore, not be directly comparable. The HPS is one of the friction measurement devices recommended by the ASTM [40] to measure the COF of floor samples. It is not sensitive to operator variability and is easy to use [9,45,46]. These were the reasons why we adopted this device. Due to its drag mechanism design, the HPS is proposed to be used primarily for dry measurement. However, the significance of the surface conditions on the COF in the current study indicates that this device is capable of differentiating the slip resistances among the dry, wet, and WD solution covered surfaces.
Different slip resistance criteria considering pedestrian safety have been used in different countries. Some of the slip resistance criteria pertain to a certain type of friction measurement methodology or device. For example, the Australian and New Zealand Standard [47] adopted a dynamic COF of 0.4 based on a pendulum tester. The Health and Safety Executive of the UK [48] recommended values of slip potential, instead of slip resistance, based on the pendulum test value (PTV). The slip potential is low for a PTV of 36 or higher. Static COF has been adopted to assess the slip resistance more often in the USA than in many other countries. A static COF of 0.5 was adopted as a safety criterion for pedestrian walkways by both the American National Standards Institute (ANSI) [49] and the U.S. Occupational Safety and Health Administration (OSHA) [50]. The Americans with Disabilities Act (ADA) requires the static COF being 0.6 and 0.8 or above for level surfaces and ramps, respectively [51].
Stone floors are widely used in public spaces. Unless they have been ground and polishing processed, stone floors normally have a rough surface and are believed to have proper slip resistance for walking. The COF of these floors was significantly (p < 0.0001) higher than that of the ceramic floors. Such results were not surprising and were consistent with the findings in the literature [52]. All the floor samples we tested under the dry condition met the requirement of ANSI [49]. Even on wet surfaces, all the stone floors and four of the ceramic floors had mean COF values higher than 0.5. On the WD solution contaminated conditions, all the ceramic floors except C3 had mean COF values lower than 0.5. This implies that most (five of six) of the ceramic floors we tested are risky under the WD solution contaminated condition.
In tribology, the transmission of friction, as a function of normal load, along a sliding surface depends, at least partially, on the topography of the surface [49,53,54]. The Ra values of the floor samples were adopted in this study to represent the surface profiles of these samples because this parameter is the one that has been used most commonly in slip and fall research [26,37,38]. The estimates of the regression coefficients and corresponding statistics in Table 3 demonstrate the significance of Ra on the COF under the three surface conditions tested. The polynomial regression models of the COF indicate that Ra affected COF in a nonlinear fashion. There are discrepancies between our study and that of Kim et al. [26] in developing the regression models. The first one is that our COFs were static while the COFs in theirs were dynamic. Secondly, we tested only the Neolite footwear sample while they tested one PVC and two Nitrile Rubber soles from three commercially available shoes. Finally, our models considered the dry, wet, and WD solution covered conditions while the cubic function in theirs considered only their soapsuds covered condition. Even with these discrepancies, the curvilinear relationship between the COF and Ra in our models still supports the three-zone concept of Kim et al. [26].
In Figure 3, all three curves reach their peaks at an Ra of approximately 54–55 μm for the three surface conditions. These peaks imply that a further increase of the surface roughness (Ra) provided no extra help in improving the slip resistance (COF). The beginning of the plateau, or, alternatively, the upper bound of the steady-growth zone, should be somewhere before the Ra has reached those peak values. This implies that the upper bound of the steady-growth zone proposed by Kim et al. [26] (Ra = 50 μm) was supported.
In the zone of steady growth, the COF increases almost linearly with Ra. A COF of 0.5 [48] of the safety criterion was adopted to determine the lower bound of the steady-growth zone. Ra values of 19 and 27 μm were obtained for the wet and WD solution covered conditions, respectively. Table 4 summarizes the Ra values of the current study and those in the literature. Our Ra values are slightly higher than that recommended by Kim et al. [26] but are lower than that of Chen et al. [36].
The positive correlation between the Ra and the COF values in our study was consistent with the findings in Chang et al. [9] but was only partially consistent with those in Kim et al. [26]. The Pearson’s correlation coefficients between the Ra and the COF for the dry, wet, and WD solution conditions in the current study were approximately the same (0.62–0.66, p < 0.0001). This was inconsistent with the results in Kim et al. [26] where they found Ra was significantly correlated with their dynamic COF on soapsuds covered surfaces, but the correlation was insignificant on their dry surfaces. A possible reason for this inconsistency may be that the static COF in our experiment is less sensitive to the variations on the surface profile represented by Ra. The inconsistency could also be attributed to the different footwear and floor samples in the two studies.
A limitation of this study was that only one footwear material (Neolite) was tested. This material has been adopted in many friction measurement studies because of its homogeneity and reliability in physical characteristics [18,19,24,36]. Our results could be different if other footwear materials were used. Another limitation was that most of the floor samples we tested were rougher than the common floors found indoors. Almost all the floor samples (eleven of twelve) had an Ra higher than 9 μm. Our results may, therefore, not be applicable to floors with an Ra less than this level.

5. Conclusions

A friction measurement study was performed on six stone and six ceramic floor samples under dry, wet, and WD solution covered conditions. The COF values of the stone floors were significantly higher than those of the ceramic floors. All the stone floors under all the surface conditions tested had mean COF values higher than 0.5, a safety criterion recommended by the ANSI [49]. Two and five ceramic floors tested under the wet and WD solution covered conditions, respectively, had mean COFs lower than 0.5. Three polynomial regression equations between the COF and Ra were developed. These equations confirmed that the three-zone concept proposed by Kim et al. [26] is valid when static COF values measured using an HPS were adopted. In addition, the concept is valid not only on the WD solution (soapsuds) covered surface but also on dry and wet surfaces. The upper bound Ra values in the steady-growth zone in the current study were equivalent to those in the literature [26]. The lower bound Ra values under our wet and WD solution covered conditions were slightly higher than that proposed in the literature. The findings of the current study can provide insightful implications for the prevention of floor slipperiness and can thus help in reducing slip and fall incidences. Future research may be considered to test commonly used footwear materials not tested in our study, such as blown rubber and ethylene vinyl acetate, to validate the applicability of the three-zone concept on those materials.

Author Contributions

Conceptualization, S.K. and K.-W.L.; methodology, K.-W.L.; validation, L.P., K.-W.L.; formal analysis, S.K. and K.-W.L.; investigation, S.K.; resources, K.-W.L.; data curation, S.K.; writing—original draft preparation, S.K. and K.-W.L.; writing—review and editing, K.-W.L. and L.P.; visualization, C.-C.C.; supervision, K.-W.L.; project administration, C.-C.C.; funding acquisition, K.-W.L. and L.P. All authors have read and agreed to the published version of the manuscript.

Funding

This research was financially supported by research funding from the Ministry of Science and Technology of Taiwan (MOST110-2221-E-216-004), General Project of Philosophy and Social Science Research in Universities of Jiangsu China(2021SJA0060), and Humanity and Social Science Funding of Fundamental Research Expenses of Central Government Higher Education of Nanjing Agricultural University (SKYC2021024).

Institutional Review Board Statement

Not applicable.

Informed Consent Statement

Not applicable.

Data Availability Statement

Not applicable.

Conflicts of Interest

The authors declare no conflict of interest.

References

  1. Chang, W.-R.; Leclercq, S.; Lockhart, T.; Haslam, R. State of science: Occupational slips, trips and falls on the same level. Ergonomics 2016, 59, 1–23. [Google Scholar] [CrossRef] [Green Version]
  2. Li, J.; Goerlandt, F.; Li, K.W. Slip and fall incidents at work: A visual analytics analysis of the research domain. Int. J. Environ. Res. Public Health 2019, 16, 4972. [Google Scholar] [CrossRef] [Green Version]
  3. Ministry of Labor (MOL). Labor Inspection Annual Report, Taipei, Taiwan. 2019. Available online: http://www.osha.gov.tw/1106/1164/1165/1168/29804 (accessed on 17 February 2021). (In Chinese)
  4. Ministry of Manpower (MOM). Workplace Safety and Health Report 2019: National Statistics. Singapore. 2020. Available online: http://mom.gov.sg (accessed on 17 January 2021).
  5. Labour Department. Occupational Safety and Health Statistics, The Government of Hong Kong Special Administrative Region. 2019. Available online: https://www.labour.gov.hk/eng/osh/pdf/archive/statistics/OSH_Statistics_2018_eng.pdf (accessed on 22 January 2021).
  6. U.S. Department of Labor, Bureau of Labor Statistics (BLS). Employer-Reported Workplace Injures and Illnesses—2017; BLS: Washington, DC, USA, 2018.
  7. Health and Safety Executive (HSE). Health and Safety at Work Summary Statistics for Great Britain 2020. Available online: https://www.hse.gov.uk/statistics/overall/hssh1920.pdf (accessed on 10 March 2021).
  8. Courtney, T.K.; Sorock, G.S.; Manning, D.P.; Collins, J.W.; Holbein-Jenny, M.A. Occupational slip, trip, and fall-related injuries can the contribution of slipperiness be isolated? Ergonomics 2001, 44, 1118–1137. [Google Scholar] [CrossRef] [PubMed]
  9. Chang, W.R.; Grönqvist, R.; Leclercq, S.; Brungraber, R.J.; Mattke, U.; Strandberg, L.; Thorpe, S.C.; Myung, R.; Makkonen, L.; Courtney, T.K. The role of friction in the measurement of slipperiness, Part 2: Survey of friction measurement devices. Ergonomics 2001, 44, 1233–1261. [Google Scholar] [CrossRef]
  10. Hanson, J.P.; Redfern, M.S.; Mazumdar, M. Predicting slips and falls considering required and available friction. Ergonomics 1999, 42, 1619–1633. [Google Scholar] [CrossRef] [PubMed]
  11. Grönqvist, R.; Chang, W.-R.; Courtney, T.K.; Leamon, T.B.; Redfern, M.S.; Strandberg, L. Measurement of slipperiness: Fundamental concepts and definitions. Ergonomics 2001, 44, 1102–1117. [Google Scholar] [CrossRef]
  12. Beschorner, K.E.; Albert, D.L.; Redfern, M.S. Required coefficient of friction during level walking is predictive of slipping. Gait Posture 2016, 48, 256–260. [Google Scholar] [CrossRef] [PubMed]
  13. Beschorner, K.E.; Iraqi, A.; Redfern, M.S.; Moyer, B.E.; Cham, R. Influence of averaging time-interval on shoe-floor-contaminant available coefficient of friction measurements. Appl. Ergon. 2020, 82, 102959. [Google Scholar] [CrossRef]
  14. Beschorner, K.E.; Iraqi, A.; Redfern, M.S.; Cham, R.; Li, Y. Predicting slips based on the STM 603 whole-footwear tribometer under different coefficient of friction testing conditions. Ergonomics 2019, 62, 668–681. [Google Scholar] [CrossRef]
  15. Li, K.W.; Zhao, C.; Peng, L.; Liu, A.-Q. Subjective assessments of floor slipperiness before and after walk under two lighting conditions. Int. J. Occup. Saf. Ergon. 2017, 24, 294–302. [Google Scholar] [CrossRef] [PubMed]
  16. Redfern, M.S.; Cham, R.; Gielo-Perczak, K.; Grönqvist, R.; Hirvonen, M.; Lanshammar, H.; Marpet, M.; Pai, C.Y.C., IV; Powers, C. Biomechanics of slips. Ergonomics 2001, 44, 1138–1166. [Google Scholar] [CrossRef]
  17. Chang, W.-R.; Cotnam, J.P.; Matz, S. Field evaluation of two commonly used slipmeters. Appl. Ergon. 2002, 34, 51–60. [Google Scholar] [CrossRef]
  18. Li, K.W.; Chen, C.J. The effect of shoe soling tread groove width on the coefficient of friction with different sole materials, floors, and contaminants. Appl. Ergon. 2004, 35, 499–507. [Google Scholar] [CrossRef] [PubMed]
  19. Yu, R.; Li, K.W. A field assessment of floor slipperiness in a student cafeteria. Int. J. Inj. Control. Saf. Promot. 2012, 20, 245–253. [Google Scholar] [CrossRef] [PubMed]
  20. Merryweather, A.S.; Thiese, M.S.; Kapellusch, J.M.; Garg, A.; Fix, D.J.; Hegmann, K.T. Occupational factors related to slips, trips and falls among home healthcare workers. Saf. Sci. 2018, 107, 155–160. [Google Scholar] [CrossRef]
  21. Coşkun, G.; Sarıışık, G. Analysis of slip safety risk by portable floor slipperiness tester in state institutions. J. Build. Eng. 2020, 27, 100953. [Google Scholar] [CrossRef]
  22. Johnson, K.P. Assessing Floor Slipperiness in Campus Dining Halls Using Objective and Subjective Measures. Master’s Thesis, East Carolina University, Greenville, NC, USA, December 2017. Available online: http://hdl.handle.net/10342/6544. (accessed on 10 March 2021).
  23. Grönqvist, R. Mechanisms of friction and assessment of slip resistance of new and used footwear soles on contaminated floors. Ergonomics 1995, 38, 224–241. [Google Scholar] [CrossRef] [PubMed]
  24. Li, K.W.; Chang, W.R.; Wei, J.C.; Kou, C.H. Friction measurements on ramps using the Brungraber Mark II slip meter. Saf. Sci. 2006, 44, 375–386. [Google Scholar] [CrossRef]
  25. Derler, S.; Kausch, F.; Huber, R. Analysis of factors influencing the friction coefficients of shoe sole materials. Saf. Sci. 2007, 46, 822–832. [Google Scholar] [CrossRef]
  26. Kim, I.-J.; Hsiao, H.; Simeonov, P. Functional levels of floor surface roughness for the prevention of slips and falls: Clean-and-dry and soapsuds-covered wet surfaces. Appl. Ergon. 2013, 44, 58–64. [Google Scholar] [CrossRef]
  27. Kim, I.-J. Wear observation of shoe surfaces: Application for slip and fall safety assessments. Tribol. Trans. 2015, 58, 407–417. [Google Scholar] [CrossRef]
  28. Kim, I.-J. A study on wear development of floor surfaces: Impact on pedestrian walkway slip-resistance performance. Tribol. Int. 2016, 95, 316–323. [Google Scholar] [CrossRef]
  29. Çoşkun, G.; Sarıışık, G.; Sarıışık, A. Classification of parameters affecting slip safety of limestones. Cogent Eng. 2016, 3, 1217821. [Google Scholar] [CrossRef]
  30. Jones, T.; Iraqi, A.; Beschorner, K. Performance testing of work shoes labeled as slip resistant. Appl. Ergon. 2018, 68, 304–312. [Google Scholar] [CrossRef]
  31. Iraqi, A.; Vidic, N.S.; Redfern, M.S.; Beschorner, K.E. Prediction of coefficient of friction based on footwear outsole features. Appl. Ergon. 2019, 82, 102963. [Google Scholar] [CrossRef]
  32. Fekr, A.R.; Li, Y.; Gauvin, C.; Wong, G.; Cheng, W.; Fernie, G.; Dutta, T. Evaluation of winter footwear: Comparison of test methods to determine footwear slip resistance on ice surfaces. Int. J. Environ. Res. Public Health 2021, 18, 405. [Google Scholar] [CrossRef] [PubMed]
  33. Sarıışık, A.; Akdaş, H.; Sarıışık, G.; Çoşkun, G. Slip safety analysis of differently surface processed dimension marbles. J. Test. Eval. 2011, 39, 908–917. [Google Scholar] [CrossRef]
  34. Iraqi, A.; Cham, R.; Redfern, M.S.; Beschorner, K.E. Coefficient of friction testing parameters influence the prediction of human slips. Appl. Ergon. 2018, 70, 118–126. [Google Scholar] [CrossRef] [PubMed]
  35. DeMarch, A.; Angioletto, E.; Vieira, A.W.; Molin, A.D.; Montedo, O.R.K.; Angioletto, E. Coefficients of static and dynamic friction of ceramic floor tiles: Proposal of new method of surface roughness determination. Int. J. Metrol. Qual. Eng. 2019, 10, 4. [Google Scholar] [CrossRef]
  36. Chen, C.-C.; Chen, Z.-X.; Chang, C.-L.; Lin, F.-L. The slip-resistance effect evaluation of floor roughness under different liquid viscosity. Procedia Manuf. 2015, 3, 5007–5013. [Google Scholar] [CrossRef] [Green Version]
  37. Chang, W.-R. The effect of surface roughness on the measurement of slip resistance. Int. J. Ind. Ergon. 1999, 24, 299–313. [Google Scholar] [CrossRef]
  38. Li, K.W.; Yu, R.; Zhang, W. Roughness and slipperiness of floor surface: Tactile sensation and perception. Saf. Sci. 2011, 49, 508–512. [Google Scholar] [CrossRef]
  39. Grönqvist, R.; Roine, J.; Korhonen, E.; Rahikainen, A. Slip resistance versus surface roughness of deck and other underfoot surfaces in ships. J. Occup. Accid. 1990, 13, 291–302. [Google Scholar] [CrossRef]
  40. ASTM F609-05. Standard Test Method for Using a Horizontal Pull Slipmeter (HPS); ASTM International: West Conshohocken, PA, USA, 2013; Available online: http://www.astm.org (accessed on 10 March 2021).
  41. Li, R.; Li, X.; Li, Y.; Yang, P.; Liu, J. Experimental and numerical study on surface roughness of magnetorheological elastomer for controllable friction. Friction 2020, 8, 917–929. [Google Scholar] [CrossRef] [Green Version]
  42. Mitutoyo, Portable Surface Roughness Tester SURFTEST SJ301 Series User Menu. Available online: https://www2.mitutoyo.co.jp/eng/support/service/catalog/03/E15013.pdf (accessed on 10 March 2021).
  43. Brown, C.A.; Hansen, H.N.; Jiang, X.J.; Blateyron, F.; Berglund, J.; Senin, N.; Bartkowiak, T.; Dixon, B.; Le Goic, G.; Quinsat, Y.; et al. Multiscale analyses and characterizations of surface topographies. CIRP Ann. Manuf. Technol. 2018, 67, 839–862. [Google Scholar] [CrossRef]
  44. Montgomery, D.C. Design and Analysis of Experiment, 2nd ed.; John Wiley & Sons, Inc.: Hoboken, NJ, USA, 1984; p. 70. [Google Scholar]
  45. Chang, W.R.; Maynard, W.S. Factors influencing the slip index measurements with the horizontal pull slipmeter. Work 2006, 26, 99–105. [Google Scholar]
  46. Khaday, S.; Li, K.W. Friction measurement on common floor using a horizontal pull slip meter. Int. J. Environ. Sci. Dev. 2019, 10, 275–279. [Google Scholar] [CrossRef]
  47. AS/NZS 4663. Australian Standards: Slip Resistance Measurement of Existing Pedestrian Surfaces. 2004. Available online: https://www.saiglobal.com/pdftemp/previews/osh/as/as4000/4600/4663-2004.pdf. (accessed on 10 March 2021).
  48. Health and Safety Executive (HSE). Assessing the Slip Resistance of Flooring. 2012. Available online: http://www.hse.gov.uk/pubns/geis2.htm (accessed on 17 February 2021).
  49. American National Standards Institute (ANSI). Provision of Slip Resistance on Walking/Working Surfaces; ANSI/ASSE A1264.2; American Society of Safety Engineers: Des Plaines, IL, USA, 2012. [Google Scholar]
  50. Occupational Safety and Health Administration (OSHA). Static Coefficients of Friction for Walking/Working Surfaces. 2019. Available online: http://www.osha.gov/pls/oshaweb/owadisp.show_document?p_table=FEDERAL_REGISTER&p_id=17819 (accessed on 10 March 2021).
  51. Daukus, S. Understanding Floor Slip Resistance Standards. 2018. Available online: http://www.florock.net/2018/06/floor-slip-resistance-standards (accessed on 18 February 2021).
  52. Ahmad, N.A.; Tap, M.M.; Syahrom, A.; Rohani, J.M. The Relationship Between Coefficient of Friction (COF) with Floor Slipperiness and Roughness. In Quantitative and Qualitative Factors that Leads to Slip and Fall Incidents. Springer Briefs in Applied Sciences and Technology; Springer: Berlin/Heidelberg, Germany, 2016; pp. 21–31. [Google Scholar] [CrossRef]
  53. Berglund, J.; Brown, C.; Rosén, B.-G.; Bay, N.O. Milled die steel surface roughness correlation with steel sheet friction. CIRP Ann. 2010, 59, 577–580. [Google Scholar] [CrossRef]
  54. Wiklund, D.; Liljebgren, M.; Berglund, J.; Bay, N.; Kjellsson, K.; Rosén, B.G. Friction in sheet metal forming: A Comparison between milled and manually polished surfaces. In Proceedings of the 4th International Conference on Tribology in Manufacturing Processes, Nice, France, 13–15 June 2010; pp. 613–622. [Google Scholar]
Figure 1. Horizontal pull slip meter: (a) power and weight units, (b) footwear sample on the bottom of the weight unit.
Coatings 11 01254 g001
Figure 2. COF values of the floor samples.
Coatings 11 01254 g002
Figure 3. Regression model and measured COF (dot): the curves from top to bottom are for dry, wet, and WD solution covered conditions. The dotted lines indicate the boundaries of the three zones recommended by Kim et al. [26].
Coatings 11 01254 g003
Table 1. Floor samples.
CodeStone FloorRa (μm)CodeCeramic TileRa (μm)
S1 Coatings 11 01254 i00131.5C1 Coatings 11 01254 i0028.9
S2 Coatings 11 01254 i00329.0C2 Coatings 11 01254 i00418.9
S3 Coatings 11 01254 i00556.8C3 Coatings 11 01254 i00620.3
S4 Coatings 11 01254 i00738.4C4 Coatings 11 01254 i00827.2
S5 Coatings 11 01254 i00933.6C5 Coatings 11 01254 i01027.5
S6 Coatings 11 01254 i01165.1C6 Coatings 11 01254 i01230.4
Table 2. Duncan’s multiple range test results for floors under wet and WD solution covered conditions.
FloorRa (μm)Wet
Mean COF
Grouping *WD Solution
Mean COF
Grouping *
S229.00.78A0.77A
S131.50.77AB0.76A
S665.10.74B0.70B
S533.60.68C0.63C
S356.80.63D0.58D
S438.40.63D0.57D
C320.30.62D0.55D
C630.40.60D0.49E
C427.20.52E0.45F
C527.50.52E0.41G
C218.90.47F0.40G
C18.90.42G0.30H
* Duncan grouping; different letters indicate they are significantly different (p < 0.05).
Table 3. Results of regression modeling.
Surfaceß0ß1ß2ß3R2√MSE
dry0.508−4.1 × 10−35 × 10−4−6 × 10−60.960.022
wet0.393−2.5 × 10−35 × 10−4−6 × 10−60.940.033
WD solution0.297−4.4 × 10−36 × 10−4−7 × 10−60.930.044
Table 4. Comparison of the lower bound Ra values in different studies.
StudyFriction Measurement DeviceSurface Covered bySafety CriterionRa (μm)
Gronqvist et al. (1990)dynamic step simulatorglycerolDCOF = 0.27–9
glycerolDCOF = 0.316–22
Kim et al. (2013)pendulum-type
hydraulic dynamic friction tester
soapsudsDCOF = 0.417
Chen et al. (2015)Brungraber Mark IIwater, sodaSCOF = 0.528
Liquids: 2 mPa·s < Viscosity < 38 mPa·sSCOF = 0.540
Current studyHPSWaterSCOF = 0.519
WD solutionSCOF = 0.527
Publisher’s Note: MDPI stays neutral with regard to jurisdictional claims in published maps and institutional affiliations.

